Roanoke, TX Map & Demographics
Roanoke Map
Roanoke Overview
$52,378
PER CAPITA INCOME
$133,373
AVG FAMILY INCOME
$113,171
AVG HOUSEHOLD INCOME
27.3%
WAGE / INCOME GAP [ % ]
72.7¢/ $1
WAGE / INCOME GAP [ $ ]
0.40
INEQUALITY / GINI INDEX
9,565
TOTAL POPULATION
4,933
MALE POPULATION
4,632
FEMALE POPULATION
106.50
MALES / 100 FEMALES
93.90
FEMALES / 100 MALES
36.5
MEDIAN AGE
3.3
AVG FAMILY SIZE
2.6
AVG HOUSEHOLD SIZE
5,331
LABOR FORCE [ PEOPLE ]
74.9%
PERCENT IN LABOR FORCE
4.1%
UNEMPLOYMENT RATE
Roanoke Zip Codes
Income in Roanoke
Income Overview in Roanoke
Per Capita Income in Roanoke is $52,378, while median incomes of families and households are $133,373 and $113,171 respectively.
| Characteristic | Number | Measure |
| Per Capita Income | 9,565 | $52,378 |
| Median Family Income | 2,527 | $133,373 |
| Mean Family Income | 2,527 | $162,905 |
| Median Household Income | 3,620 | $113,171 |
| Mean Household Income | 3,620 | $143,461 |
| Income Deficit | 2,527 | $0 |
| Wage / Income Gap (%) | 9,565 | 27.32% |
| Wage / Income Gap ($) | 9,565 | 72.68¢ per $1 |
| Gini / Inequality Index | 9,565 | 0.40 |
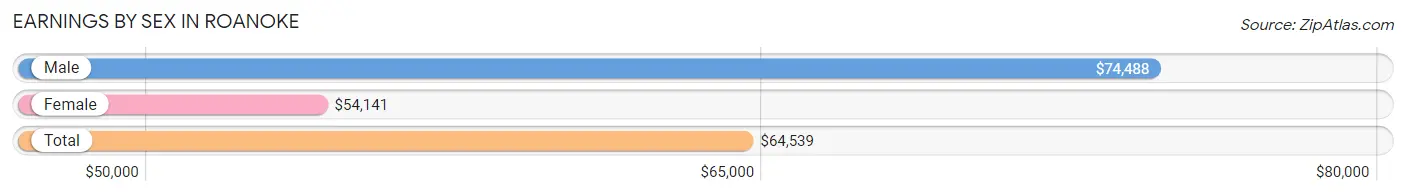
Earnings by Sex in Roanoke
Average Earnings in Roanoke are $64,539, $74,488 for men and $54,141 for women, a difference of 27.3%.
| Sex | Number | Average Earnings |
| Male | 3,148 (57.3%) | $74,488 |
| Female | 2,347 (42.7%) | $54,141 |
| Total | 5,495 (100.0%) | $64,539 |
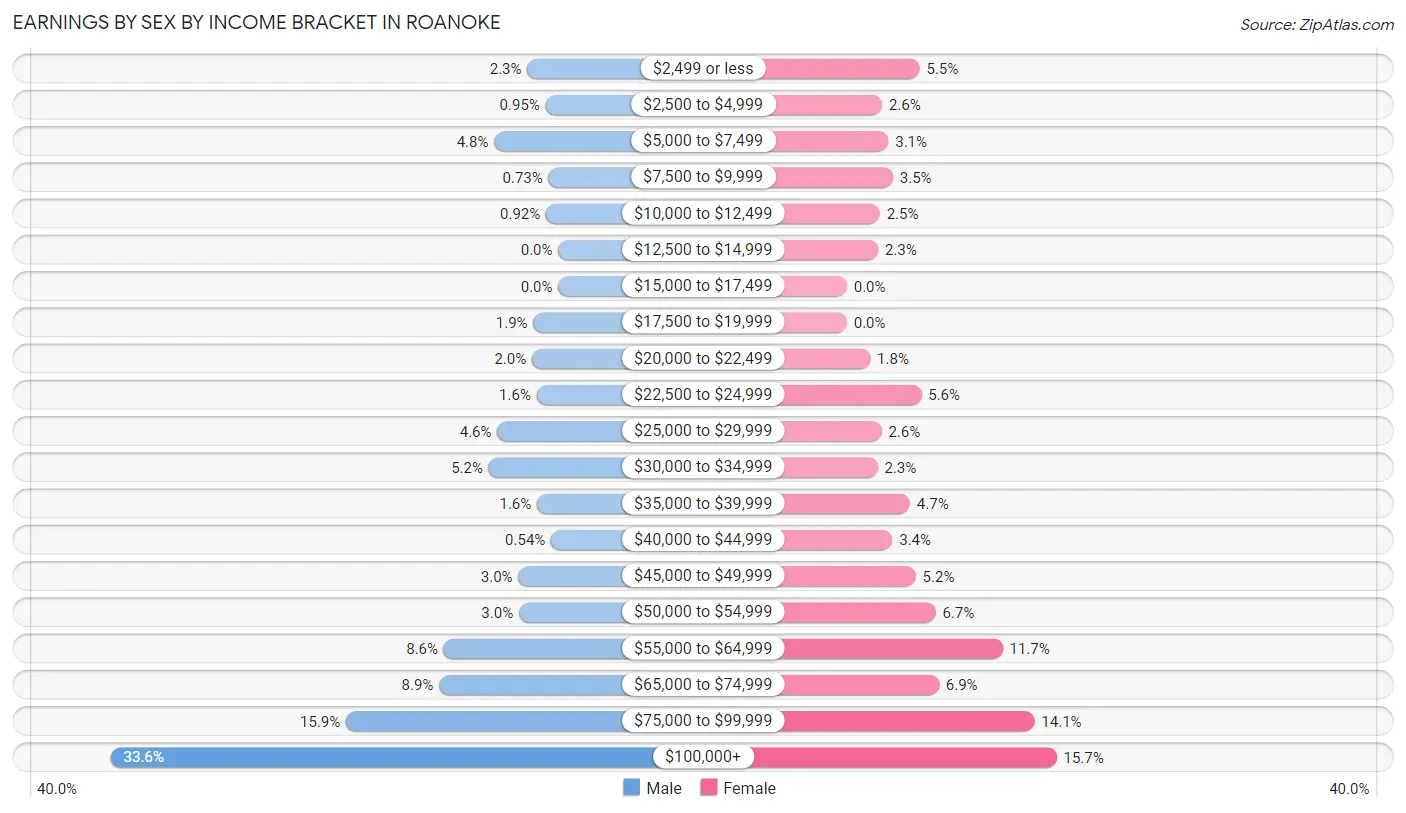
Earnings by Sex by Income Bracket in Roanoke
The most common earnings brackets in Roanoke are $100,000+ for men (1,056 | 33.6%) and $100,000+ for women (369 | 15.7%).
| Income | Male | Female |
| $2,499 or less | 73 (2.3%) | 128 (5.4%) |
| $2,500 to $4,999 | 30 (0.9%) | 62 (2.6%) |
| $5,000 to $7,499 | 151 (4.8%) | 73 (3.1%) |
| $7,500 to $9,999 | 23 (0.7%) | 81 (3.5%) |
| $10,000 to $12,499 | 29 (0.9%) | 58 (2.5%) |
| $12,500 to $14,999 | 0 (0.0%) | 55 (2.3%) |
| $15,000 to $17,499 | 0 (0.0%) | 0 (0.0%) |
| $17,500 to $19,999 | 59 (1.9%) | 0 (0.0%) |
| $20,000 to $22,499 | 62 (2.0%) | 41 (1.8%) |
| $22,500 to $24,999 | 51 (1.6%) | 131 (5.6%) |
| $25,000 to $29,999 | 144 (4.6%) | 61 (2.6%) |
| $30,000 to $34,999 | 164 (5.2%) | 54 (2.3%) |
| $35,000 to $39,999 | 50 (1.6%) | 111 (4.7%) |
| $40,000 to $44,999 | 17 (0.5%) | 80 (3.4%) |
| $45,000 to $49,999 | 94 (3.0%) | 121 (5.2%) |
| $50,000 to $54,999 | 93 (2.9%) | 156 (6.7%) |
| $55,000 to $64,999 | 270 (8.6%) | 274 (11.7%) |
| $65,000 to $74,999 | 281 (8.9%) | 162 (6.9%) |
| $75,000 to $99,999 | 501 (15.9%) | 330 (14.1%) |
| $100,000+ | 1,056 (33.6%) | 369 (15.7%) |
| Total | 3,148 (100.0%) | 2,347 (100.0%) |
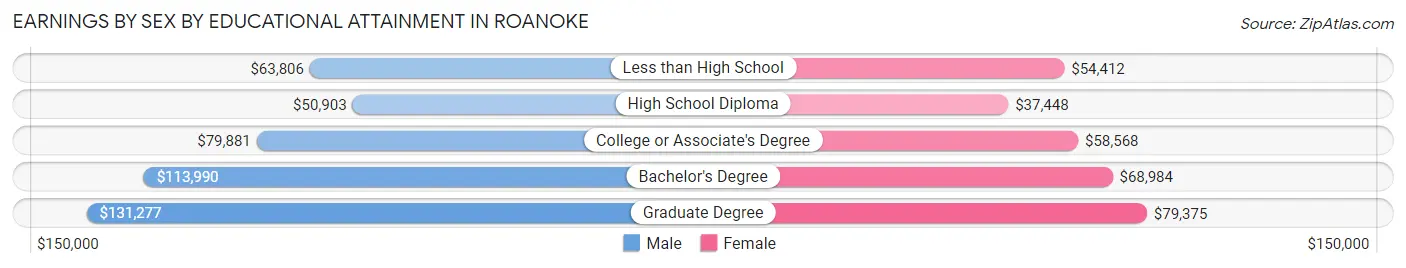
Earnings by Sex by Educational Attainment in Roanoke
Average earnings in Roanoke are $81,053 for men and $58,900 for women, a difference of 27.3%. Men with an educational attainment of graduate degree enjoy the highest average annual earnings of $131,277, while those with high school diploma education earn the least with $50,903. Women with an educational attainment of graduate degree earn the most with the average annual earnings of $79,375, while those with high school diploma education have the smallest earnings of $37,448.
| Educational Attainment | Male Income | Female Income |
| Less than High School | $63,806 | $54,412 |
| High School Diploma | $50,903 | $37,448 |
| College or Associate's Degree | $79,881 | $58,568 |
| Bachelor's Degree | $113,990 | $68,984 |
| Graduate Degree | $131,277 | $79,375 |
| Total | $81,053 | $58,900 |
Family Income in Roanoke
Family Income Brackets in Roanoke
According to the Roanoke family income data, there are 571 families falling into the $150,000 to $199,999 income range, which is the most common income bracket and makes up 22.6% of all families.
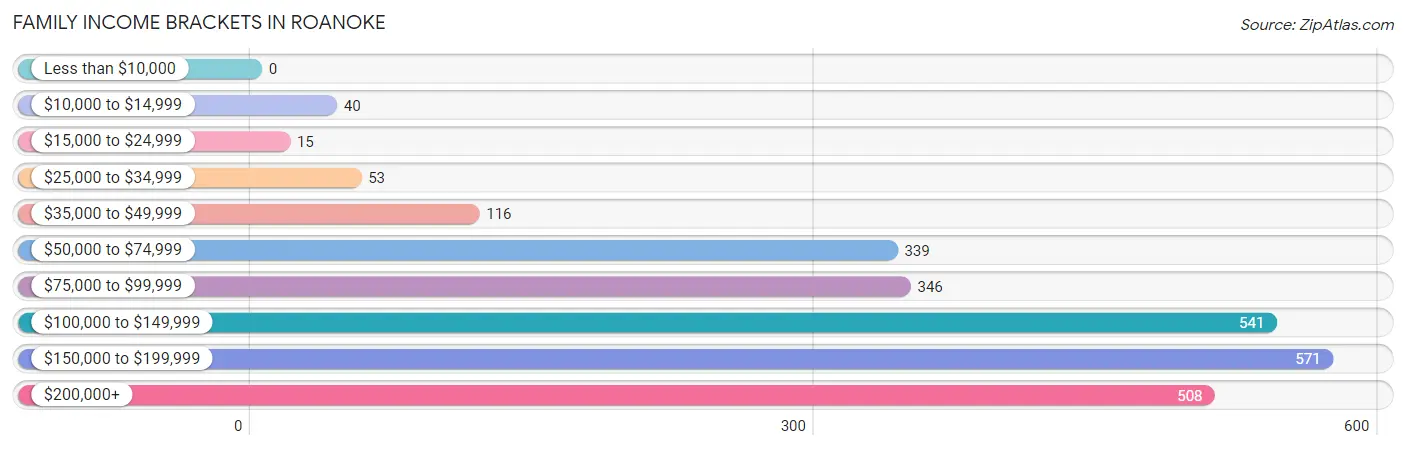
| Income Bracket | # Families | % Families |
| Less than $10,000 | 0 | 0.0% |
| $10,000 to $14,999 | 40 | 1.6% |
| $15,000 to $24,999 | 15 | 0.6% |
| $25,000 to $34,999 | 53 | 2.1% |
| $35,000 to $49,999 | 116 | 4.6% |
| $50,000 to $74,999 | 339 | 13.4% |
| $75,000 to $99,999 | 346 | 13.7% |
| $100,000 to $149,999 | 541 | 21.4% |
| $150,000 to $199,999 | 571 | 22.6% |
| $200,000+ | 508 | 20.1% |
Family Income by Famaliy Size in Roanoke
4-person families (815 | 32.3%) account for the highest median family income in Roanoke with $160,104 per family, while 2-person families (683 | 27.0%) have the highest median income of $62,873 per family member.
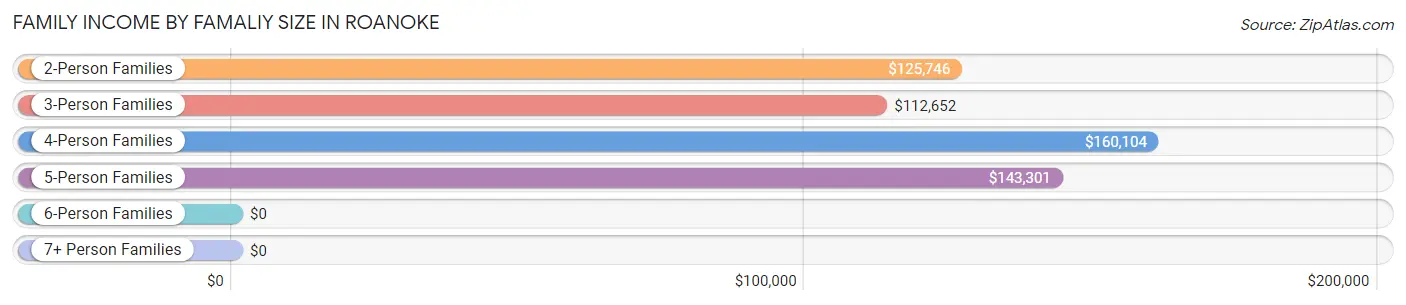
| Income Bracket | # Families | Median Income |
| 2-Person Families | 683 (27.0%) | $125,746 |
| 3-Person Families | 713 (28.2%) | $112,652 |
| 4-Person Families | 815 (32.3%) | $160,104 |
| 5-Person Families | 263 (10.4%) | $143,301 |
| 6-Person Families | 33 (1.3%) | $0 |
| 7+ Person Families | 20 (0.8%) | $0 |
| Total | 2,527 (100.0%) | $133,373 |
Family Income by Number of Earners in Roanoke
The median family income in Roanoke is $133,373, with families comprising 3+ earners (330) having the highest median family income of $165,517, while families with 1 earner (938) have the lowest median family income of $77,192, accounting for 13.1% and 37.1% of families, respectively.
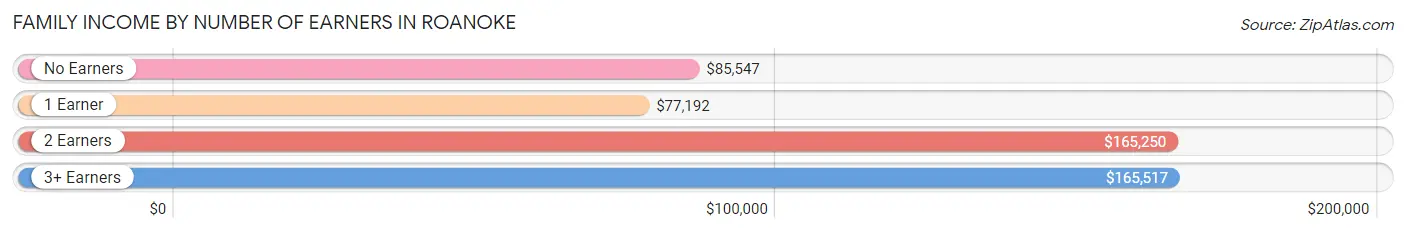
| Number of Earners | # Families | Median Income |
| No Earners | 131 (5.2%) | $85,547 |
| 1 Earner | 938 (37.1%) | $77,192 |
| 2 Earners | 1,128 (44.6%) | $165,250 |
| 3+ Earners | 330 (13.1%) | $165,517 |
| Total | 2,527 (100.0%) | $133,373 |
Household Income in Roanoke
Household Income Brackets in Roanoke
With 854 households falling in the category, the $75,000 to $99,999 income range is the most frequent in Roanoke, accounting for 23.6% of all households. In contrast, only 29 households (0.8%) fall into the less than $10,000 income bracket, making it the least populous group.
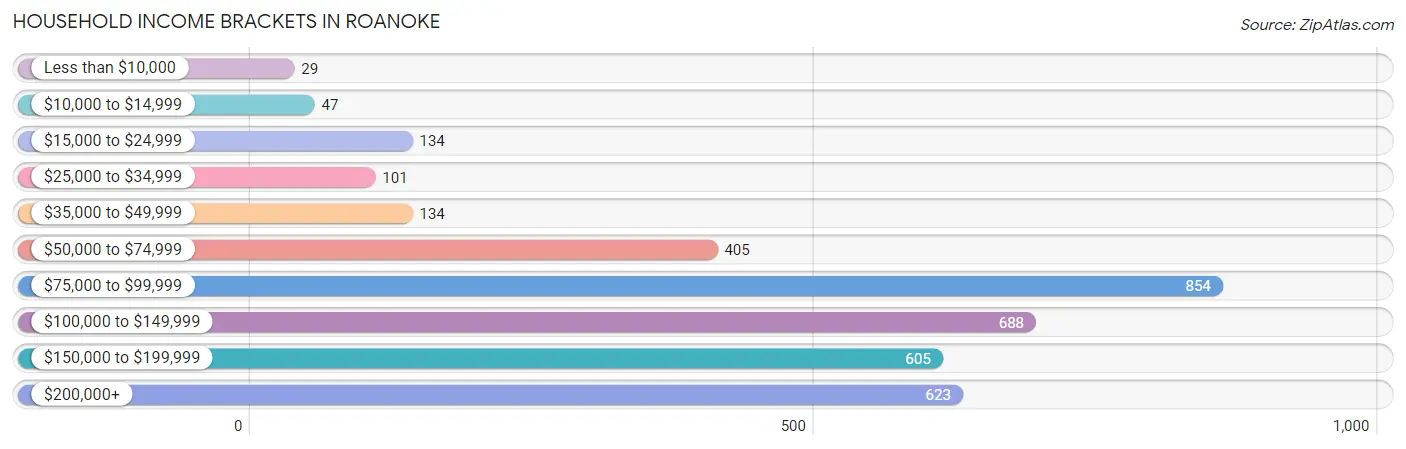
| Income Bracket | # Households | % Households |
| Less than $10,000 | 29 | 0.8% |
| $10,000 to $14,999 | 47 | 1.3% |
| $15,000 to $24,999 | 134 | 3.7% |
| $25,000 to $34,999 | 101 | 2.8% |
| $35,000 to $49,999 | 134 | 3.7% |
| $50,000 to $74,999 | 405 | 11.2% |
| $75,000 to $99,999 | 854 | 23.6% |
| $100,000 to $149,999 | 688 | 19.0% |
| $150,000 to $199,999 | 605 | 16.7% |
| $200,000+ | 623 | 17.2% |
Household Income by Householder Age in Roanoke
The median household income in Roanoke is $113,171, with the highest median household income of $124,453 found in the 25 to 44 years age bracket for the primary householder. A total of 1,551 households (42.8%) fall into this category. Meanwhile, the 15 to 24 years age bracket for the primary householder has the lowest median household income of $0, with 142 households (3.9%) in this group.
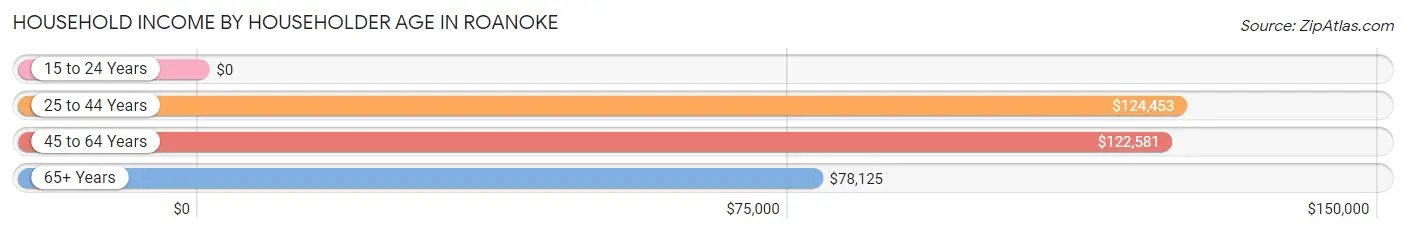
| Income Bracket | # Households | Median Income |
| 15 to 24 Years | 142 (3.9%) | $0 |
| 25 to 44 Years | 1,551 (42.8%) | $124,453 |
| 45 to 64 Years | 1,622 (44.8%) | $122,581 |
| 65+ Years | 305 (8.4%) | $78,125 |
| Total | 3,620 (100.0%) | $113,171 |
Poverty in Roanoke
Income Below Poverty by Sex and Age in Roanoke
With 2.9% poverty level for males and 2.7% for females among the residents of Roanoke, 16 and 17 year old males and 55 to 64 year old females are the most vulnerable to poverty, with 40 males (38.5%) and 50 females (14.9%) in their respective age groups living below the poverty level.
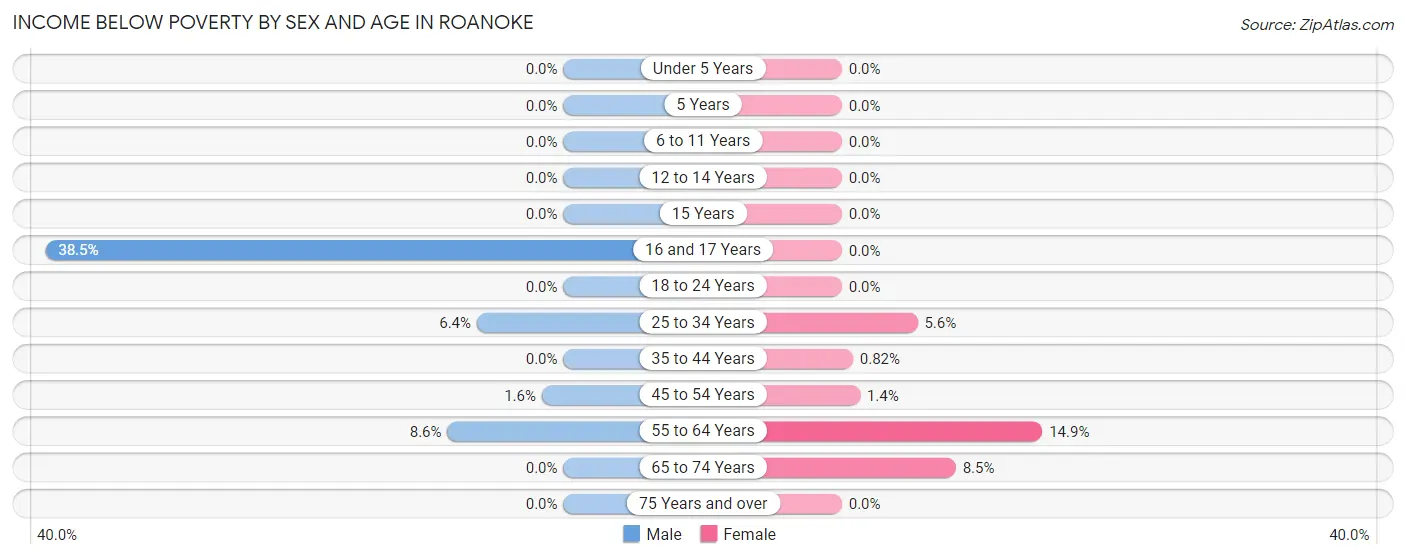
| Age Bracket | Male | Female |
| Under 5 Years | 0 (0.0%) | 0 (0.0%) |
| 5 Years | 0 (0.0%) | 0 (0.0%) |
| 6 to 11 Years | 0 (0.0%) | 0 (0.0%) |
| 12 to 14 Years | 0 (0.0%) | 0 (0.0%) |
| 15 Years | 0 (0.0%) | 0 (0.0%) |
| 16 and 17 Years | 40 (38.5%) | 0 (0.0%) |
| 18 to 24 Years | 0 (0.0%) | 0 (0.0%) |
| 25 to 34 Years | 43 (6.4%) | 40 (5.6%) |
| 35 to 44 Years | 0 (0.0%) | 7 (0.8%) |
| 45 to 54 Years | 15 (1.6%) | 11 (1.3%) |
| 55 to 64 Years | 44 (8.6%) | 50 (14.9%) |
| 65 to 74 Years | 0 (0.0%) | 17 (8.5%) |
| 75 Years and over | 0 (0.0%) | 0 (0.0%) |
| Total | 142 (2.9%) | 125 (2.7%) |
Income Above Poverty by Sex and Age in Roanoke
According to the poverty statistics in Roanoke, males aged under 5 years and females aged under 5 years are the age groups that are most secure financially, with 100.0% of males and 100.0% of females in these age groups living above the poverty line.
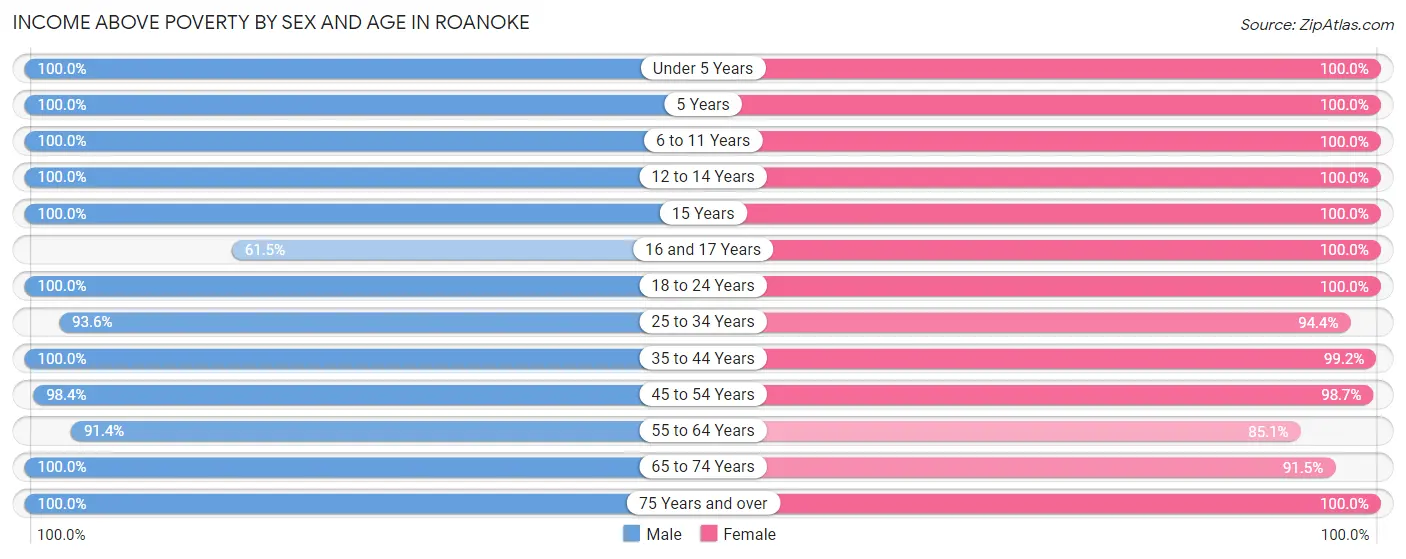
| Age Bracket | Male | Female |
| Under 5 Years | 380 (100.0%) | 385 (100.0%) |
| 5 Years | 148 (100.0%) | 55 (100.0%) |
| 6 to 11 Years | 473 (100.0%) | 434 (100.0%) |
| 12 to 14 Years | 189 (100.0%) | 251 (100.0%) |
| 15 Years | 86 (100.0%) | 46 (100.0%) |
| 16 and 17 Years | 64 (61.5%) | 170 (100.0%) |
| 18 to 24 Years | 330 (100.0%) | 228 (100.0%) |
| 25 to 34 Years | 627 (93.6%) | 672 (94.4%) |
| 35 to 44 Years | 814 (100.0%) | 850 (99.2%) |
| 45 to 54 Years | 921 (98.4%) | 804 (98.7%) |
| 55 to 64 Years | 467 (91.4%) | 286 (85.1%) |
| 65 to 74 Years | 187 (100.0%) | 184 (91.5%) |
| 75 Years and over | 105 (100.0%) | 142 (100.0%) |
| Total | 4,791 (97.1%) | 4,507 (97.3%) |
Income Below Poverty Among Married-Couple Families in Roanoke
The poverty statistics for married-couple families in Roanoke show that 1.8% or 40 of the total 2,235 families live below the poverty line. Families with 1 or 2 children have the highest poverty rate of 2.9%, comprising of 40 families. On the other hand, families with no children have the lowest poverty rate of 0.0%, which includes 0 families.
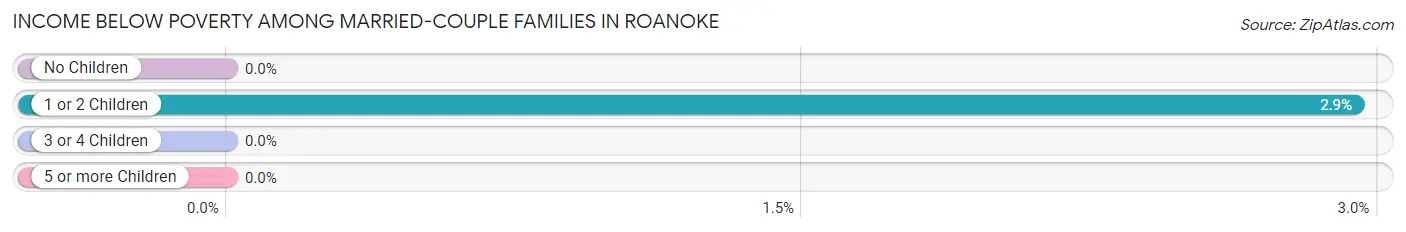
| Children | Above Poverty | Below Poverty |
| No Children | 662 (100.0%) | 0 (0.0%) |
| 1 or 2 Children | 1,319 (97.1%) | 40 (2.9%) |
| 3 or 4 Children | 214 (100.0%) | 0 (0.0%) |
| 5 or more Children | 0 (0.0%) | 0 (0.0%) |
| Total | 2,195 (98.2%) | 40 (1.8%) |
Income Below Poverty Among Single-Parent Households in Roanoke
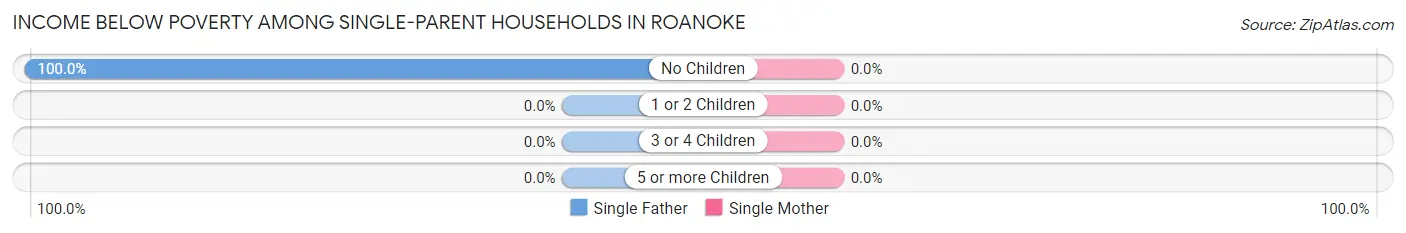
| Children | Single Father | Single Mother |
| No Children | 15 (100.0%) | 0 (0.0%) |
| 1 or 2 Children | 0 (0.0%) | 0 (0.0%) |
| 3 or 4 Children | 0 (0.0%) | 0 (0.0%) |
| 5 or more Children | 0 (0.0%) | 0 (0.0%) |
| Total | 15 (31.2%) | 0 (0.0%) |
Income Below Poverty Among Married-Couple vs Single-Parent Households in Roanoke
The poverty data for Roanoke shows that 40 of the married-couple family households (1.8%) and 15 of the single-parent households (5.1%) are living below the poverty level. Within the married-couple family households, those with 1 or 2 children have the highest poverty rate, with 40 households (2.9%) falling below the poverty line. Among the single-parent households, those with no children have the highest poverty rate, with 15 household (15.1%) living below poverty.
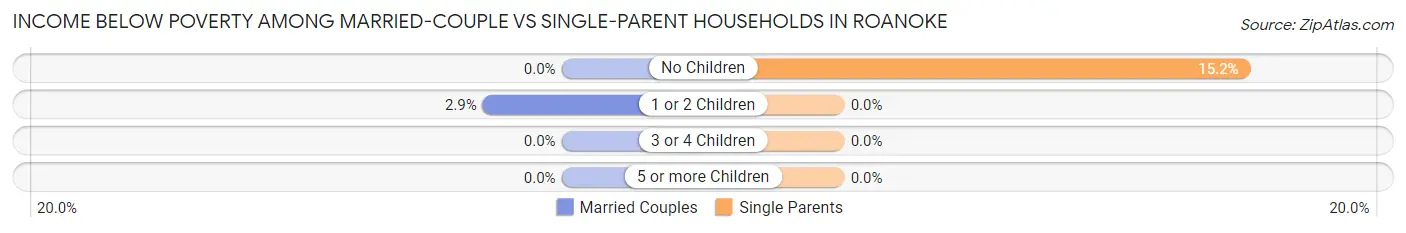
| Children | Married-Couple Families | Single-Parent Households |
| No Children | 0 (0.0%) | 15 (15.1%) |
| 1 or 2 Children | 40 (2.9%) | 0 (0.0%) |
| 3 or 4 Children | 0 (0.0%) | 0 (0.0%) |
| 5 or more Children | 0 (0.0%) | 0 (0.0%) |
| Total | 40 (1.8%) | 15 (5.1%) |
Race in Roanoke
The most populous races in Roanoke are White / Caucasian (6,380 | 66.7%), Hispanic or Latino (2,218 | 23.2%), and Two or more Races (1,632 | 17.1%).
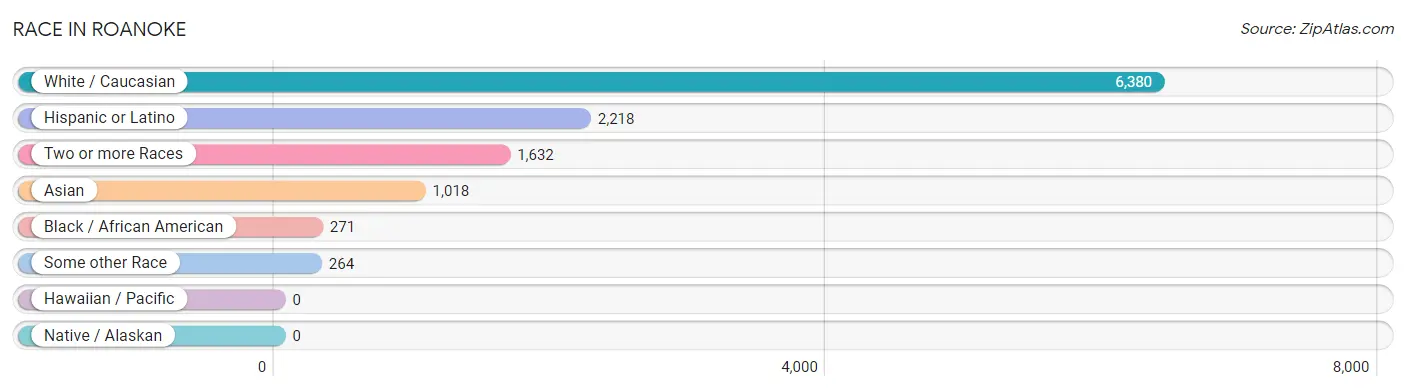
| Race | # Population | % Population |
| Asian | 1,018 | 10.6% |
| Black / African American | 271 | 2.8% |
| Hawaiian / Pacific | 0 | 0.0% |
| Hispanic or Latino | 2,218 | 23.2% |
| Native / Alaskan | 0 | 0.0% |
| White / Caucasian | 6,380 | 66.7% |
| Two or more Races | 1,632 | 17.1% |
| Some other Race | 264 | 2.8% |
| Total | 9,565 | 100.0% |
Ancestry in Roanoke
The most populous ancestries reported in Roanoke are Mexican (1,445 | 15.1%), German (1,228 | 12.8%), English (1,043 | 10.9%), Irish (899 | 9.4%), and Italian (709 | 7.4%), together accounting for 55.7% of all Roanoke residents.
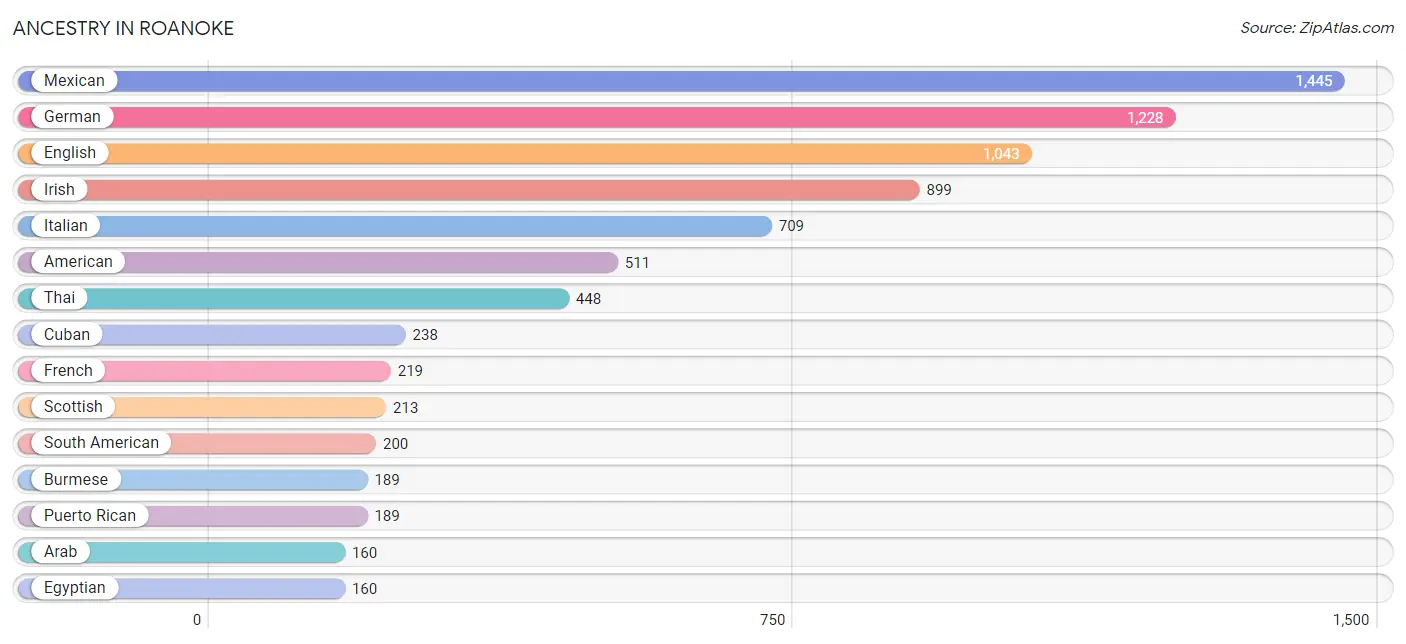
| Ancestry | # Population | % Population |
| American | 511 | 5.3% |
| Arab | 160 | 1.7% |
| British | 82 | 0.9% |
| Burmese | 189 | 2.0% |
| Canadian | 20 | 0.2% |
| Central American | 93 | 1.0% |
| Colombian | 16 | 0.2% |
| Costa Rican | 93 | 1.0% |
| Creek | 21 | 0.2% |
| Croatian | 22 | 0.2% |
| Cuban | 238 | 2.5% |
| Czech | 33 | 0.4% |
| Danish | 16 | 0.2% |
| Dutch | 39 | 0.4% |
| Ecuadorian | 94 | 1.0% |
| Egyptian | 160 | 1.7% |
| English | 1,043 | 10.9% |
| European | 54 | 0.6% |
| French | 219 | 2.3% |
| French Canadian | 93 | 1.0% |
| German | 1,228 | 12.8% |
| Greek | 25 | 0.3% |
| Hungarian | 77 | 0.8% |
| Irish | 899 | 9.4% |
| Italian | 709 | 7.4% |
| Korean | 86 | 0.9% |
| Mexican | 1,445 | 15.1% |
| Nigerian | 138 | 1.4% |
| Northern European | 79 | 0.8% |
| Norwegian | 134 | 1.4% |
| Pakistani | 13 | 0.1% |
| Peruvian | 90 | 0.9% |
| Polish | 146 | 1.5% |
| Puerto Rican | 189 | 2.0% |
| Russian | 28 | 0.3% |
| Scotch-Irish | 45 | 0.5% |
| Scottish | 213 | 2.2% |
| Serbian | 18 | 0.2% |
| Slovak | 22 | 0.2% |
| South American | 200 | 2.1% |
| Spaniard | 53 | 0.5% |
| Sri Lankan | 54 | 0.6% |
| Subsaharan African | 138 | 1.4% |
| Swedish | 14 | 0.2% |
| Swiss | 106 | 1.1% |
| Thai | 448 | 4.7% | View All 46 Rows |
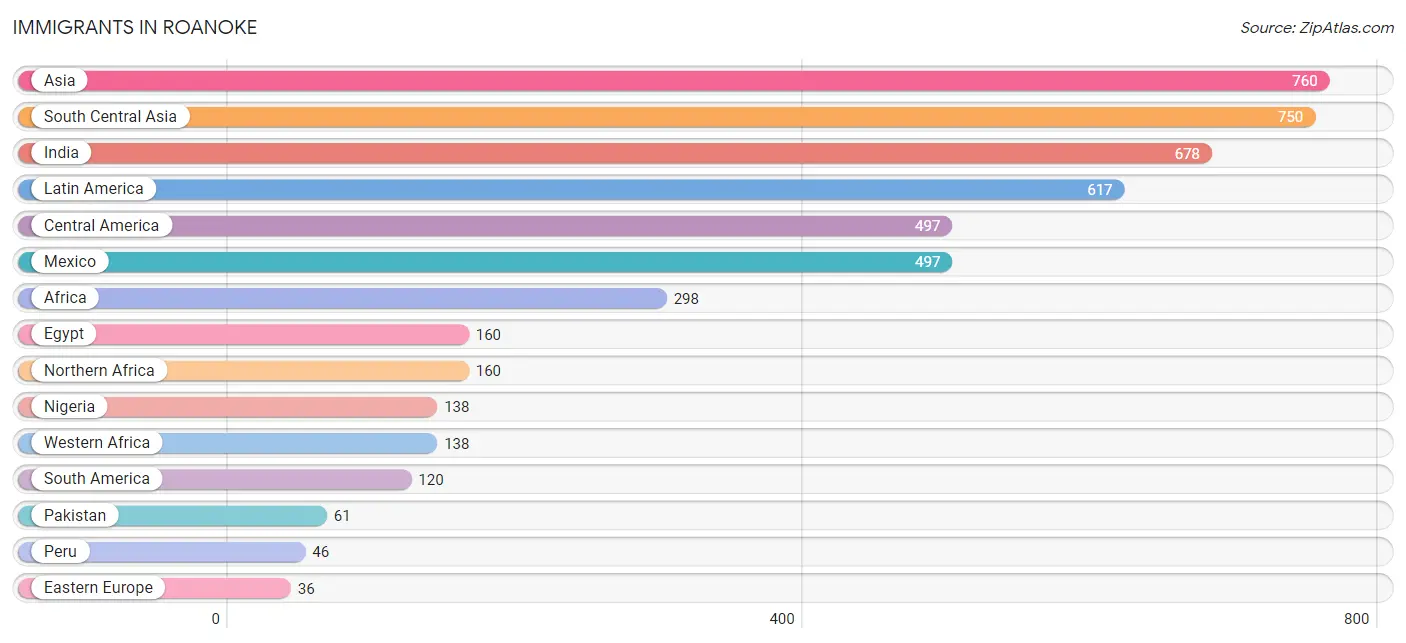
Immigrants in Roanoke
The most numerous immigrant groups reported in Roanoke came from Asia (760 | 8.0%), South Central Asia (750 | 7.8%), India (678 | 7.1%), Latin America (617 | 6.5%), and Central America (497 | 5.2%), together accounting for 34.5% of all Roanoke residents.
| Immigration Origin | # Population | % Population |
| Africa | 298 | 3.1% |
| Asia | 760 | 8.0% |
| Central America | 497 | 5.2% |
| Colombia | 16 | 0.2% |
| Eastern Asia | 10 | 0.1% |
| Eastern Europe | 36 | 0.4% |
| Ecuador | 31 | 0.3% |
| Egypt | 160 | 1.7% |
| Europe | 36 | 0.4% |
| India | 678 | 7.1% |
| Korea | 10 | 0.1% |
| Latin America | 617 | 6.5% |
| Mexico | 497 | 5.2% |
| Nepal | 11 | 0.1% |
| Nigeria | 138 | 1.4% |
| Northern Africa | 160 | 1.7% |
| Pakistan | 61 | 0.6% |
| Peru | 46 | 0.5% |
| Poland | 36 | 0.4% |
| South America | 120 | 1.3% |
| South Central Asia | 750 | 7.8% |
| Venezuela | 27 | 0.3% |
| Western Africa | 138 | 1.4% | View All 23 Rows |
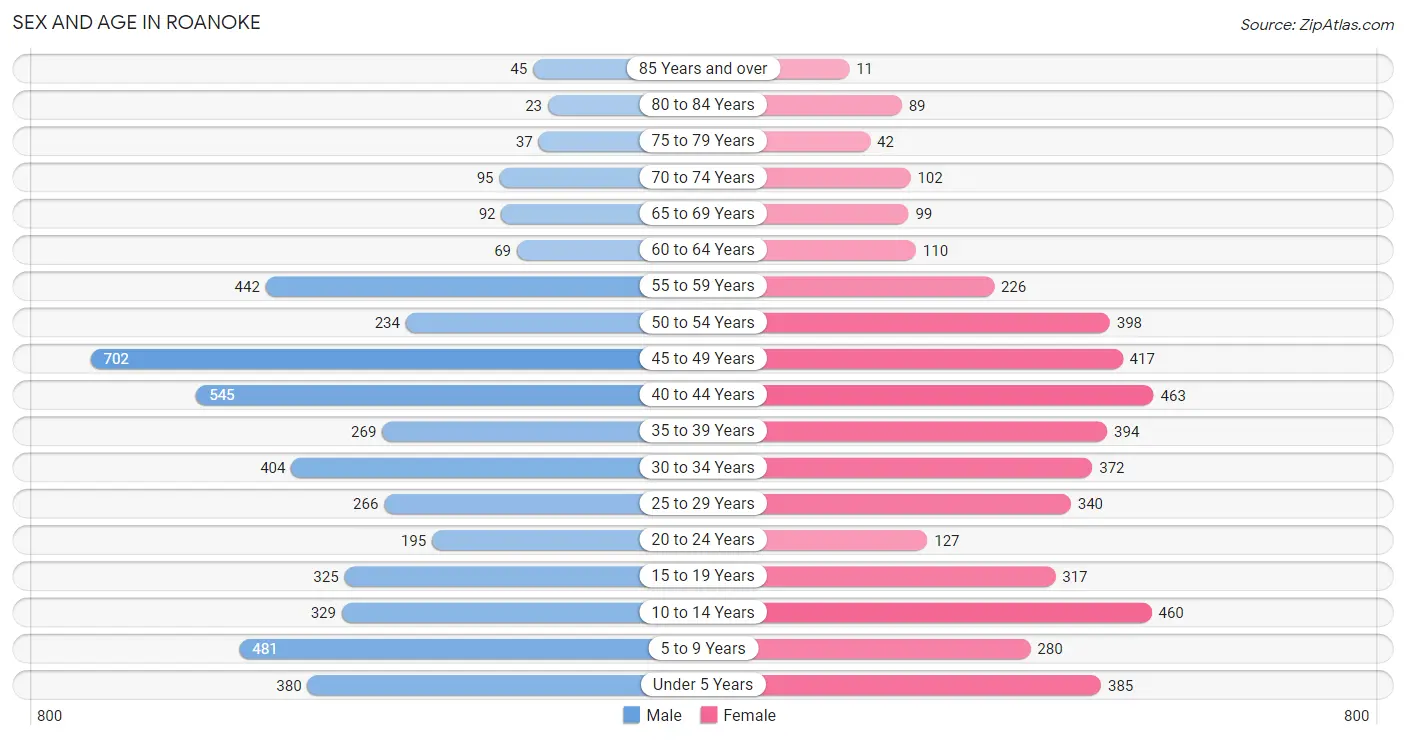
Sex and Age in Roanoke
Sex and Age in Roanoke
The most populous age groups in Roanoke are 45 to 49 Years (702 | 14.2%) for men and 40 to 44 Years (463 | 10.0%) for women.
| Age Bracket | Male | Female |
| Under 5 Years | 380 (7.7%) | 385 (8.3%) |
| 5 to 9 Years | 481 (9.8%) | 280 (6.0%) |
| 10 to 14 Years | 329 (6.7%) | 460 (9.9%) |
| 15 to 19 Years | 325 (6.6%) | 317 (6.8%) |
| 20 to 24 Years | 195 (4.0%) | 127 (2.7%) |
| 25 to 29 Years | 266 (5.4%) | 340 (7.3%) |
| 30 to 34 Years | 404 (8.2%) | 372 (8.0%) |
| 35 to 39 Years | 269 (5.4%) | 394 (8.5%) |
| 40 to 44 Years | 545 (11.1%) | 463 (10.0%) |
| 45 to 49 Years | 702 (14.2%) | 417 (9.0%) |
| 50 to 54 Years | 234 (4.7%) | 398 (8.6%) |
| 55 to 59 Years | 442 (9.0%) | 226 (4.9%) |
| 60 to 64 Years | 69 (1.4%) | 110 (2.4%) |
| 65 to 69 Years | 92 (1.9%) | 99 (2.1%) |
| 70 to 74 Years | 95 (1.9%) | 102 (2.2%) |
| 75 to 79 Years | 37 (0.7%) | 42 (0.9%) |
| 80 to 84 Years | 23 (0.5%) | 89 (1.9%) |
| 85 Years and over | 45 (0.9%) | 11 (0.2%) |
| Total | 4,933 (100.0%) | 4,632 (100.0%) |
Families and Households in Roanoke
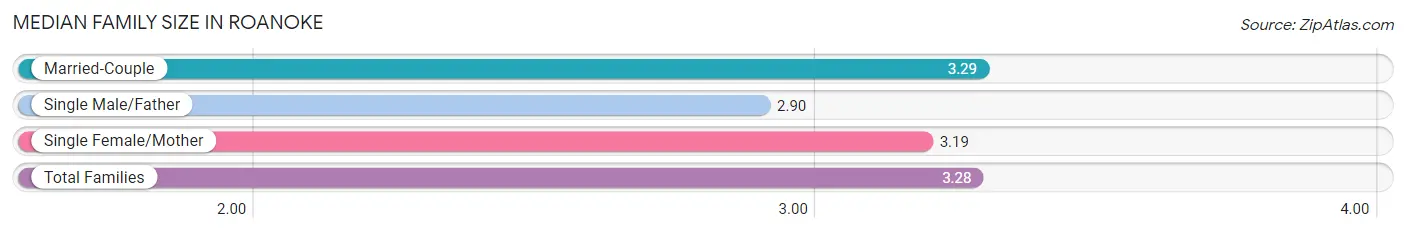
Median Family Size in Roanoke
The median family size in Roanoke is 3.28 persons per family, with married-couple families (2,235 | 88.4%) accounting for the largest median family size of 3.29 persons per family. On the other hand, single male/father families (48 | 1.9%) represent the smallest median family size with 2.90 persons per family.
| Family Type | # Families | Family Size |
| Married-Couple | 2,235 (88.4%) | 3.29 |
| Single Male/Father | 48 (1.9%) | 2.90 |
| Single Female/Mother | 244 (9.7%) | 3.19 |
| Total Families | 2,527 (100.0%) | 3.28 |
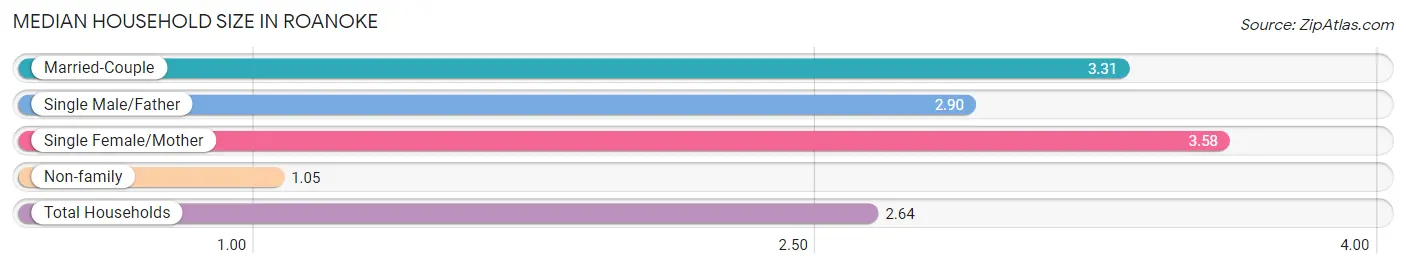
Median Household Size in Roanoke
The median household size in Roanoke is 2.64 persons per household, with single female/mother households (244 | 6.7%) accounting for the largest median household size of 3.58 persons per household. non-family households (1,093 | 30.2%) represent the smallest median household size with 1.05 persons per household.
| Household Type | # Households | Household Size |
| Married-Couple | 2,235 (61.7%) | 3.31 |
| Single Male/Father | 48 (1.3%) | 2.90 |
| Single Female/Mother | 244 (6.7%) | 3.58 |
| Non-family | 1,093 (30.2%) | 1.05 |
| Total Households | 3,620 (100.0%) | 2.64 |
Household Size by Marriage Status in Roanoke
Out of a total of 3,620 households in Roanoke, 2,527 (69.8%) are family households, while 1,093 (30.2%) are nonfamily households. The most numerous type of family households are 4-person households, comprising 835, and the most common type of nonfamily households are 1-person households, comprising 1,037.
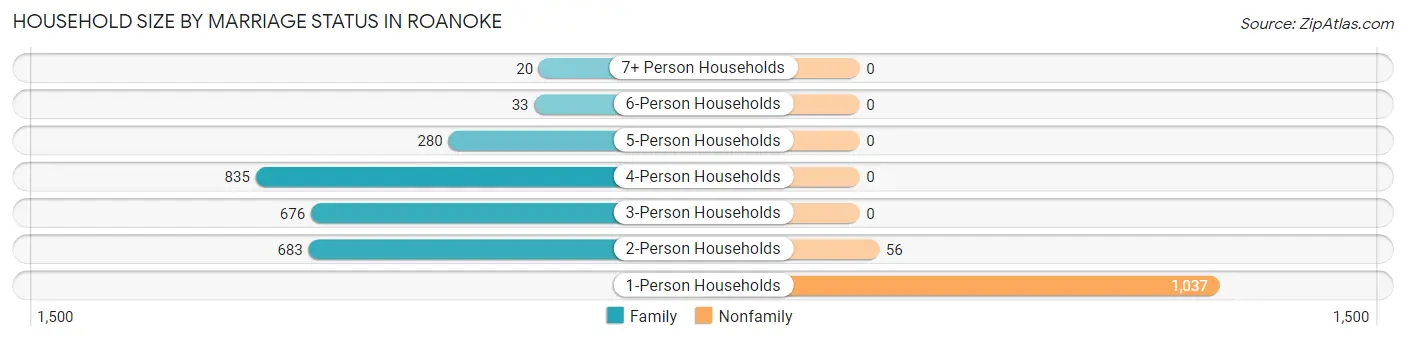
| Household Size | Family Households | Nonfamily Households |
| 1-Person Households | - | 1,037 (28.6%) |
| 2-Person Households | 683 (18.9%) | 56 (1.5%) |
| 3-Person Households | 676 (18.7%) | 0 (0.0%) |
| 4-Person Households | 835 (23.1%) | 0 (0.0%) |
| 5-Person Households | 280 (7.7%) | 0 (0.0%) |
| 6-Person Households | 33 (0.9%) | 0 (0.0%) |
| 7+ Person Households | 20 (0.5%) | 0 (0.0%) |
| Total | 2,527 (69.8%) | 1,093 (30.2%) |
Female Fertility in Roanoke
Fertility by Age in Roanoke
Average fertility rate in Roanoke is 29.0 births per 1,000 women. Women in the age bracket of 20 to 34 years have the highest fertility rate with 88.0 births per 1,000 women. Women in the age bracket of 20 to 34 years acount for 100.0% of all women with births.
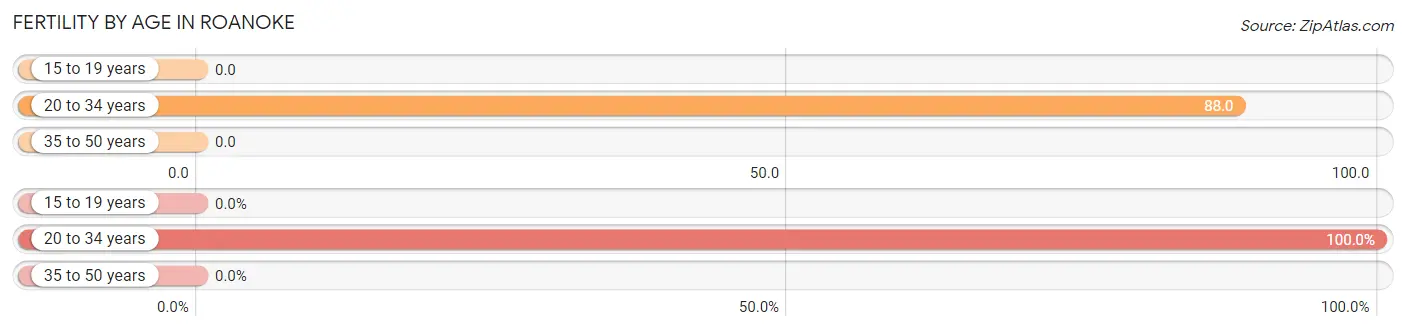
| Age Bracket | Women with Births | Births / 1,000 Women |
| 15 to 19 years | 0 (0.0%) | 0.0 |
| 20 to 34 years | 74 (100.0%) | 88.0 |
| 35 to 50 years | 0 (0.0%) | 0.0 |
| Total | 74 (100.0%) | 29.0 |
Fertility by Age by Marriage Status in Roanoke
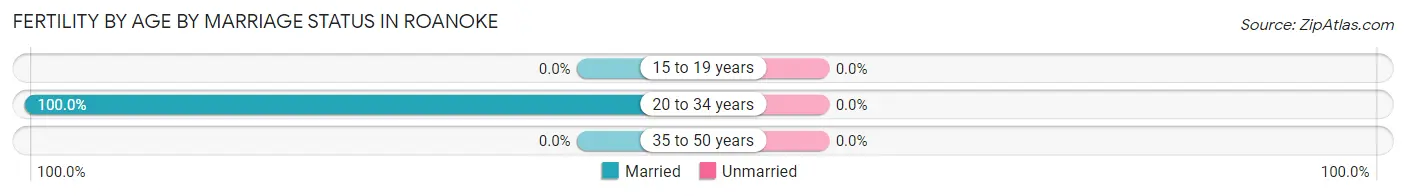
| Age Bracket | Married | Unmarried |
| 15 to 19 years | 0 (0.0%) | 0 (0.0%) |
| 20 to 34 years | 74 (100.0%) | 0 (0.0%) |
| 35 to 50 years | 0 (0.0%) | 0 (0.0%) |
| Total | 74 (100.0%) | 0 (0.0%) |
Fertility by Education in Roanoke
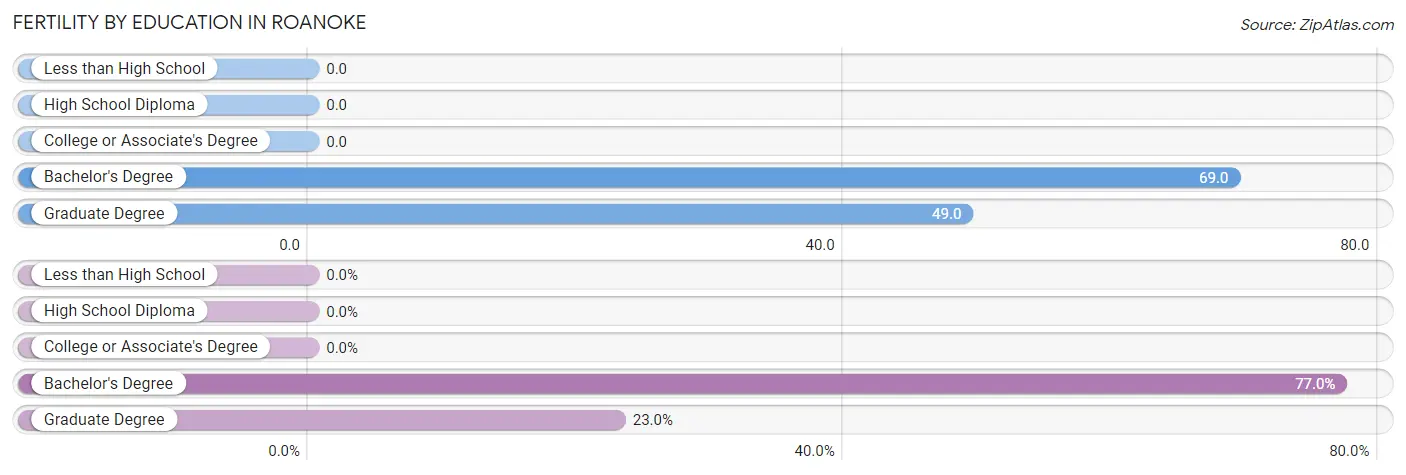
| Educational Attainment | Women with Births | Births / 1,000 Women |
| Less than High School | 0 (0.0%) | 0.0 |
| High School Diploma | 0 (0.0%) | 0.0 |
| College or Associate's Degree | 0 (0.0%) | 0.0 |
| Bachelor's Degree | 57 (77.0%) | 69.0 |
| Graduate Degree | 17 (23.0%) | 49.0 |
| Total | 74 (100.0%) | 29.0 |
Fertility by Education by Marriage Status in Roanoke
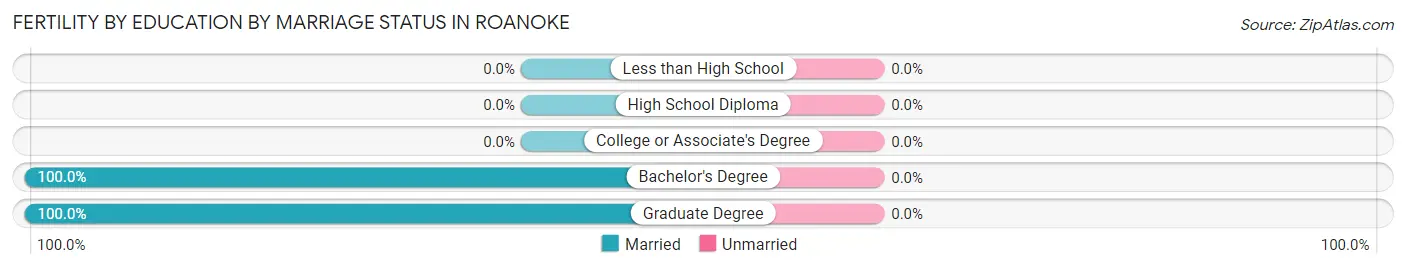
| Educational Attainment | Married | Unmarried |
| Less than High School | 0 (0.0%) | 0 (0.0%) |
| High School Diploma | 0 (0.0%) | 0 (0.0%) |
| College or Associate's Degree | 0 (0.0%) | 0 (0.0%) |
| Bachelor's Degree | 57 (100.0%) | 0 (0.0%) |
| Graduate Degree | 17 (100.0%) | 0 (0.0%) |
| Total | 74 (100.0%) | 0 (0.0%) |
Employment Characteristics in Roanoke
Employment by Class of Employer in Roanoke
Among the 4,898 employed individuals in Roanoke, private company employees (3,701 | 75.6%), local government employees (412 | 8.4%), and self-employed (not incorporated) (277 | 5.7%) make up the most common classes of employment.
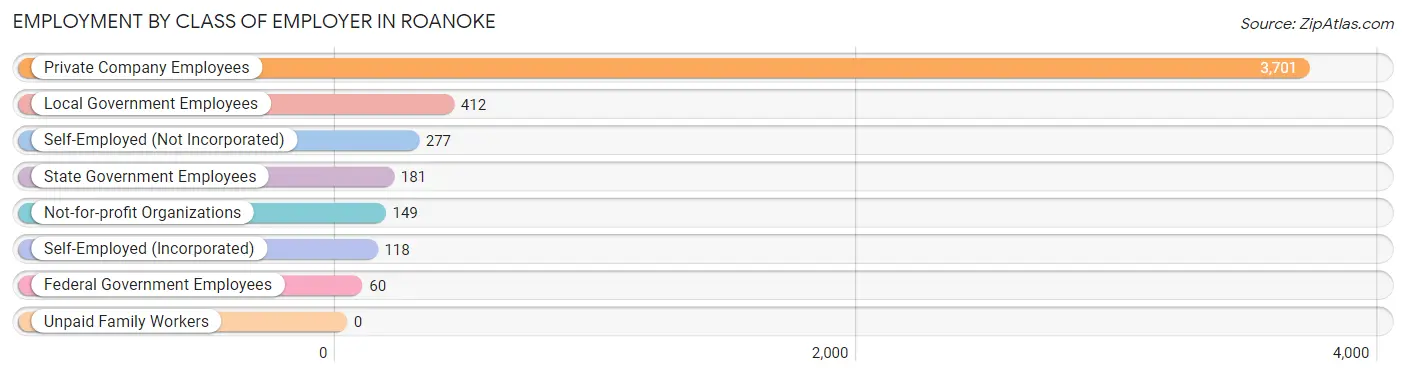
| Employer Class | # Employees | % Employees |
| Private Company Employees | 3,701 | 75.6% |
| Self-Employed (Incorporated) | 118 | 2.4% |
| Self-Employed (Not Incorporated) | 277 | 5.7% |
| Not-for-profit Organizations | 149 | 3.0% |
| Local Government Employees | 412 | 8.4% |
| State Government Employees | 181 | 3.7% |
| Federal Government Employees | 60 | 1.2% |
| Unpaid Family Workers | 0 | 0.0% |
| Total | 4,898 | 100.0% |
Employment Status by Age in Roanoke
According to the labor force statistics for Roanoke, out of the total population over 16 years of age (7,118), 74.9% or 5,331 individuals are in the labor force, with 4.1% or 219 of them unemployed. The age group with the highest labor force participation rate is 20 to 24 years, with 100.0% or 322 individuals in the labor force. Within the labor force, the 35 to 44 years age range has the highest percentage of unemployed individuals, with 7.3% or 93 of them being unemployed.
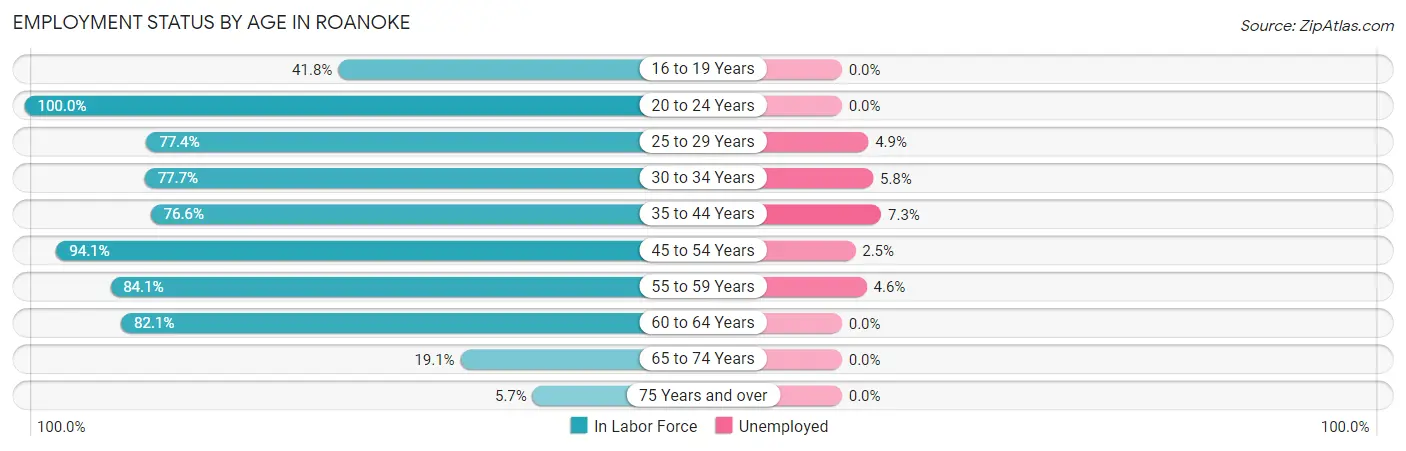
| Age Bracket | In Labor Force | Unemployed |
| 16 to 19 Years | 213 (41.8%) | 0 (0.0%) |
| 20 to 24 Years | 322 (100.0%) | 0 (0.0%) |
| 25 to 29 Years | 469 (77.4%) | 23 (4.9%) |
| 30 to 34 Years | 603 (77.7%) | 35 (5.8%) |
| 35 to 44 Years | 1,280 (76.6%) | 93 (7.3%) |
| 45 to 54 Years | 1,648 (94.1%) | 41 (2.5%) |
| 55 to 59 Years | 562 (84.1%) | 26 (4.6%) |
| 60 to 64 Years | 147 (82.1%) | 0 (0.0%) |
| 65 to 74 Years | 74 (19.1%) | 0 (0.0%) |
| 75 Years and over | 14 (5.7%) | 0 (0.0%) |
| Total | 5,331 (74.9%) | 219 (4.1%) |
Employment Status by Educational Attainment in Roanoke
According to labor force statistics for Roanoke, 83.3% of individuals (4,707) out of the total population between 25 and 64 years of age (5,651) are in the labor force, with 4.6% or 217 of them being unemployed. The group with the highest labor force participation rate are those with the educational attainment of college / associate degree, with 88.3% or 1,395 individuals in the labor force. Within the labor force, individuals with less than high school education have the highest percentage of unemployment, with 11.1% or 27 of them being unemployed.
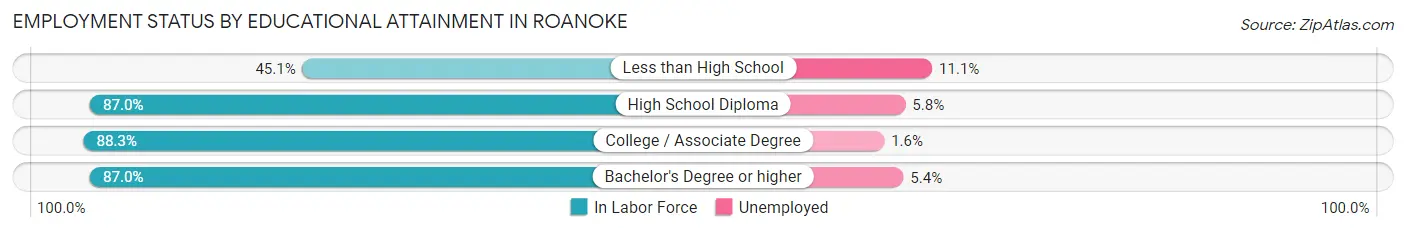
| Educational Attainment | In Labor Force | Unemployed |
| Less than High School | 244 (45.1%) | 60 (11.1%) |
| High School Diploma | 849 (87.0%) | 57 (5.8%) |
| College / Associate Degree | 1,395 (88.3%) | 25 (1.6%) |
| Bachelor's Degree or higher | 2,222 (87.0%) | 138 (5.4%) |
| Total | 4,707 (83.3%) | 260 (4.6%) |
Employment Occupations by Sex in Roanoke
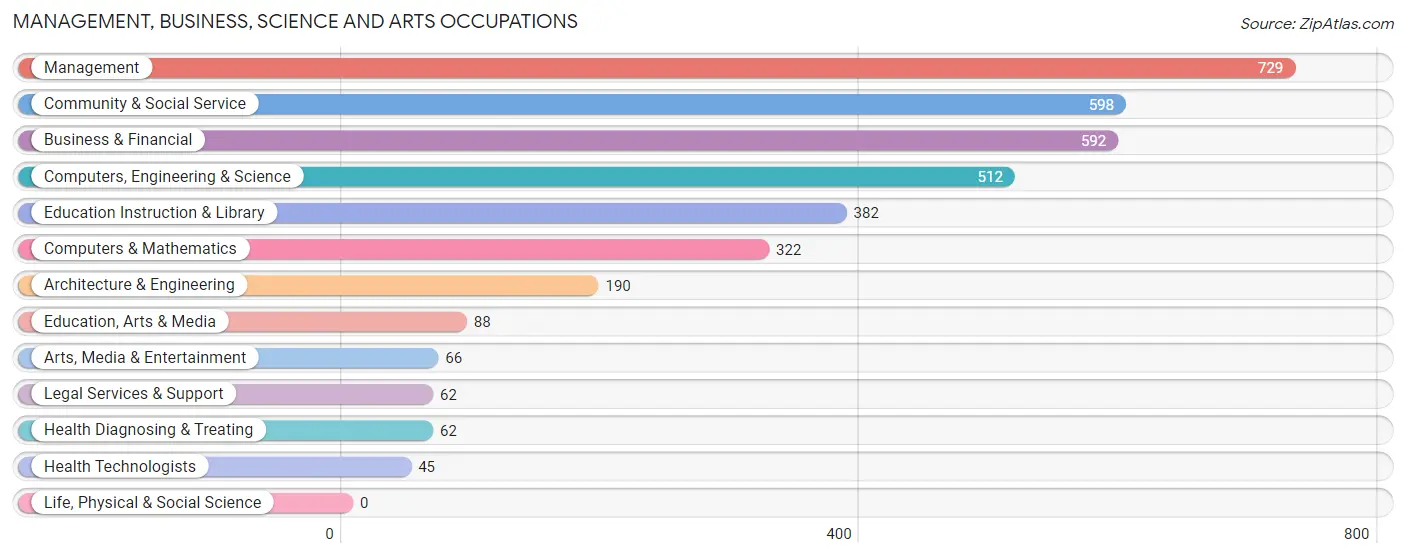
Management, Business, Science and Arts Occupations
The most common Management, Business, Science and Arts occupations in Roanoke are Management (729 | 14.2%), Community & Social Service (598 | 11.7%), Business & Financial (592 | 11.6%), Computers, Engineering & Science (512 | 10.0%), and Education Instruction & Library (382 | 7.5%).
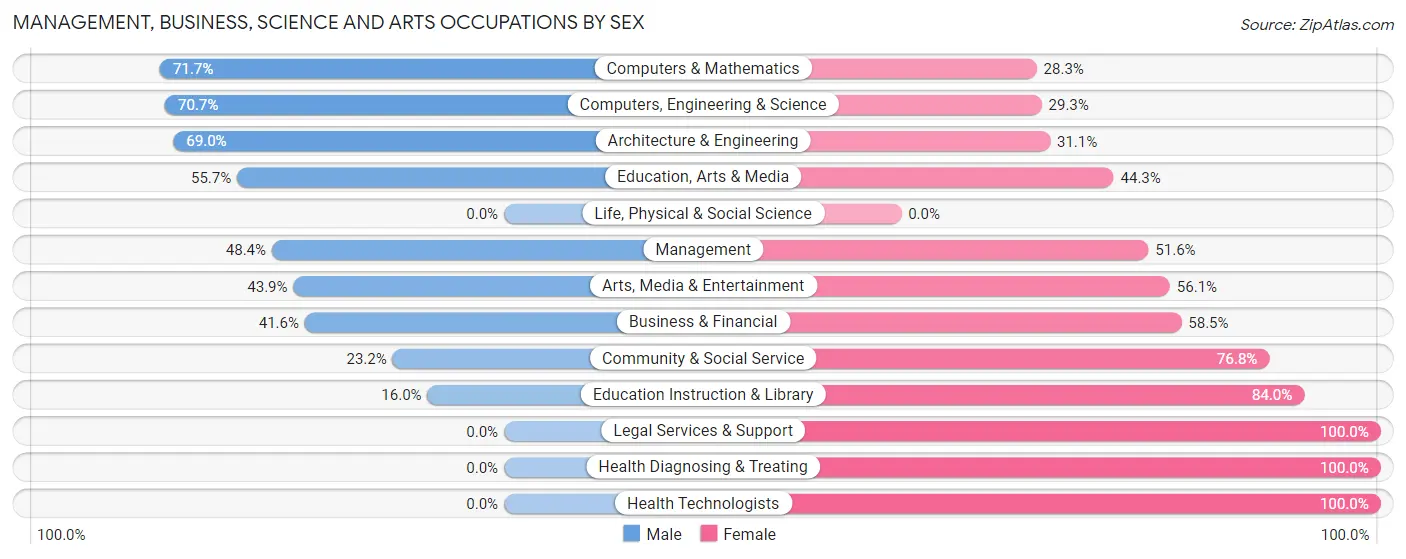
Management, Business, Science and Arts Occupations by Sex
Within the Management, Business, Science and Arts occupations in Roanoke, the most male-oriented occupations are Computers & Mathematics (71.7%), Computers, Engineering & Science (70.7%), and Architecture & Engineering (69.0%), while the most female-oriented occupations are Legal Services & Support (100.0%), Health Diagnosing & Treating (100.0%), and Health Technologists (100.0%).
| Occupation | Male | Female |
| Management | 353 (48.4%) | 376 (51.6%) |
| Business & Financial | 246 (41.5%) | 346 (58.5%) |
| Computers, Engineering & Science | 362 (70.7%) | 150 (29.3%) |
| Computers & Mathematics | 231 (71.7%) | 91 (28.3%) |
| Architecture & Engineering | 131 (69.0%) | 59 (31.0%) |
| Life, Physical & Social Science | 0 (0.0%) | 0 (0.0%) |
| Community & Social Service | 139 (23.2%) | 459 (76.8%) |
| Education, Arts & Media | 49 (55.7%) | 39 (44.3%) |
| Legal Services & Support | 0 (0.0%) | 62 (100.0%) |
| Education Instruction & Library | 61 (16.0%) | 321 (84.0%) |
| Arts, Media & Entertainment | 29 (43.9%) | 37 (56.1%) |
| Health Diagnosing & Treating | 0 (0.0%) | 62 (100.0%) |
| Health Technologists | 0 (0.0%) | 45 (100.0%) |
| Total (Category) | 1,100 (44.1%) | 1,393 (55.9%) |
| Total (Overall) | 2,877 (56.3%) | 2,237 (43.7%) |
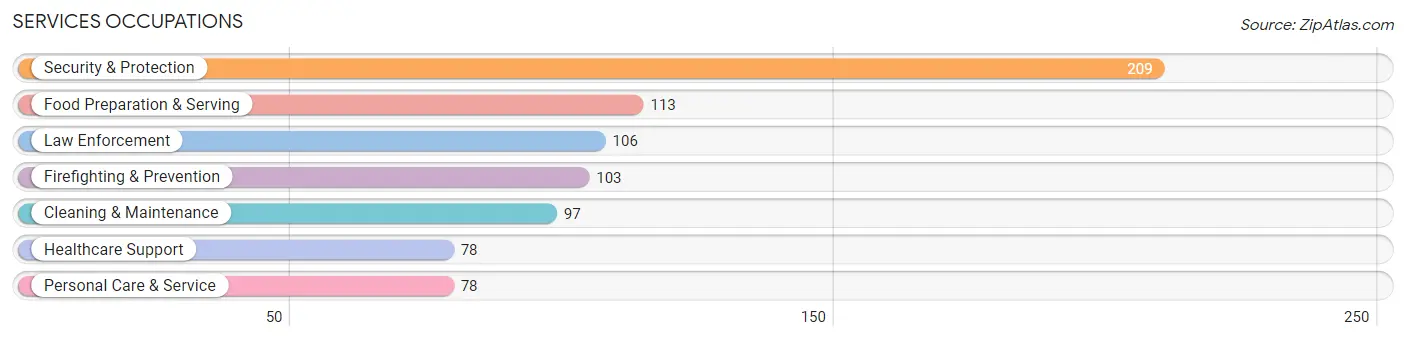
Services Occupations
The most common Services occupations in Roanoke are Security & Protection (209 | 4.1%), Food Preparation & Serving (113 | 2.2%), Law Enforcement (106 | 2.1%), Firefighting & Prevention (103 | 2.0%), and Cleaning & Maintenance (97 | 1.9%).
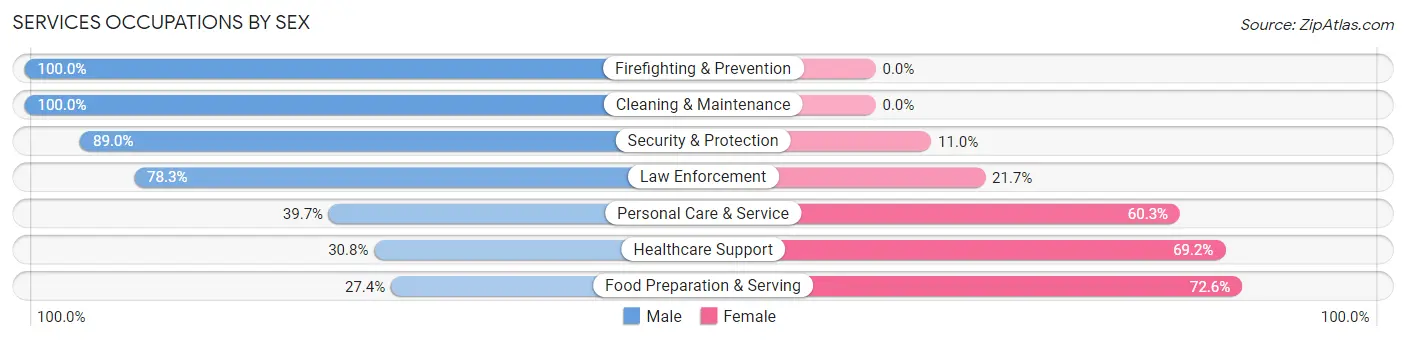
Services Occupations by Sex
Within the Services occupations in Roanoke, the most male-oriented occupations are Firefighting & Prevention (100.0%), Cleaning & Maintenance (100.0%), and Security & Protection (89.0%), while the most female-oriented occupations are Food Preparation & Serving (72.6%), Healthcare Support (69.2%), and Personal Care & Service (60.3%).
| Occupation | Male | Female |
| Healthcare Support | 24 (30.8%) | 54 (69.2%) |
| Security & Protection | 186 (89.0%) | 23 (11.0%) |
| Firefighting & Prevention | 103 (100.0%) | 0 (0.0%) |
| Law Enforcement | 83 (78.3%) | 23 (21.7%) |
| Food Preparation & Serving | 31 (27.4%) | 82 (72.6%) |
| Cleaning & Maintenance | 97 (100.0%) | 0 (0.0%) |
| Personal Care & Service | 31 (39.7%) | 47 (60.3%) |
| Total (Category) | 369 (64.2%) | 206 (35.8%) |
| Total (Overall) | 2,877 (56.3%) | 2,237 (43.7%) |
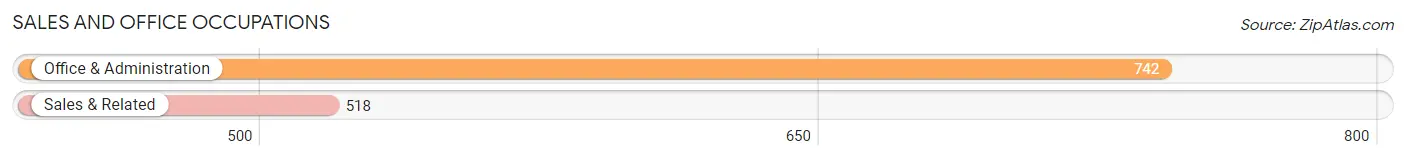
Sales and Office Occupations
The most common Sales and Office occupations in Roanoke are Office & Administration (742 | 14.5%), and Sales & Related (518 | 10.1%).
Sales and Office Occupations by Sex
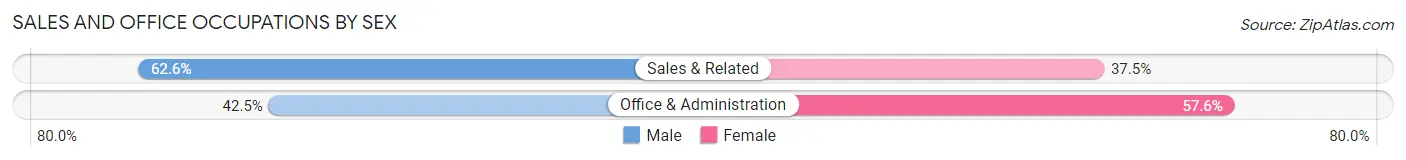
| Occupation | Male | Female |
| Sales & Related | 324 (62.5%) | 194 (37.4%) |
| Office & Administration | 315 (42.4%) | 427 (57.6%) |
| Total (Category) | 639 (50.7%) | 621 (49.3%) |
| Total (Overall) | 2,877 (56.3%) | 2,237 (43.7%) |
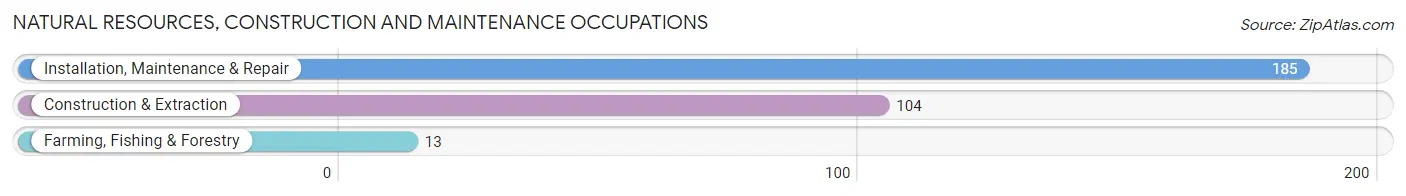
Natural Resources, Construction and Maintenance Occupations
The most common Natural Resources, Construction and Maintenance occupations in Roanoke are Installation, Maintenance & Repair (185 | 3.6%), Construction & Extraction (104 | 2.0%), and Farming, Fishing & Forestry (13 | 0.3%).
Natural Resources, Construction and Maintenance Occupations by Sex
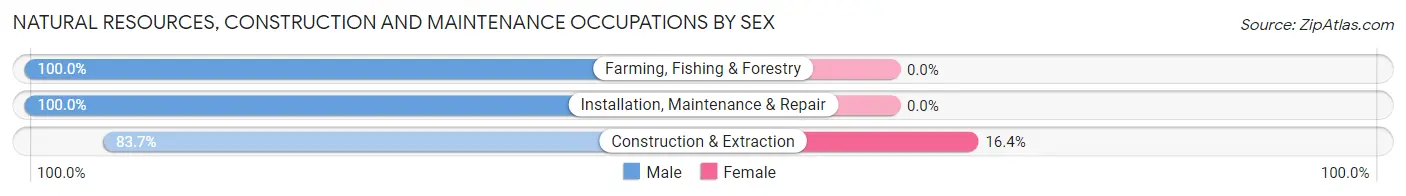
| Occupation | Male | Female |
| Farming, Fishing & Forestry | 13 (100.0%) | 0 (0.0%) |
| Construction & Extraction | 87 (83.7%) | 17 (16.4%) |
| Installation, Maintenance & Repair | 185 (100.0%) | 0 (0.0%) |
| Total (Category) | 285 (94.4%) | 17 (5.6%) |
| Total (Overall) | 2,877 (56.3%) | 2,237 (43.7%) |
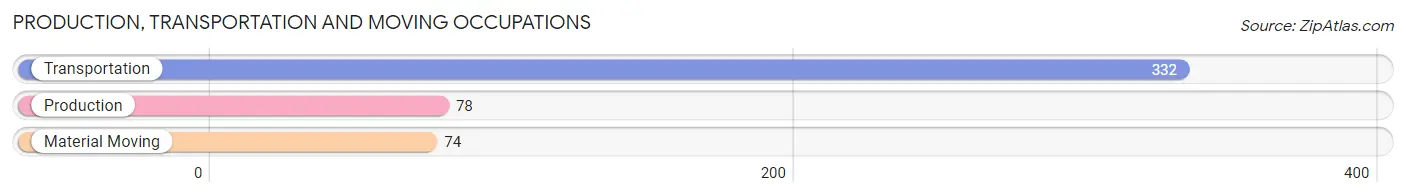
Production, Transportation and Moving Occupations
The most common Production, Transportation and Moving occupations in Roanoke are Transportation (332 | 6.5%), Production (78 | 1.5%), and Material Moving (74 | 1.5%).
Production, Transportation and Moving Occupations by Sex
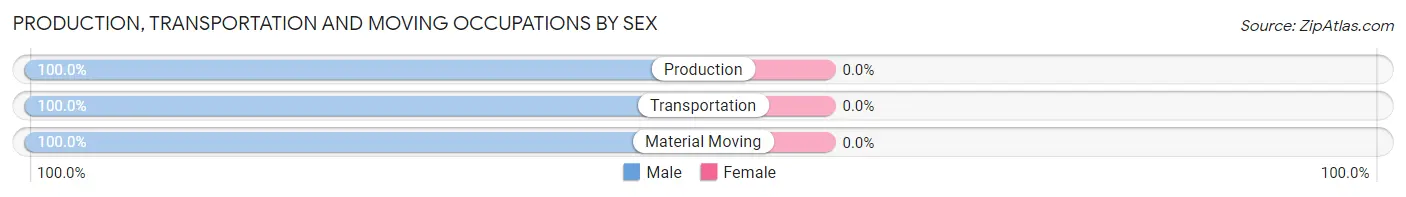
| Occupation | Male | Female |
| Production | 78 (100.0%) | 0 (0.0%) |
| Transportation | 332 (100.0%) | 0 (0.0%) |
| Material Moving | 74 (100.0%) | 0 (0.0%) |
| Total (Category) | 484 (100.0%) | 0 (0.0%) |
| Total (Overall) | 2,877 (56.3%) | 2,237 (43.7%) |
Employment Industries by Sex in Roanoke
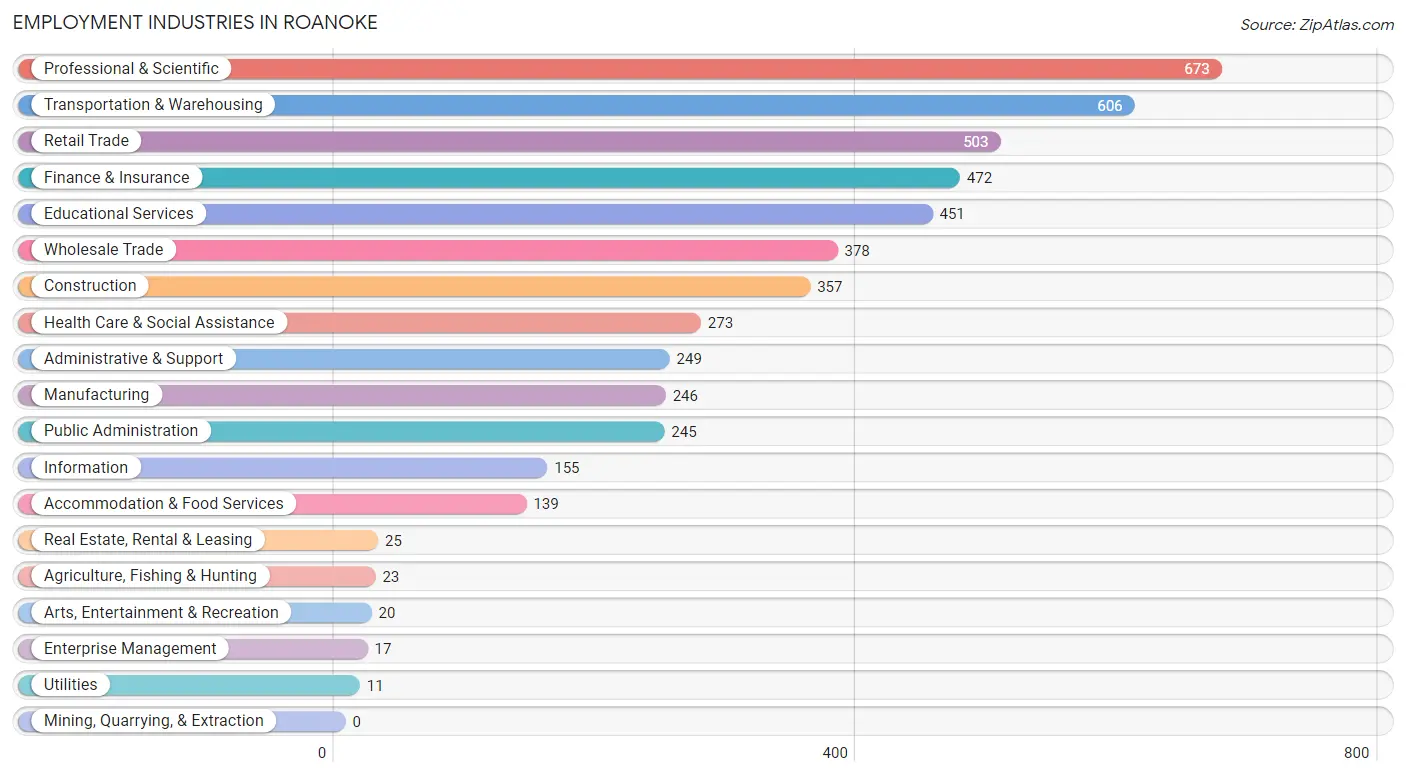
Employment Industries in Roanoke
The major employment industries in Roanoke include Professional & Scientific (673 | 13.2%), Transportation & Warehousing (606 | 11.8%), Retail Trade (503 | 9.8%), Finance & Insurance (472 | 9.2%), and Educational Services (451 | 8.8%).
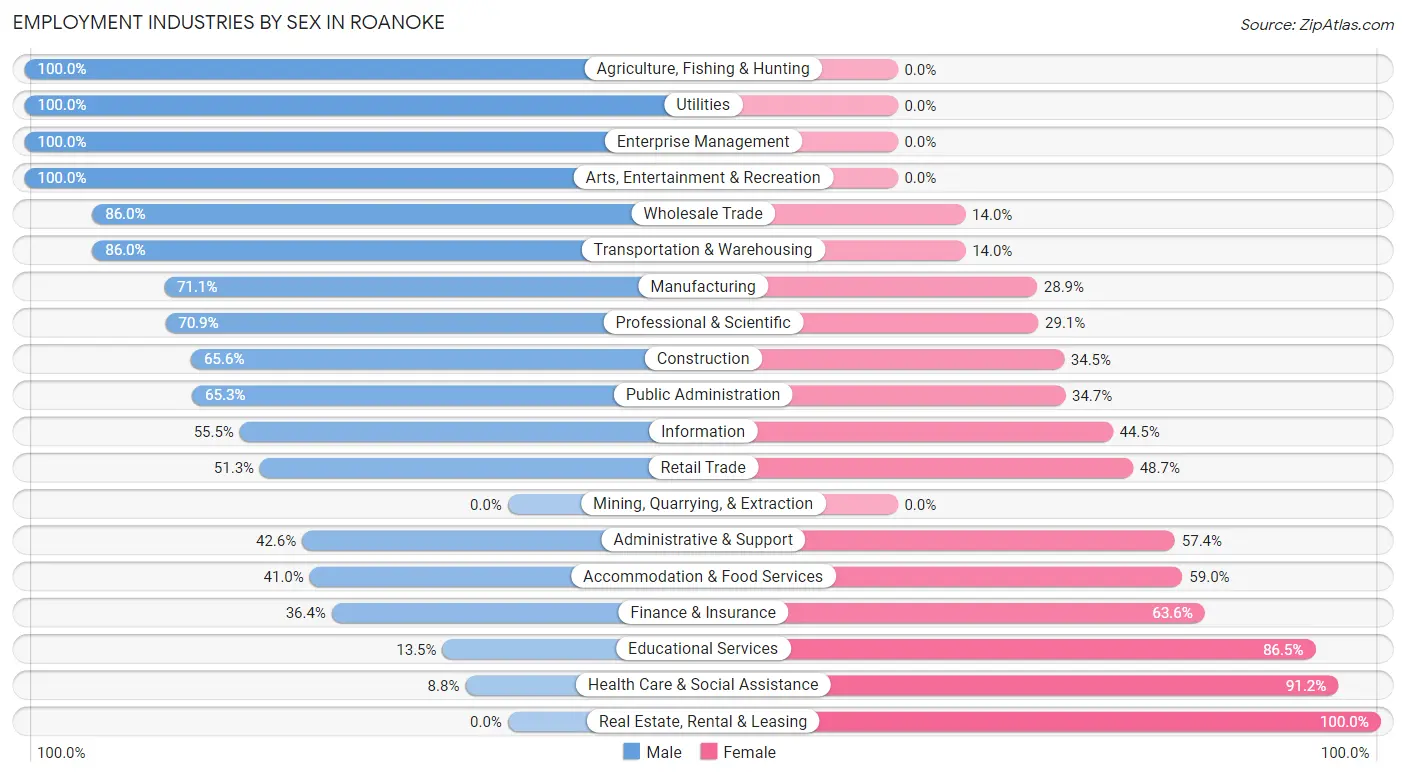
Employment Industries by Sex in Roanoke
The Roanoke industries that see more men than women are Agriculture, Fishing & Hunting (100.0%), Utilities (100.0%), and Enterprise Management (100.0%), whereas the industries that tend to have a higher number of women are Real Estate, Rental & Leasing (100.0%), Health Care & Social Assistance (91.2%), and Educational Services (86.5%).
| Industry | Male | Female |
| Agriculture, Fishing & Hunting | 23 (100.0%) | 0 (0.0%) |
| Mining, Quarrying, & Extraction | 0 (0.0%) | 0 (0.0%) |
| Construction | 234 (65.5%) | 123 (34.4%) |
| Manufacturing | 175 (71.1%) | 71 (28.9%) |
| Wholesale Trade | 325 (86.0%) | 53 (14.0%) |
| Retail Trade | 258 (51.3%) | 245 (48.7%) |
| Transportation & Warehousing | 521 (86.0%) | 85 (14.0%) |
| Utilities | 11 (100.0%) | 0 (0.0%) |
| Information | 86 (55.5%) | 69 (44.5%) |
| Finance & Insurance | 172 (36.4%) | 300 (63.6%) |
| Real Estate, Rental & Leasing | 0 (0.0%) | 25 (100.0%) |
| Professional & Scientific | 477 (70.9%) | 196 (29.1%) |
| Enterprise Management | 17 (100.0%) | 0 (0.0%) |
| Administrative & Support | 106 (42.6%) | 143 (57.4%) |
| Educational Services | 61 (13.5%) | 390 (86.5%) |
| Health Care & Social Assistance | 24 (8.8%) | 249 (91.2%) |
| Arts, Entertainment & Recreation | 20 (100.0%) | 0 (0.0%) |
| Accommodation & Food Services | 57 (41.0%) | 82 (59.0%) |
| Public Administration | 160 (65.3%) | 85 (34.7%) |
| Total | 2,877 (56.3%) | 2,237 (43.7%) |
Education in Roanoke
School Enrollment in Roanoke
The most common levels of schooling among the 2,586 students in Roanoke are middle school (687 | 26.6%), elementary school (577 | 22.3%), and high school (535 | 20.7%).
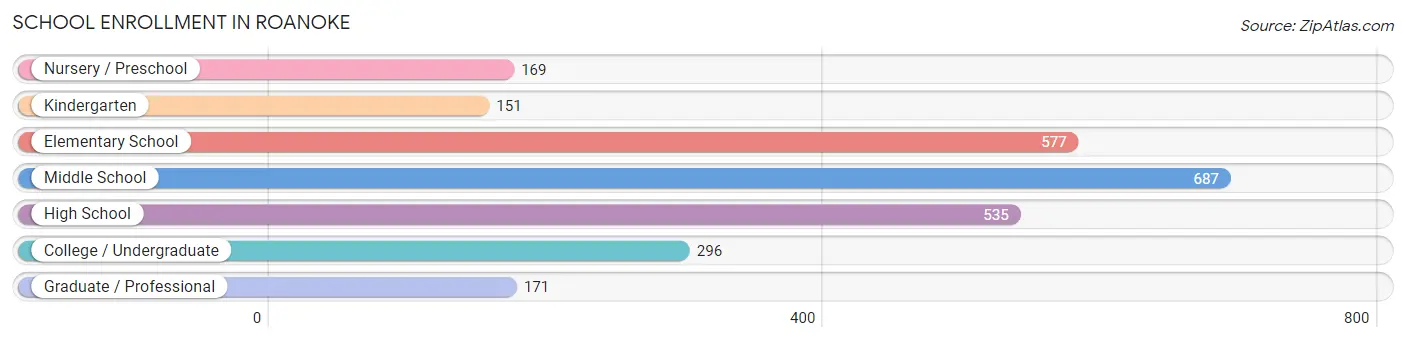
| School Level | # Students | % Students |
| Nursery / Preschool | 169 | 6.5% |
| Kindergarten | 151 | 5.8% |
| Elementary School | 577 | 22.3% |
| Middle School | 687 | 26.6% |
| High School | 535 | 20.7% |
| College / Undergraduate | 296 | 11.5% |
| Graduate / Professional | 171 | 6.6% |
| Total | 2,586 | 100.0% |
School Enrollment by Age by Funding Source in Roanoke
Out of a total of 2,586 students who are enrolled in schools in Roanoke, 308 (11.9%) attend a private institution, while the remaining 2,278 (88.1%) are enrolled in public schools. The age group of 3 to 4 year olds has the highest likelihood of being enrolled in private schools, with 34 (26.8% in the age bracket) enrolled. Conversely, the age group of 18 to 19 year olds has the lowest likelihood of being enrolled in a private school, with 77 (100.0% in the age bracket) attending a public institution.
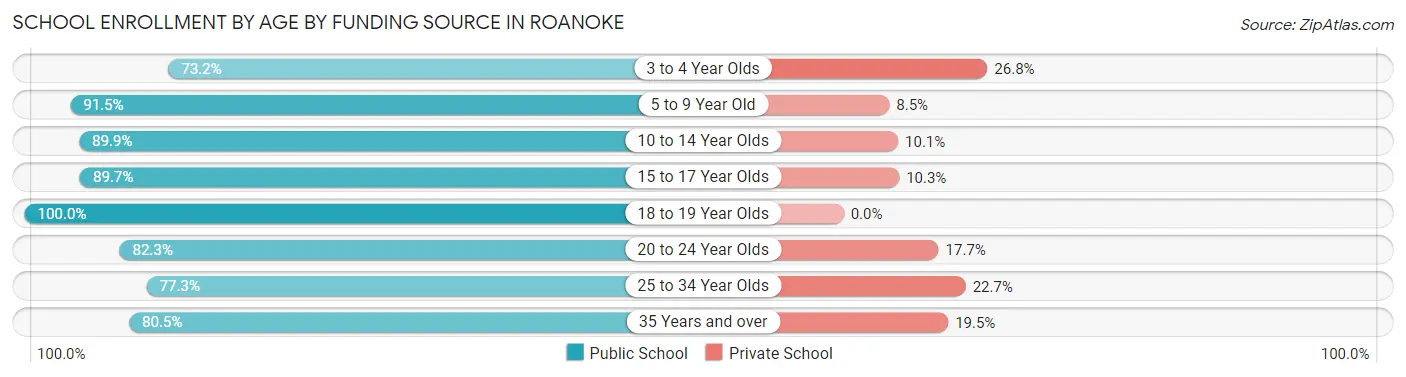
| Age Bracket | Public School | Private School |
| 3 to 4 Year Olds | 93 (73.2%) | 34 (26.8%) |
| 5 to 9 Year Old | 677 (91.5%) | 63 (8.5%) |
| 10 to 14 Year Olds | 709 (89.9%) | 80 (10.1%) |
| 15 to 17 Year Olds | 364 (89.7%) | 42 (10.3%) |
| 18 to 19 Year Olds | 77 (100.0%) | 0 (0.0%) |
| 20 to 24 Year Olds | 121 (82.3%) | 26 (17.7%) |
| 25 to 34 Year Olds | 85 (77.3%) | 25 (22.7%) |
| 35 Years and over | 153 (80.5%) | 37 (19.5%) |
| Total | 2,278 (88.1%) | 308 (11.9%) |
Educational Attainment by Field of Study in Roanoke
Business (907 | 30.7%), arts & humanities (346 | 11.7%), education (261 | 8.8%), computers & mathematics (253 | 8.6%), and engineering (244 | 8.3%) are the most common fields of study among 2,958 individuals in Roanoke who have obtained a bachelor's degree or higher.
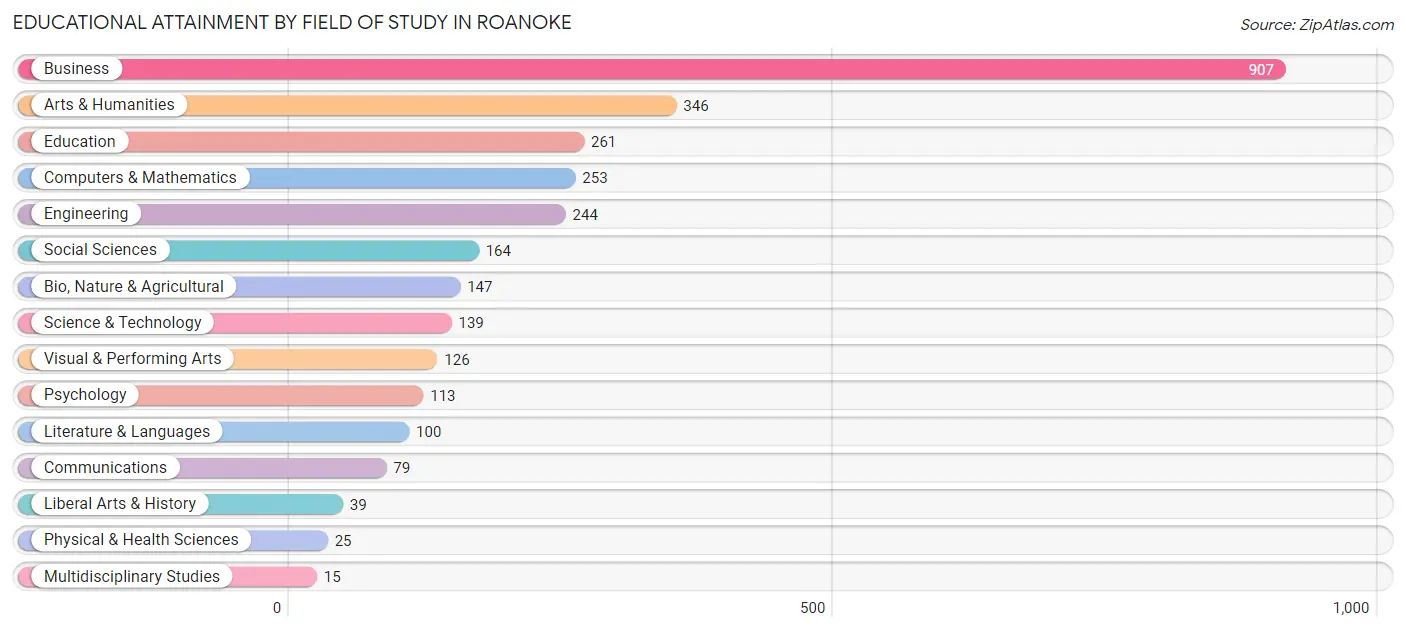
| Field of Study | # Graduates | % Graduates |
| Computers & Mathematics | 253 | 8.6% |
| Bio, Nature & Agricultural | 147 | 5.0% |
| Physical & Health Sciences | 25 | 0.9% |
| Psychology | 113 | 3.8% |
| Social Sciences | 164 | 5.5% |
| Engineering | 244 | 8.3% |
| Multidisciplinary Studies | 15 | 0.5% |
| Science & Technology | 139 | 4.7% |
| Business | 907 | 30.7% |
| Education | 261 | 8.8% |
| Literature & Languages | 100 | 3.4% |
| Liberal Arts & History | 39 | 1.3% |
| Visual & Performing Arts | 126 | 4.3% |
| Communications | 79 | 2.7% |
| Arts & Humanities | 346 | 11.7% |
| Total | 2,958 | 100.0% |
Transportation & Commute in Roanoke
Vehicle Availability by Sex in Roanoke
The most prevalent vehicle ownership categories in Roanoke are males with 2 vehicles (1,124, accounting for 41.3%) and females with 2 vehicles (851, making up 51.6%).
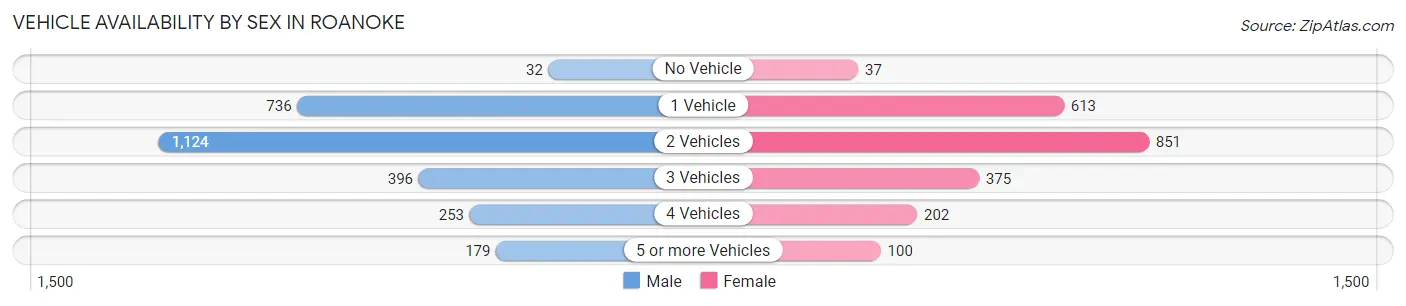
| Vehicles Available | Male | Female |
| No Vehicle | 32 (1.2%) | 37 (1.7%) |
| 1 Vehicle | 736 (27.1%) | 613 (28.1%) |
| 2 Vehicles | 1,124 (41.3%) | 851 (39.1%) |
| 3 Vehicles | 396 (14.6%) | 375 (17.2%) |
| 4 Vehicles | 253 (9.3%) | 202 (9.3%) |
| 5 or more Vehicles | 179 (6.6%) | 100 (4.6%) |
| Total | 2,720 (100.0%) | 2,178 (100.0%) |
Commute Time in Roanoke
The most frequently occuring commute durations in Roanoke are 30 to 34 minutes (919 commuters, 21.5%), 15 to 19 minutes (659 commuters, 15.4%), and 25 to 29 minutes (582 commuters, 13.6%).
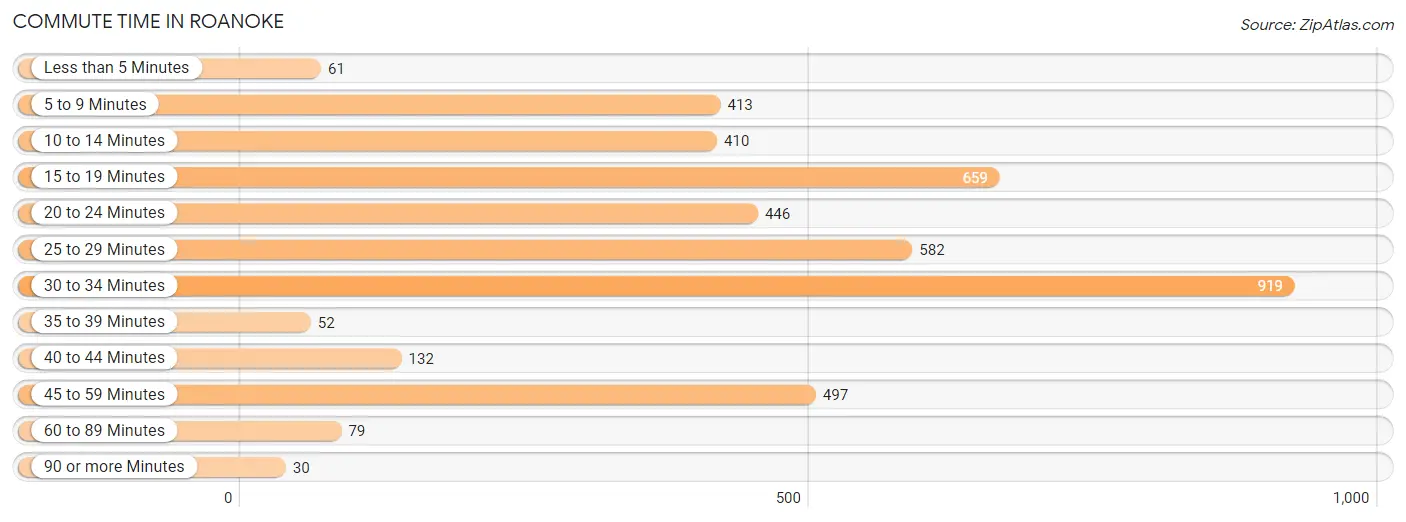
| Commute Time | # Commuters | % Commuters |
| Less than 5 Minutes | 61 | 1.4% |
| 5 to 9 Minutes | 413 | 9.7% |
| 10 to 14 Minutes | 410 | 9.6% |
| 15 to 19 Minutes | 659 | 15.4% |
| 20 to 24 Minutes | 446 | 10.4% |
| 25 to 29 Minutes | 582 | 13.6% |
| 30 to 34 Minutes | 919 | 21.5% |
| 35 to 39 Minutes | 52 | 1.2% |
| 40 to 44 Minutes | 132 | 3.1% |
| 45 to 59 Minutes | 497 | 11.6% |
| 60 to 89 Minutes | 79 | 1.8% |
| 90 or more Minutes | 30 | 0.7% |
Commute Time by Sex in Roanoke
The most common commute times in Roanoke are 30 to 34 minutes (597 commuters, 24.1%) for males and 30 to 34 minutes (322 commuters, 17.8%) for females.
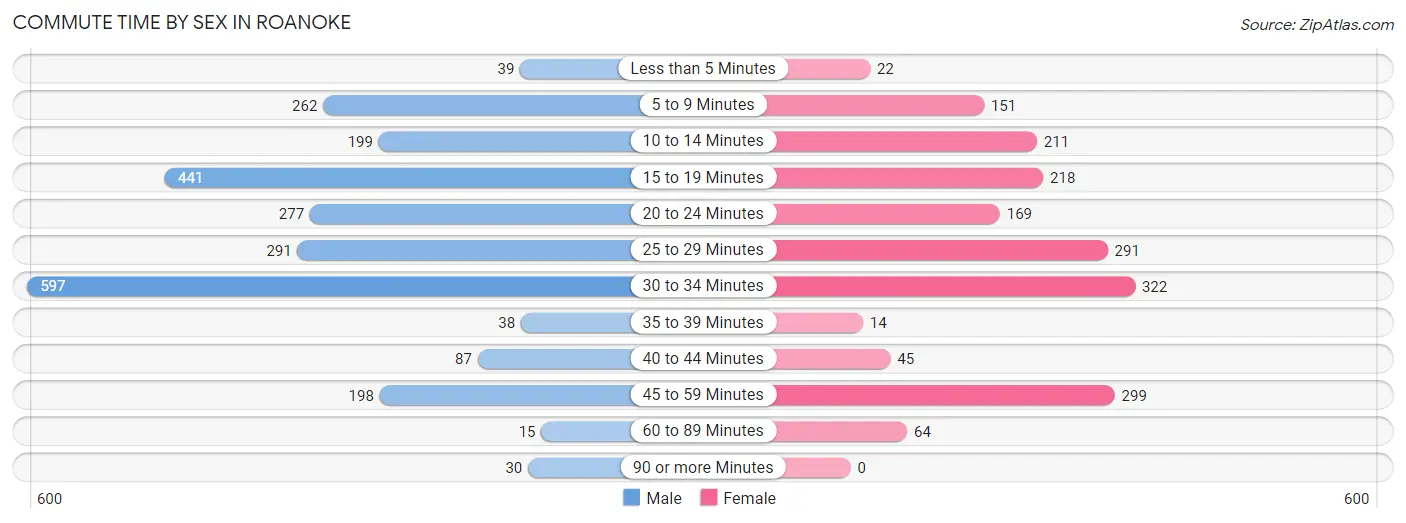
| Commute Time | Male | Female |
| Less than 5 Minutes | 39 (1.6%) | 22 (1.2%) |
| 5 to 9 Minutes | 262 (10.6%) | 151 (8.4%) |
| 10 to 14 Minutes | 199 (8.0%) | 211 (11.7%) |
| 15 to 19 Minutes | 441 (17.8%) | 218 (12.1%) |
| 20 to 24 Minutes | 277 (11.2%) | 169 (9.4%) |
| 25 to 29 Minutes | 291 (11.8%) | 291 (16.1%) |
| 30 to 34 Minutes | 597 (24.1%) | 322 (17.8%) |
| 35 to 39 Minutes | 38 (1.5%) | 14 (0.8%) |
| 40 to 44 Minutes | 87 (3.5%) | 45 (2.5%) |
| 45 to 59 Minutes | 198 (8.0%) | 299 (16.6%) |
| 60 to 89 Minutes | 15 (0.6%) | 64 (3.5%) |
| 90 or more Minutes | 30 (1.2%) | 0 (0.0%) |
Time of Departure to Work by Sex in Roanoke
The most frequent times of departure to work in Roanoke are 6:30 AM to 6:59 AM (327, 13.2%) for males and 7:00 AM to 7:29 AM (421, 23.3%) for females.
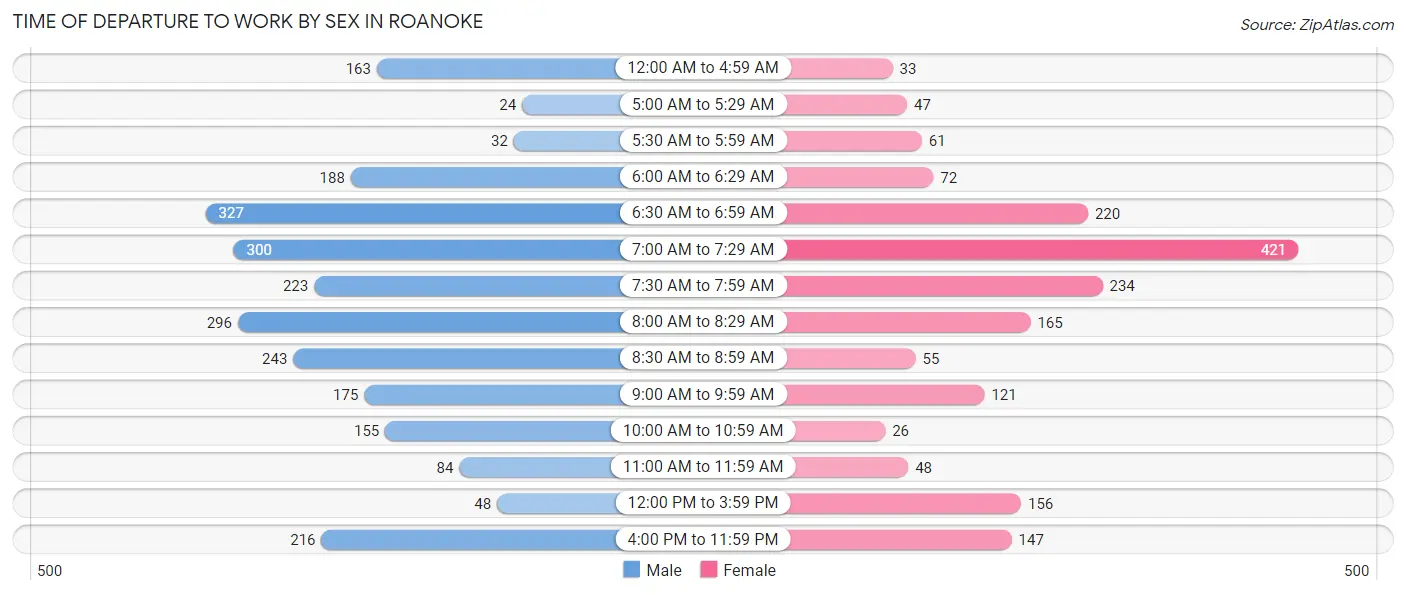
| Time of Departure | Male | Female |
| 12:00 AM to 4:59 AM | 163 (6.6%) | 33 (1.8%) |
| 5:00 AM to 5:29 AM | 24 (1.0%) | 47 (2.6%) |
| 5:30 AM to 5:59 AM | 32 (1.3%) | 61 (3.4%) |
| 6:00 AM to 6:29 AM | 188 (7.6%) | 72 (4.0%) |
| 6:30 AM to 6:59 AM | 327 (13.2%) | 220 (12.2%) |
| 7:00 AM to 7:29 AM | 300 (12.1%) | 421 (23.3%) |
| 7:30 AM to 7:59 AM | 223 (9.0%) | 234 (13.0%) |
| 8:00 AM to 8:29 AM | 296 (12.0%) | 165 (9.1%) |
| 8:30 AM to 8:59 AM | 243 (9.8%) | 55 (3.0%) |
| 9:00 AM to 9:59 AM | 175 (7.1%) | 121 (6.7%) |
| 10:00 AM to 10:59 AM | 155 (6.3%) | 26 (1.4%) |
| 11:00 AM to 11:59 AM | 84 (3.4%) | 48 (2.7%) |
| 12:00 PM to 3:59 PM | 48 (1.9%) | 156 (8.6%) |
| 4:00 PM to 11:59 PM | 216 (8.7%) | 147 (8.1%) |
| Total | 2,474 (100.0%) | 1,806 (100.0%) |
Housing Occupancy in Roanoke
Occupancy by Ownership in Roanoke
Of the total 3,620 dwellings in Roanoke, owner-occupied units account for 2,117 (58.5%), while renter-occupied units make up 1,503 (41.5%).
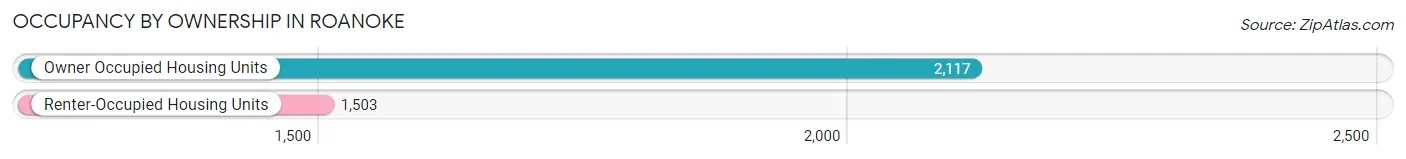
| Occupancy | # Housing Units | % Housing Units |
| Owner Occupied Housing Units | 2,117 | 58.5% |
| Renter-Occupied Housing Units | 1,503 | 41.5% |
| Total Occupied Housing Units | 3,620 | 100.0% |
Occupancy by Household Size in Roanoke
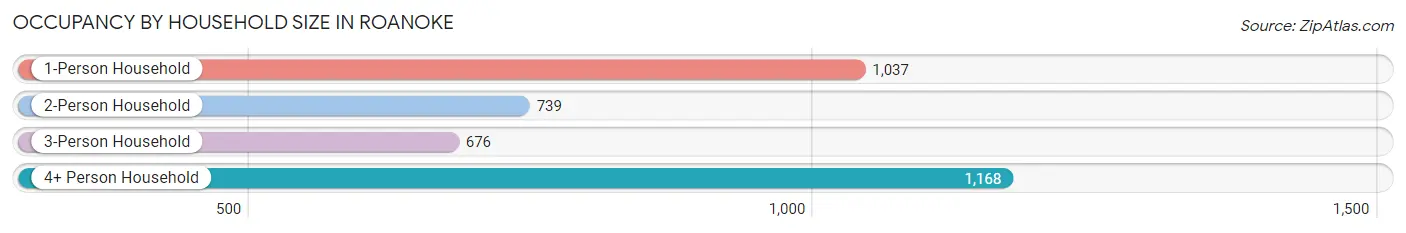
| Household Size | # Housing Units | % Housing Units |
| 1-Person Household | 1,037 | 28.6% |
| 2-Person Household | 739 | 20.4% |
| 3-Person Household | 676 | 18.7% |
| 4+ Person Household | 1,168 | 32.3% |
| Total Housing Units | 3,620 | 100.0% |
Occupancy by Ownership by Household Size in Roanoke
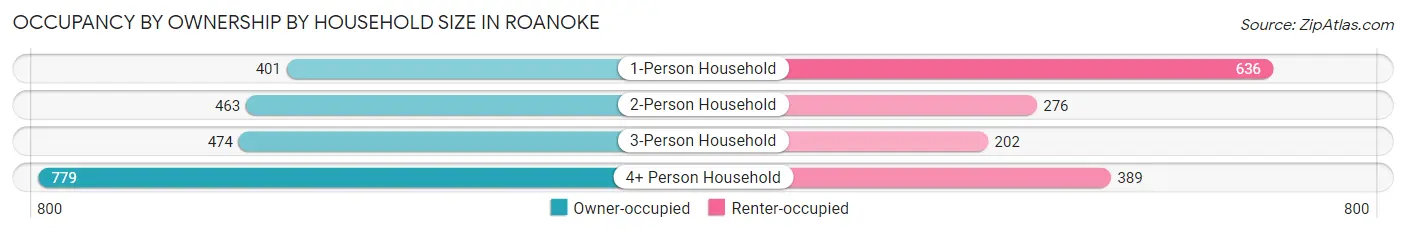
| Household Size | Owner-occupied | Renter-occupied |
| 1-Person Household | 401 (38.7%) | 636 (61.3%) |
| 2-Person Household | 463 (62.6%) | 276 (37.3%) |
| 3-Person Household | 474 (70.1%) | 202 (29.9%) |
| 4+ Person Household | 779 (66.7%) | 389 (33.3%) |
| Total Housing Units | 2,117 (58.5%) | 1,503 (41.5%) |
Occupancy by Educational Attainment in Roanoke
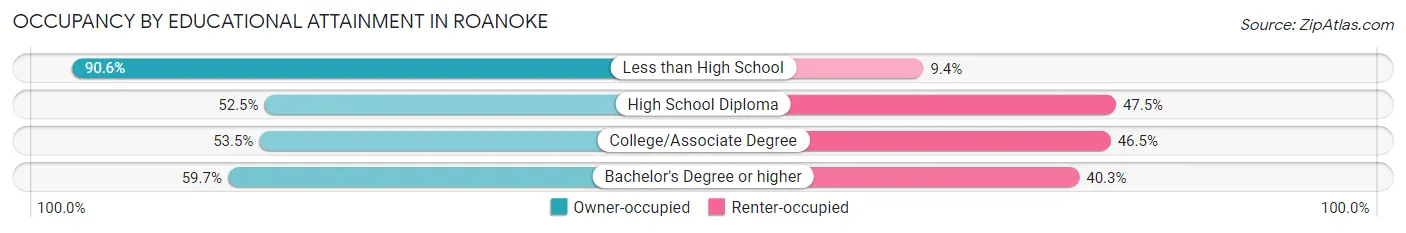
| Household Size | Owner-occupied | Renter-occupied |
| Less than High School | 174 (90.6%) | 18 (9.4%) |
| High School Diploma | 245 (52.5%) | 222 (47.5%) |
| College/Associate Degree | 605 (53.5%) | 526 (46.5%) |
| Bachelor's Degree or higher | 1,093 (59.7%) | 737 (40.3%) |
Occupancy by Age of Householder in Roanoke
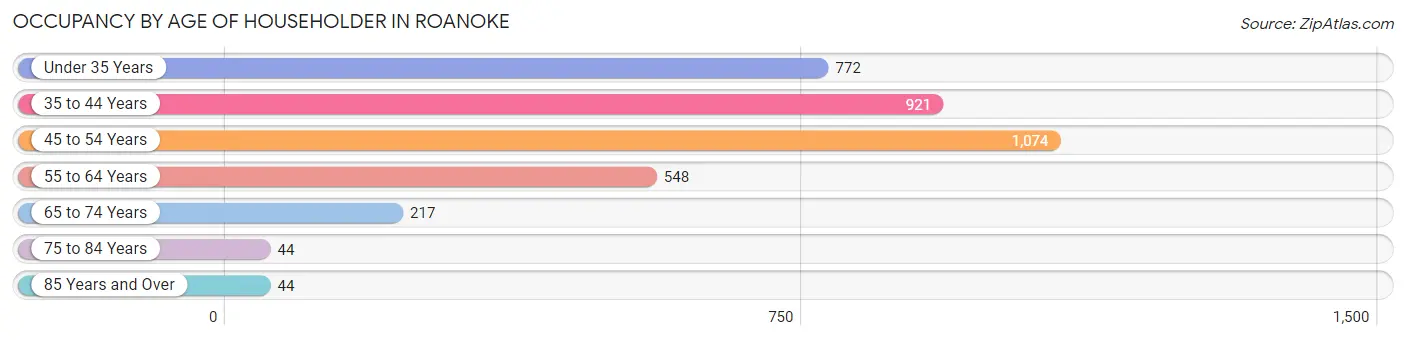
| Age Bracket | # Households | % Households |
| Under 35 Years | 772 | 21.3% |
| 35 to 44 Years | 921 | 25.4% |
| 45 to 54 Years | 1,074 | 29.7% |
| 55 to 64 Years | 548 | 15.1% |
| 65 to 74 Years | 217 | 6.0% |
| 75 to 84 Years | 44 | 1.2% |
| 85 Years and Over | 44 | 1.2% |
| Total | 3,620 | 100.0% |
Housing Finances in Roanoke
Median Income by Occupancy in Roanoke
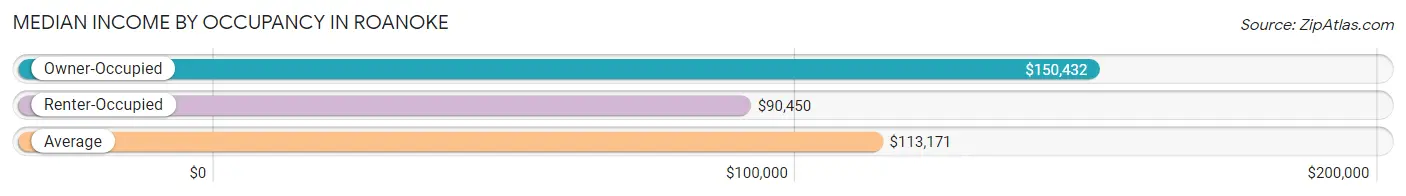
| Occupancy Type | # Households | Median Income |
| Owner-Occupied | 2,117 (58.5%) | $150,432 |
| Renter-Occupied | 1,503 (41.5%) | $90,450 |
| Average | 3,620 (100.0%) | $113,171 |
Occupancy by Householder Income Bracket in Roanoke
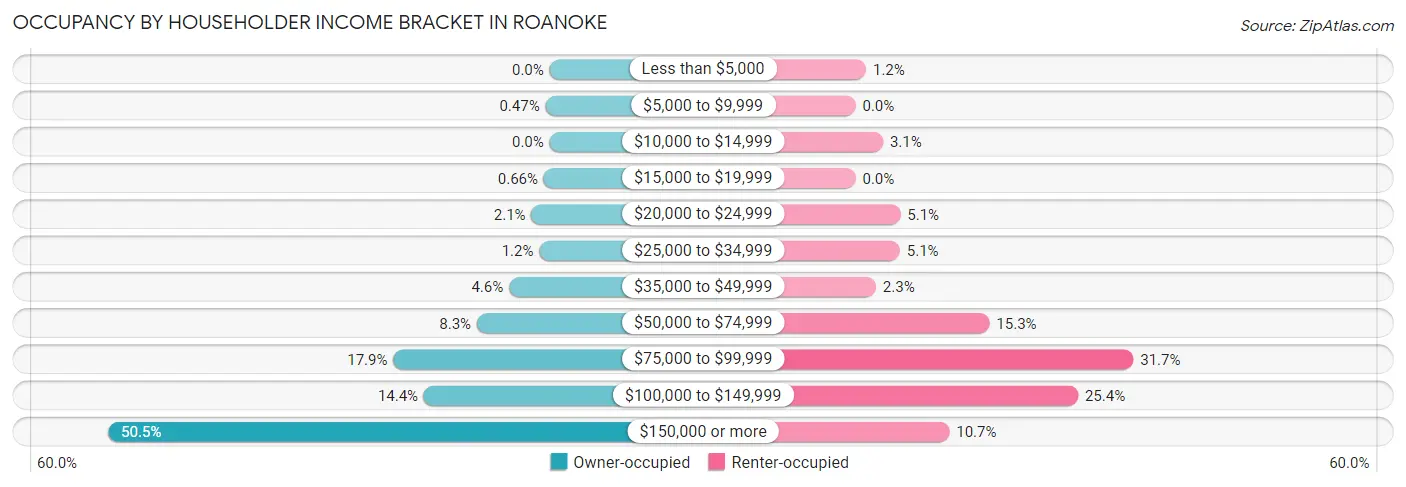
| Income Bracket | Owner-occupied | Renter-occupied |
| Less than $5,000 | 0 (0.0%) | 18 (1.2%) |
| $5,000 to $9,999 | 10 (0.5%) | 0 (0.0%) |
| $10,000 to $14,999 | 0 (0.0%) | 47 (3.1%) |
| $15,000 to $19,999 | 14 (0.7%) | 0 (0.0%) |
| $20,000 to $24,999 | 44 (2.1%) | 77 (5.1%) |
| $25,000 to $34,999 | 25 (1.2%) | 76 (5.1%) |
| $35,000 to $49,999 | 98 (4.6%) | 35 (2.3%) |
| $50,000 to $74,999 | 176 (8.3%) | 230 (15.3%) |
| $75,000 to $99,999 | 378 (17.9%) | 477 (31.7%) |
| $100,000 to $149,999 | 304 (14.4%) | 382 (25.4%) |
| $150,000 or more | 1,068 (50.4%) | 161 (10.7%) |
| Total | 2,117 (100.0%) | 1,503 (100.0%) |
Monthly Housing Cost Tiers in Roanoke
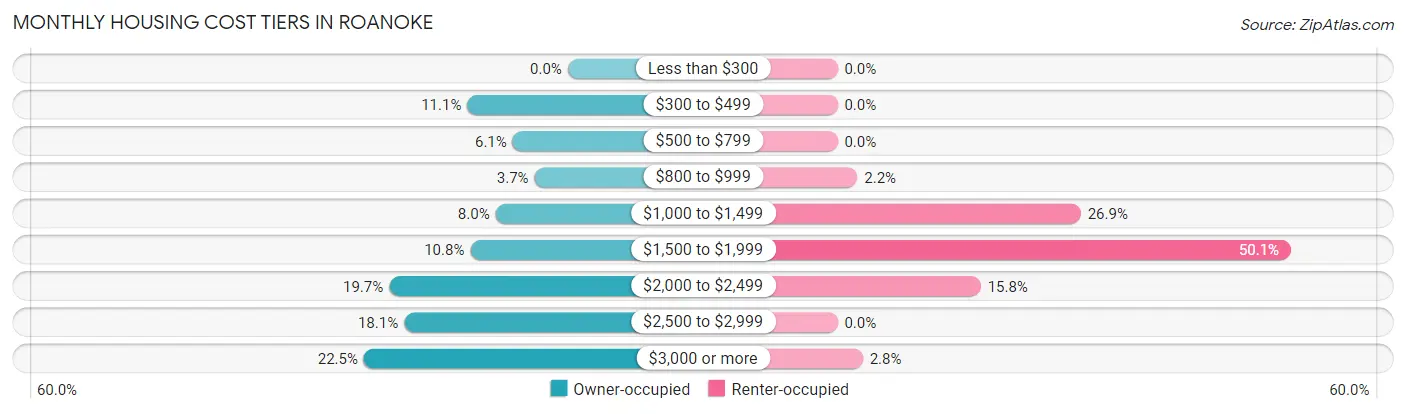
| Monthly Cost | Owner-occupied | Renter-occupied |
| Less than $300 | 0 (0.0%) | 0 (0.0%) |
| $300 to $499 | 235 (11.1%) | 0 (0.0%) |
| $500 to $799 | 129 (6.1%) | 0 (0.0%) |
| $800 to $999 | 78 (3.7%) | 33 (2.2%) |
| $1,000 to $1,499 | 169 (8.0%) | 404 (26.9%) |
| $1,500 to $1,999 | 228 (10.8%) | 753 (50.1%) |
| $2,000 to $2,499 | 418 (19.7%) | 238 (15.8%) |
| $2,500 to $2,999 | 383 (18.1%) | 0 (0.0%) |
| $3,000 or more | 477 (22.5%) | 42 (2.8%) |
| Total | 2,117 (100.0%) | 1,503 (100.0%) |
Physical Housing Characteristics in Roanoke
Housing Structures in Roanoke
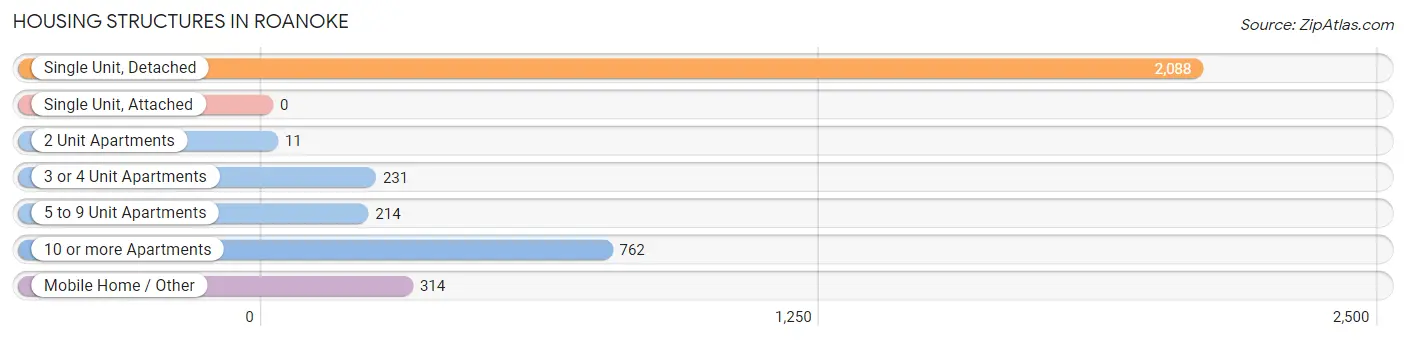
| Structure Type | # Housing Units | % Housing Units |
| Single Unit, Detached | 2,088 | 57.7% |
| Single Unit, Attached | 0 | 0.0% |
| 2 Unit Apartments | 11 | 0.3% |
| 3 or 4 Unit Apartments | 231 | 6.4% |
| 5 to 9 Unit Apartments | 214 | 5.9% |
| 10 or more Apartments | 762 | 21.0% |
| Mobile Home / Other | 314 | 8.7% |
| Total | 3,620 | 100.0% |
Housing Structures by Occupancy in Roanoke
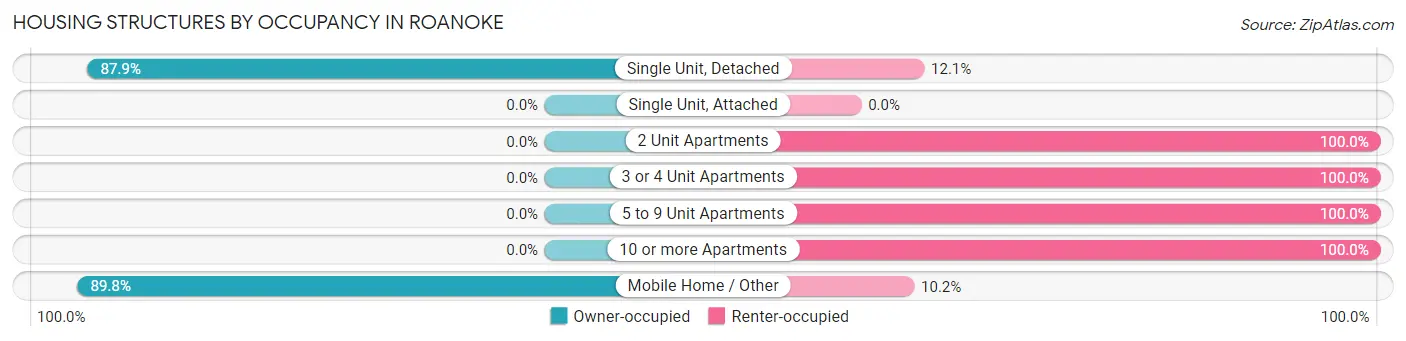
| Structure Type | Owner-occupied | Renter-occupied |
| Single Unit, Detached | 1,835 (87.9%) | 253 (12.1%) |
| Single Unit, Attached | 0 (0.0%) | 0 (0.0%) |
| 2 Unit Apartments | 0 (0.0%) | 11 (100.0%) |
| 3 or 4 Unit Apartments | 0 (0.0%) | 231 (100.0%) |
| 5 to 9 Unit Apartments | 0 (0.0%) | 214 (100.0%) |
| 10 or more Apartments | 0 (0.0%) | 762 (100.0%) |
| Mobile Home / Other | 282 (89.8%) | 32 (10.2%) |
| Total | 2,117 (58.5%) | 1,503 (41.5%) |
Housing Structures by Number of Rooms in Roanoke
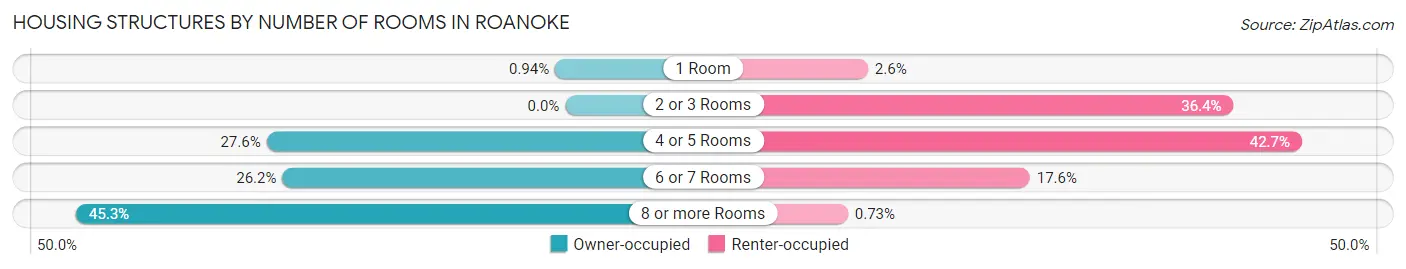
| Number of Rooms | Owner-occupied | Renter-occupied |
| 1 Room | 20 (0.9%) | 39 (2.6%) |
| 2 or 3 Rooms | 0 (0.0%) | 547 (36.4%) |
| 4 or 5 Rooms | 585 (27.6%) | 642 (42.7%) |
| 6 or 7 Rooms | 554 (26.2%) | 264 (17.6%) |
| 8 or more Rooms | 958 (45.3%) | 11 (0.7%) |
| Total | 2,117 (100.0%) | 1,503 (100.0%) |
Housing Structure by Heating Type in Roanoke
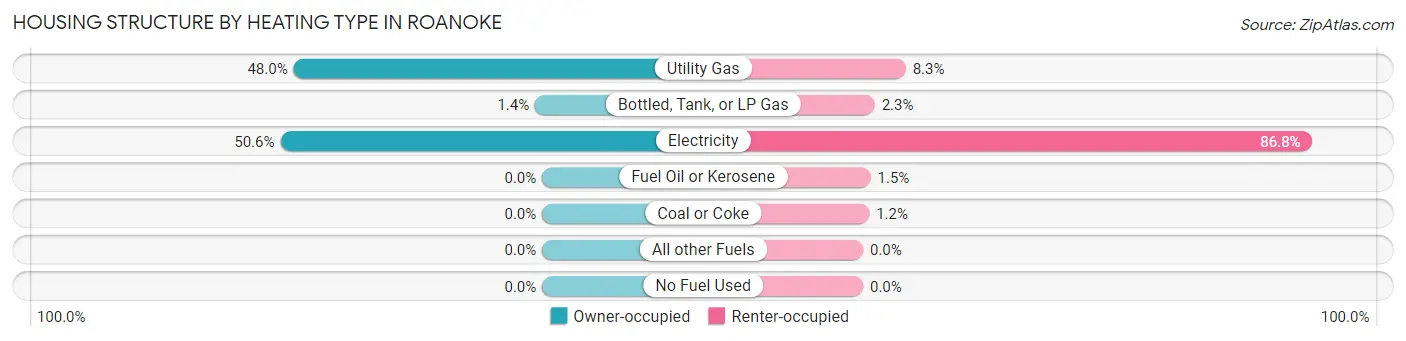
| Heating Type | Owner-occupied | Renter-occupied |
| Utility Gas | 1,017 (48.0%) | 124 (8.3%) |
| Bottled, Tank, or LP Gas | 29 (1.4%) | 34 (2.3%) |
| Electricity | 1,071 (50.6%) | 1,305 (86.8%) |
| Fuel Oil or Kerosene | 0 (0.0%) | 22 (1.5%) |
| Coal or Coke | 0 (0.0%) | 18 (1.2%) |
| All other Fuels | 0 (0.0%) | 0 (0.0%) |
| No Fuel Used | 0 (0.0%) | 0 (0.0%) |
| Total | 2,117 (100.0%) | 1,503 (100.0%) |
Household Vehicle Usage in Roanoke
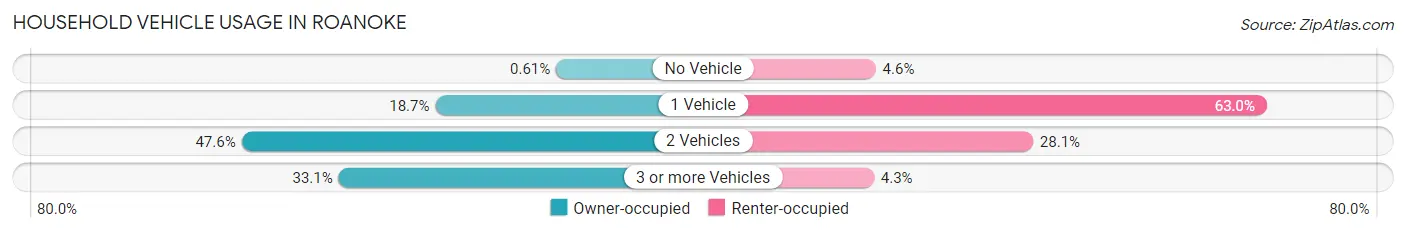
| Vehicles per Household | Owner-occupied | Renter-occupied |
| No Vehicle | 13 (0.6%) | 69 (4.6%) |
| 1 Vehicle | 395 (18.7%) | 947 (63.0%) |
| 2 Vehicles | 1,008 (47.6%) | 422 (28.1%) |
| 3 or more Vehicles | 701 (33.1%) | 65 (4.3%) |
| Total | 2,117 (100.0%) | 1,503 (100.0%) |
Real Estate & Mortgages in Roanoke
Real Estate and Mortgage Overview in Roanoke
| Characteristic | Without Mortgage | With Mortgage |
| Housing Units | 504 | 1,613 |
| Median Property Value | $172,600 | $436,900 |
| Median Household Income | $76,380 | $945 |
| Monthly Housing Costs | $539 | $477 |
| Real Estate Taxes | $1,907 | $0 |
Property Value by Mortgage Status in Roanoke
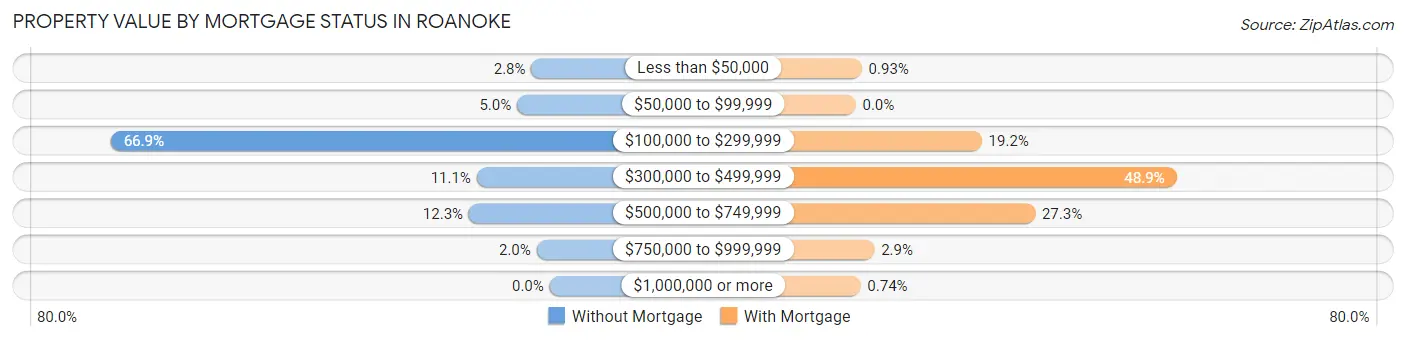
| Property Value | Without Mortgage | With Mortgage |
| Less than $50,000 | 14 (2.8%) | 15 (0.9%) |
| $50,000 to $99,999 | 25 (5.0%) | 0 (0.0%) |
| $100,000 to $299,999 | 337 (66.9%) | 310 (19.2%) |
| $300,000 to $499,999 | 56 (11.1%) | 789 (48.9%) |
| $500,000 to $749,999 | 62 (12.3%) | 441 (27.3%) |
| $750,000 to $999,999 | 10 (2.0%) | 46 (2.9%) |
| $1,000,000 or more | 0 (0.0%) | 12 (0.7%) |
| Total | 504 (100.0%) | 1,613 (100.0%) |
Household Income by Mortgage Status in Roanoke
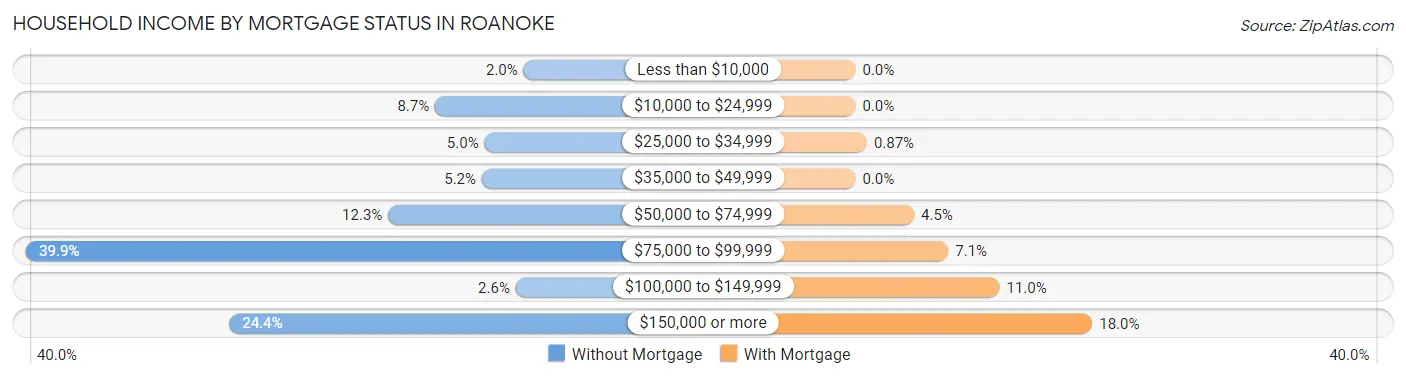
| Household Income | Without Mortgage | With Mortgage |
| Less than $10,000 | 10 (2.0%) | 0 (0.0%) |
| $10,000 to $24,999 | 44 (8.7%) | 0 (0.0%) |
| $25,000 to $34,999 | 25 (5.0%) | 14 (0.9%) |
| $35,000 to $49,999 | 26 (5.2%) | 0 (0.0%) |
| $50,000 to $74,999 | 62 (12.3%) | 72 (4.5%) |
| $75,000 to $99,999 | 201 (39.9%) | 114 (7.1%) |
| $100,000 to $149,999 | 13 (2.6%) | 177 (11.0%) |
| $150,000 or more | 123 (24.4%) | 291 (18.0%) |
| Total | 504 (100.0%) | 1,613 (100.0%) |
Property Value to Household Income Ratio in Roanoke
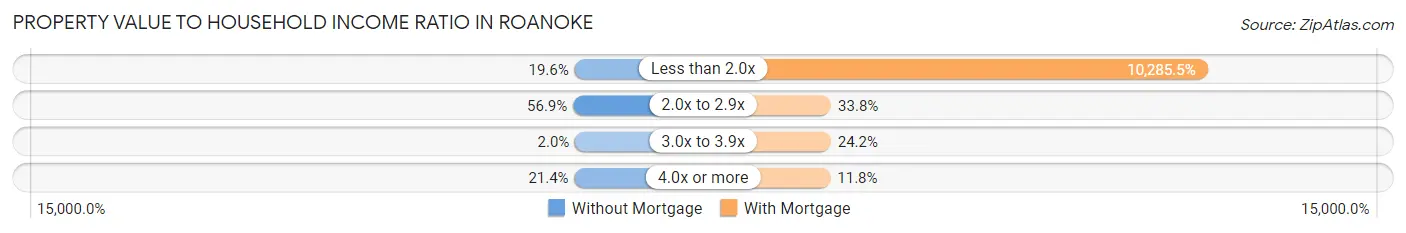
| Value-to-Income Ratio | Without Mortgage | With Mortgage |
| Less than 2.0x | 99 (19.6%) | 165,905 (10,285.5%) |
| 2.0x to 2.9x | 287 (56.9%) | 545 (33.8%) |
| 3.0x to 3.9x | 10 (2.0%) | 390 (24.2%) |
| 4.0x or more | 108 (21.4%) | 191 (11.8%) |
| Total | 504 (100.0%) | 1,613 (100.0%) |
Real Estate Taxes by Mortgage Status in Roanoke
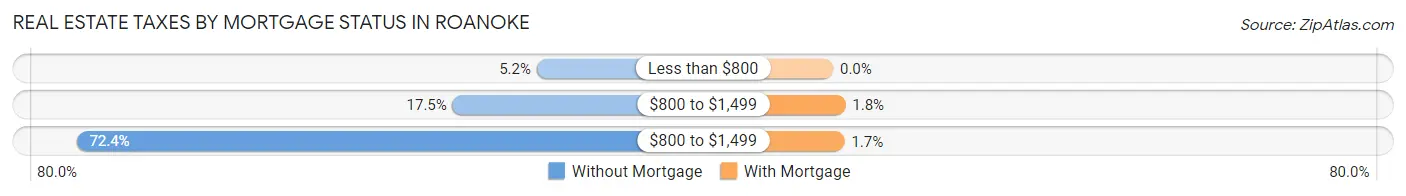
| Property Taxes | Without Mortgage | With Mortgage |
| Less than $800 | 26 (5.2%) | 0 (0.0%) |
| $800 to $1,499 | 88 (17.5%) | 29 (1.8%) |
| $800 to $1,499 | 365 (72.4%) | 27 (1.7%) |
| Total | 504 (100.0%) | 1,613 (100.0%) |
Health & Disability in Roanoke
Health Insurance Coverage by Age in Roanoke
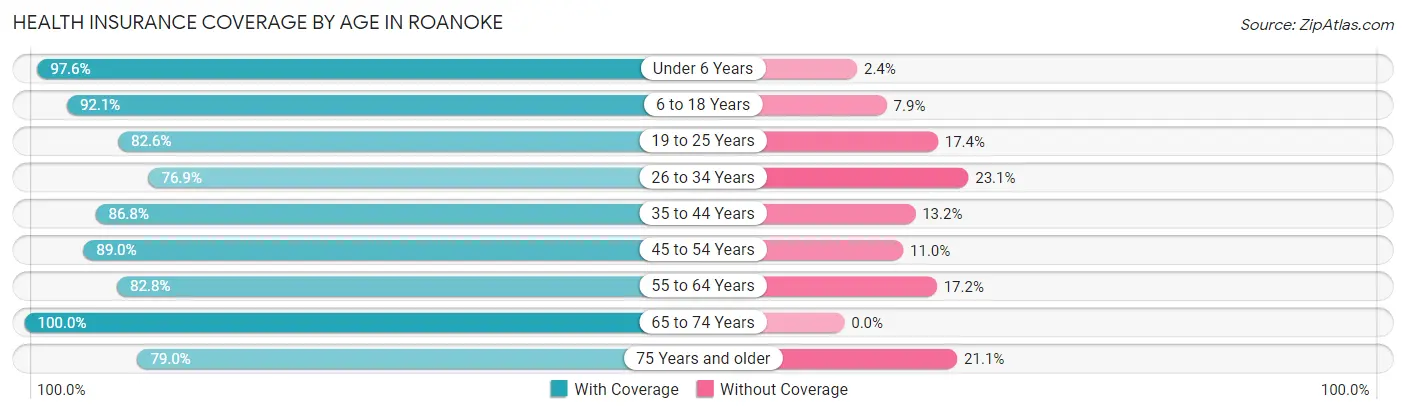
| Age Bracket | With Coverage | Without Coverage |
| Under 6 Years | 945 (97.6%) | 23 (2.4%) |
| 6 to 18 Years | 1,760 (92.1%) | 151 (7.9%) |
| 19 to 25 Years | 507 (82.6%) | 107 (17.4%) |
| 26 to 34 Years | 898 (76.9%) | 270 (23.1%) |
| 35 to 44 Years | 1,450 (86.8%) | 221 (13.2%) |
| 45 to 54 Years | 1,559 (89.0%) | 192 (11.0%) |
| 55 to 64 Years | 701 (82.8%) | 146 (17.2%) |
| 65 to 74 Years | 388 (100.0%) | 0 (0.0%) |
| 75 Years and older | 195 (78.9%) | 52 (21.0%) |
| Total | 8,403 (87.8%) | 1,162 (12.1%) |
Health Insurance Coverage by Citizenship Status in Roanoke
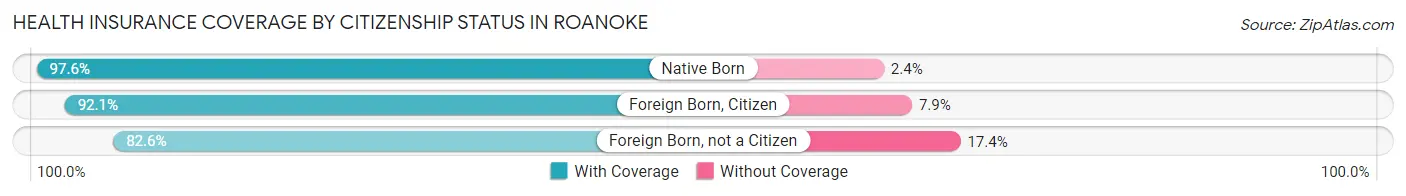
| Citizenship Status | With Coverage | Without Coverage |
| Native Born | 945 (97.6%) | 23 (2.4%) |
| Foreign Born, Citizen | 1,760 (92.1%) | 151 (7.9%) |
| Foreign Born, not a Citizen | 507 (82.6%) | 107 (17.4%) |
Health Insurance Coverage by Household Income in Roanoke
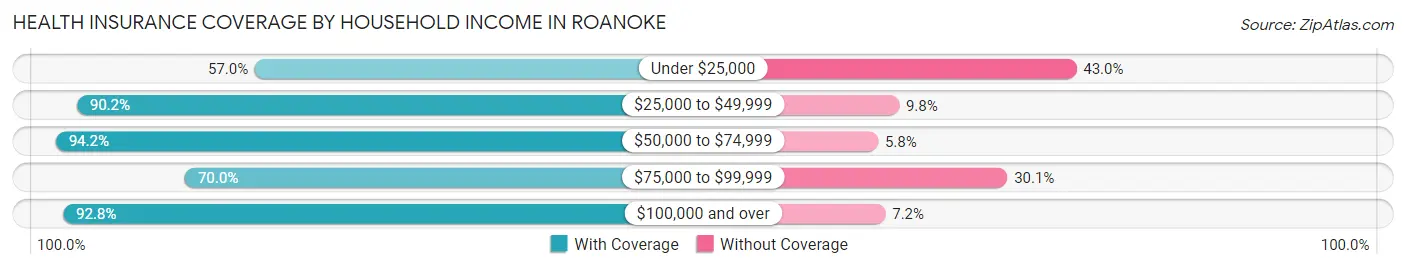
| Household Income | With Coverage | Without Coverage |
| Under $25,000 | 187 (57.0%) | 141 (43.0%) |
| $25,000 to $49,999 | 544 (90.2%) | 59 (9.8%) |
| $50,000 to $74,999 | 1,064 (94.2%) | 66 (5.8%) |
| $75,000 to $99,999 | 1,087 (70.0%) | 467 (30.0%) |
| $100,000 and over | 5,521 (92.8%) | 429 (7.2%) |
Public vs Private Health Insurance Coverage by Age in Roanoke
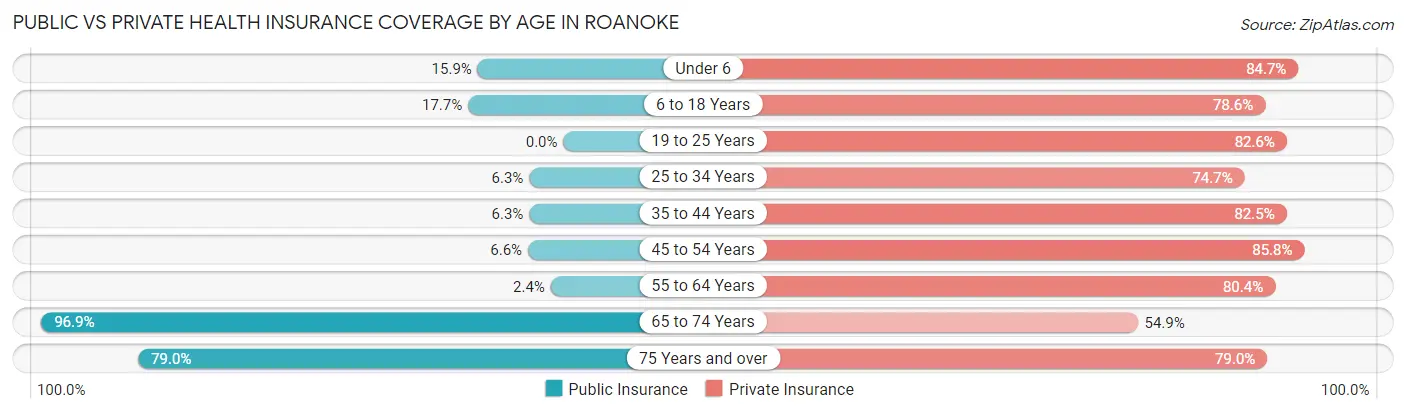
| Age Bracket | Public Insurance | Private Insurance |
| Under 6 | 154 (15.9%) | 820 (84.7%) |
| 6 to 18 Years | 338 (17.7%) | 1,501 (78.5%) |
| 19 to 25 Years | 0 (0.0%) | 507 (82.6%) |
| 25 to 34 Years | 74 (6.3%) | 873 (74.7%) |
| 35 to 44 Years | 106 (6.3%) | 1,379 (82.5%) |
| 45 to 54 Years | 115 (6.6%) | 1,503 (85.8%) |
| 55 to 64 Years | 20 (2.4%) | 681 (80.4%) |
| 65 to 74 Years | 376 (96.9%) | 213 (54.9%) |
| 75 Years and over | 195 (78.9%) | 195 (78.9%) |
| Total | 1,378 (14.4%) | 7,672 (80.2%) |
Disability Status by Sex by Age in Roanoke
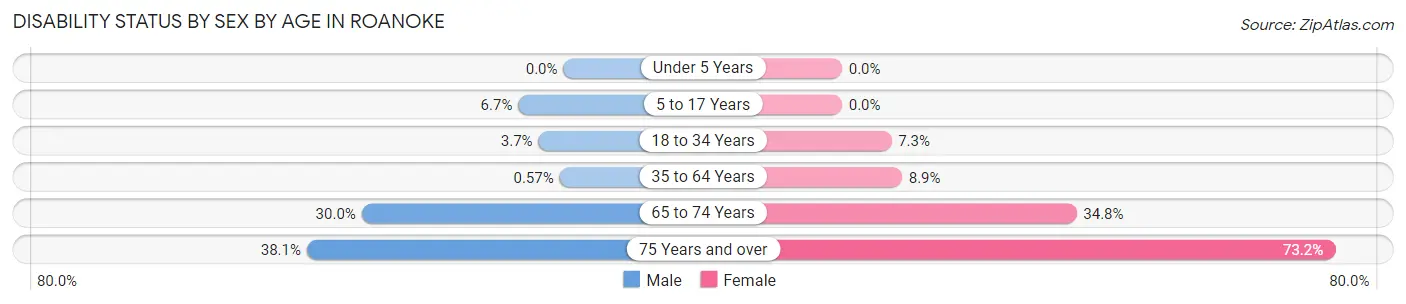
| Age Bracket | Male | Female |
| Under 5 Years | 0 (0.0%) | 0 (0.0%) |
| 5 to 17 Years | 67 (6.7%) | 0 (0.0%) |
| 18 to 34 Years | 37 (3.7%) | 69 (7.3%) |
| 35 to 64 Years | 13 (0.6%) | 179 (8.9%) |
| 65 to 74 Years | 56 (29.9%) | 70 (34.8%) |
| 75 Years and over | 40 (38.1%) | 104 (73.2%) |
Disability Class by Sex by Age in Roanoke
Disability Class: Hearing Difficulty
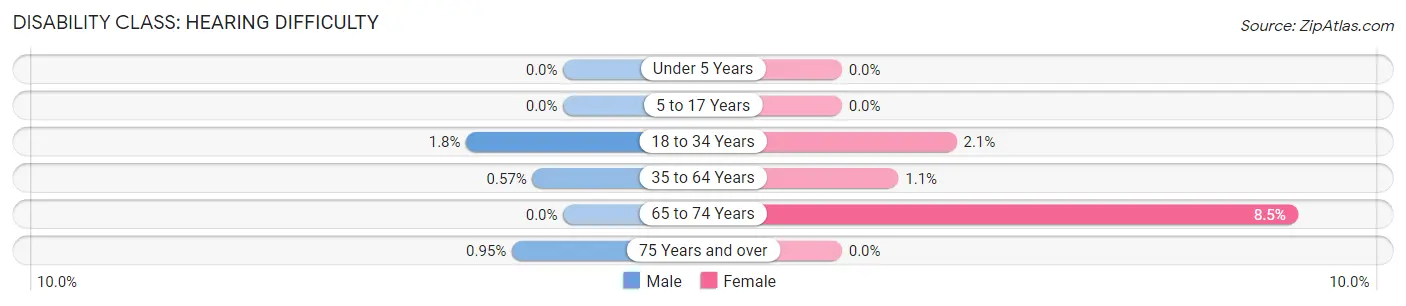
| Age Bracket | Male | Female |
| Under 5 Years | 0 (0.0%) | 0 (0.0%) |
| 5 to 17 Years | 0 (0.0%) | 0 (0.0%) |
| 18 to 34 Years | 18 (1.8%) | 20 (2.1%) |
| 35 to 64 Years | 13 (0.6%) | 21 (1.1%) |
| 65 to 74 Years | 0 (0.0%) | 17 (8.5%) |
| 75 Years and over | 1 (0.9%) | 0 (0.0%) |
Disability Class: Vision Difficulty
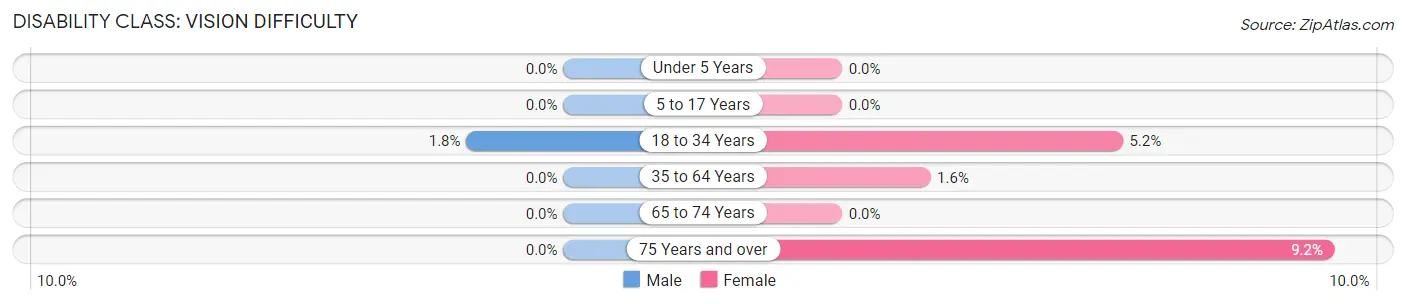
| Age Bracket | Male | Female |
| Under 5 Years | 0 (0.0%) | 0 (0.0%) |
| 5 to 17 Years | 0 (0.0%) | 0 (0.0%) |
| 18 to 34 Years | 18 (1.8%) | 49 (5.2%) |
| 35 to 64 Years | 0 (0.0%) | 33 (1.6%) |
| 65 to 74 Years | 0 (0.0%) | 0 (0.0%) |
| 75 Years and over | 0 (0.0%) | 13 (9.1%) |
Disability Class: Cognitive Difficulty
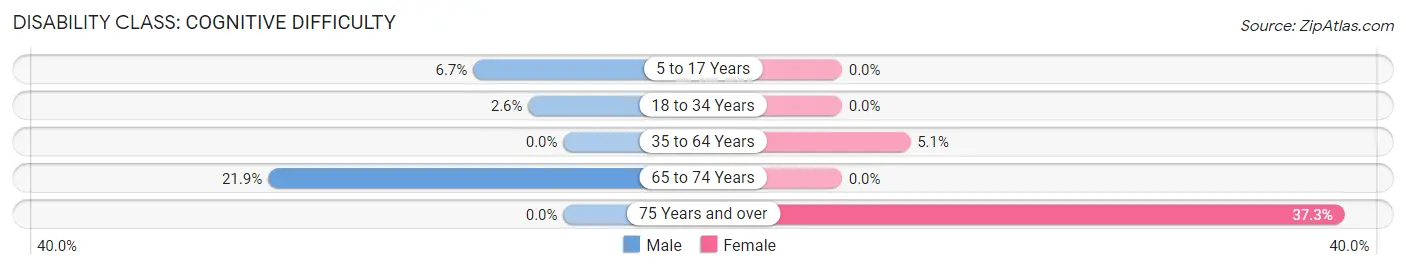
| Age Bracket | Male | Female |
| 5 to 17 Years | 67 (6.7%) | 0 (0.0%) |
| 18 to 34 Years | 26 (2.6%) | 0 (0.0%) |
| 35 to 64 Years | 0 (0.0%) | 102 (5.1%) |
| 65 to 74 Years | 41 (21.9%) | 0 (0.0%) |
| 75 Years and over | 0 (0.0%) | 53 (37.3%) |
Disability Class: Ambulatory Difficulty
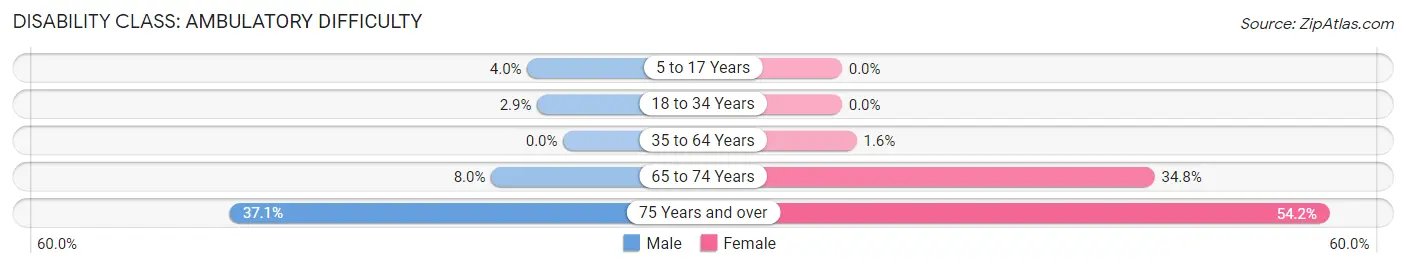
| Age Bracket | Male | Female |
| 5 to 17 Years | 40 (4.0%) | 0 (0.0%) |
| 18 to 34 Years | 29 (2.9%) | 0 (0.0%) |
| 35 to 64 Years | 0 (0.0%) | 33 (1.6%) |
| 65 to 74 Years | 15 (8.0%) | 70 (34.8%) |
| 75 Years and over | 39 (37.1%) | 77 (54.2%) |
Disability Class: Self-Care Difficulty
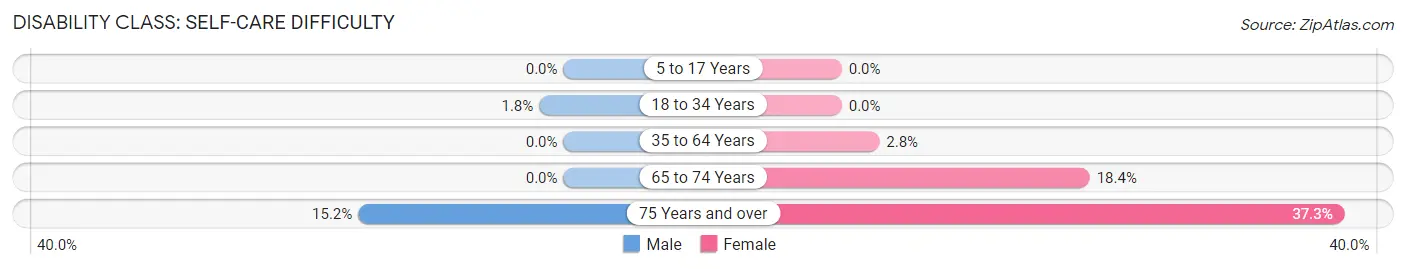
| Age Bracket | Male | Female |
| 5 to 17 Years | 0 (0.0%) | 0 (0.0%) |
| 18 to 34 Years | 18 (1.8%) | 0 (0.0%) |
| 35 to 64 Years | 0 (0.0%) | 56 (2.8%) |
| 65 to 74 Years | 0 (0.0%) | 37 (18.4%) |
| 75 Years and over | 16 (15.2%) | 53 (37.3%) |
Technology Access in Roanoke
Computing Device Access in Roanoke
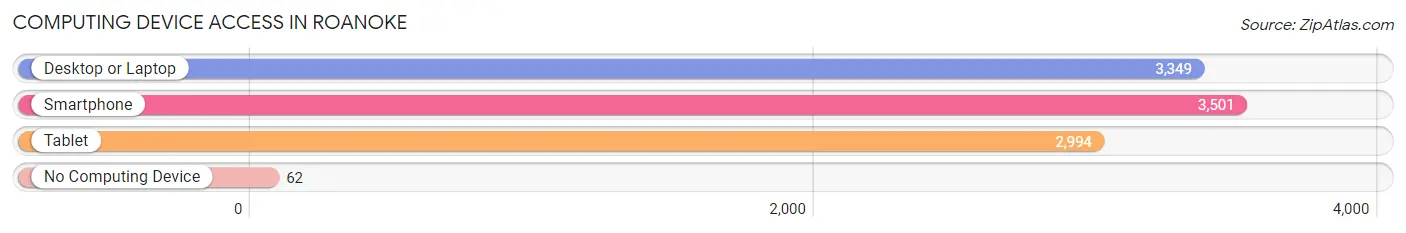
| Device Type | # Households | % Households |
| Desktop or Laptop | 3,349 | 92.5% |
| Smartphone | 3,501 | 96.7% |
| Tablet | 2,994 | 82.7% |
| No Computing Device | 62 | 1.7% |
| Total | 3,620 | 100.0% |
Internet Access in Roanoke
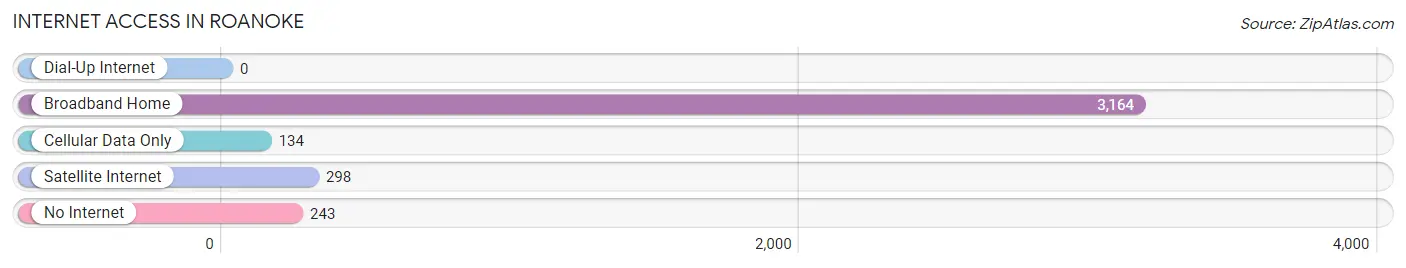
| Internet Type | # Households | % Households |
| Dial-Up Internet | 0 | 0.0% |
| Broadband Home | 3,164 | 87.4% |
| Cellular Data Only | 134 | 3.7% |
| Satellite Internet | 298 | 8.2% |
| No Internet | 243 | 6.7% |
| Total | 3,620 | 100.0% |
Roanoke Summary
Roanoke, Texas is a city located in Denton County, Texas, United States. It is part of the Dallas-Fort Worth-Arlington metropolitan area. The population was 7,788 at the 2010 census. Roanoke is known as the “Unique Dining Capital of Texas” due to its many restaurants.
History
The area that is now Roanoke was first settled in the 1840s by German and Swiss immigrants. The town was originally called “Dry Creek”, but was later renamed “Roanoke” after the Roanoke River in Virginia. The town was officially incorporated in 1883.
In the early 1900s, Roanoke was a thriving agricultural community. The town was home to several cotton gins, a flour mill, and a brick factory. The town also had a railroad station, which connected it to the rest of the state.
In the 1950s, Roanoke began to experience a population boom. This was due to the growth of the Dallas-Fort Worth area, which caused many people to move to the suburbs. Roanoke was one of the many towns that benefited from this growth.
Geography
Roanoke is located in Denton County, Texas, United States. It is part of the Dallas-Fort Worth-Arlington metropolitan area. The city is situated on the banks of the Trinity River.
The city has a total area of 8.2 square miles, all of which is land. The elevation of the city is 645 feet above sea level.
Economy
The economy of Roanoke is largely based on the service industry. The city is home to several restaurants, retail stores, and other businesses. The city is also home to several corporate headquarters, including the headquarters of the Dr Pepper Snapple Group.
The city is also home to several manufacturing companies, including a steel mill and a plastics factory.
Demographics
As of the 2010 census, the population of Roanoke was 7,788. The racial makeup of the city was 79.3% White, 8.2% African American, 0.4% Native American, 1.2% Asian, 0.1% Pacific Islander, 8.2% from other races, and 2.8% from two or more races. Hispanic or Latino of any race were 18.3% of the population.
The median income for a household in the city was $50,945, and the median income for a family was $60,945. The per capita income for the city was $25,945. About 6.2% of families and 8.2% of the population were below the poverty line, including 10.2% of those under age 18 and 6.2% of those age 65 or over.
Roanoke is a diverse city with a strong economy and a vibrant culture. The city is home to many restaurants, businesses, and corporate headquarters. The city is also home to several manufacturing companies, which provide jobs for many of the city’s residents. The city is a great place to live, work, and play.
Common Questions
What is Per Capita Income in Roanoke?
Per Capita income in Roanoke is $52,378.
What is the Median Family Income in Roanoke?
Median Family Income in Roanoke is $133,373.
What is the Median Household income in Roanoke?
Median Household Income in Roanoke is $113,171.
What is Income or Wage Gap in Roanoke?
Income or Wage Gap in Roanoke is 27.3%.
Women in Roanoke earn 72.7 cents for every dollar earned by a man.
What is Inequality or Gini Index in Roanoke?
Inequality or Gini Index in Roanoke is 0.40.
What is the Total Population of Roanoke?
Total Population of Roanoke is 9,565.
What is the Total Male Population of Roanoke?
Total Male Population of Roanoke is 4,933.
What is the Total Female Population of Roanoke?
Total Female Population of Roanoke is 4,632.
What is the Ratio of Males per 100 Females in Roanoke?
There are 106.50 Males per 100 Females in Roanoke.
What is the Ratio of Females per 100 Males in Roanoke?
There are 93.90 Females per 100 Males in Roanoke.
What is the Median Population Age in Roanoke?
Median Population Age in Roanoke is 36.5 Years.
What is the Average Family Size in Roanoke
Average Family Size in Roanoke is 3.3 People.
What is the Average Household Size in Roanoke
Average Household Size in Roanoke is 2.6 People.
How Large is the Labor Force in Roanoke?
There are 5,331 People in the Labor Forcein in Roanoke.
What is the Percentage of People in the Labor Force in Roanoke?
74.9% of People are in the Labor Force in Roanoke.
What is the Unemployment Rate in Roanoke?
Unemployment Rate in Roanoke is 4.1%.