Battle Mountain, NV Map & Demographics
Battle Mountain Map
Battle Mountain Overview
$42,486
PER CAPITA INCOME
$102,178
AVG FAMILY INCOME
$99,962
AVG HOUSEHOLD INCOME
49.9%
WAGE / INCOME GAP [ % ]
50.1¢/ $1
WAGE / INCOME GAP [ $ ]
0.41
INEQUALITY / GINI INDEX
4,187
TOTAL POPULATION
2,340
MALE POPULATION
1,847
FEMALE POPULATION
126.69
MALES / 100 FEMALES
78.93
FEMALES / 100 MALES
41.1
MEDIAN AGE
3.0
AVG FAMILY SIZE
2.4
AVG HOUSEHOLD SIZE
1,953
LABOR FORCE [ PEOPLE ]
60.7%
PERCENT IN LABOR FORCE
15.2%
UNEMPLOYMENT RATE
Battle Mountain Zip Codes
Battle Mountain Area Codes
Income in Battle Mountain
Income Overview in Battle Mountain
Per Capita Income in Battle Mountain is $42,486, while median incomes of families and households are $102,178 and $99,962 respectively.
| Characteristic | Number | Measure |
| Per Capita Income | 4,187 | $42,486 |
| Median Family Income | 1,200 | $102,178 |
| Mean Family Income | 1,200 | $113,821 |
| Median Household Income | 1,697 | $99,962 |
| Mean Household Income | 1,697 | $102,852 |
| Income Deficit | 1,200 | $0 |
| Wage / Income Gap (%) | 4,187 | 49.88% |
| Wage / Income Gap ($) | 4,187 | 50.12¢ per $1 |
| Gini / Inequality Index | 4,187 | 0.41 |
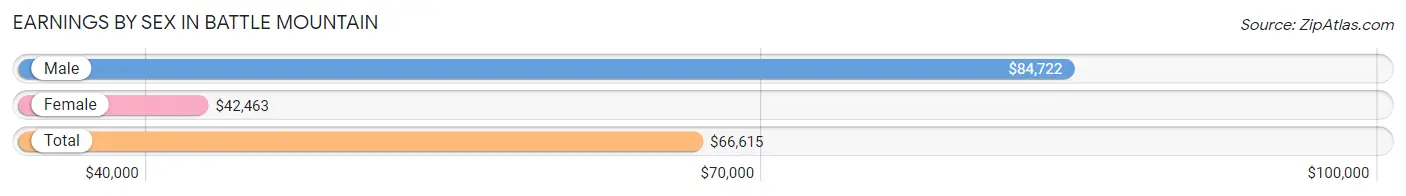
Earnings by Sex in Battle Mountain
Average Earnings in Battle Mountain are $66,615, $84,722 for men and $42,463 for women, a difference of 49.9%.
| Sex | Number | Average Earnings |
| Male | 1,338 (69.8%) | $84,722 |
| Female | 579 (30.2%) | $42,463 |
| Total | 1,917 (100.0%) | $66,615 |
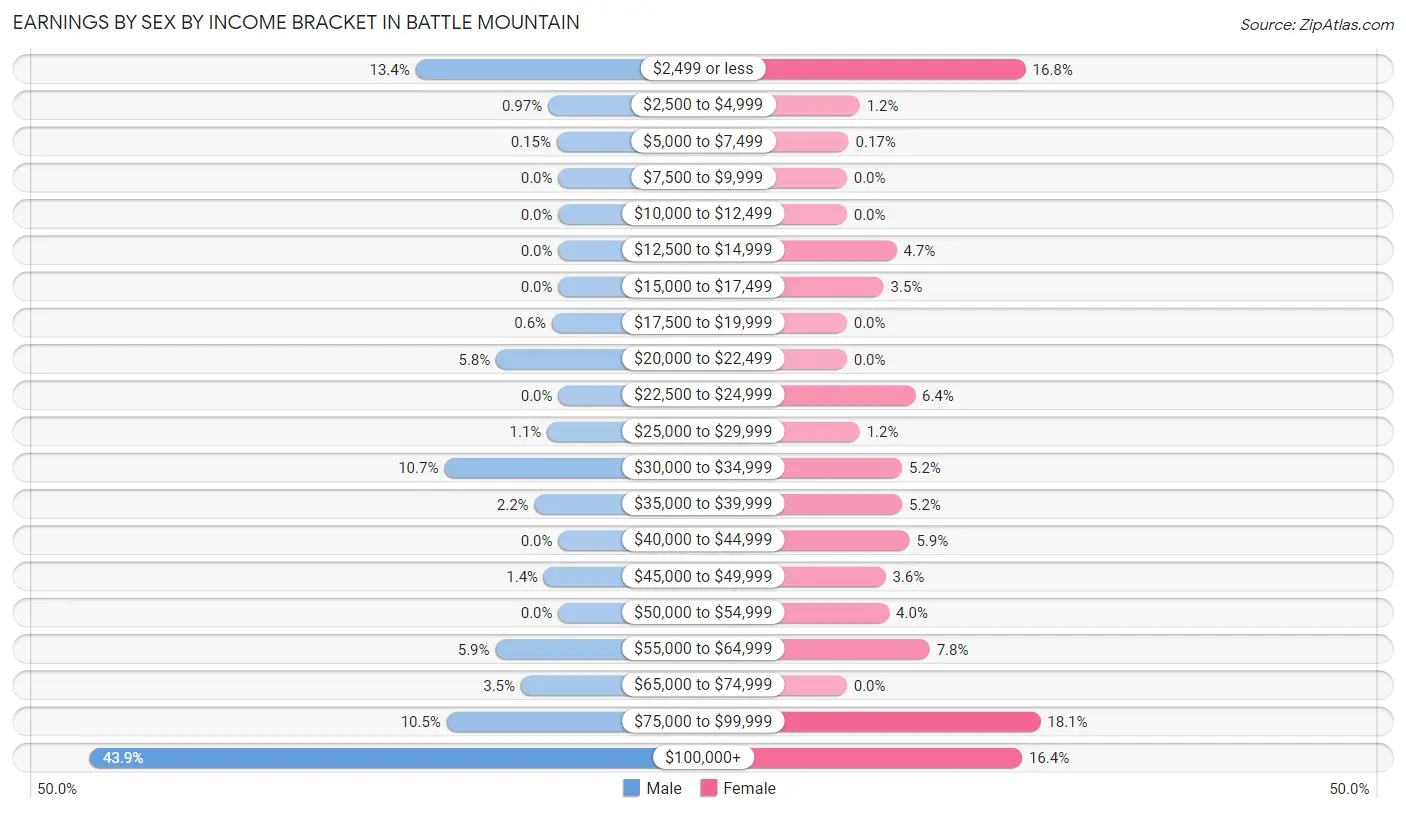
Earnings by Sex by Income Bracket in Battle Mountain
The most common earnings brackets in Battle Mountain are $100,000+ for men (587 | 43.9%) and $75,000 to $99,999 for women (105 | 18.1%).
| Income | Male | Female |
| $2,499 or less | 179 (13.4%) | 97 (16.8%) |
| $2,500 to $4,999 | 13 (1.0%) | 7 (1.2%) |
| $5,000 to $7,499 | 2 (0.2%) | 1 (0.2%) |
| $7,500 to $9,999 | 0 (0.0%) | 0 (0.0%) |
| $10,000 to $12,499 | 0 (0.0%) | 0 (0.0%) |
| $12,500 to $14,999 | 0 (0.0%) | 27 (4.7%) |
| $15,000 to $17,499 | 0 (0.0%) | 20 (3.5%) |
| $17,500 to $19,999 | 8 (0.6%) | 0 (0.0%) |
| $20,000 to $22,499 | 78 (5.8%) | 0 (0.0%) |
| $22,500 to $24,999 | 0 (0.0%) | 37 (6.4%) |
| $25,000 to $29,999 | 14 (1.1%) | 7 (1.2%) |
| $30,000 to $34,999 | 143 (10.7%) | 30 (5.2%) |
| $35,000 to $39,999 | 30 (2.2%) | 30 (5.2%) |
| $40,000 to $44,999 | 0 (0.0%) | 34 (5.9%) |
| $45,000 to $49,999 | 18 (1.3%) | 21 (3.6%) |
| $50,000 to $54,999 | 0 (0.0%) | 23 (4.0%) |
| $55,000 to $64,999 | 79 (5.9%) | 45 (7.8%) |
| $65,000 to $74,999 | 47 (3.5%) | 0 (0.0%) |
| $75,000 to $99,999 | 140 (10.5%) | 105 (18.1%) |
| $100,000+ | 587 (43.9%) | 95 (16.4%) |
| Total | 1,338 (100.0%) | 579 (100.0%) |
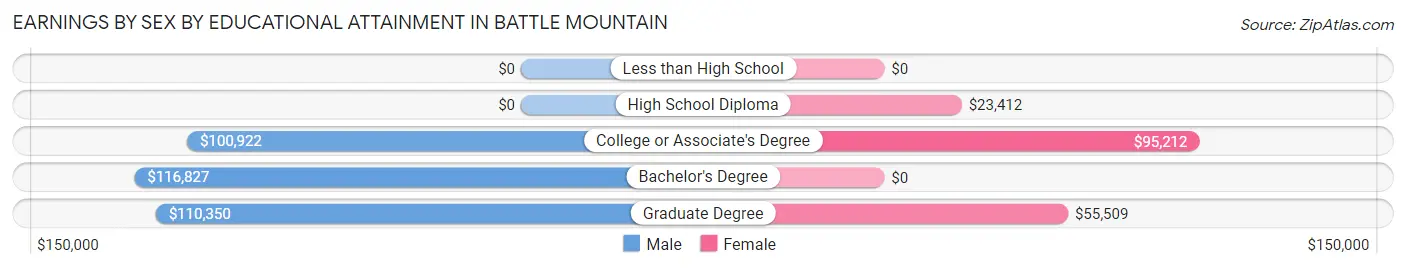
Earnings by Sex by Educational Attainment in Battle Mountain
Average earnings in Battle Mountain are $86,912 for men and $53,261 for women, a difference of 38.7%. Men with an educational attainment of bachelor's degree enjoy the highest average annual earnings of $116,827, while those with college or associate's degree education earn the least with $100,922. Women with an educational attainment of college or associate's degree earn the most with the average annual earnings of $95,212, while those with high school diploma education have the smallest earnings of $23,412.
| Educational Attainment | Male Income | Female Income |
| Less than High School | - | - |
| High School Diploma | - | - |
| College or Associate's Degree | $100,922 | $95,212 |
| Bachelor's Degree | $116,827 | $0 |
| Graduate Degree | $110,350 | $55,509 |
| Total | $86,912 | $53,261 |
Family Income in Battle Mountain
Family Income Brackets in Battle Mountain
According to the Battle Mountain family income data, there are 456 families falling into the $100,000 to $149,999 income range, which is the most common income bracket and makes up 38.0% of all families.
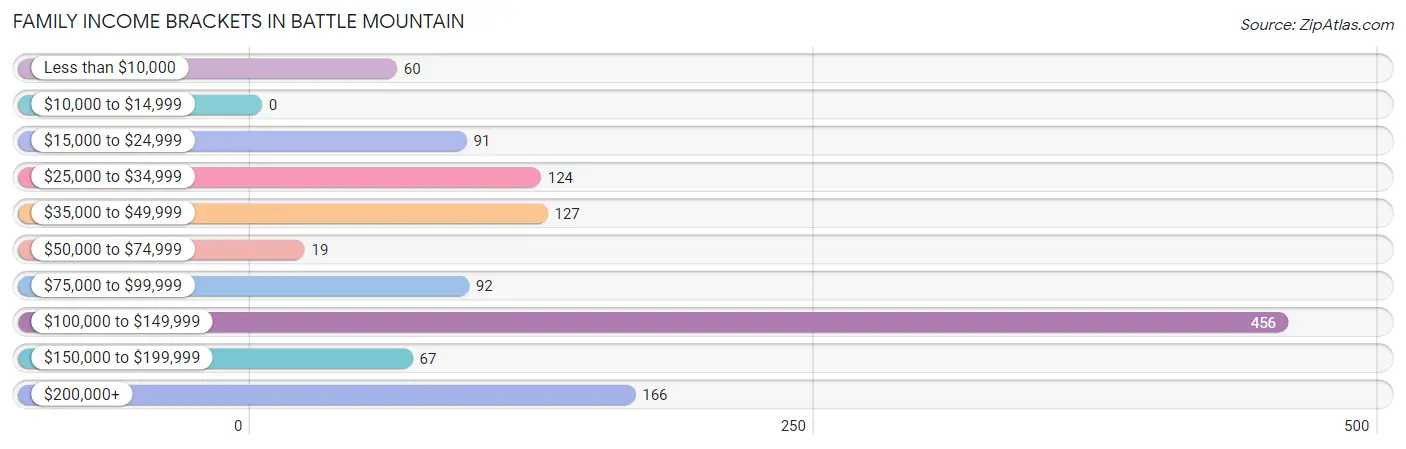
| Income Bracket | # Families | % Families |
| Less than $10,000 | 60 | 5.0% |
| $10,000 to $14,999 | 0 | 0.0% |
| $15,000 to $24,999 | 91 | 7.6% |
| $25,000 to $34,999 | 124 | 10.3% |
| $35,000 to $49,999 | 127 | 10.6% |
| $50,000 to $74,999 | 19 | 1.6% |
| $75,000 to $99,999 | 92 | 7.7% |
| $100,000 to $149,999 | 456 | 38.0% |
| $150,000 to $199,999 | 67 | 5.6% |
| $200,000+ | 166 | 13.8% |
Family Income by Famaliy Size in Battle Mountain
3-person families (425 | 35.4%) account for the highest median family income in Battle Mountain with $137,607 per family, while 3-person families (425 | 35.4%) have the highest median income of $45,869 per family member.
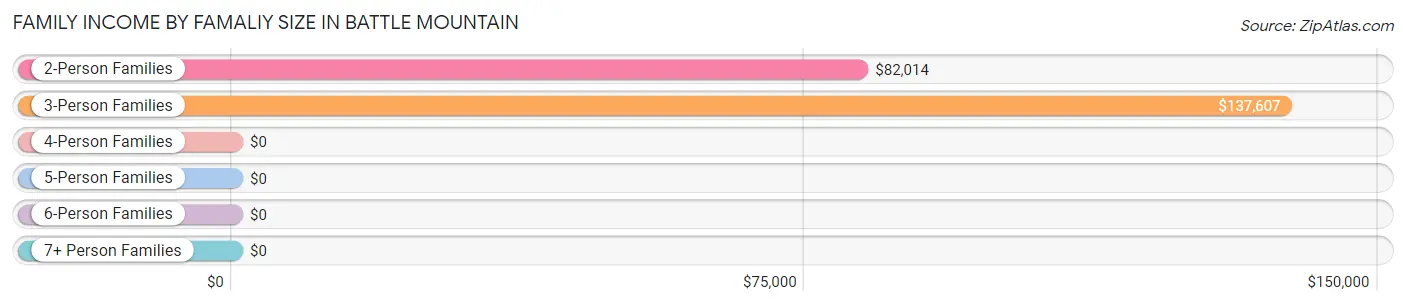
| Income Bracket | # Families | Median Income |
| 2-Person Families | 489 (40.7%) | $82,014 |
| 3-Person Families | 425 (35.4%) | $137,607 |
| 4-Person Families | 227 (18.9%) | $0 |
| 5-Person Families | 42 (3.5%) | $0 |
| 6-Person Families | 0 (0.0%) | $0 |
| 7+ Person Families | 17 (1.4%) | $0 |
| Total | 1,200 (100.0%) | $102,178 |
Family Income by Number of Earners in Battle Mountain
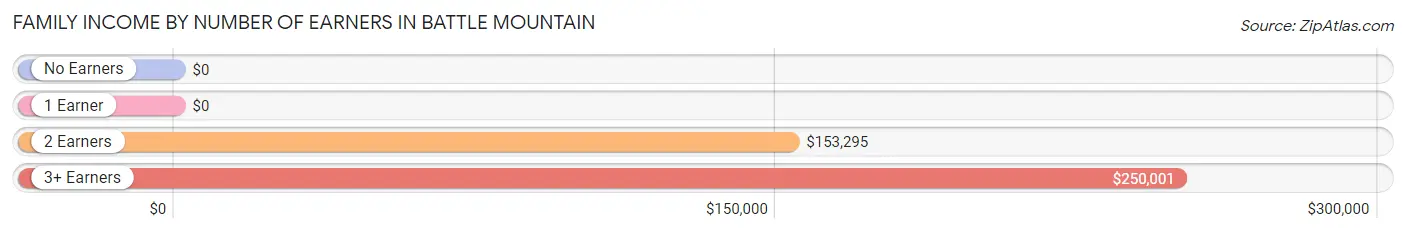
| Number of Earners | # Families | Median Income |
| No Earners | 145 (12.1%) | $0 |
| 1 Earner | 679 (56.6%) | $0 |
| 2 Earners | 283 (23.6%) | $153,295 |
| 3+ Earners | 93 (7.7%) | $250,001 |
| Total | 1,200 (100.0%) | $102,178 |
Household Income in Battle Mountain
Household Income Brackets in Battle Mountain
With 591 households falling in the category, the $100,000 to $149,999 income range is the most frequent in Battle Mountain, accounting for 34.8% of all households. In contrast, only 20 households (1.2%) fall into the $10,000 to $14,999 income bracket, making it the least populous group.
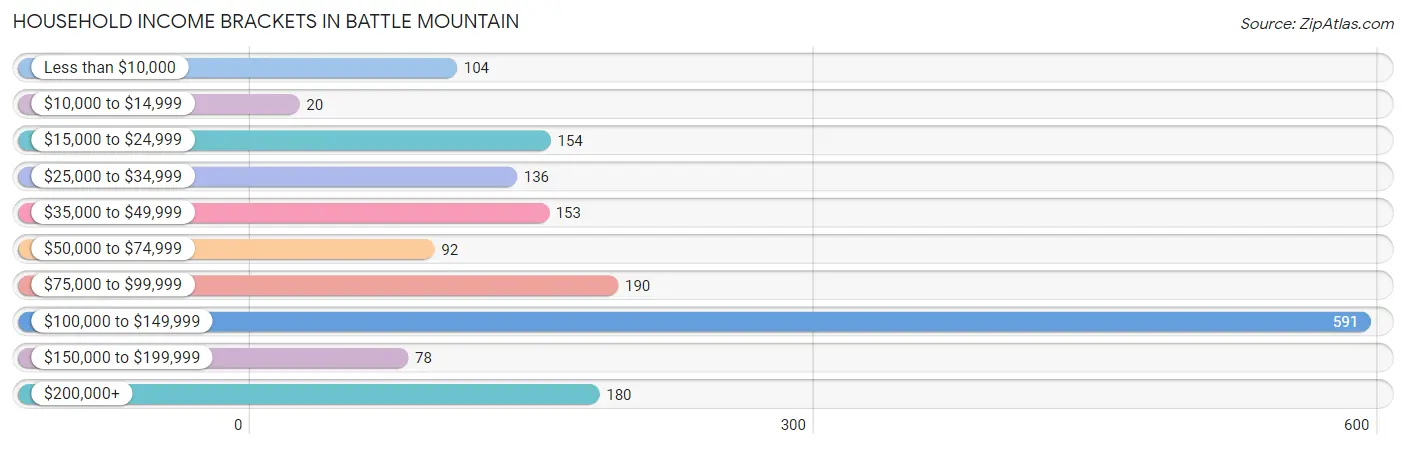
| Income Bracket | # Households | % Households |
| Less than $10,000 | 104 | 6.1% |
| $10,000 to $14,999 | 20 | 1.2% |
| $15,000 to $24,999 | 154 | 9.1% |
| $25,000 to $34,999 | 136 | 8.0% |
| $35,000 to $49,999 | 153 | 9.0% |
| $50,000 to $74,999 | 92 | 5.4% |
| $75,000 to $99,999 | 190 | 11.2% |
| $100,000 to $149,999 | 591 | 34.8% |
| $150,000 to $199,999 | 78 | 4.6% |
| $200,000+ | 180 | 10.6% |
Household Income by Householder Age in Battle Mountain
The median household income in Battle Mountain is $99,962, with the highest median household income of $104,770 found in the 45 to 64 years age bracket for the primary householder. A total of 734 households (43.2%) fall into this category.
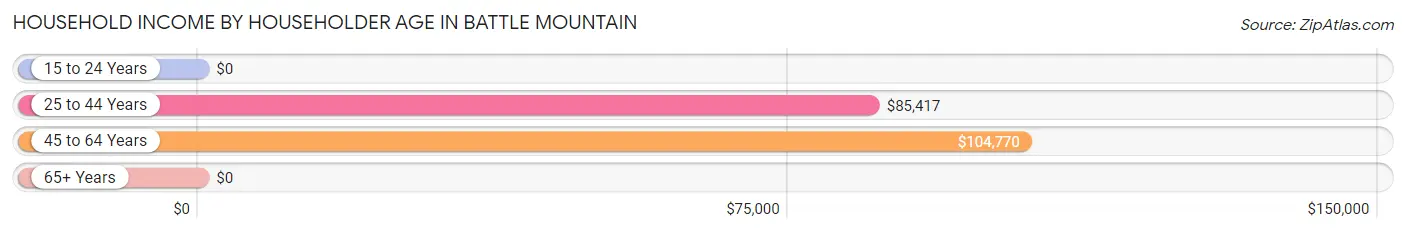
| Income Bracket | # Households | Median Income |
| 15 to 24 Years | 0 (0.0%) | $0 |
| 25 to 44 Years | 672 (39.6%) | $85,417 |
| 45 to 64 Years | 734 (43.2%) | $104,770 |
| 65+ Years | 291 (17.2%) | $0 |
| Total | 1,697 (100.0%) | $99,962 |
Poverty in Battle Mountain
Income Below Poverty by Sex and Age in Battle Mountain
With 10.0% poverty level for males and 12.7% for females among the residents of Battle Mountain, 12 to 14 year old males and 18 to 24 year old females are the most vulnerable to poverty, with 44 males (32.1%) and 5 females (100.0%) in their respective age groups living below the poverty level.
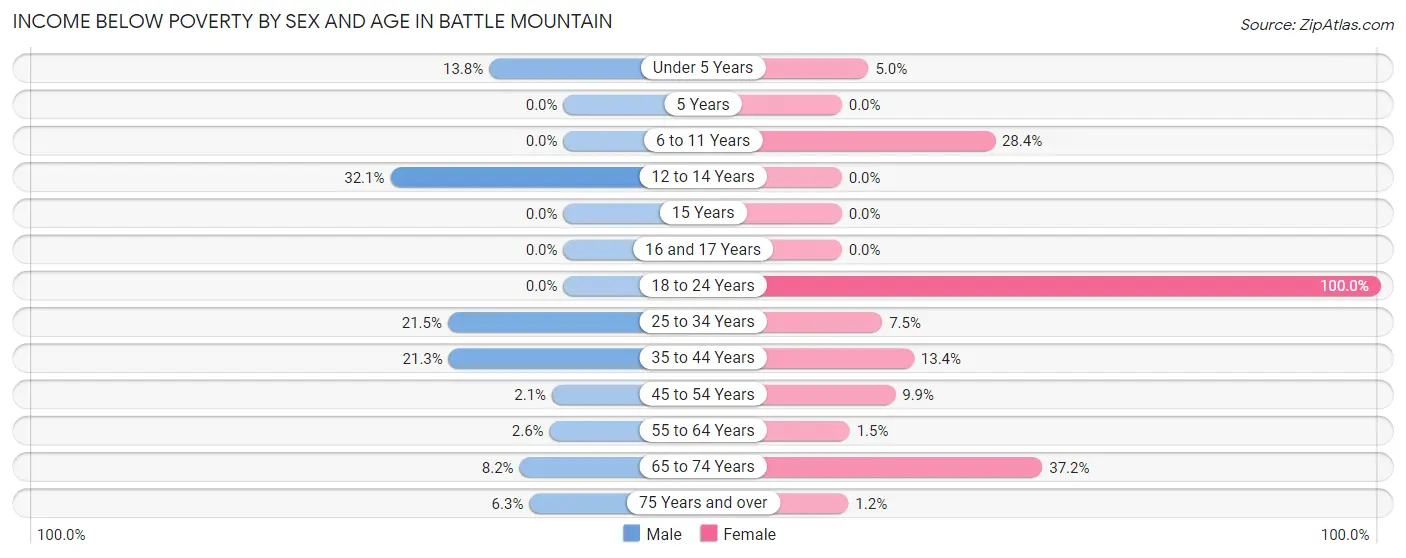
| Age Bracket | Male | Female |
| Under 5 Years | 4 (13.8%) | 5 (5.0%) |
| 5 Years | 0 (0.0%) | 0 (0.0%) |
| 6 to 11 Years | 0 (0.0%) | 85 (28.4%) |
| 12 to 14 Years | 44 (32.1%) | 0 (0.0%) |
| 15 Years | 0 (0.0%) | 0 (0.0%) |
| 16 and 17 Years | 0 (0.0%) | 0 (0.0%) |
| 18 to 24 Years | 0 (0.0%) | 5 (100.0%) |
| 25 to 34 Years | 68 (21.4%) | 16 (7.5%) |
| 35 to 44 Years | 85 (21.3%) | 19 (13.4%) |
| 45 to 54 Years | 5 (2.1%) | 29 (9.9%) |
| 55 to 64 Years | 9 (2.6%) | 5 (1.5%) |
| 65 to 74 Years | 12 (8.2%) | 67 (37.2%) |
| 75 Years and over | 5 (6.3%) | 1 (1.2%) |
| Total | 232 (10.0%) | 232 (12.7%) |
Income Above Poverty by Sex and Age in Battle Mountain
According to the poverty statistics in Battle Mountain, males aged 6 to 11 years and females aged 12 to 14 years are the age groups that are most secure financially, with 100.0% of males and 100.0% of females in these age groups living above the poverty line.
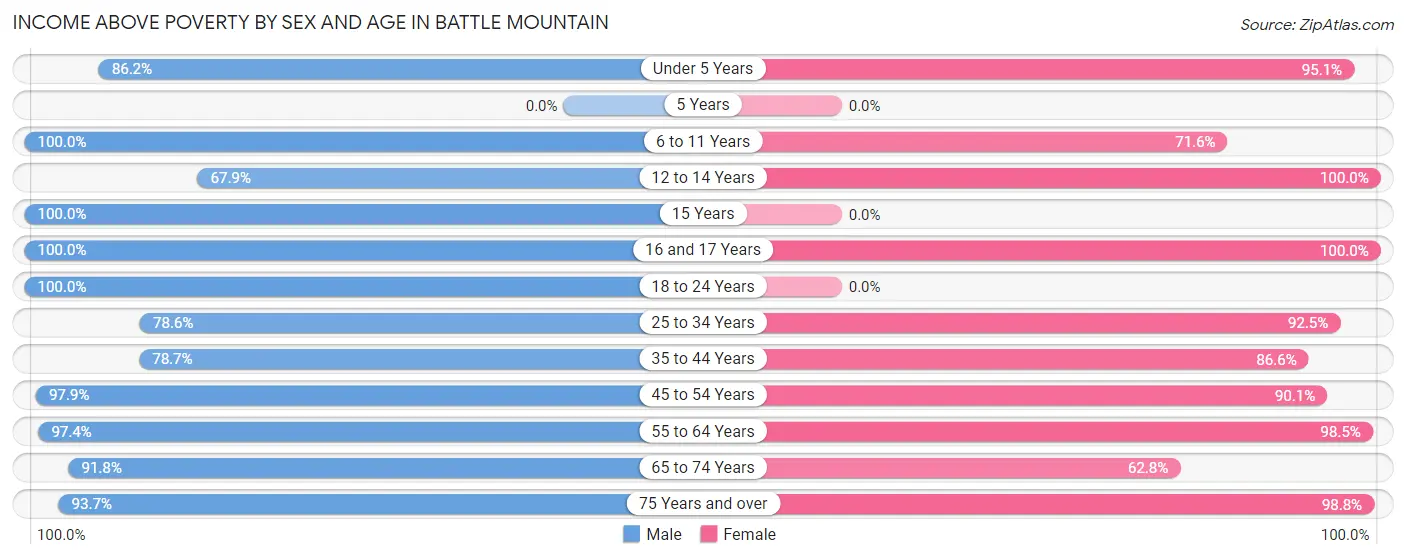
| Age Bracket | Male | Female |
| Under 5 Years | 25 (86.2%) | 96 (95.1%) |
| 5 Years | 0 (0.0%) | 0 (0.0%) |
| 6 to 11 Years | 229 (100.0%) | 214 (71.6%) |
| 12 to 14 Years | 93 (67.9%) | 55 (100.0%) |
| 15 Years | 120 (100.0%) | 0 (0.0%) |
| 16 and 17 Years | 40 (100.0%) | 121 (100.0%) |
| 18 to 24 Years | 230 (100.0%) | 0 (0.0%) |
| 25 to 34 Years | 249 (78.5%) | 197 (92.5%) |
| 35 to 44 Years | 314 (78.7%) | 123 (86.6%) |
| 45 to 54 Years | 231 (97.9%) | 263 (90.1%) |
| 55 to 64 Years | 340 (97.4%) | 335 (98.5%) |
| 65 to 74 Years | 135 (91.8%) | 113 (62.8%) |
| 75 Years and over | 74 (93.7%) | 80 (98.8%) |
| Total | 2,080 (90.0%) | 1,597 (87.3%) |
Income Below Poverty Among Married-Couple Families in Battle Mountain
| Children | Above Poverty | Below Poverty |
| No Children | 474 (100.0%) | 0 (0.0%) |
| 1 or 2 Children | 263 (100.0%) | 0 (0.0%) |
| 3 or 4 Children | 17 (100.0%) | 0 (0.0%) |
| 5 or more Children | 17 (100.0%) | 0 (0.0%) |
| Total | 771 (100.0%) | 0 (0.0%) |
Income Below Poverty Among Single-Parent Households in Battle Mountain
According to the poverty data in Battle Mountain, 19.3% or 63 single-father households and 64.7% or 66 single-mother households are living below the poverty line. Among single-father households, those with 1 or 2 children have the highest poverty rate, with 63 households (20.0%) experiencing poverty. Likewise, among single-mother households, those with 1 or 2 children have the highest poverty rate, with 66 households (75.0%) falling below the poverty line.
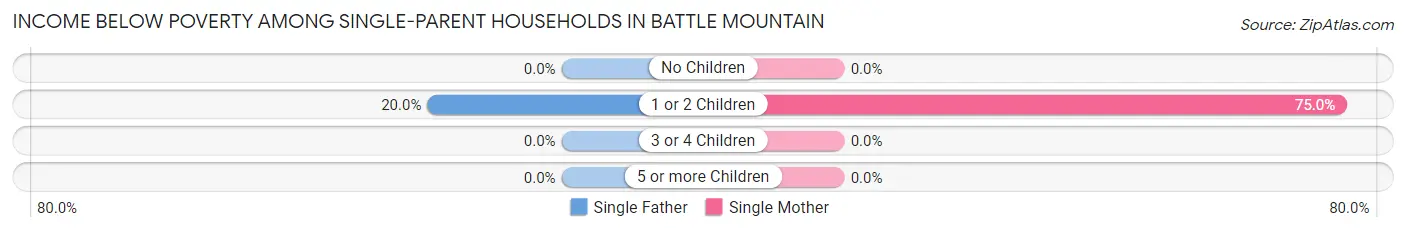
| Children | Single Father | Single Mother |
| No Children | 0 (0.0%) | 0 (0.0%) |
| 1 or 2 Children | 63 (20.0%) | 66 (75.0%) |
| 3 or 4 Children | 0 (0.0%) | 0 (0.0%) |
| 5 or more Children | 0 (0.0%) | 0 (0.0%) |
| Total | 63 (19.3%) | 66 (64.7%) |
Income Below Poverty Among Married-Couple vs Single-Parent Households in Battle Mountain
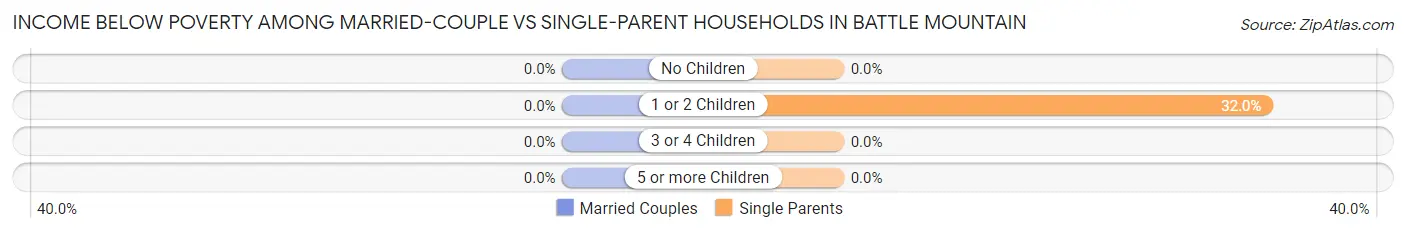
| Children | Married-Couple Families | Single-Parent Households |
| No Children | 0 (0.0%) | 0 (0.0%) |
| 1 or 2 Children | 0 (0.0%) | 129 (32.0%) |
| 3 or 4 Children | 0 (0.0%) | 0 (0.0%) |
| 5 or more Children | 0 (0.0%) | 0 (0.0%) |
| Total | 0 (0.0%) | 129 (30.1%) |
Race in Battle Mountain
The most populous races in Battle Mountain are White / Caucasian (3,465 | 82.8%), Hispanic or Latino (1,111 | 26.5%), and Two or more Races (303 | 7.2%).
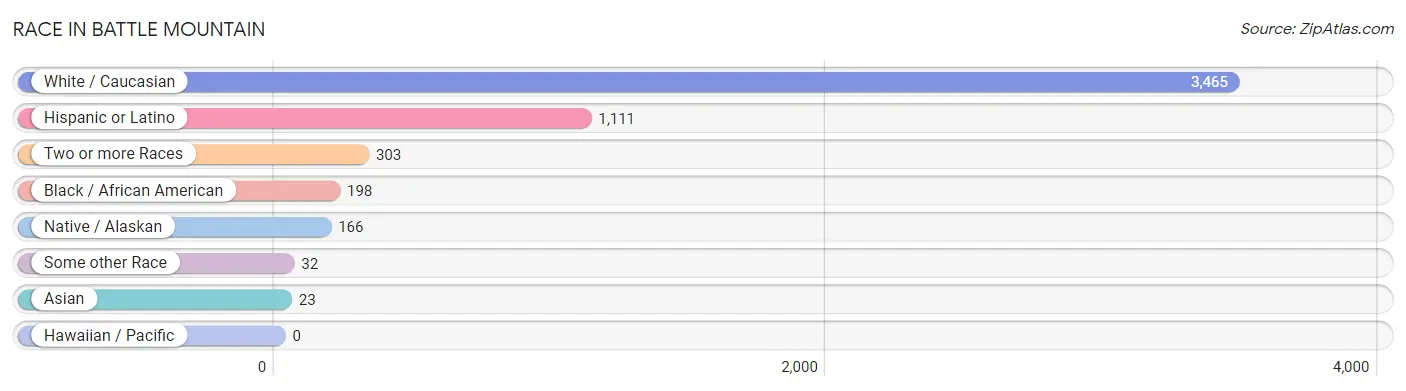
| Race | # Population | % Population |
| Asian | 23 | 0.5% |
| Black / African American | 198 | 4.7% |
| Hawaiian / Pacific | 0 | 0.0% |
| Hispanic or Latino | 1,111 | 26.5% |
| Native / Alaskan | 166 | 4.0% |
| White / Caucasian | 3,465 | 82.8% |
| Two or more Races | 303 | 7.2% |
| Some other Race | 32 | 0.8% |
| Total | 4,187 | 100.0% |
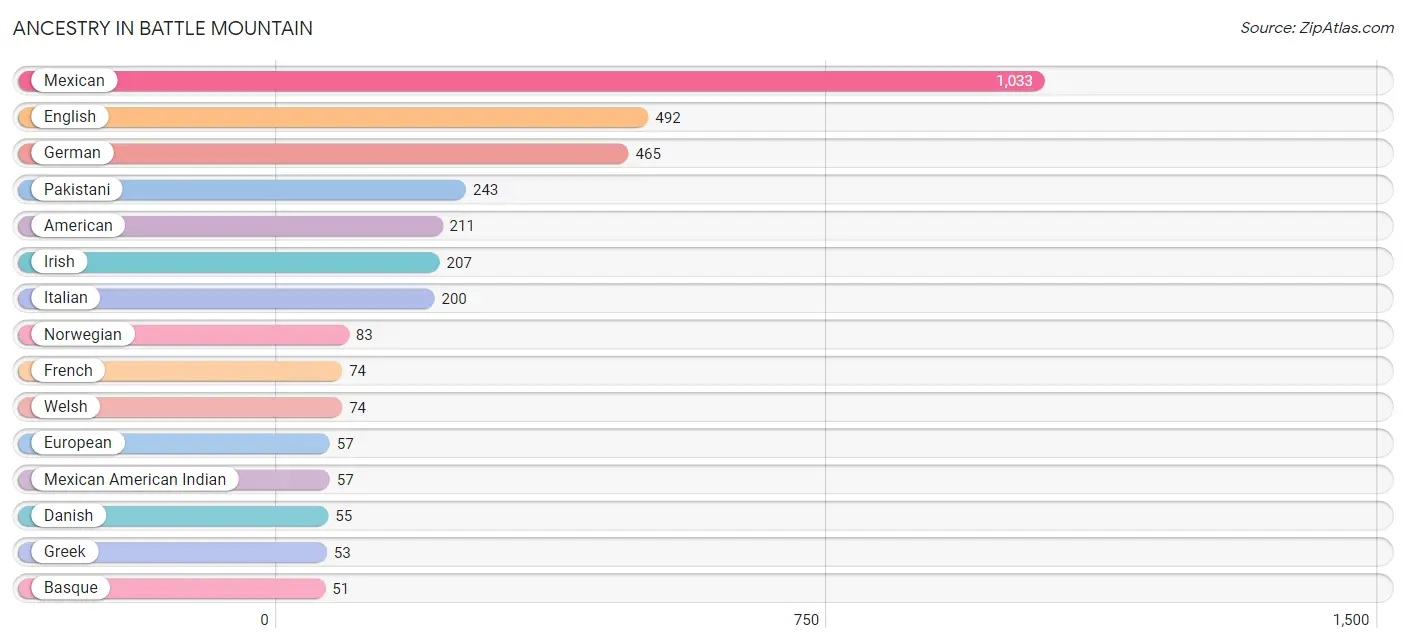
Ancestry in Battle Mountain
The most populous ancestries reported in Battle Mountain are Mexican (1,033 | 24.7%), English (492 | 11.7%), German (465 | 11.1%), Pakistani (243 | 5.8%), and American (211 | 5.0%), together accounting for 58.4% of all Battle Mountain residents.
| Ancestry | # Population | % Population |
| American | 211 | 5.0% |
| Basque | 51 | 1.2% |
| British | 21 | 0.5% |
| Canadian | 15 | 0.4% |
| Cherokee | 44 | 1.1% |
| Colombian | 27 | 0.6% |
| Danish | 55 | 1.3% |
| Dutch | 22 | 0.5% |
| English | 492 | 11.7% |
| European | 57 | 1.4% |
| Finnish | 44 | 1.1% |
| French | 74 | 1.8% |
| French Canadian | 39 | 0.9% |
| German | 465 | 11.1% |
| Greek | 53 | 1.3% |
| Hungarian | 49 | 1.2% |
| Irish | 207 | 4.9% |
| Italian | 200 | 4.8% |
| Mexican | 1,033 | 24.7% |
| Mexican American Indian | 57 | 1.4% |
| Norwegian | 83 | 2.0% |
| Paiute | 7 | 0.2% |
| Pakistani | 243 | 5.8% |
| Polish | 30 | 0.7% |
| Portuguese | 12 | 0.3% |
| Russian | 25 | 0.6% |
| Scotch-Irish | 48 | 1.1% |
| Scottish | 44 | 1.1% |
| Shoshone | 35 | 0.8% |
| South African | 10 | 0.2% |
| South American | 27 | 0.6% |
| Spaniard | 51 | 1.2% |
| Subsaharan African | 10 | 0.2% |
| Swedish | 43 | 1.0% |
| Thai | 7 | 0.2% |
| Welsh | 74 | 1.8% | View All 36 Rows |
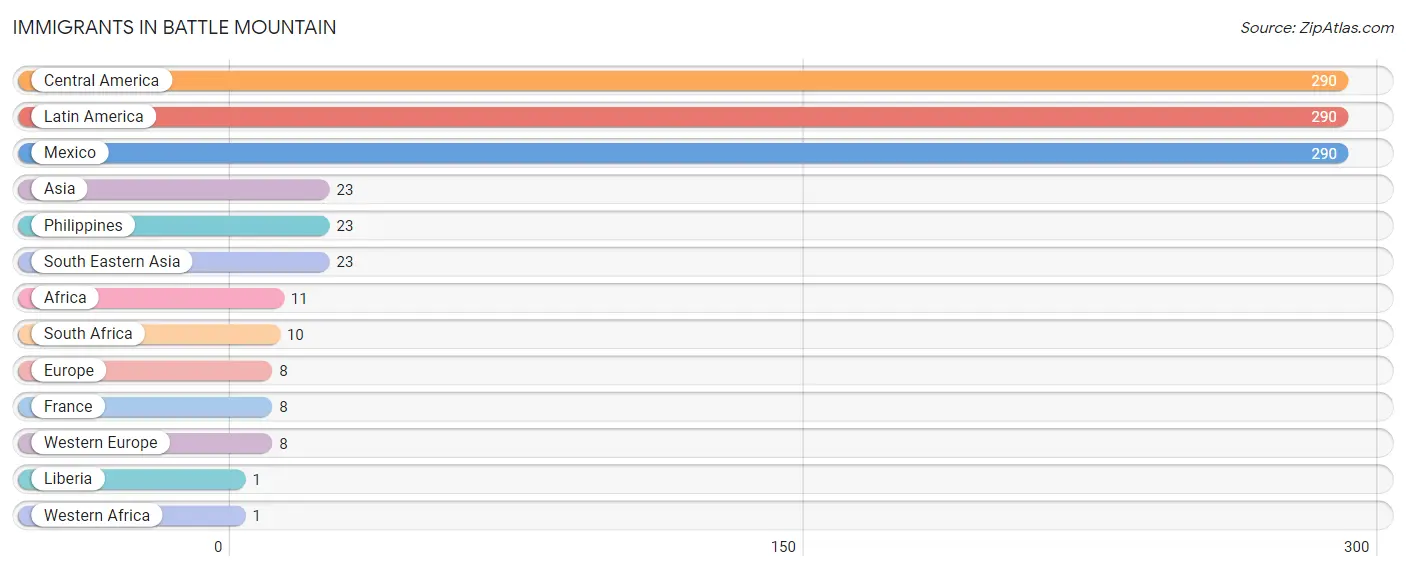
Immigrants in Battle Mountain
The most numerous immigrant groups reported in Battle Mountain came from Central America (290 | 6.9%), Latin America (290 | 6.9%), Mexico (290 | 6.9%), Asia (23 | 0.5%), and Philippines (23 | 0.5%), together accounting for 21.9% of all Battle Mountain residents.
| Immigration Origin | # Population | % Population |
| Africa | 11 | 0.3% |
| Asia | 23 | 0.5% |
| Central America | 290 | 6.9% |
| Europe | 8 | 0.2% |
| France | 8 | 0.2% |
| Latin America | 290 | 6.9% |
| Liberia | 1 | 0.0% |
| Mexico | 290 | 6.9% |
| Philippines | 23 | 0.5% |
| South Africa | 10 | 0.2% |
| South Eastern Asia | 23 | 0.5% |
| Western Africa | 1 | 0.0% |
| Western Europe | 8 | 0.2% | View All 13 Rows |
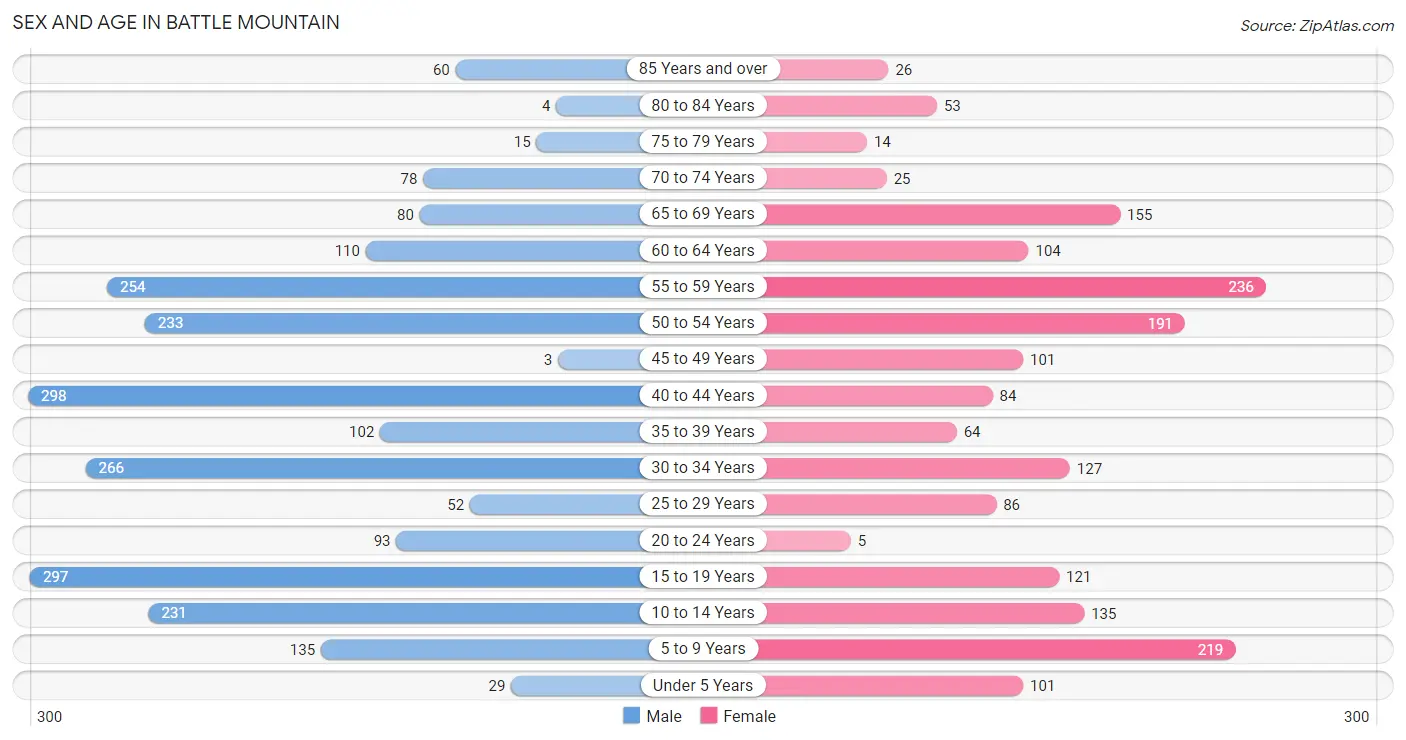
Sex and Age in Battle Mountain
Sex and Age in Battle Mountain
The most populous age groups in Battle Mountain are 40 to 44 Years (298 | 12.7%) for men and 55 to 59 Years (236 | 12.8%) for women.
| Age Bracket | Male | Female |
| Under 5 Years | 29 (1.2%) | 101 (5.5%) |
| 5 to 9 Years | 135 (5.8%) | 219 (11.9%) |
| 10 to 14 Years | 231 (9.9%) | 135 (7.3%) |
| 15 to 19 Years | 297 (12.7%) | 121 (6.6%) |
| 20 to 24 Years | 93 (4.0%) | 5 (0.3%) |
| 25 to 29 Years | 52 (2.2%) | 86 (4.7%) |
| 30 to 34 Years | 266 (11.4%) | 127 (6.9%) |
| 35 to 39 Years | 102 (4.4%) | 64 (3.5%) |
| 40 to 44 Years | 298 (12.7%) | 84 (4.5%) |
| 45 to 49 Years | 3 (0.1%) | 101 (5.5%) |
| 50 to 54 Years | 233 (10.0%) | 191 (10.3%) |
| 55 to 59 Years | 254 (10.8%) | 236 (12.8%) |
| 60 to 64 Years | 110 (4.7%) | 104 (5.6%) |
| 65 to 69 Years | 80 (3.4%) | 155 (8.4%) |
| 70 to 74 Years | 78 (3.3%) | 25 (1.3%) |
| 75 to 79 Years | 15 (0.6%) | 14 (0.8%) |
| 80 to 84 Years | 4 (0.2%) | 53 (2.9%) |
| 85 Years and over | 60 (2.6%) | 26 (1.4%) |
| Total | 2,340 (100.0%) | 1,847 (100.0%) |
Families and Households in Battle Mountain
Median Family Size in Battle Mountain
The median family size in Battle Mountain is 2.97 persons per family, with married-couple families (771 | 64.2%) accounting for the largest median family size of 3.21 persons per family. On the other hand, single male/father families (327 | 27.3%) represent the smallest median family size with 2.37 persons per family.

| Family Type | # Families | Family Size |
| Married-Couple | 771 (64.2%) | 3.21 |
| Single Male/Father | 327 (27.3%) | 2.37 |
| Single Female/Mother | 102 (8.5%) | 3.05 |
| Total Families | 1,200 (100.0%) | 2.97 |
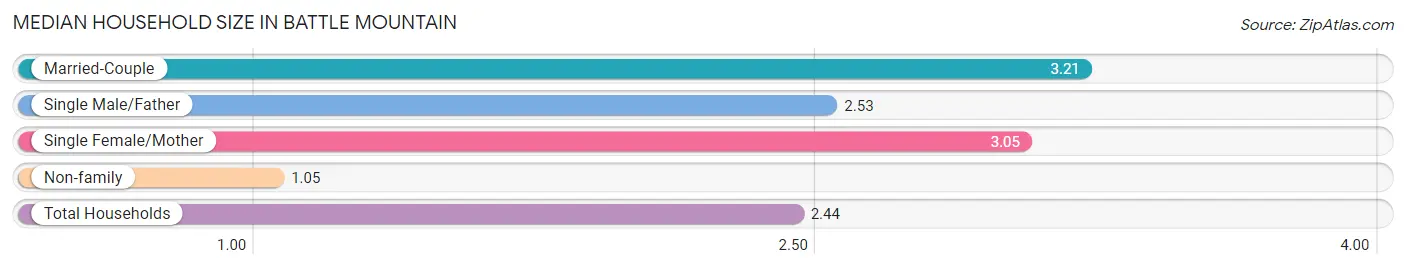
Median Household Size in Battle Mountain
The median household size in Battle Mountain is 2.44 persons per household, with married-couple households (771 | 45.4%) accounting for the largest median household size of 3.21 persons per household. non-family households (497 | 29.3%) represent the smallest median household size with 1.05 persons per household.
| Household Type | # Households | Household Size |
| Married-Couple | 771 (45.4%) | 3.21 |
| Single Male/Father | 327 (19.3%) | 2.53 |
| Single Female/Mother | 102 (6.0%) | 3.05 |
| Non-family | 497 (29.3%) | 1.05 |
| Total Households | 1,697 (100.0%) | 2.44 |
Household Size by Marriage Status in Battle Mountain
Out of a total of 1,697 households in Battle Mountain, 1,200 (70.7%) are family households, while 497 (29.3%) are nonfamily households. The most numerous type of family households are 2-person households, comprising 478, and the most common type of nonfamily households are 1-person households, comprising 469.

| Household Size | Family Households | Nonfamily Households |
| 1-Person Households | - | 469 (27.6%) |
| 2-Person Households | 478 (28.2%) | 28 (1.7%) |
| 3-Person Households | 392 (23.1%) | 0 (0.0%) |
| 4-Person Households | 268 (15.8%) | 0 (0.0%) |
| 5-Person Households | 45 (2.6%) | 0 (0.0%) |
| 6-Person Households | 0 (0.0%) | 0 (0.0%) |
| 7+ Person Households | 17 (1.0%) | 0 (0.0%) |
| Total | 1,200 (70.7%) | 497 (29.3%) |
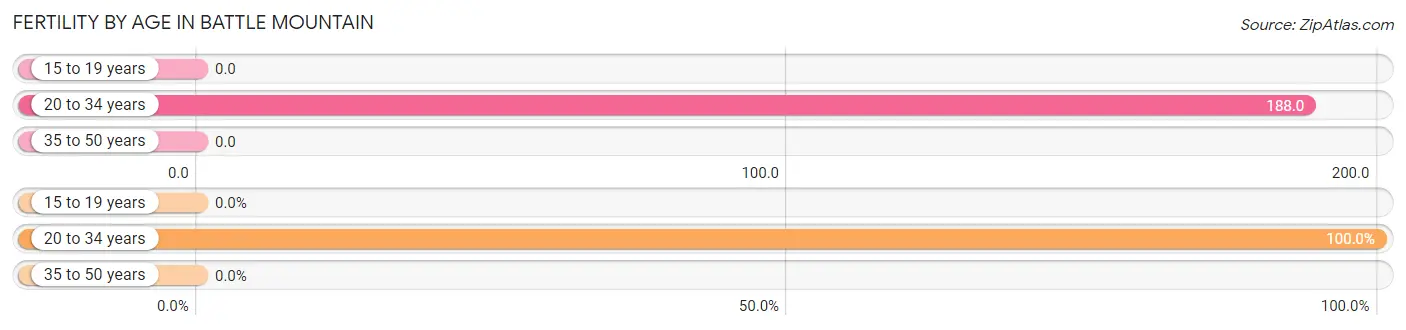
Female Fertility in Battle Mountain
Fertility by Age in Battle Mountain
Average fertility rate in Battle Mountain is 70.0 births per 1,000 women. Women in the age bracket of 20 to 34 years have the highest fertility rate with 188.0 births per 1,000 women. Women in the age bracket of 20 to 34 years acount for 100.0% of all women with births.
| Age Bracket | Women with Births | Births / 1,000 Women |
| 15 to 19 years | 0 (0.0%) | 0.0 |
| 20 to 34 years | 41 (100.0%) | 188.0 |
| 35 to 50 years | 0 (0.0%) | 0.0 |
| Total | 41 (100.0%) | 70.0 |
Fertility by Age by Marriage Status in Battle Mountain
87.8% of women with births (41) in Battle Mountain are married. The highest percentage of unmarried women with births falls into 20 to 34 years age bracket with 12.2% of them unmarried at the time of birth, while the lowest percentage of unmarried women with births belong to 20 to 34 years age bracket with 12.2% of them unmarried.
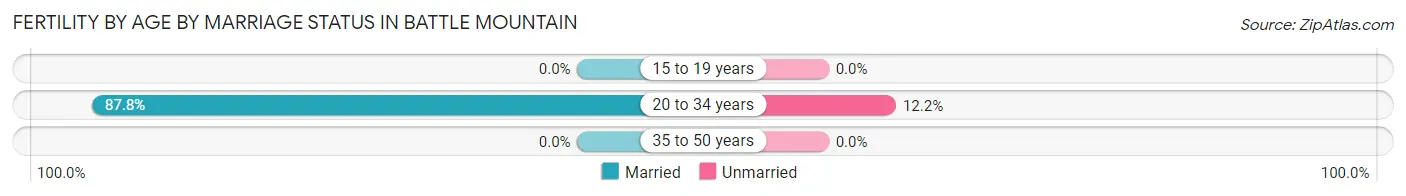
| Age Bracket | Married | Unmarried |
| 15 to 19 years | 0 (0.0%) | 0 (0.0%) |
| 20 to 34 years | 36 (87.8%) | 5 (12.2%) |
| 35 to 50 years | 0 (0.0%) | 0 (0.0%) |
| Total | 36 (87.8%) | 5 (12.2%) |
Fertility by Education in Battle Mountain
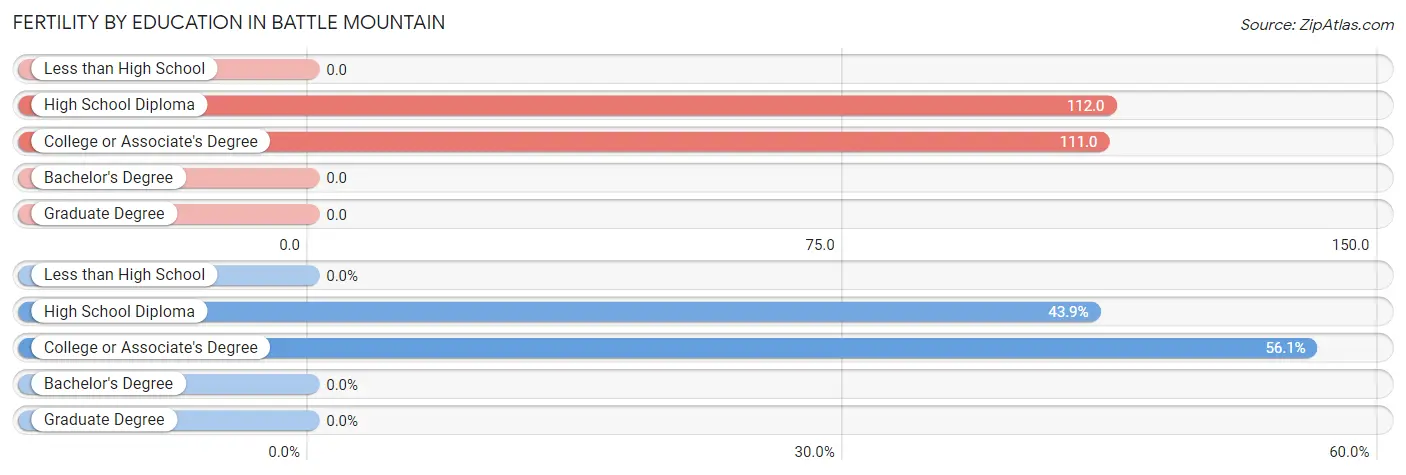
| Educational Attainment | Women with Births | Births / 1,000 Women |
| Less than High School | 0 (0.0%) | 0.0 |
| High School Diploma | 18 (43.9%) | 112.0 |
| College or Associate's Degree | 23 (56.1%) | 111.0 |
| Bachelor's Degree | 0 (0.0%) | 0.0 |
| Graduate Degree | 0 (0.0%) | 0.0 |
| Total | 41 (100.0%) | 70.0 |
Fertility by Education by Marriage Status in Battle Mountain
12.2% of women with births in Battle Mountain are unmarried. Women with the educational attainment of college or associate's degree are most likely to be married with 100.0% of them married at childbirth, while women with the educational attainment of high school diploma are least likely to be married with 27.8% of them unmarried at childbirth.
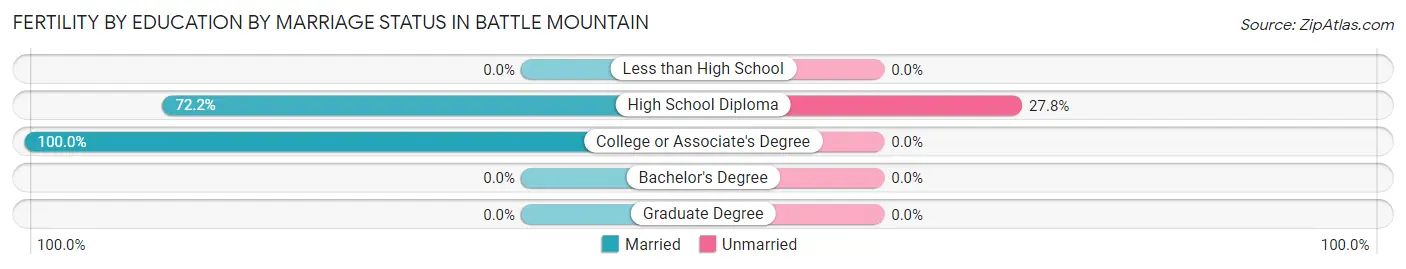
| Educational Attainment | Married | Unmarried |
| Less than High School | 0 (0.0%) | 0 (0.0%) |
| High School Diploma | 13 (72.2%) | 5 (27.8%) |
| College or Associate's Degree | 23 (100.0%) | 0 (0.0%) |
| Bachelor's Degree | 0 (0.0%) | 0 (0.0%) |
| Graduate Degree | 0 (0.0%) | 0 (0.0%) |
| Total | 36 (87.8%) | 5 (12.2%) |
Employment Characteristics in Battle Mountain
Employment by Class of Employer in Battle Mountain
Among the 1,655 employed individuals in Battle Mountain, private company employees (1,228 | 74.2%), local government employees (236 | 14.3%), and federal government employees (137 | 8.3%) make up the most common classes of employment.
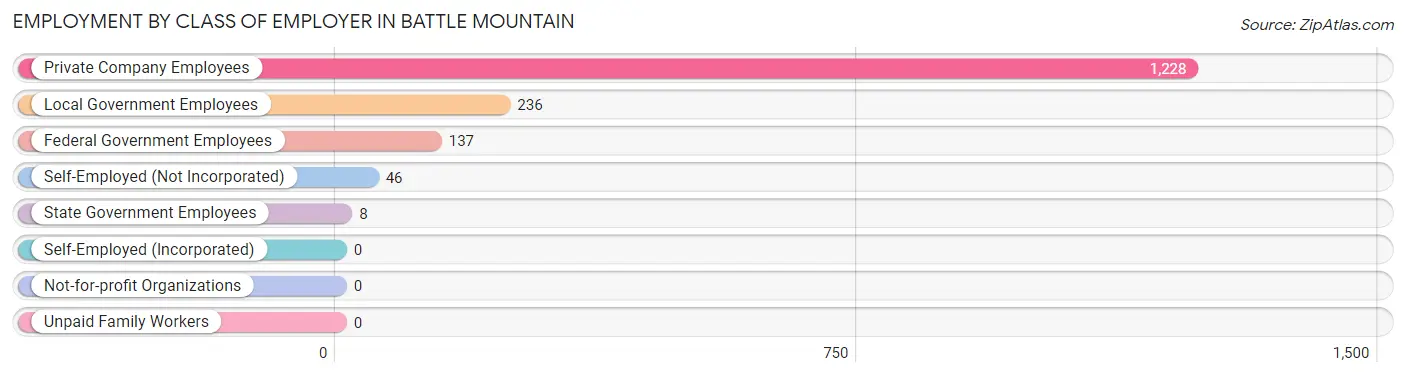
| Employer Class | # Employees | % Employees |
| Private Company Employees | 1,228 | 74.2% |
| Self-Employed (Incorporated) | 0 | 0.0% |
| Self-Employed (Not Incorporated) | 46 | 2.8% |
| Not-for-profit Organizations | 0 | 0.0% |
| Local Government Employees | 236 | 14.3% |
| State Government Employees | 8 | 0.5% |
| Federal Government Employees | 137 | 8.3% |
| Unpaid Family Workers | 0 | 0.0% |
| Total | 1,655 | 100.0% |
Employment Status by Age in Battle Mountain
According to the labor force statistics for Battle Mountain, out of the total population over 16 years of age (3,217), 60.7% or 1,953 individuals are in the labor force, with 15.2% or 297 of them unemployed. The age group with the highest labor force participation rate is 25 to 29 years, with 100.0% or 138 individuals in the labor force. Within the labor force, the 16 to 19 years age range has the highest percentage of unemployed individuals, with 82.6% or 38 of them being unemployed.
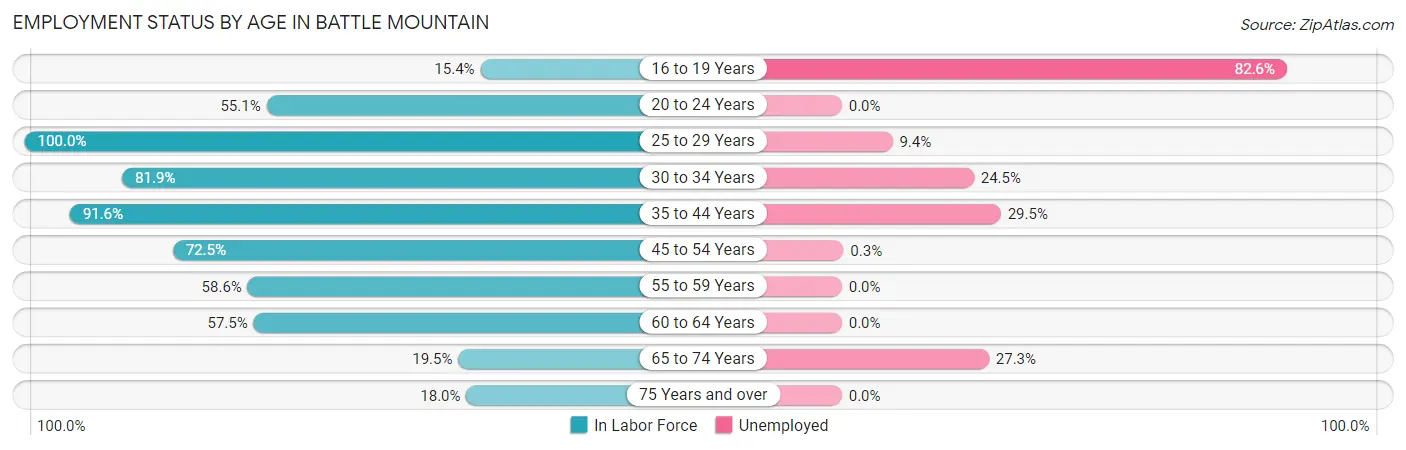
| Age Bracket | In Labor Force | Unemployed |
| 16 to 19 Years | 46 (15.4%) | 38 (82.6%) |
| 20 to 24 Years | 54 (55.1%) | 0 (0.0%) |
| 25 to 29 Years | 138 (100.0%) | 13 (9.4%) |
| 30 to 34 Years | 322 (81.9%) | 79 (24.5%) |
| 35 to 44 Years | 502 (91.6%) | 148 (29.5%) |
| 45 to 54 Years | 383 (72.5%) | 1 (0.3%) |
| 55 to 59 Years | 287 (58.6%) | 0 (0.0%) |
| 60 to 64 Years | 123 (57.5%) | 0 (0.0%) |
| 65 to 74 Years | 66 (19.5%) | 18 (27.3%) |
| 75 Years and over | 31 (18.0%) | 0 (0.0%) |
| Total | 1,953 (60.7%) | 297 (15.2%) |
Employment Status by Educational Attainment in Battle Mountain
According to labor force statistics for Battle Mountain, 75.9% of individuals (1,754) out of the total population between 25 and 64 years of age (2,311) are in the labor force, with 13.7% or 240 of them being unemployed. The group with the highest labor force participation rate are those with the educational attainment of bachelor's degree or higher, with 100.0% or 227 individuals in the labor force. Within the labor force, individuals with less than high school education have the highest percentage of unemployment, with 43.8% or 60 of them being unemployed.
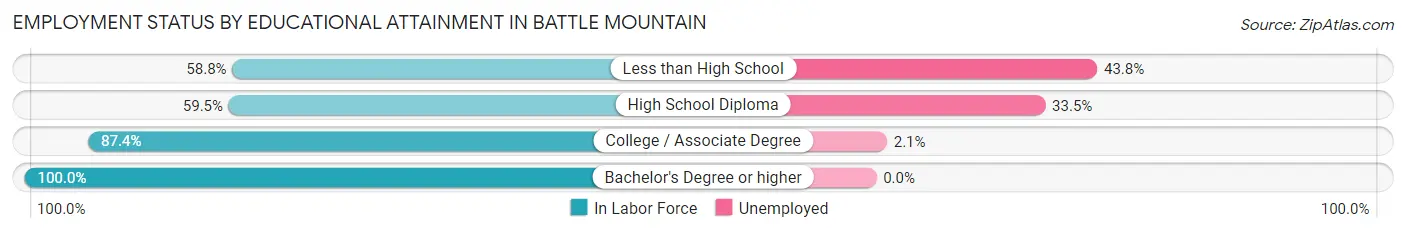
| Educational Attainment | In Labor Force | Unemployed |
| Less than High School | 137 (58.8%) | 102 (43.8%) |
| High School Diploma | 483 (59.5%) | 272 (33.5%) |
| College / Associate Degree | 908 (87.4%) | 22 (2.1%) |
| Bachelor's Degree or higher | 227 (100.0%) | 0 (0.0%) |
| Total | 1,754 (75.9%) | 317 (13.7%) |
Employment Occupations by Sex in Battle Mountain
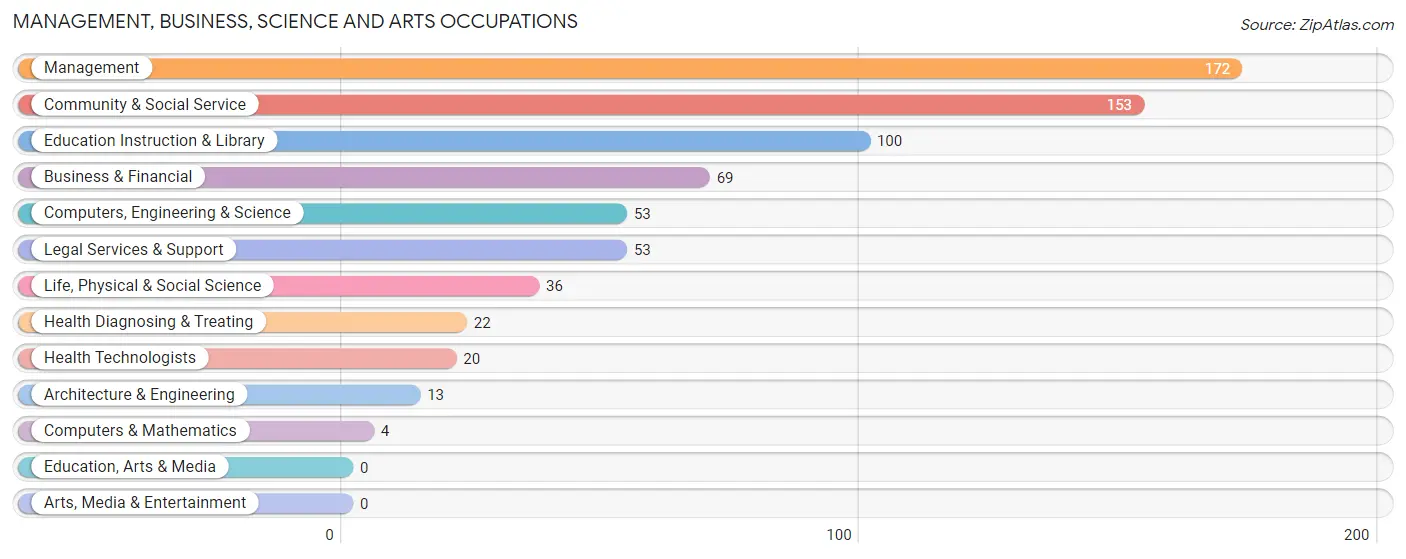
Management, Business, Science and Arts Occupations
The most common Management, Business, Science and Arts occupations in Battle Mountain are Management (172 | 10.4%), Community & Social Service (153 | 9.2%), Education Instruction & Library (100 | 6.0%), Business & Financial (69 | 4.2%), and Computers, Engineering & Science (53 | 3.2%).
Management, Business, Science and Arts Occupations by Sex
Within the Management, Business, Science and Arts occupations in Battle Mountain, the most male-oriented occupations are Architecture & Engineering (100.0%), Health Technologists (100.0%), and Health Diagnosing & Treating (90.9%), while the most female-oriented occupations are Computers & Mathematics (100.0%), Life, Physical & Social Science (100.0%), and Legal Services & Support (100.0%).
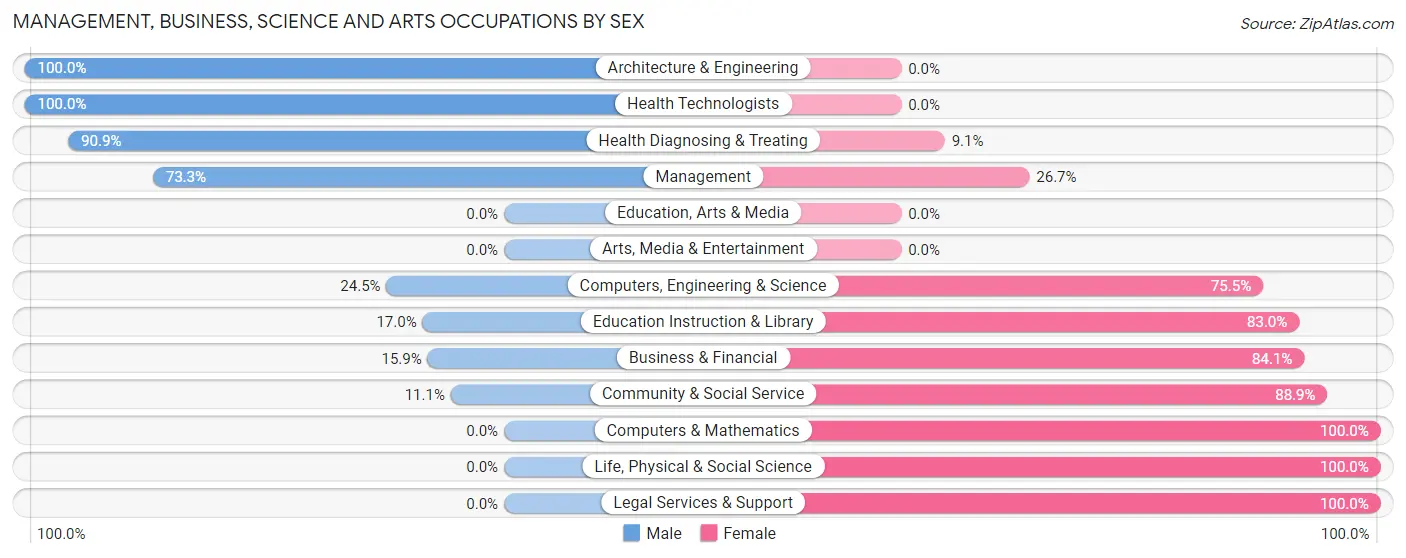
| Occupation | Male | Female |
| Management | 126 (73.3%) | 46 (26.7%) |
| Business & Financial | 11 (15.9%) | 58 (84.1%) |
| Computers, Engineering & Science | 13 (24.5%) | 40 (75.5%) |
| Computers & Mathematics | 0 (0.0%) | 4 (100.0%) |
| Architecture & Engineering | 13 (100.0%) | 0 (0.0%) |
| Life, Physical & Social Science | 0 (0.0%) | 36 (100.0%) |
| Community & Social Service | 17 (11.1%) | 136 (88.9%) |
| Education, Arts & Media | 0 (0.0%) | 0 (0.0%) |
| Legal Services & Support | 0 (0.0%) | 53 (100.0%) |
| Education Instruction & Library | 17 (17.0%) | 83 (83.0%) |
| Arts, Media & Entertainment | 0 (0.0%) | 0 (0.0%) |
| Health Diagnosing & Treating | 20 (90.9%) | 2 (9.1%) |
| Health Technologists | 20 (100.0%) | 0 (0.0%) |
| Total (Category) | 187 (39.9%) | 282 (60.1%) |
| Total (Overall) | 1,157 (69.9%) | 498 (30.1%) |
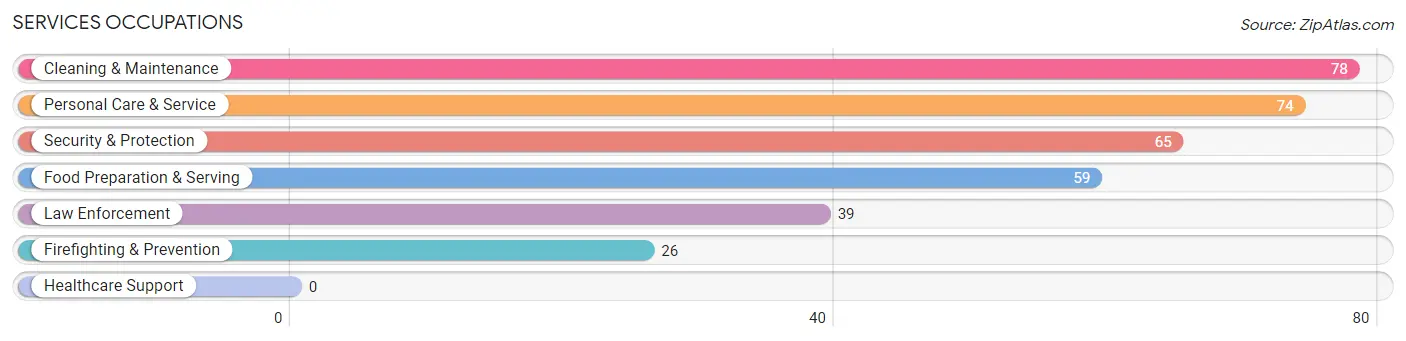
Services Occupations
The most common Services occupations in Battle Mountain are Cleaning & Maintenance (78 | 4.7%), Personal Care & Service (74 | 4.5%), Security & Protection (65 | 3.9%), Food Preparation & Serving (59 | 3.6%), and Law Enforcement (39 | 2.4%).
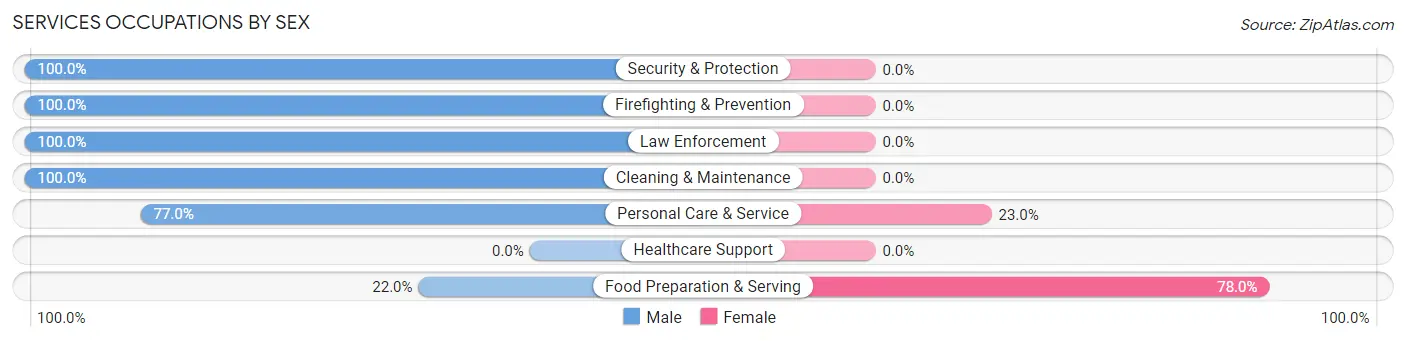
Services Occupations by Sex
Within the Services occupations in Battle Mountain, the most male-oriented occupations are Security & Protection (100.0%), Firefighting & Prevention (100.0%), and Law Enforcement (100.0%), while the most female-oriented occupations are Food Preparation & Serving (78.0%), and Personal Care & Service (23.0%).
| Occupation | Male | Female |
| Healthcare Support | 0 (0.0%) | 0 (0.0%) |
| Security & Protection | 65 (100.0%) | 0 (0.0%) |
| Firefighting & Prevention | 26 (100.0%) | 0 (0.0%) |
| Law Enforcement | 39 (100.0%) | 0 (0.0%) |
| Food Preparation & Serving | 13 (22.0%) | 46 (78.0%) |
| Cleaning & Maintenance | 78 (100.0%) | 0 (0.0%) |
| Personal Care & Service | 57 (77.0%) | 17 (23.0%) |
| Total (Category) | 213 (77.2%) | 63 (22.8%) |
| Total (Overall) | 1,157 (69.9%) | 498 (30.1%) |
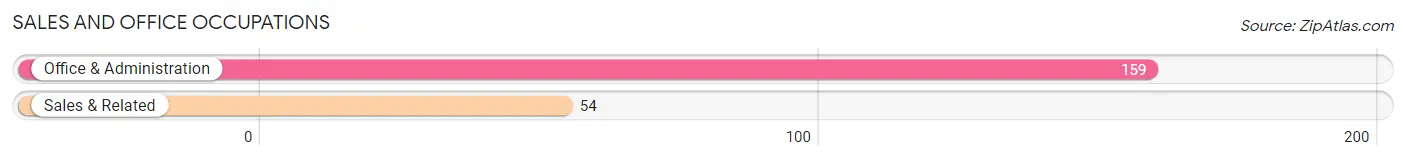
Sales and Office Occupations
The most common Sales and Office occupations in Battle Mountain are Office & Administration (159 | 9.6%), and Sales & Related (54 | 3.3%).
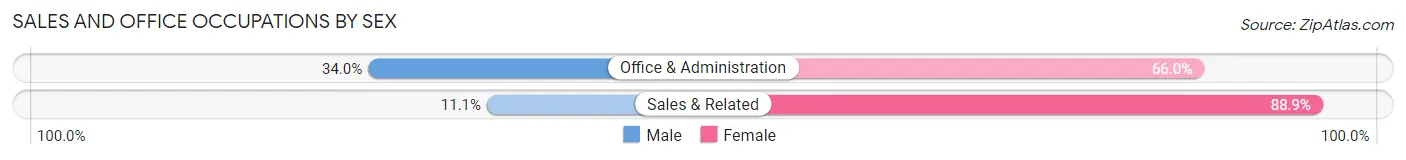
Sales and Office Occupations by Sex
| Occupation | Male | Female |
| Sales & Related | 6 (11.1%) | 48 (88.9%) |
| Office & Administration | 54 (34.0%) | 105 (66.0%) |
| Total (Category) | 60 (28.2%) | 153 (71.8%) |
| Total (Overall) | 1,157 (69.9%) | 498 (30.1%) |
Natural Resources, Construction and Maintenance Occupations
The most common Natural Resources, Construction and Maintenance occupations in Battle Mountain are Installation, Maintenance & Repair (318 | 19.2%), and Construction & Extraction (38 | 2.3%).
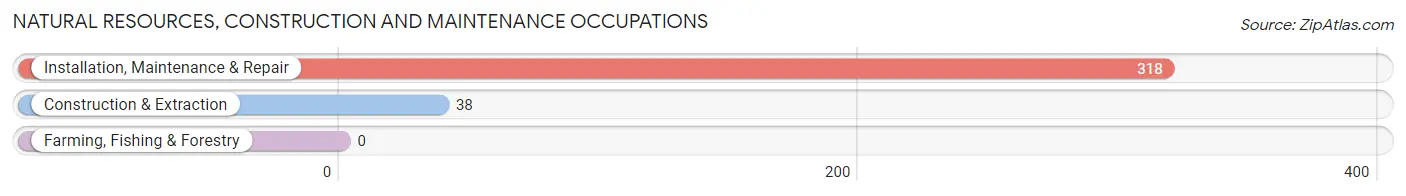
Natural Resources, Construction and Maintenance Occupations by Sex
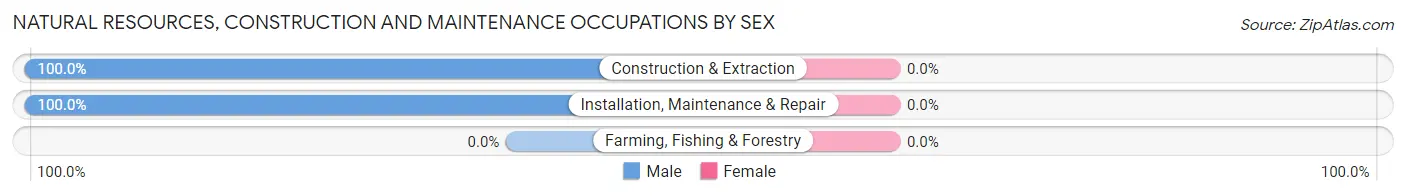
| Occupation | Male | Female |
| Farming, Fishing & Forestry | 0 (0.0%) | 0 (0.0%) |
| Construction & Extraction | 38 (100.0%) | 0 (0.0%) |
| Installation, Maintenance & Repair | 318 (100.0%) | 0 (0.0%) |
| Total (Category) | 356 (100.0%) | 0 (0.0%) |
| Total (Overall) | 1,157 (69.9%) | 498 (30.1%) |
Production, Transportation and Moving Occupations
The most common Production, Transportation and Moving occupations in Battle Mountain are Production (216 | 13.1%), Transportation (87 | 5.3%), and Material Moving (38 | 2.3%).
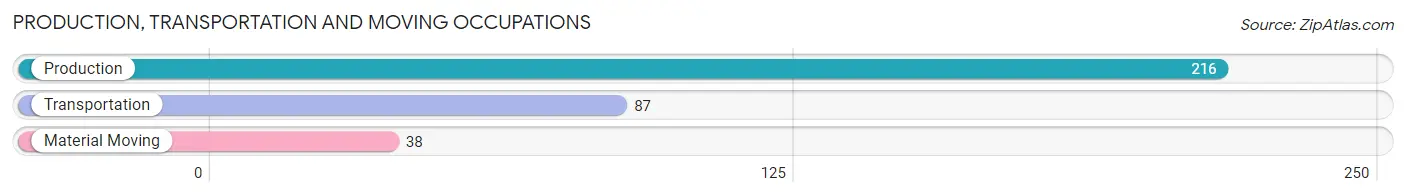
Production, Transportation and Moving Occupations by Sex
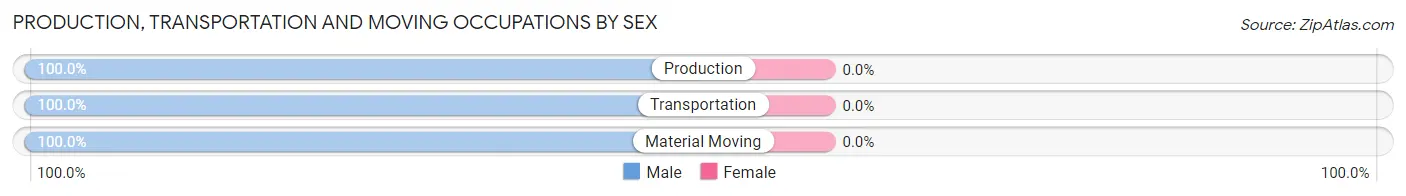
| Occupation | Male | Female |
| Production | 216 (100.0%) | 0 (0.0%) |
| Transportation | 87 (100.0%) | 0 (0.0%) |
| Material Moving | 38 (100.0%) | 0 (0.0%) |
| Total (Category) | 341 (100.0%) | 0 (0.0%) |
| Total (Overall) | 1,157 (69.9%) | 498 (30.1%) |
Employment Industries by Sex in Battle Mountain
Employment Industries in Battle Mountain
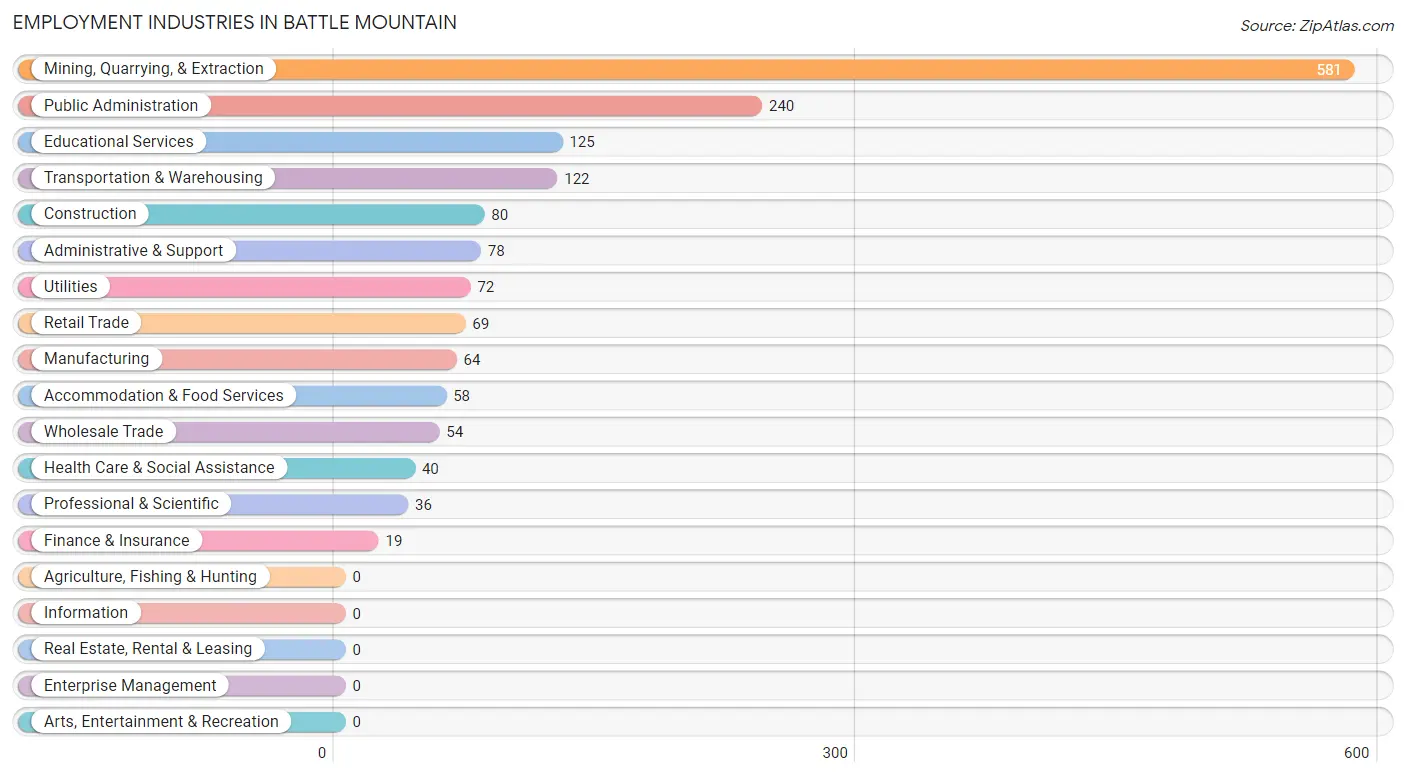
The major employment industries in Battle Mountain include Mining, Quarrying, & Extraction (581 | 35.1%), Public Administration (240 | 14.5%), Educational Services (125 | 7.5%), Transportation & Warehousing (122 | 7.4%), and Construction (80 | 4.8%).
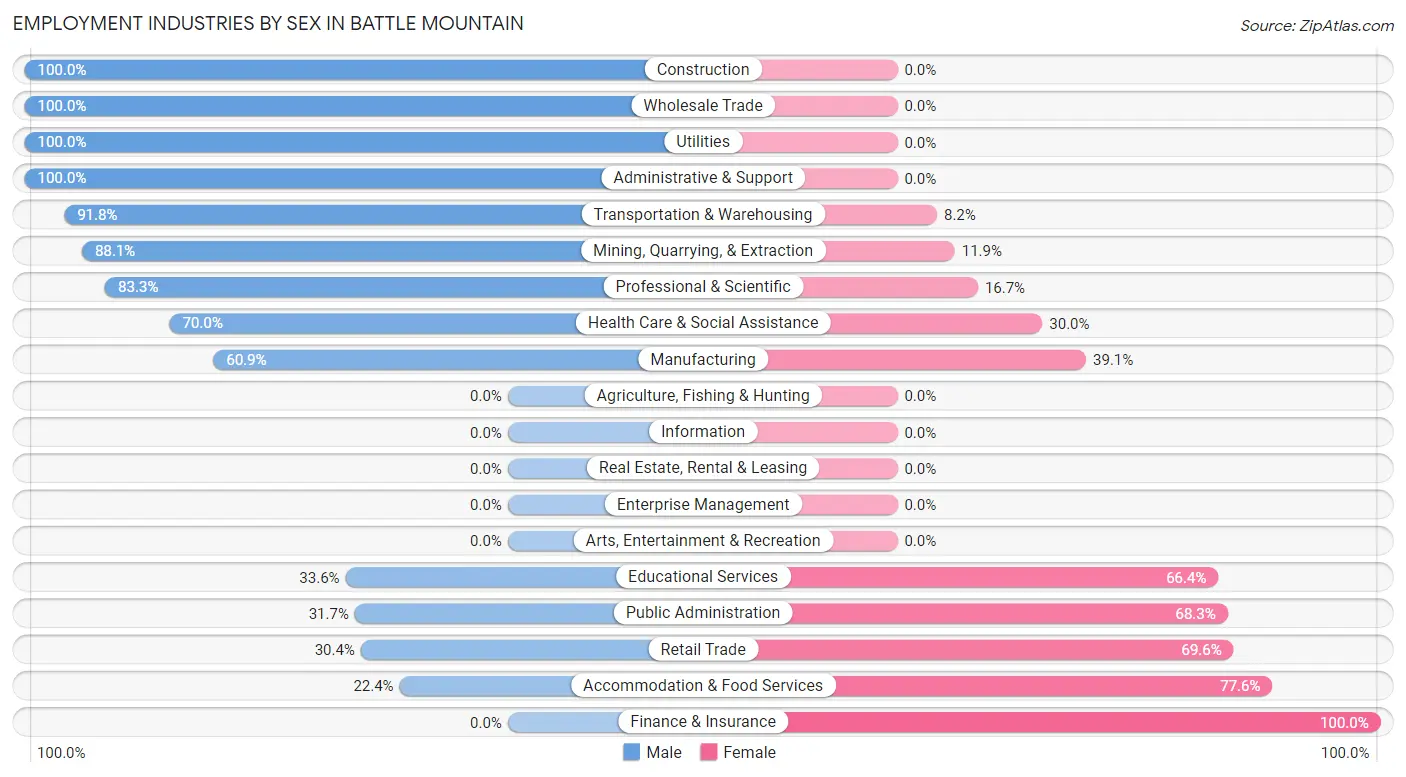
Employment Industries by Sex in Battle Mountain
The Battle Mountain industries that see more men than women are Construction (100.0%), Wholesale Trade (100.0%), and Utilities (100.0%), whereas the industries that tend to have a higher number of women are Finance & Insurance (100.0%), Accommodation & Food Services (77.6%), and Retail Trade (69.6%).
| Industry | Male | Female |
| Agriculture, Fishing & Hunting | 0 (0.0%) | 0 (0.0%) |
| Mining, Quarrying, & Extraction | 512 (88.1%) | 69 (11.9%) |
| Construction | 80 (100.0%) | 0 (0.0%) |
| Manufacturing | 39 (60.9%) | 25 (39.1%) |
| Wholesale Trade | 54 (100.0%) | 0 (0.0%) |
| Retail Trade | 21 (30.4%) | 48 (69.6%) |
| Transportation & Warehousing | 112 (91.8%) | 10 (8.2%) |
| Utilities | 72 (100.0%) | 0 (0.0%) |
| Information | 0 (0.0%) | 0 (0.0%) |
| Finance & Insurance | 0 (0.0%) | 19 (100.0%) |
| Real Estate, Rental & Leasing | 0 (0.0%) | 0 (0.0%) |
| Professional & Scientific | 30 (83.3%) | 6 (16.7%) |
| Enterprise Management | 0 (0.0%) | 0 (0.0%) |
| Administrative & Support | 78 (100.0%) | 0 (0.0%) |
| Educational Services | 42 (33.6%) | 83 (66.4%) |
| Health Care & Social Assistance | 28 (70.0%) | 12 (30.0%) |
| Arts, Entertainment & Recreation | 0 (0.0%) | 0 (0.0%) |
| Accommodation & Food Services | 13 (22.4%) | 45 (77.6%) |
| Public Administration | 76 (31.7%) | 164 (68.3%) |
| Total | 1,157 (69.9%) | 498 (30.1%) |
Education in Battle Mountain
School Enrollment in Battle Mountain
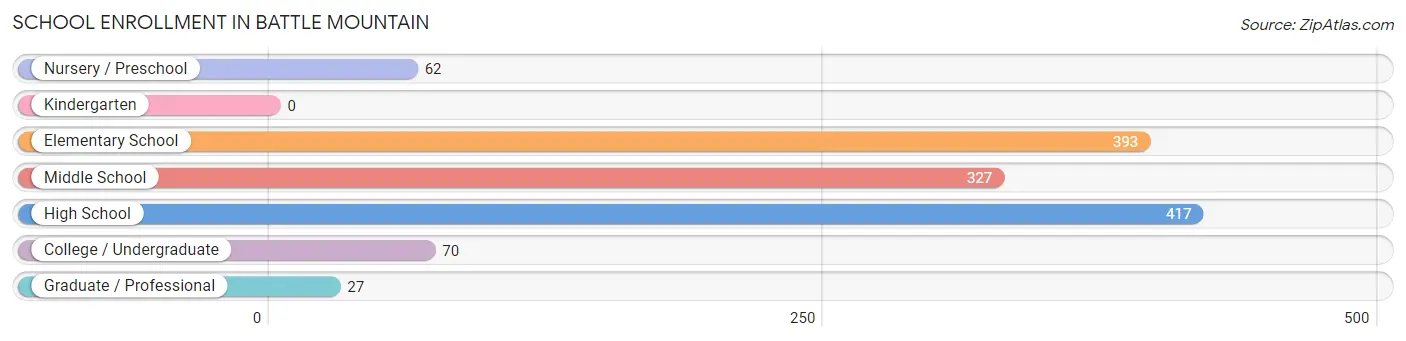
The most common levels of schooling among the 1,296 students in Battle Mountain are high school (417 | 32.2%), elementary school (393 | 30.3%), and middle school (327 | 25.2%).
| School Level | # Students | % Students |
| Nursery / Preschool | 62 | 4.8% |
| Kindergarten | 0 | 0.0% |
| Elementary School | 393 | 30.3% |
| Middle School | 327 | 25.2% |
| High School | 417 | 32.2% |
| College / Undergraduate | 70 | 5.4% |
| Graduate / Professional | 27 | 2.1% |
| Total | 1,296 | 100.0% |
School Enrollment by Age by Funding Source in Battle Mountain
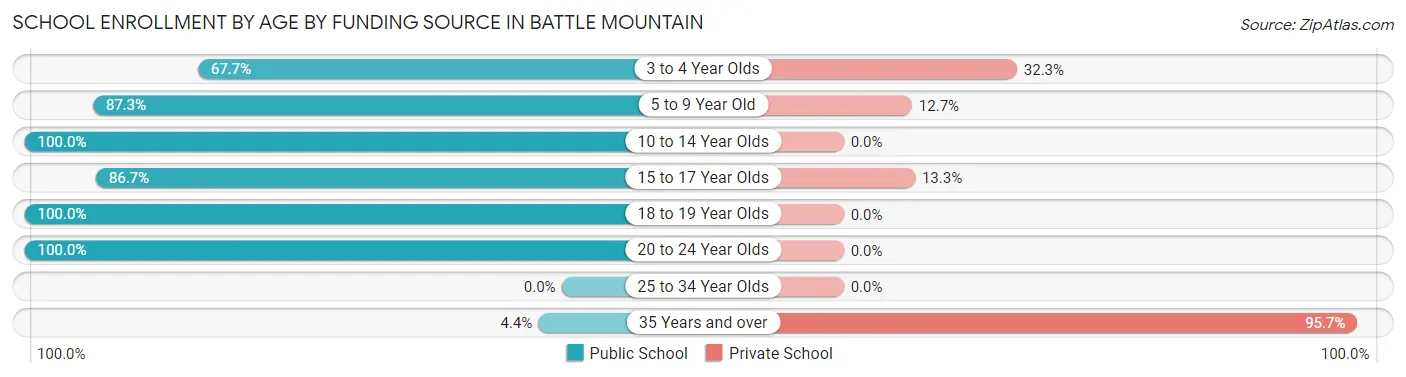
Out of a total of 1,296 students who are enrolled in schools in Battle Mountain, 185 (14.3%) attend a private institution, while the remaining 1,111 (85.7%) are enrolled in public schools. The age group of 35 years and over has the highest likelihood of being enrolled in private schools, with 88 (95.7% in the age bracket) enrolled. Conversely, the age group of 10 to 14 year olds has the lowest likelihood of being enrolled in a private school, with 366 (100.0% in the age bracket) attending a public institution.
| Age Bracket | Public School | Private School |
| 3 to 4 Year Olds | 42 (67.7%) | 20 (32.3%) |
| 5 to 9 Year Old | 309 (87.3%) | 45 (12.7%) |
| 10 to 14 Year Olds | 366 (100.0%) | 0 (0.0%) |
| 15 to 17 Year Olds | 209 (86.7%) | 32 (13.3%) |
| 18 to 19 Year Olds | 137 (100.0%) | 0 (0.0%) |
| 20 to 24 Year Olds | 44 (100.0%) | 0 (0.0%) |
| 25 to 34 Year Olds | 0 (0.0%) | 0 (0.0%) |
| 35 Years and over | 4 (4.3%) | 88 (95.7%) |
| Total | 1,111 (85.7%) | 185 (14.3%) |
Educational Attainment by Field of Study in Battle Mountain
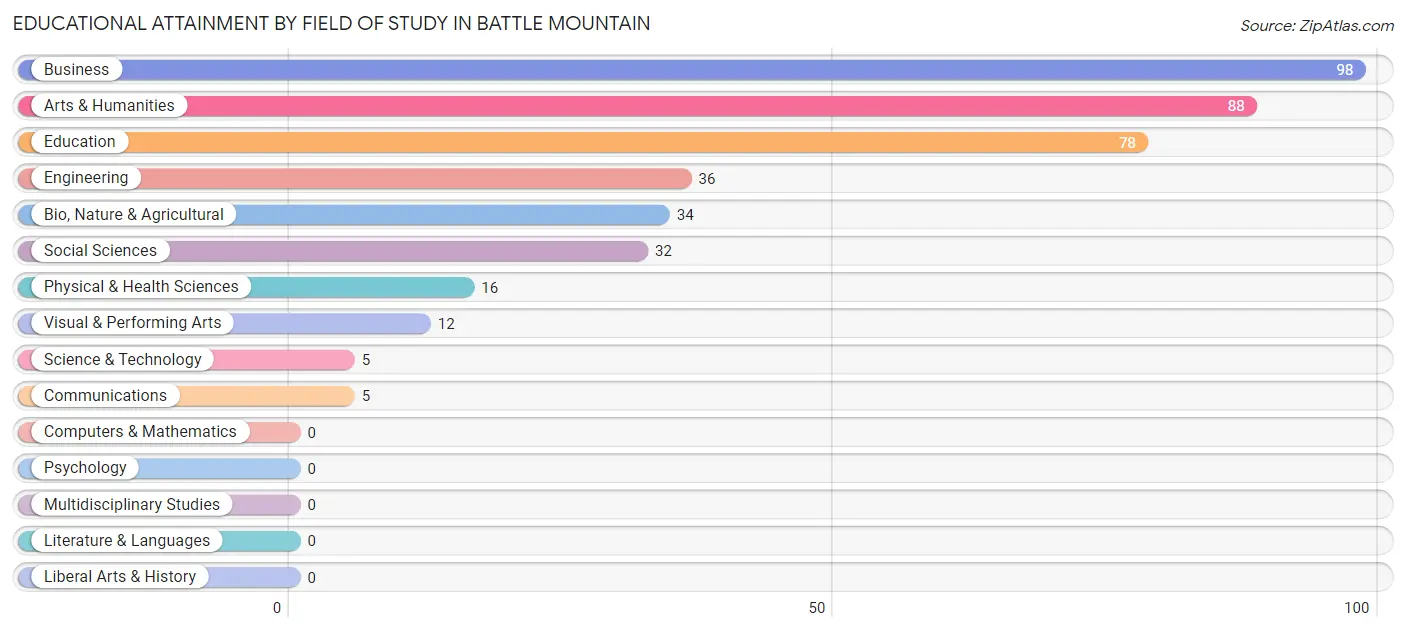
Business (98 | 24.3%), arts & humanities (88 | 21.8%), education (78 | 19.3%), engineering (36 | 8.9%), and bio, nature & agricultural (34 | 8.4%) are the most common fields of study among 404 individuals in Battle Mountain who have obtained a bachelor's degree or higher.
| Field of Study | # Graduates | % Graduates |
| Computers & Mathematics | 0 | 0.0% |
| Bio, Nature & Agricultural | 34 | 8.4% |
| Physical & Health Sciences | 16 | 4.0% |
| Psychology | 0 | 0.0% |
| Social Sciences | 32 | 7.9% |
| Engineering | 36 | 8.9% |
| Multidisciplinary Studies | 0 | 0.0% |
| Science & Technology | 5 | 1.2% |
| Business | 98 | 24.3% |
| Education | 78 | 19.3% |
| Literature & Languages | 0 | 0.0% |
| Liberal Arts & History | 0 | 0.0% |
| Visual & Performing Arts | 12 | 3.0% |
| Communications | 5 | 1.2% |
| Arts & Humanities | 88 | 21.8% |
| Total | 404 | 100.0% |
Transportation & Commute in Battle Mountain
Vehicle Availability by Sex in Battle Mountain
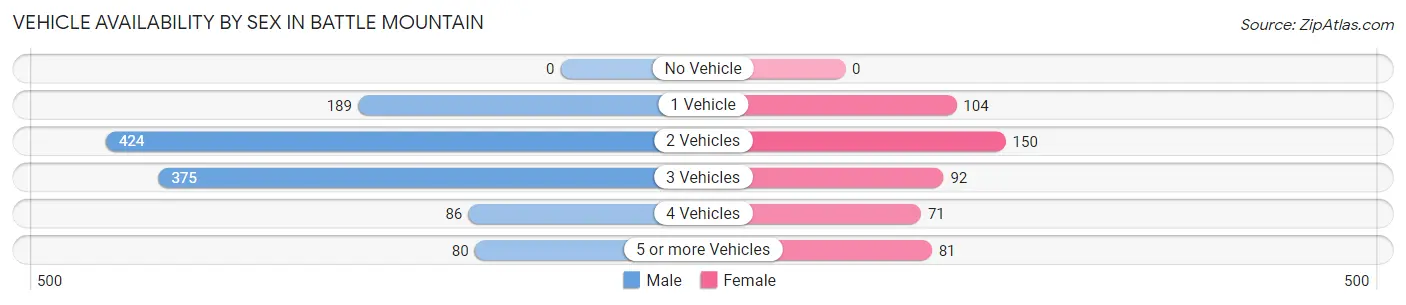
The most prevalent vehicle ownership categories in Battle Mountain are males with 2 vehicles (424, accounting for 36.7%) and females with 2 vehicles (150, making up 85.1%).
| Vehicles Available | Male | Female |
| No Vehicle | 0 (0.0%) | 0 (0.0%) |
| 1 Vehicle | 189 (16.4%) | 104 (20.9%) |
| 2 Vehicles | 424 (36.7%) | 150 (30.1%) |
| 3 Vehicles | 375 (32.5%) | 92 (18.5%) |
| 4 Vehicles | 86 (7.4%) | 71 (14.3%) |
| 5 or more Vehicles | 80 (6.9%) | 81 (16.3%) |
| Total | 1,154 (100.0%) | 498 (100.0%) |
Commute Time in Battle Mountain
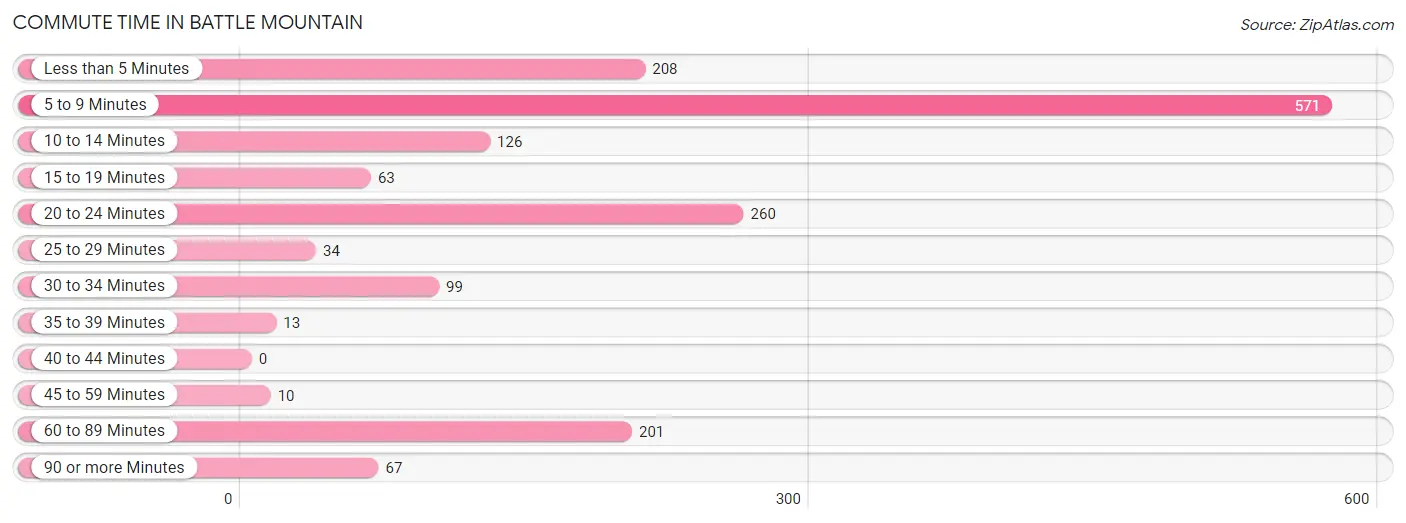
The most frequently occuring commute durations in Battle Mountain are 5 to 9 minutes (571 commuters, 34.6%), 20 to 24 minutes (260 commuters, 15.7%), and less than 5 minutes (208 commuters, 12.6%).
| Commute Time | # Commuters | % Commuters |
| Less than 5 Minutes | 208 | 12.6% |
| 5 to 9 Minutes | 571 | 34.6% |
| 10 to 14 Minutes | 126 | 7.6% |
| 15 to 19 Minutes | 63 | 3.8% |
| 20 to 24 Minutes | 260 | 15.7% |
| 25 to 29 Minutes | 34 | 2.1% |
| 30 to 34 Minutes | 99 | 6.0% |
| 35 to 39 Minutes | 13 | 0.8% |
| 40 to 44 Minutes | 0 | 0.0% |
| 45 to 59 Minutes | 10 | 0.6% |
| 60 to 89 Minutes | 201 | 12.2% |
| 90 or more Minutes | 67 | 4.1% |
Commute Time by Sex in Battle Mountain
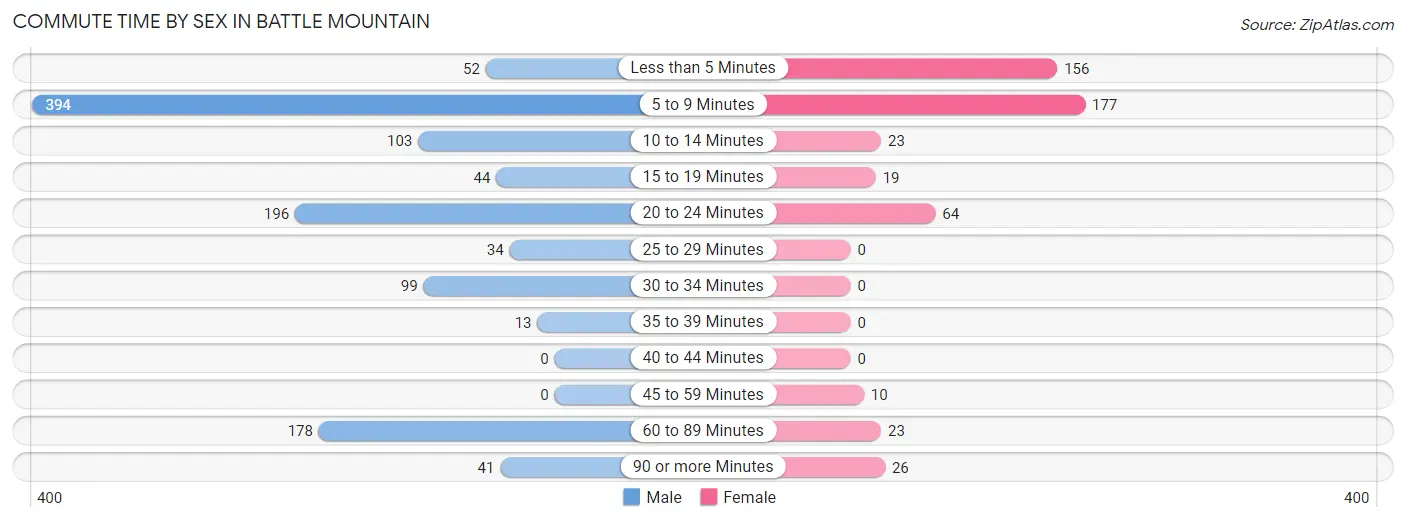
The most common commute times in Battle Mountain are 5 to 9 minutes (394 commuters, 34.1%) for males and 5 to 9 minutes (177 commuters, 35.5%) for females.
| Commute Time | Male | Female |
| Less than 5 Minutes | 52 (4.5%) | 156 (31.3%) |
| 5 to 9 Minutes | 394 (34.1%) | 177 (35.5%) |
| 10 to 14 Minutes | 103 (8.9%) | 23 (4.6%) |
| 15 to 19 Minutes | 44 (3.8%) | 19 (3.8%) |
| 20 to 24 Minutes | 196 (17.0%) | 64 (12.9%) |
| 25 to 29 Minutes | 34 (2.9%) | 0 (0.0%) |
| 30 to 34 Minutes | 99 (8.6%) | 0 (0.0%) |
| 35 to 39 Minutes | 13 (1.1%) | 0 (0.0%) |
| 40 to 44 Minutes | 0 (0.0%) | 0 (0.0%) |
| 45 to 59 Minutes | 0 (0.0%) | 10 (2.0%) |
| 60 to 89 Minutes | 178 (15.4%) | 23 (4.6%) |
| 90 or more Minutes | 41 (3.5%) | 26 (5.2%) |
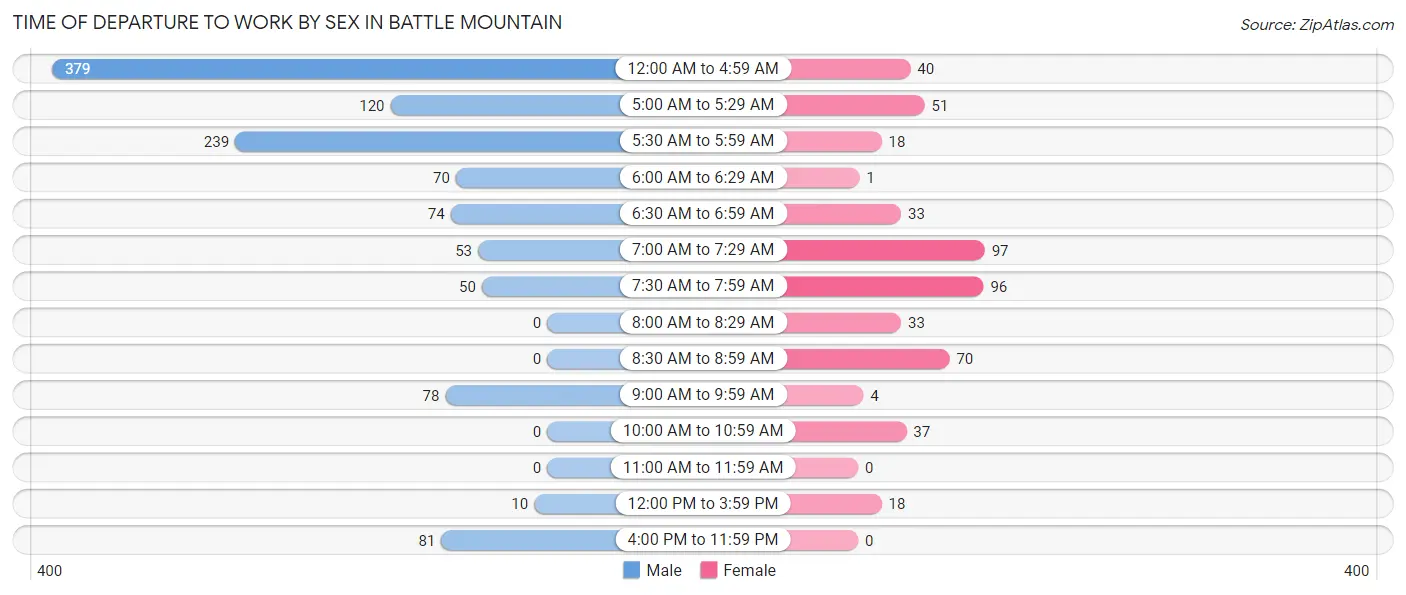
Time of Departure to Work by Sex in Battle Mountain
The most frequent times of departure to work in Battle Mountain are 12:00 AM to 4:59 AM (379, 32.8%) for males and 7:00 AM to 7:29 AM (97, 19.5%) for females.
| Time of Departure | Male | Female |
| 12:00 AM to 4:59 AM | 379 (32.8%) | 40 (8.0%) |
| 5:00 AM to 5:29 AM | 120 (10.4%) | 51 (10.2%) |
| 5:30 AM to 5:59 AM | 239 (20.7%) | 18 (3.6%) |
| 6:00 AM to 6:29 AM | 70 (6.1%) | 1 (0.2%) |
| 6:30 AM to 6:59 AM | 74 (6.4%) | 33 (6.6%) |
| 7:00 AM to 7:29 AM | 53 (4.6%) | 97 (19.5%) |
| 7:30 AM to 7:59 AM | 50 (4.3%) | 96 (19.3%) |
| 8:00 AM to 8:29 AM | 0 (0.0%) | 33 (6.6%) |
| 8:30 AM to 8:59 AM | 0 (0.0%) | 70 (14.1%) |
| 9:00 AM to 9:59 AM | 78 (6.8%) | 4 (0.8%) |
| 10:00 AM to 10:59 AM | 0 (0.0%) | 37 (7.4%) |
| 11:00 AM to 11:59 AM | 0 (0.0%) | 0 (0.0%) |
| 12:00 PM to 3:59 PM | 10 (0.9%) | 18 (3.6%) |
| 4:00 PM to 11:59 PM | 81 (7.0%) | 0 (0.0%) |
| Total | 1,154 (100.0%) | 498 (100.0%) |
Housing Occupancy in Battle Mountain
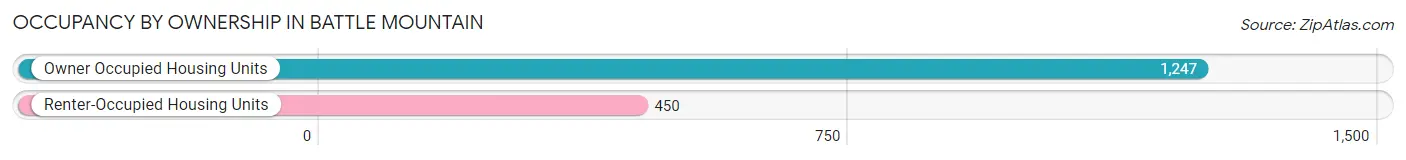
Occupancy by Ownership in Battle Mountain
Of the total 1,697 dwellings in Battle Mountain, owner-occupied units account for 1,247 (73.5%), while renter-occupied units make up 450 (26.5%).
| Occupancy | # Housing Units | % Housing Units |
| Owner Occupied Housing Units | 1,247 | 73.5% |
| Renter-Occupied Housing Units | 450 | 26.5% |
| Total Occupied Housing Units | 1,697 | 100.0% |
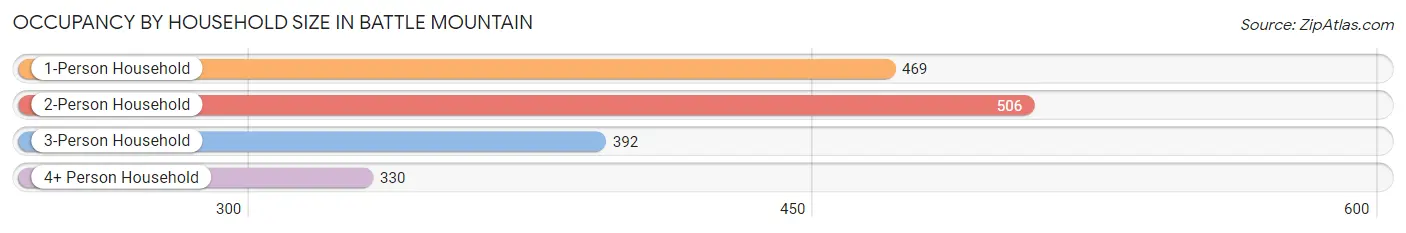
Occupancy by Household Size in Battle Mountain
| Household Size | # Housing Units | % Housing Units |
| 1-Person Household | 469 | 27.6% |
| 2-Person Household | 506 | 29.8% |
| 3-Person Household | 392 | 23.1% |
| 4+ Person Household | 330 | 19.5% |
| Total Housing Units | 1,697 | 100.0% |
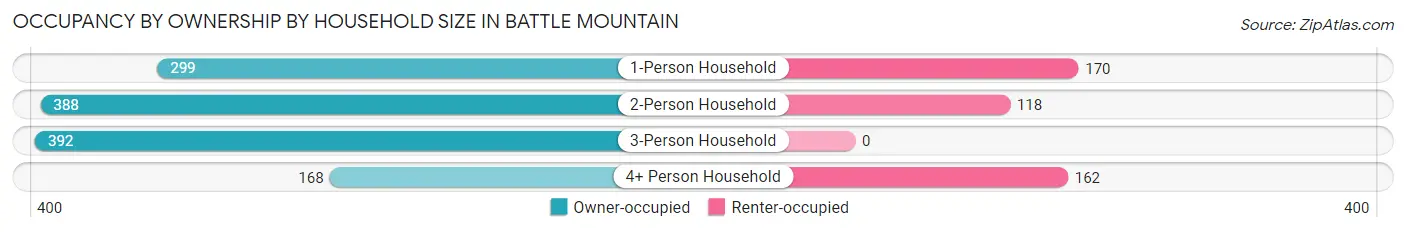
Occupancy by Ownership by Household Size in Battle Mountain
| Household Size | Owner-occupied | Renter-occupied |
| 1-Person Household | 299 (63.7%) | 170 (36.2%) |
| 2-Person Household | 388 (76.7%) | 118 (23.3%) |
| 3-Person Household | 392 (100.0%) | 0 (0.0%) |
| 4+ Person Household | 168 (50.9%) | 162 (49.1%) |
| Total Housing Units | 1,247 (73.5%) | 450 (26.5%) |
Occupancy by Educational Attainment in Battle Mountain
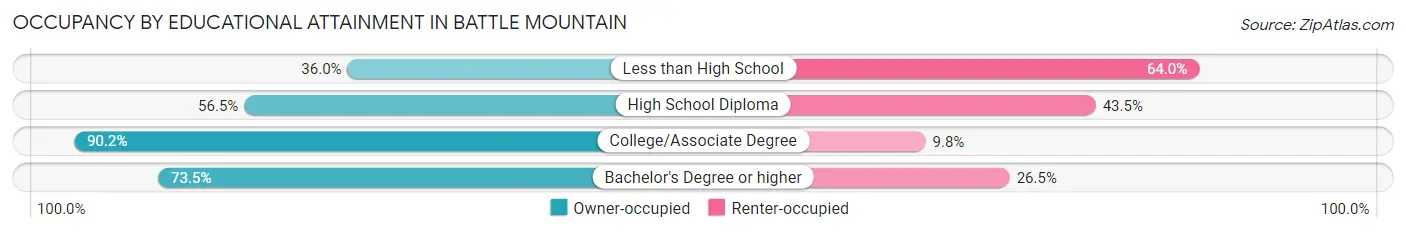
| Household Size | Owner-occupied | Renter-occupied |
| Less than High School | 36 (36.0%) | 64 (64.0%) |
| High School Diploma | 323 (56.5%) | 249 (43.5%) |
| College/Associate Degree | 727 (90.2%) | 79 (9.8%) |
| Bachelor's Degree or higher | 161 (73.5%) | 58 (26.5%) |
Occupancy by Age of Householder in Battle Mountain
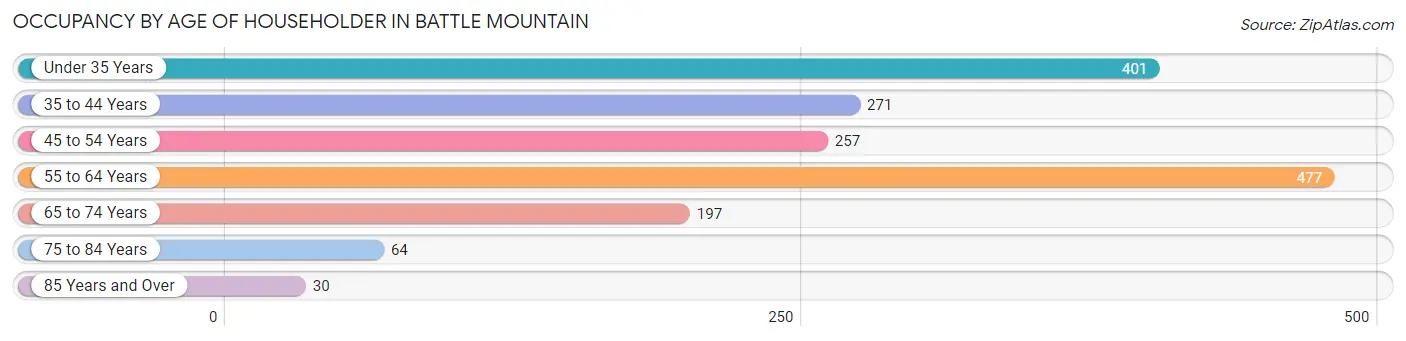
| Age Bracket | # Households | % Households |
| Under 35 Years | 401 | 23.6% |
| 35 to 44 Years | 271 | 16.0% |
| 45 to 54 Years | 257 | 15.1% |
| 55 to 64 Years | 477 | 28.1% |
| 65 to 74 Years | 197 | 11.6% |
| 75 to 84 Years | 64 | 3.8% |
| 85 Years and Over | 30 | 1.8% |
| Total | 1,697 | 100.0% |
Housing Finances in Battle Mountain
Median Income by Occupancy in Battle Mountain
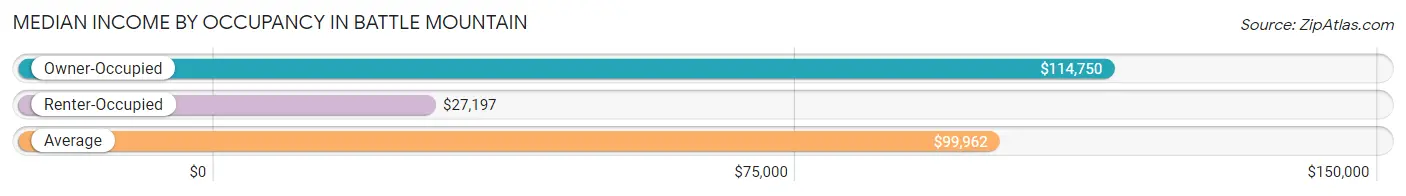
| Occupancy Type | # Households | Median Income |
| Owner-Occupied | 1,247 (73.5%) | $114,750 |
| Renter-Occupied | 450 (26.5%) | $27,197 |
| Average | 1,697 (100.0%) | $99,962 |
Occupancy by Householder Income Bracket in Battle Mountain
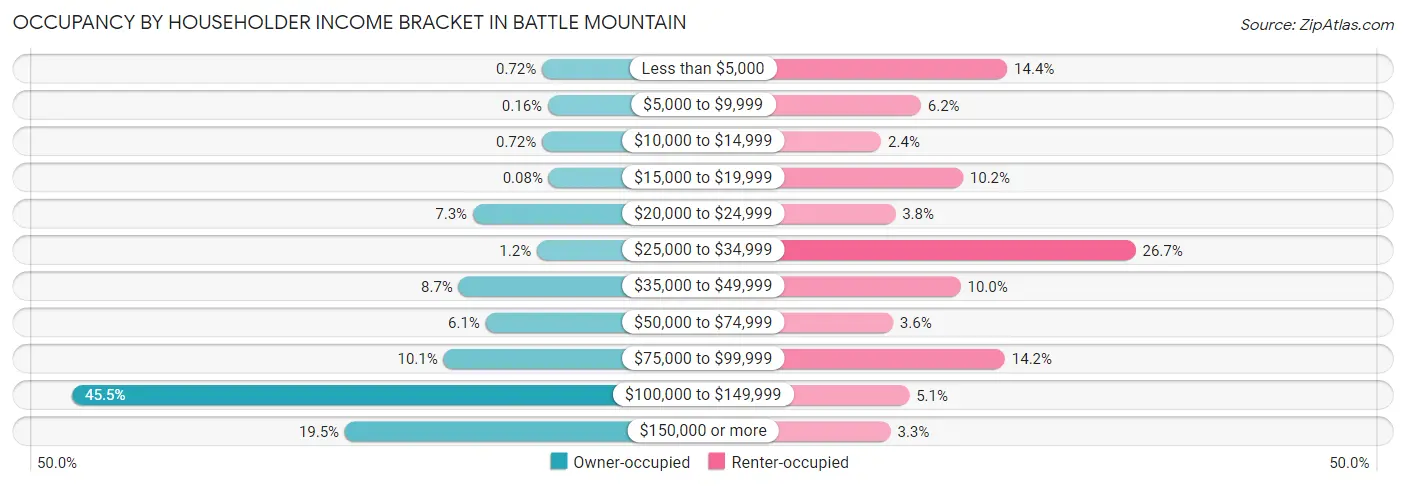
| Income Bracket | Owner-occupied | Renter-occupied |
| Less than $5,000 | 9 (0.7%) | 65 (14.4%) |
| $5,000 to $9,999 | 2 (0.2%) | 28 (6.2%) |
| $10,000 to $14,999 | 9 (0.7%) | 11 (2.4%) |
| $15,000 to $19,999 | 1 (0.1%) | 46 (10.2%) |
| $20,000 to $24,999 | 91 (7.3%) | 17 (3.8%) |
| $25,000 to $34,999 | 15 (1.2%) | 120 (26.7%) |
| $35,000 to $49,999 | 108 (8.7%) | 45 (10.0%) |
| $50,000 to $74,999 | 76 (6.1%) | 16 (3.6%) |
| $75,000 to $99,999 | 126 (10.1%) | 64 (14.2%) |
| $100,000 to $149,999 | 567 (45.5%) | 23 (5.1%) |
| $150,000 or more | 243 (19.5%) | 15 (3.3%) |
| Total | 1,247 (100.0%) | 450 (100.0%) |
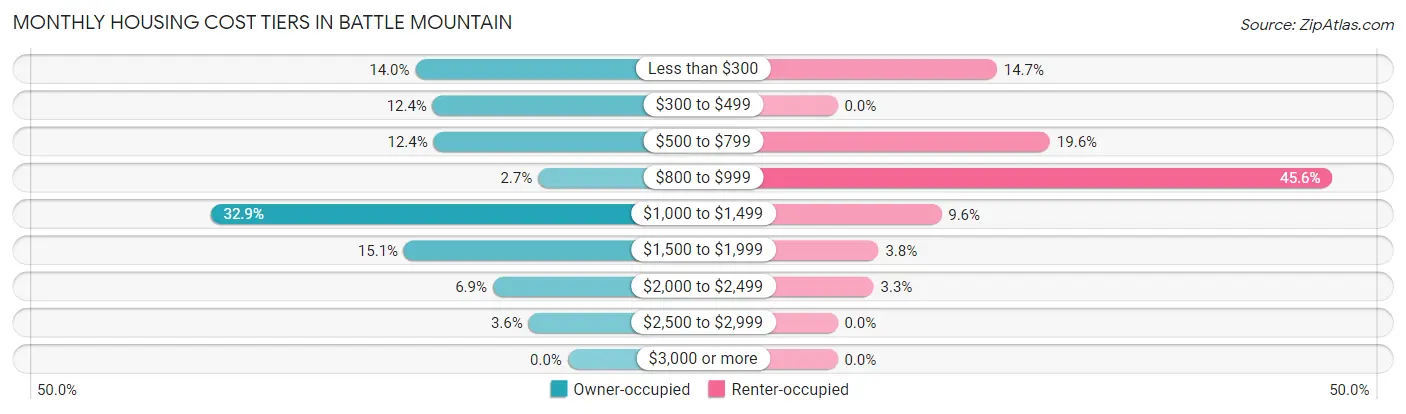
Monthly Housing Cost Tiers in Battle Mountain
| Monthly Cost | Owner-occupied | Renter-occupied |
| Less than $300 | 175 (14.0%) | 66 (14.7%) |
| $300 to $499 | 155 (12.4%) | 0 (0.0%) |
| $500 to $799 | 154 (12.3%) | 88 (19.6%) |
| $800 to $999 | 34 (2.7%) | 205 (45.6%) |
| $1,000 to $1,499 | 410 (32.9%) | 43 (9.6%) |
| $1,500 to $1,999 | 188 (15.1%) | 17 (3.8%) |
| $2,000 to $2,499 | 86 (6.9%) | 15 (3.3%) |
| $2,500 to $2,999 | 45 (3.6%) | 0 (0.0%) |
| $3,000 or more | 0 (0.0%) | 0 (0.0%) |
| Total | 1,247 (100.0%) | 450 (100.0%) |
Physical Housing Characteristics in Battle Mountain
Housing Structures in Battle Mountain
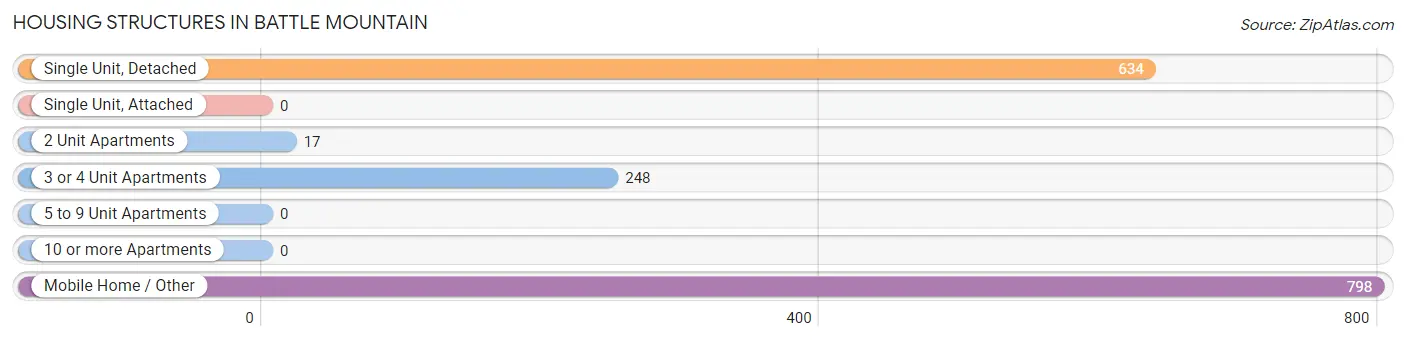
| Structure Type | # Housing Units | % Housing Units |
| Single Unit, Detached | 634 | 37.4% |
| Single Unit, Attached | 0 | 0.0% |
| 2 Unit Apartments | 17 | 1.0% |
| 3 or 4 Unit Apartments | 248 | 14.6% |
| 5 to 9 Unit Apartments | 0 | 0.0% |
| 10 or more Apartments | 0 | 0.0% |
| Mobile Home / Other | 798 | 47.0% |
| Total | 1,697 | 100.0% |
Housing Structures by Occupancy in Battle Mountain
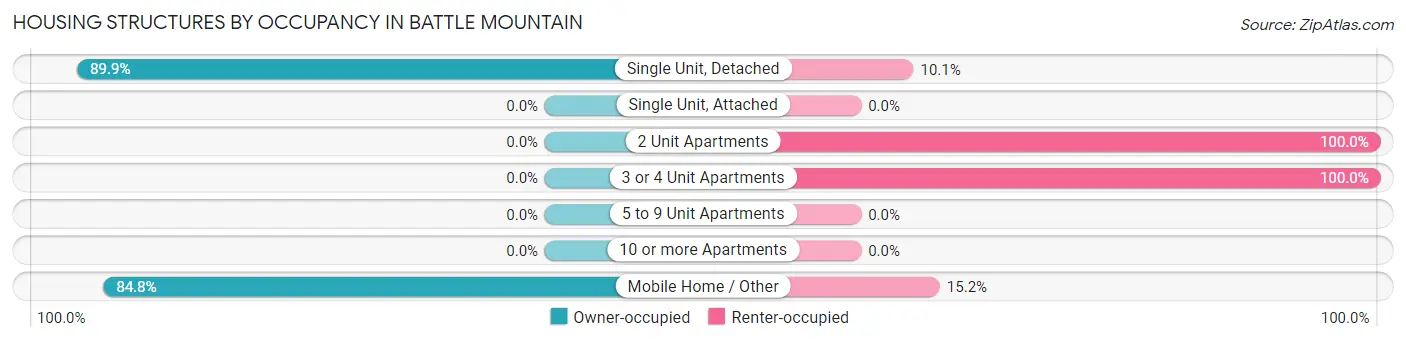
| Structure Type | Owner-occupied | Renter-occupied |
| Single Unit, Detached | 570 (89.9%) | 64 (10.1%) |
| Single Unit, Attached | 0 (0.0%) | 0 (0.0%) |
| 2 Unit Apartments | 0 (0.0%) | 17 (100.0%) |
| 3 or 4 Unit Apartments | 0 (0.0%) | 248 (100.0%) |
| 5 to 9 Unit Apartments | 0 (0.0%) | 0 (0.0%) |
| 10 or more Apartments | 0 (0.0%) | 0 (0.0%) |
| Mobile Home / Other | 677 (84.8%) | 121 (15.2%) |
| Total | 1,247 (73.5%) | 450 (26.5%) |
Housing Structures by Number of Rooms in Battle Mountain
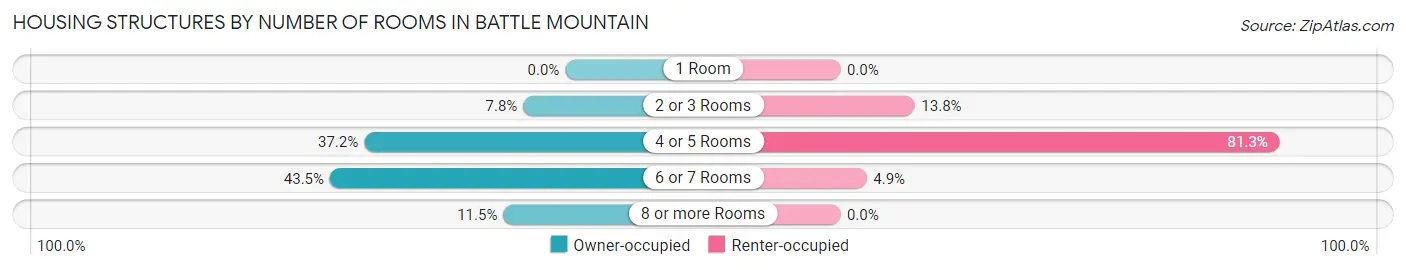
| Number of Rooms | Owner-occupied | Renter-occupied |
| 1 Room | 0 (0.0%) | 0 (0.0%) |
| 2 or 3 Rooms | 97 (7.8%) | 62 (13.8%) |
| 4 or 5 Rooms | 464 (37.2%) | 366 (81.3%) |
| 6 or 7 Rooms | 543 (43.5%) | 22 (4.9%) |
| 8 or more Rooms | 143 (11.5%) | 0 (0.0%) |
| Total | 1,247 (100.0%) | 450 (100.0%) |
Housing Structure by Heating Type in Battle Mountain
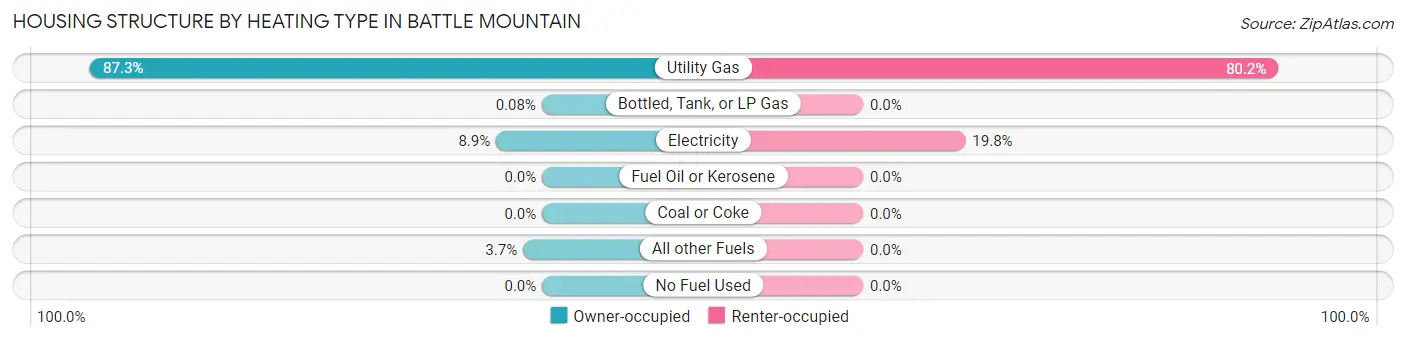
| Heating Type | Owner-occupied | Renter-occupied |
| Utility Gas | 1,089 (87.3%) | 361 (80.2%) |
| Bottled, Tank, or LP Gas | 1 (0.1%) | 0 (0.0%) |
| Electricity | 111 (8.9%) | 89 (19.8%) |
| Fuel Oil or Kerosene | 0 (0.0%) | 0 (0.0%) |
| Coal or Coke | 0 (0.0%) | 0 (0.0%) |
| All other Fuels | 46 (3.7%) | 0 (0.0%) |
| No Fuel Used | 0 (0.0%) | 0 (0.0%) |
| Total | 1,247 (100.0%) | 450 (100.0%) |
Household Vehicle Usage in Battle Mountain
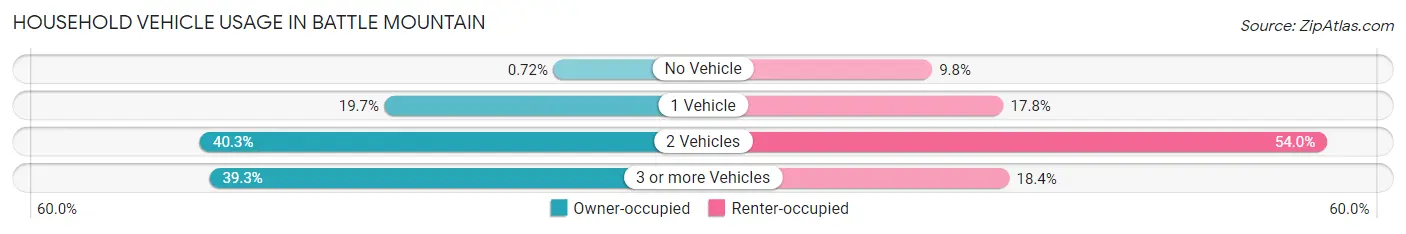
| Vehicles per Household | Owner-occupied | Renter-occupied |
| No Vehicle | 9 (0.7%) | 44 (9.8%) |
| 1 Vehicle | 245 (19.7%) | 80 (17.8%) |
| 2 Vehicles | 503 (40.3%) | 243 (54.0%) |
| 3 or more Vehicles | 490 (39.3%) | 83 (18.4%) |
| Total | 1,247 (100.0%) | 450 (100.0%) |
Real Estate & Mortgages in Battle Mountain
Real Estate and Mortgage Overview in Battle Mountain
| Characteristic | Without Mortgage | With Mortgage |
| Housing Units | 441 | 806 |
| Median Property Value | $159,100 | $220,000 |
| Median Household Income | $100,297 | $203 |
| Monthly Housing Costs | $377 | $0 |
| Real Estate Taxes | $1,329 | $44 |
Property Value by Mortgage Status in Battle Mountain
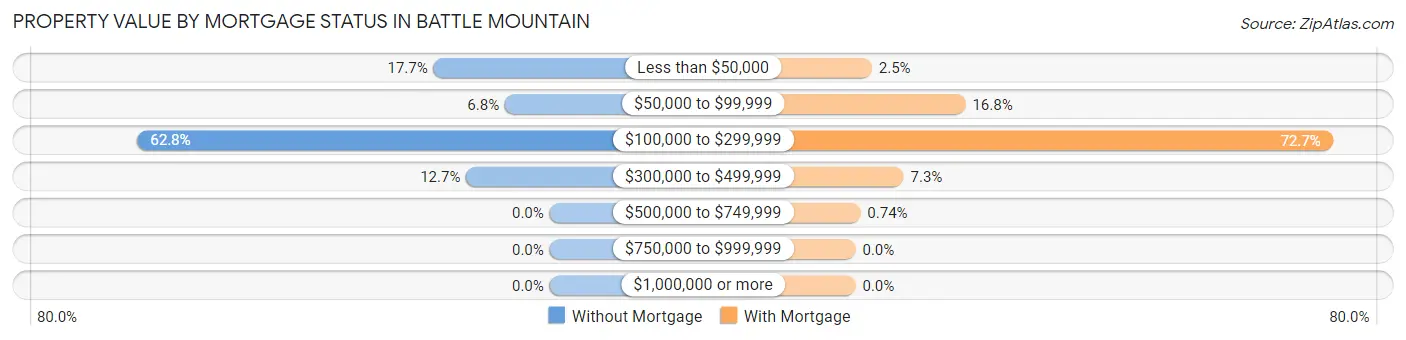
| Property Value | Without Mortgage | With Mortgage |
| Less than $50,000 | 78 (17.7%) | 20 (2.5%) |
| $50,000 to $99,999 | 30 (6.8%) | 135 (16.8%) |
| $100,000 to $299,999 | 277 (62.8%) | 586 (72.7%) |
| $300,000 to $499,999 | 56 (12.7%) | 59 (7.3%) |
| $500,000 to $749,999 | 0 (0.0%) | 6 (0.7%) |
| $750,000 to $999,999 | 0 (0.0%) | 0 (0.0%) |
| $1,000,000 or more | 0 (0.0%) | 0 (0.0%) |
| Total | 441 (100.0%) | 806 (100.0%) |
Household Income by Mortgage Status in Battle Mountain
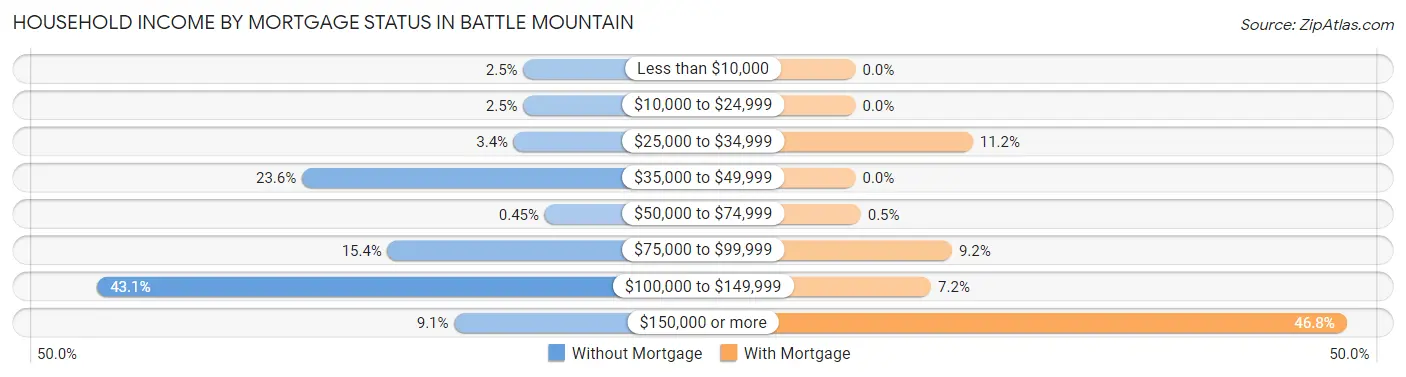
| Household Income | Without Mortgage | With Mortgage |
| Less than $10,000 | 11 (2.5%) | 0 (0.0%) |
| $10,000 to $24,999 | 11 (2.5%) | 0 (0.0%) |
| $25,000 to $34,999 | 15 (3.4%) | 90 (11.2%) |
| $35,000 to $49,999 | 104 (23.6%) | 0 (0.0%) |
| $50,000 to $74,999 | 2 (0.4%) | 4 (0.5%) |
| $75,000 to $99,999 | 68 (15.4%) | 74 (9.2%) |
| $100,000 to $149,999 | 190 (43.1%) | 58 (7.2%) |
| $150,000 or more | 40 (9.1%) | 377 (46.8%) |
| Total | 441 (100.0%) | 806 (100.0%) |
Property Value to Household Income Ratio in Battle Mountain
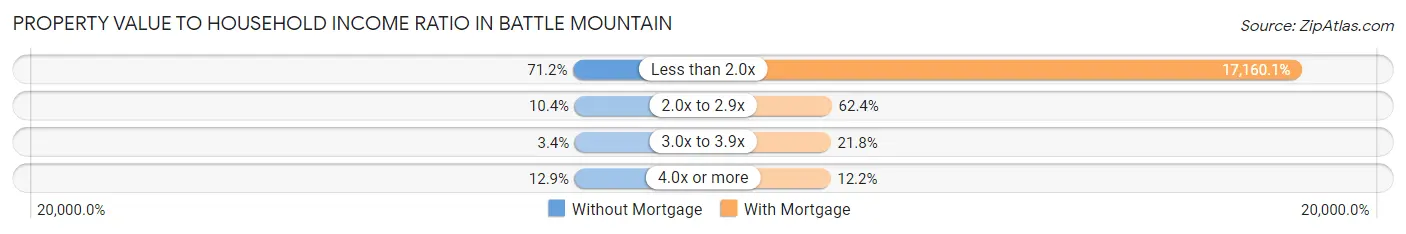
| Value-to-Income Ratio | Without Mortgage | With Mortgage |
| Less than 2.0x | 314 (71.2%) | 138,310 (17,160.1%) |
| 2.0x to 2.9x | 46 (10.4%) | 503 (62.4%) |
| 3.0x to 3.9x | 15 (3.4%) | 176 (21.8%) |
| 4.0x or more | 57 (12.9%) | 98 (12.2%) |
| Total | 441 (100.0%) | 806 (100.0%) |
Real Estate Taxes by Mortgage Status in Battle Mountain
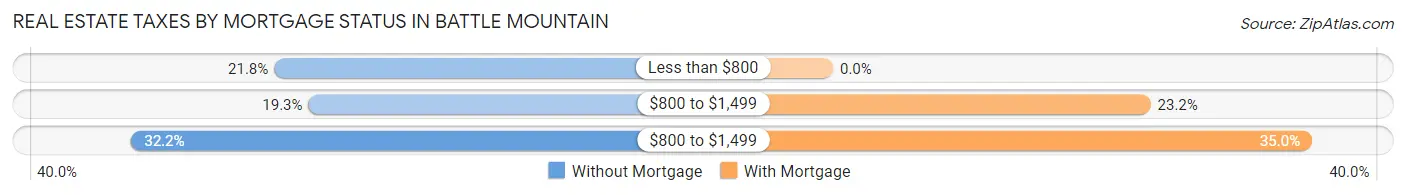
| Property Taxes | Without Mortgage | With Mortgage |
| Less than $800 | 96 (21.8%) | 0 (0.0%) |
| $800 to $1,499 | 85 (19.3%) | 187 (23.2%) |
| $800 to $1,499 | 142 (32.2%) | 282 (35.0%) |
| Total | 441 (100.0%) | 806 (100.0%) |
Health & Disability in Battle Mountain
Health Insurance Coverage by Age in Battle Mountain
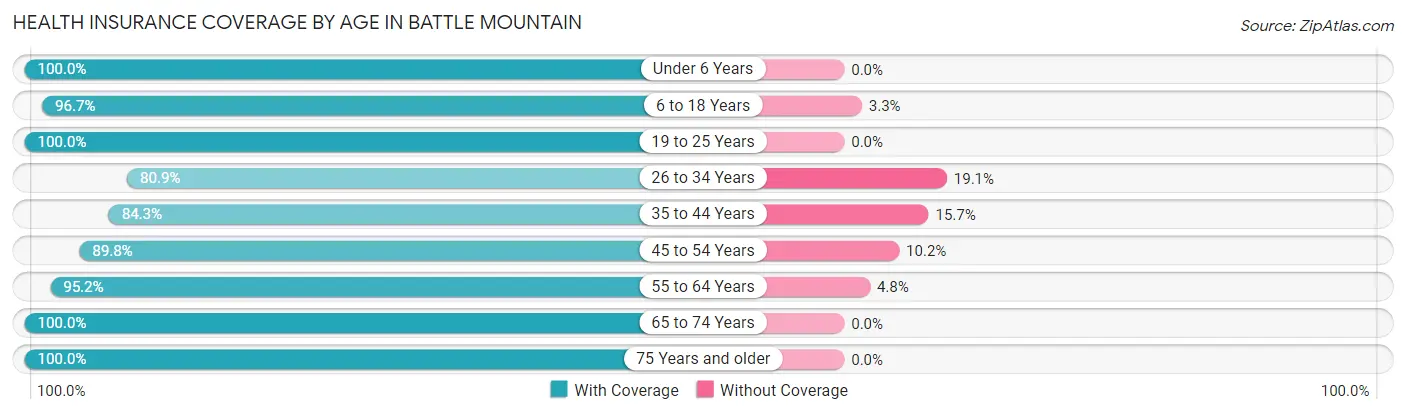
| Age Bracket | With Coverage | Without Coverage |
| Under 6 Years | 130 (100.0%) | 0 (0.0%) |
| 6 to 18 Years | 1,063 (96.7%) | 36 (3.3%) |
| 19 to 25 Years | 160 (100.0%) | 0 (0.0%) |
| 26 to 34 Years | 410 (80.9%) | 97 (19.1%) |
| 35 to 44 Years | 456 (84.3%) | 85 (15.7%) |
| 45 to 54 Years | 474 (89.8%) | 54 (10.2%) |
| 55 to 64 Years | 656 (95.2%) | 33 (4.8%) |
| 65 to 74 Years | 327 (100.0%) | 0 (0.0%) |
| 75 Years and older | 160 (100.0%) | 0 (0.0%) |
| Total | 3,836 (92.6%) | 305 (7.4%) |
Health Insurance Coverage by Citizenship Status in Battle Mountain
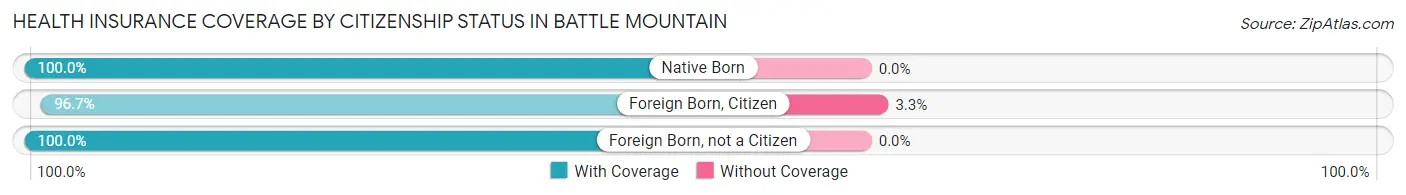
| Citizenship Status | With Coverage | Without Coverage |
| Native Born | 130 (100.0%) | 0 (0.0%) |
| Foreign Born, Citizen | 1,063 (96.7%) | 36 (3.3%) |
| Foreign Born, not a Citizen | 160 (100.0%) | 0 (0.0%) |
Health Insurance Coverage by Household Income in Battle Mountain
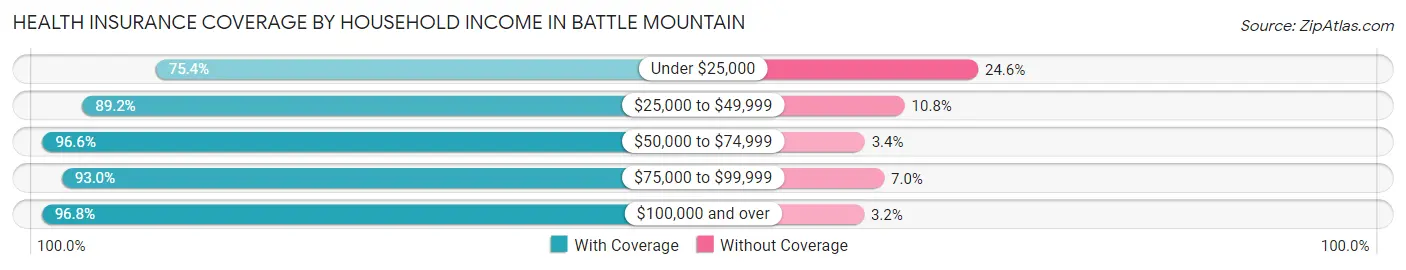
| Household Income | With Coverage | Without Coverage |
| Under $25,000 | 322 (75.4%) | 105 (24.6%) |
| $25,000 to $49,999 | 699 (89.2%) | 85 (10.8%) |
| $50,000 to $74,999 | 144 (96.6%) | 5 (3.4%) |
| $75,000 to $99,999 | 506 (93.0%) | 38 (7.0%) |
| $100,000 and over | 2,162 (96.8%) | 72 (3.2%) |
Public vs Private Health Insurance Coverage by Age in Battle Mountain
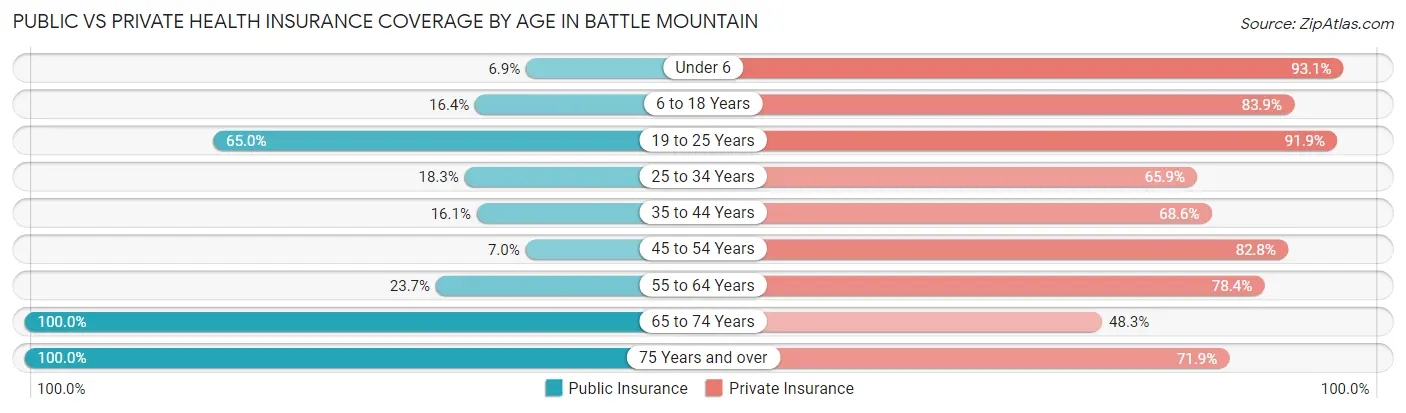
| Age Bracket | Public Insurance | Private Insurance |
| Under 6 | 9 (6.9%) | 121 (93.1%) |
| 6 to 18 Years | 180 (16.4%) | 922 (83.9%) |
| 19 to 25 Years | 104 (65.0%) | 147 (91.9%) |
| 25 to 34 Years | 93 (18.3%) | 334 (65.9%) |
| 35 to 44 Years | 87 (16.1%) | 371 (68.6%) |
| 45 to 54 Years | 37 (7.0%) | 437 (82.8%) |
| 55 to 64 Years | 163 (23.7%) | 540 (78.4%) |
| 65 to 74 Years | 327 (100.0%) | 158 (48.3%) |
| 75 Years and over | 160 (100.0%) | 115 (71.9%) |
| Total | 1,160 (28.0%) | 3,145 (75.9%) |
Disability Status by Sex by Age in Battle Mountain
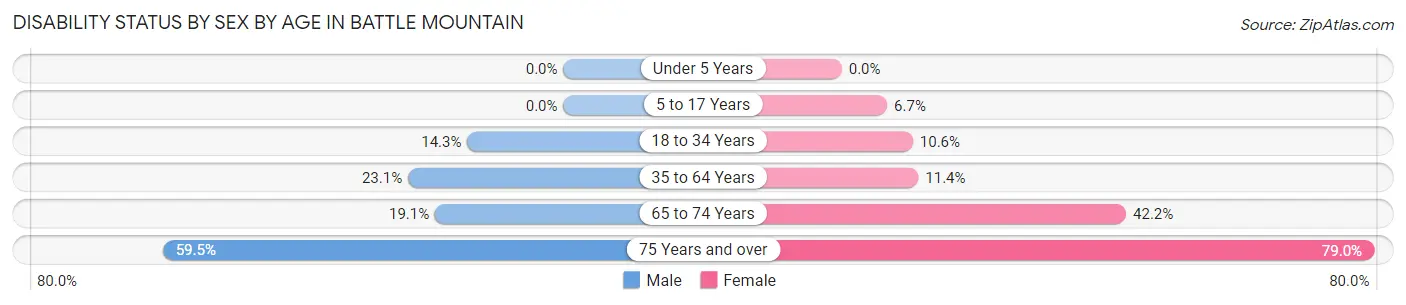
| Age Bracket | Male | Female |
| Under 5 Years | 0 (0.0%) | 0 (0.0%) |
| 5 to 17 Years | 0 (0.0%) | 32 (6.7%) |
| 18 to 34 Years | 78 (14.3%) | 23 (10.5%) |
| 35 to 64 Years | 227 (23.1%) | 88 (11.4%) |
| 65 to 74 Years | 28 (19.1%) | 76 (42.2%) |
| 75 Years and over | 47 (59.5%) | 64 (79.0%) |
Disability Class by Sex by Age in Battle Mountain
Disability Class: Hearing Difficulty
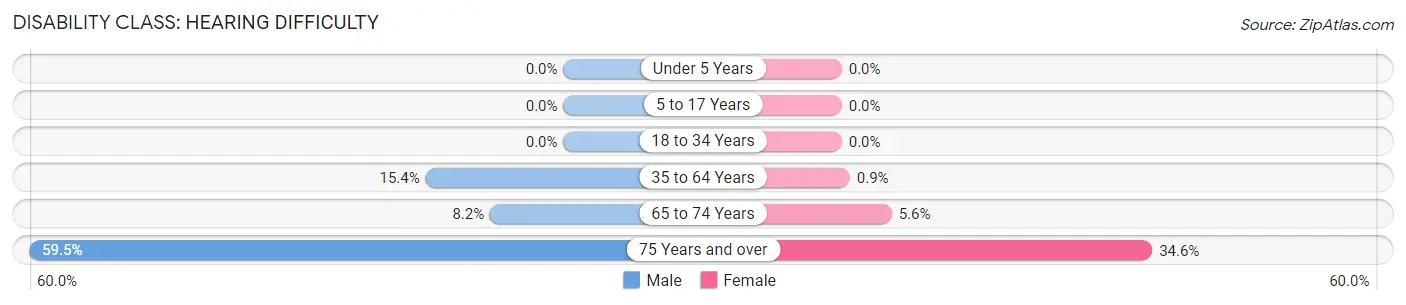
| Age Bracket | Male | Female |
| Under 5 Years | 0 (0.0%) | 0 (0.0%) |
| 5 to 17 Years | 0 (0.0%) | 0 (0.0%) |
| 18 to 34 Years | 0 (0.0%) | 0 (0.0%) |
| 35 to 64 Years | 151 (15.3%) | 7 (0.9%) |
| 65 to 74 Years | 12 (8.2%) | 10 (5.6%) |
| 75 Years and over | 47 (59.5%) | 28 (34.6%) |
Disability Class: Vision Difficulty
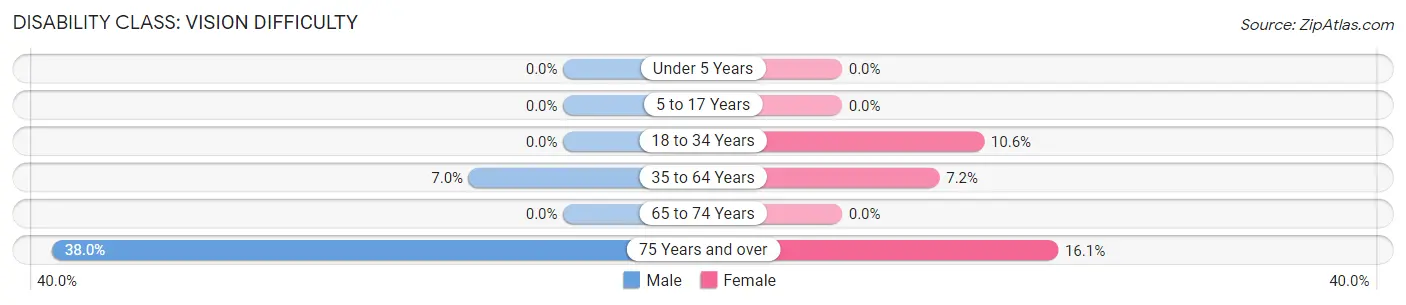
| Age Bracket | Male | Female |
| Under 5 Years | 0 (0.0%) | 0 (0.0%) |
| 5 to 17 Years | 0 (0.0%) | 0 (0.0%) |
| 18 to 34 Years | 0 (0.0%) | 23 (10.5%) |
| 35 to 64 Years | 69 (7.0%) | 56 (7.2%) |
| 65 to 74 Years | 0 (0.0%) | 0 (0.0%) |
| 75 Years and over | 30 (38.0%) | 13 (16.1%) |
Disability Class: Cognitive Difficulty
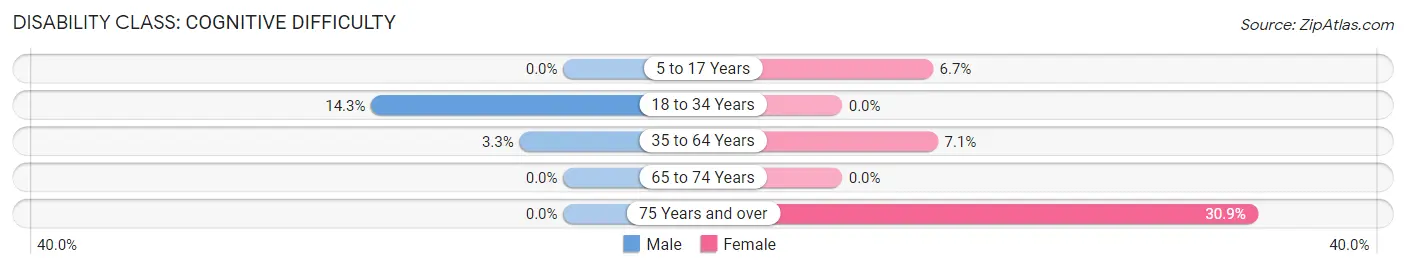
| Age Bracket | Male | Female |
| 5 to 17 Years | 0 (0.0%) | 32 (6.7%) |
| 18 to 34 Years | 78 (14.3%) | 0 (0.0%) |
| 35 to 64 Years | 32 (3.3%) | 55 (7.1%) |
| 65 to 74 Years | 0 (0.0%) | 0 (0.0%) |
| 75 Years and over | 0 (0.0%) | 25 (30.9%) |
Disability Class: Ambulatory Difficulty
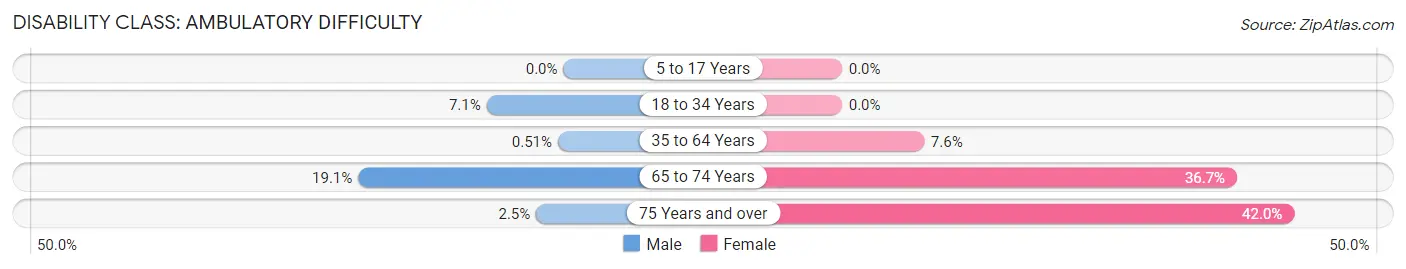
| Age Bracket | Male | Female |
| 5 to 17 Years | 0 (0.0%) | 0 (0.0%) |
| 18 to 34 Years | 39 (7.1%) | 0 (0.0%) |
| 35 to 64 Years | 5 (0.5%) | 59 (7.6%) |
| 65 to 74 Years | 28 (19.1%) | 66 (36.7%) |
| 75 Years and over | 2 (2.5%) | 34 (42.0%) |
Disability Class: Self-Care Difficulty
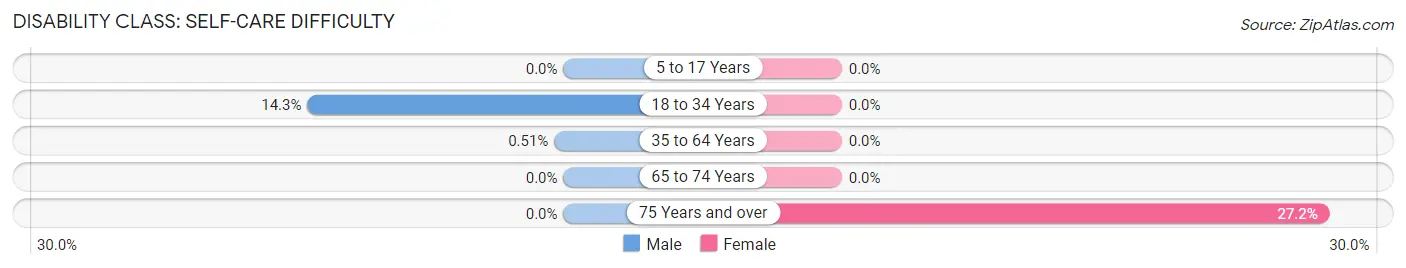
| Age Bracket | Male | Female |
| 5 to 17 Years | 0 (0.0%) | 0 (0.0%) |
| 18 to 34 Years | 78 (14.3%) | 0 (0.0%) |
| 35 to 64 Years | 5 (0.5%) | 0 (0.0%) |
| 65 to 74 Years | 0 (0.0%) | 0 (0.0%) |
| 75 Years and over | 0 (0.0%) | 22 (27.2%) |
Technology Access in Battle Mountain
Computing Device Access in Battle Mountain
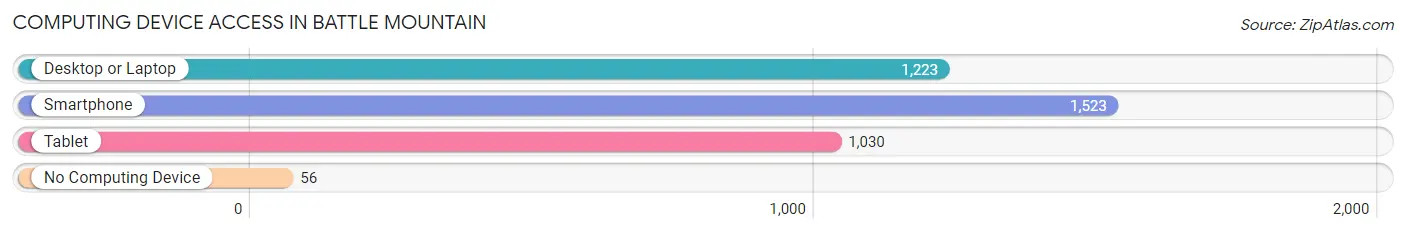
| Device Type | # Households | % Households |
| Desktop or Laptop | 1,223 | 72.1% |
| Smartphone | 1,523 | 89.7% |
| Tablet | 1,030 | 60.7% |
| No Computing Device | 56 | 3.3% |
| Total | 1,697 | 100.0% |
Internet Access in Battle Mountain
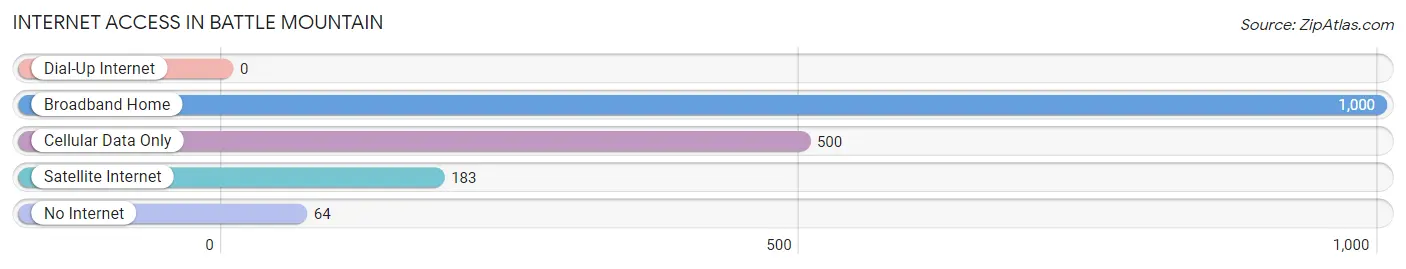
| Internet Type | # Households | % Households |
| Dial-Up Internet | 0 | 0.0% |
| Broadband Home | 1,000 | 58.9% |
| Cellular Data Only | 500 | 29.5% |
| Satellite Internet | 183 | 10.8% |
| No Internet | 64 | 3.8% |
| Total | 1,697 | 100.0% |
Battle Mountain Summary
History
The town of Battle Mountain, Nevada is located in the northern part of the state, in Lander County. It is situated at the intersection of Interstate 80 and U.S. Highway 95, and is the county seat of Lander County. The town was founded in 1869, when a group of prospectors discovered gold in the area. The town was originally called “Battle Mountain” because of the frequent skirmishes between the prospectors and the local Native American tribes.
The town was officially incorporated in 1873, and the population grew rapidly as more prospectors arrived in search of gold. The town was also a popular stop for travelers on the Central Pacific Railroad, which ran through the area. The town’s population peaked in the late 19th century, but began to decline in the early 20th century as the gold rush ended and the railroad was rerouted.
Geography
Battle Mountain is located in the northern part of Nevada, in Lander County. It is situated at the intersection of Interstate 80 and U.S. Highway 95, and is the county seat of Lander County. The town is located in the Great Basin Desert, and is surrounded by mountains and desert terrain. The town is located at an elevation of 4,902 feet, and has a total area of 4.3 square miles.
The climate in Battle Mountain is semi-arid, with hot summers and cold winters. The average high temperature in July is 92 degrees Fahrenheit, and the average low temperature in January is 18 degrees Fahrenheit. The town receives an average of 8.5 inches of precipitation per year, with most of it falling in the winter months.
Economy
The economy of Battle Mountain is largely based on mining and tourism. The town is home to several gold mines, and is also a popular destination for tourists who come to explore the area’s natural beauty. The town is also home to several businesses, including restaurants, hotels, and retail stores.
The town is also home to several government agencies, including the Bureau of Land Management, the U.S. Forest Service, and the Nevada Department of Transportation. The town is also home to a branch of the University of Nevada, Reno.
Demographics
As of the 2010 census, the population of Battle Mountain was 3,635. The population is largely white (83.3%), with smaller percentages of Hispanic (7.3%), African American (2.2%), and Native American (1.2%) residents. The median household income in the town is $41,944, and the median age is 37.
The town is home to several churches, including the Church of Jesus Christ of Latter-day Saints, the United Methodist Church, and the Catholic Church. The town is also home to several schools, including Battle Mountain High School, Battle Mountain Middle School, and Battle Mountain Elementary School.
Common Questions
What is Per Capita Income in Battle Mountain?
Per Capita income in Battle Mountain is $42,486.
What is the Median Family Income in Battle Mountain?
Median Family Income in Battle Mountain is $102,178.
What is the Median Household income in Battle Mountain?
Median Household Income in Battle Mountain is $99,962.
What is Income or Wage Gap in Battle Mountain?
Income or Wage Gap in Battle Mountain is 49.9%.
Women in Battle Mountain earn 50.1 cents for every dollar earned by a man.
What is Inequality or Gini Index in Battle Mountain?
Inequality or Gini Index in Battle Mountain is 0.41.
What is the Total Population of Battle Mountain?
Total Population of Battle Mountain is 4,187.
What is the Total Male Population of Battle Mountain?
Total Male Population of Battle Mountain is 2,340.
What is the Total Female Population of Battle Mountain?
Total Female Population of Battle Mountain is 1,847.
What is the Ratio of Males per 100 Females in Battle Mountain?
There are 126.69 Males per 100 Females in Battle Mountain.
What is the Ratio of Females per 100 Males in Battle Mountain?
There are 78.93 Females per 100 Males in Battle Mountain.
What is the Median Population Age in Battle Mountain?
Median Population Age in Battle Mountain is 41.1 Years.
What is the Average Family Size in Battle Mountain
Average Family Size in Battle Mountain is 3.0 People.
What is the Average Household Size in Battle Mountain
Average Household Size in Battle Mountain is 2.4 People.
How Large is the Labor Force in Battle Mountain?
There are 1,953 People in the Labor Forcein in Battle Mountain.
What is the Percentage of People in the Labor Force in Battle Mountain?
60.7% of People are in the Labor Force in Battle Mountain.
What is the Unemployment Rate in Battle Mountain?
Unemployment Rate in Battle Mountain is 15.2%.