Flaxton, ND Map & Demographics
Flaxton Map
Flaxton Overview
$32,134
PER CAPITA INCOME
0.37
INEQUALITY / GINI INDEX
44
TOTAL POPULATION
26
MALE POPULATION
18
FEMALE POPULATION
144.44
MALES / 100 FEMALES
69.23
FEMALES / 100 MALES
56.0
MEDIAN AGE
3.6
AVG FAMILY SIZE
1.7
AVG HOUSEHOLD SIZE
17
LABOR FORCE [ PEOPLE ]
44.7%
PERCENT IN LABOR FORCE
Flaxton Zip Codes
Flaxton Area Codes
Income in Flaxton
Income Overview in Flaxton
| Characteristic | Number | Measure |
| Per Capita Income | 44 | $32,134 |
| Median Family Income | 7 | $0 |
| Mean Family Income | 7 | $71,943 |
| Median Household Income | 26 | $0 |
| Mean Household Income | 26 | $53,481 |
| Income Deficit | 7 | $0 |
| Wage / Income Gap (%) | 44 | 0.00% |
| Wage / Income Gap ($) | 44 | 100.00¢ per $1 |
| Gini / Inequality Index | 44 | 0.37 |
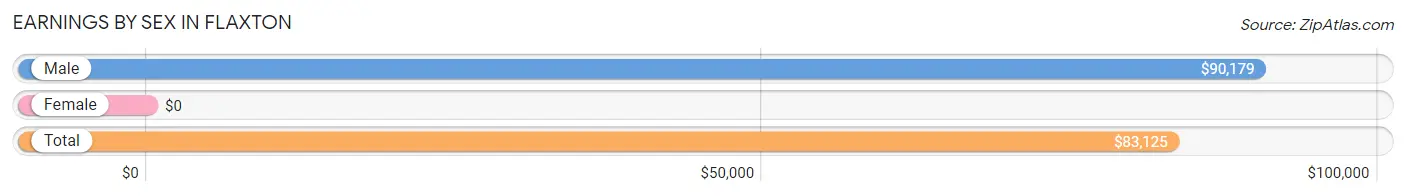
Earnings by Sex in Flaxton
| Sex | Number | Average Earnings |
| Male | 13 (76.5%) | $90,179 |
| Female | 4 (23.5%) | $0 |
| Total | 17 (100.0%) | $83,125 |
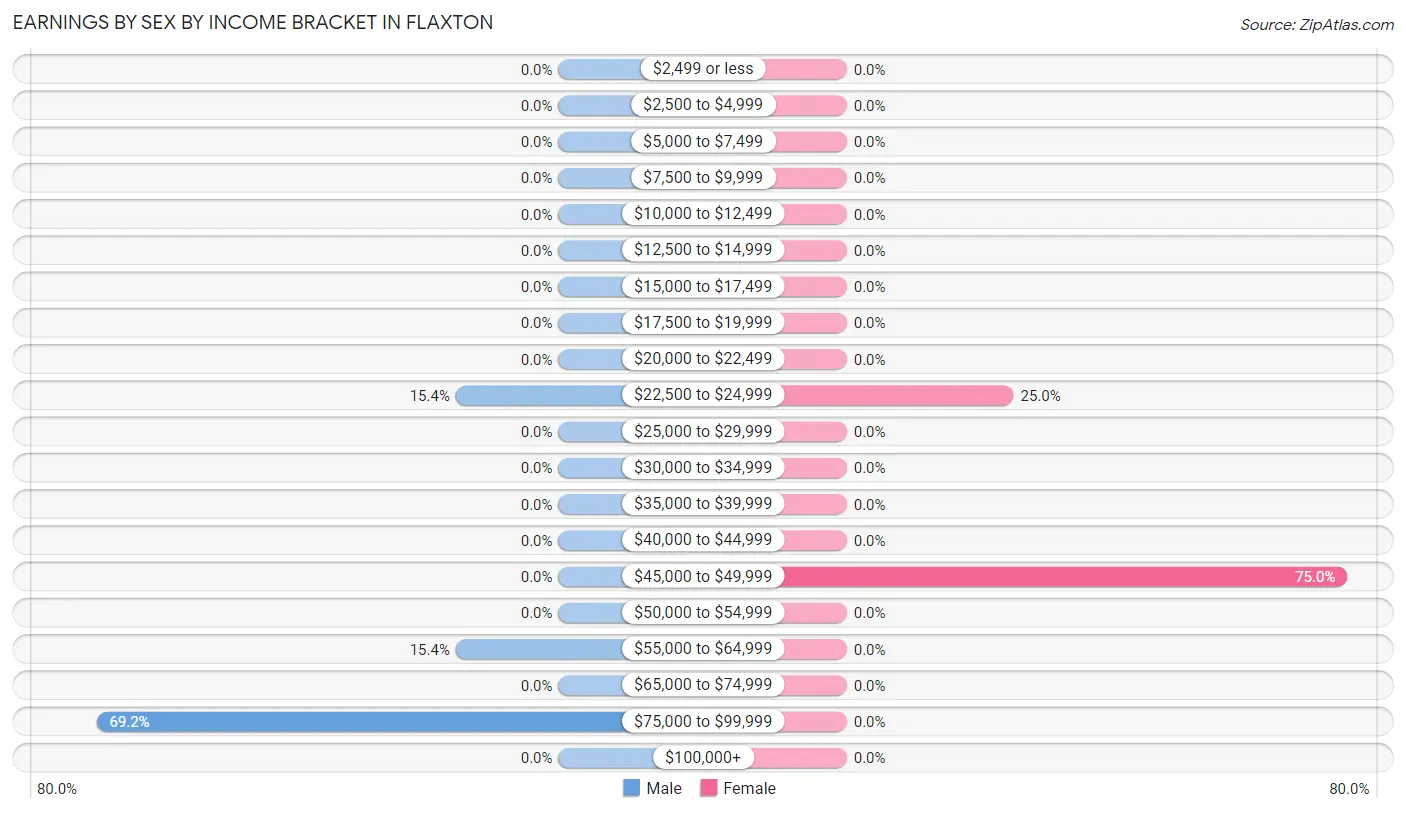
Earnings by Sex by Income Bracket in Flaxton
The most common earnings brackets in Flaxton are $75,000 to $99,999 for men (9 | 69.2%) and $45,000 to $49,999 for women (3 | 75.0%).
| Income | Male | Female |
| $2,499 or less | 0 (0.0%) | 0 (0.0%) |
| $2,500 to $4,999 | 0 (0.0%) | 0 (0.0%) |
| $5,000 to $7,499 | 0 (0.0%) | 0 (0.0%) |
| $7,500 to $9,999 | 0 (0.0%) | 0 (0.0%) |
| $10,000 to $12,499 | 0 (0.0%) | 0 (0.0%) |
| $12,500 to $14,999 | 0 (0.0%) | 0 (0.0%) |
| $15,000 to $17,499 | 0 (0.0%) | 0 (0.0%) |
| $17,500 to $19,999 | 0 (0.0%) | 0 (0.0%) |
| $20,000 to $22,499 | 0 (0.0%) | 0 (0.0%) |
| $22,500 to $24,999 | 2 (15.4%) | 1 (25.0%) |
| $25,000 to $29,999 | 0 (0.0%) | 0 (0.0%) |
| $30,000 to $34,999 | 0 (0.0%) | 0 (0.0%) |
| $35,000 to $39,999 | 0 (0.0%) | 0 (0.0%) |
| $40,000 to $44,999 | 0 (0.0%) | 0 (0.0%) |
| $45,000 to $49,999 | 0 (0.0%) | 3 (75.0%) |
| $50,000 to $54,999 | 0 (0.0%) | 0 (0.0%) |
| $55,000 to $64,999 | 2 (15.4%) | 0 (0.0%) |
| $65,000 to $74,999 | 0 (0.0%) | 0 (0.0%) |
| $75,000 to $99,999 | 9 (69.2%) | 0 (0.0%) |
| $100,000+ | 0 (0.0%) | 0 (0.0%) |
| Total | 13 (100.0%) | 4 (100.0%) |
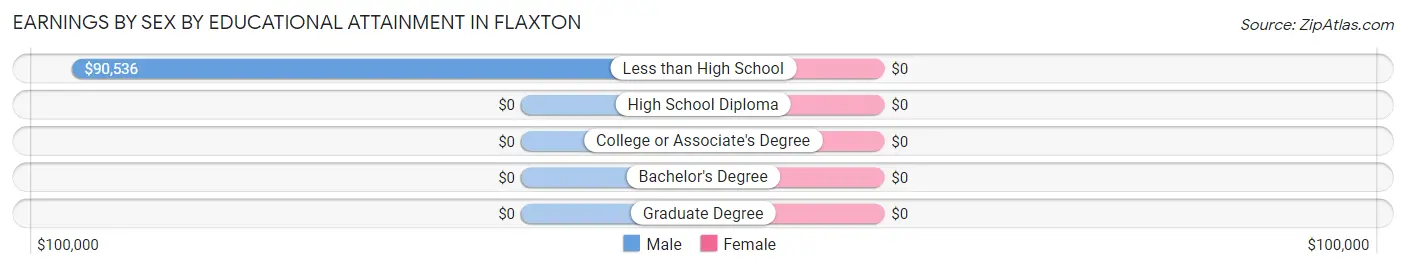
Earnings by Sex by Educational Attainment in Flaxton
| Educational Attainment | Male Income | Female Income |
| Less than High School | $90,536 | $0 |
| High School Diploma | - | - |
| College or Associate's Degree | - | - |
| Bachelor's Degree | - | - |
| Graduate Degree | - | - |
| Total | $90,179 | $0 |
Family Income in Flaxton
Family Income Brackets in Flaxton
According to the Flaxton family income data, there are 2 families falling into the $25,000 to $34,999 income range, which is the most common income bracket and makes up 28.6% of all families.
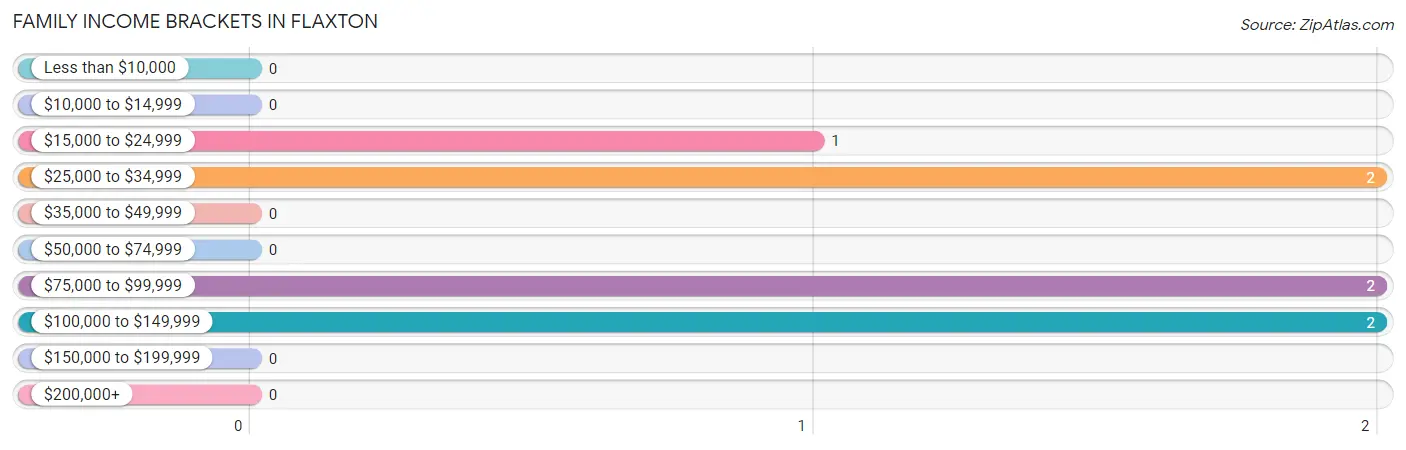
| Income Bracket | # Families | % Families |
| Less than $10,000 | 0 | 0.0% |
| $10,000 to $14,999 | 0 | 0.0% |
| $15,000 to $24,999 | 1 | 14.3% |
| $25,000 to $34,999 | 2 | 28.6% |
| $35,000 to $49,999 | 0 | 0.0% |
| $50,000 to $74,999 | 0 | 0.0% |
| $75,000 to $99,999 | 2 | 28.6% |
| $100,000 to $149,999 | 2 | 28.6% |
| $150,000 to $199,999 | 0 | 0.0% |
| $200,000+ | 0 | 0.0% |
Family Income by Famaliy Size in Flaxton
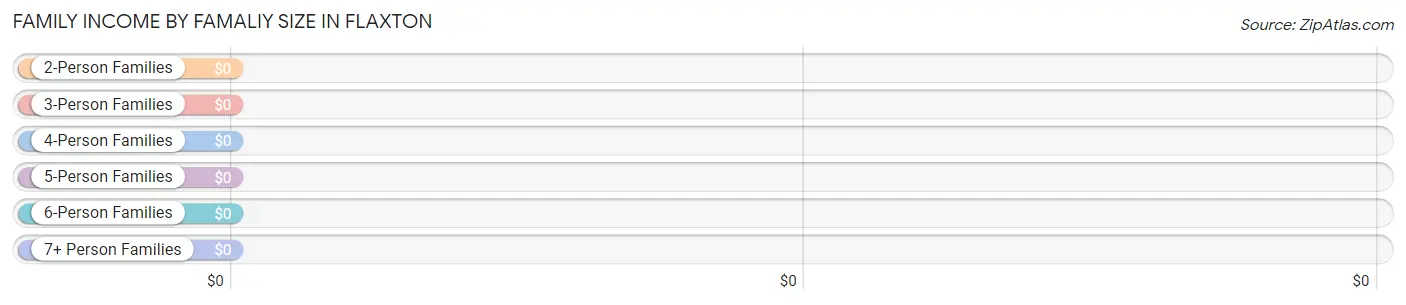
| Income Bracket | # Families | Median Income |
| 2-Person Families | 3 (42.9%) | $0 |
| 3-Person Families | 2 (28.6%) | $0 |
| 4-Person Families | 0 (0.0%) | $0 |
| 5-Person Families | 2 (28.6%) | $0 |
| 6-Person Families | 0 (0.0%) | $0 |
| 7+ Person Families | 0 (0.0%) | $0 |
| Total | 7 (100.0%) | $0 |
Family Income by Number of Earners in Flaxton
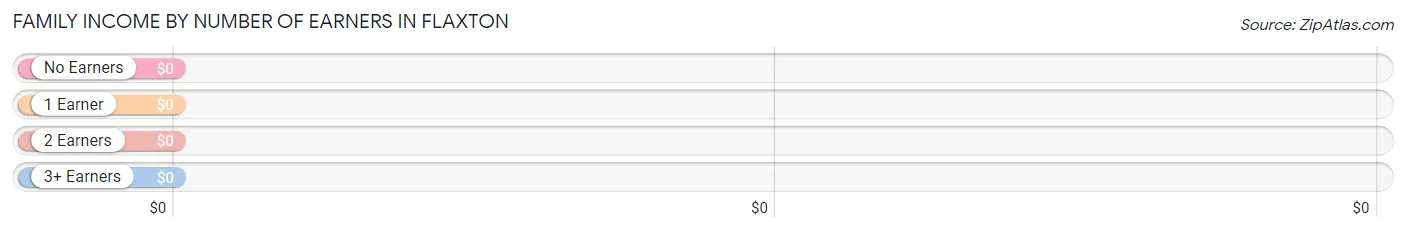
| Number of Earners | # Families | Median Income |
| No Earners | 1 (14.3%) | $0 |
| 1 Earner | 4 (57.1%) | $0 |
| 2 Earners | 0 (0.0%) | $0 |
| 3+ Earners | 2 (28.6%) | $0 |
| Total | 7 (100.0%) | $0 |
Household Income in Flaxton
Household Income Brackets in Flaxton
With 11 households falling in the category, the $15,000 to $24,999 income range is the most frequent in Flaxton, accounting for 42.3% of all households.
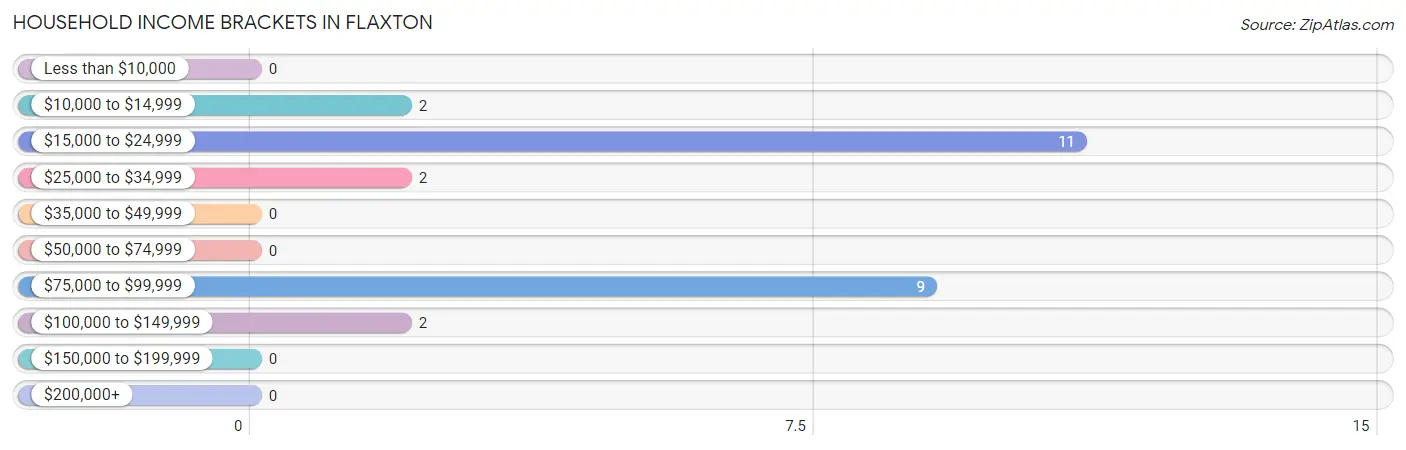
| Income Bracket | # Households | % Households |
| Less than $10,000 | 0 | 0.0% |
| $10,000 to $14,999 | 2 | 7.7% |
| $15,000 to $24,999 | 11 | 42.3% |
| $25,000 to $34,999 | 2 | 7.7% |
| $35,000 to $49,999 | 0 | 0.0% |
| $50,000 to $74,999 | 0 | 0.0% |
| $75,000 to $99,999 | 9 | 34.6% |
| $100,000 to $149,999 | 2 | 7.7% |
| $150,000 to $199,999 | 0 | 0.0% |
| $200,000+ | 0 | 0.0% |
Household Income by Householder Age in Flaxton
The median household income in Flaxton is $0, with the highest median household income of $91,071 found in the 45 to 64 years age bracket for the primary householder. A total of 12 households (46.2%) fall into this category.
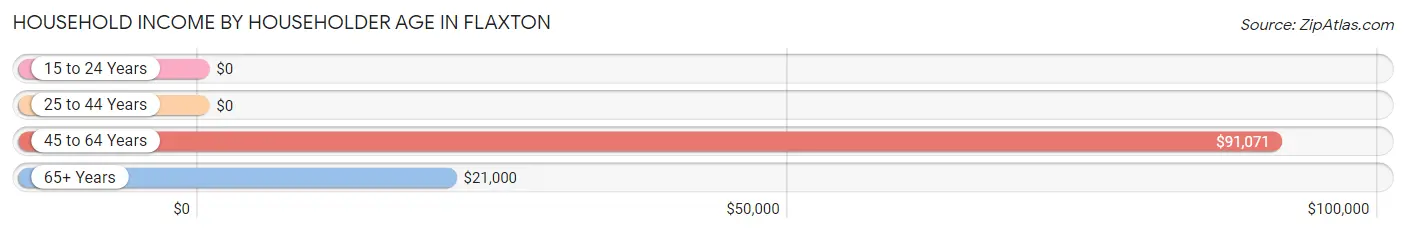
| Income Bracket | # Households | Median Income |
| 15 to 24 Years | 0 (0.0%) | $0 |
| 25 to 44 Years | 2 (7.7%) | $0 |
| 45 to 64 Years | 12 (46.2%) | $91,071 |
| 65+ Years | 12 (46.2%) | $21,000 |
| Total | 26 (100.0%) | $0 |
Poverty in Flaxton
Income Below Poverty by Sex and Age in Flaxton
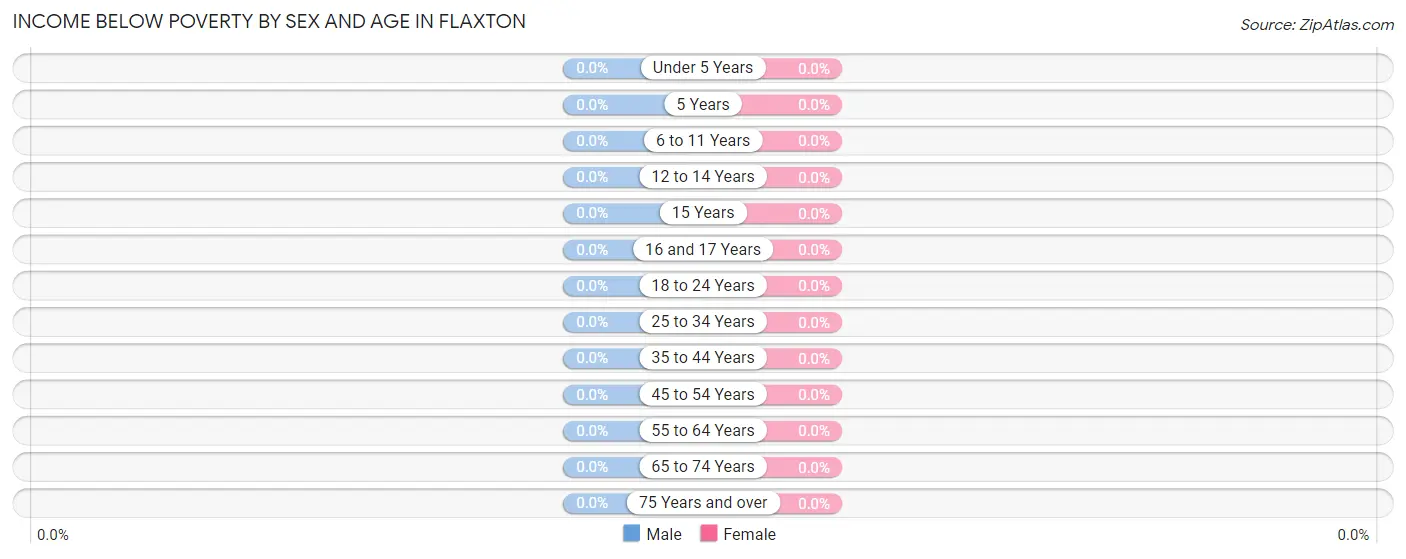
| Age Bracket | Male | Female |
| Under 5 Years | 0 (0.0%) | 0 (0.0%) |
| 5 Years | 0 (0.0%) | 0 (0.0%) |
| 6 to 11 Years | 0 (0.0%) | 0 (0.0%) |
| 12 to 14 Years | 0 (0.0%) | 0 (0.0%) |
| 15 Years | 0 (0.0%) | 0 (0.0%) |
| 16 and 17 Years | 0 (0.0%) | 0 (0.0%) |
| 18 to 24 Years | 0 (0.0%) | 0 (0.0%) |
| 25 to 34 Years | 0 (0.0%) | 0 (0.0%) |
| 35 to 44 Years | 0 (0.0%) | 0 (0.0%) |
| 45 to 54 Years | 0 (0.0%) | 0 (0.0%) |
| 55 to 64 Years | 0 (0.0%) | 0 (0.0%) |
| 65 to 74 Years | 0 (0.0%) | 0 (0.0%) |
| 75 Years and over | 0 (0.0%) | 0 (0.0%) |
| Total | 0 (0.0%) | 0 (0.0%) |
Income Above Poverty by Sex and Age in Flaxton
According to the poverty statistics in Flaxton, males aged under 5 years and females aged 6 to 11 years are the age groups that are most secure financially, with 100.0% of males and 100.0% of females in these age groups living above the poverty line.
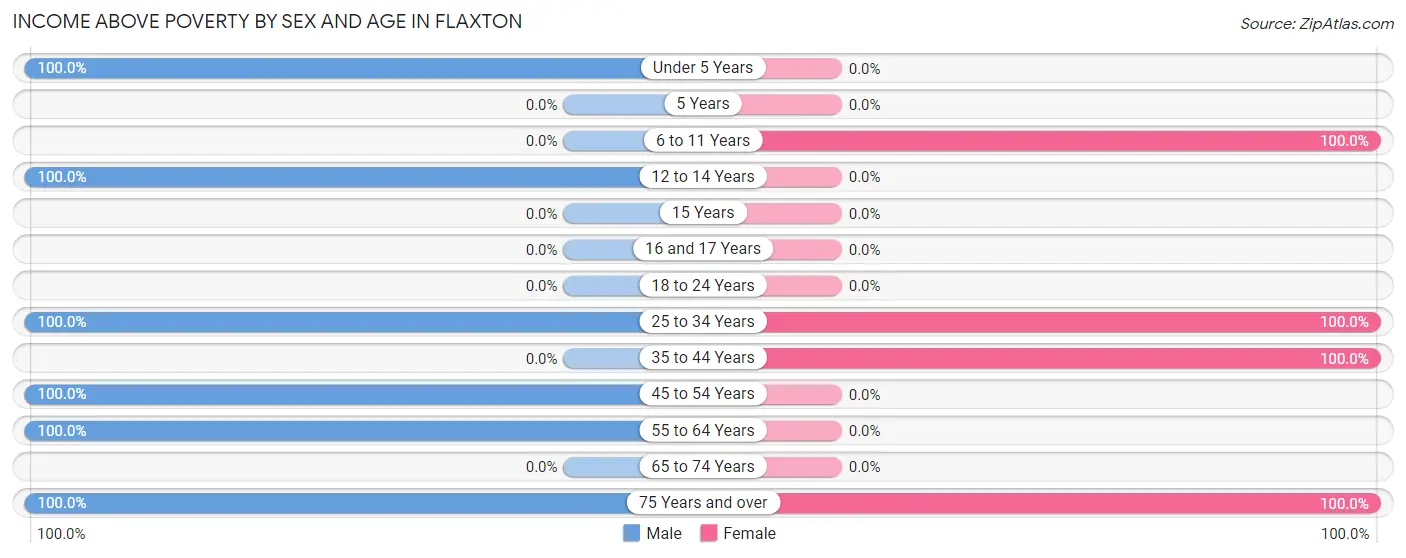
| Age Bracket | Male | Female |
| Under 5 Years | 2 (100.0%) | 0 (0.0%) |
| 5 Years | 0 (0.0%) | 0 (0.0%) |
| 6 to 11 Years | 0 (0.0%) | 2 (100.0%) |
| 12 to 14 Years | 2 (100.0%) | 0 (0.0%) |
| 15 Years | 0 (0.0%) | 0 (0.0%) |
| 16 and 17 Years | 0 (0.0%) | 0 (0.0%) |
| 18 to 24 Years | 0 (0.0%) | 0 (0.0%) |
| 25 to 34 Years | 4 (100.0%) | 5 (100.0%) |
| 35 to 44 Years | 0 (0.0%) | 4 (100.0%) |
| 45 to 54 Years | 1 (100.0%) | 0 (0.0%) |
| 55 to 64 Years | 11 (100.0%) | 0 (0.0%) |
| 65 to 74 Years | 0 (0.0%) | 0 (0.0%) |
| 75 Years and over | 6 (100.0%) | 7 (100.0%) |
| Total | 26 (100.0%) | 18 (100.0%) |
Income Below Poverty Among Married-Couple Families in Flaxton
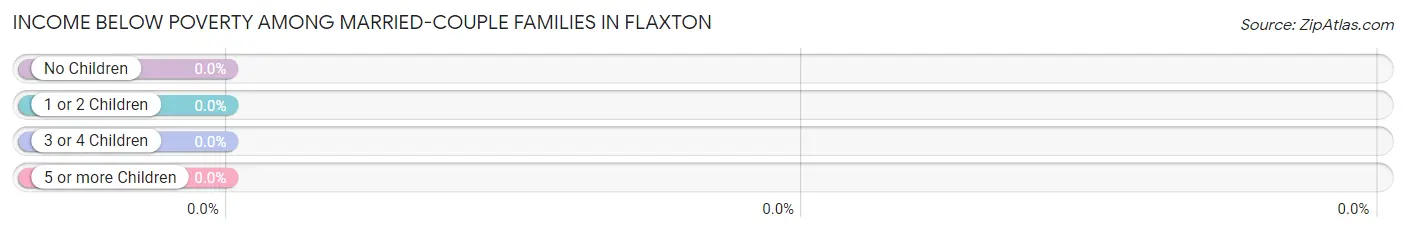
| Children | Above Poverty | Below Poverty |
| No Children | 4 (100.0%) | 0 (0.0%) |
| 1 or 2 Children | 0 (0.0%) | 0 (0.0%) |
| 3 or 4 Children | 2 (100.0%) | 0 (0.0%) |
| 5 or more Children | 0 (0.0%) | 0 (0.0%) |
| Total | 6 (100.0%) | 0 (0.0%) |
Income Below Poverty Among Single-Parent Households in Flaxton
| Children | Single Father | Single Mother |
| No Children | 0 (0.0%) | 0 (0.0%) |
| 1 or 2 Children | 0 (0.0%) | 0 (0.0%) |
| 3 or 4 Children | 0 (0.0%) | 0 (0.0%) |
| 5 or more Children | 0 (0.0%) | 0 (0.0%) |
| Total | 0 (0.0%) | 0 (0.0%) |
Income Below Poverty Among Married-Couple vs Single-Parent Households in Flaxton
| Children | Married-Couple Families | Single-Parent Households |
| No Children | 0 (0.0%) | 0 (0.0%) |
| 1 or 2 Children | 0 (0.0%) | 0 (0.0%) |
| 3 or 4 Children | 0 (0.0%) | 0 (0.0%) |
| 5 or more Children | 0 (0.0%) | 0 (0.0%) |
| Total | 0 (0.0%) | 0 (0.0%) |
Race in Flaxton
The most populous races in Flaxton are White / Caucasian (41 | 93.2%), and Asian (3 | 6.8%).
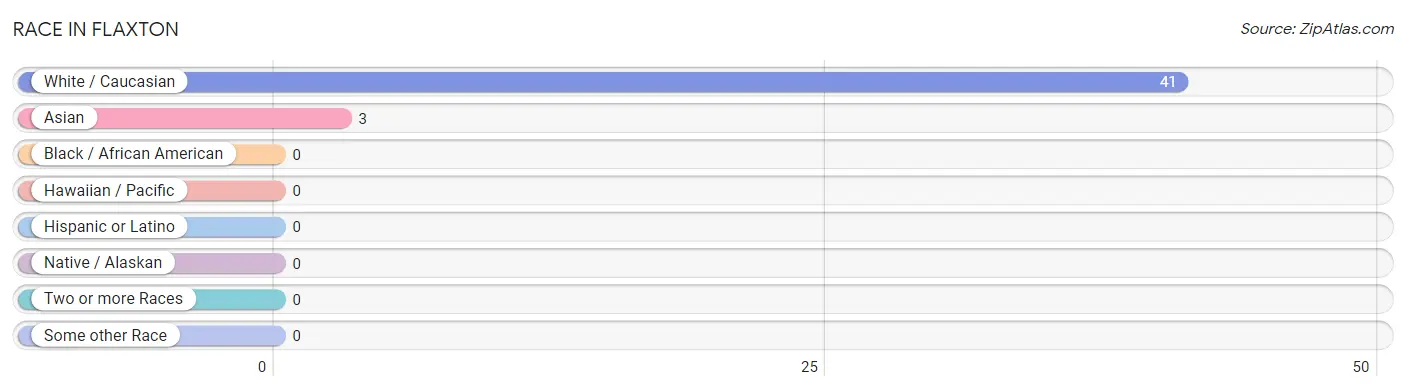
| Race | # Population | % Population |
| Asian | 3 | 6.8% |
| Black / African American | 0 | 0.0% |
| Hawaiian / Pacific | 0 | 0.0% |
| Hispanic or Latino | 0 | 0.0% |
| Native / Alaskan | 0 | 0.0% |
| White / Caucasian | 41 | 93.2% |
| Two or more Races | 0 | 0.0% |
| Some other Race | 0 | 0.0% |
| Total | 44 | 100.0% |
Ancestry in Flaxton
The most populous ancestries reported in Flaxton are Norwegian (7 | 15.9%), English (4 | 9.1%), European (3 | 6.8%), Korean (3 | 6.8%), and German (2 | 4.5%), together accounting for 43.2% of all Flaxton residents.
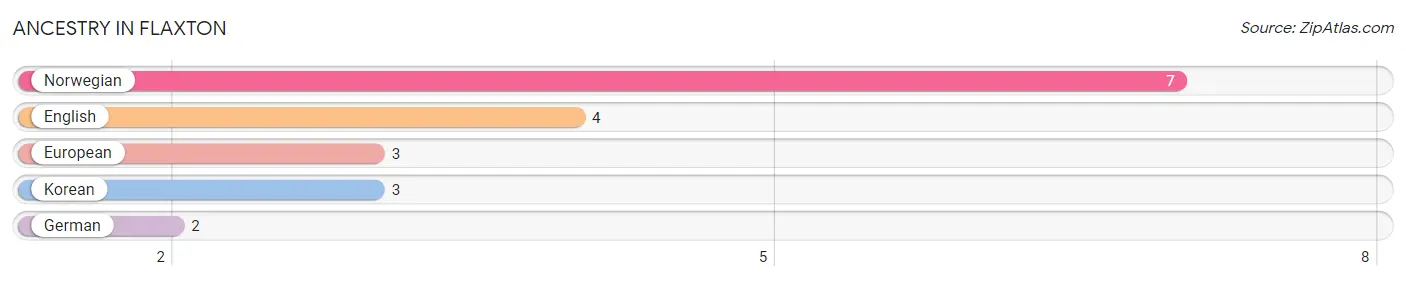
| Ancestry | # Population | % Population |
| English | 4 | 9.1% |
| European | 3 | 6.8% |
| German | 2 | 4.5% |
| Korean | 3 | 6.8% |
| Norwegian | 7 | 15.9% | View All 5 Rows |
Immigrants in Flaxton
The most numerous immigrant groups reported in Flaxton came from Asia (3 | 6.8%), Philippines (3 | 6.8%), and South Eastern Asia (3 | 6.8%), together accounting for 20.5% of all Flaxton residents.
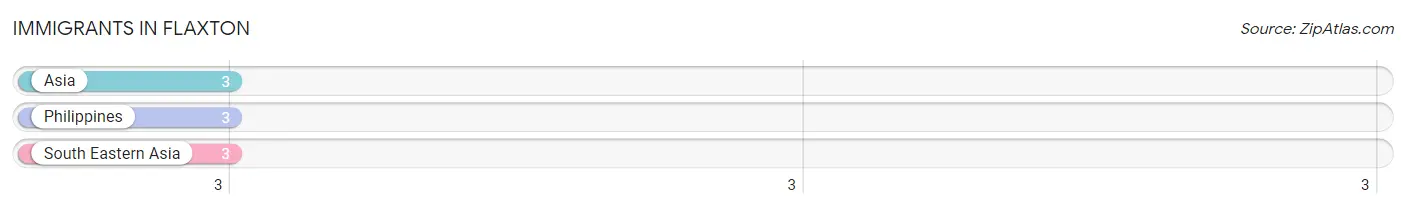
| Immigration Origin | # Population | % Population |
| Asia | 3 | 6.8% |
| Philippines | 3 | 6.8% |
| South Eastern Asia | 3 | 6.8% | View All 3 Rows |
Sex and Age in Flaxton
Sex and Age in Flaxton
The most populous age groups in Flaxton are 55 to 59 Years (11 | 42.3%) for men and 75 to 79 Years (6 | 33.3%) for women.
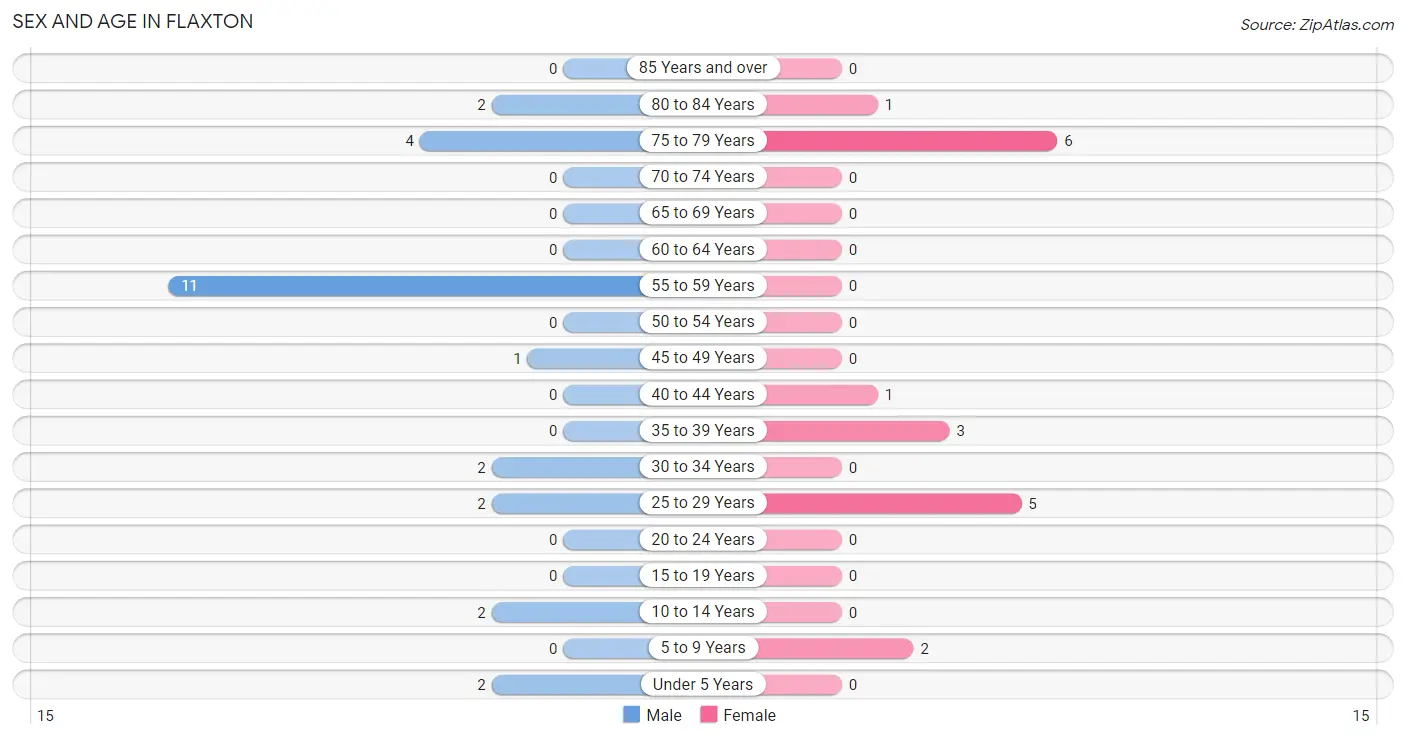
| Age Bracket | Male | Female |
| Under 5 Years | 2 (7.7%) | 0 (0.0%) |
| 5 to 9 Years | 0 (0.0%) | 2 (11.1%) |
| 10 to 14 Years | 2 (7.7%) | 0 (0.0%) |
| 15 to 19 Years | 0 (0.0%) | 0 (0.0%) |
| 20 to 24 Years | 0 (0.0%) | 0 (0.0%) |
| 25 to 29 Years | 2 (7.7%) | 5 (27.8%) |
| 30 to 34 Years | 2 (7.7%) | 0 (0.0%) |
| 35 to 39 Years | 0 (0.0%) | 3 (16.7%) |
| 40 to 44 Years | 0 (0.0%) | 1 (5.6%) |
| 45 to 49 Years | 1 (3.8%) | 0 (0.0%) |
| 50 to 54 Years | 0 (0.0%) | 0 (0.0%) |
| 55 to 59 Years | 11 (42.3%) | 0 (0.0%) |
| 60 to 64 Years | 0 (0.0%) | 0 (0.0%) |
| 65 to 69 Years | 0 (0.0%) | 0 (0.0%) |
| 70 to 74 Years | 0 (0.0%) | 0 (0.0%) |
| 75 to 79 Years | 4 (15.4%) | 6 (33.3%) |
| 80 to 84 Years | 2 (7.7%) | 1 (5.6%) |
| 85 Years and over | 0 (0.0%) | 0 (0.0%) |
| Total | 26 (100.0%) | 18 (100.0%) |
Families and Households in Flaxton
Median Family Size in Flaxton
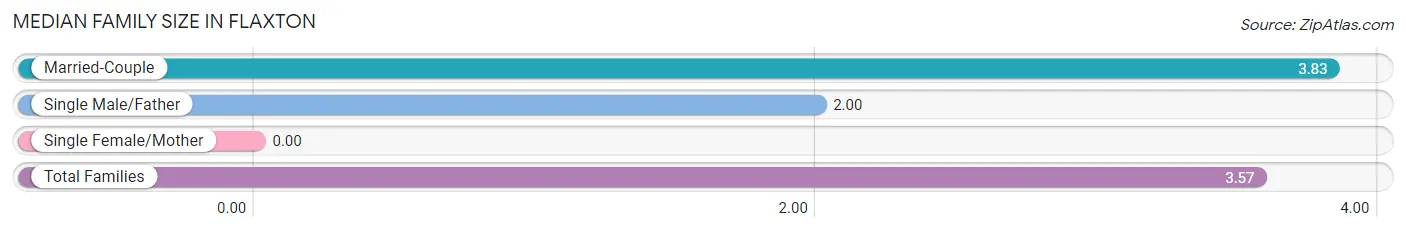
| Family Type | # Families | Family Size |
| Married-Couple | 6 (85.7%) | 3.83 |
| Single Male/Father | 1 (14.3%) | 2.00 |
| Single Female/Mother | 0 (0.0%) | - |
| Total Families | 7 (100.0%) | 3.57 |
Median Household Size in Flaxton
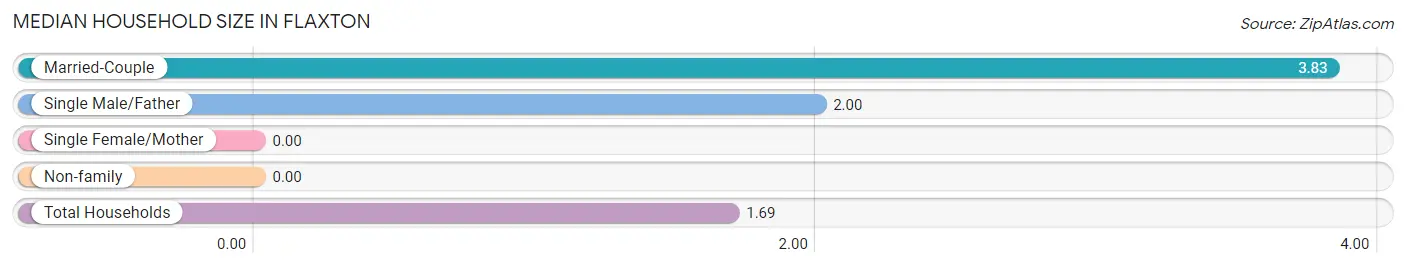
| Household Type | # Households | Household Size |
| Married-Couple | 6 (23.1%) | 3.83 |
| Single Male/Father | 1 (3.8%) | 2.00 |
| Single Female/Mother | 0 (0.0%) | - |
| Non-family | 19 (73.1%) | - |
| Total Households | 26 (100.0%) | 1.69 |
Household Size by Marriage Status in Flaxton
Out of a total of 26 households in Flaxton, 7 (26.9%) are family households, while 19 (73.1%) are nonfamily households. The most numerous type of family households are 2-person households, comprising 3, and the most common type of nonfamily households are 1-person households, comprising 19.
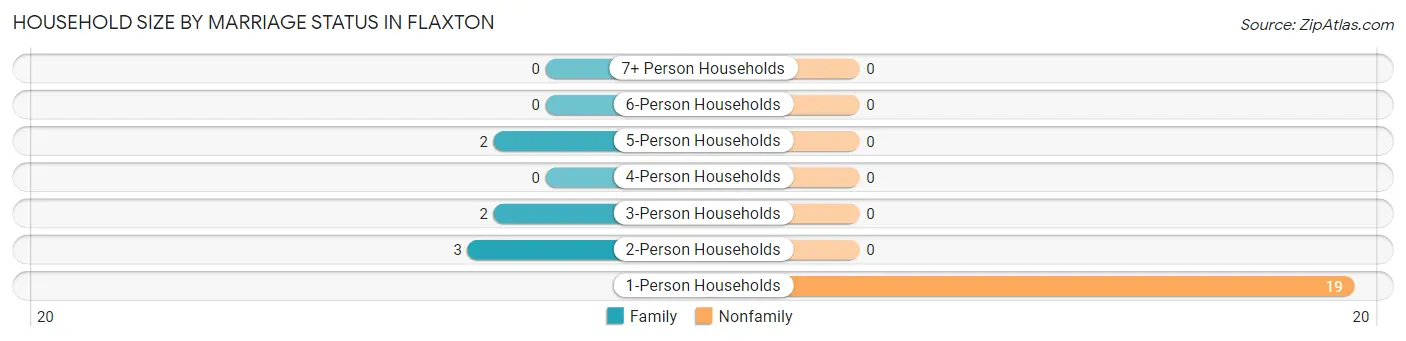
| Household Size | Family Households | Nonfamily Households |
| 1-Person Households | - | 19 (73.1%) |
| 2-Person Households | 3 (11.5%) | 0 (0.0%) |
| 3-Person Households | 2 (7.7%) | 0 (0.0%) |
| 4-Person Households | 0 (0.0%) | 0 (0.0%) |
| 5-Person Households | 2 (7.7%) | 0 (0.0%) |
| 6-Person Households | 0 (0.0%) | 0 (0.0%) |
| 7+ Person Households | 0 (0.0%) | 0 (0.0%) |
| Total | 7 (26.9%) | 19 (73.1%) |
Female Fertility in Flaxton
Fertility by Age in Flaxton
| Age Bracket | Women with Births | Births / 1,000 Women |
| 15 to 19 years | 0 (0.0%) | 0.0 |
| 20 to 34 years | 0 (0.0%) | 0.0 |
| 35 to 50 years | 0 (0.0%) | 0.0 |
| Total | 0 (0.0%) | 0.0 |
Fertility by Age by Marriage Status in Flaxton
| Age Bracket | Married | Unmarried |
| 15 to 19 years | 0 (0.0%) | 0 (0.0%) |
| 20 to 34 years | 0 (0.0%) | 0 (0.0%) |
| 35 to 50 years | 0 (0.0%) | 0 (0.0%) |
| Total | 0 (0.0%) | 0 (0.0%) |
Fertility by Education in Flaxton
| Educational Attainment | Women with Births | Births / 1,000 Women |
| Less than High School | 0 (0.0%) | 0.0 |
| High School Diploma | 0 (0.0%) | 0.0 |
| College or Associate's Degree | 0 (0.0%) | 0.0 |
| Bachelor's Degree | 0 (0.0%) | 0.0 |
| Graduate Degree | 0 (0.0%) | 0.0 |
| Total | 0 (0.0%) | 0.0 |
Fertility by Education by Marriage Status in Flaxton
| Educational Attainment | Married | Unmarried |
| Less than High School | 0 (0.0%) | 0 (0.0%) |
| High School Diploma | 0 (0.0%) | 0 (0.0%) |
| College or Associate's Degree | 0 (0.0%) | 0 (0.0%) |
| Bachelor's Degree | 0 (0.0%) | 0 (0.0%) |
| Graduate Degree | 0 (0.0%) | 0 (0.0%) |
| Total | 0 (0.0%) | 0 (0.0%) |
Employment Characteristics in Flaxton
Employment by Class of Employer in Flaxton
Among the 17 employed individuals in Flaxton, private company employees (15 | 88.2%), and local government employees (2 | 11.8%) make up the most common classes of employment.
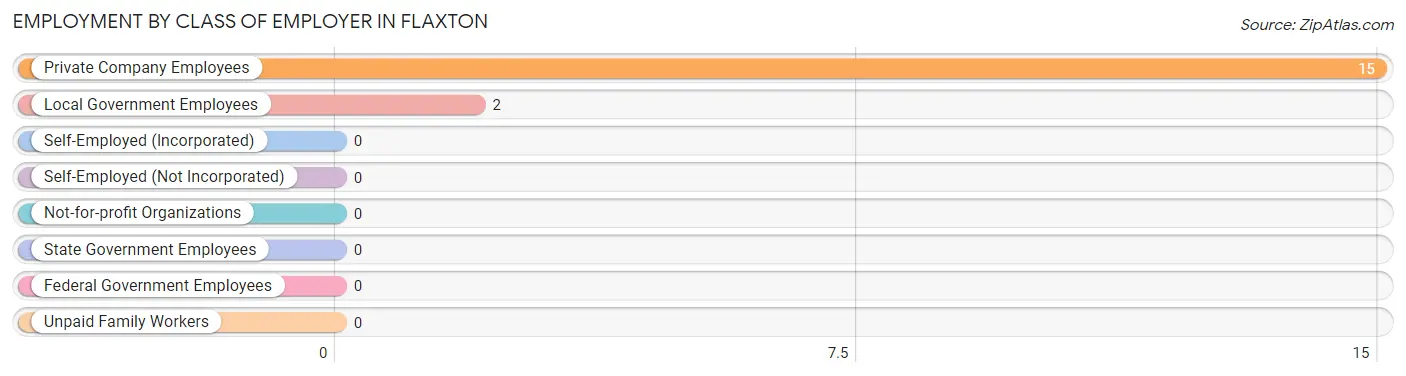
| Employer Class | # Employees | % Employees |
| Private Company Employees | 15 | 88.2% |
| Self-Employed (Incorporated) | 0 | 0.0% |
| Self-Employed (Not Incorporated) | 0 | 0.0% |
| Not-for-profit Organizations | 0 | 0.0% |
| Local Government Employees | 2 | 11.8% |
| State Government Employees | 0 | 0.0% |
| Federal Government Employees | 0 | 0.0% |
| Unpaid Family Workers | 0 | 0.0% |
| Total | 17 | 100.0% |
Employment Status by Age in Flaxton
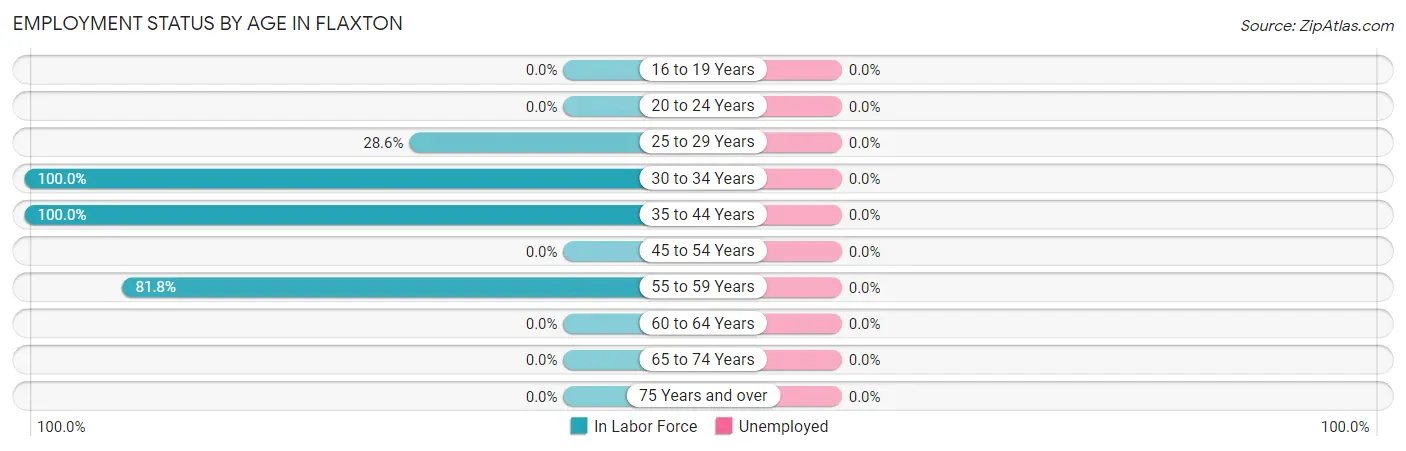
| Age Bracket | In Labor Force | Unemployed |
| 16 to 19 Years | 0 (0.0%) | 0 (0.0%) |
| 20 to 24 Years | 0 (0.0%) | 0 (0.0%) |
| 25 to 29 Years | 2 (28.6%) | 0 (0.0%) |
| 30 to 34 Years | 2 (100.0%) | 0 (0.0%) |
| 35 to 44 Years | 4 (100.0%) | 0 (0.0%) |
| 45 to 54 Years | 0 (0.0%) | 0 (0.0%) |
| 55 to 59 Years | 9 (81.8%) | 0 (0.0%) |
| 60 to 64 Years | 0 (0.0%) | 0 (0.0%) |
| 65 to 74 Years | 0 (0.0%) | 0 (0.0%) |
| 75 Years and over | 0 (0.0%) | 0 (0.0%) |
| Total | 17 (44.7%) | 0 (0.0%) |
Employment Status by Educational Attainment in Flaxton
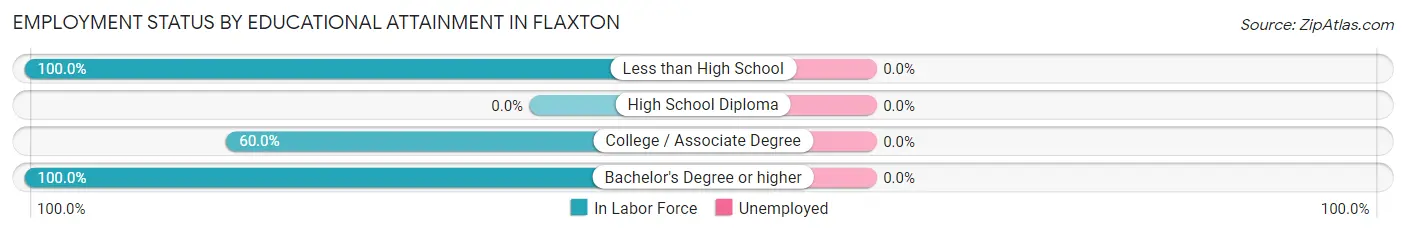
| Educational Attainment | In Labor Force | Unemployed |
| Less than High School | 11 (100.0%) | 0 (0.0%) |
| High School Diploma | 0 (0.0%) | 0 (0.0%) |
| College / Associate Degree | 3 (60.0%) | 0 (0.0%) |
| Bachelor's Degree or higher | 3 (100.0%) | 0 (0.0%) |
| Total | 17 (68.0%) | 0 (0.0%) |
Employment Occupations by Sex in Flaxton
Management, Business, Science and Arts Occupations
Management, Business, Science and Arts Occupations by Sex
| Occupation | Male | Female |
| Management | 0 (0.0%) | 0 (0.0%) |
| Business & Financial | 0 (0.0%) | 0 (0.0%) |
| Computers, Engineering & Science | 0 (0.0%) | 0 (0.0%) |
| Computers & Mathematics | 0 (0.0%) | 0 (0.0%) |
| Architecture & Engineering | 0 (0.0%) | 0 (0.0%) |
| Life, Physical & Social Science | 0 (0.0%) | 0 (0.0%) |
| Community & Social Service | 0 (0.0%) | 0 (0.0%) |
| Education, Arts & Media | 0 (0.0%) | 0 (0.0%) |
| Legal Services & Support | 0 (0.0%) | 0 (0.0%) |
| Education Instruction & Library | 0 (0.0%) | 0 (0.0%) |
| Arts, Media & Entertainment | 0 (0.0%) | 0 (0.0%) |
| Health Diagnosing & Treating | 0 (0.0%) | 0 (0.0%) |
| Health Technologists | 0 (0.0%) | 0 (0.0%) |
| Total (Category) | 0 (0.0%) | 0 (0.0%) |
| Total (Overall) | 13 (76.5%) | 4 (23.5%) |
Services Occupations
The most common Services occupations in Flaxton are , and Food Preparation & Serving (3 | 17.6%).
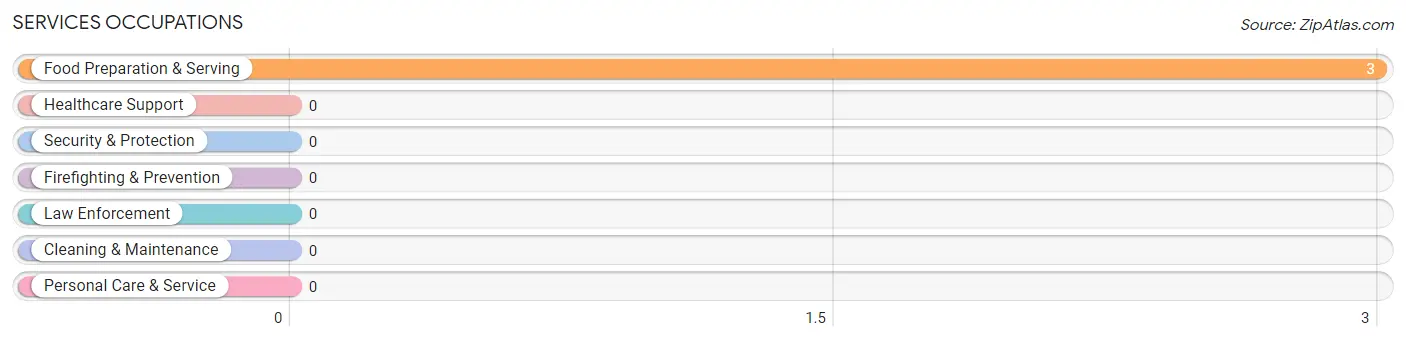
Services Occupations by Sex
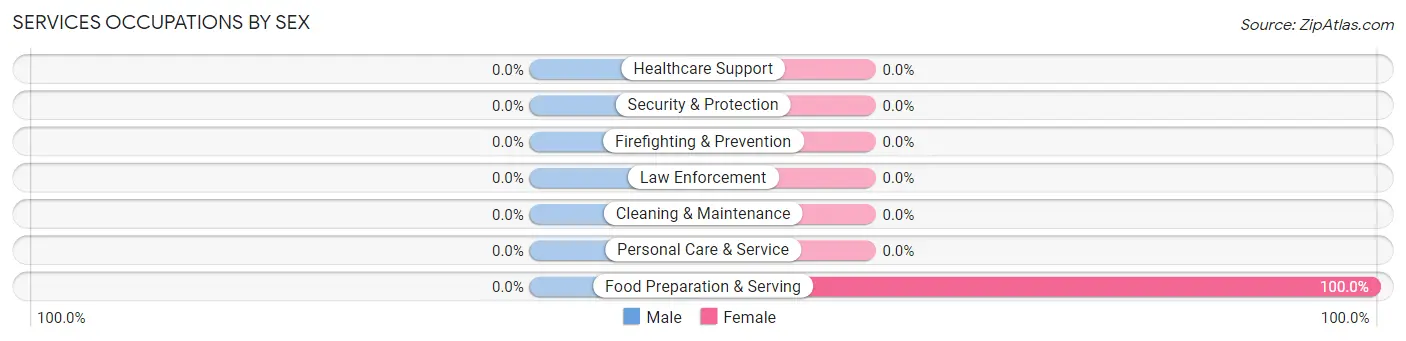
| Occupation | Male | Female |
| Healthcare Support | 0 (0.0%) | 0 (0.0%) |
| Security & Protection | 0 (0.0%) | 0 (0.0%) |
| Firefighting & Prevention | 0 (0.0%) | 0 (0.0%) |
| Law Enforcement | 0 (0.0%) | 0 (0.0%) |
| Food Preparation & Serving | 0 (0.0%) | 3 (100.0%) |
| Cleaning & Maintenance | 0 (0.0%) | 0 (0.0%) |
| Personal Care & Service | 0 (0.0%) | 0 (0.0%) |
| Total (Category) | 0 (0.0%) | 3 (100.0%) |
| Total (Overall) | 13 (76.5%) | 4 (23.5%) |
Sales and Office Occupations
The most common Sales and Office occupations in Flaxton are , and Sales & Related (3 | 17.6%).
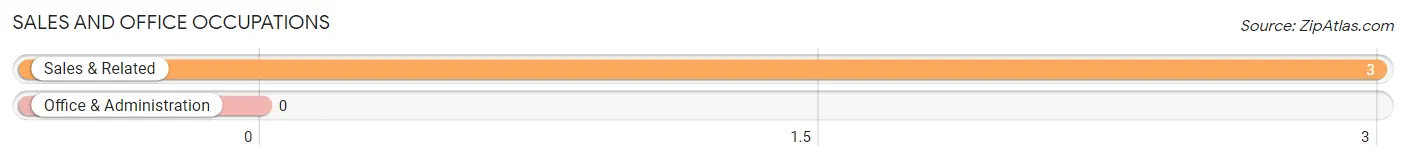
Sales and Office Occupations by Sex
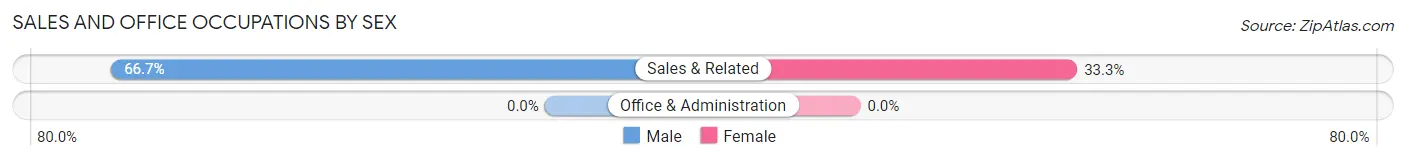
| Occupation | Male | Female |
| Sales & Related | 2 (66.7%) | 1 (33.3%) |
| Office & Administration | 0 (0.0%) | 0 (0.0%) |
| Total (Category) | 2 (66.7%) | 1 (33.3%) |
| Total (Overall) | 13 (76.5%) | 4 (23.5%) |
Natural Resources, Construction and Maintenance Occupations
The most common Natural Resources, Construction and Maintenance occupations in Flaxton are Construction & Extraction (2 | 11.8%), and Installation, Maintenance & Repair (2 | 11.8%).
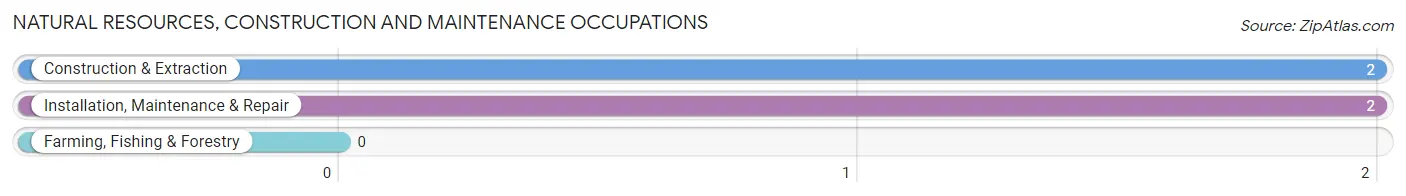
Natural Resources, Construction and Maintenance Occupations by Sex
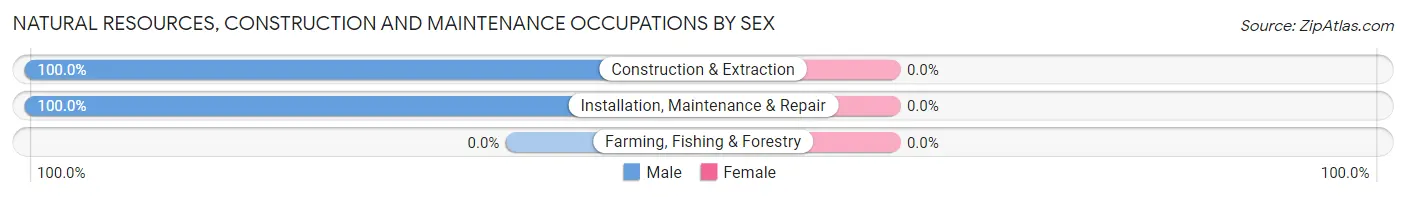
| Occupation | Male | Female |
| Farming, Fishing & Forestry | 0 (0.0%) | 0 (0.0%) |
| Construction & Extraction | 2 (100.0%) | 0 (0.0%) |
| Installation, Maintenance & Repair | 2 (100.0%) | 0 (0.0%) |
| Total (Category) | 4 (100.0%) | 0 (0.0%) |
| Total (Overall) | 13 (76.5%) | 4 (23.5%) |
Production, Transportation and Moving Occupations
The most common Production, Transportation and Moving occupations in Flaxton are , and Transportation (7 | 41.2%).
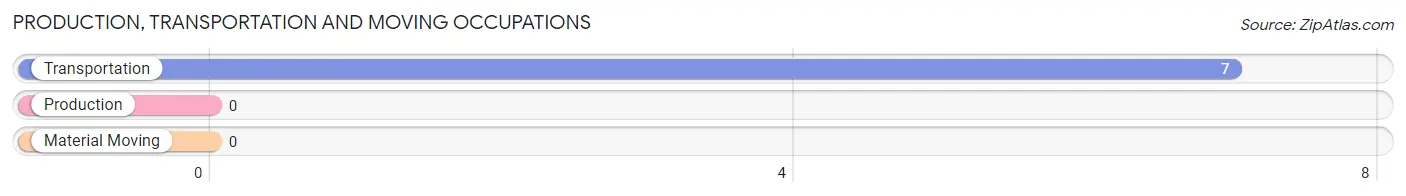
Production, Transportation and Moving Occupations by Sex
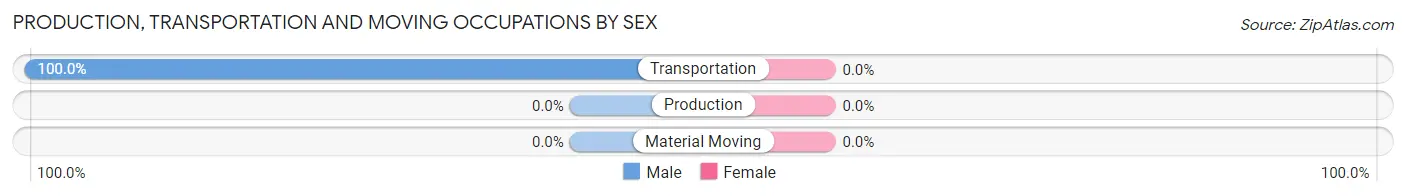
| Occupation | Male | Female |
| Production | 0 (0.0%) | 0 (0.0%) |
| Transportation | 7 (100.0%) | 0 (0.0%) |
| Material Moving | 0 (0.0%) | 0 (0.0%) |
| Total (Category) | 7 (100.0%) | 0 (0.0%) |
| Total (Overall) | 13 (76.5%) | 4 (23.5%) |
Employment Industries by Sex in Flaxton
Employment Industries in Flaxton
The major employment industries in Flaxton include Mining, Quarrying, & Extraction (9 | 52.9%), Retail Trade (6 | 35.3%), and Construction (2 | 11.8%).
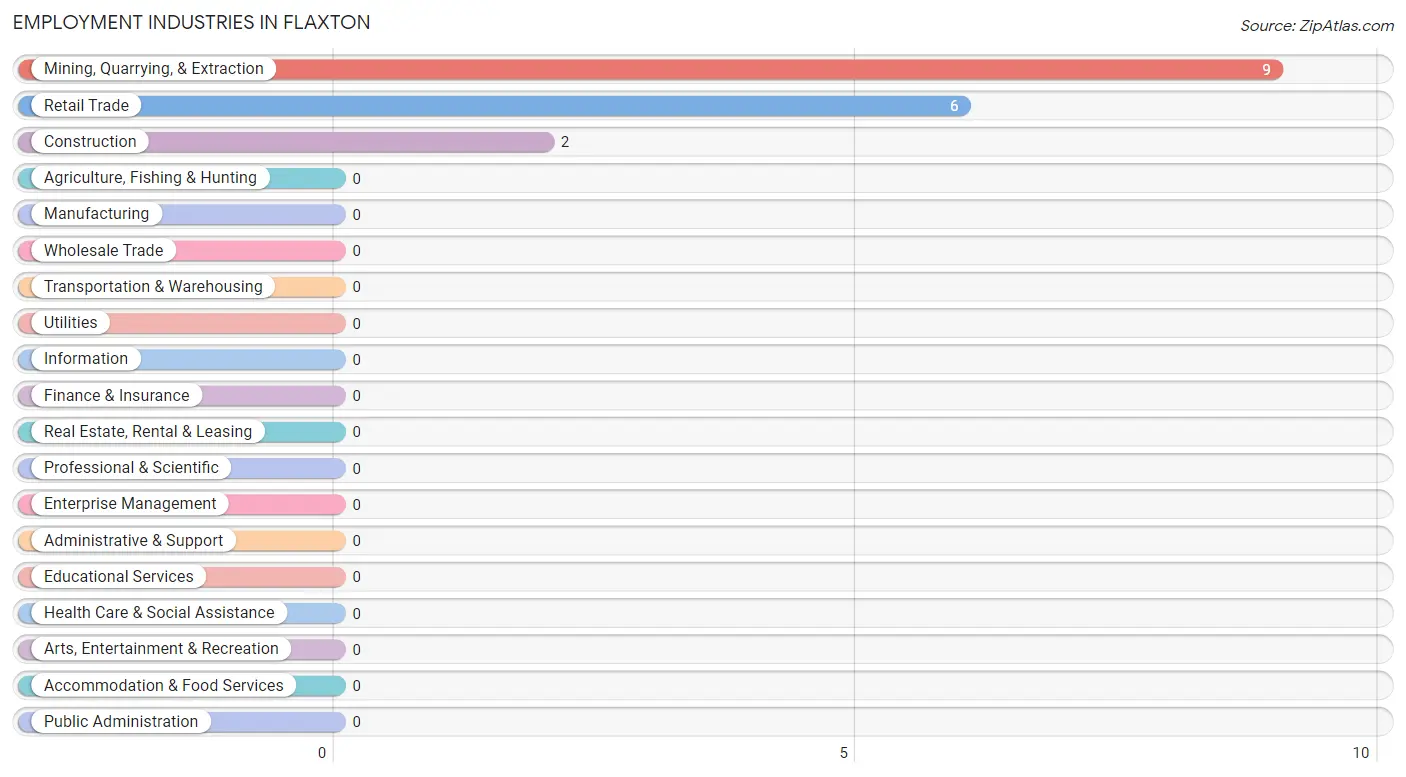
Employment Industries by Sex in Flaxton
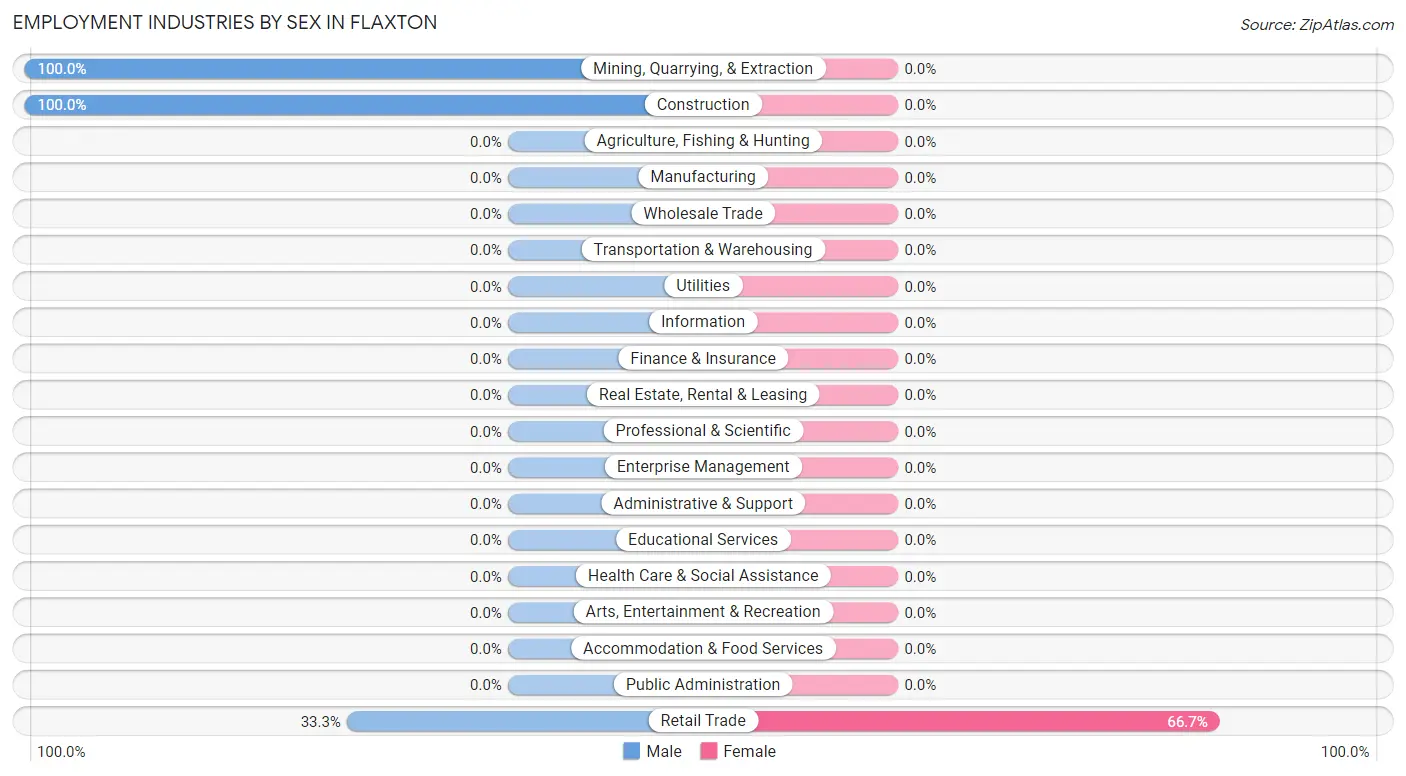
| Industry | Male | Female |
| Agriculture, Fishing & Hunting | 0 (0.0%) | 0 (0.0%) |
| Mining, Quarrying, & Extraction | 9 (100.0%) | 0 (0.0%) |
| Construction | 2 (100.0%) | 0 (0.0%) |
| Manufacturing | 0 (0.0%) | 0 (0.0%) |
| Wholesale Trade | 0 (0.0%) | 0 (0.0%) |
| Retail Trade | 2 (33.3%) | 4 (66.7%) |
| Transportation & Warehousing | 0 (0.0%) | 0 (0.0%) |
| Utilities | 0 (0.0%) | 0 (0.0%) |
| Information | 0 (0.0%) | 0 (0.0%) |
| Finance & Insurance | 0 (0.0%) | 0 (0.0%) |
| Real Estate, Rental & Leasing | 0 (0.0%) | 0 (0.0%) |
| Professional & Scientific | 0 (0.0%) | 0 (0.0%) |
| Enterprise Management | 0 (0.0%) | 0 (0.0%) |
| Administrative & Support | 0 (0.0%) | 0 (0.0%) |
| Educational Services | 0 (0.0%) | 0 (0.0%) |
| Health Care & Social Assistance | 0 (0.0%) | 0 (0.0%) |
| Arts, Entertainment & Recreation | 0 (0.0%) | 0 (0.0%) |
| Accommodation & Food Services | 0 (0.0%) | 0 (0.0%) |
| Public Administration | 0 (0.0%) | 0 (0.0%) |
| Total | 13 (76.5%) | 4 (23.5%) |
Education in Flaxton
School Enrollment in Flaxton
The most common levels of schooling among the 4 students in Flaxton are kindergarten (2 | 50.0%), and middle school (2 | 50.0%).
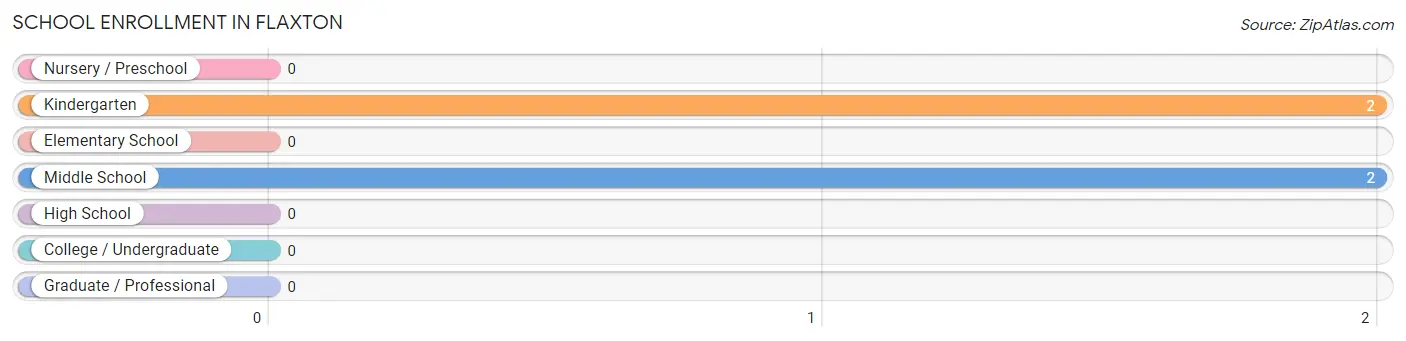
| School Level | # Students | % Students |
| Nursery / Preschool | 0 | 0.0% |
| Kindergarten | 2 | 50.0% |
| Elementary School | 0 | 0.0% |
| Middle School | 2 | 50.0% |
| High School | 0 | 0.0% |
| College / Undergraduate | 0 | 0.0% |
| Graduate / Professional | 0 | 0.0% |
| Total | 4 | 100.0% |
School Enrollment by Age by Funding Source in Flaxton
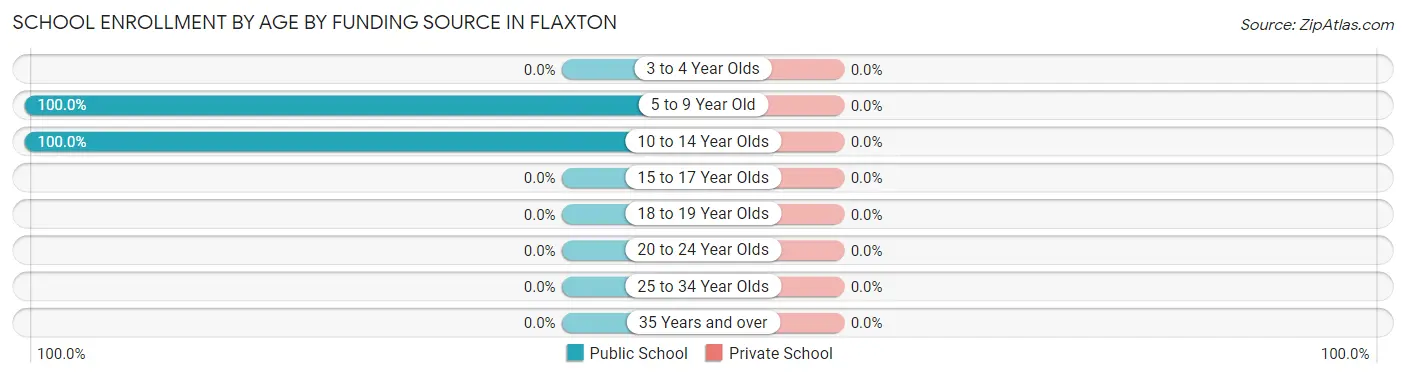
| Age Bracket | Public School | Private School |
| 3 to 4 Year Olds | 0 (0.0%) | 0 (0.0%) |
| 5 to 9 Year Old | 2 (100.0%) | 0 (0.0%) |
| 10 to 14 Year Olds | 2 (100.0%) | 0 (0.0%) |
| 15 to 17 Year Olds | 0 (0.0%) | 0 (0.0%) |
| 18 to 19 Year Olds | 0 (0.0%) | 0 (0.0%) |
| 20 to 24 Year Olds | 0 (0.0%) | 0 (0.0%) |
| 25 to 34 Year Olds | 0 (0.0%) | 0 (0.0%) |
| 35 Years and over | 0 (0.0%) | 0 (0.0%) |
| Total | 4 (100.0%) | 0 (0.0%) |
Educational Attainment by Field of Study in Flaxton
Education (4 | 57.1%), and communications (3 | 42.9%) are the most common fields of study among 7 individuals in Flaxton who have obtained a bachelor's degree or higher.
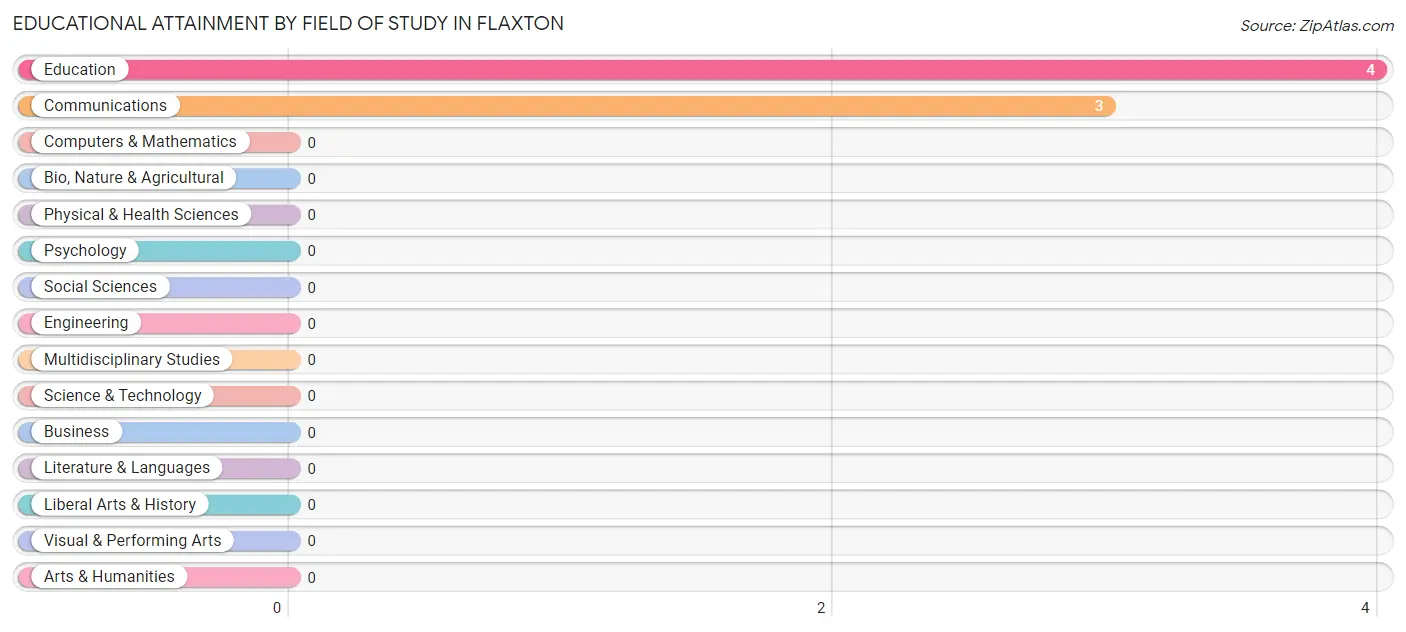
| Field of Study | # Graduates | % Graduates |
| Computers & Mathematics | 0 | 0.0% |
| Bio, Nature & Agricultural | 0 | 0.0% |
| Physical & Health Sciences | 0 | 0.0% |
| Psychology | 0 | 0.0% |
| Social Sciences | 0 | 0.0% |
| Engineering | 0 | 0.0% |
| Multidisciplinary Studies | 0 | 0.0% |
| Science & Technology | 0 | 0.0% |
| Business | 0 | 0.0% |
| Education | 4 | 57.1% |
| Literature & Languages | 0 | 0.0% |
| Liberal Arts & History | 0 | 0.0% |
| Visual & Performing Arts | 0 | 0.0% |
| Communications | 3 | 42.9% |
| Arts & Humanities | 0 | 0.0% |
| Total | 7 | 100.0% |
Transportation & Commute in Flaxton
Vehicle Availability by Sex in Flaxton
The most prevalent vehicle ownership categories in Flaxton are males with 1 vehicle (9, accounting for 69.2%) and females with 1 vehicle (1, making up 225.0%).
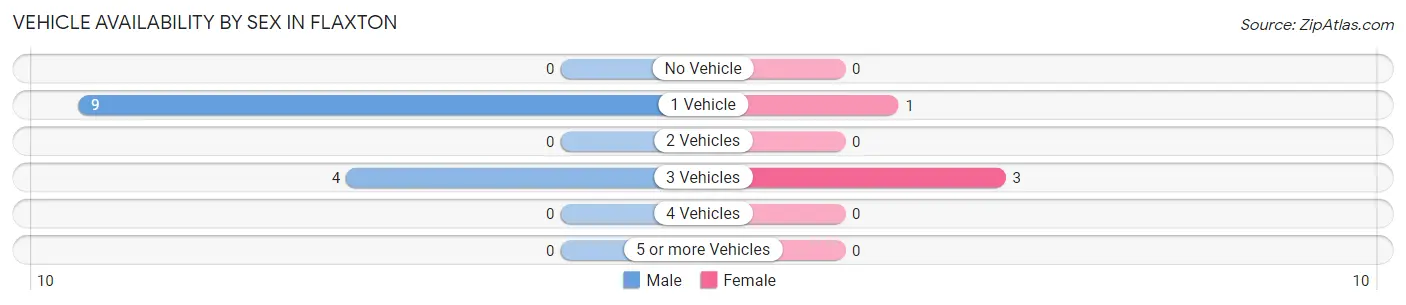
| Vehicles Available | Male | Female |
| No Vehicle | 0 (0.0%) | 0 (0.0%) |
| 1 Vehicle | 9 (69.2%) | 1 (25.0%) |
| 2 Vehicles | 0 (0.0%) | 0 (0.0%) |
| 3 Vehicles | 4 (30.8%) | 3 (75.0%) |
| 4 Vehicles | 0 (0.0%) | 0 (0.0%) |
| 5 or more Vehicles | 0 (0.0%) | 0 (0.0%) |
| Total | 13 (100.0%) | 4 (100.0%) |
Commute Time in Flaxton
The most frequently occuring commute durations in Flaxton are 10 to 14 minutes (9 commuters, 52.9%), 20 to 24 minutes (6 commuters, 35.3%), and 15 to 19 minutes (2 commuters, 11.8%).
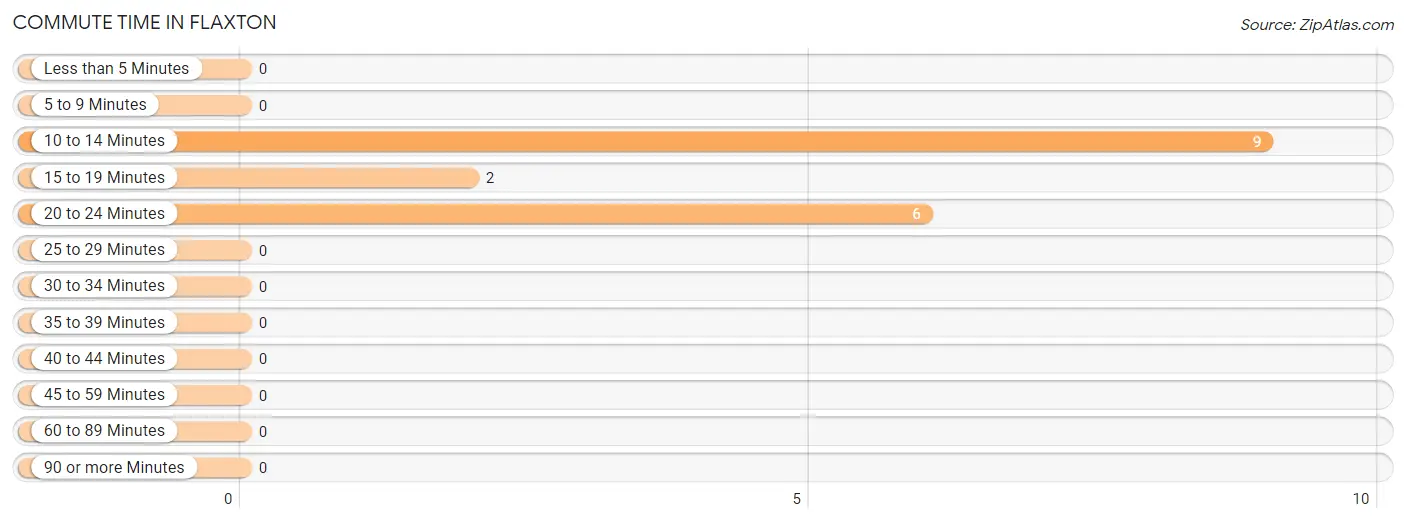
| Commute Time | # Commuters | % Commuters |
| Less than 5 Minutes | 0 | 0.0% |
| 5 to 9 Minutes | 0 | 0.0% |
| 10 to 14 Minutes | 9 | 52.9% |
| 15 to 19 Minutes | 2 | 11.8% |
| 20 to 24 Minutes | 6 | 35.3% |
| 25 to 29 Minutes | 0 | 0.0% |
| 30 to 34 Minutes | 0 | 0.0% |
| 35 to 39 Minutes | 0 | 0.0% |
| 40 to 44 Minutes | 0 | 0.0% |
| 45 to 59 Minutes | 0 | 0.0% |
| 60 to 89 Minutes | 0 | 0.0% |
| 90 or more Minutes | 0 | 0.0% |
Commute Time by Sex in Flaxton
The most common commute times in Flaxton are 10 to 14 minutes (9 commuters, 69.2%) for males and 20 to 24 minutes (4 commuters, 100.0%) for females.
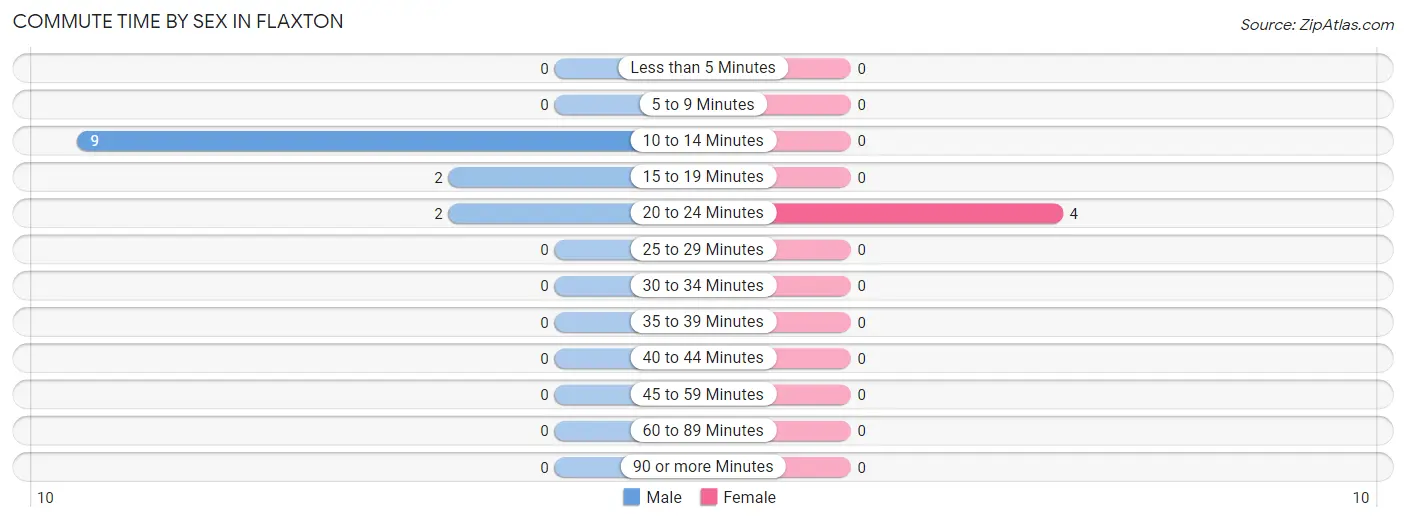
| Commute Time | Male | Female |
| Less than 5 Minutes | 0 (0.0%) | 0 (0.0%) |
| 5 to 9 Minutes | 0 (0.0%) | 0 (0.0%) |
| 10 to 14 Minutes | 9 (69.2%) | 0 (0.0%) |
| 15 to 19 Minutes | 2 (15.4%) | 0 (0.0%) |
| 20 to 24 Minutes | 2 (15.4%) | 4 (100.0%) |
| 25 to 29 Minutes | 0 (0.0%) | 0 (0.0%) |
| 30 to 34 Minutes | 0 (0.0%) | 0 (0.0%) |
| 35 to 39 Minutes | 0 (0.0%) | 0 (0.0%) |
| 40 to 44 Minutes | 0 (0.0%) | 0 (0.0%) |
| 45 to 59 Minutes | 0 (0.0%) | 0 (0.0%) |
| 60 to 89 Minutes | 0 (0.0%) | 0 (0.0%) |
| 90 or more Minutes | 0 (0.0%) | 0 (0.0%) |
Time of Departure to Work by Sex in Flaxton
The most frequent times of departure to work in Flaxton are 6:00 AM to 6:29 AM (11, 84.6%) for males and 6:30 AM to 6:59 AM (3, 75.0%) for females.
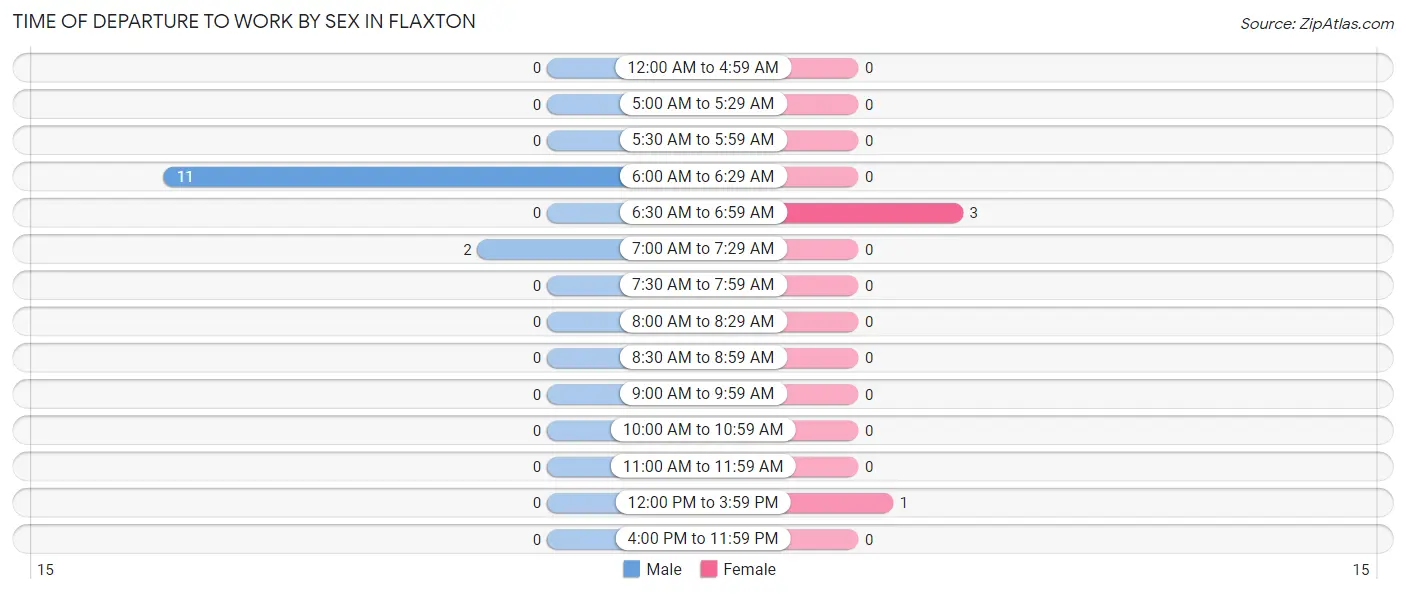
| Time of Departure | Male | Female |
| 12:00 AM to 4:59 AM | 0 (0.0%) | 0 (0.0%) |
| 5:00 AM to 5:29 AM | 0 (0.0%) | 0 (0.0%) |
| 5:30 AM to 5:59 AM | 0 (0.0%) | 0 (0.0%) |
| 6:00 AM to 6:29 AM | 11 (84.6%) | 0 (0.0%) |
| 6:30 AM to 6:59 AM | 0 (0.0%) | 3 (75.0%) |
| 7:00 AM to 7:29 AM | 2 (15.4%) | 0 (0.0%) |
| 7:30 AM to 7:59 AM | 0 (0.0%) | 0 (0.0%) |
| 8:00 AM to 8:29 AM | 0 (0.0%) | 0 (0.0%) |
| 8:30 AM to 8:59 AM | 0 (0.0%) | 0 (0.0%) |
| 9:00 AM to 9:59 AM | 0 (0.0%) | 0 (0.0%) |
| 10:00 AM to 10:59 AM | 0 (0.0%) | 0 (0.0%) |
| 11:00 AM to 11:59 AM | 0 (0.0%) | 0 (0.0%) |
| 12:00 PM to 3:59 PM | 0 (0.0%) | 1 (25.0%) |
| 4:00 PM to 11:59 PM | 0 (0.0%) | 0 (0.0%) |
| Total | 13 (100.0%) | 4 (100.0%) |
Housing Occupancy in Flaxton
Occupancy by Ownership in Flaxton
Of the total 26 dwellings in Flaxton, owner-occupied units account for 26 (100.0%), while renter-occupied units make up 0 (0.0%).
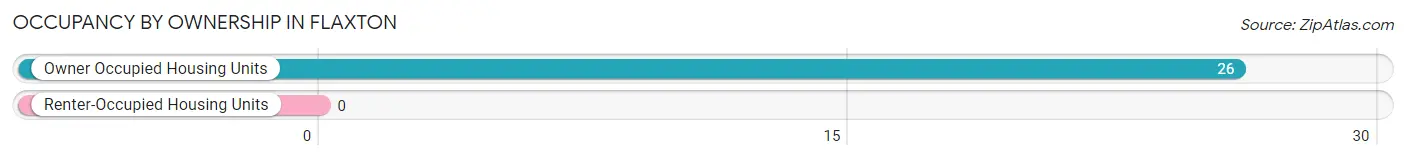
| Occupancy | # Housing Units | % Housing Units |
| Owner Occupied Housing Units | 26 | 100.0% |
| Renter-Occupied Housing Units | 0 | 0.0% |
| Total Occupied Housing Units | 26 | 100.0% |
Occupancy by Household Size in Flaxton

| Household Size | # Housing Units | % Housing Units |
| 1-Person Household | 19 | 73.1% |
| 2-Person Household | 3 | 11.5% |
| 3-Person Household | 2 | 7.7% |
| 4+ Person Household | 2 | 7.7% |
| Total Housing Units | 26 | 100.0% |
Occupancy by Ownership by Household Size in Flaxton
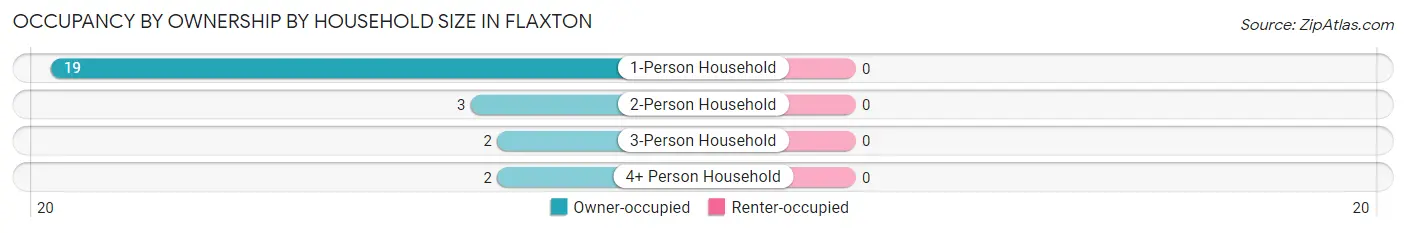
| Household Size | Owner-occupied | Renter-occupied |
| 1-Person Household | 19 (100.0%) | 0 (0.0%) |
| 2-Person Household | 3 (100.0%) | 0 (0.0%) |
| 3-Person Household | 2 (100.0%) | 0 (0.0%) |
| 4+ Person Household | 2 (100.0%) | 0 (0.0%) |
| Total Housing Units | 26 (100.0%) | 0 (0.0%) |
Occupancy by Educational Attainment in Flaxton
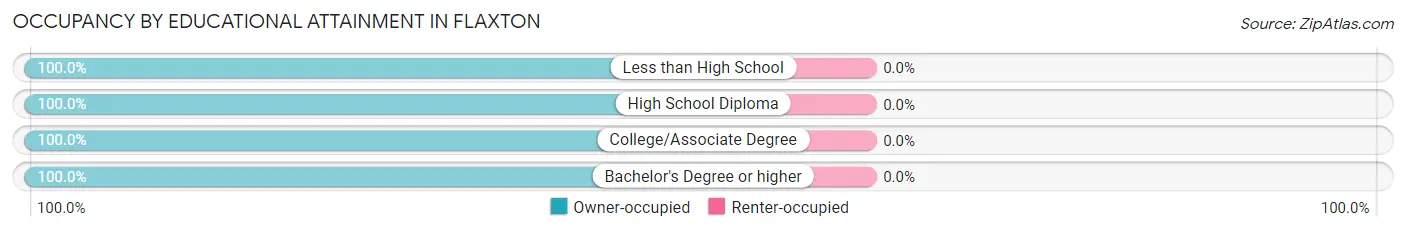
| Household Size | Owner-occupied | Renter-occupied |
| Less than High School | 11 (100.0%) | 0 (0.0%) |
| High School Diploma | 7 (100.0%) | 0 (0.0%) |
| College/Associate Degree | 4 (100.0%) | 0 (0.0%) |
| Bachelor's Degree or higher | 4 (100.0%) | 0 (0.0%) |
Occupancy by Age of Householder in Flaxton
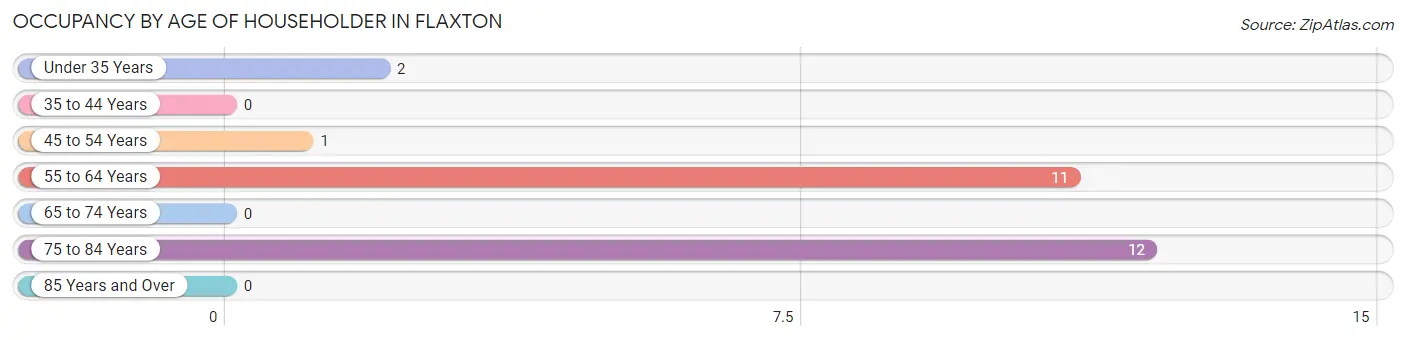
| Age Bracket | # Households | % Households |
| Under 35 Years | 2 | 7.7% |
| 35 to 44 Years | 0 | 0.0% |
| 45 to 54 Years | 1 | 3.8% |
| 55 to 64 Years | 11 | 42.3% |
| 65 to 74 Years | 0 | 0.0% |
| 75 to 84 Years | 12 | 46.2% |
| 85 Years and Over | 0 | 0.0% |
| Total | 26 | 100.0% |
Housing Finances in Flaxton
Median Income by Occupancy in Flaxton
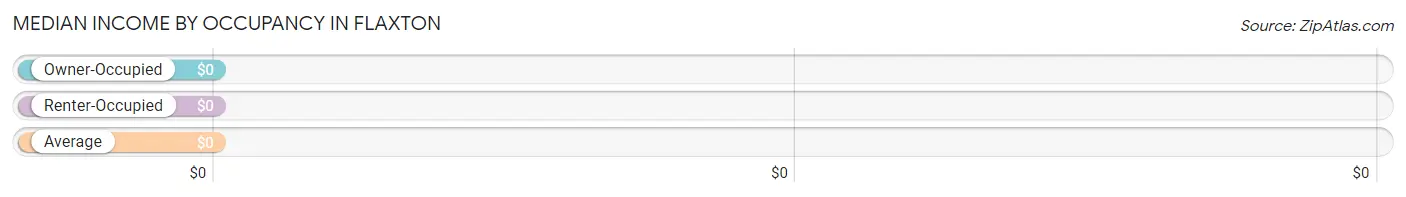
| Occupancy Type | # Households | Median Income |
| Owner-Occupied | 26 (100.0%) | $0 |
| Renter-Occupied | 0 (0.0%) | $0 |
| Average | 26 (100.0%) | $0 |
Occupancy by Householder Income Bracket in Flaxton
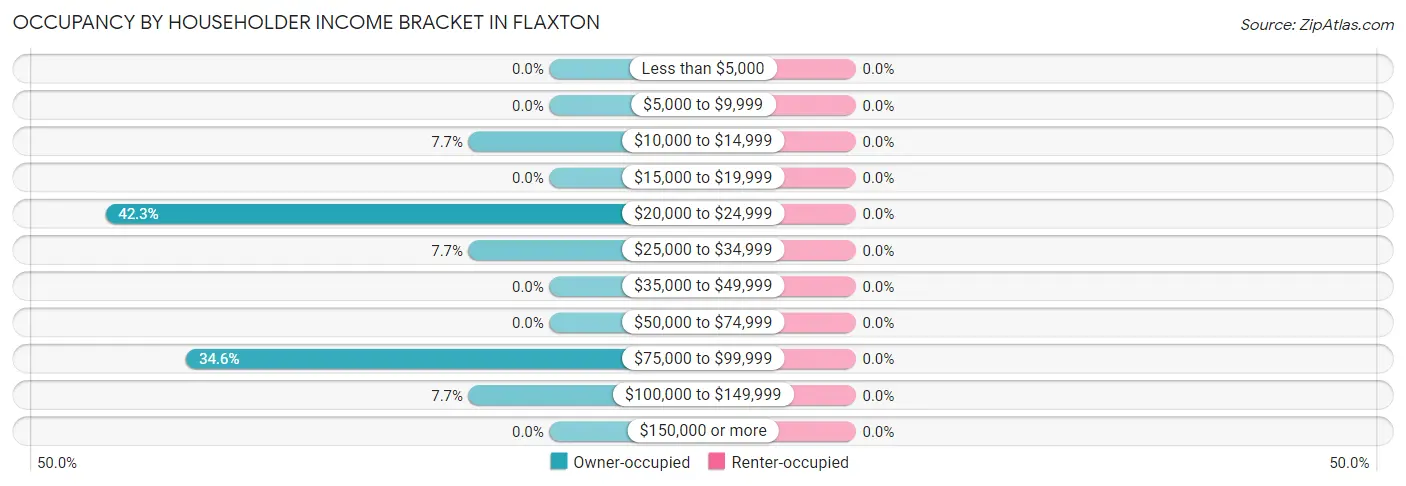
| Income Bracket | Owner-occupied | Renter-occupied |
| Less than $5,000 | 0 (0.0%) | 0 (0.0%) |
| $5,000 to $9,999 | 0 (0.0%) | 0 (0.0%) |
| $10,000 to $14,999 | 2 (7.7%) | 0 (0.0%) |
| $15,000 to $19,999 | 0 (0.0%) | 0 (0.0%) |
| $20,000 to $24,999 | 11 (42.3%) | 0 (0.0%) |
| $25,000 to $34,999 | 2 (7.7%) | 0 (0.0%) |
| $35,000 to $49,999 | 0 (0.0%) | 0 (0.0%) |
| $50,000 to $74,999 | 0 (0.0%) | 0 (0.0%) |
| $75,000 to $99,999 | 9 (34.6%) | 0 (0.0%) |
| $100,000 to $149,999 | 2 (7.7%) | 0 (0.0%) |
| $150,000 or more | 0 (0.0%) | 0 (0.0%) |
| Total | 26 (100.0%) | 0 (0.0%) |
Monthly Housing Cost Tiers in Flaxton
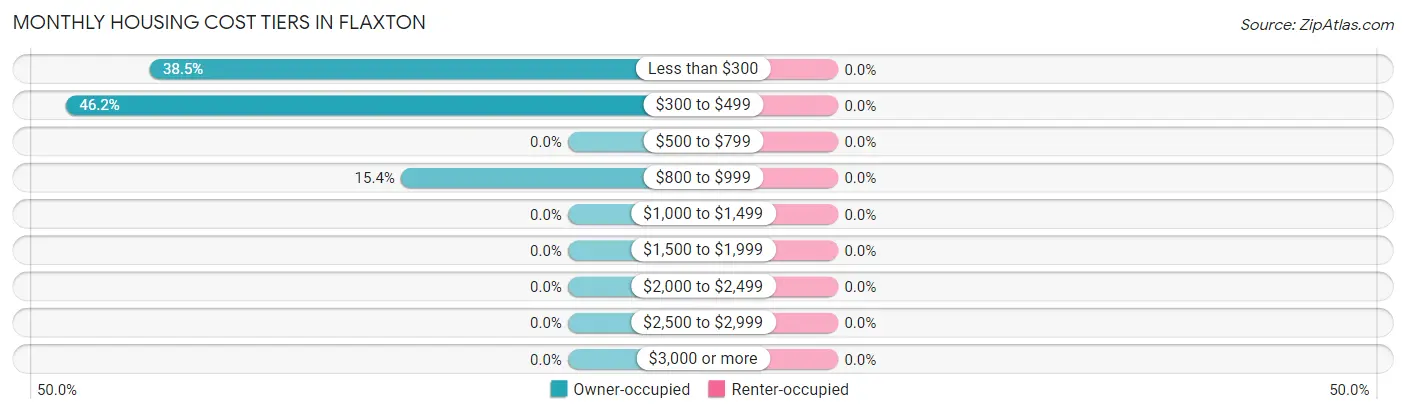
| Monthly Cost | Owner-occupied | Renter-occupied |
| Less than $300 | 10 (38.5%) | 0 (0.0%) |
| $300 to $499 | 12 (46.2%) | 0 (0.0%) |
| $500 to $799 | 0 (0.0%) | 0 (0.0%) |
| $800 to $999 | 4 (15.4%) | 0 (0.0%) |
| $1,000 to $1,499 | 0 (0.0%) | 0 (0.0%) |
| $1,500 to $1,999 | 0 (0.0%) | 0 (0.0%) |
| $2,000 to $2,499 | 0 (0.0%) | 0 (0.0%) |
| $2,500 to $2,999 | 0 (0.0%) | 0 (0.0%) |
| $3,000 or more | 0 (0.0%) | 0 (0.0%) |
| Total | 26 (100.0%) | 0 (0.0%) |
Physical Housing Characteristics in Flaxton
Housing Structures in Flaxton
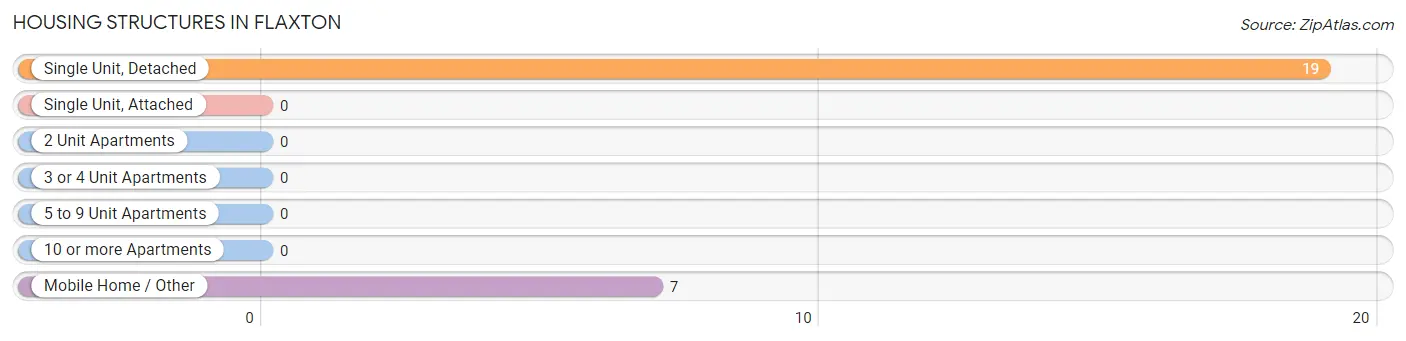
| Structure Type | # Housing Units | % Housing Units |
| Single Unit, Detached | 19 | 73.1% |
| Single Unit, Attached | 0 | 0.0% |
| 2 Unit Apartments | 0 | 0.0% |
| 3 or 4 Unit Apartments | 0 | 0.0% |
| 5 to 9 Unit Apartments | 0 | 0.0% |
| 10 or more Apartments | 0 | 0.0% |
| Mobile Home / Other | 7 | 26.9% |
| Total | 26 | 100.0% |
Housing Structures by Occupancy in Flaxton
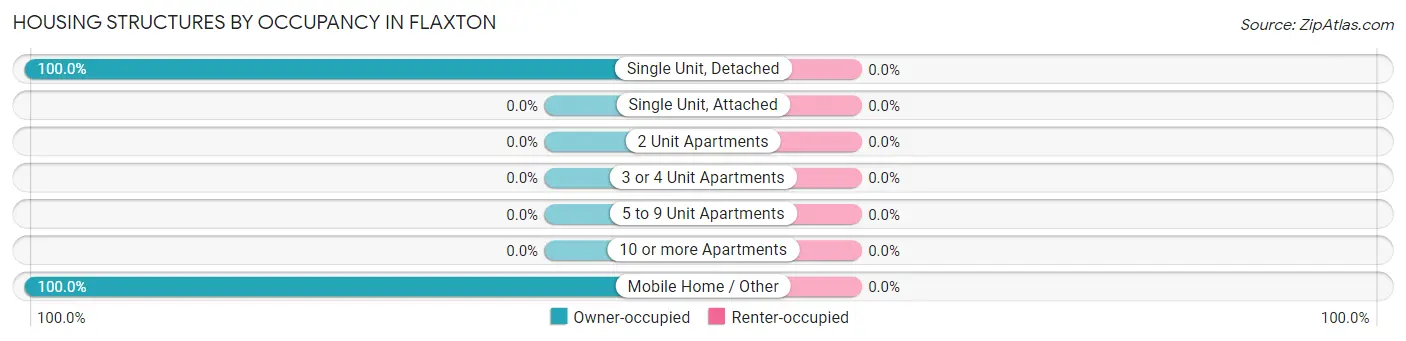
| Structure Type | Owner-occupied | Renter-occupied |
| Single Unit, Detached | 19 (100.0%) | 0 (0.0%) |
| Single Unit, Attached | 0 (0.0%) | 0 (0.0%) |
| 2 Unit Apartments | 0 (0.0%) | 0 (0.0%) |
| 3 or 4 Unit Apartments | 0 (0.0%) | 0 (0.0%) |
| 5 to 9 Unit Apartments | 0 (0.0%) | 0 (0.0%) |
| 10 or more Apartments | 0 (0.0%) | 0 (0.0%) |
| Mobile Home / Other | 7 (100.0%) | 0 (0.0%) |
| Total | 26 (100.0%) | 0 (0.0%) |
Housing Structures by Number of Rooms in Flaxton
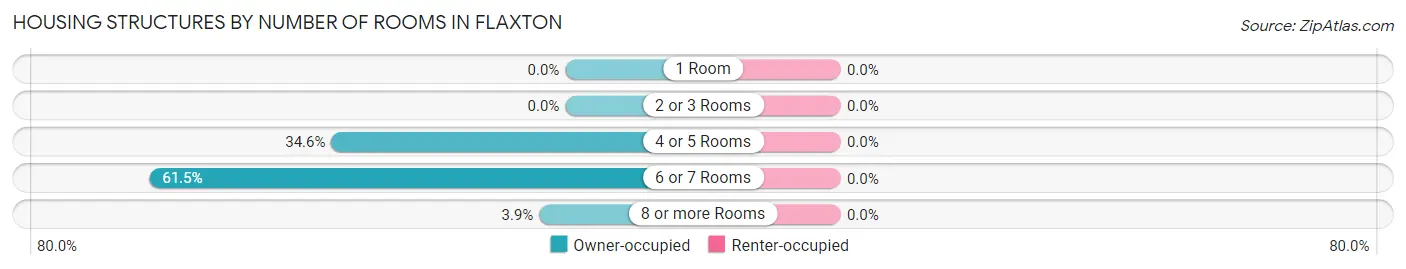
| Number of Rooms | Owner-occupied | Renter-occupied |
| 1 Room | 0 (0.0%) | 0 (0.0%) |
| 2 or 3 Rooms | 0 (0.0%) | 0 (0.0%) |
| 4 or 5 Rooms | 9 (34.6%) | 0 (0.0%) |
| 6 or 7 Rooms | 16 (61.5%) | 0 (0.0%) |
| 8 or more Rooms | 1 (3.8%) | 0 (0.0%) |
| Total | 26 (100.0%) | 0 (0.0%) |
Housing Structure by Heating Type in Flaxton
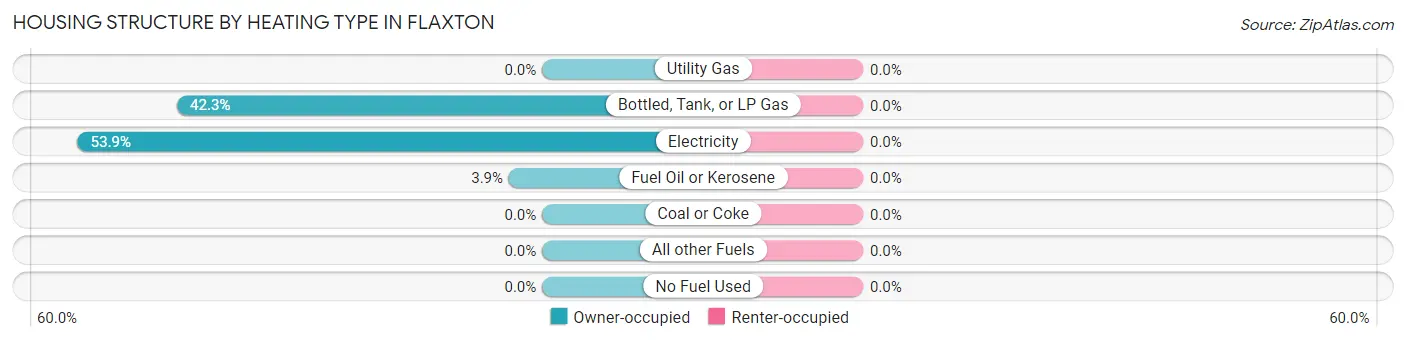
| Heating Type | Owner-occupied | Renter-occupied |
| Utility Gas | 0 (0.0%) | 0 (0.0%) |
| Bottled, Tank, or LP Gas | 11 (42.3%) | 0 (0.0%) |
| Electricity | 14 (53.8%) | 0 (0.0%) |
| Fuel Oil or Kerosene | 1 (3.8%) | 0 (0.0%) |
| Coal or Coke | 0 (0.0%) | 0 (0.0%) |
| All other Fuels | 0 (0.0%) | 0 (0.0%) |
| No Fuel Used | 0 (0.0%) | 0 (0.0%) |
| Total | 26 (100.0%) | 0 (0.0%) |
Household Vehicle Usage in Flaxton
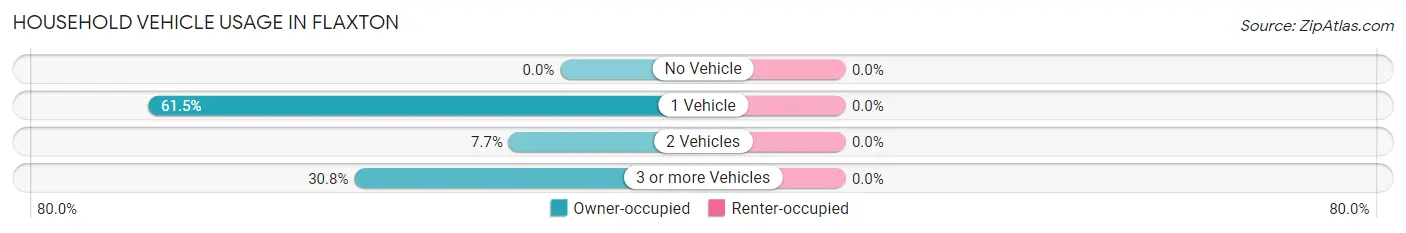
| Vehicles per Household | Owner-occupied | Renter-occupied |
| No Vehicle | 0 (0.0%) | 0 (0.0%) |
| 1 Vehicle | 16 (61.5%) | 0 (0.0%) |
| 2 Vehicles | 2 (7.7%) | 0 (0.0%) |
| 3 or more Vehicles | 8 (30.8%) | 0 (0.0%) |
| Total | 26 (100.0%) | 0 (0.0%) |
Real Estate & Mortgages in Flaxton
Real Estate and Mortgage Overview in Flaxton
| Characteristic | Without Mortgage | With Mortgage |
| Housing Units | 22 | 4 |
| Median Property Value | $35,000 | $0 |
| Median Household Income | - | - |
| Monthly Housing Costs | $408 | $0 |
| Real Estate Taxes | $500 | $0 |
Property Value by Mortgage Status in Flaxton
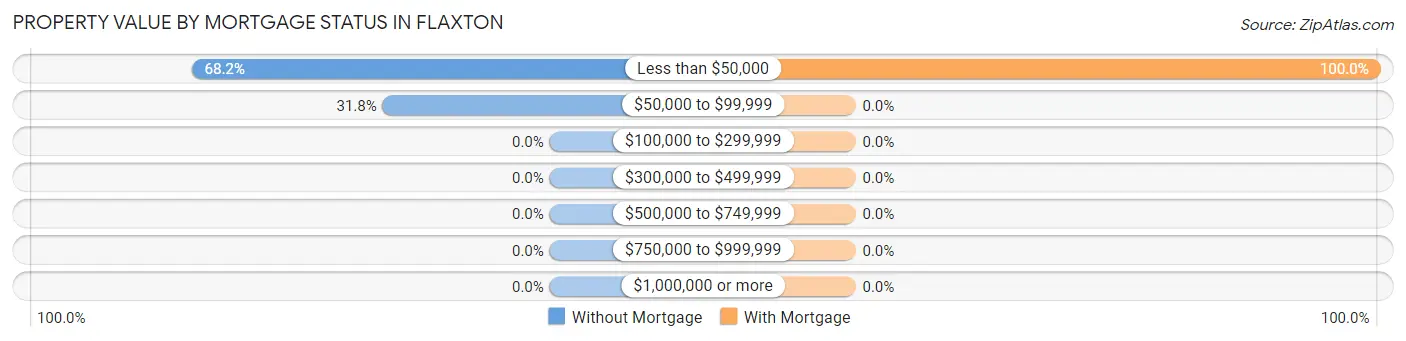
| Property Value | Without Mortgage | With Mortgage |
| Less than $50,000 | 15 (68.2%) | 4 (100.0%) |
| $50,000 to $99,999 | 7 (31.8%) | 0 (0.0%) |
| $100,000 to $299,999 | 0 (0.0%) | 0 (0.0%) |
| $300,000 to $499,999 | 0 (0.0%) | 0 (0.0%) |
| $500,000 to $749,999 | 0 (0.0%) | 0 (0.0%) |
| $750,000 to $999,999 | 0 (0.0%) | 0 (0.0%) |
| $1,000,000 or more | 0 (0.0%) | 0 (0.0%) |
| Total | 22 (100.0%) | 4 (100.0%) |
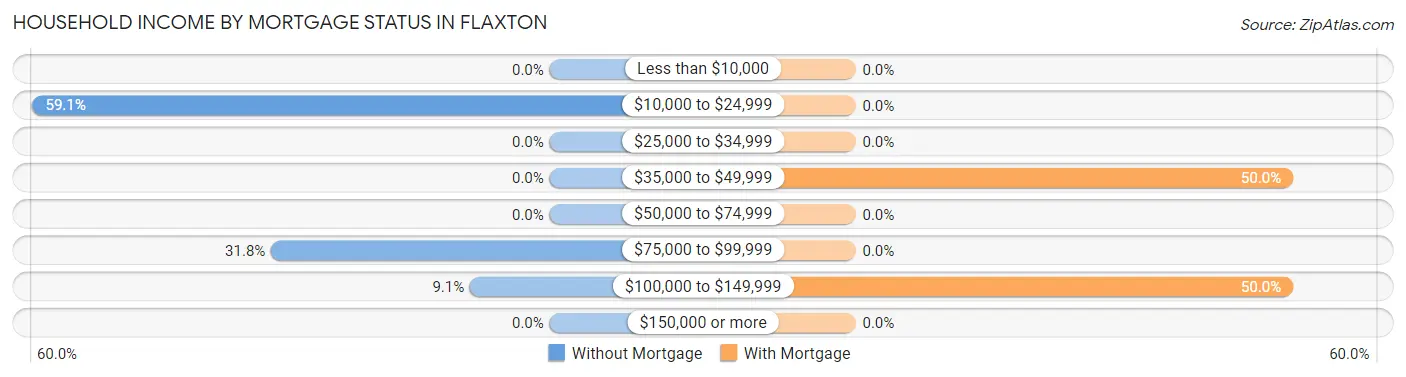
Household Income by Mortgage Status in Flaxton
| Household Income | Without Mortgage | With Mortgage |
| Less than $10,000 | 0 (0.0%) | 0 (0.0%) |
| $10,000 to $24,999 | 13 (59.1%) | 0 (0.0%) |
| $25,000 to $34,999 | 0 (0.0%) | 0 (0.0%) |
| $35,000 to $49,999 | 0 (0.0%) | 2 (50.0%) |
| $50,000 to $74,999 | 0 (0.0%) | 0 (0.0%) |
| $75,000 to $99,999 | 7 (31.8%) | 0 (0.0%) |
| $100,000 to $149,999 | 2 (9.1%) | 2 (50.0%) |
| $150,000 or more | 0 (0.0%) | 0 (0.0%) |
| Total | 22 (100.0%) | 4 (100.0%) |
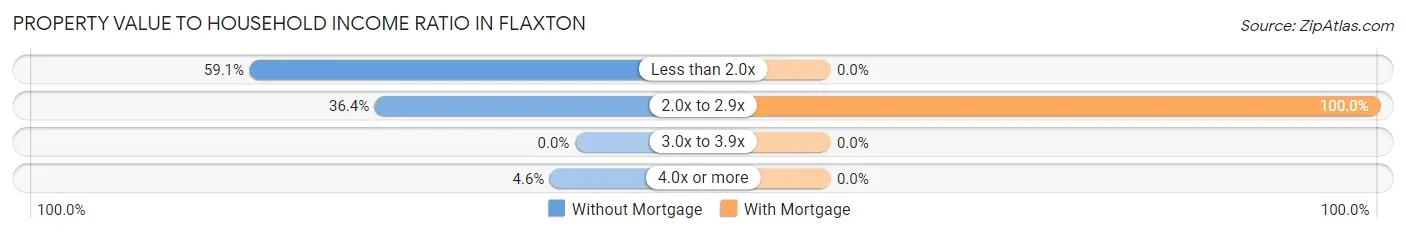
Property Value to Household Income Ratio in Flaxton
| Value-to-Income Ratio | Without Mortgage | With Mortgage |
| Less than 2.0x | 13 (59.1%) | 0 (0.0%) |
| 2.0x to 2.9x | 8 (36.4%) | 4 (100.0%) |
| 3.0x to 3.9x | 0 (0.0%) | 0 (0.0%) |
| 4.0x or more | 1 (4.5%) | 0 (0.0%) |
| Total | 22 (100.0%) | 4 (100.0%) |
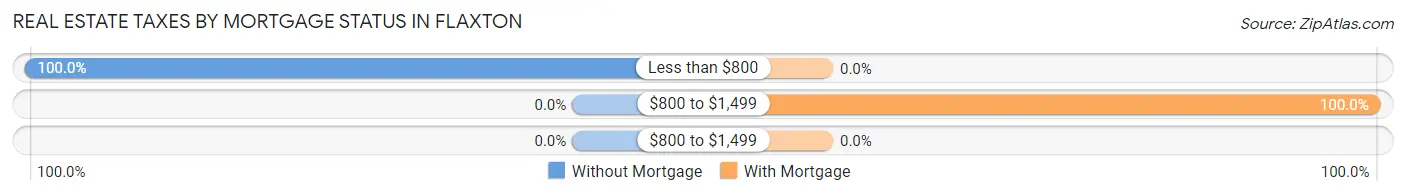
Real Estate Taxes by Mortgage Status in Flaxton
| Property Taxes | Without Mortgage | With Mortgage |
| Less than $800 | 22 (100.0%) | 0 (0.0%) |
| $800 to $1,499 | 0 (0.0%) | 4 (100.0%) |
| $800 to $1,499 | 0 (0.0%) | 0 (0.0%) |
| Total | 22 (100.0%) | 4 (100.0%) |
Health & Disability in Flaxton
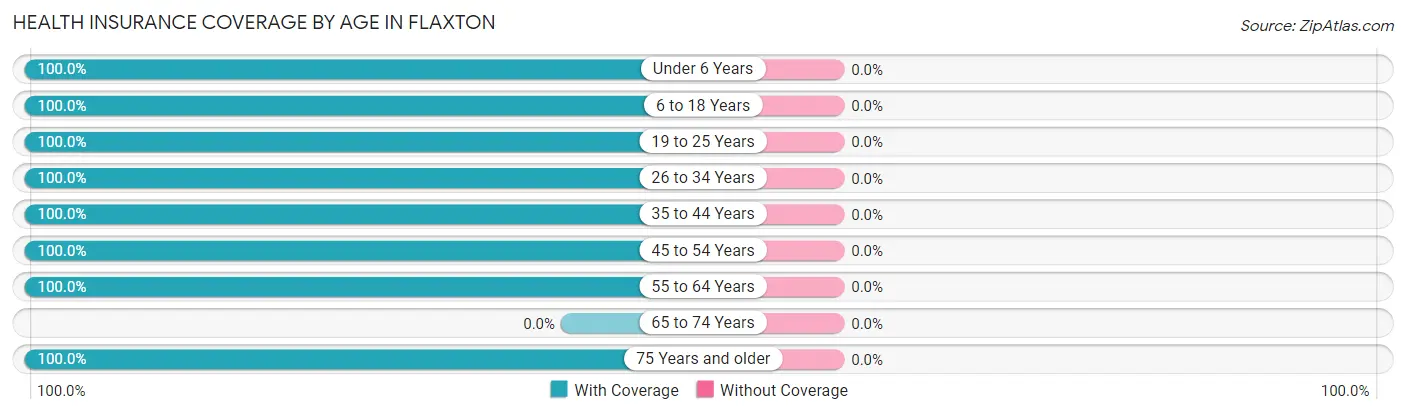
Health Insurance Coverage by Age in Flaxton
| Age Bracket | With Coverage | Without Coverage |
| Under 6 Years | 2 (100.0%) | 0 (0.0%) |
| 6 to 18 Years | 4 (100.0%) | 0 (0.0%) |
| 19 to 25 Years | 2 (100.0%) | 0 (0.0%) |
| 26 to 34 Years | 7 (100.0%) | 0 (0.0%) |
| 35 to 44 Years | 4 (100.0%) | 0 (0.0%) |
| 45 to 54 Years | 1 (100.0%) | 0 (0.0%) |
| 55 to 64 Years | 11 (100.0%) | 0 (0.0%) |
| 65 to 74 Years | 0 (0.0%) | 0 (0.0%) |
| 75 Years and older | 13 (100.0%) | 0 (0.0%) |
| Total | 44 (100.0%) | 0 (0.0%) |
Health Insurance Coverage by Citizenship Status in Flaxton
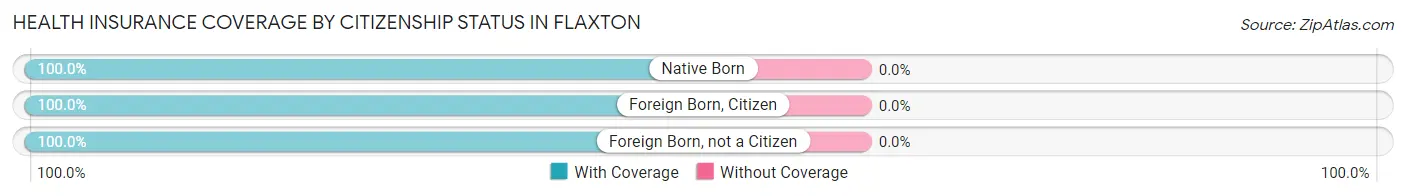
| Citizenship Status | With Coverage | Without Coverage |
| Native Born | 2 (100.0%) | 0 (0.0%) |
| Foreign Born, Citizen | 4 (100.0%) | 0 (0.0%) |
| Foreign Born, not a Citizen | 2 (100.0%) | 0 (0.0%) |
Health Insurance Coverage by Household Income in Flaxton
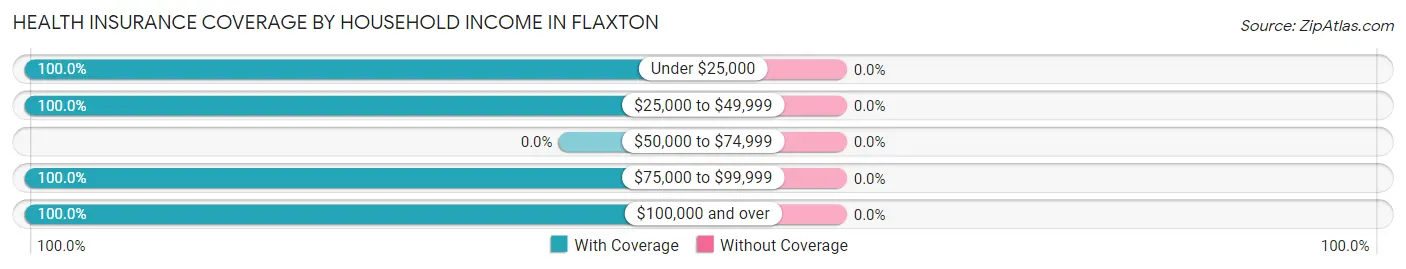
| Household Income | With Coverage | Without Coverage |
| Under $25,000 | 14 (100.0%) | 0 (0.0%) |
| $25,000 to $49,999 | 3 (100.0%) | 0 (0.0%) |
| $50,000 to $74,999 | 0 (0.0%) | 0 (0.0%) |
| $75,000 to $99,999 | 20 (100.0%) | 0 (0.0%) |
| $100,000 and over | 7 (100.0%) | 0 (0.0%) |
Public vs Private Health Insurance Coverage by Age in Flaxton
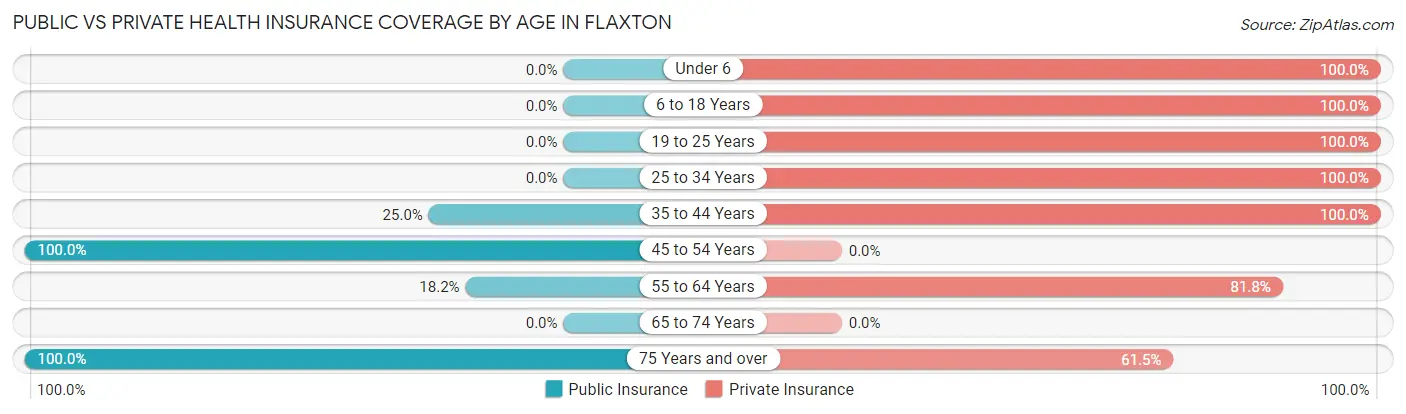
| Age Bracket | Public Insurance | Private Insurance |
| Under 6 | 0 (0.0%) | 2 (100.0%) |
| 6 to 18 Years | 0 (0.0%) | 4 (100.0%) |
| 19 to 25 Years | 0 (0.0%) | 2 (100.0%) |
| 25 to 34 Years | 0 (0.0%) | 7 (100.0%) |
| 35 to 44 Years | 1 (25.0%) | 4 (100.0%) |
| 45 to 54 Years | 1 (100.0%) | 0 (0.0%) |
| 55 to 64 Years | 2 (18.2%) | 9 (81.8%) |
| 65 to 74 Years | 0 (0.0%) | 0 (0.0%) |
| 75 Years and over | 13 (100.0%) | 8 (61.5%) |
| Total | 17 (38.6%) | 36 (81.8%) |
Disability Status by Sex by Age in Flaxton
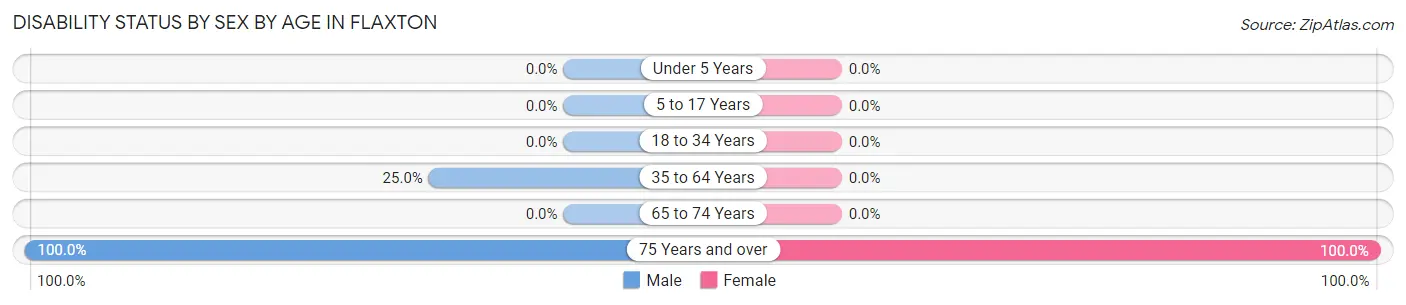
| Age Bracket | Male | Female |
| Under 5 Years | 0 (0.0%) | 0 (0.0%) |
| 5 to 17 Years | 0 (0.0%) | 0 (0.0%) |
| 18 to 34 Years | 0 (0.0%) | 0 (0.0%) |
| 35 to 64 Years | 3 (25.0%) | 0 (0.0%) |
| 65 to 74 Years | 0 (0.0%) | 0 (0.0%) |
| 75 Years and over | 6 (100.0%) | 7 (100.0%) |
Disability Class by Sex by Age in Flaxton
Disability Class: Hearing Difficulty
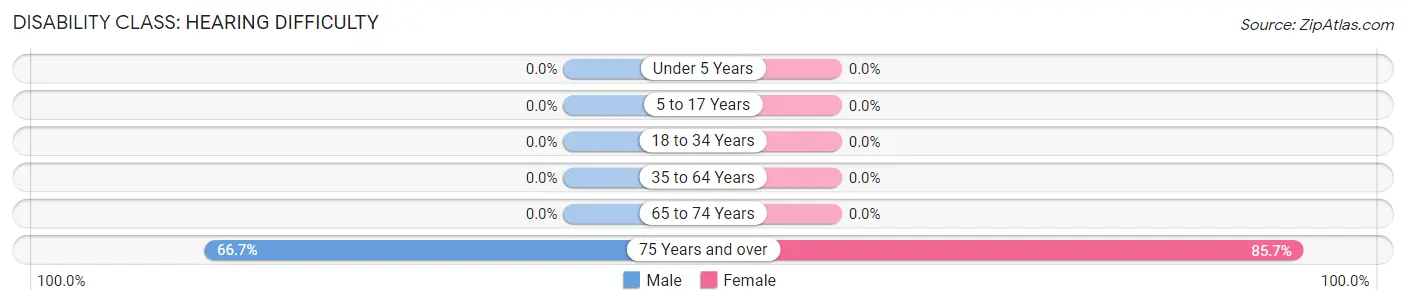
| Age Bracket | Male | Female |
| Under 5 Years | 0 (0.0%) | 0 (0.0%) |
| 5 to 17 Years | 0 (0.0%) | 0 (0.0%) |
| 18 to 34 Years | 0 (0.0%) | 0 (0.0%) |
| 35 to 64 Years | 0 (0.0%) | 0 (0.0%) |
| 65 to 74 Years | 0 (0.0%) | 0 (0.0%) |
| 75 Years and over | 4 (66.7%) | 6 (85.7%) |
Disability Class: Vision Difficulty
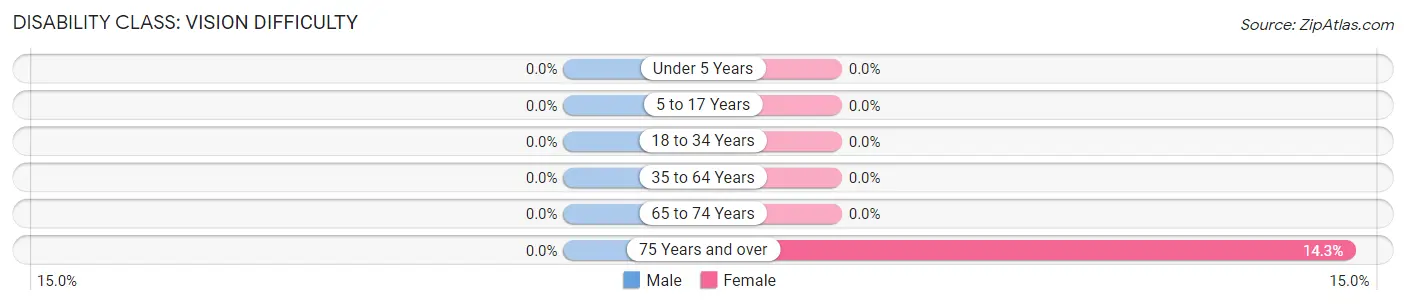
| Age Bracket | Male | Female |
| Under 5 Years | 0 (0.0%) | 0 (0.0%) |
| 5 to 17 Years | 0 (0.0%) | 0 (0.0%) |
| 18 to 34 Years | 0 (0.0%) | 0 (0.0%) |
| 35 to 64 Years | 0 (0.0%) | 0 (0.0%) |
| 65 to 74 Years | 0 (0.0%) | 0 (0.0%) |
| 75 Years and over | 0 (0.0%) | 1 (14.3%) |
Disability Class: Cognitive Difficulty
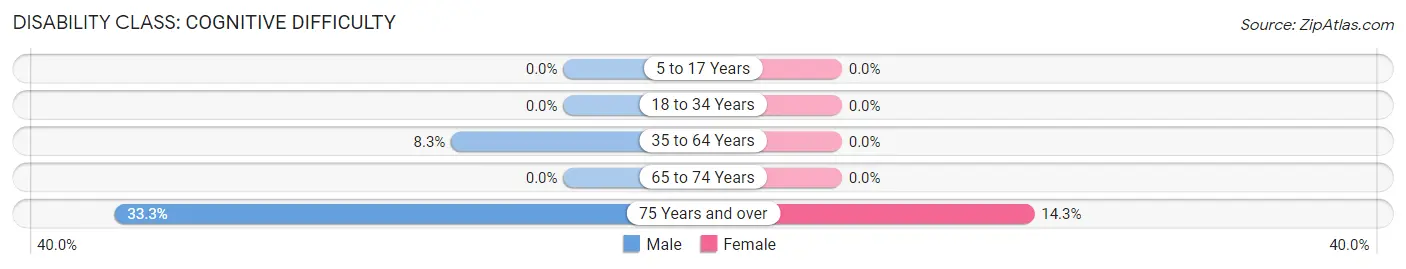
| Age Bracket | Male | Female |
| 5 to 17 Years | 0 (0.0%) | 0 (0.0%) |
| 18 to 34 Years | 0 (0.0%) | 0 (0.0%) |
| 35 to 64 Years | 1 (8.3%) | 0 (0.0%) |
| 65 to 74 Years | 0 (0.0%) | 0 (0.0%) |
| 75 Years and over | 2 (33.3%) | 1 (14.3%) |
Disability Class: Ambulatory Difficulty

| Age Bracket | Male | Female |
| 5 to 17 Years | 0 (0.0%) | 0 (0.0%) |
| 18 to 34 Years | 0 (0.0%) | 0 (0.0%) |
| 35 to 64 Years | 2 (16.7%) | 0 (0.0%) |
| 65 to 74 Years | 0 (0.0%) | 0 (0.0%) |
| 75 Years and over | 2 (33.3%) | 0 (0.0%) |
Disability Class: Self-Care Difficulty
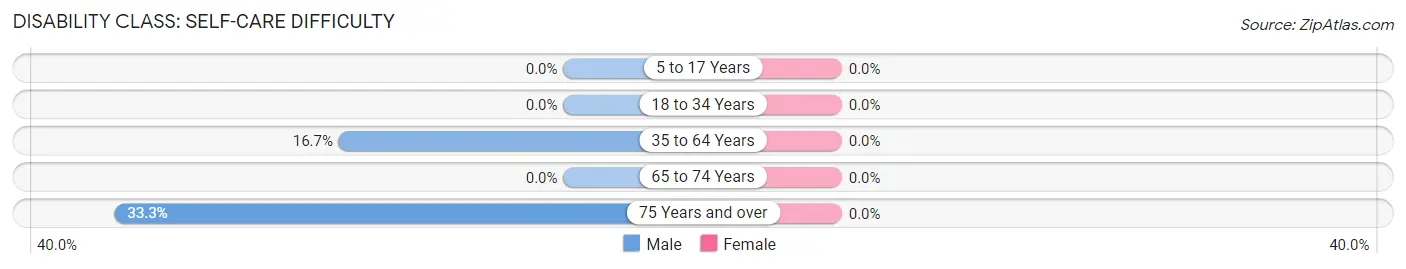
| Age Bracket | Male | Female |
| 5 to 17 Years | 0 (0.0%) | 0 (0.0%) |
| 18 to 34 Years | 0 (0.0%) | 0 (0.0%) |
| 35 to 64 Years | 2 (16.7%) | 0 (0.0%) |
| 65 to 74 Years | 0 (0.0%) | 0 (0.0%) |
| 75 Years and over | 2 (33.3%) | 0 (0.0%) |
Technology Access in Flaxton
Computing Device Access in Flaxton
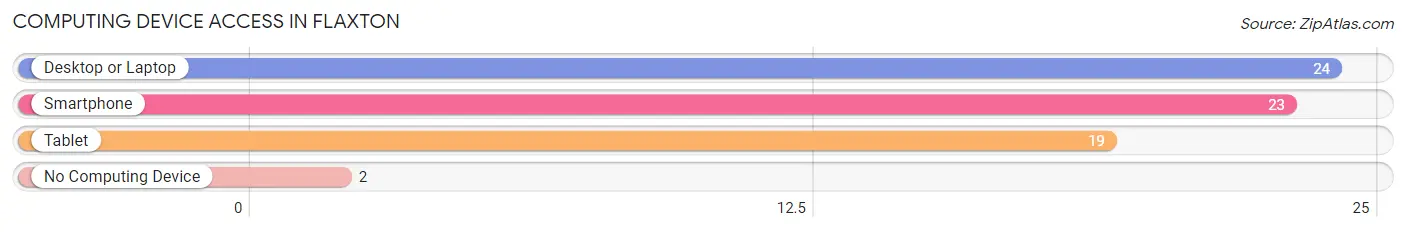
| Device Type | # Households | % Households |
| Desktop or Laptop | 24 | 92.3% |
| Smartphone | 23 | 88.5% |
| Tablet | 19 | 73.1% |
| No Computing Device | 2 | 7.7% |
| Total | 26 | 100.0% |
Internet Access in Flaxton
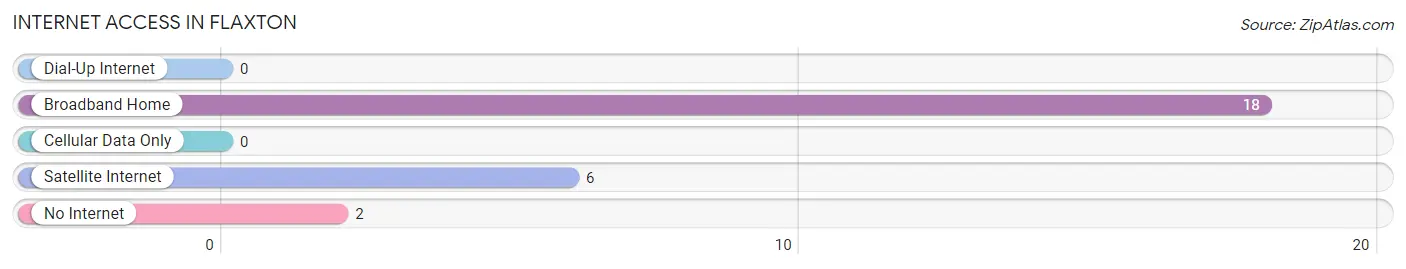
| Internet Type | # Households | % Households |
| Dial-Up Internet | 0 | 0.0% |
| Broadband Home | 18 | 69.2% |
| Cellular Data Only | 0 | 0.0% |
| Satellite Internet | 6 | 23.1% |
| No Internet | 2 | 7.7% |
| Total | 26 | 100.0% |
Flaxton Summary
History
The small town of Flaxton, North Dakota is located in the heart of the state, just south of the Canadian border. It is a small, rural community with a population of just over 500 people. The town was founded in 1882 by a group of settlers from Minnesota who were looking for a place to settle and start a new life. The town was named after the nearby Flaxton Creek, which was named after a local Native American chief.
The town was originally a farming community, with the main crops being wheat, oats, and barley. The town also had a small sawmill and a few other businesses. In the early 1900s, the town began to grow and expand, with the addition of a post office, a bank, a hotel, and a few other businesses.
In the 1920s, the town began to experience a decline in population as many of the farmers moved away to find better opportunities elsewhere. This decline continued until the 1950s, when the town began to experience a resurgence in population. This was due to the influx of new residents who were attracted to the area by the availability of jobs in the oil and gas industry.
The town has continued to grow and develop over the years, and today it is a thriving community with a population of over 500 people. The town is home to a variety of businesses, including a grocery store, a hardware store, a bank, a post office, and a few other businesses.
Geography
Flaxton is located in the heart of North Dakota, just south of the Canadian border. The town is situated in the Red River Valley, which is a large, flat area of land that is surrounded by rolling hills and prairies. The town is located on the banks of the Red River, which is a major tributary of the Missouri River.
The town is located in the central part of the state, and is about an hour and a half drive from the state capital of Bismarck. The town is also located close to the Turtle Mountain State Forest, which is a popular destination for outdoor activities such as camping, hiking, and fishing.
Economy
The economy of Flaxton is largely based on agriculture and oil and gas production. The town is home to a variety of farms, which produce a variety of crops such as wheat, oats, barley, and hay. The town is also home to a few oil and gas production companies, which provide jobs for many of the town’s residents.
The town is also home to a few small businesses, such as a grocery store, a hardware store, a bank, and a post office. The town also has a few restaurants and bars, which provide a variety of services to the town’s residents.
Demographics
As of the 2010 census, the population of Flaxton was 514 people. The town is predominantly white, with a small percentage of African Americans, Native Americans, and other races. The median age of the town’s residents is 44 years old, and the median household income is $41,250. The town has a high rate of homeownership, with over 80% of the town’s residents owning their own homes.
Common Questions
What is Per Capita Income in Flaxton?
Per Capita income in Flaxton is $32,134.
What is Inequality or Gini Index in Flaxton?
Inequality or Gini Index in Flaxton is 0.37.
What is the Total Population of Flaxton?
Total Population of Flaxton is 44.
What is the Total Male Population of Flaxton?
Total Male Population of Flaxton is 26.
What is the Total Female Population of Flaxton?
Total Female Population of Flaxton is 18.
What is the Ratio of Males per 100 Females in Flaxton?
There are 144.44 Males per 100 Females in Flaxton.
What is the Ratio of Females per 100 Males in Flaxton?
There are 69.23 Females per 100 Males in Flaxton.
What is the Median Population Age in Flaxton?
Median Population Age in Flaxton is 56.0 Years.
What is the Average Family Size in Flaxton
Average Family Size in Flaxton is 3.6 People.
What is the Average Household Size in Flaxton
Average Household Size in Flaxton is 1.7 People.
How Large is the Labor Force in Flaxton?
There are 17 People in the Labor Forcein in Flaxton.
What is the Percentage of People in the Labor Force in Flaxton?
44.7% of People are in the Labor Force in Flaxton.