Centrahoma, OK Map & Demographics
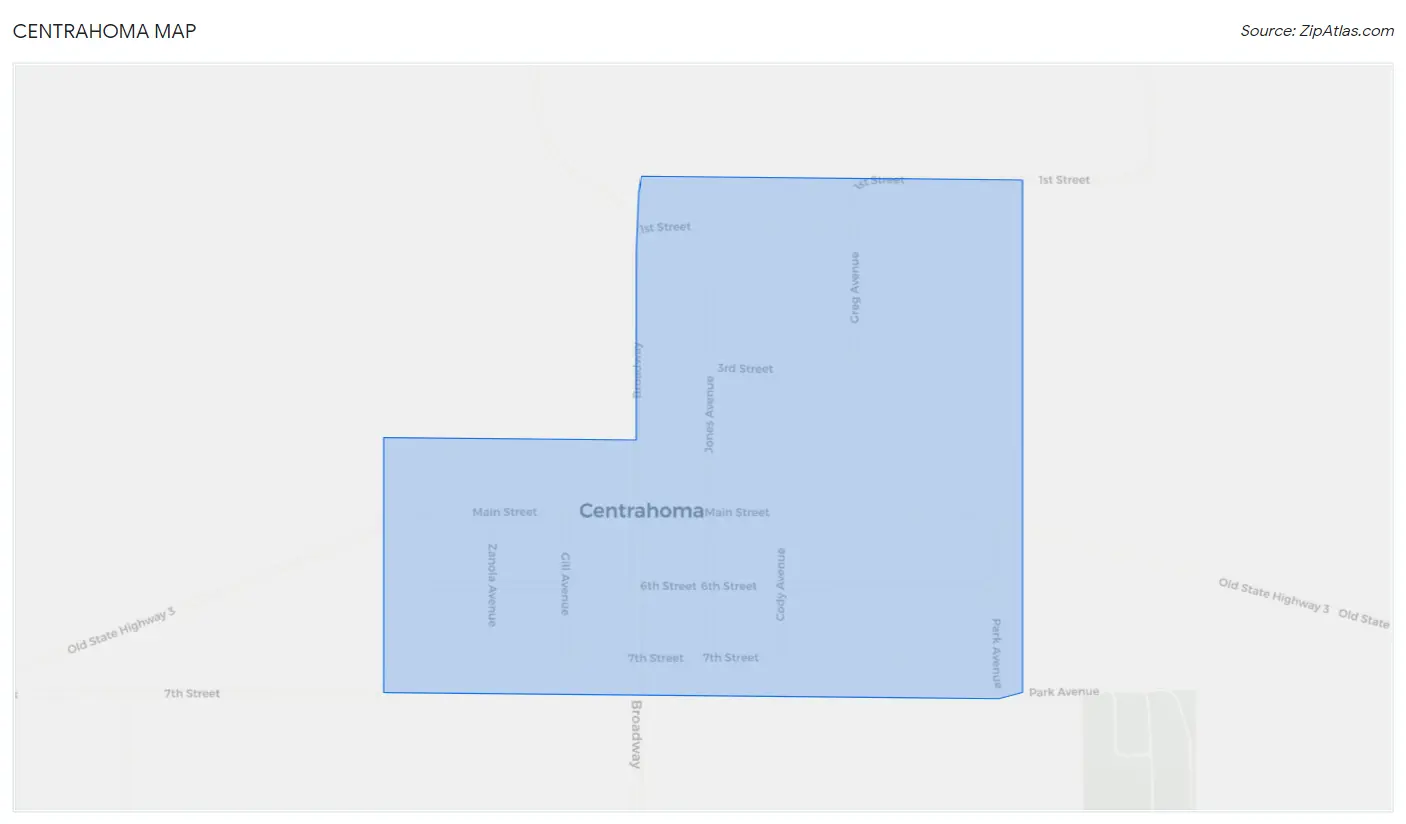
Centrahoma Map
Centrahoma Overview
$19,420
PER CAPITA INCOME
$21,429
AVG HOUSEHOLD INCOME
0.41
INEQUALITY / GINI INDEX
54
TOTAL POPULATION
23
MALE POPULATION
31
FEMALE POPULATION
74.19
MALES / 100 FEMALES
134.78
FEMALES / 100 MALES
49.7
MEDIAN AGE
3.3
AVG FAMILY SIZE
1.9
AVG HOUSEHOLD SIZE
10
LABOR FORCE [ PEOPLE ]
24.4%
PERCENT IN LABOR FORCE
Centrahoma Zip Codes
Centrahoma Area Codes
Income in Centrahoma
Income Overview in Centrahoma
| Characteristic | Number | Measure |
| Per Capita Income | 54 | $19,420 |
| Median Family Income | 11 | $0 |
| Mean Family Income | 11 | $57,964 |
| Median Household Income | 28 | $21,429 |
| Mean Household Income | 28 | $36,489 |
| Income Deficit | 11 | $0 |
| Wage / Income Gap (%) | 54 | 0.00% |
| Wage / Income Gap ($) | 54 | 100.00¢ per $1 |
| Gini / Inequality Index | 54 | 0.41 |
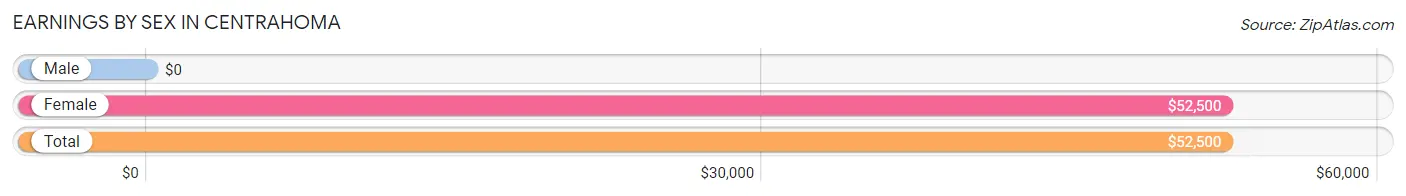
Earnings by Sex in Centrahoma
| Sex | Number | Average Earnings |
| Male | 8 (66.7%) | $0 |
| Female | 4 (33.3%) | $52,500 |
| Total | 12 (100.0%) | $52,500 |
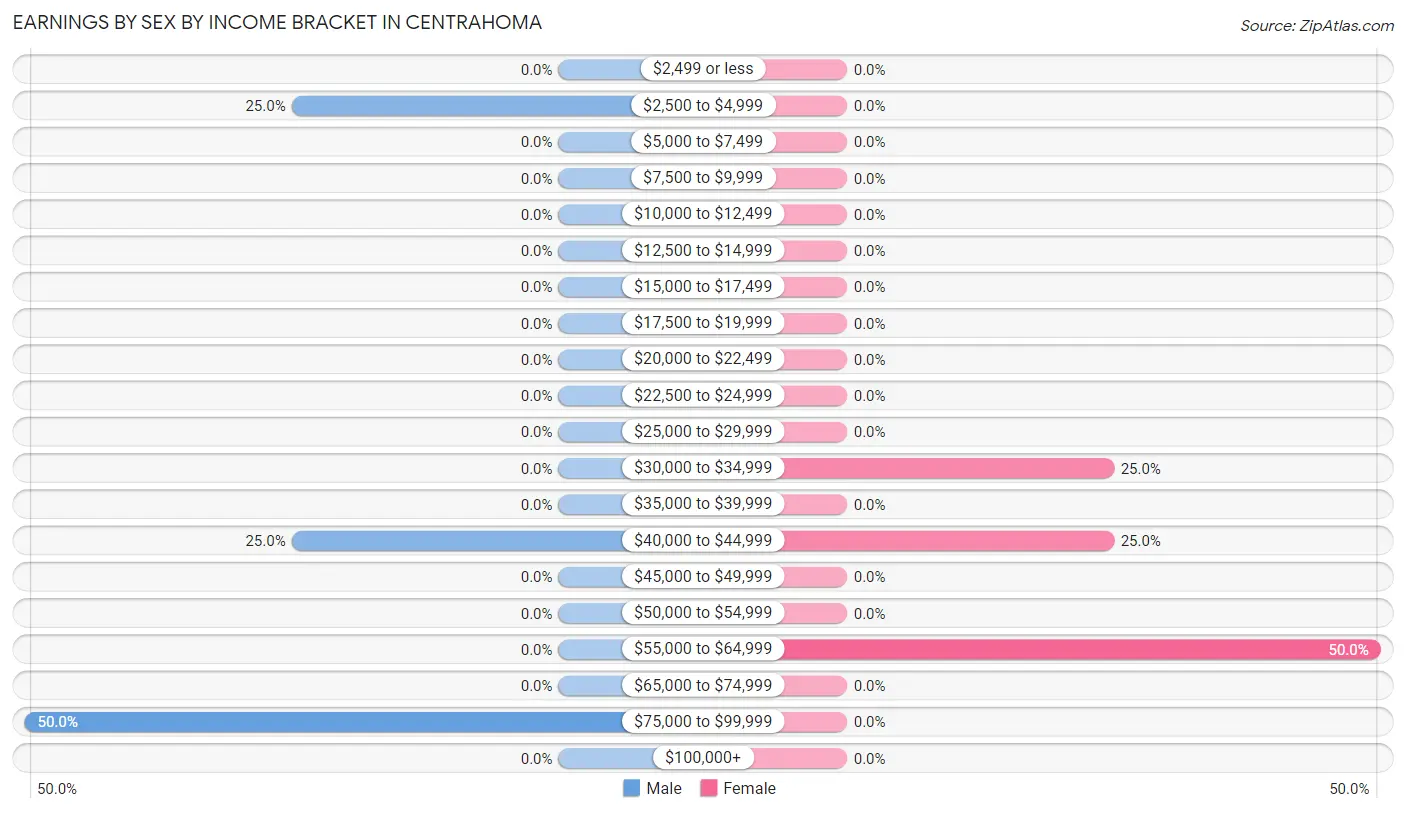
Earnings by Sex by Income Bracket in Centrahoma
The most common earnings brackets in Centrahoma are $75,000 to $99,999 for men (4 | 50.0%) and $55,000 to $64,999 for women (2 | 50.0%).
| Income | Male | Female |
| $2,499 or less | 0 (0.0%) | 0 (0.0%) |
| $2,500 to $4,999 | 2 (25.0%) | 0 (0.0%) |
| $5,000 to $7,499 | 0 (0.0%) | 0 (0.0%) |
| $7,500 to $9,999 | 0 (0.0%) | 0 (0.0%) |
| $10,000 to $12,499 | 0 (0.0%) | 0 (0.0%) |
| $12,500 to $14,999 | 0 (0.0%) | 0 (0.0%) |
| $15,000 to $17,499 | 0 (0.0%) | 0 (0.0%) |
| $17,500 to $19,999 | 0 (0.0%) | 0 (0.0%) |
| $20,000 to $22,499 | 0 (0.0%) | 0 (0.0%) |
| $22,500 to $24,999 | 0 (0.0%) | 0 (0.0%) |
| $25,000 to $29,999 | 0 (0.0%) | 0 (0.0%) |
| $30,000 to $34,999 | 0 (0.0%) | 1 (25.0%) |
| $35,000 to $39,999 | 0 (0.0%) | 0 (0.0%) |
| $40,000 to $44,999 | 2 (25.0%) | 1 (25.0%) |
| $45,000 to $49,999 | 0 (0.0%) | 0 (0.0%) |
| $50,000 to $54,999 | 0 (0.0%) | 0 (0.0%) |
| $55,000 to $64,999 | 0 (0.0%) | 2 (50.0%) |
| $65,000 to $74,999 | 0 (0.0%) | 0 (0.0%) |
| $75,000 to $99,999 | 4 (50.0%) | 0 (0.0%) |
| $100,000+ | 0 (0.0%) | 0 (0.0%) |
| Total | 8 (100.0%) | 4 (100.0%) |
Earnings by Sex by Educational Attainment in Centrahoma
| Educational Attainment | Male Income | Female Income |
| Less than High School | - | - |
| High School Diploma | - | - |
| College or Associate's Degree | - | - |
| Bachelor's Degree | - | - |
| Graduate Degree | - | - |
| Total | - | - |
Family Income in Centrahoma
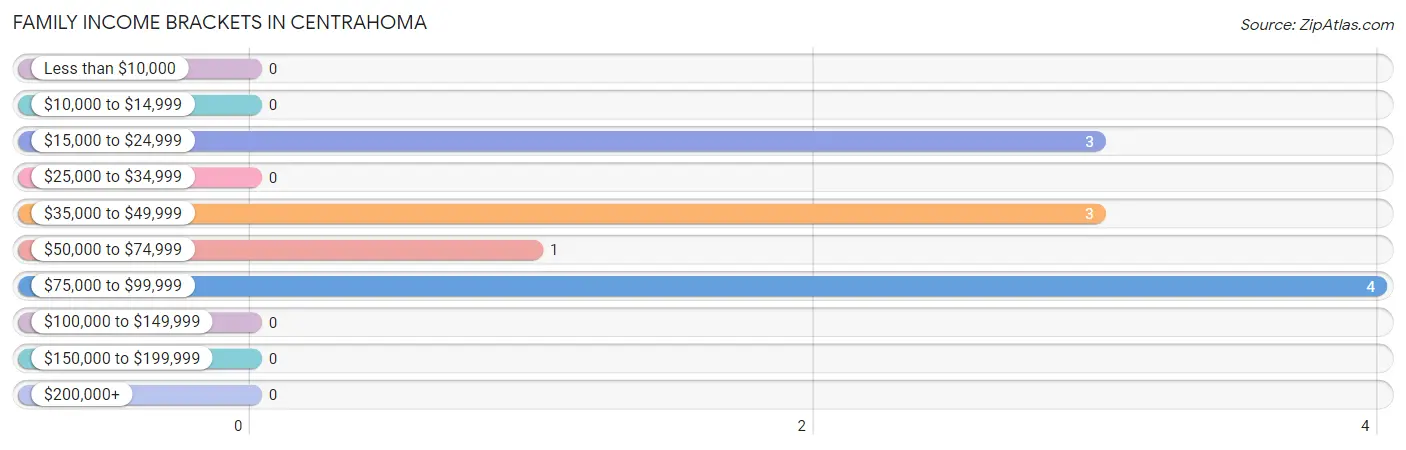
Family Income Brackets in Centrahoma
According to the Centrahoma family income data, there are 4 families falling into the $75,000 to $99,999 income range, which is the most common income bracket and makes up 36.4% of all families.
| Income Bracket | # Families | % Families |
| Less than $10,000 | 0 | 0.0% |
| $10,000 to $14,999 | 0 | 0.0% |
| $15,000 to $24,999 | 3 | 27.3% |
| $25,000 to $34,999 | 0 | 0.0% |
| $35,000 to $49,999 | 3 | 27.3% |
| $50,000 to $74,999 | 1 | 9.1% |
| $75,000 to $99,999 | 4 | 36.4% |
| $100,000 to $149,999 | 0 | 0.0% |
| $150,000 to $199,999 | 0 | 0.0% |
| $200,000+ | 0 | 0.0% |
Family Income by Famaliy Size in Centrahoma
| Income Bracket | # Families | Median Income |
| 2-Person Families | 2 (18.2%) | $0 |
| 3-Person Families | 3 (27.3%) | $0 |
| 4-Person Families | 4 (36.4%) | $0 |
| 5-Person Families | 2 (18.2%) | $0 |
| 6-Person Families | 0 (0.0%) | $0 |
| 7+ Person Families | 0 (0.0%) | $0 |
| Total | 11 (100.0%) | $0 |
Family Income by Number of Earners in Centrahoma
| Number of Earners | # Families | Median Income |
| No Earners | 2 (18.2%) | $0 |
| 1 Earner | 9 (81.8%) | $0 |
| 2 Earners | 0 (0.0%) | $0 |
| 3+ Earners | 0 (0.0%) | $0 |
| Total | 11 (100.0%) | $0 |
Household Income in Centrahoma
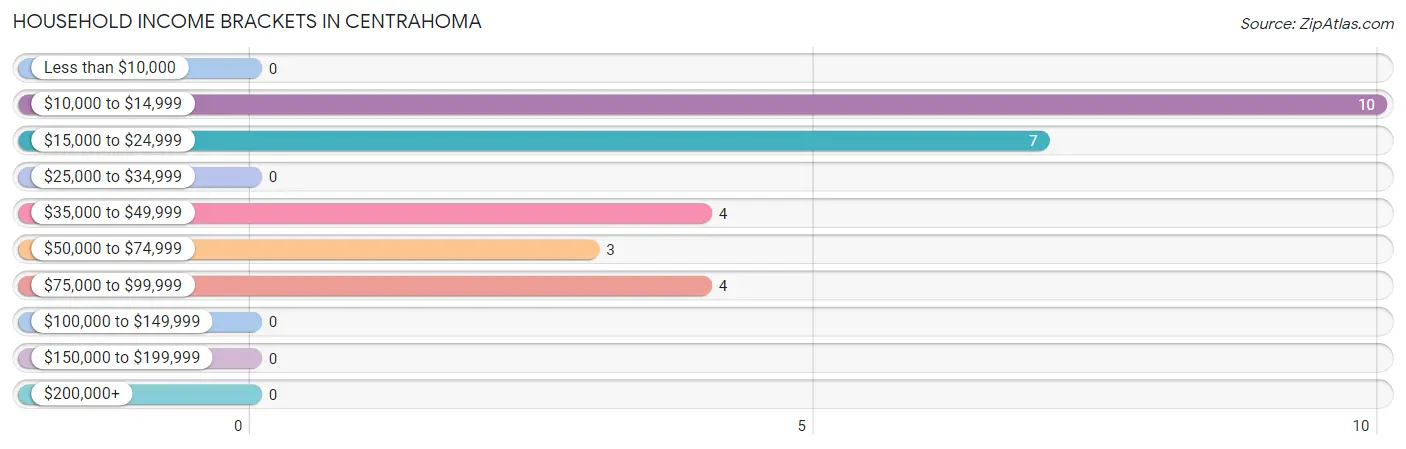
Household Income Brackets in Centrahoma
With 10 households falling in the category, the $10,000 to $14,999 income range is the most frequent in Centrahoma, accounting for 35.7% of all households.
| Income Bracket | # Households | % Households |
| Less than $10,000 | 0 | 0.0% |
| $10,000 to $14,999 | 10 | 35.7% |
| $15,000 to $24,999 | 7 | 25.0% |
| $25,000 to $34,999 | 0 | 0.0% |
| $35,000 to $49,999 | 4 | 14.3% |
| $50,000 to $74,999 | 3 | 10.7% |
| $75,000 to $99,999 | 4 | 14.3% |
| $100,000 to $149,999 | 0 | 0.0% |
| $150,000 to $199,999 | 0 | 0.0% |
| $200,000+ | 0 | 0.0% |
Household Income by Householder Age in Centrahoma
The median household income in Centrahoma is $21,429, with the highest median household income of $20,714 found in the 65+ years age bracket for the primary householder. A total of 12 households (42.9%) fall into this category.
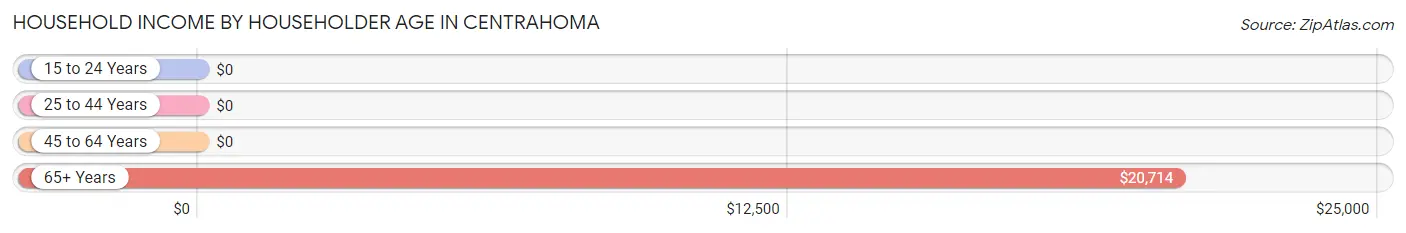
| Income Bracket | # Households | Median Income |
| 15 to 24 Years | 0 (0.0%) | $0 |
| 25 to 44 Years | 6 (21.4%) | $0 |
| 45 to 64 Years | 10 (35.7%) | $0 |
| 65+ Years | 12 (42.9%) | $20,714 |
| Total | 28 (100.0%) | $21,429 |
Poverty in Centrahoma
Income Below Poverty by Sex and Age in Centrahoma
With 30.4% poverty level for males and 29.0% for females among the residents of Centrahoma, 45 to 54 year old males and 45 to 54 year old females are the most vulnerable to poverty, with 5 males (83.3%) and 3 females (75.0%) in their respective age groups living below the poverty level.
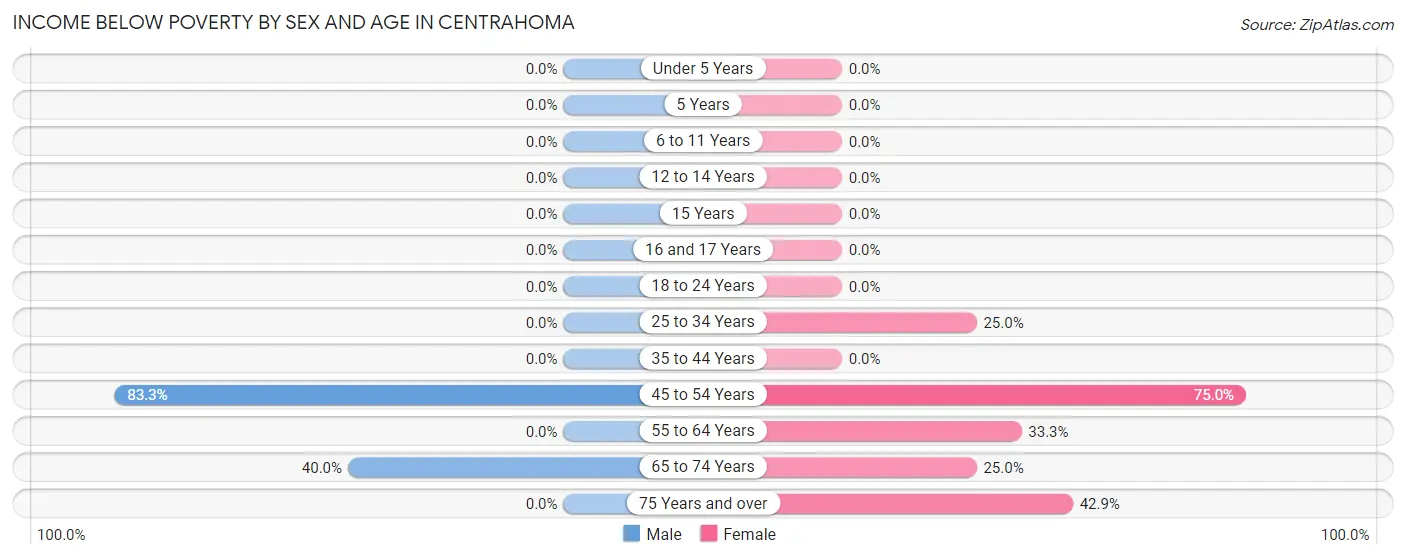
| Age Bracket | Male | Female |
| Under 5 Years | 0 (0.0%) | 0 (0.0%) |
| 5 Years | 0 (0.0%) | 0 (0.0%) |
| 6 to 11 Years | 0 (0.0%) | 0 (0.0%) |
| 12 to 14 Years | 0 (0.0%) | 0 (0.0%) |
| 15 Years | 0 (0.0%) | 0 (0.0%) |
| 16 and 17 Years | 0 (0.0%) | 0 (0.0%) |
| 18 to 24 Years | 0 (0.0%) | 0 (0.0%) |
| 25 to 34 Years | 0 (0.0%) | 1 (25.0%) |
| 35 to 44 Years | 0 (0.0%) | 0 (0.0%) |
| 45 to 54 Years | 5 (83.3%) | 3 (75.0%) |
| 55 to 64 Years | 0 (0.0%) | 1 (33.3%) |
| 65 to 74 Years | 2 (40.0%) | 1 (25.0%) |
| 75 Years and over | 0 (0.0%) | 3 (42.9%) |
| Total | 7 (30.4%) | 9 (29.0%) |
Income Above Poverty by Sex and Age in Centrahoma
According to the poverty statistics in Centrahoma, males aged under 5 years and females aged under 5 years are the age groups that are most secure financially, with 100.0% of males and 100.0% of females in these age groups living above the poverty line.
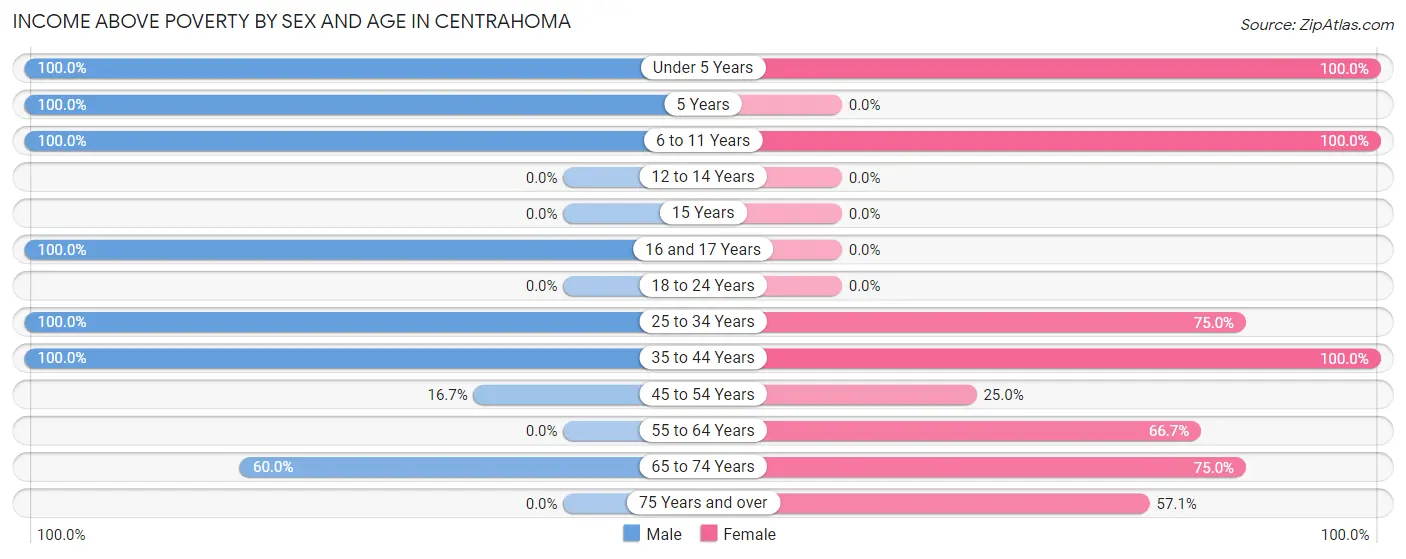
| Age Bracket | Male | Female |
| Under 5 Years | 1 (100.0%) | 4 (100.0%) |
| 5 Years | 1 (100.0%) | 0 (0.0%) |
| 6 to 11 Years | 3 (100.0%) | 4 (100.0%) |
| 12 to 14 Years | 0 (0.0%) | 0 (0.0%) |
| 15 Years | 0 (0.0%) | 0 (0.0%) |
| 16 and 17 Years | 1 (100.0%) | 0 (0.0%) |
| 18 to 24 Years | 0 (0.0%) | 0 (0.0%) |
| 25 to 34 Years | 2 (100.0%) | 3 (75.0%) |
| 35 to 44 Years | 4 (100.0%) | 1 (100.0%) |
| 45 to 54 Years | 1 (16.7%) | 1 (25.0%) |
| 55 to 64 Years | 0 (0.0%) | 2 (66.7%) |
| 65 to 74 Years | 3 (60.0%) | 3 (75.0%) |
| 75 Years and over | 0 (0.0%) | 4 (57.1%) |
| Total | 16 (69.6%) | 22 (71.0%) |
Income Below Poverty Among Married-Couple Families in Centrahoma
The poverty statistics for married-couple families in Centrahoma show that 33.3% or 2 of the total 6 families live below the poverty line. Families with no children have the highest poverty rate of 66.7%, comprising of 2 families. On the other hand, families with 1 or 2 children have the lowest poverty rate of 0.0%, which includes 0 families.
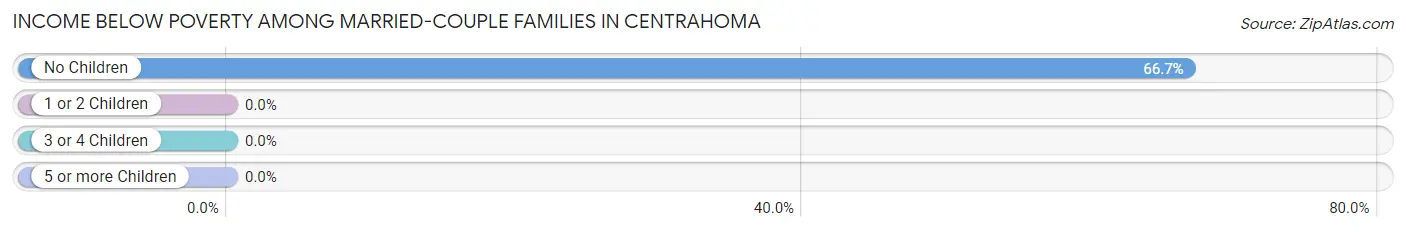
| Children | Above Poverty | Below Poverty |
| No Children | 1 (33.3%) | 2 (66.7%) |
| 1 or 2 Children | 1 (100.0%) | 0 (0.0%) |
| 3 or 4 Children | 2 (100.0%) | 0 (0.0%) |
| 5 or more Children | 0 (0.0%) | 0 (0.0%) |
| Total | 4 (66.7%) | 2 (33.3%) |
Income Below Poverty Among Single-Parent Households in Centrahoma
| Children | Single Father | Single Mother |
| No Children | 0 (0.0%) | 0 (0.0%) |
| 1 or 2 Children | 0 (0.0%) | 0 (0.0%) |
| 3 or 4 Children | 0 (0.0%) | 0 (0.0%) |
| 5 or more Children | 0 (0.0%) | 0 (0.0%) |
| Total | 0 (0.0%) | 0 (0.0%) |
Income Below Poverty Among Married-Couple vs Single-Parent Households in Centrahoma
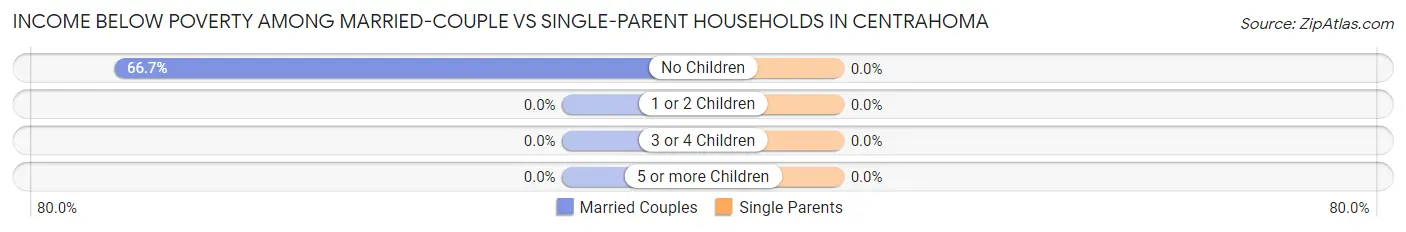
| Children | Married-Couple Families | Single-Parent Households |
| No Children | 2 (66.7%) | 0 (0.0%) |
| 1 or 2 Children | 0 (0.0%) | 0 (0.0%) |
| 3 or 4 Children | 0 (0.0%) | 0 (0.0%) |
| 5 or more Children | 0 (0.0%) | 0 (0.0%) |
| Total | 2 (33.3%) | 0 (0.0%) |
Race in Centrahoma
The most populous races in Centrahoma are White / Caucasian (37 | 68.5%), and Two or more Races (17 | 31.5%).
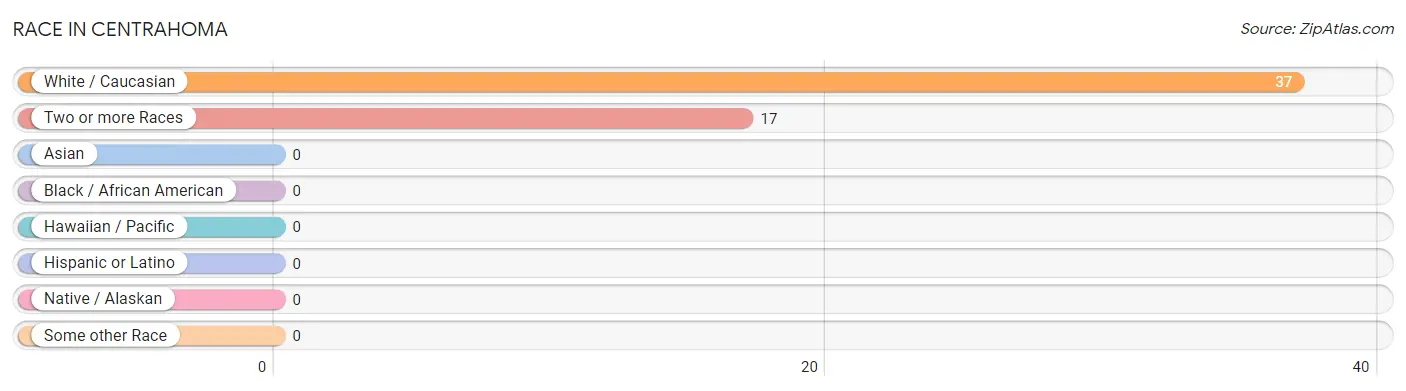
| Race | # Population | % Population |
| Asian | 0 | 0.0% |
| Black / African American | 0 | 0.0% |
| Hawaiian / Pacific | 0 | 0.0% |
| Hispanic or Latino | 0 | 0.0% |
| Native / Alaskan | 0 | 0.0% |
| White / Caucasian | 37 | 68.5% |
| Two or more Races | 17 | 31.5% |
| Some other Race | 0 | 0.0% |
| Total | 54 | 100.0% |
Ancestry in Centrahoma
The most populous ancestries reported in Centrahoma are Cherokee (11 | 20.4%), Italian (10 | 18.5%), Polish (10 | 18.5%), German (7 | 13.0%), and Irish (6 | 11.1%), together accounting for 81.5% of all Centrahoma residents.
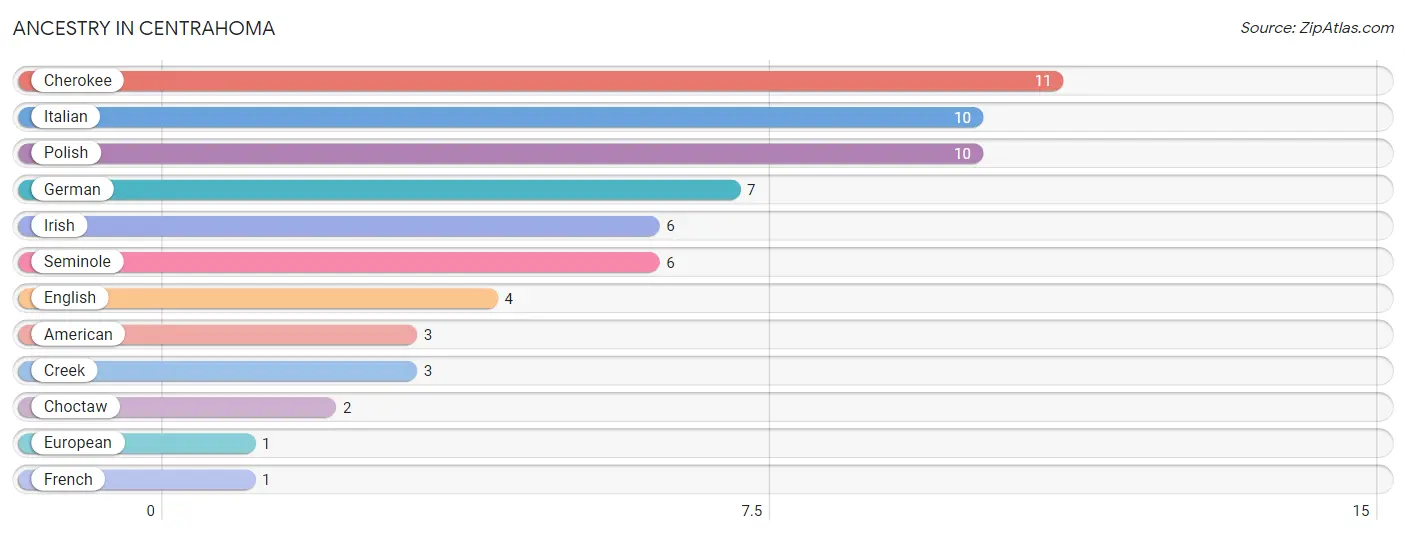
| Ancestry | # Population | % Population |
| American | 3 | 5.6% |
| Cherokee | 11 | 20.4% |
| Choctaw | 2 | 3.7% |
| Creek | 3 | 5.6% |
| English | 4 | 7.4% |
| European | 1 | 1.8% |
| French | 1 | 1.8% |
| German | 7 | 13.0% |
| Irish | 6 | 11.1% |
| Italian | 10 | 18.5% |
| Polish | 10 | 18.5% |
| Seminole | 6 | 11.1% | View All 12 Rows |
Immigrants in Centrahoma

| Immigration Origin | # Population | % Population | View All 0 Rows |
Sex and Age in Centrahoma
Sex and Age in Centrahoma
The most populous age groups in Centrahoma are 50 to 54 Years (6 | 26.1%) for men and 75 to 79 Years (7 | 22.6%) for women.
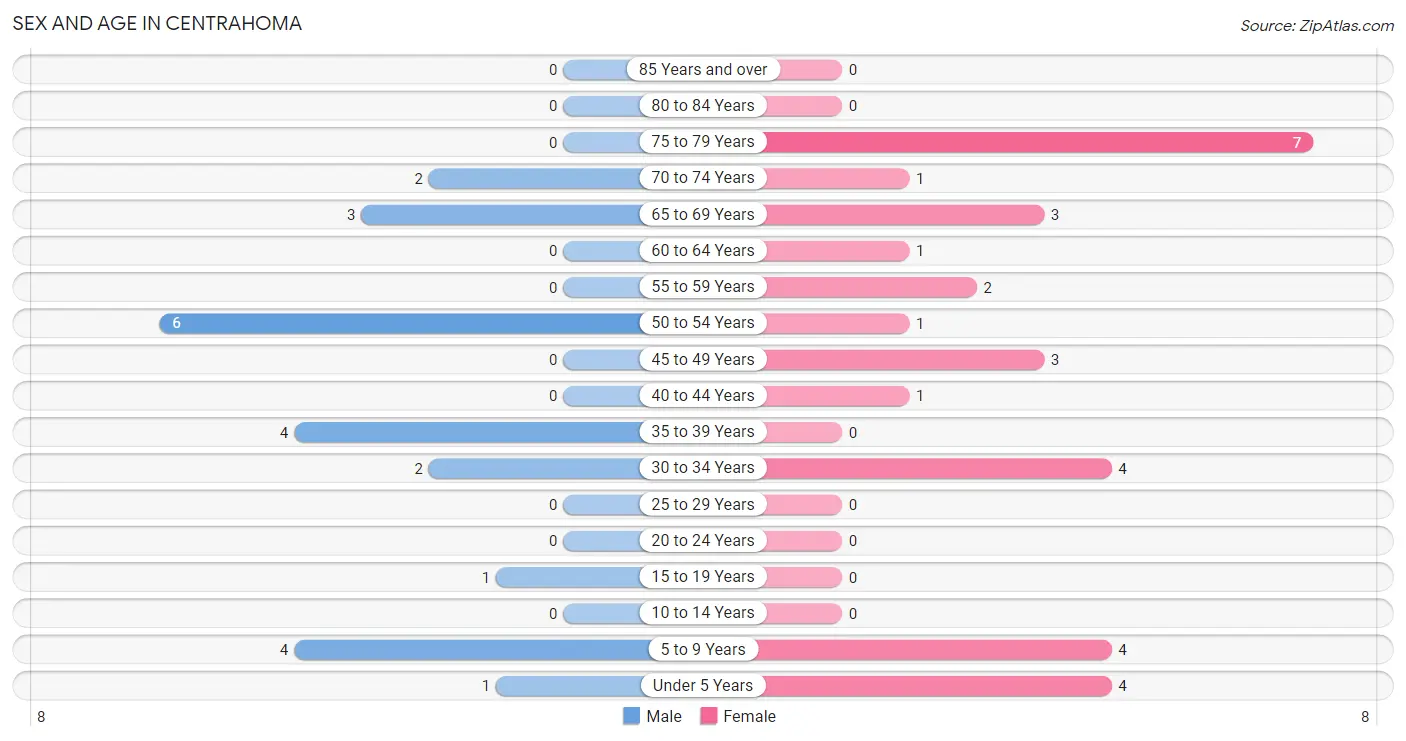
| Age Bracket | Male | Female |
| Under 5 Years | 1 (4.3%) | 4 (12.9%) |
| 5 to 9 Years | 4 (17.4%) | 4 (12.9%) |
| 10 to 14 Years | 0 (0.0%) | 0 (0.0%) |
| 15 to 19 Years | 1 (4.3%) | 0 (0.0%) |
| 20 to 24 Years | 0 (0.0%) | 0 (0.0%) |
| 25 to 29 Years | 0 (0.0%) | 0 (0.0%) |
| 30 to 34 Years | 2 (8.7%) | 4 (12.9%) |
| 35 to 39 Years | 4 (17.4%) | 0 (0.0%) |
| 40 to 44 Years | 0 (0.0%) | 1 (3.2%) |
| 45 to 49 Years | 0 (0.0%) | 3 (9.7%) |
| 50 to 54 Years | 6 (26.1%) | 1 (3.2%) |
| 55 to 59 Years | 0 (0.0%) | 2 (6.5%) |
| 60 to 64 Years | 0 (0.0%) | 1 (3.2%) |
| 65 to 69 Years | 3 (13.0%) | 3 (9.7%) |
| 70 to 74 Years | 2 (8.7%) | 1 (3.2%) |
| 75 to 79 Years | 0 (0.0%) | 7 (22.6%) |
| 80 to 84 Years | 0 (0.0%) | 0 (0.0%) |
| 85 Years and over | 0 (0.0%) | 0 (0.0%) |
| Total | 23 (100.0%) | 31 (100.0%) |
Families and Households in Centrahoma
Median Family Size in Centrahoma
The median family size in Centrahoma is 3.27 persons per family, with married-couple families (6 | 54.5%) accounting for the largest median family size of 4.17 persons per family. On the other hand, single female/mother families (1 | 9.1%) represent the smallest median family size with 2.00 persons per family.
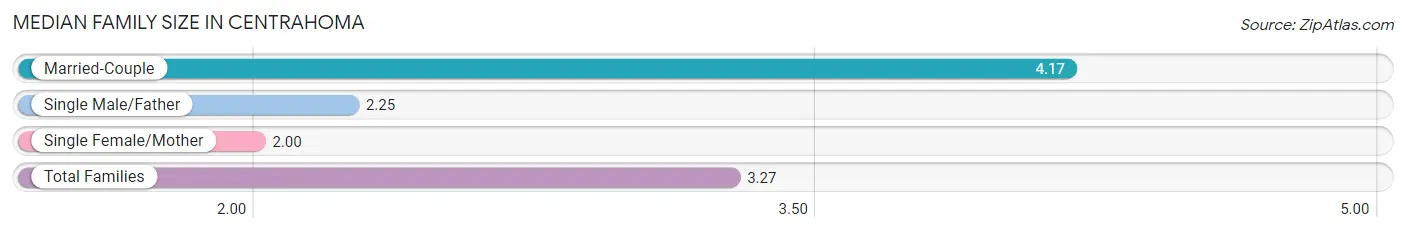
| Family Type | # Families | Family Size |
| Married-Couple | 6 (54.5%) | 4.17 |
| Single Male/Father | 4 (36.4%) | 2.25 |
| Single Female/Mother | 1 (9.1%) | 2.00 |
| Total Families | 11 (100.0%) | 3.27 |
Median Household Size in Centrahoma
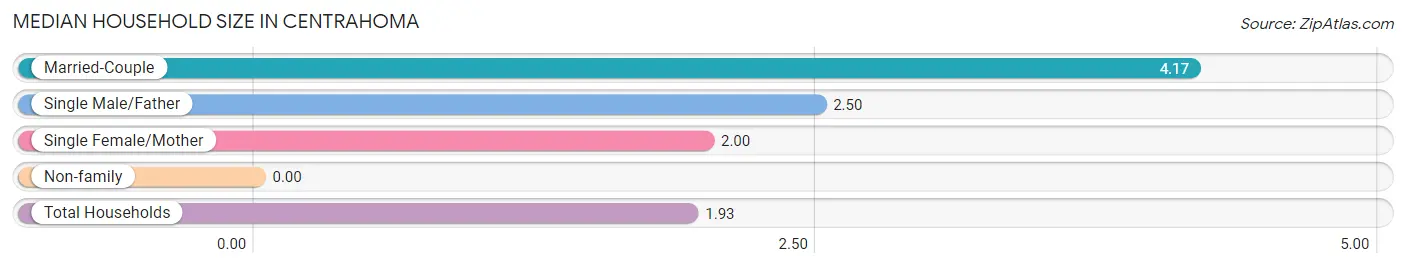
| Household Type | # Households | Household Size |
| Married-Couple | 6 (21.4%) | 4.17 |
| Single Male/Father | 4 (14.3%) | 2.50 |
| Single Female/Mother | 1 (3.6%) | 2.00 |
| Non-family | 17 (60.7%) | - |
| Total Households | 28 (100.0%) | 1.93 |
Household Size by Marriage Status in Centrahoma
Out of a total of 28 households in Centrahoma, 11 (39.3%) are family households, while 17 (60.7%) are nonfamily households. The most numerous type of family households are 5-person households, comprising 6, and the most common type of nonfamily households are 1-person households, comprising 17.
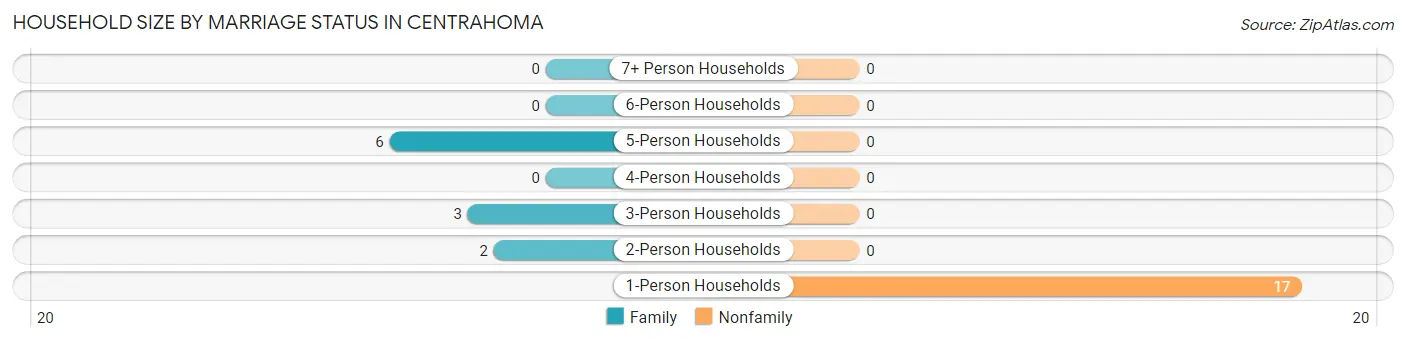
| Household Size | Family Households | Nonfamily Households |
| 1-Person Households | - | 17 (60.7%) |
| 2-Person Households | 2 (7.1%) | 0 (0.0%) |
| 3-Person Households | 3 (10.7%) | 0 (0.0%) |
| 4-Person Households | 0 (0.0%) | 0 (0.0%) |
| 5-Person Households | 6 (21.4%) | 0 (0.0%) |
| 6-Person Households | 0 (0.0%) | 0 (0.0%) |
| 7+ Person Households | 0 (0.0%) | 0 (0.0%) |
| Total | 11 (39.3%) | 17 (60.7%) |
Female Fertility in Centrahoma
Fertility by Age in Centrahoma
Average fertility rate in Centrahoma is 500.0 births per 1,000 women. Women in the age bracket of 20 to 34 years have the highest fertility rate with 1,000.0 births per 1,000 women. Women in the age bracket of 20 to 34 years acount for 100.0% of all women with births.
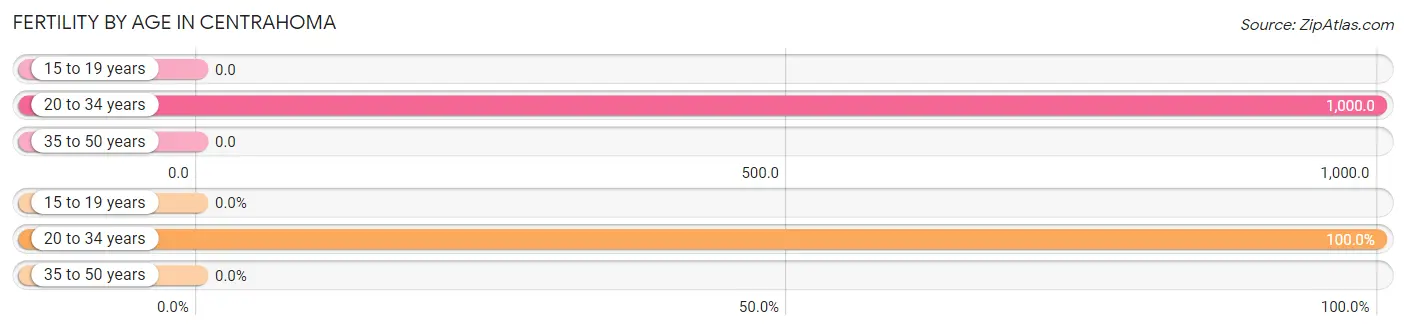
| Age Bracket | Women with Births | Births / 1,000 Women |
| 15 to 19 years | 0 (0.0%) | 0.0 |
| 20 to 34 years | 4 (100.0%) | 1,000.0 |
| 35 to 50 years | 0 (0.0%) | 0.0 |
| Total | 4 (100.0%) | 500.0 |
Fertility by Age by Marriage Status in Centrahoma
75.0% of women with births (4) in Centrahoma are married. The highest percentage of unmarried women with births falls into 20 to 34 years age bracket with 25.0% of them unmarried at the time of birth, while the lowest percentage of unmarried women with births belong to 20 to 34 years age bracket with 25.0% of them unmarried.
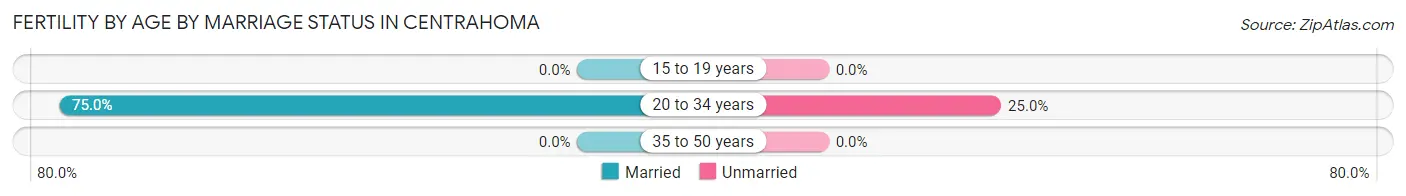
| Age Bracket | Married | Unmarried |
| 15 to 19 years | 0 (0.0%) | 0 (0.0%) |
| 20 to 34 years | 3 (75.0%) | 1 (25.0%) |
| 35 to 50 years | 0 (0.0%) | 0 (0.0%) |
| Total | 3 (75.0%) | 1 (25.0%) |
Fertility by Education in Centrahoma
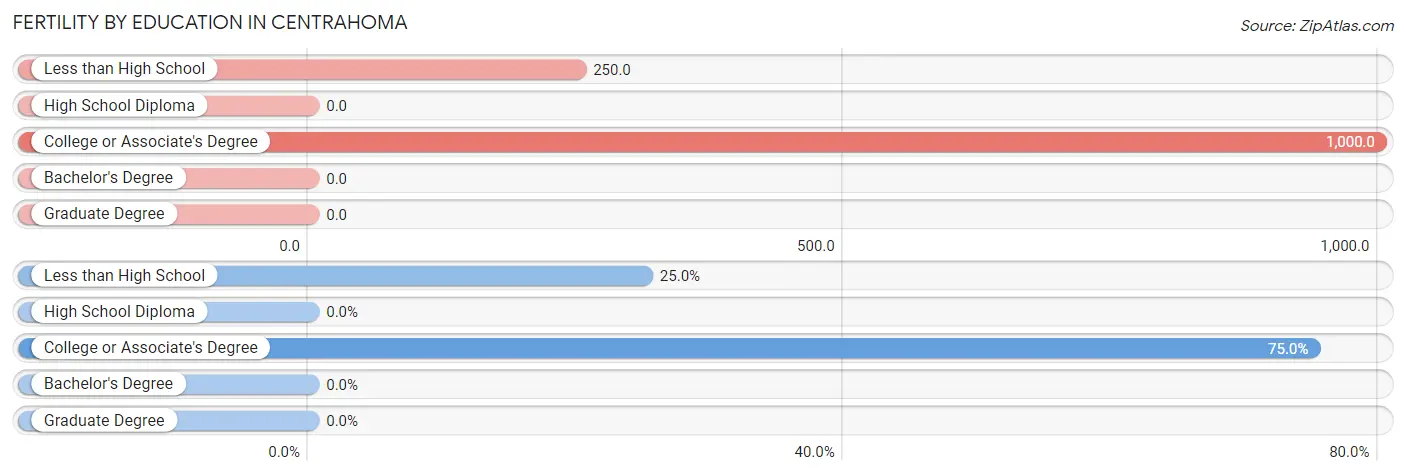
| Educational Attainment | Women with Births | Births / 1,000 Women |
| Less than High School | 1 (25.0%) | 250.0 |
| High School Diploma | 0 (0.0%) | 0.0 |
| College or Associate's Degree | 3 (75.0%) | 1,000.0 |
| Bachelor's Degree | 0 (0.0%) | 0.0 |
| Graduate Degree | 0 (0.0%) | 0.0 |
| Total | 4 (100.0%) | 500.0 |
Fertility by Education by Marriage Status in Centrahoma
25.0% of women with births in Centrahoma are unmarried. Women with the educational attainment of college or associate's degree are most likely to be married with 100.0% of them married at childbirth, while women with the educational attainment of less than high school are least likely to be married with 100.0% of them unmarried at childbirth.
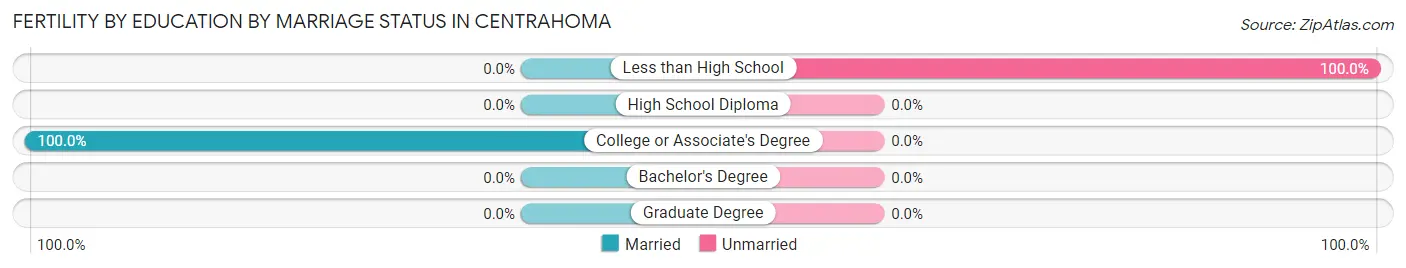
| Educational Attainment | Married | Unmarried |
| Less than High School | 0 (0.0%) | 1 (100.0%) |
| High School Diploma | 0 (0.0%) | 0 (0.0%) |
| College or Associate's Degree | 3 (100.0%) | 0 (0.0%) |
| Bachelor's Degree | 0 (0.0%) | 0 (0.0%) |
| Graduate Degree | 0 (0.0%) | 0 (0.0%) |
| Total | 3 (75.0%) | 1 (25.0%) |
Employment Characteristics in Centrahoma
Employment by Class of Employer in Centrahoma
Among the 10 employed individuals in Centrahoma, private company employees (9 | 90.0%), and unpaid family workers (1 | 10.0%) make up the most common classes of employment.
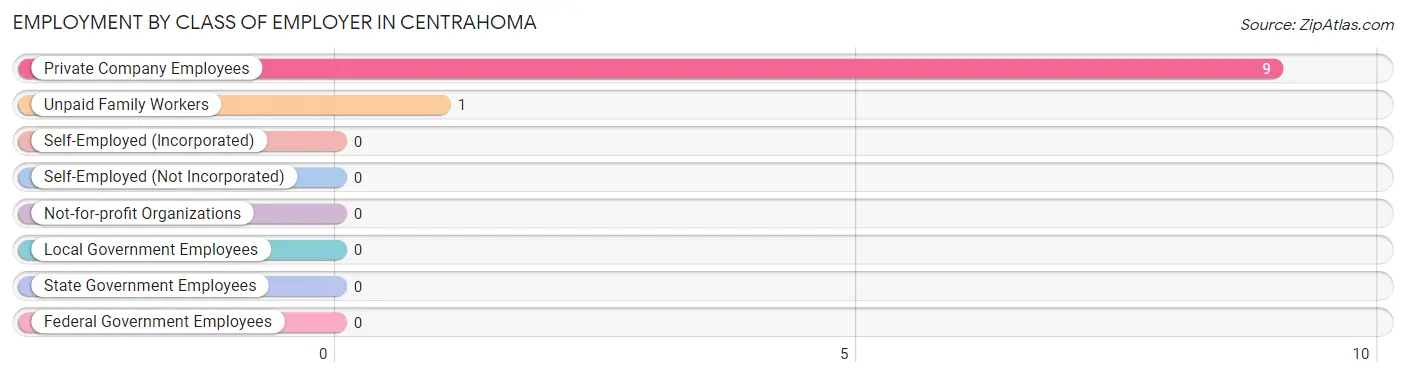
| Employer Class | # Employees | % Employees |
| Private Company Employees | 9 | 90.0% |
| Self-Employed (Incorporated) | 0 | 0.0% |
| Self-Employed (Not Incorporated) | 0 | 0.0% |
| Not-for-profit Organizations | 0 | 0.0% |
| Local Government Employees | 0 | 0.0% |
| State Government Employees | 0 | 0.0% |
| Federal Government Employees | 0 | 0.0% |
| Unpaid Family Workers | 1 | 10.0% |
| Total | 10 | 100.0% |
Employment Status by Age in Centrahoma
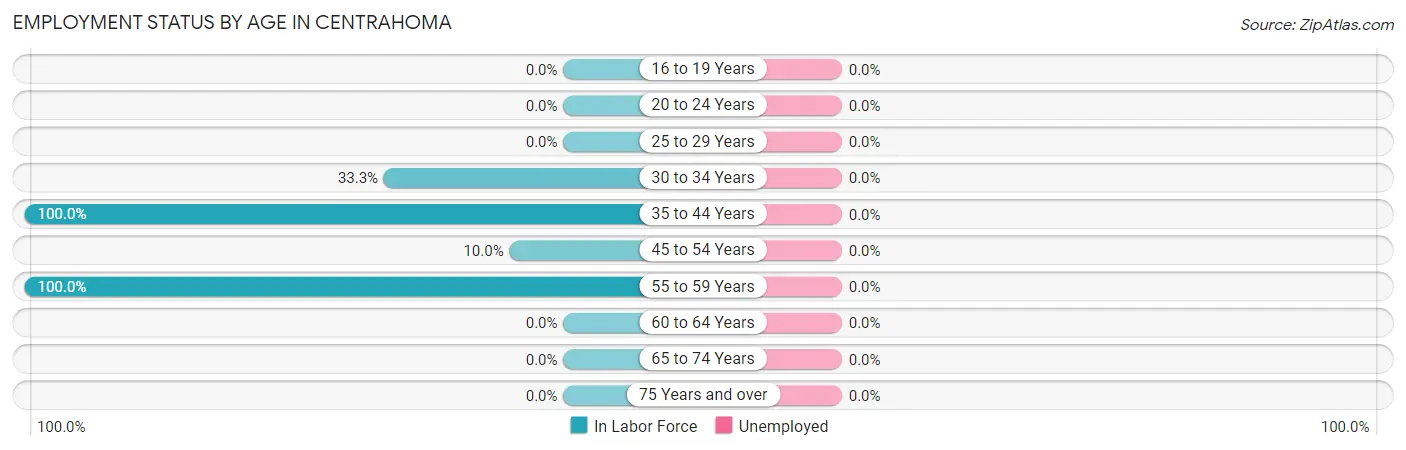
| Age Bracket | In Labor Force | Unemployed |
| 16 to 19 Years | 0 (0.0%) | 0 (0.0%) |
| 20 to 24 Years | 0 (0.0%) | 0 (0.0%) |
| 25 to 29 Years | 0 (0.0%) | 0 (0.0%) |
| 30 to 34 Years | 2 (33.3%) | 0 (0.0%) |
| 35 to 44 Years | 5 (100.0%) | 0 (0.0%) |
| 45 to 54 Years | 1 (10.0%) | 0 (0.0%) |
| 55 to 59 Years | 2 (100.0%) | 0 (0.0%) |
| 60 to 64 Years | 0 (0.0%) | 0 (0.0%) |
| 65 to 74 Years | 0 (0.0%) | 0 (0.0%) |
| 75 Years and over | 0 (0.0%) | 0 (0.0%) |
| Total | 10 (24.4%) | 0 (0.0%) |
Employment Status by Educational Attainment in Centrahoma
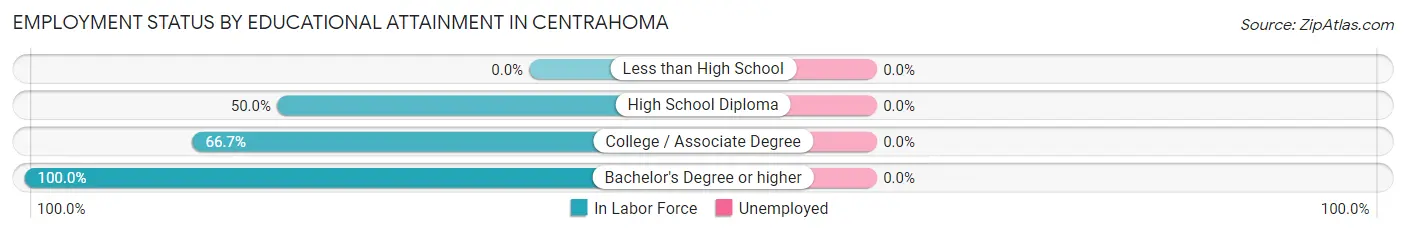
| Educational Attainment | In Labor Force | Unemployed |
| Less than High School | 0 (0.0%) | 0 (0.0%) |
| High School Diploma | 1 (50.0%) | 0 (0.0%) |
| College / Associate Degree | 8 (66.7%) | 0 (0.0%) |
| Bachelor's Degree or higher | 1 (100.0%) | 0 (0.0%) |
| Total | 10 (41.7%) | 0 (0.0%) |
Employment Occupations by Sex in Centrahoma
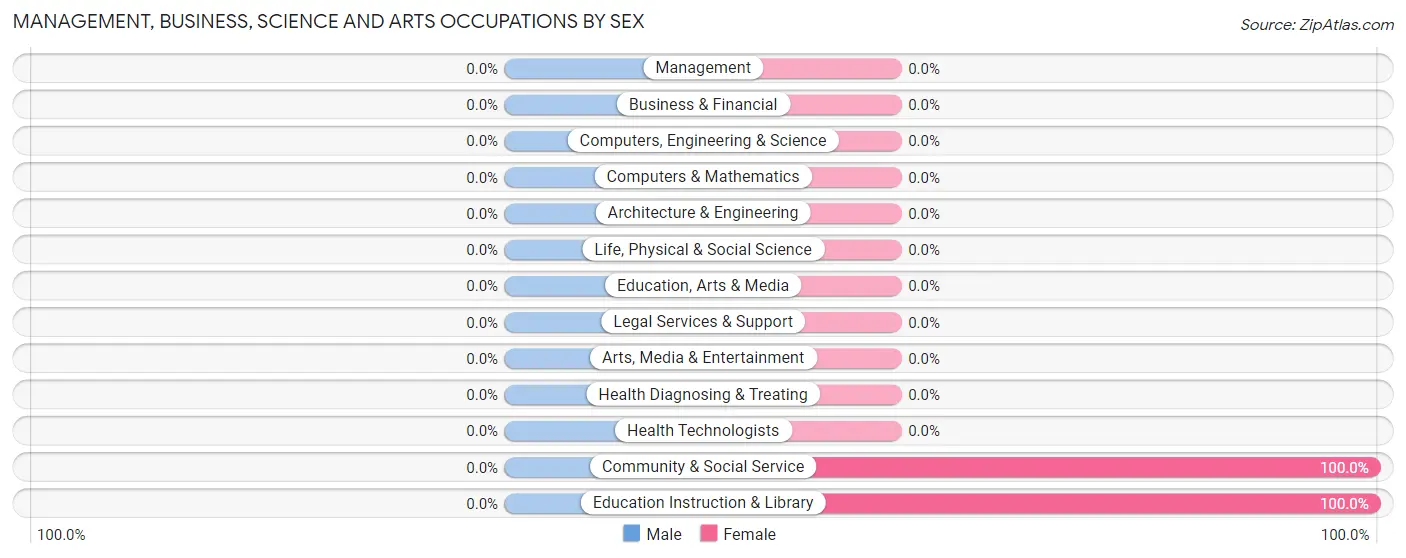
Management, Business, Science and Arts Occupations
The most common Management, Business, Science and Arts occupations in Centrahoma are Community & Social Service (1 | 10.0%), and Education Instruction & Library (1 | 10.0%).
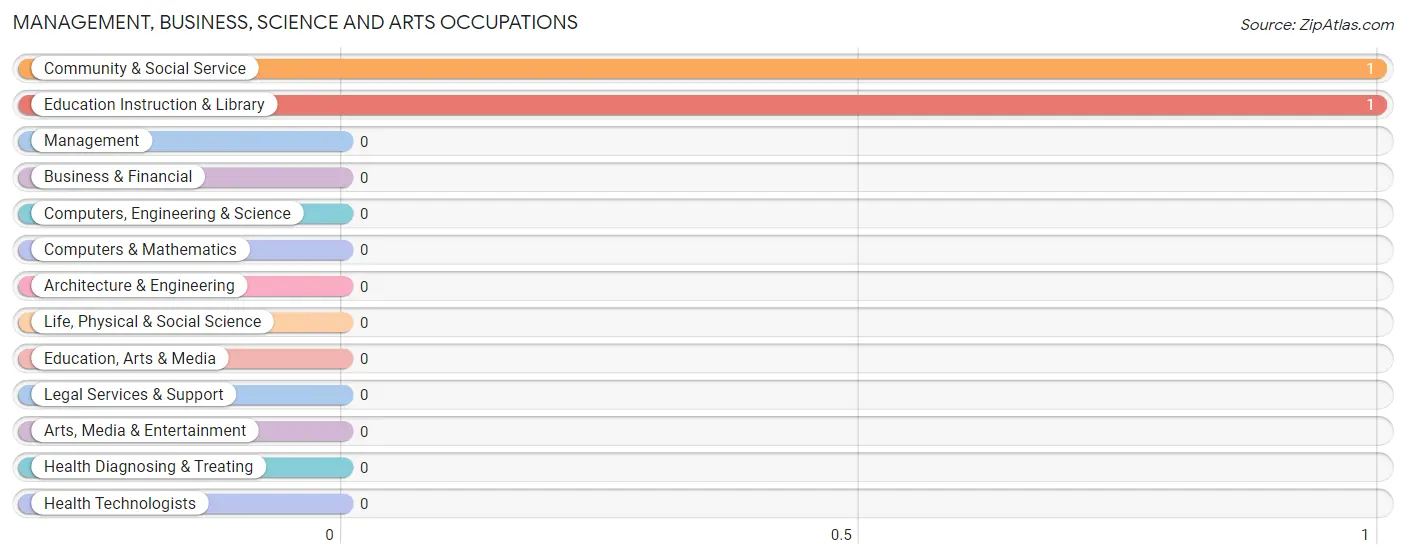
Management, Business, Science and Arts Occupations by Sex
| Occupation | Male | Female |
| Management | 0 (0.0%) | 0 (0.0%) |
| Business & Financial | 0 (0.0%) | 0 (0.0%) |
| Computers, Engineering & Science | 0 (0.0%) | 0 (0.0%) |
| Computers & Mathematics | 0 (0.0%) | 0 (0.0%) |
| Architecture & Engineering | 0 (0.0%) | 0 (0.0%) |
| Life, Physical & Social Science | 0 (0.0%) | 0 (0.0%) |
| Community & Social Service | 0 (0.0%) | 1 (100.0%) |
| Education, Arts & Media | 0 (0.0%) | 0 (0.0%) |
| Legal Services & Support | 0 (0.0%) | 0 (0.0%) |
| Education Instruction & Library | 0 (0.0%) | 1 (100.0%) |
| Arts, Media & Entertainment | 0 (0.0%) | 0 (0.0%) |
| Health Diagnosing & Treating | 0 (0.0%) | 0 (0.0%) |
| Health Technologists | 0 (0.0%) | 0 (0.0%) |
| Total (Category) | 0 (0.0%) | 1 (100.0%) |
| Total (Overall) | 6 (60.0%) | 4 (40.0%) |
Services Occupations
Services Occupations by Sex
| Occupation | Male | Female |
| Healthcare Support | 0 (0.0%) | 0 (0.0%) |
| Security & Protection | 0 (0.0%) | 0 (0.0%) |
| Firefighting & Prevention | 0 (0.0%) | 0 (0.0%) |
| Law Enforcement | 0 (0.0%) | 0 (0.0%) |
| Food Preparation & Serving | 0 (0.0%) | 0 (0.0%) |
| Cleaning & Maintenance | 0 (0.0%) | 0 (0.0%) |
| Personal Care & Service | 0 (0.0%) | 0 (0.0%) |
| Total (Category) | 0 (0.0%) | 0 (0.0%) |
| Total (Overall) | 6 (60.0%) | 4 (40.0%) |
Sales and Office Occupations
The most common Sales and Office occupations in Centrahoma are , and Office & Administration (2 | 20.0%).
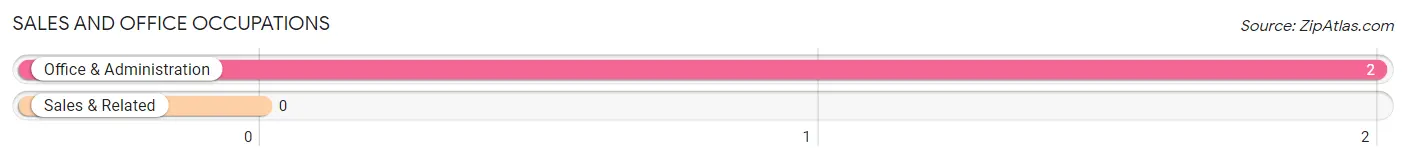
Sales and Office Occupations by Sex
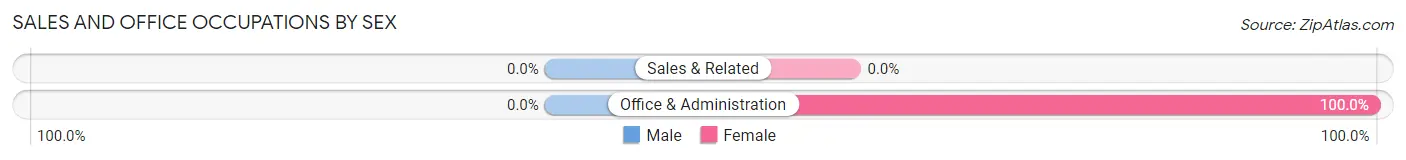
| Occupation | Male | Female |
| Sales & Related | 0 (0.0%) | 0 (0.0%) |
| Office & Administration | 0 (0.0%) | 2 (100.0%) |
| Total (Category) | 0 (0.0%) | 2 (100.0%) |
| Total (Overall) | 6 (60.0%) | 4 (40.0%) |
Natural Resources, Construction and Maintenance Occupations
The most common Natural Resources, Construction and Maintenance occupations in Centrahoma are Construction & Extraction (4 | 40.0%), and Farming, Fishing & Forestry (1 | 10.0%).
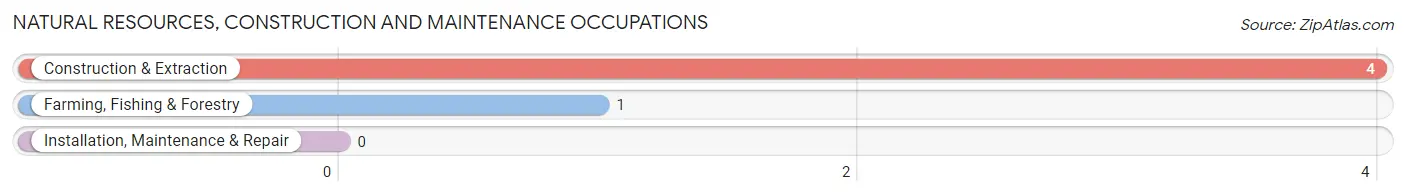
Natural Resources, Construction and Maintenance Occupations by Sex
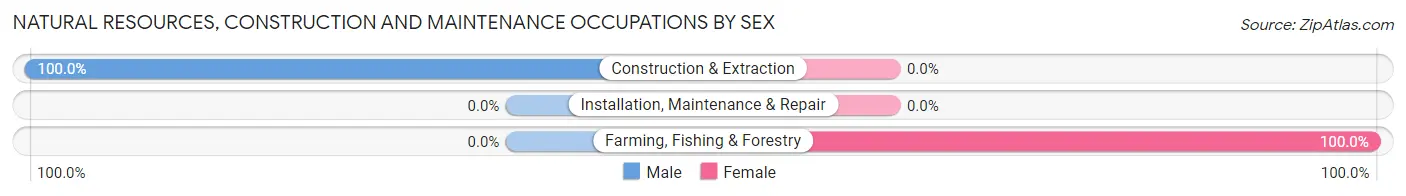
| Occupation | Male | Female |
| Farming, Fishing & Forestry | 0 (0.0%) | 1 (100.0%) |
| Construction & Extraction | 4 (100.0%) | 0 (0.0%) |
| Installation, Maintenance & Repair | 0 (0.0%) | 0 (0.0%) |
| Total (Category) | 4 (80.0%) | 1 (20.0%) |
| Total (Overall) | 6 (60.0%) | 4 (40.0%) |
Production, Transportation and Moving Occupations
The most common Production, Transportation and Moving occupations in Centrahoma are , and Production (2 | 20.0%).
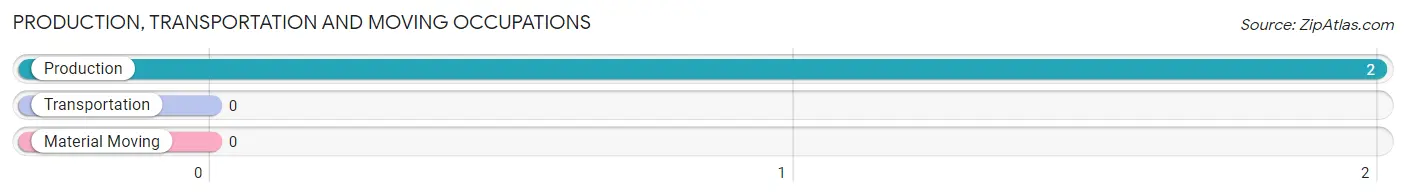
Production, Transportation and Moving Occupations by Sex
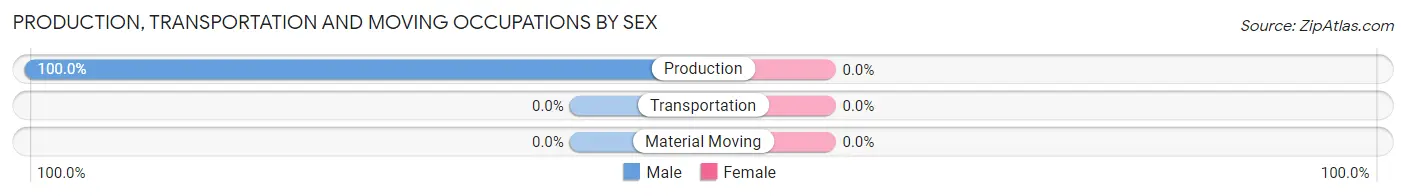
| Occupation | Male | Female |
| Production | 2 (100.0%) | 0 (0.0%) |
| Transportation | 0 (0.0%) | 0 (0.0%) |
| Material Moving | 0 (0.0%) | 0 (0.0%) |
| Total (Category) | 2 (100.0%) | 0 (0.0%) |
| Total (Overall) | 6 (60.0%) | 4 (40.0%) |
Employment Industries by Sex in Centrahoma
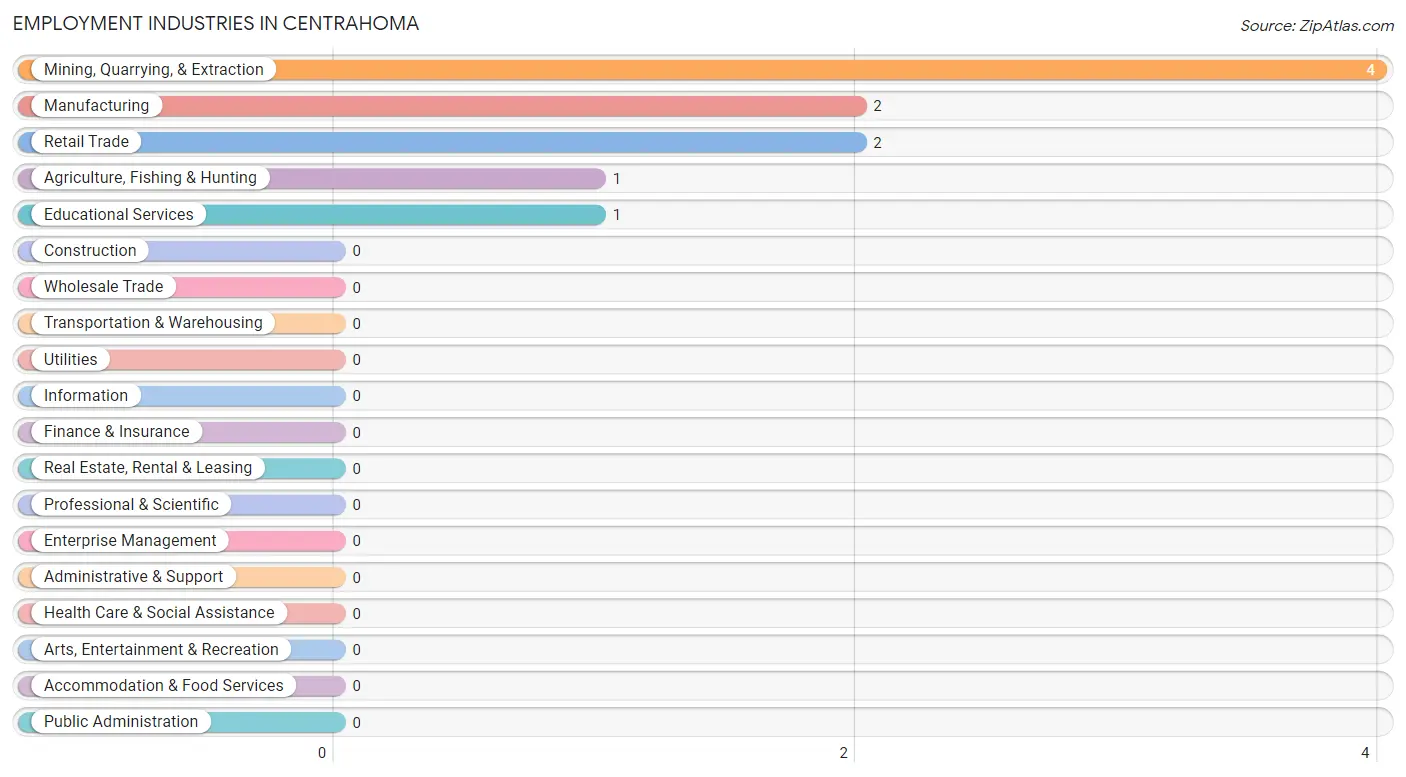
Employment Industries in Centrahoma
The major employment industries in Centrahoma include Mining, Quarrying, & Extraction (4 | 40.0%), Manufacturing (2 | 20.0%), Retail Trade (2 | 20.0%), Agriculture, Fishing & Hunting (1 | 10.0%), and Educational Services (1 | 10.0%).
Employment Industries by Sex in Centrahoma
The Centrahoma industries that see more men than women are Mining, Quarrying, & Extraction (100.0%), and Manufacturing (100.0%), whereas the industries that tend to have a higher number of women are Agriculture, Fishing & Hunting (100.0%), Retail Trade (100.0%), and Educational Services (100.0%).
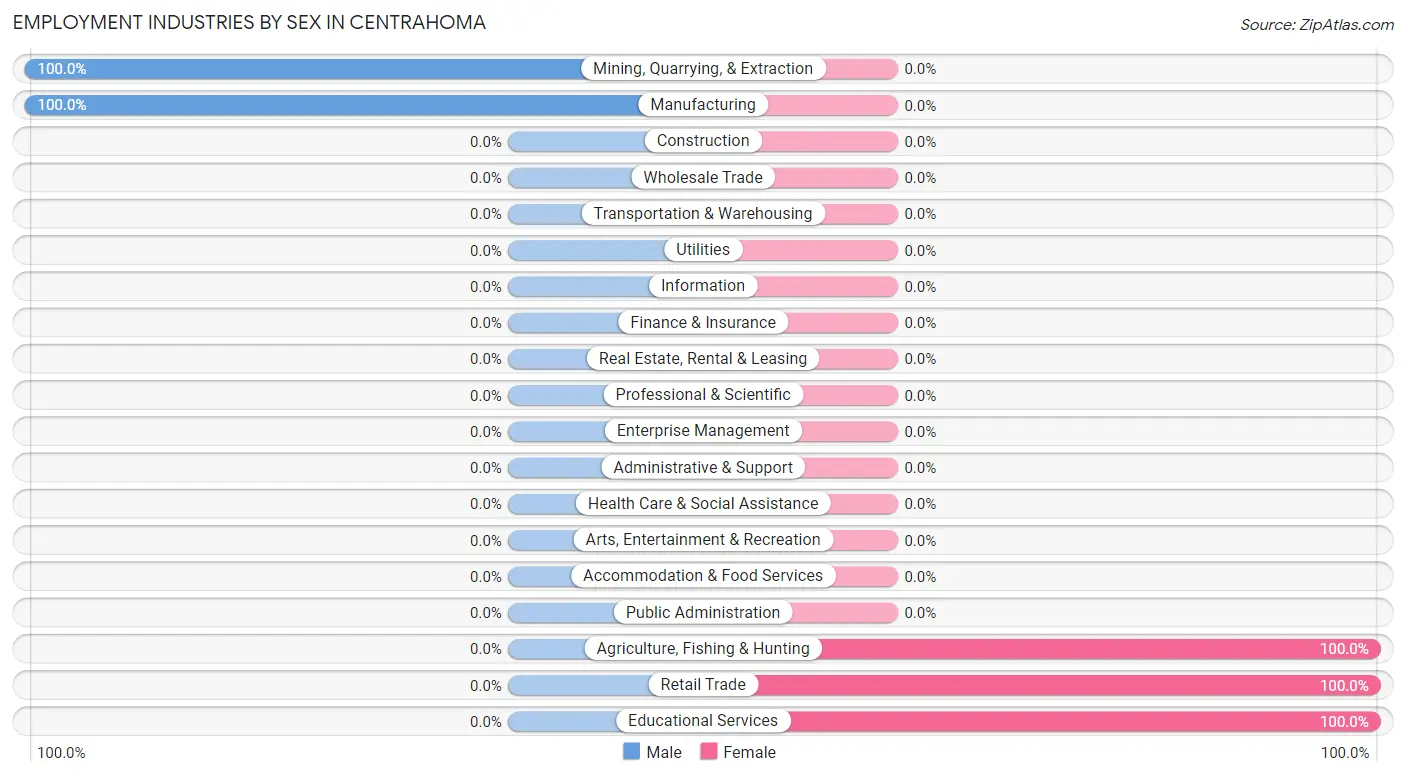
| Industry | Male | Female |
| Agriculture, Fishing & Hunting | 0 (0.0%) | 1 (100.0%) |
| Mining, Quarrying, & Extraction | 4 (100.0%) | 0 (0.0%) |
| Construction | 0 (0.0%) | 0 (0.0%) |
| Manufacturing | 2 (100.0%) | 0 (0.0%) |
| Wholesale Trade | 0 (0.0%) | 0 (0.0%) |
| Retail Trade | 0 (0.0%) | 2 (100.0%) |
| Transportation & Warehousing | 0 (0.0%) | 0 (0.0%) |
| Utilities | 0 (0.0%) | 0 (0.0%) |
| Information | 0 (0.0%) | 0 (0.0%) |
| Finance & Insurance | 0 (0.0%) | 0 (0.0%) |
| Real Estate, Rental & Leasing | 0 (0.0%) | 0 (0.0%) |
| Professional & Scientific | 0 (0.0%) | 0 (0.0%) |
| Enterprise Management | 0 (0.0%) | 0 (0.0%) |
| Administrative & Support | 0 (0.0%) | 0 (0.0%) |
| Educational Services | 0 (0.0%) | 1 (100.0%) |
| Health Care & Social Assistance | 0 (0.0%) | 0 (0.0%) |
| Arts, Entertainment & Recreation | 0 (0.0%) | 0 (0.0%) |
| Accommodation & Food Services | 0 (0.0%) | 0 (0.0%) |
| Public Administration | 0 (0.0%) | 0 (0.0%) |
| Total | 6 (60.0%) | 4 (40.0%) |
Education in Centrahoma
School Enrollment in Centrahoma
The most common levels of schooling among the 9 students in Centrahoma are kindergarten (4 | 44.4%), elementary school (4 | 44.4%), and high school (1 | 11.1%).
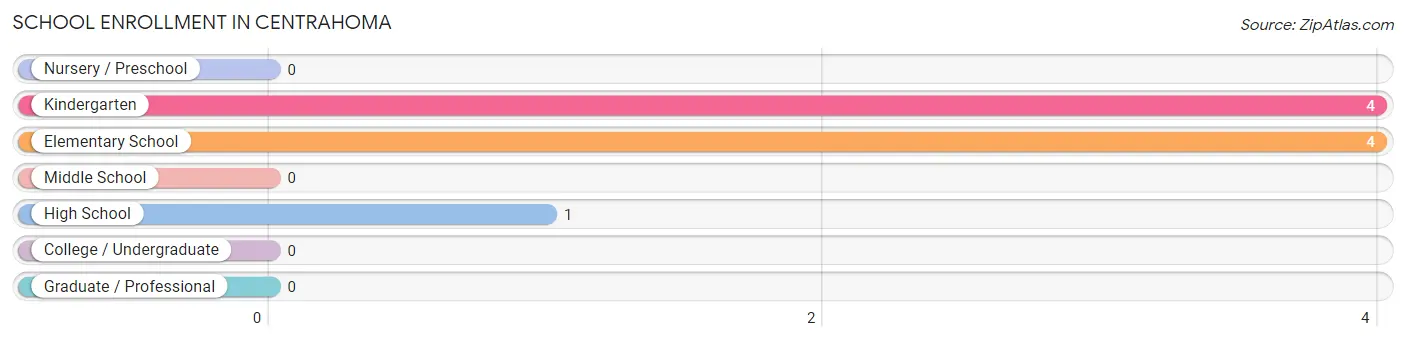
| School Level | # Students | % Students |
| Nursery / Preschool | 0 | 0.0% |
| Kindergarten | 4 | 44.4% |
| Elementary School | 4 | 44.4% |
| Middle School | 0 | 0.0% |
| High School | 1 | 11.1% |
| College / Undergraduate | 0 | 0.0% |
| Graduate / Professional | 0 | 0.0% |
| Total | 9 | 100.0% |
School Enrollment by Age by Funding Source in Centrahoma
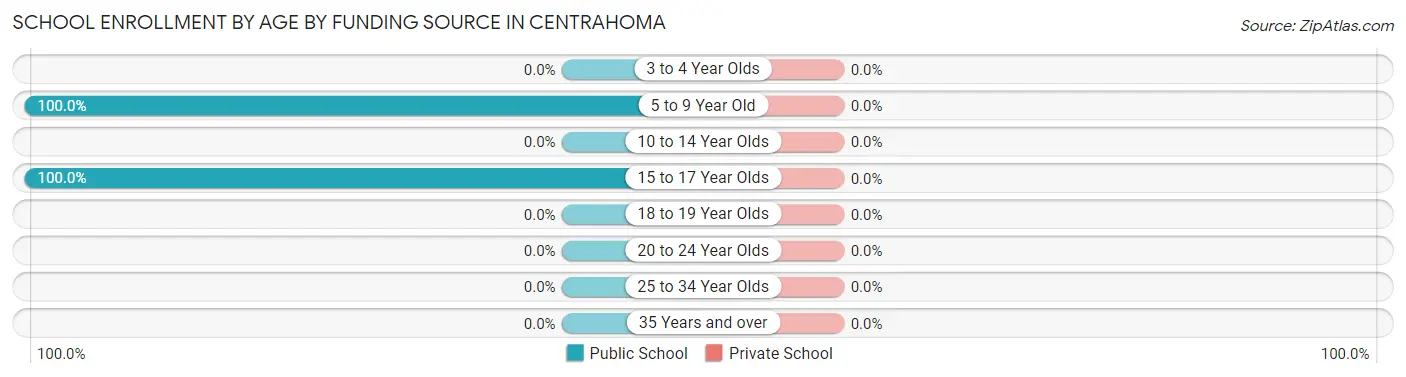
| Age Bracket | Public School | Private School |
| 3 to 4 Year Olds | 0 (0.0%) | 0 (0.0%) |
| 5 to 9 Year Old | 8 (100.0%) | 0 (0.0%) |
| 10 to 14 Year Olds | 0 (0.0%) | 0 (0.0%) |
| 15 to 17 Year Olds | 1 (100.0%) | 0 (0.0%) |
| 18 to 19 Year Olds | 0 (0.0%) | 0 (0.0%) |
| 20 to 24 Year Olds | 0 (0.0%) | 0 (0.0%) |
| 25 to 34 Year Olds | 0 (0.0%) | 0 (0.0%) |
| 35 Years and over | 0 (0.0%) | 0 (0.0%) |
| Total | 9 (100.0%) | 0 (0.0%) |
Educational Attainment by Field of Study in Centrahoma
, and bio, nature & agricultural (1 | 100.0%) are the most common fields of study among 1 individuals in Centrahoma who have obtained a bachelor's degree or higher.
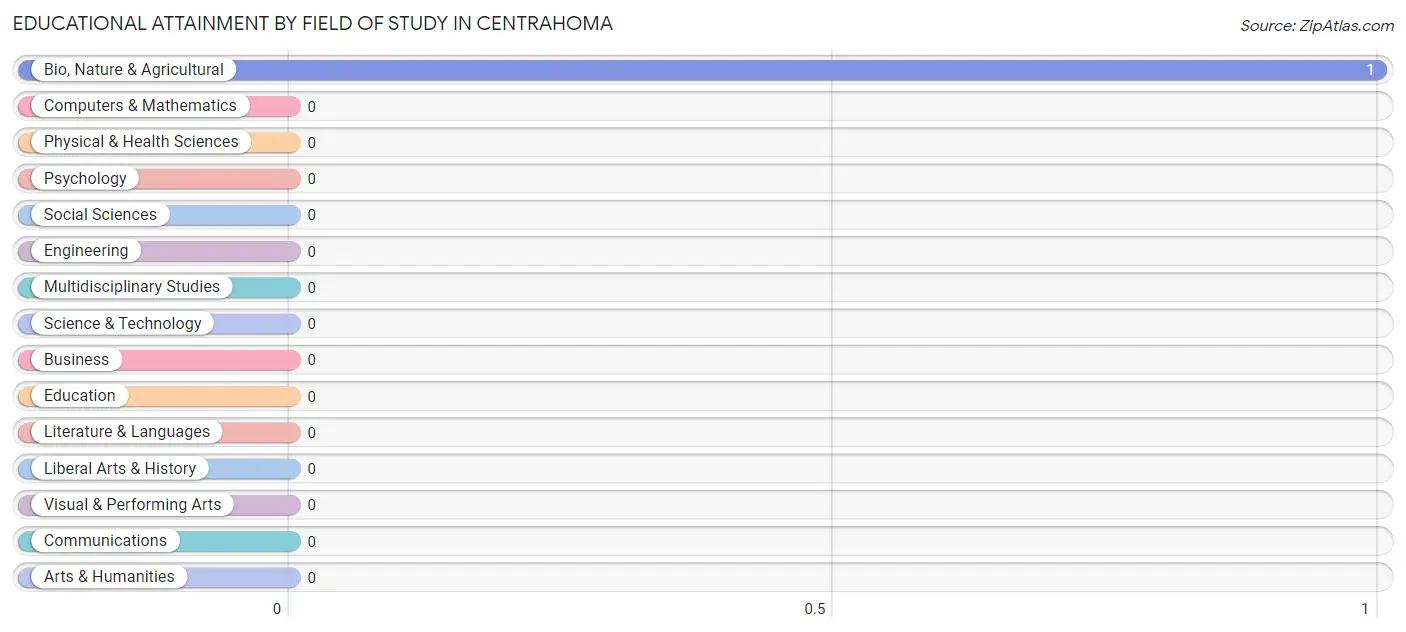
| Field of Study | # Graduates | % Graduates |
| Computers & Mathematics | 0 | 0.0% |
| Bio, Nature & Agricultural | 1 | 100.0% |
| Physical & Health Sciences | 0 | 0.0% |
| Psychology | 0 | 0.0% |
| Social Sciences | 0 | 0.0% |
| Engineering | 0 | 0.0% |
| Multidisciplinary Studies | 0 | 0.0% |
| Science & Technology | 0 | 0.0% |
| Business | 0 | 0.0% |
| Education | 0 | 0.0% |
| Literature & Languages | 0 | 0.0% |
| Liberal Arts & History | 0 | 0.0% |
| Visual & Performing Arts | 0 | 0.0% |
| Communications | 0 | 0.0% |
| Arts & Humanities | 0 | 0.0% |
| Total | 1 | 100.0% |
Transportation & Commute in Centrahoma
Vehicle Availability by Sex in Centrahoma
The most prevalent vehicle ownership categories in Centrahoma are males with 5 or more vehicles (4, accounting for 66.7%) and females with 5 or more vehicles (0, making up 100.0%).
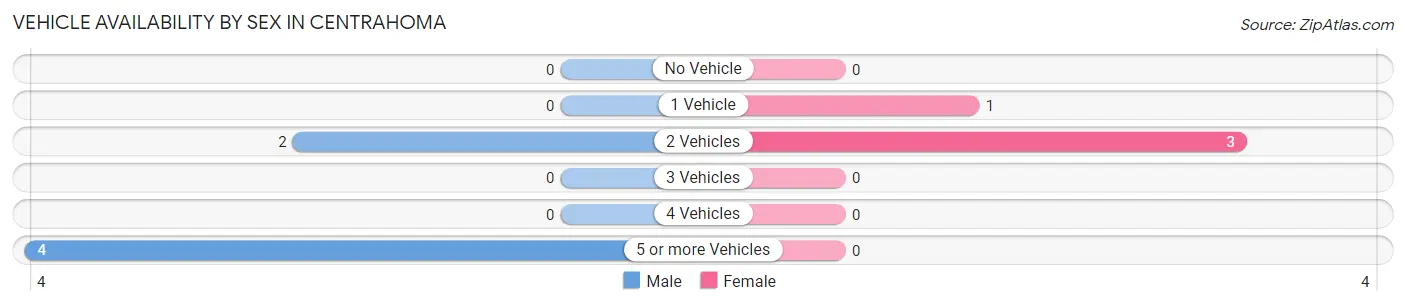
| Vehicles Available | Male | Female |
| No Vehicle | 0 (0.0%) | 0 (0.0%) |
| 1 Vehicle | 0 (0.0%) | 1 (25.0%) |
| 2 Vehicles | 2 (33.3%) | 3 (75.0%) |
| 3 Vehicles | 0 (0.0%) | 0 (0.0%) |
| 4 Vehicles | 0 (0.0%) | 0 (0.0%) |
| 5 or more Vehicles | 4 (66.7%) | 0 (0.0%) |
| Total | 6 (100.0%) | 4 (100.0%) |
Commute Time in Centrahoma
The most frequently occuring commute durations in Centrahoma are 30 to 34 minutes (8 commuters, 88.9%), 45 to 59 minutes (1 commuters, 11.1%), and less than 5 minutes (0 commuters, 0.0%).
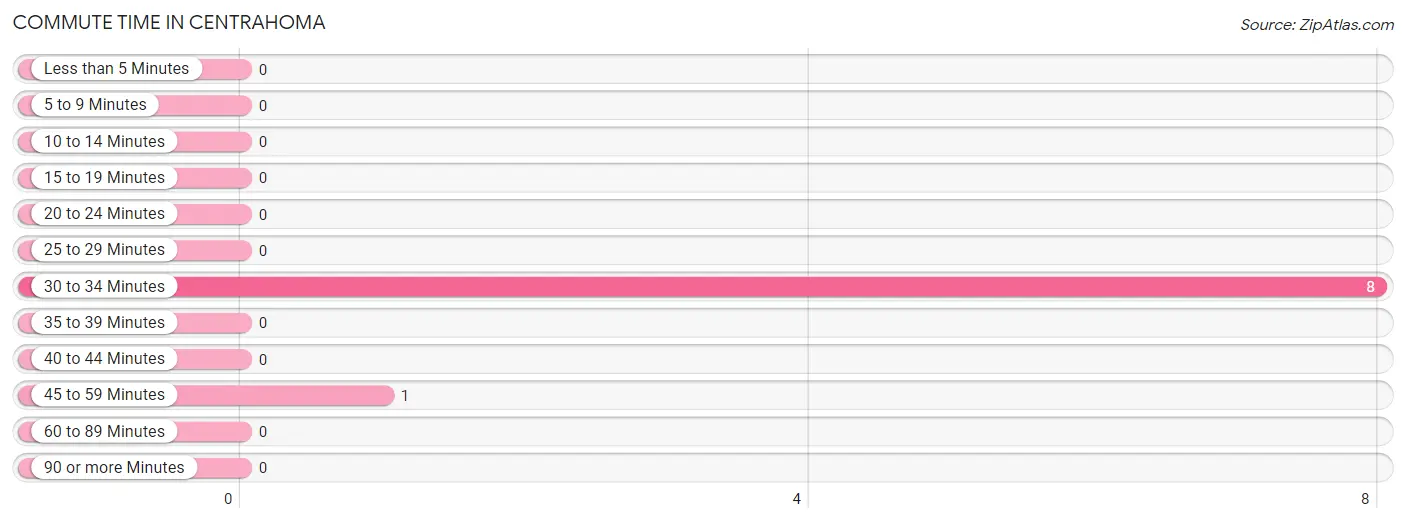
| Commute Time | # Commuters | % Commuters |
| Less than 5 Minutes | 0 | 0.0% |
| 5 to 9 Minutes | 0 | 0.0% |
| 10 to 14 Minutes | 0 | 0.0% |
| 15 to 19 Minutes | 0 | 0.0% |
| 20 to 24 Minutes | 0 | 0.0% |
| 25 to 29 Minutes | 0 | 0.0% |
| 30 to 34 Minutes | 8 | 88.9% |
| 35 to 39 Minutes | 0 | 0.0% |
| 40 to 44 Minutes | 0 | 0.0% |
| 45 to 59 Minutes | 1 | 11.1% |
| 60 to 89 Minutes | 0 | 0.0% |
| 90 or more Minutes | 0 | 0.0% |
Commute Time by Sex in Centrahoma
The most common commute times in Centrahoma are 30 to 34 minutes (6 commuters, 100.0%) for males and 30 to 34 minutes (2 commuters, 66.7%) for females.
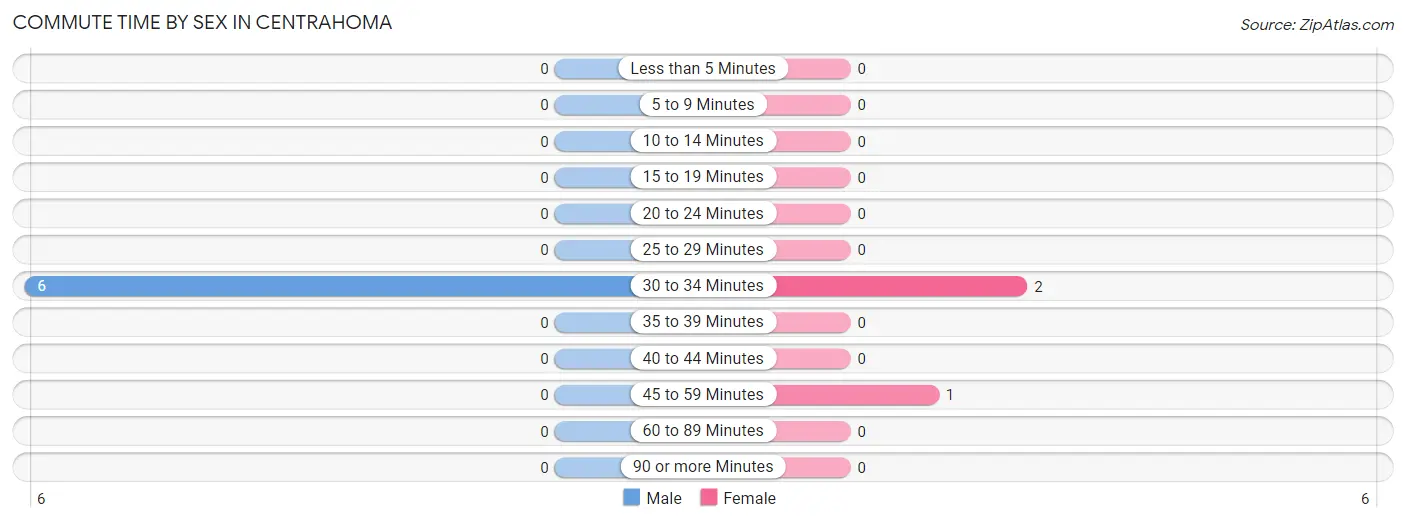
| Commute Time | Male | Female |
| Less than 5 Minutes | 0 (0.0%) | 0 (0.0%) |
| 5 to 9 Minutes | 0 (0.0%) | 0 (0.0%) |
| 10 to 14 Minutes | 0 (0.0%) | 0 (0.0%) |
| 15 to 19 Minutes | 0 (0.0%) | 0 (0.0%) |
| 20 to 24 Minutes | 0 (0.0%) | 0 (0.0%) |
| 25 to 29 Minutes | 0 (0.0%) | 0 (0.0%) |
| 30 to 34 Minutes | 6 (100.0%) | 2 (66.7%) |
| 35 to 39 Minutes | 0 (0.0%) | 0 (0.0%) |
| 40 to 44 Minutes | 0 (0.0%) | 0 (0.0%) |
| 45 to 59 Minutes | 0 (0.0%) | 1 (33.3%) |
| 60 to 89 Minutes | 0 (0.0%) | 0 (0.0%) |
| 90 or more Minutes | 0 (0.0%) | 0 (0.0%) |
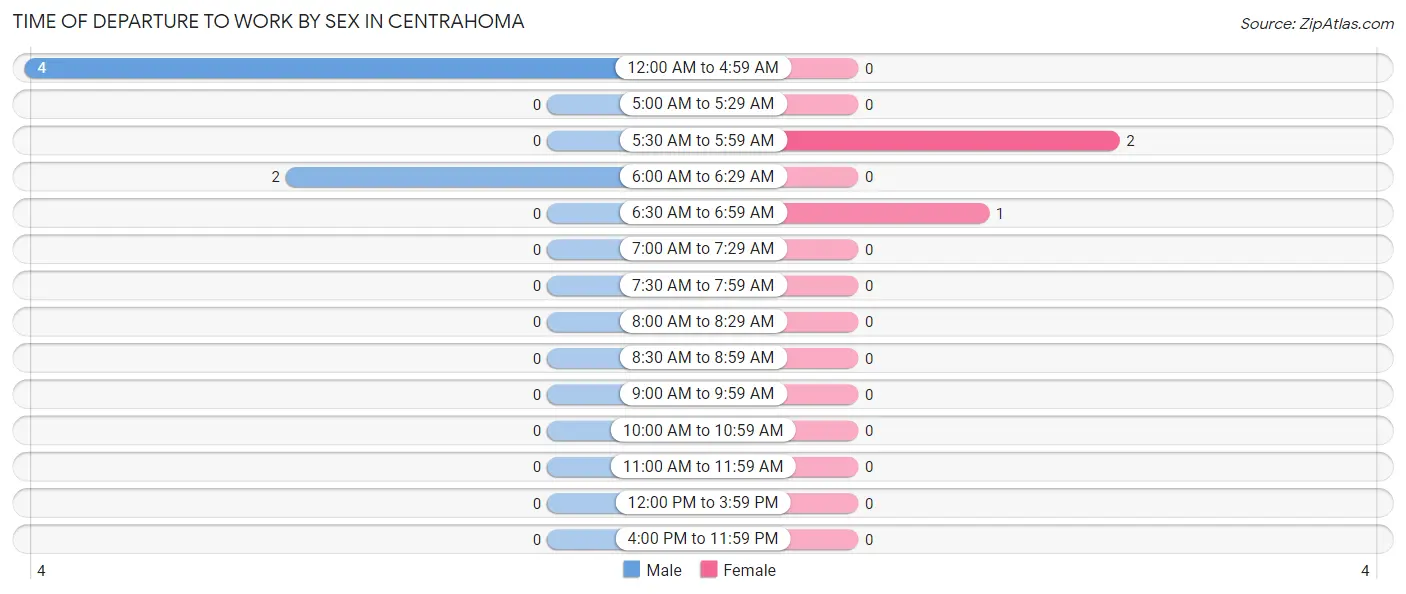
Time of Departure to Work by Sex in Centrahoma
The most frequent times of departure to work in Centrahoma are 12:00 AM to 4:59 AM (4, 66.7%) for males and 5:30 AM to 5:59 AM (2, 66.7%) for females.
| Time of Departure | Male | Female |
| 12:00 AM to 4:59 AM | 4 (66.7%) | 0 (0.0%) |
| 5:00 AM to 5:29 AM | 0 (0.0%) | 0 (0.0%) |
| 5:30 AM to 5:59 AM | 0 (0.0%) | 2 (66.7%) |
| 6:00 AM to 6:29 AM | 2 (33.3%) | 0 (0.0%) |
| 6:30 AM to 6:59 AM | 0 (0.0%) | 1 (33.3%) |
| 7:00 AM to 7:29 AM | 0 (0.0%) | 0 (0.0%) |
| 7:30 AM to 7:59 AM | 0 (0.0%) | 0 (0.0%) |
| 8:00 AM to 8:29 AM | 0 (0.0%) | 0 (0.0%) |
| 8:30 AM to 8:59 AM | 0 (0.0%) | 0 (0.0%) |
| 9:00 AM to 9:59 AM | 0 (0.0%) | 0 (0.0%) |
| 10:00 AM to 10:59 AM | 0 (0.0%) | 0 (0.0%) |
| 11:00 AM to 11:59 AM | 0 (0.0%) | 0 (0.0%) |
| 12:00 PM to 3:59 PM | 0 (0.0%) | 0 (0.0%) |
| 4:00 PM to 11:59 PM | 0 (0.0%) | 0 (0.0%) |
| Total | 6 (100.0%) | 3 (100.0%) |
Housing Occupancy in Centrahoma
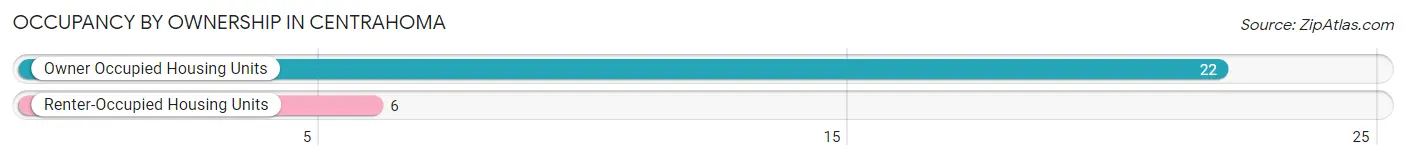
Occupancy by Ownership in Centrahoma
Of the total 28 dwellings in Centrahoma, owner-occupied units account for 22 (78.6%), while renter-occupied units make up 6 (21.4%).
| Occupancy | # Housing Units | % Housing Units |
| Owner Occupied Housing Units | 22 | 78.6% |
| Renter-Occupied Housing Units | 6 | 21.4% |
| Total Occupied Housing Units | 28 | 100.0% |
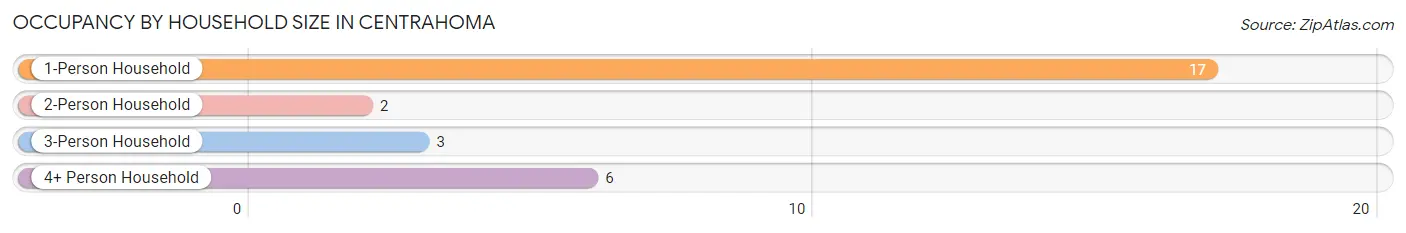
Occupancy by Household Size in Centrahoma
| Household Size | # Housing Units | % Housing Units |
| 1-Person Household | 17 | 60.7% |
| 2-Person Household | 2 | 7.1% |
| 3-Person Household | 3 | 10.7% |
| 4+ Person Household | 6 | 21.4% |
| Total Housing Units | 28 | 100.0% |
Occupancy by Ownership by Household Size in Centrahoma
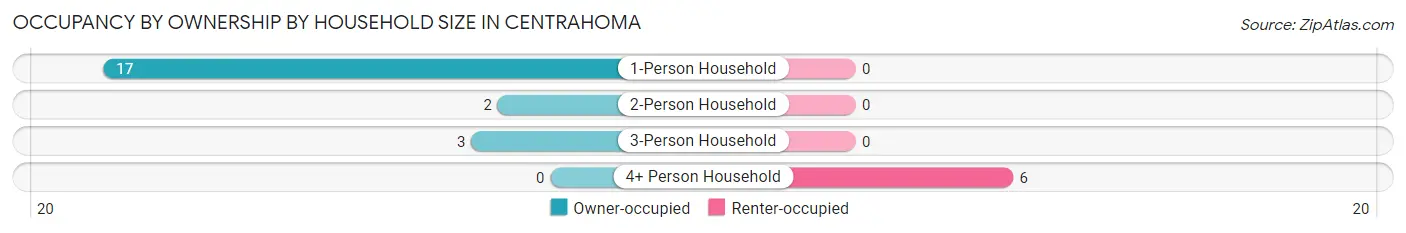
| Household Size | Owner-occupied | Renter-occupied |
| 1-Person Household | 17 (100.0%) | 0 (0.0%) |
| 2-Person Household | 2 (100.0%) | 0 (0.0%) |
| 3-Person Household | 3 (100.0%) | 0 (0.0%) |
| 4+ Person Household | 0 (0.0%) | 6 (100.0%) |
| Total Housing Units | 22 (78.6%) | 6 (21.4%) |
Occupancy by Educational Attainment in Centrahoma
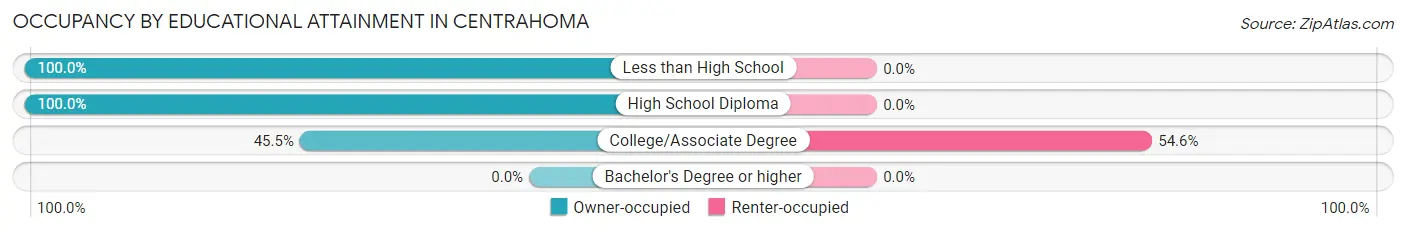
| Household Size | Owner-occupied | Renter-occupied |
| Less than High School | 8 (100.0%) | 0 (0.0%) |
| High School Diploma | 9 (100.0%) | 0 (0.0%) |
| College/Associate Degree | 5 (45.5%) | 6 (54.5%) |
| Bachelor's Degree or higher | 0 (0.0%) | 0 (0.0%) |
Occupancy by Age of Householder in Centrahoma
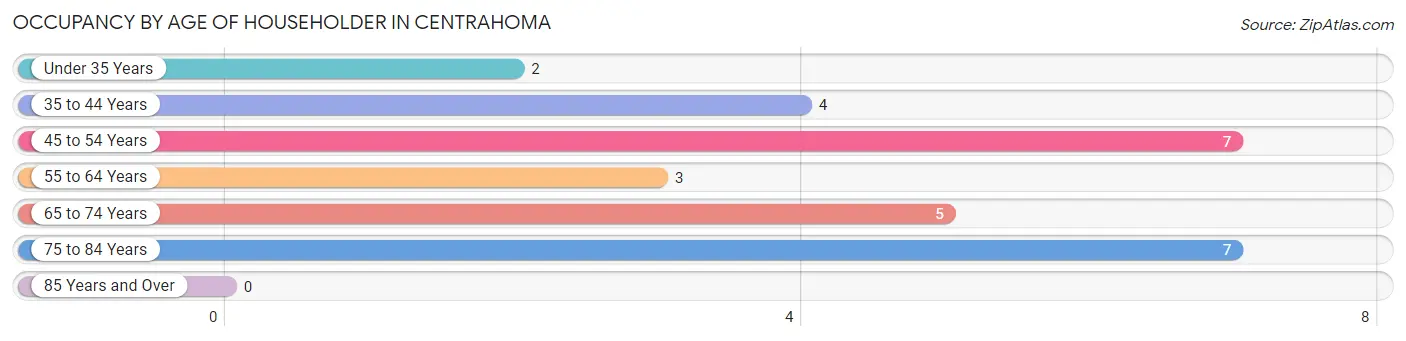
| Age Bracket | # Households | % Households |
| Under 35 Years | 2 | 7.1% |
| 35 to 44 Years | 4 | 14.3% |
| 45 to 54 Years | 7 | 25.0% |
| 55 to 64 Years | 3 | 10.7% |
| 65 to 74 Years | 5 | 17.9% |
| 75 to 84 Years | 7 | 25.0% |
| 85 Years and Over | 0 | 0.0% |
| Total | 28 | 100.0% |
Housing Finances in Centrahoma
Median Income by Occupancy in Centrahoma
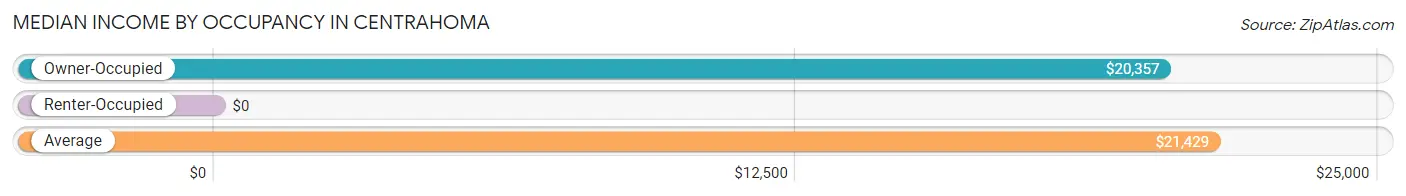
| Occupancy Type | # Households | Median Income |
| Owner-Occupied | 22 (78.6%) | $20,357 |
| Renter-Occupied | 6 (21.4%) | $0 |
| Average | 28 (100.0%) | $21,429 |
Occupancy by Householder Income Bracket in Centrahoma
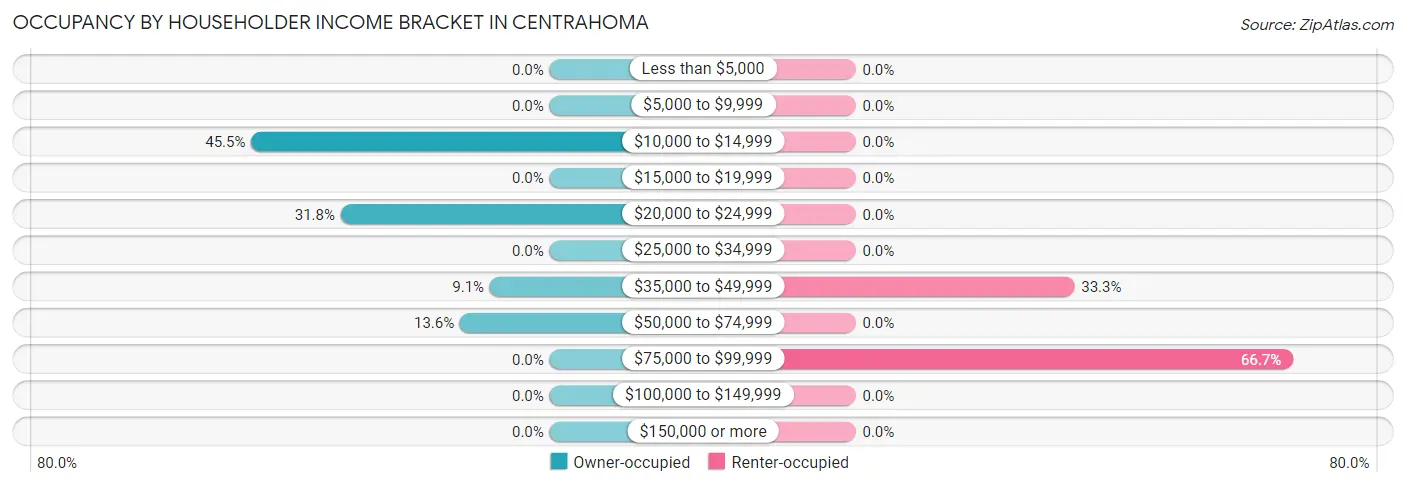
| Income Bracket | Owner-occupied | Renter-occupied |
| Less than $5,000 | 0 (0.0%) | 0 (0.0%) |
| $5,000 to $9,999 | 0 (0.0%) | 0 (0.0%) |
| $10,000 to $14,999 | 10 (45.5%) | 0 (0.0%) |
| $15,000 to $19,999 | 0 (0.0%) | 0 (0.0%) |
| $20,000 to $24,999 | 7 (31.8%) | 0 (0.0%) |
| $25,000 to $34,999 | 0 (0.0%) | 0 (0.0%) |
| $35,000 to $49,999 | 2 (9.1%) | 2 (33.3%) |
| $50,000 to $74,999 | 3 (13.6%) | 0 (0.0%) |
| $75,000 to $99,999 | 0 (0.0%) | 4 (66.7%) |
| $100,000 to $149,999 | 0 (0.0%) | 0 (0.0%) |
| $150,000 or more | 0 (0.0%) | 0 (0.0%) |
| Total | 22 (100.0%) | 6 (100.0%) |
Monthly Housing Cost Tiers in Centrahoma
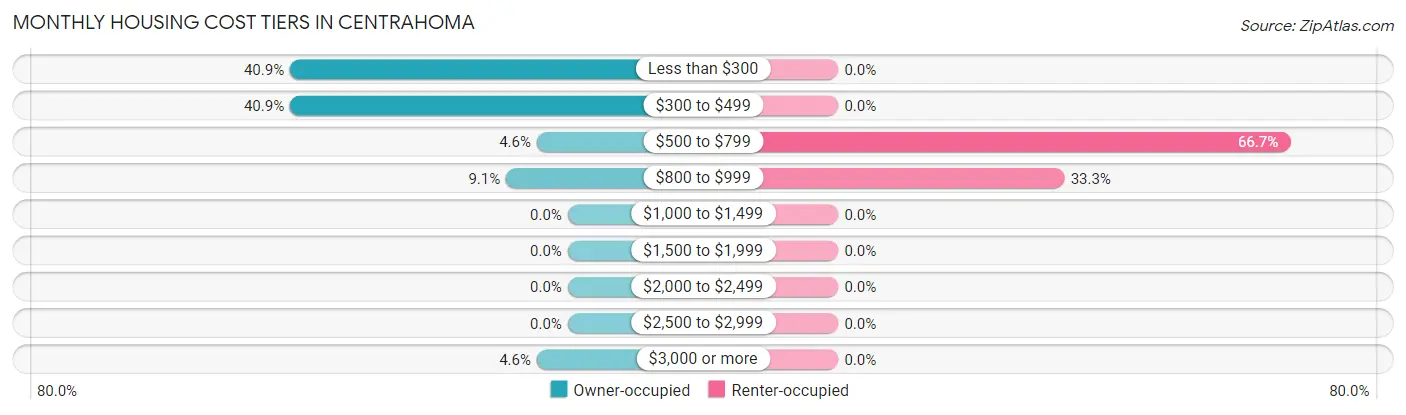
| Monthly Cost | Owner-occupied | Renter-occupied |
| Less than $300 | 9 (40.9%) | 0 (0.0%) |
| $300 to $499 | 9 (40.9%) | 0 (0.0%) |
| $500 to $799 | 1 (4.5%) | 4 (66.7%) |
| $800 to $999 | 2 (9.1%) | 2 (33.3%) |
| $1,000 to $1,499 | 0 (0.0%) | 0 (0.0%) |
| $1,500 to $1,999 | 0 (0.0%) | 0 (0.0%) |
| $2,000 to $2,499 | 0 (0.0%) | 0 (0.0%) |
| $2,500 to $2,999 | 0 (0.0%) | 0 (0.0%) |
| $3,000 or more | 1 (4.5%) | 0 (0.0%) |
| Total | 22 (100.0%) | 6 (100.0%) |
Physical Housing Characteristics in Centrahoma
Housing Structures in Centrahoma
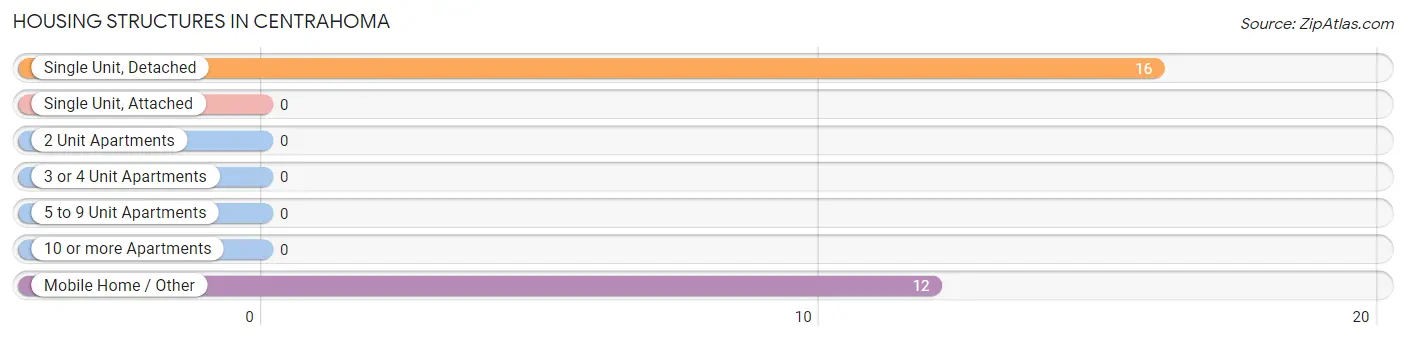
| Structure Type | # Housing Units | % Housing Units |
| Single Unit, Detached | 16 | 57.1% |
| Single Unit, Attached | 0 | 0.0% |
| 2 Unit Apartments | 0 | 0.0% |
| 3 or 4 Unit Apartments | 0 | 0.0% |
| 5 to 9 Unit Apartments | 0 | 0.0% |
| 10 or more Apartments | 0 | 0.0% |
| Mobile Home / Other | 12 | 42.9% |
| Total | 28 | 100.0% |
Housing Structures by Occupancy in Centrahoma
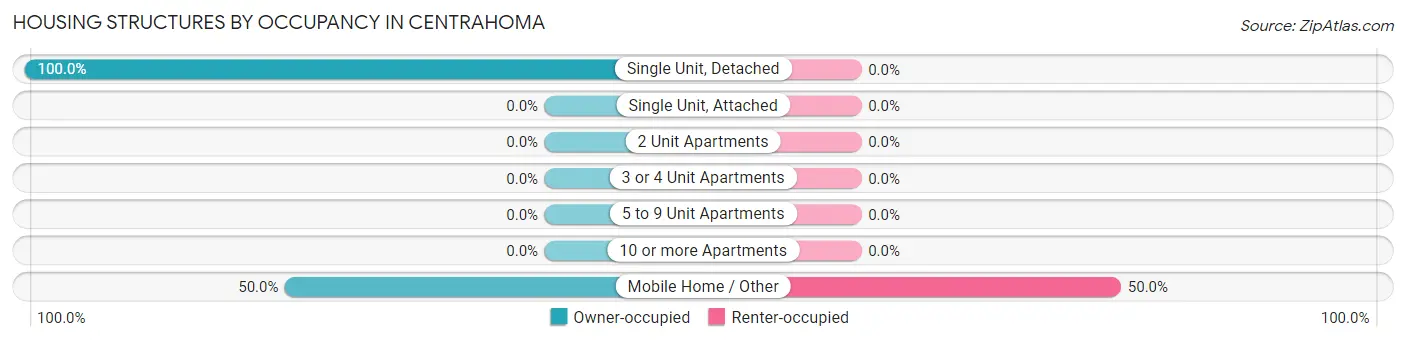
| Structure Type | Owner-occupied | Renter-occupied |
| Single Unit, Detached | 16 (100.0%) | 0 (0.0%) |
| Single Unit, Attached | 0 (0.0%) | 0 (0.0%) |
| 2 Unit Apartments | 0 (0.0%) | 0 (0.0%) |
| 3 or 4 Unit Apartments | 0 (0.0%) | 0 (0.0%) |
| 5 to 9 Unit Apartments | 0 (0.0%) | 0 (0.0%) |
| 10 or more Apartments | 0 (0.0%) | 0 (0.0%) |
| Mobile Home / Other | 6 (50.0%) | 6 (50.0%) |
| Total | 22 (78.6%) | 6 (21.4%) |
Housing Structures by Number of Rooms in Centrahoma
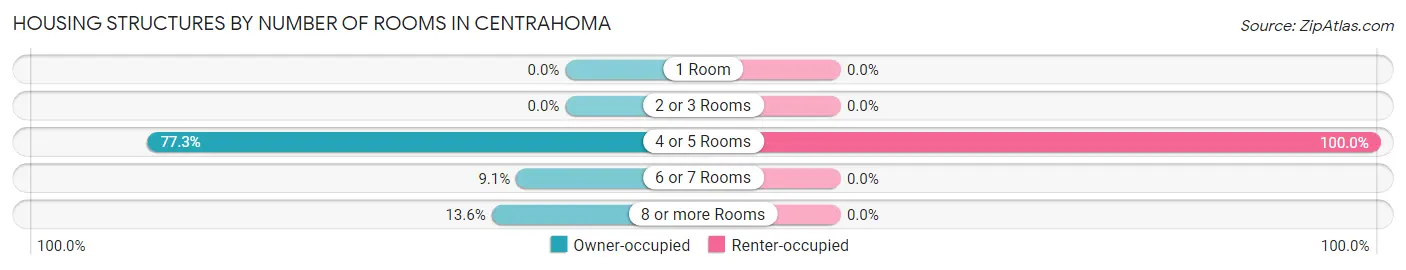
| Number of Rooms | Owner-occupied | Renter-occupied |
| 1 Room | 0 (0.0%) | 0 (0.0%) |
| 2 or 3 Rooms | 0 (0.0%) | 0 (0.0%) |
| 4 or 5 Rooms | 17 (77.3%) | 6 (100.0%) |
| 6 or 7 Rooms | 2 (9.1%) | 0 (0.0%) |
| 8 or more Rooms | 3 (13.6%) | 0 (0.0%) |
| Total | 22 (100.0%) | 6 (100.0%) |
Housing Structure by Heating Type in Centrahoma
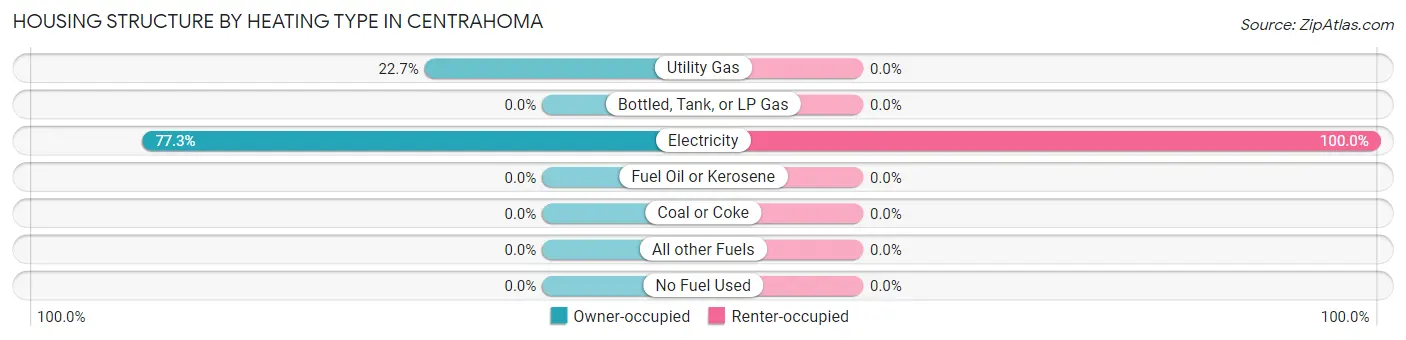
| Heating Type | Owner-occupied | Renter-occupied |
| Utility Gas | 5 (22.7%) | 0 (0.0%) |
| Bottled, Tank, or LP Gas | 0 (0.0%) | 0 (0.0%) |
| Electricity | 17 (77.3%) | 6 (100.0%) |
| Fuel Oil or Kerosene | 0 (0.0%) | 0 (0.0%) |
| Coal or Coke | 0 (0.0%) | 0 (0.0%) |
| All other Fuels | 0 (0.0%) | 0 (0.0%) |
| No Fuel Used | 0 (0.0%) | 0 (0.0%) |
| Total | 22 (100.0%) | 6 (100.0%) |
Household Vehicle Usage in Centrahoma
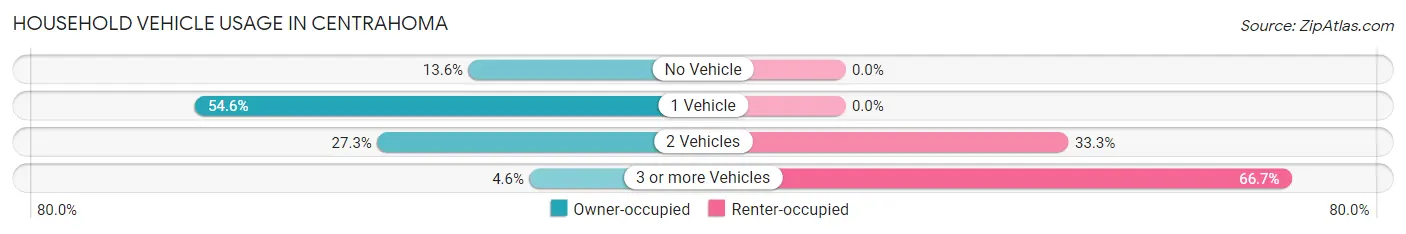
| Vehicles per Household | Owner-occupied | Renter-occupied |
| No Vehicle | 3 (13.6%) | 0 (0.0%) |
| 1 Vehicle | 12 (54.5%) | 0 (0.0%) |
| 2 Vehicles | 6 (27.3%) | 2 (33.3%) |
| 3 or more Vehicles | 1 (4.5%) | 4 (66.7%) |
| Total | 22 (100.0%) | 6 (100.0%) |
Real Estate & Mortgages in Centrahoma
Real Estate and Mortgage Overview in Centrahoma
| Characteristic | Without Mortgage | With Mortgage |
| Housing Units | 19 | 3 |
| Median Property Value | $58,300 | $0 |
| Median Household Income | $14,792 | $0 |
| Monthly Housing Costs | $313 | $1 |
| Real Estate Taxes | $350 | $0 |
Property Value by Mortgage Status in Centrahoma
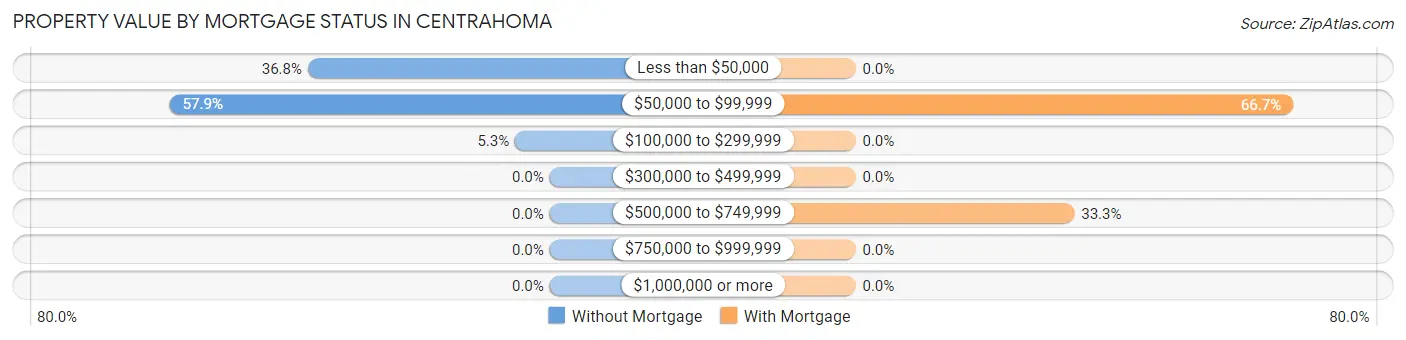
| Property Value | Without Mortgage | With Mortgage |
| Less than $50,000 | 7 (36.8%) | 0 (0.0%) |
| $50,000 to $99,999 | 11 (57.9%) | 2 (66.7%) |
| $100,000 to $299,999 | 1 (5.3%) | 0 (0.0%) |
| $300,000 to $499,999 | 0 (0.0%) | 0 (0.0%) |
| $500,000 to $749,999 | 0 (0.0%) | 1 (33.3%) |
| $750,000 to $999,999 | 0 (0.0%) | 0 (0.0%) |
| $1,000,000 or more | 0 (0.0%) | 0 (0.0%) |
| Total | 19 (100.0%) | 3 (100.0%) |
Household Income by Mortgage Status in Centrahoma
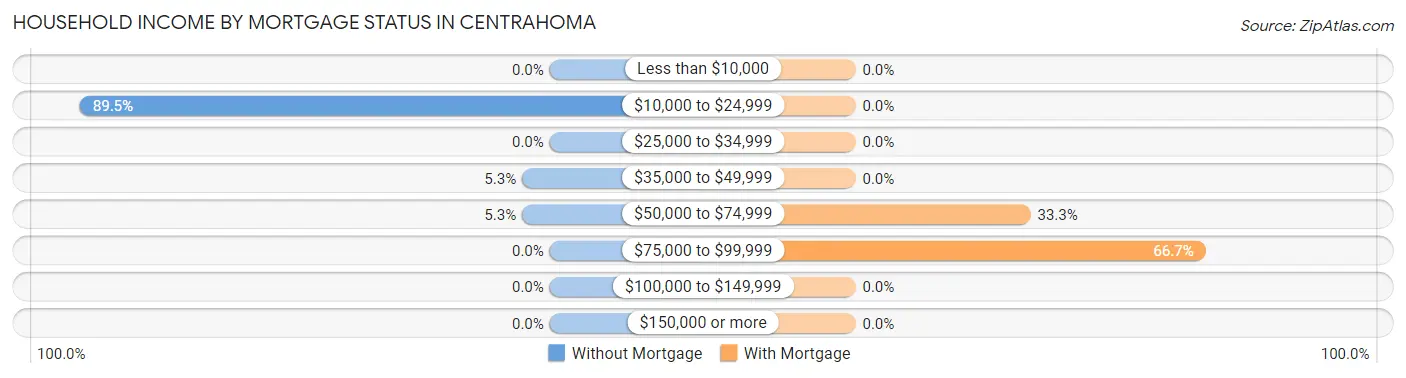
| Household Income | Without Mortgage | With Mortgage |
| Less than $10,000 | 0 (0.0%) | 0 (0.0%) |
| $10,000 to $24,999 | 17 (89.5%) | 0 (0.0%) |
| $25,000 to $34,999 | 0 (0.0%) | 0 (0.0%) |
| $35,000 to $49,999 | 1 (5.3%) | 0 (0.0%) |
| $50,000 to $74,999 | 1 (5.3%) | 1 (33.3%) |
| $75,000 to $99,999 | 0 (0.0%) | 2 (66.7%) |
| $100,000 to $149,999 | 0 (0.0%) | 0 (0.0%) |
| $150,000 or more | 0 (0.0%) | 0 (0.0%) |
| Total | 19 (100.0%) | 3 (100.0%) |
Property Value to Household Income Ratio in Centrahoma
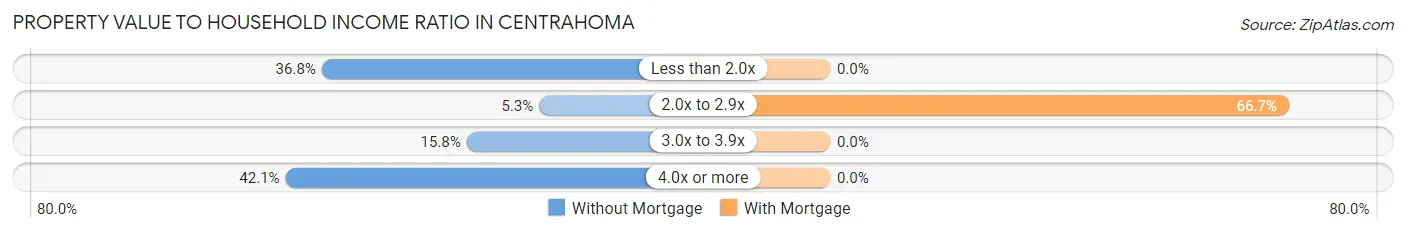
| Value-to-Income Ratio | Without Mortgage | With Mortgage |
| Less than 2.0x | 7 (36.8%) | 0 (0.0%) |
| 2.0x to 2.9x | 1 (5.3%) | 2 (66.7%) |
| 3.0x to 3.9x | 3 (15.8%) | 0 (0.0%) |
| 4.0x or more | 8 (42.1%) | 0 (0.0%) |
| Total | 19 (100.0%) | 3 (100.0%) |
Real Estate Taxes by Mortgage Status in Centrahoma
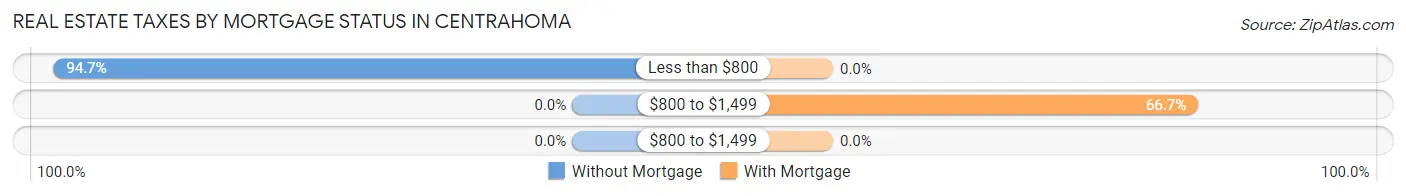
| Property Taxes | Without Mortgage | With Mortgage |
| Less than $800 | 18 (94.7%) | 0 (0.0%) |
| $800 to $1,499 | 0 (0.0%) | 2 (66.7%) |
| $800 to $1,499 | 0 (0.0%) | 0 (0.0%) |
| Total | 19 (100.0%) | 3 (100.0%) |
Health & Disability in Centrahoma
Health Insurance Coverage by Age in Centrahoma
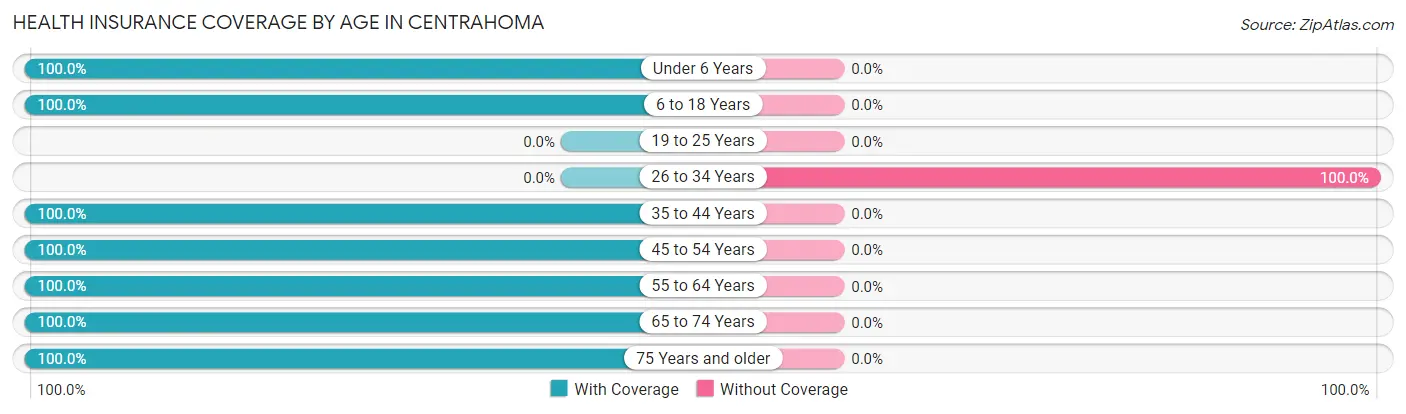
| Age Bracket | With Coverage | Without Coverage |
| Under 6 Years | 6 (100.0%) | 0 (0.0%) |
| 6 to 18 Years | 8 (100.0%) | 0 (0.0%) |
| 19 to 25 Years | 0 (0.0%) | 0 (0.0%) |
| 26 to 34 Years | 0 (0.0%) | 6 (100.0%) |
| 35 to 44 Years | 5 (100.0%) | 0 (0.0%) |
| 45 to 54 Years | 10 (100.0%) | 0 (0.0%) |
| 55 to 64 Years | 3 (100.0%) | 0 (0.0%) |
| 65 to 74 Years | 9 (100.0%) | 0 (0.0%) |
| 75 Years and older | 7 (100.0%) | 0 (0.0%) |
| Total | 48 (88.9%) | 6 (11.1%) |
Health Insurance Coverage by Citizenship Status in Centrahoma
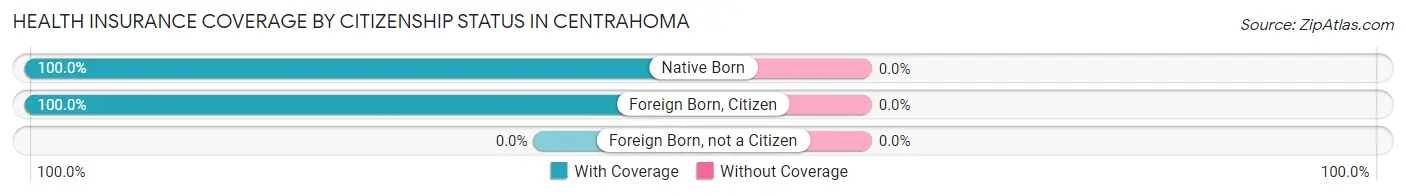
| Citizenship Status | With Coverage | Without Coverage |
| Native Born | 6 (100.0%) | 0 (0.0%) |
| Foreign Born, Citizen | 8 (100.0%) | 0 (0.0%) |
| Foreign Born, not a Citizen | 0 (0.0%) | 0 (0.0%) |
Health Insurance Coverage by Household Income in Centrahoma
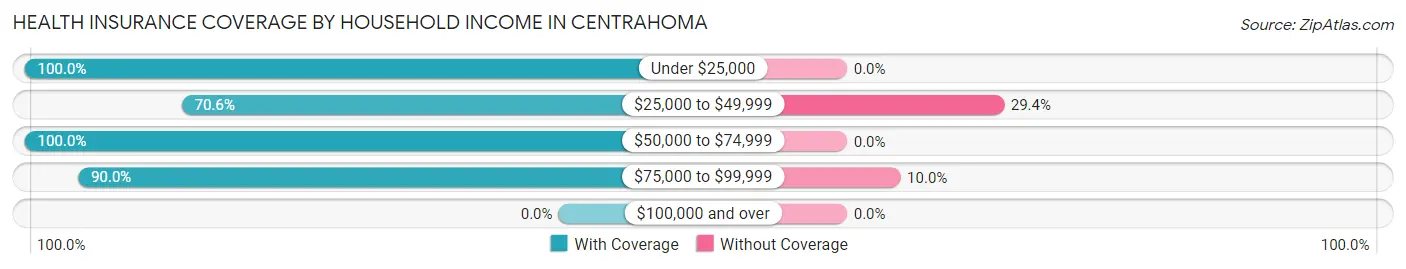
| Household Income | With Coverage | Without Coverage |
| Under $25,000 | 22 (100.0%) | 0 (0.0%) |
| $25,000 to $49,999 | 12 (70.6%) | 5 (29.4%) |
| $50,000 to $74,999 | 5 (100.0%) | 0 (0.0%) |
| $75,000 to $99,999 | 9 (90.0%) | 1 (10.0%) |
| $100,000 and over | 0 (0.0%) | 0 (0.0%) |
Public vs Private Health Insurance Coverage by Age in Centrahoma
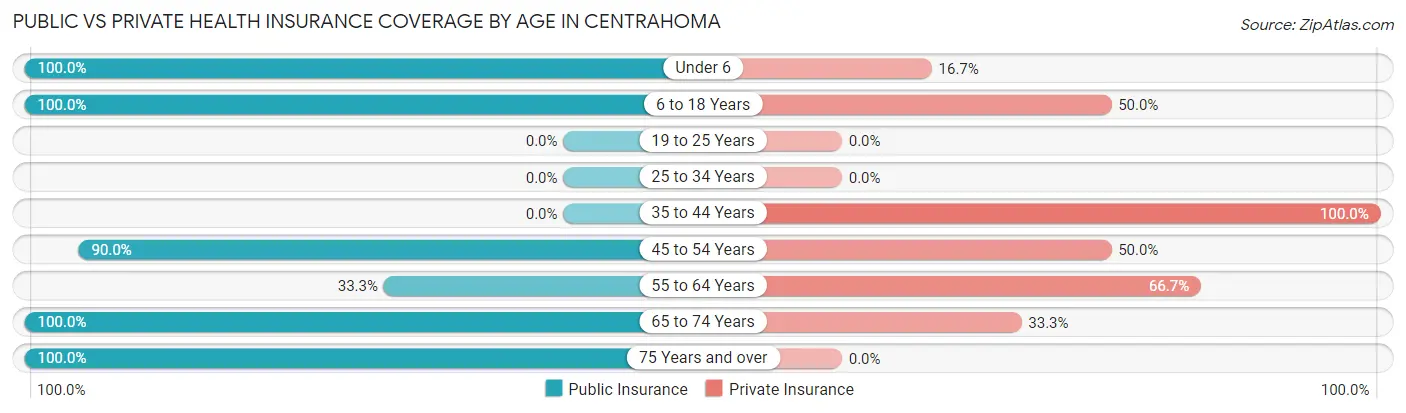
| Age Bracket | Public Insurance | Private Insurance |
| Under 6 | 6 (100.0%) | 1 (16.7%) |
| 6 to 18 Years | 8 (100.0%) | 4 (50.0%) |
| 19 to 25 Years | 0 (0.0%) | 0 (0.0%) |
| 25 to 34 Years | 0 (0.0%) | 0 (0.0%) |
| 35 to 44 Years | 0 (0.0%) | 5 (100.0%) |
| 45 to 54 Years | 9 (90.0%) | 5 (50.0%) |
| 55 to 64 Years | 1 (33.3%) | 2 (66.7%) |
| 65 to 74 Years | 9 (100.0%) | 3 (33.3%) |
| 75 Years and over | 7 (100.0%) | 0 (0.0%) |
| Total | 40 (74.1%) | 20 (37.0%) |
Disability Status by Sex by Age in Centrahoma
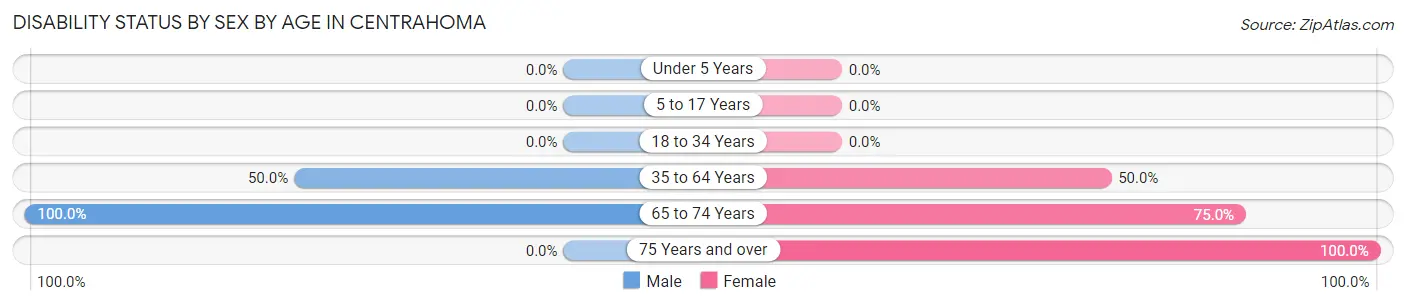
| Age Bracket | Male | Female |
| Under 5 Years | 0 (0.0%) | 0 (0.0%) |
| 5 to 17 Years | 0 (0.0%) | 0 (0.0%) |
| 18 to 34 Years | 0 (0.0%) | 0 (0.0%) |
| 35 to 64 Years | 5 (50.0%) | 4 (50.0%) |
| 65 to 74 Years | 5 (100.0%) | 3 (75.0%) |
| 75 Years and over | 0 (0.0%) | 7 (100.0%) |
Disability Class by Sex by Age in Centrahoma
Disability Class: Hearing Difficulty
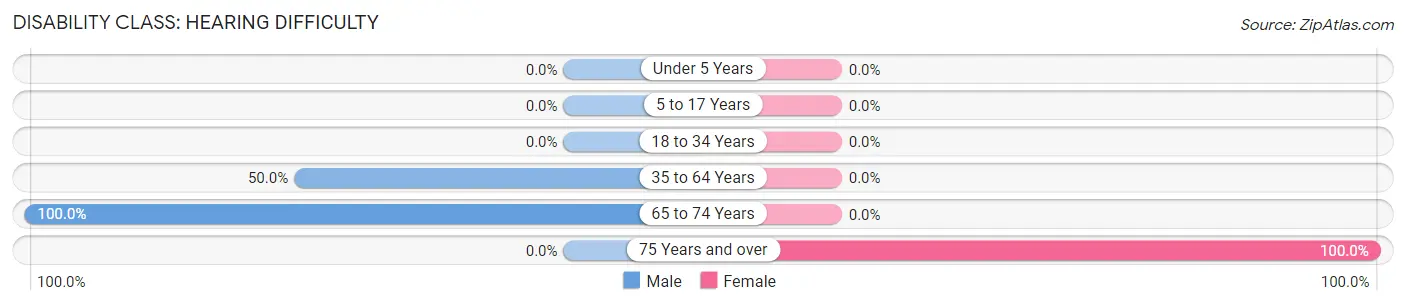
| Age Bracket | Male | Female |
| Under 5 Years | 0 (0.0%) | 0 (0.0%) |
| 5 to 17 Years | 0 (0.0%) | 0 (0.0%) |
| 18 to 34 Years | 0 (0.0%) | 0 (0.0%) |
| 35 to 64 Years | 5 (50.0%) | 0 (0.0%) |
| 65 to 74 Years | 5 (100.0%) | 0 (0.0%) |
| 75 Years and over | 0 (0.0%) | 7 (100.0%) |
Disability Class: Vision Difficulty
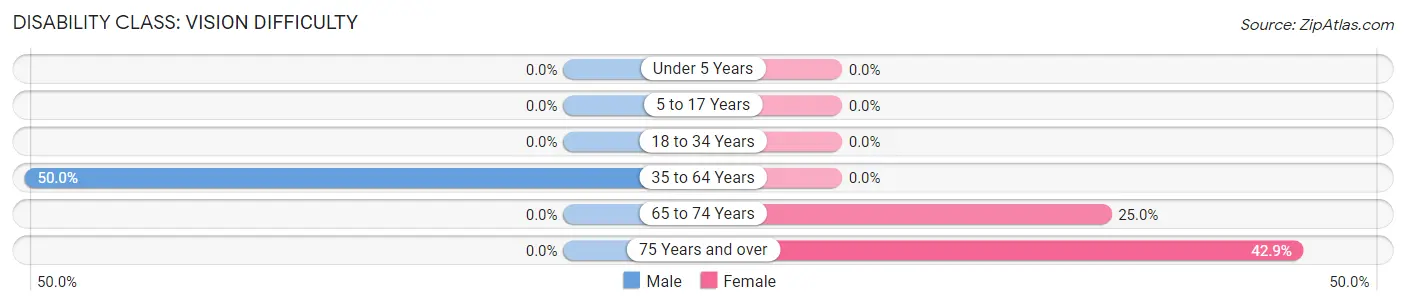
| Age Bracket | Male | Female |
| Under 5 Years | 0 (0.0%) | 0 (0.0%) |
| 5 to 17 Years | 0 (0.0%) | 0 (0.0%) |
| 18 to 34 Years | 0 (0.0%) | 0 (0.0%) |
| 35 to 64 Years | 5 (50.0%) | 0 (0.0%) |
| 65 to 74 Years | 0 (0.0%) | 1 (25.0%) |
| 75 Years and over | 0 (0.0%) | 3 (42.9%) |
Disability Class: Cognitive Difficulty
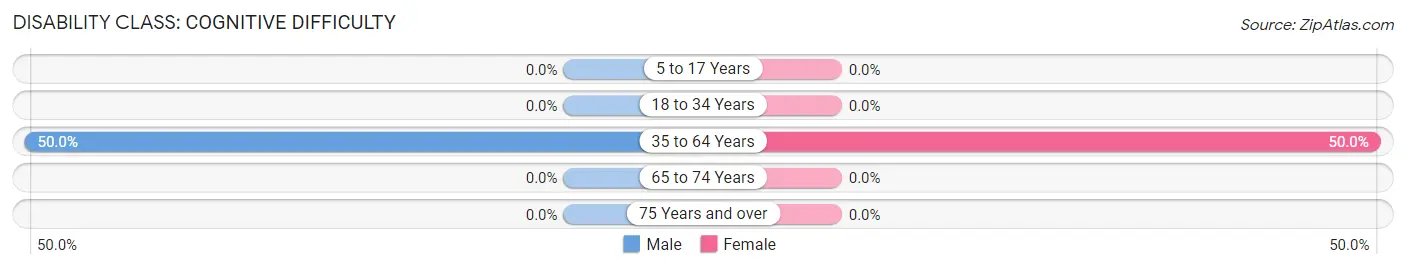
| Age Bracket | Male | Female |
| 5 to 17 Years | 0 (0.0%) | 0 (0.0%) |
| 18 to 34 Years | 0 (0.0%) | 0 (0.0%) |
| 35 to 64 Years | 5 (50.0%) | 4 (50.0%) |
| 65 to 74 Years | 0 (0.0%) | 0 (0.0%) |
| 75 Years and over | 0 (0.0%) | 0 (0.0%) |
Disability Class: Ambulatory Difficulty
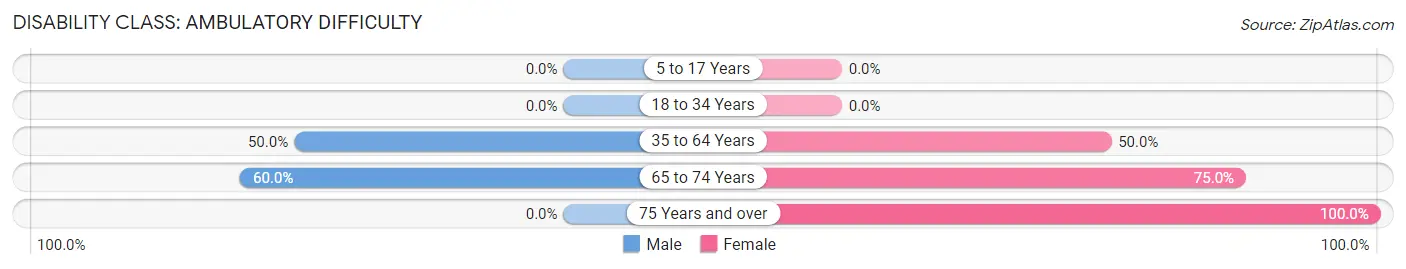
| Age Bracket | Male | Female |
| 5 to 17 Years | 0 (0.0%) | 0 (0.0%) |
| 18 to 34 Years | 0 (0.0%) | 0 (0.0%) |
| 35 to 64 Years | 5 (50.0%) | 4 (50.0%) |
| 65 to 74 Years | 3 (60.0%) | 3 (75.0%) |
| 75 Years and over | 0 (0.0%) | 7 (100.0%) |
Disability Class: Self-Care Difficulty
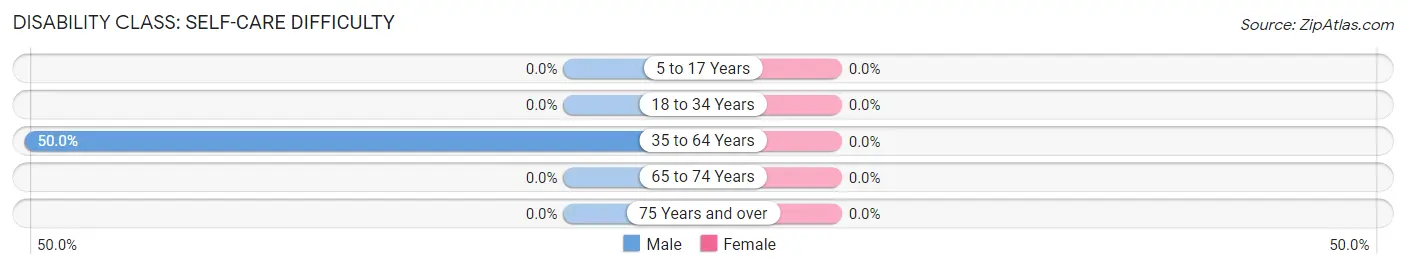
| Age Bracket | Male | Female |
| 5 to 17 Years | 0 (0.0%) | 0 (0.0%) |
| 18 to 34 Years | 0 (0.0%) | 0 (0.0%) |
| 35 to 64 Years | 5 (50.0%) | 0 (0.0%) |
| 65 to 74 Years | 0 (0.0%) | 0 (0.0%) |
| 75 Years and over | 0 (0.0%) | 0 (0.0%) |
Technology Access in Centrahoma
Computing Device Access in Centrahoma
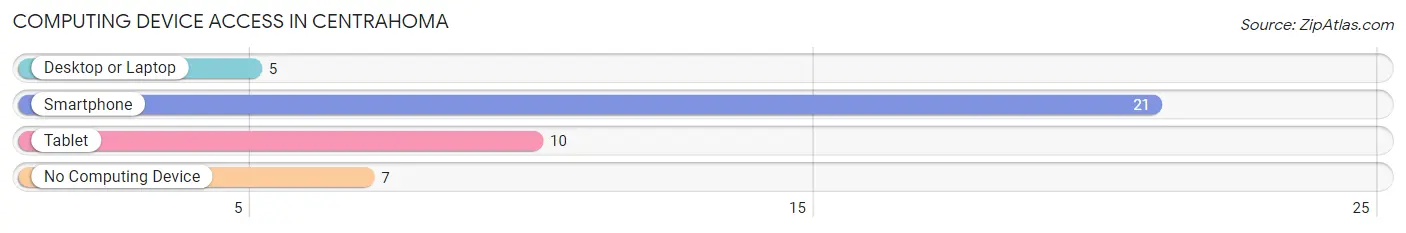
| Device Type | # Households | % Households |
| Desktop or Laptop | 5 | 17.9% |
| Smartphone | 21 | 75.0% |
| Tablet | 10 | 35.7% |
| No Computing Device | 7 | 25.0% |
| Total | 28 | 100.0% |
Internet Access in Centrahoma
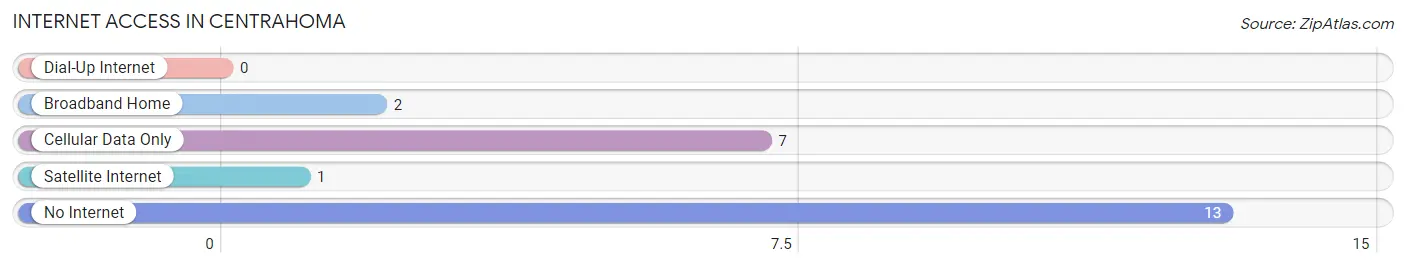
| Internet Type | # Households | % Households |
| Dial-Up Internet | 0 | 0.0% |
| Broadband Home | 2 | 7.1% |
| Cellular Data Only | 7 | 25.0% |
| Satellite Internet | 1 | 3.6% |
| No Internet | 13 | 46.4% |
| Total | 28 | 100.0% |
Centrahoma Summary
Centrahoma is a small town located in Coal County, Oklahoma. It is situated in the foothills of the Ouachita Mountains, approximately 20 miles south of McAlester. The town was founded in the late 1800s and has a population of approximately 500 people.
Geography
Centrahoma is located in the foothills of the Ouachita Mountains, approximately 20 miles south of McAlester. The town is situated on the banks of the Clear Boggy Creek, which flows through the area. The town is surrounded by rolling hills and wooded areas, providing a picturesque backdrop for the town. The climate in Centrahoma is mild, with temperatures ranging from the mid-50s in the winter to the mid-80s in the summer.
Economy
The economy of Centrahoma is largely based on agriculture and timber. The town is home to several small farms, which produce a variety of crops, including corn, soybeans, and wheat. The timber industry is also an important part of the local economy, with several sawmills located in the area. In addition, there are several small businesses in the town, including a grocery store, a hardware store, and a few restaurants.
Demographics
As of the 2010 census, the population of Centrahoma was 498. The racial makeup of the town was 95.2% White, 0.2% African American, 0.4% Native American, 0.2% Asian, 0.2% from other races, and 3.8% from two or more races. The median household income was $30,000, and the median family income was $35,000.
History
Centrahoma was founded in the late 1800s by settlers from the Choctaw Nation. The town was originally known as Clear Boggy, but the name was changed to Centrahoma in the early 1900s. The town was a thriving agricultural center, with several farms and sawmills in the area. In the early 1900s, the town was home to a cotton gin, a grist mill, and a blacksmith shop.
In the 1920s, the town was home to a number of businesses, including a bank, a hotel, a movie theater, and a general store. The town also had a school, which was attended by students from the surrounding area. In the 1950s, the town began to decline, as many of the businesses closed and the population began to dwindle.
Today, Centrahoma is a small, rural town with a population of approximately 500 people. The town is still home to several small businesses, including a grocery store, a hardware store, and a few restaurants. The town is also home to a post office, a library, and a volunteer fire department. The town is served by the Centrahoma School District, which serves students from kindergarten through 12th grade.
Common Questions
What is Per Capita Income in Centrahoma?
Per Capita income in Centrahoma is $19,420.
What is the Median Household income in Centrahoma?
Median Household Income in Centrahoma is $21,429.
What is Inequality or Gini Index in Centrahoma?
Inequality or Gini Index in Centrahoma is 0.41.
What is the Total Population of Centrahoma?
Total Population of Centrahoma is 54.
What is the Total Male Population of Centrahoma?
Total Male Population of Centrahoma is 23.
What is the Total Female Population of Centrahoma?
Total Female Population of Centrahoma is 31.
What is the Ratio of Males per 100 Females in Centrahoma?
There are 74.19 Males per 100 Females in Centrahoma.
What is the Ratio of Females per 100 Males in Centrahoma?
There are 134.78 Females per 100 Males in Centrahoma.
What is the Median Population Age in Centrahoma?
Median Population Age in Centrahoma is 49.7 Years.
What is the Average Family Size in Centrahoma
Average Family Size in Centrahoma is 3.3 People.
What is the Average Household Size in Centrahoma
Average Household Size in Centrahoma is 1.9 People.
How Large is the Labor Force in Centrahoma?
There are 10 People in the Labor Forcein in Centrahoma.
What is the Percentage of People in the Labor Force in Centrahoma?
24.4% of People are in the Labor Force in Centrahoma.