Raysal, WV Map & Demographics
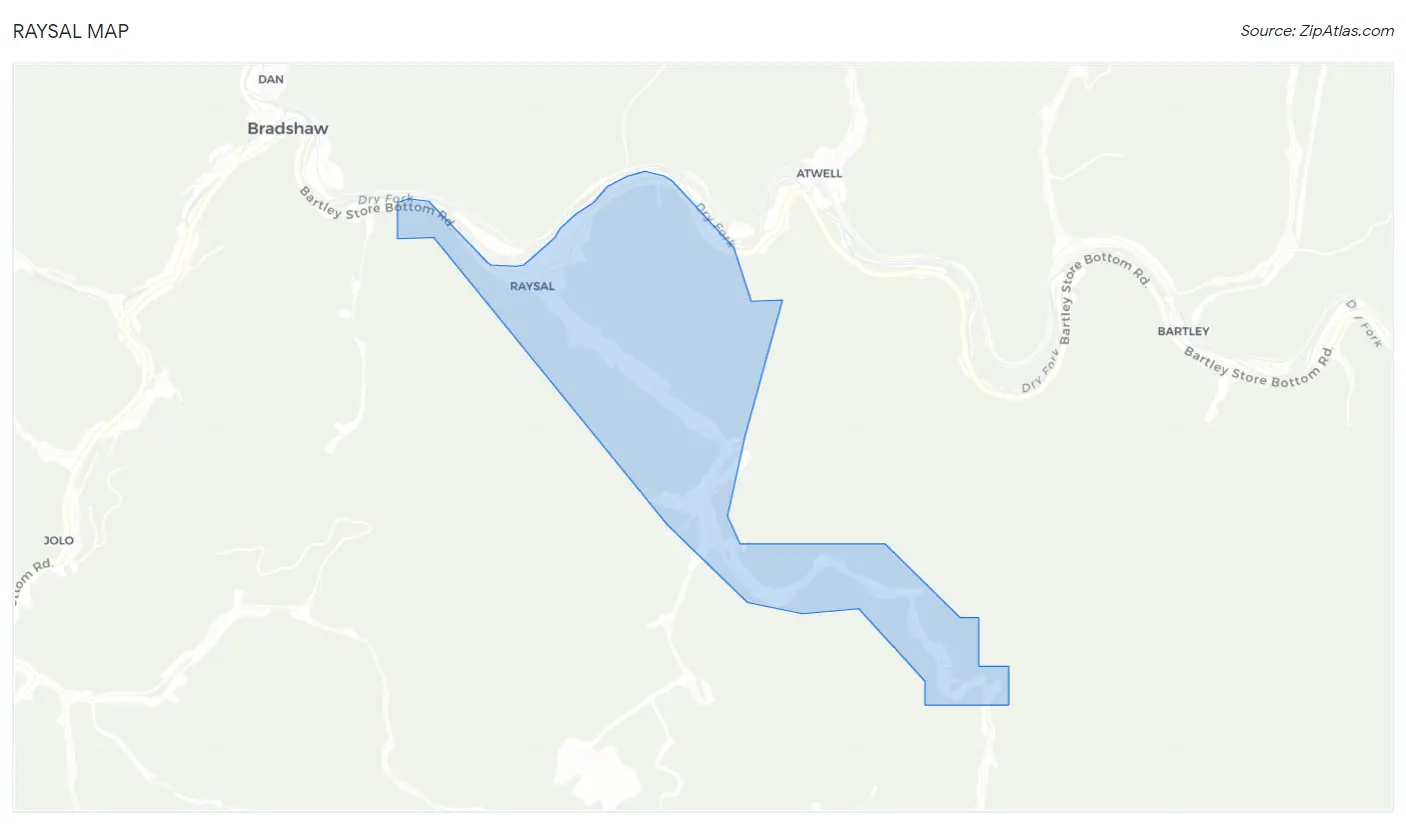
Raysal Map
Raysal Overview
$15,123
PER CAPITA INCOME
$31,000
AVG FAMILY INCOME
$31,154
AVG HOUSEHOLD INCOME
0.41
INEQUALITY / GINI INDEX
644
TOTAL POPULATION
277
MALE POPULATION
367
FEMALE POPULATION
75.48
MALES / 100 FEMALES
132.49
FEMALES / 100 MALES
47.7
MEDIAN AGE
2.9
AVG FAMILY SIZE
2.8
AVG HOUSEHOLD SIZE
154
LABOR FORCE [ PEOPLE ]
28.9%
PERCENT IN LABOR FORCE
74.7%
UNEMPLOYMENT RATE
Raysal Zip Codes
Raysal Area Codes
Income in Raysal
Income Overview in Raysal
Per Capita Income in Raysal is $15,123, while median incomes of families and households are $31,000 and $31,154 respectively.
| Characteristic | Number | Measure |
| Per Capita Income | 644 | $15,123 |
| Median Family Income | 184 | $31,000 |
| Mean Family Income | 184 | $43,021 |
| Median Household Income | 230 | $31,154 |
| Mean Household Income | 230 | $42,353 |
| Income Deficit | 184 | $0 |
| Wage / Income Gap (%) | 644 | 0.00% |
| Wage / Income Gap ($) | 644 | 100.00¢ per $1 |
| Gini / Inequality Index | 644 | 0.41 |
Earnings by Sex in Raysal
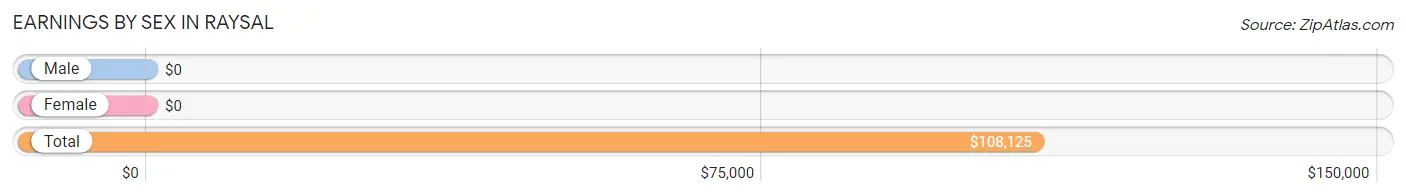
| Sex | Number | Average Earnings |
| Male | 38 (97.4%) | $0 |
| Female | 1 (2.6%) | $0 |
| Total | 39 (100.0%) | $108,125 |
Earnings by Sex by Income Bracket in Raysal
The most common earnings brackets in Raysal are $100,000+ for men (38 | 100.0%) and $55,000 to $64,999 for women (1 | 100.0%).

| Income | Male | Female |
| $2,499 or less | 0 (0.0%) | 0 (0.0%) |
| $2,500 to $4,999 | 0 (0.0%) | 0 (0.0%) |
| $5,000 to $7,499 | 0 (0.0%) | 0 (0.0%) |
| $7,500 to $9,999 | 0 (0.0%) | 0 (0.0%) |
| $10,000 to $12,499 | 0 (0.0%) | 0 (0.0%) |
| $12,500 to $14,999 | 0 (0.0%) | 0 (0.0%) |
| $15,000 to $17,499 | 0 (0.0%) | 0 (0.0%) |
| $17,500 to $19,999 | 0 (0.0%) | 0 (0.0%) |
| $20,000 to $22,499 | 0 (0.0%) | 0 (0.0%) |
| $22,500 to $24,999 | 0 (0.0%) | 0 (0.0%) |
| $25,000 to $29,999 | 0 (0.0%) | 0 (0.0%) |
| $30,000 to $34,999 | 0 (0.0%) | 0 (0.0%) |
| $35,000 to $39,999 | 0 (0.0%) | 0 (0.0%) |
| $40,000 to $44,999 | 0 (0.0%) | 0 (0.0%) |
| $45,000 to $49,999 | 0 (0.0%) | 0 (0.0%) |
| $50,000 to $54,999 | 0 (0.0%) | 0 (0.0%) |
| $55,000 to $64,999 | 0 (0.0%) | 1 (100.0%) |
| $65,000 to $74,999 | 0 (0.0%) | 0 (0.0%) |
| $75,000 to $99,999 | 0 (0.0%) | 0 (0.0%) |
| $100,000+ | 38 (100.0%) | 0 (0.0%) |
| Total | 38 (100.0%) | 1 (100.0%) |
Earnings by Sex by Educational Attainment in Raysal
| Educational Attainment | Male Income | Female Income |
| Less than High School | - | - |
| High School Diploma | - | - |
| College or Associate's Degree | - | - |
| Bachelor's Degree | - | - |
| Graduate Degree | - | - |
| Total | - | - |
Family Income in Raysal
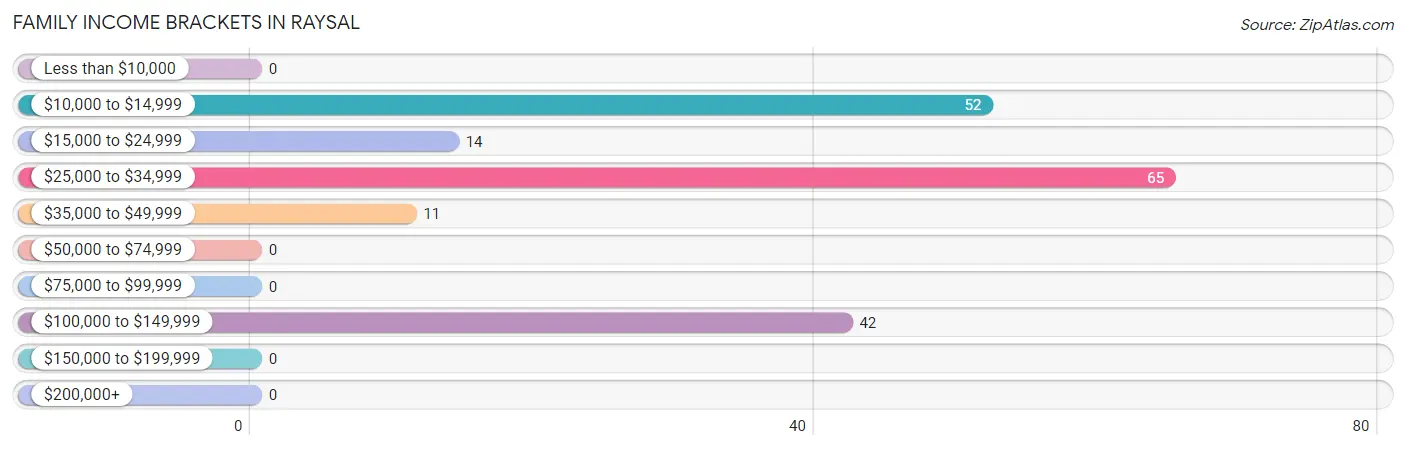
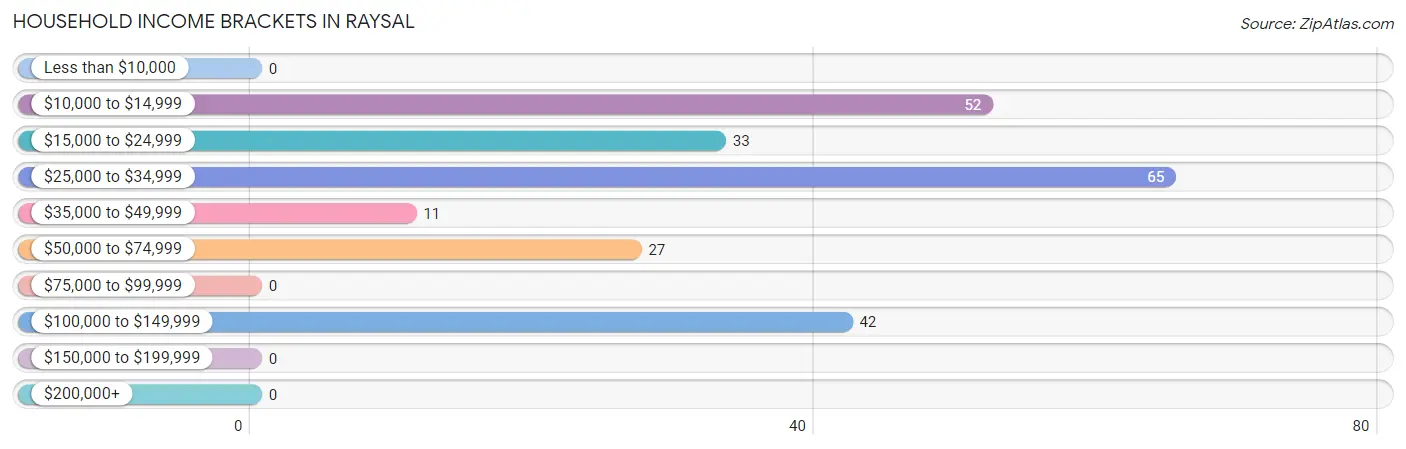
Family Income Brackets in Raysal
According to the Raysal family income data, there are 65 families falling into the $25,000 to $34,999 income range, which is the most common income bracket and makes up 35.3% of all families.
| Income Bracket | # Families | % Families |
| Less than $10,000 | 0 | 0.0% |
| $10,000 to $14,999 | 52 | 28.3% |
| $15,000 to $24,999 | 14 | 7.6% |
| $25,000 to $34,999 | 65 | 35.3% |
| $35,000 to $49,999 | 11 | 6.0% |
| $50,000 to $74,999 | 0 | 0.0% |
| $75,000 to $99,999 | 0 | 0.0% |
| $100,000 to $149,999 | 42 | 22.8% |
| $150,000 to $199,999 | 0 | 0.0% |
| $200,000+ | 0 | 0.0% |
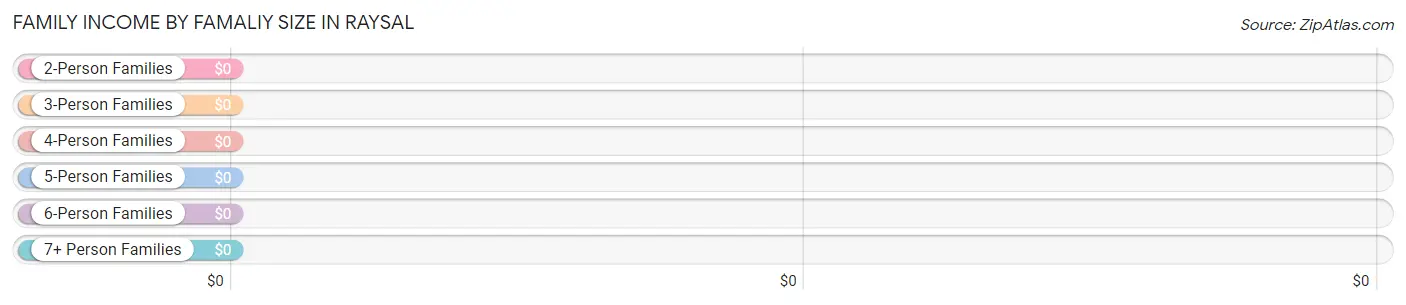
Family Income by Famaliy Size in Raysal
| Income Bracket | # Families | Median Income |
| 2-Person Families | 109 (59.2%) | $0 |
| 3-Person Families | 23 (12.5%) | $0 |
| 4-Person Families | 52 (28.3%) | $0 |
| 5-Person Families | 0 (0.0%) | $0 |
| 6-Person Families | 0 (0.0%) | $0 |
| 7+ Person Families | 0 (0.0%) | $0 |
| Total | 184 (100.0%) | $31,000 |
Family Income by Number of Earners in Raysal
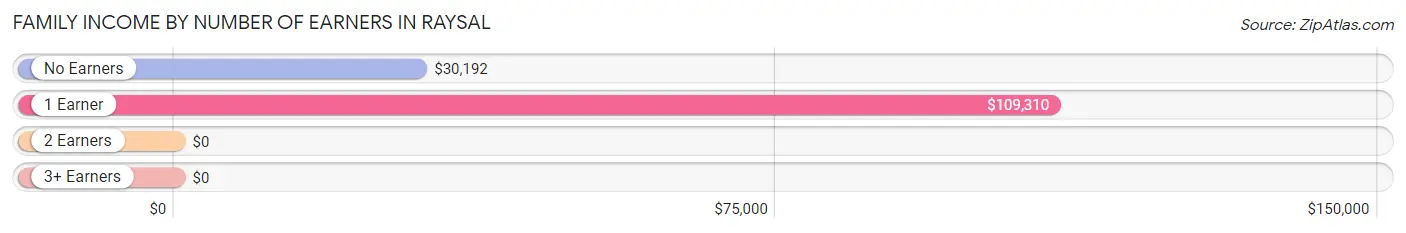
| Number of Earners | # Families | Median Income |
| No Earners | 142 (77.2%) | $30,192 |
| 1 Earner | 42 (22.8%) | $109,310 |
| 2 Earners | 0 (0.0%) | $0 |
| 3+ Earners | 0 (0.0%) | $0 |
| Total | 184 (100.0%) | $31,000 |
Household Income in Raysal
Household Income Brackets in Raysal
With 65 households falling in the category, the $25,000 to $34,999 income range is the most frequent in Raysal, accounting for 28.3% of all households.
| Income Bracket | # Households | % Households |
| Less than $10,000 | 0 | 0.0% |
| $10,000 to $14,999 | 52 | 22.6% |
| $15,000 to $24,999 | 33 | 14.3% |
| $25,000 to $34,999 | 65 | 28.3% |
| $35,000 to $49,999 | 11 | 4.8% |
| $50,000 to $74,999 | 27 | 11.7% |
| $75,000 to $99,999 | 0 | 0.0% |
| $100,000 to $149,999 | 42 | 18.3% |
| $150,000 to $199,999 | 0 | 0.0% |
| $200,000+ | 0 | 0.0% |
Household Income by Householder Age in Raysal
| Income Bracket | # Households | Median Income |
| 15 to 24 Years | 0 (0.0%) | $0 |
| 25 to 44 Years | 0 (0.0%) | $0 |
| 45 to 64 Years | 94 (40.9%) | $0 |
| 65+ Years | 136 (59.1%) | $0 |
| Total | 230 (100.0%) | $31,154 |
Poverty in Raysal
Income Below Poverty by Sex and Age in Raysal
With 40.8% poverty level for males and 44.1% for females among the residents of Raysal, 18 to 24 year old males and under 5 year old females are the most vulnerable to poverty, with 61 males (84.7%) and 44 females (100.0%) in their respective age groups living below the poverty level.
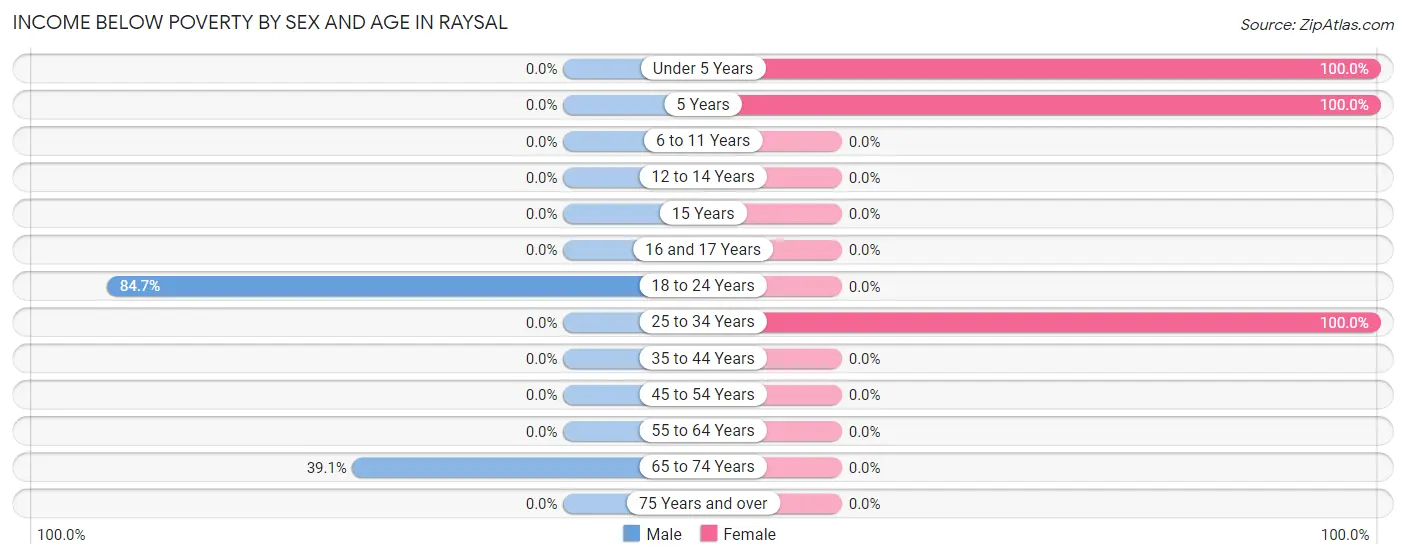
| Age Bracket | Male | Female |
| Under 5 Years | 0 (0.0%) | 44 (100.0%) |
| 5 Years | 0 (0.0%) | 36 (100.0%) |
| 6 to 11 Years | 0 (0.0%) | 0 (0.0%) |
| 12 to 14 Years | 0 (0.0%) | 0 (0.0%) |
| 15 Years | 0 (0.0%) | 0 (0.0%) |
| 16 and 17 Years | 0 (0.0%) | 0 (0.0%) |
| 18 to 24 Years | 61 (84.7%) | 0 (0.0%) |
| 25 to 34 Years | 0 (0.0%) | 82 (100.0%) |
| 35 to 44 Years | 0 (0.0%) | 0 (0.0%) |
| 45 to 54 Years | 0 (0.0%) | 0 (0.0%) |
| 55 to 64 Years | 0 (0.0%) | 0 (0.0%) |
| 65 to 74 Years | 52 (39.1%) | 0 (0.0%) |
| 75 Years and over | 0 (0.0%) | 0 (0.0%) |
| Total | 113 (40.8%) | 162 (44.1%) |
Income Above Poverty by Sex and Age in Raysal
According to the poverty statistics in Raysal, males aged under 5 years and females aged 12 to 14 years are the age groups that are most secure financially, with 100.0% of males and 100.0% of females in these age groups living above the poverty line.
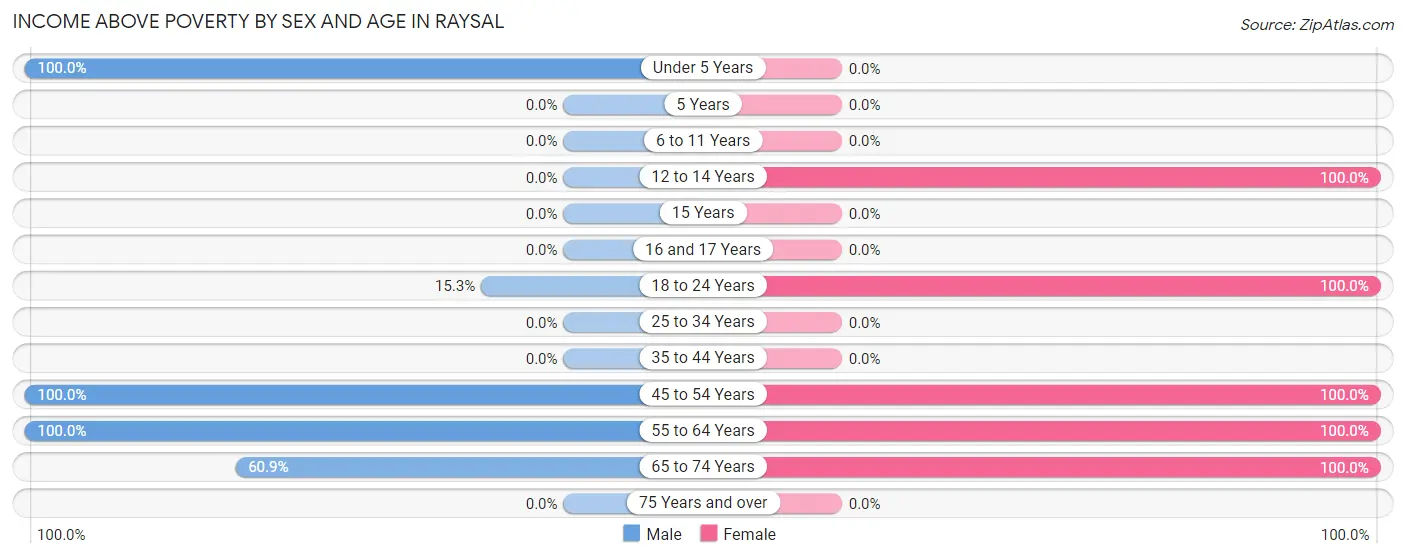
| Age Bracket | Male | Female |
| Under 5 Years | 19 (100.0%) | 0 (0.0%) |
| 5 Years | 0 (0.0%) | 0 (0.0%) |
| 6 to 11 Years | 0 (0.0%) | 0 (0.0%) |
| 12 to 14 Years | 0 (0.0%) | 13 (100.0%) |
| 15 Years | 0 (0.0%) | 0 (0.0%) |
| 16 and 17 Years | 0 (0.0%) | 0 (0.0%) |
| 18 to 24 Years | 11 (15.3%) | 33 (100.0%) |
| 25 to 34 Years | 0 (0.0%) | 0 (0.0%) |
| 35 to 44 Years | 0 (0.0%) | 0 (0.0%) |
| 45 to 54 Years | 26 (100.0%) | 20 (100.0%) |
| 55 to 64 Years | 27 (100.0%) | 84 (100.0%) |
| 65 to 74 Years | 81 (60.9%) | 55 (100.0%) |
| 75 Years and over | 0 (0.0%) | 0 (0.0%) |
| Total | 164 (59.2%) | 205 (55.9%) |
Income Below Poverty Among Married-Couple Families in Raysal
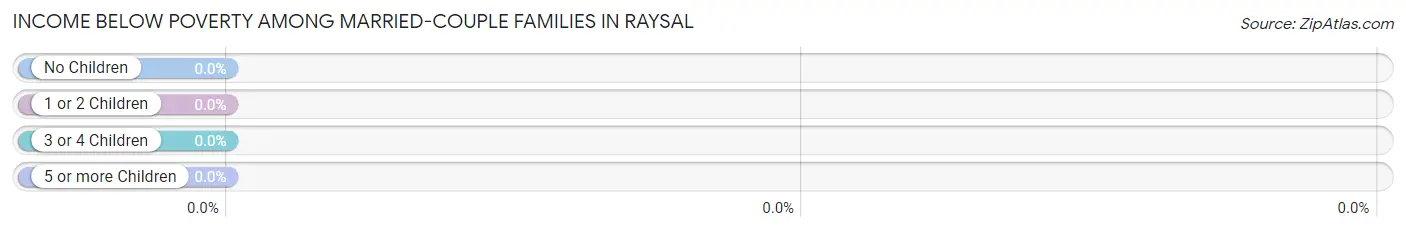
| Children | Above Poverty | Below Poverty |
| No Children | 107 (100.0%) | 0 (0.0%) |
| 1 or 2 Children | 0 (0.0%) | 0 (0.0%) |
| 3 or 4 Children | 0 (0.0%) | 0 (0.0%) |
| 5 or more Children | 0 (0.0%) | 0 (0.0%) |
| Total | 107 (100.0%) | 0 (0.0%) |
Income Below Poverty Among Single-Parent Households in Raysal
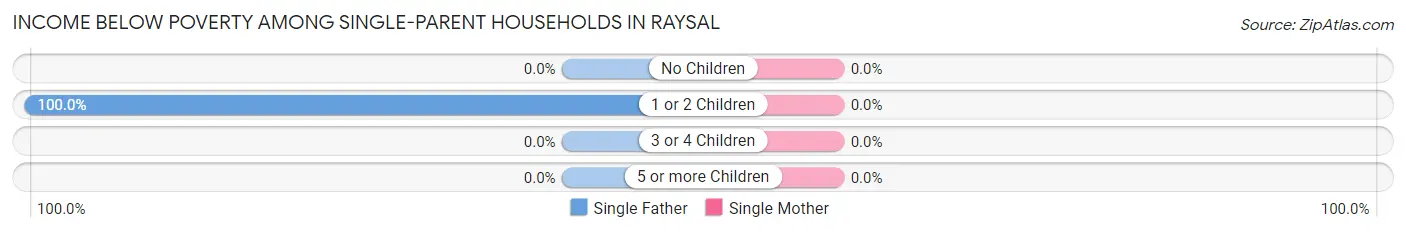
| Children | Single Father | Single Mother |
| No Children | 0 (0.0%) | 0 (0.0%) |
| 1 or 2 Children | 52 (100.0%) | 0 (0.0%) |
| 3 or 4 Children | 0 (0.0%) | 0 (0.0%) |
| 5 or more Children | 0 (0.0%) | 0 (0.0%) |
| Total | 52 (78.8%) | 0 (0.0%) |
Income Below Poverty Among Married-Couple vs Single-Parent Households in Raysal
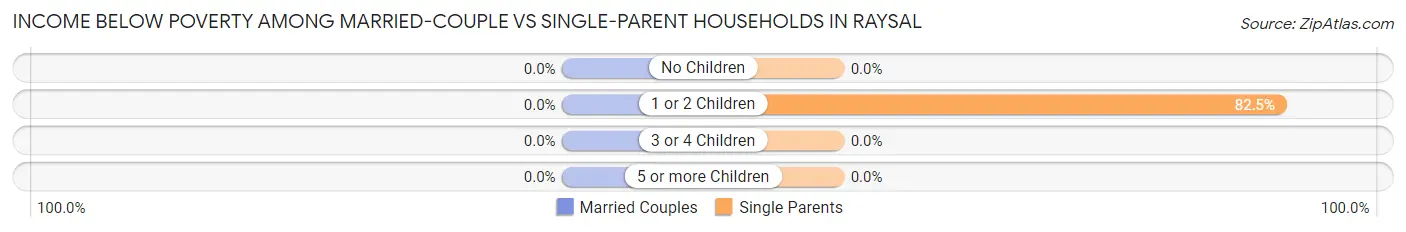
| Children | Married-Couple Families | Single-Parent Households |
| No Children | 0 (0.0%) | 0 (0.0%) |
| 1 or 2 Children | 0 (0.0%) | 52 (82.5%) |
| 3 or 4 Children | 0 (0.0%) | 0 (0.0%) |
| 5 or more Children | 0 (0.0%) | 0 (0.0%) |
| Total | 0 (0.0%) | 52 (67.5%) |
Race in Raysal
The most populous races in Raysal are , and White / Caucasian (644 | 100.0%).
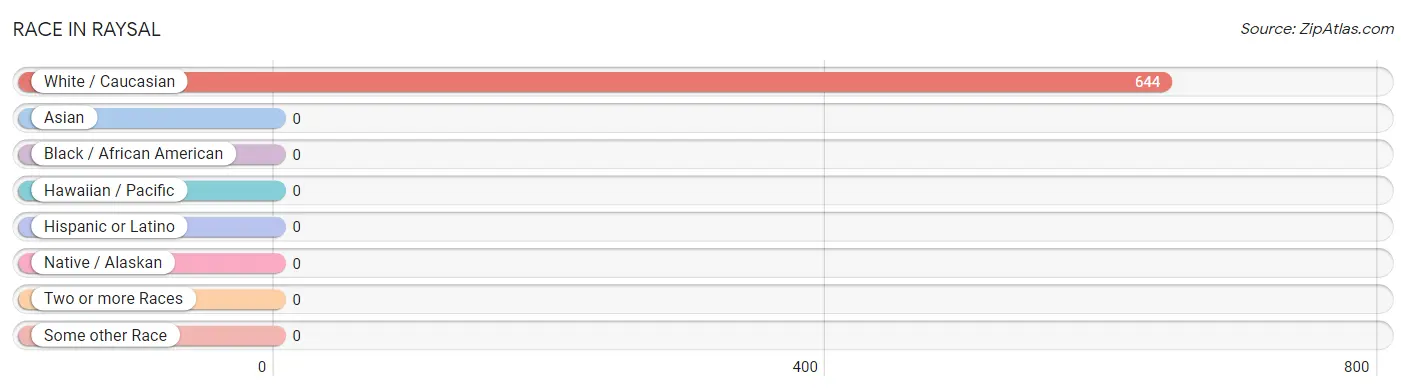
| Race | # Population | % Population |
| Asian | 0 | 0.0% |
| Black / African American | 0 | 0.0% |
| Hawaiian / Pacific | 0 | 0.0% |
| Hispanic or Latino | 0 | 0.0% |
| Native / Alaskan | 0 | 0.0% |
| White / Caucasian | 644 | 100.0% |
| Two or more Races | 0 | 0.0% |
| Some other Race | 0 | 0.0% |
| Total | 644 | 100.0% |
Ancestry in Raysal
The most populous ancestries reported in Raysal are Irish (59 | 9.2%), English (47 | 7.3%), American (43 | 6.7%), and German (31 | 4.8%), together accounting for 27.9% of all Raysal residents.

| Ancestry | # Population | % Population |
| American | 43 | 6.7% |
| English | 47 | 7.3% |
| German | 31 | 4.8% |
| Irish | 59 | 9.2% | View All 4 Rows |
Immigrants in Raysal

| Immigration Origin | # Population | % Population | View All 0 Rows |
Sex and Age in Raysal
Sex and Age in Raysal
The most populous age groups in Raysal are 65 to 69 Years (81 | 29.2%) for men and 25 to 29 Years (82 | 22.3%) for women.
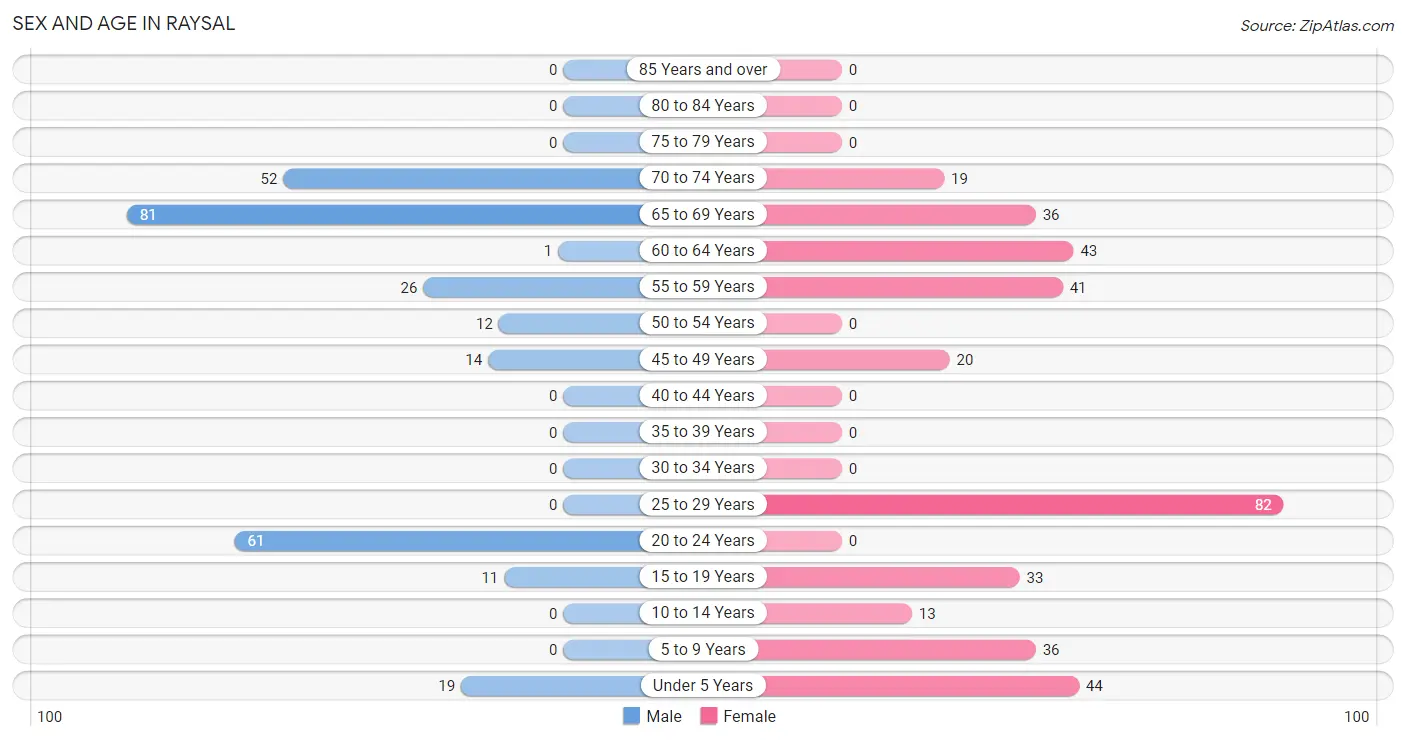
| Age Bracket | Male | Female |
| Under 5 Years | 19 (6.9%) | 44 (12.0%) |
| 5 to 9 Years | 0 (0.0%) | 36 (9.8%) |
| 10 to 14 Years | 0 (0.0%) | 13 (3.5%) |
| 15 to 19 Years | 11 (4.0%) | 33 (9.0%) |
| 20 to 24 Years | 61 (22.0%) | 0 (0.0%) |
| 25 to 29 Years | 0 (0.0%) | 82 (22.3%) |
| 30 to 34 Years | 0 (0.0%) | 0 (0.0%) |
| 35 to 39 Years | 0 (0.0%) | 0 (0.0%) |
| 40 to 44 Years | 0 (0.0%) | 0 (0.0%) |
| 45 to 49 Years | 14 (5.1%) | 20 (5.4%) |
| 50 to 54 Years | 12 (4.3%) | 0 (0.0%) |
| 55 to 59 Years | 26 (9.4%) | 41 (11.2%) |
| 60 to 64 Years | 1 (0.4%) | 43 (11.7%) |
| 65 to 69 Years | 81 (29.2%) | 36 (9.8%) |
| 70 to 74 Years | 52 (18.8%) | 19 (5.2%) |
| 75 to 79 Years | 0 (0.0%) | 0 (0.0%) |
| 80 to 84 Years | 0 (0.0%) | 0 (0.0%) |
| 85 Years and over | 0 (0.0%) | 0 (0.0%) |
| Total | 277 (100.0%) | 367 (100.0%) |
Families and Households in Raysal
Median Family Size in Raysal
The median family size in Raysal is 2.92 persons per family, with single male/father families (66 | 35.9%) accounting for the largest median family size of 3.95 persons per family. On the other hand, married-couple families (107 | 58.2%) represent the smallest median family size with 2.18 persons per family.
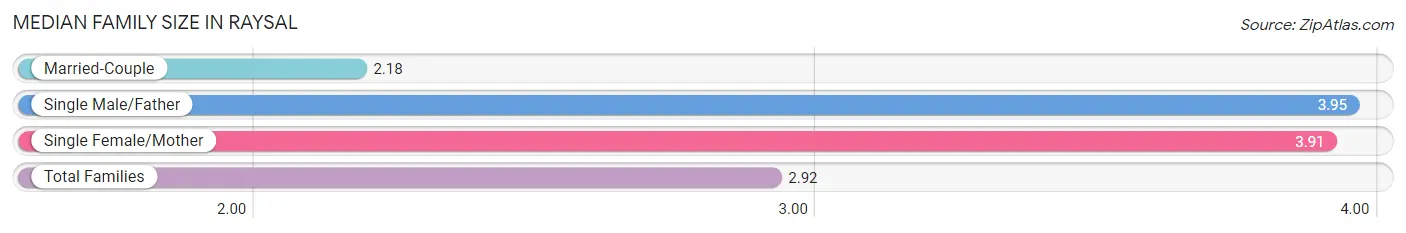
| Family Type | # Families | Family Size |
| Married-Couple | 107 (58.2%) | 2.18 |
| Single Male/Father | 66 (35.9%) | 3.95 |
| Single Female/Mother | 11 (6.0%) | 3.91 |
| Total Families | 184 (100.0%) | 2.92 |
Median Household Size in Raysal
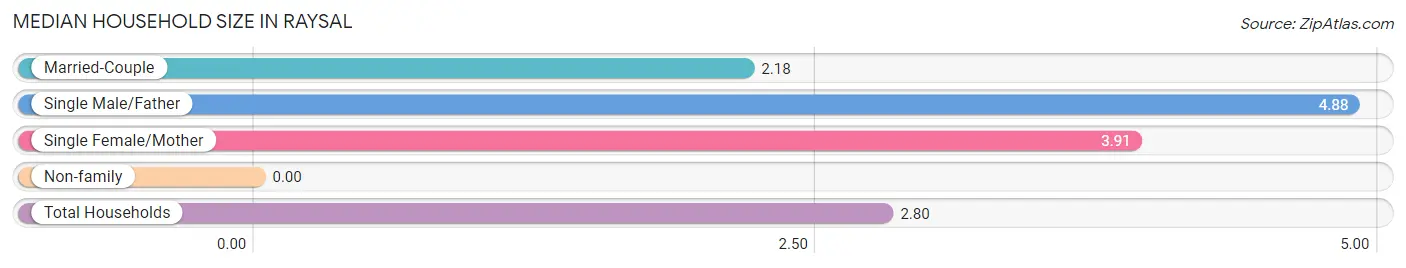
| Household Type | # Households | Household Size |
| Married-Couple | 107 (46.5%) | 2.18 |
| Single Male/Father | 66 (28.7%) | 4.88 |
| Single Female/Mother | 11 (4.8%) | 3.91 |
| Non-family | 46 (20.0%) | - |
| Total Households | 230 (100.0%) | 2.80 |
Household Size by Marriage Status in Raysal
Out of a total of 230 households in Raysal, 184 (80.0%) are family households, while 46 (20.0%) are nonfamily households. The most numerous type of family households are 2-person households, comprising 109, and the most common type of nonfamily households are 1-person households, comprising 46.
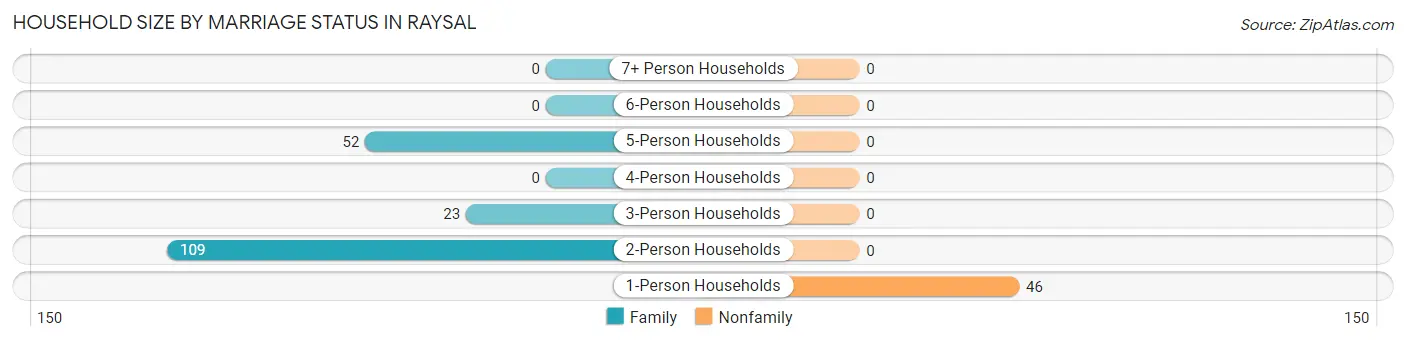
| Household Size | Family Households | Nonfamily Households |
| 1-Person Households | - | 46 (20.0%) |
| 2-Person Households | 109 (47.4%) | 0 (0.0%) |
| 3-Person Households | 23 (10.0%) | 0 (0.0%) |
| 4-Person Households | 0 (0.0%) | 0 (0.0%) |
| 5-Person Households | 52 (22.6%) | 0 (0.0%) |
| 6-Person Households | 0 (0.0%) | 0 (0.0%) |
| 7+ Person Households | 0 (0.0%) | 0 (0.0%) |
| Total | 184 (80.0%) | 46 (20.0%) |
Female Fertility in Raysal
Fertility by Age in Raysal
| Age Bracket | Women with Births | Births / 1,000 Women |
| 15 to 19 years | 0 (0.0%) | 0.0 |
| 20 to 34 years | 0 (0.0%) | 0.0 |
| 35 to 50 years | 0 (0.0%) | 0.0 |
| Total | 0 (0.0%) | 0.0 |
Fertility by Age by Marriage Status in Raysal
| Age Bracket | Married | Unmarried |
| 15 to 19 years | 0 (0.0%) | 0 (0.0%) |
| 20 to 34 years | 0 (0.0%) | 0 (0.0%) |
| 35 to 50 years | 0 (0.0%) | 0 (0.0%) |
| Total | 0 (0.0%) | 0 (0.0%) |
Fertility by Education in Raysal

| Educational Attainment | Women with Births | Births / 1,000 Women |
| Less than High School | 0 (0.0%) | 0.0 |
| High School Diploma | 0 (0.0%) | 0.0 |
| College or Associate's Degree | 0 (0.0%) | 0.0 |
| Bachelor's Degree | 0 (0.0%) | 0.0 |
| Graduate Degree | 0 (0.0%) | 0.0 |
| Total | 0 (0.0%) | 0.0 |
Fertility by Education by Marriage Status in Raysal
| Educational Attainment | Married | Unmarried |
| Less than High School | 0 (0.0%) | 0 (0.0%) |
| High School Diploma | 0 (0.0%) | 0 (0.0%) |
| College or Associate's Degree | 0 (0.0%) | 0 (0.0%) |
| Bachelor's Degree | 0 (0.0%) | 0 (0.0%) |
| Graduate Degree | 0 (0.0%) | 0 (0.0%) |
| Total | 0 (0.0%) | 0 (0.0%) |
Employment Characteristics in Raysal
Employment by Class of Employer in Raysal
Among the 39 employed individuals in Raysal, private company employees (26 | 66.7%), federal government employees (12 | 30.8%), and state government employees (1 | 2.6%) make up the most common classes of employment.
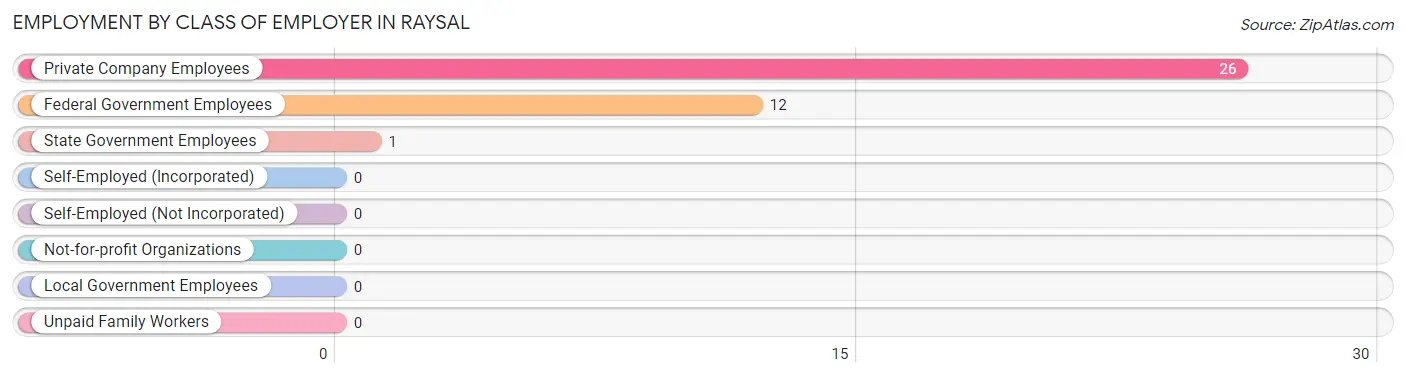
| Employer Class | # Employees | % Employees |
| Private Company Employees | 26 | 66.7% |
| Self-Employed (Incorporated) | 0 | 0.0% |
| Self-Employed (Not Incorporated) | 0 | 0.0% |
| Not-for-profit Organizations | 0 | 0.0% |
| Local Government Employees | 0 | 0.0% |
| State Government Employees | 1 | 2.6% |
| Federal Government Employees | 12 | 30.8% |
| Unpaid Family Workers | 0 | 0.0% |
| Total | 39 | 100.0% |
Employment Status by Age in Raysal
According to the labor force statistics for Raysal, out of the total population over 16 years of age (532), 28.9% or 154 individuals are in the labor force, with 74.7% or 115 of them unemployed. The age group with the highest labor force participation rate is 25 to 29 years, with 100.0% or 82 individuals in the labor force. Within the labor force, the 16 to 19 years age range has the highest percentage of unemployed individuals, with 100.0% or 33 of them being unemployed.
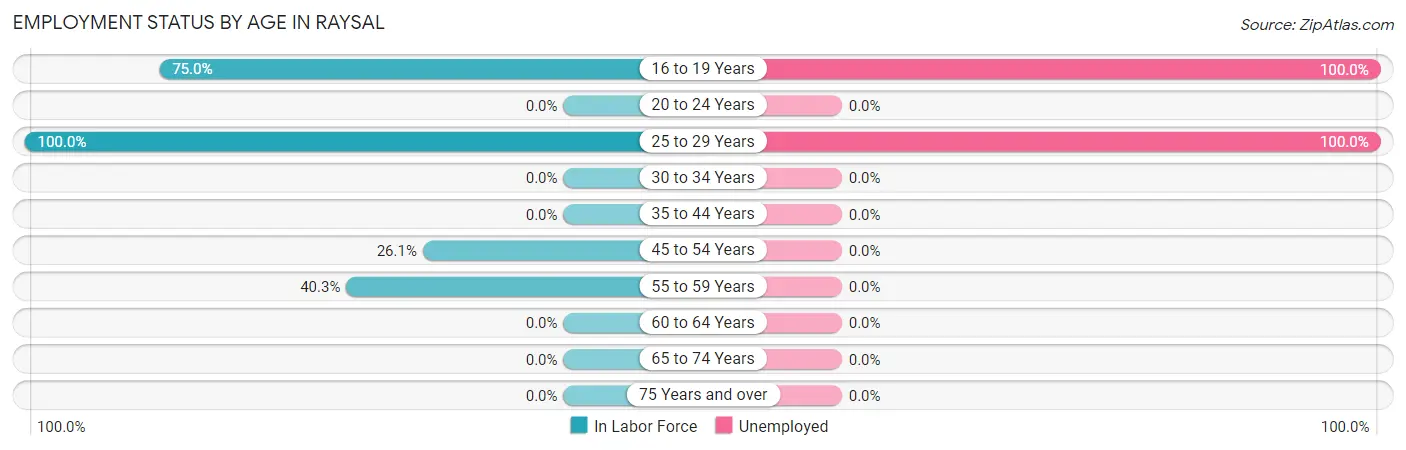
| Age Bracket | In Labor Force | Unemployed |
| 16 to 19 Years | 33 (75.0%) | 33 (100.0%) |
| 20 to 24 Years | 0 (0.0%) | 0 (0.0%) |
| 25 to 29 Years | 82 (100.0%) | 82 (100.0%) |
| 30 to 34 Years | 0 (0.0%) | 0 (0.0%) |
| 35 to 44 Years | 0 (0.0%) | 0 (0.0%) |
| 45 to 54 Years | 12 (26.1%) | 0 (0.0%) |
| 55 to 59 Years | 27 (40.3%) | 0 (0.0%) |
| 60 to 64 Years | 0 (0.0%) | 0 (0.0%) |
| 65 to 74 Years | 0 (0.0%) | 0 (0.0%) |
| 75 Years and over | 0 (0.0%) | 0 (0.0%) |
| Total | 154 (28.9%) | 115 (74.7%) |
Employment Status by Educational Attainment in Raysal
According to labor force statistics for Raysal, 50.6% of individuals (121) out of the total population between 25 and 64 years of age (239) are in the labor force, with 67.8% or 82 of them being unemployed. The group with the highest labor force participation rate are those with the educational attainment of bachelor's degree or higher, with 100.0% or 1 individuals in the labor force. Within the labor force, individuals with high school diploma education have the highest percentage of unemployment, with 75.9% or 82 of them being unemployed.
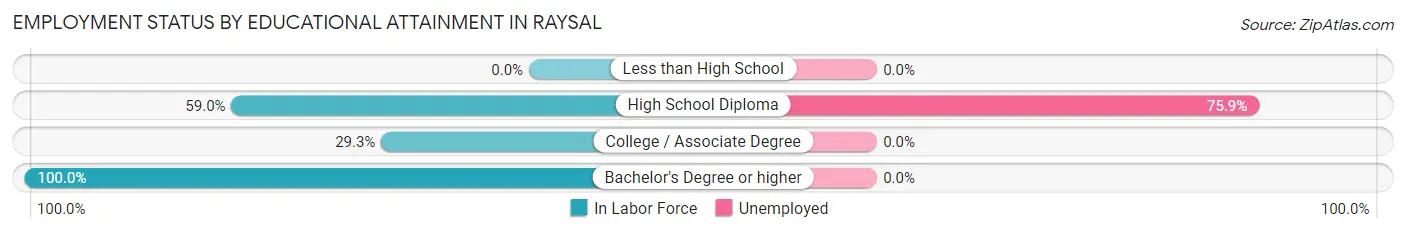
| Educational Attainment | In Labor Force | Unemployed |
| Less than High School | 0 (0.0%) | 0 (0.0%) |
| High School Diploma | 108 (59.0%) | 139 (75.9%) |
| College / Associate Degree | 12 (29.3%) | 0 (0.0%) |
| Bachelor's Degree or higher | 1 (100.0%) | 0 (0.0%) |
| Total | 121 (50.6%) | 162 (67.8%) |
Employment Occupations by Sex in Raysal
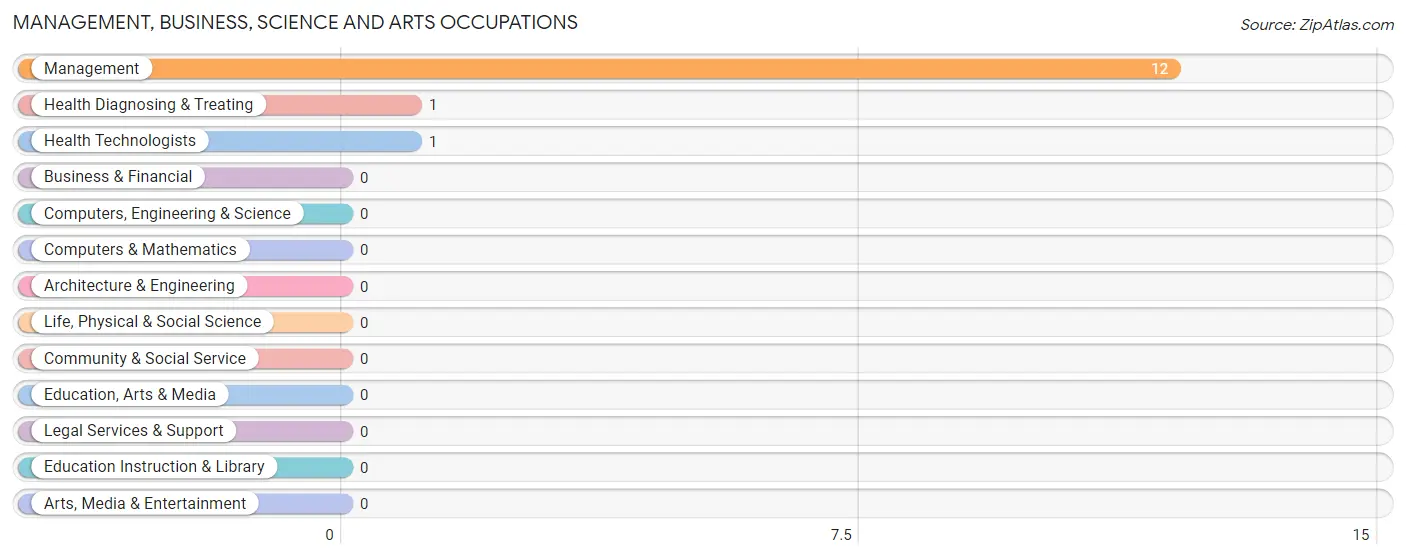
Management, Business, Science and Arts Occupations
The most common Management, Business, Science and Arts occupations in Raysal are Management (12 | 30.8%), Health Diagnosing & Treating (1 | 2.6%), and Health Technologists (1 | 2.6%).
Management, Business, Science and Arts Occupations by Sex
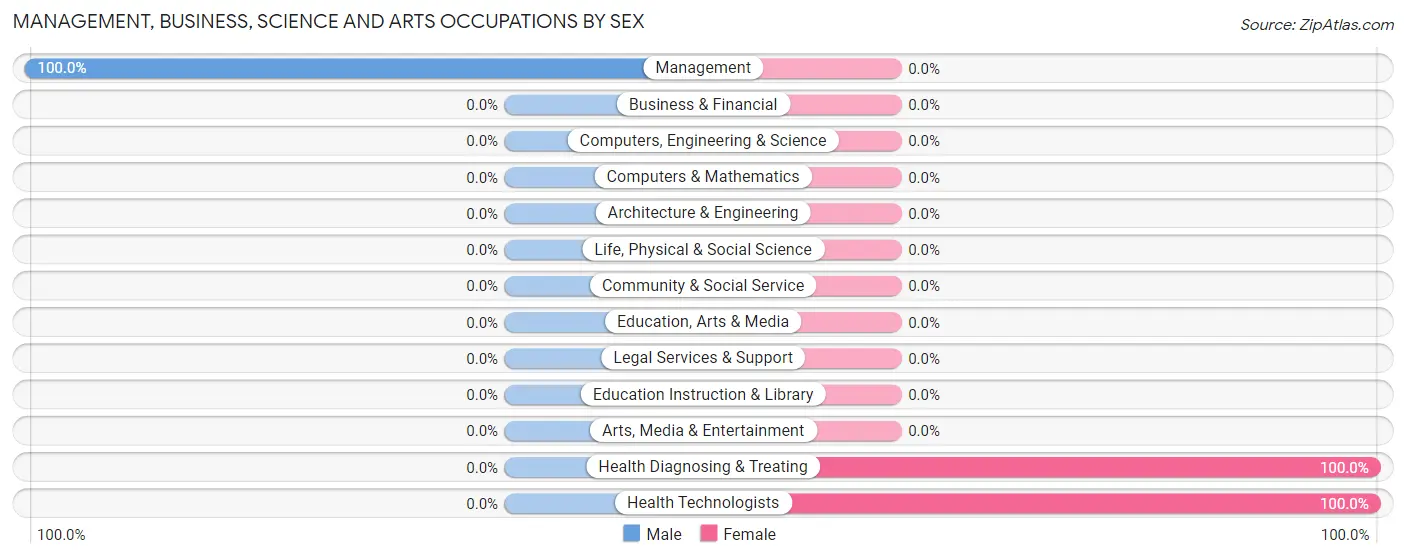
| Occupation | Male | Female |
| Management | 12 (100.0%) | 0 (0.0%) |
| Business & Financial | 0 (0.0%) | 0 (0.0%) |
| Computers, Engineering & Science | 0 (0.0%) | 0 (0.0%) |
| Computers & Mathematics | 0 (0.0%) | 0 (0.0%) |
| Architecture & Engineering | 0 (0.0%) | 0 (0.0%) |
| Life, Physical & Social Science | 0 (0.0%) | 0 (0.0%) |
| Community & Social Service | 0 (0.0%) | 0 (0.0%) |
| Education, Arts & Media | 0 (0.0%) | 0 (0.0%) |
| Legal Services & Support | 0 (0.0%) | 0 (0.0%) |
| Education Instruction & Library | 0 (0.0%) | 0 (0.0%) |
| Arts, Media & Entertainment | 0 (0.0%) | 0 (0.0%) |
| Health Diagnosing & Treating | 0 (0.0%) | 1 (100.0%) |
| Health Technologists | 0 (0.0%) | 1 (100.0%) |
| Total (Category) | 12 (92.3%) | 1 (7.7%) |
| Total (Overall) | 38 (97.4%) | 1 (2.6%) |
Services Occupations
Services Occupations by Sex
| Occupation | Male | Female |
| Healthcare Support | 0 (0.0%) | 0 (0.0%) |
| Security & Protection | 0 (0.0%) | 0 (0.0%) |
| Firefighting & Prevention | 0 (0.0%) | 0 (0.0%) |
| Law Enforcement | 0 (0.0%) | 0 (0.0%) |
| Food Preparation & Serving | 0 (0.0%) | 0 (0.0%) |
| Cleaning & Maintenance | 0 (0.0%) | 0 (0.0%) |
| Personal Care & Service | 0 (0.0%) | 0 (0.0%) |
| Total (Category) | 0 (0.0%) | 0 (0.0%) |
| Total (Overall) | 38 (97.4%) | 1 (2.6%) |
Sales and Office Occupations
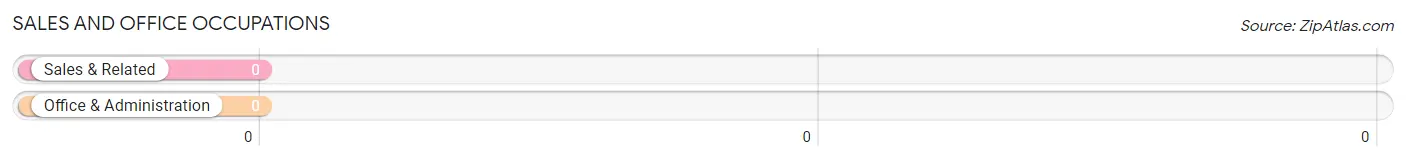
Sales and Office Occupations by Sex
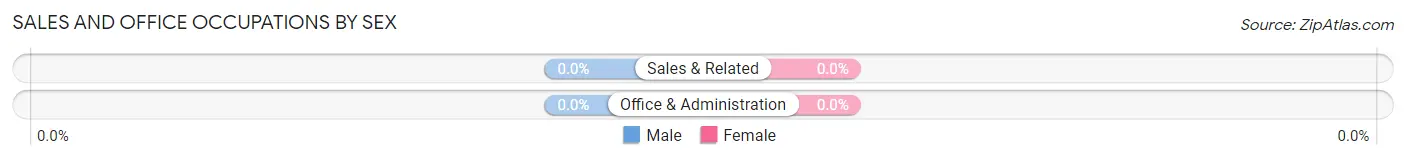
| Occupation | Male | Female |
| Sales & Related | 0 (0.0%) | 0 (0.0%) |
| Office & Administration | 0 (0.0%) | 0 (0.0%) |
| Total (Category) | 0 (0.0%) | 0 (0.0%) |
| Total (Overall) | 38 (97.4%) | 1 (2.6%) |
Natural Resources, Construction and Maintenance Occupations
The most common Natural Resources, Construction and Maintenance occupations in Raysal are , and Construction & Extraction (26 | 66.7%).
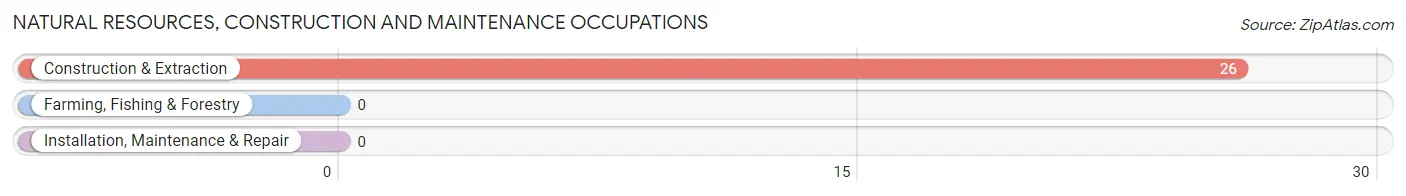
Natural Resources, Construction and Maintenance Occupations by Sex
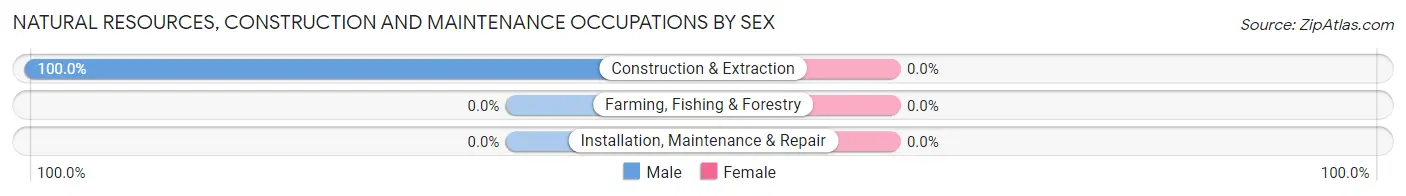
| Occupation | Male | Female |
| Farming, Fishing & Forestry | 0 (0.0%) | 0 (0.0%) |
| Construction & Extraction | 26 (100.0%) | 0 (0.0%) |
| Installation, Maintenance & Repair | 0 (0.0%) | 0 (0.0%) |
| Total (Category) | 26 (100.0%) | 0 (0.0%) |
| Total (Overall) | 38 (97.4%) | 1 (2.6%) |
Production, Transportation and Moving Occupations
Production, Transportation and Moving Occupations by Sex
| Occupation | Male | Female |
| Production | 0 (0.0%) | 0 (0.0%) |
| Transportation | 0 (0.0%) | 0 (0.0%) |
| Material Moving | 0 (0.0%) | 0 (0.0%) |
| Total (Category) | 0 (0.0%) | 0 (0.0%) |
| Total (Overall) | 38 (97.4%) | 1 (2.6%) |
Employment Industries by Sex in Raysal
Employment Industries in Raysal
The major employment industries in Raysal include Mining, Quarrying, & Extraction (26 | 66.7%), Transportation & Warehousing (12 | 30.8%), and Health Care & Social Assistance (1 | 2.6%).
Employment Industries by Sex in Raysal
| Industry | Male | Female |
| Agriculture, Fishing & Hunting | 0 (0.0%) | 0 (0.0%) |
| Mining, Quarrying, & Extraction | 26 (100.0%) | 0 (0.0%) |
| Construction | 0 (0.0%) | 0 (0.0%) |
| Manufacturing | 0 (0.0%) | 0 (0.0%) |
| Wholesale Trade | 0 (0.0%) | 0 (0.0%) |
| Retail Trade | 0 (0.0%) | 0 (0.0%) |
| Transportation & Warehousing | 12 (100.0%) | 0 (0.0%) |
| Utilities | 0 (0.0%) | 0 (0.0%) |
| Information | 0 (0.0%) | 0 (0.0%) |
| Finance & Insurance | 0 (0.0%) | 0 (0.0%) |
| Real Estate, Rental & Leasing | 0 (0.0%) | 0 (0.0%) |
| Professional & Scientific | 0 (0.0%) | 0 (0.0%) |
| Enterprise Management | 0 (0.0%) | 0 (0.0%) |
| Administrative & Support | 0 (0.0%) | 0 (0.0%) |
| Educational Services | 0 (0.0%) | 0 (0.0%) |
| Health Care & Social Assistance | 0 (0.0%) | 1 (100.0%) |
| Arts, Entertainment & Recreation | 0 (0.0%) | 0 (0.0%) |
| Accommodation & Food Services | 0 (0.0%) | 0 (0.0%) |
| Public Administration | 0 (0.0%) | 0 (0.0%) |
| Total | 38 (97.4%) | 1 (2.6%) |
Education in Raysal
School Enrollment in Raysal
The most common levels of schooling among the 141 students in Raysal are college / undergraduate (72 | 51.1%), kindergarten (36 | 25.5%), and high school (33 | 23.4%).
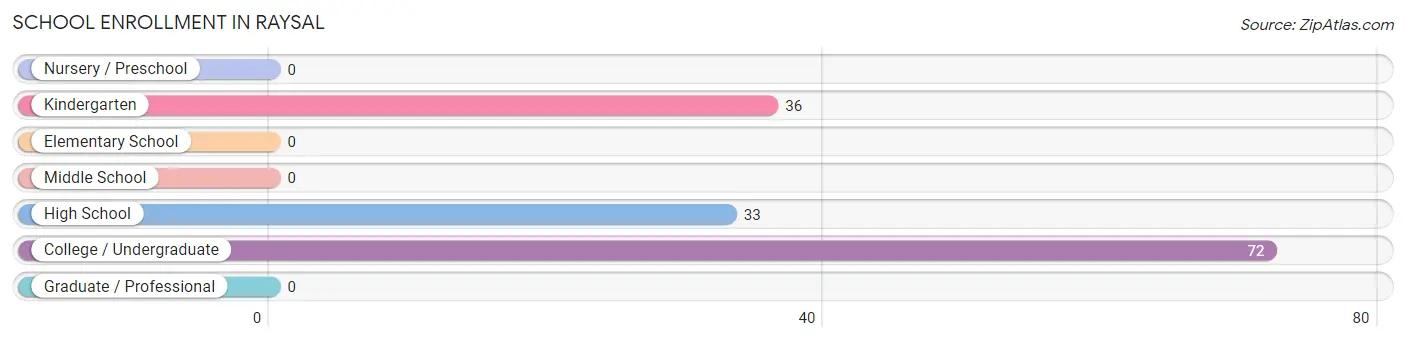
| School Level | # Students | % Students |
| Nursery / Preschool | 0 | 0.0% |
| Kindergarten | 36 | 25.5% |
| Elementary School | 0 | 0.0% |
| Middle School | 0 | 0.0% |
| High School | 33 | 23.4% |
| College / Undergraduate | 72 | 51.1% |
| Graduate / Professional | 0 | 0.0% |
| Total | 141 | 100.0% |
School Enrollment by Age by Funding Source in Raysal
Out of a total of 141 students who are enrolled in schools in Raysal, 33 (23.4%) attend a private institution, while the remaining 108 (76.6%) are enrolled in public schools. The age group of 18 to 19 year olds has the highest likelihood of being enrolled in private schools, with 33 (75.0% in the age bracket) enrolled. Conversely, the age group of 5 to 9 year old has the lowest likelihood of being enrolled in a private school, with 36 (100.0% in the age bracket) attending a public institution.
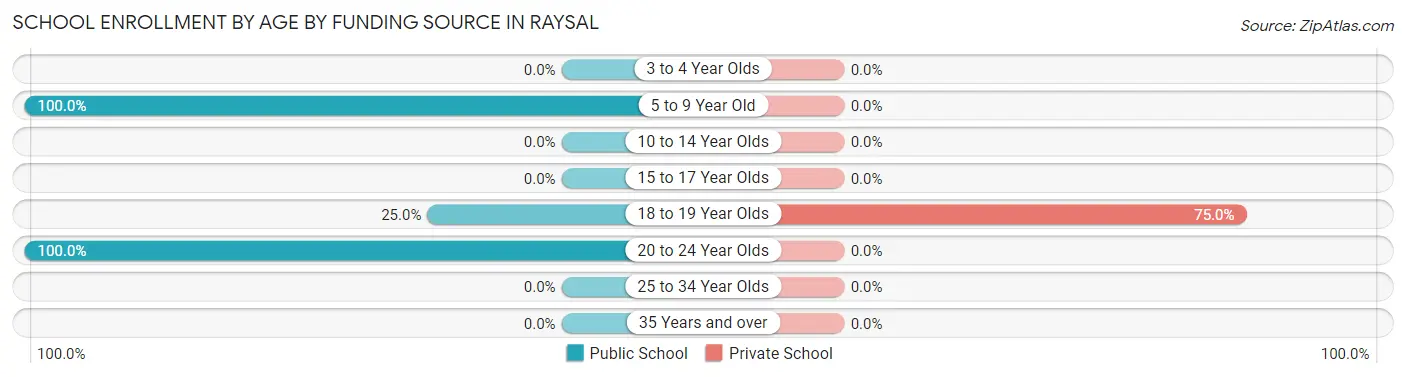
| Age Bracket | Public School | Private School |
| 3 to 4 Year Olds | 0 (0.0%) | 0 (0.0%) |
| 5 to 9 Year Old | 36 (100.0%) | 0 (0.0%) |
| 10 to 14 Year Olds | 0 (0.0%) | 0 (0.0%) |
| 15 to 17 Year Olds | 0 (0.0%) | 0 (0.0%) |
| 18 to 19 Year Olds | 11 (25.0%) | 33 (75.0%) |
| 20 to 24 Year Olds | 61 (100.0%) | 0 (0.0%) |
| 25 to 34 Year Olds | 0 (0.0%) | 0 (0.0%) |
| 35 Years and over | 0 (0.0%) | 0 (0.0%) |
| Total | 108 (76.6%) | 33 (23.4%) |
Educational Attainment by Field of Study in Raysal
, and science & technology (1 | 100.0%) are the most common fields of study among 1 individuals in Raysal who have obtained a bachelor's degree or higher.
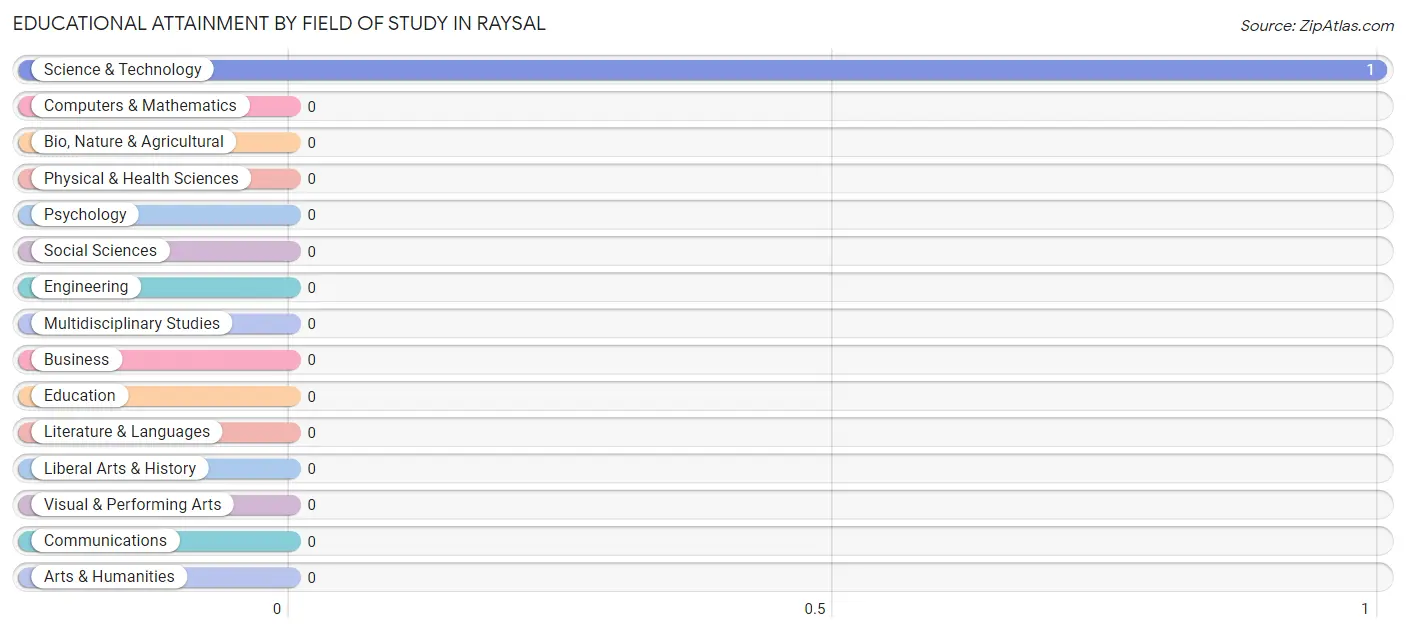
| Field of Study | # Graduates | % Graduates |
| Computers & Mathematics | 0 | 0.0% |
| Bio, Nature & Agricultural | 0 | 0.0% |
| Physical & Health Sciences | 0 | 0.0% |
| Psychology | 0 | 0.0% |
| Social Sciences | 0 | 0.0% |
| Engineering | 0 | 0.0% |
| Multidisciplinary Studies | 0 | 0.0% |
| Science & Technology | 1 | 100.0% |
| Business | 0 | 0.0% |
| Education | 0 | 0.0% |
| Literature & Languages | 0 | 0.0% |
| Liberal Arts & History | 0 | 0.0% |
| Visual & Performing Arts | 0 | 0.0% |
| Communications | 0 | 0.0% |
| Arts & Humanities | 0 | 0.0% |
| Total | 1 | 100.0% |
Transportation & Commute in Raysal
Vehicle Availability by Sex in Raysal
The most prevalent vehicle ownership categories in Raysal are males with 2 vehicles (26, accounting for 68.4%) and females with 2 vehicles (1, making up 2,600.0%).
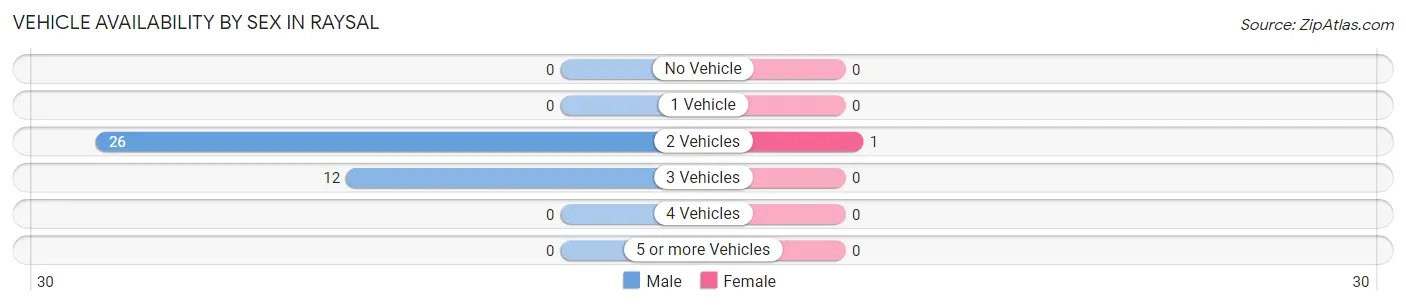
| Vehicles Available | Male | Female |
| No Vehicle | 0 (0.0%) | 0 (0.0%) |
| 1 Vehicle | 0 (0.0%) | 0 (0.0%) |
| 2 Vehicles | 26 (68.4%) | 1 (100.0%) |
| 3 Vehicles | 12 (31.6%) | 0 (0.0%) |
| 4 Vehicles | 0 (0.0%) | 0 (0.0%) |
| 5 or more Vehicles | 0 (0.0%) | 0 (0.0%) |
| Total | 38 (100.0%) | 1 (100.0%) |
Commute Time in Raysal
The most frequently occuring commute durations in Raysal are 60 to 89 minutes (26 commuters, 66.7%), 40 to 44 minutes (12 commuters, 30.8%), and 45 to 59 minutes (1 commuters, 2.6%).
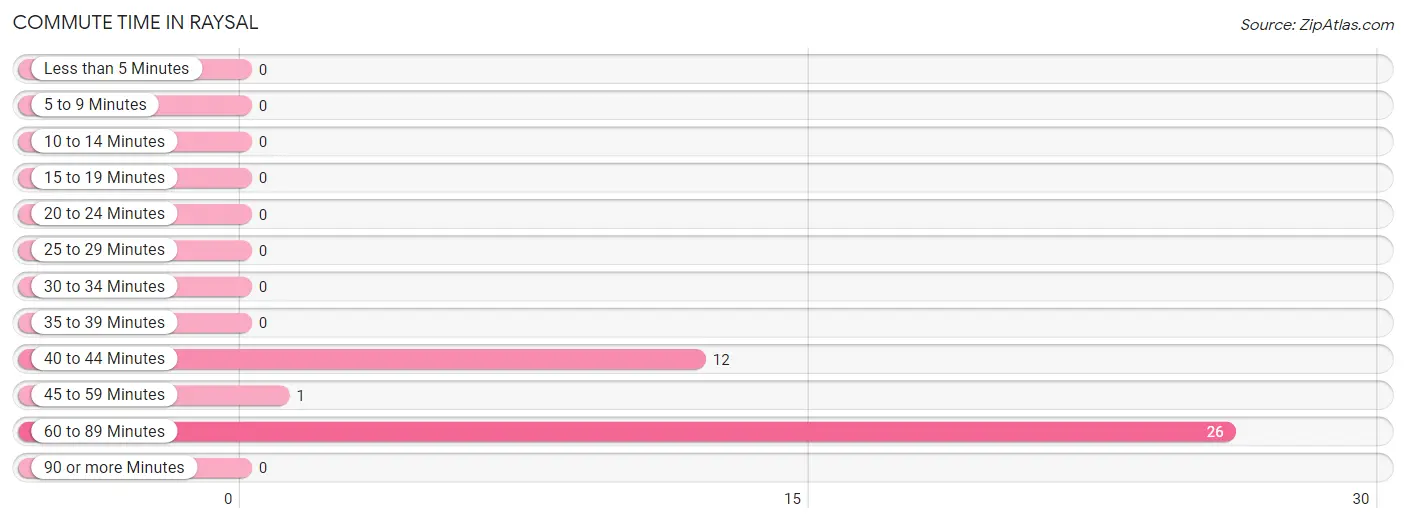
| Commute Time | # Commuters | % Commuters |
| Less than 5 Minutes | 0 | 0.0% |
| 5 to 9 Minutes | 0 | 0.0% |
| 10 to 14 Minutes | 0 | 0.0% |
| 15 to 19 Minutes | 0 | 0.0% |
| 20 to 24 Minutes | 0 | 0.0% |
| 25 to 29 Minutes | 0 | 0.0% |
| 30 to 34 Minutes | 0 | 0.0% |
| 35 to 39 Minutes | 0 | 0.0% |
| 40 to 44 Minutes | 12 | 30.8% |
| 45 to 59 Minutes | 1 | 2.6% |
| 60 to 89 Minutes | 26 | 66.7% |
| 90 or more Minutes | 0 | 0.0% |
Commute Time by Sex in Raysal
The most common commute times in Raysal are 60 to 89 minutes (26 commuters, 68.4%) for males and 45 to 59 minutes (1 commuters, 100.0%) for females.
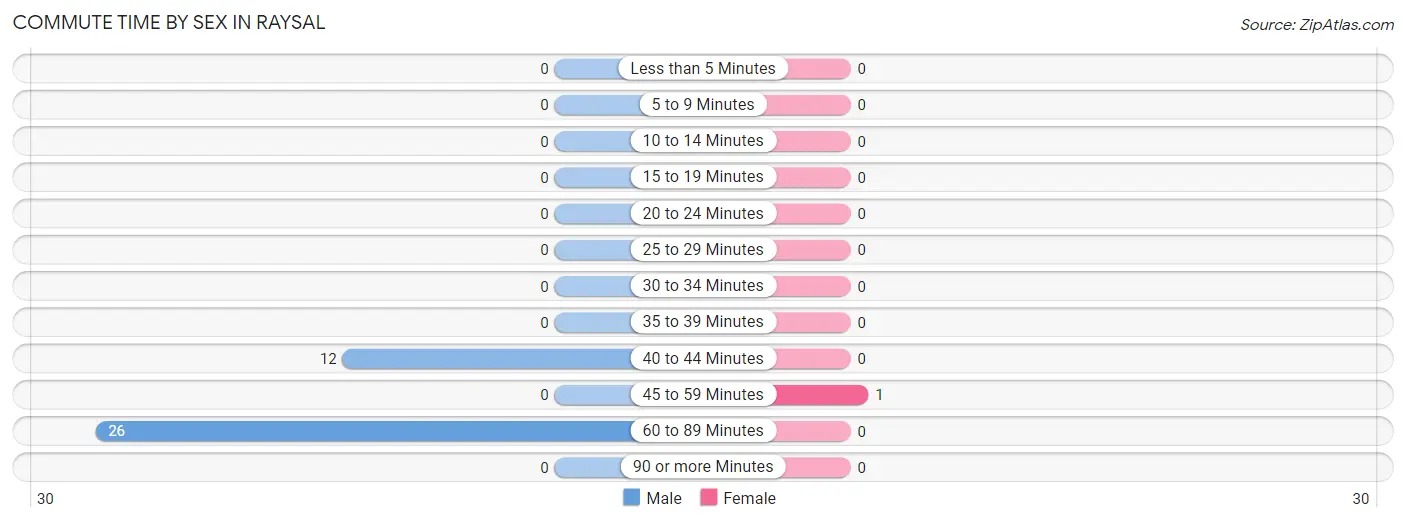
| Commute Time | Male | Female |
| Less than 5 Minutes | 0 (0.0%) | 0 (0.0%) |
| 5 to 9 Minutes | 0 (0.0%) | 0 (0.0%) |
| 10 to 14 Minutes | 0 (0.0%) | 0 (0.0%) |
| 15 to 19 Minutes | 0 (0.0%) | 0 (0.0%) |
| 20 to 24 Minutes | 0 (0.0%) | 0 (0.0%) |
| 25 to 29 Minutes | 0 (0.0%) | 0 (0.0%) |
| 30 to 34 Minutes | 0 (0.0%) | 0 (0.0%) |
| 35 to 39 Minutes | 0 (0.0%) | 0 (0.0%) |
| 40 to 44 Minutes | 12 (31.6%) | 0 (0.0%) |
| 45 to 59 Minutes | 0 (0.0%) | 1 (100.0%) |
| 60 to 89 Minutes | 26 (68.4%) | 0 (0.0%) |
| 90 or more Minutes | 0 (0.0%) | 0 (0.0%) |
Time of Departure to Work by Sex in Raysal
The most frequent times of departure to work in Raysal are 6:00 AM to 6:29 AM (26, 68.4%) for males and 7:30 AM to 7:59 AM (1, 100.0%) for females.
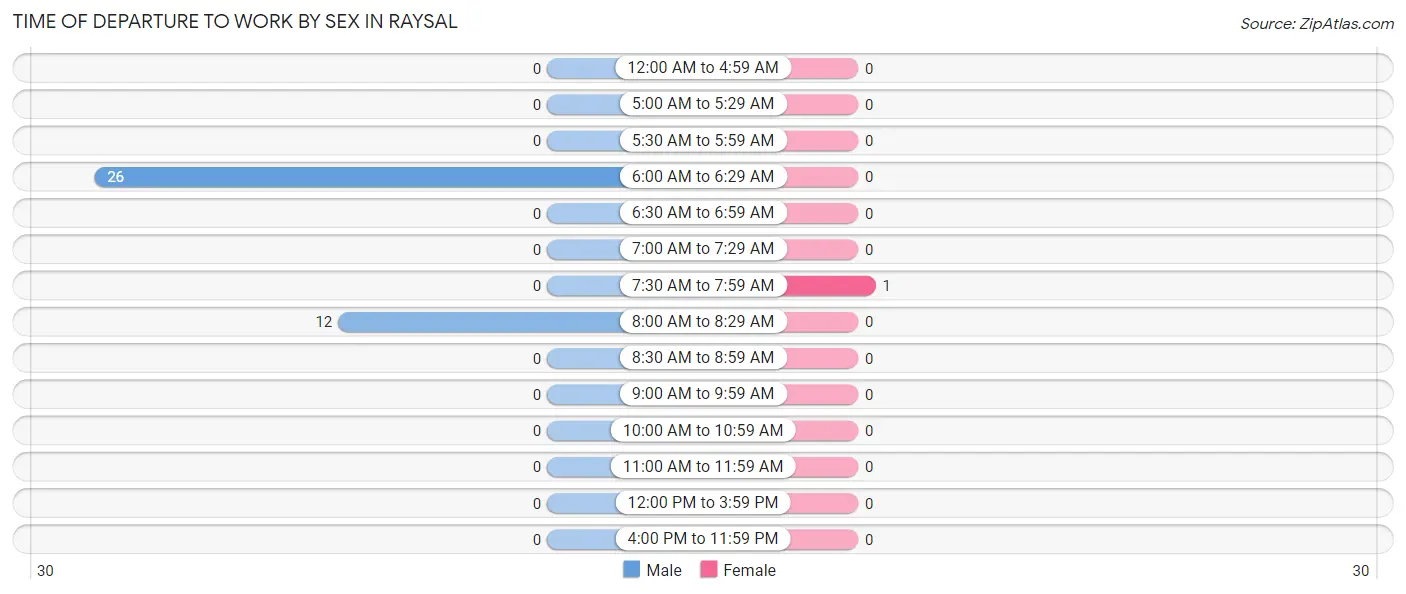
| Time of Departure | Male | Female |
| 12:00 AM to 4:59 AM | 0 (0.0%) | 0 (0.0%) |
| 5:00 AM to 5:29 AM | 0 (0.0%) | 0 (0.0%) |
| 5:30 AM to 5:59 AM | 0 (0.0%) | 0 (0.0%) |
| 6:00 AM to 6:29 AM | 26 (68.4%) | 0 (0.0%) |
| 6:30 AM to 6:59 AM | 0 (0.0%) | 0 (0.0%) |
| 7:00 AM to 7:29 AM | 0 (0.0%) | 0 (0.0%) |
| 7:30 AM to 7:59 AM | 0 (0.0%) | 1 (100.0%) |
| 8:00 AM to 8:29 AM | 12 (31.6%) | 0 (0.0%) |
| 8:30 AM to 8:59 AM | 0 (0.0%) | 0 (0.0%) |
| 9:00 AM to 9:59 AM | 0 (0.0%) | 0 (0.0%) |
| 10:00 AM to 10:59 AM | 0 (0.0%) | 0 (0.0%) |
| 11:00 AM to 11:59 AM | 0 (0.0%) | 0 (0.0%) |
| 12:00 PM to 3:59 PM | 0 (0.0%) | 0 (0.0%) |
| 4:00 PM to 11:59 PM | 0 (0.0%) | 0 (0.0%) |
| Total | 38 (100.0%) | 1 (100.0%) |
Housing Occupancy in Raysal
Occupancy by Ownership in Raysal
Of the total 230 dwellings in Raysal, owner-occupied units account for 194 (84.4%), while renter-occupied units make up 36 (15.7%).
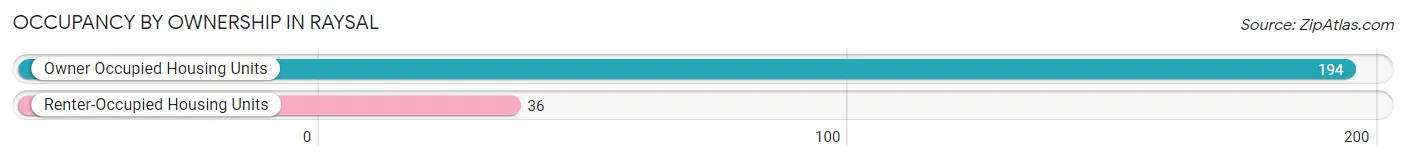
| Occupancy | # Housing Units | % Housing Units |
| Owner Occupied Housing Units | 194 | 84.4% |
| Renter-Occupied Housing Units | 36 | 15.7% |
| Total Occupied Housing Units | 230 | 100.0% |
Occupancy by Household Size in Raysal
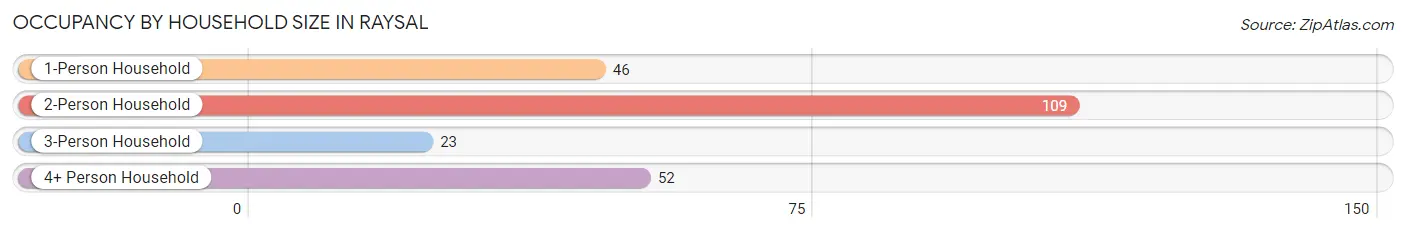
| Household Size | # Housing Units | % Housing Units |
| 1-Person Household | 46 | 20.0% |
| 2-Person Household | 109 | 47.4% |
| 3-Person Household | 23 | 10.0% |
| 4+ Person Household | 52 | 22.6% |
| Total Housing Units | 230 | 100.0% |
Occupancy by Ownership by Household Size in Raysal
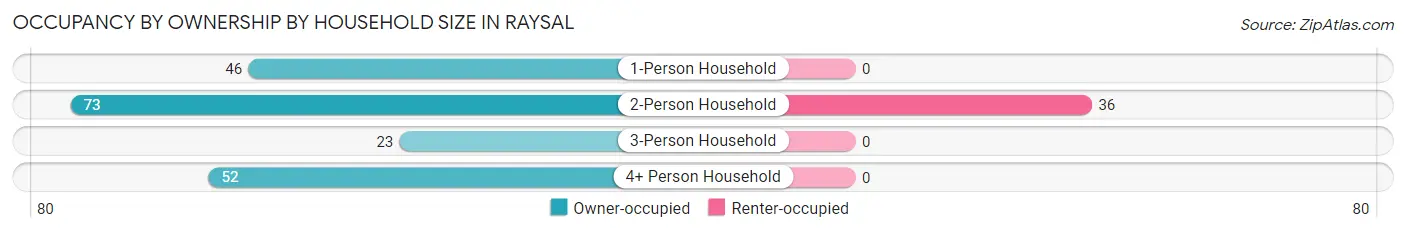
| Household Size | Owner-occupied | Renter-occupied |
| 1-Person Household | 46 (100.0%) | 0 (0.0%) |
| 2-Person Household | 73 (67.0%) | 36 (33.0%) |
| 3-Person Household | 23 (100.0%) | 0 (0.0%) |
| 4+ Person Household | 52 (100.0%) | 0 (0.0%) |
| Total Housing Units | 194 (84.4%) | 36 (15.7%) |
Occupancy by Educational Attainment in Raysal
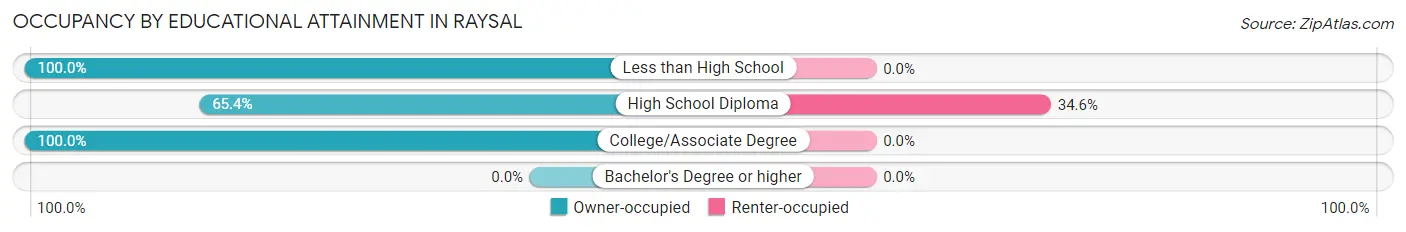
| Household Size | Owner-occupied | Renter-occupied |
| Less than High School | 85 (100.0%) | 0 (0.0%) |
| High School Diploma | 68 (65.4%) | 36 (34.6%) |
| College/Associate Degree | 41 (100.0%) | 0 (0.0%) |
| Bachelor's Degree or higher | 0 (0.0%) | 0 (0.0%) |
Occupancy by Age of Householder in Raysal
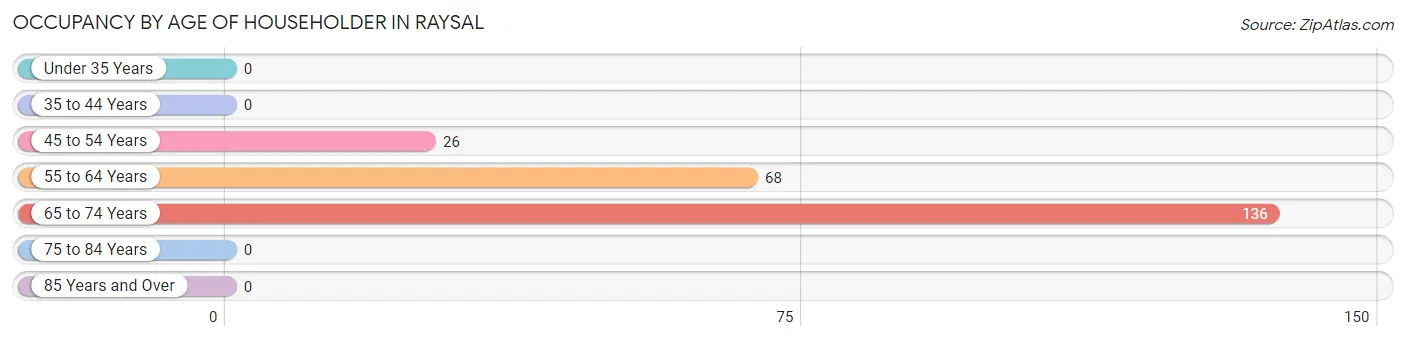
| Age Bracket | # Households | % Households |
| Under 35 Years | 0 | 0.0% |
| 35 to 44 Years | 0 | 0.0% |
| 45 to 54 Years | 26 | 11.3% |
| 55 to 64 Years | 68 | 29.6% |
| 65 to 74 Years | 136 | 59.1% |
| 75 to 84 Years | 0 | 0.0% |
| 85 Years and Over | 0 | 0.0% |
| Total | 230 | 100.0% |
Housing Finances in Raysal
Median Income by Occupancy in Raysal
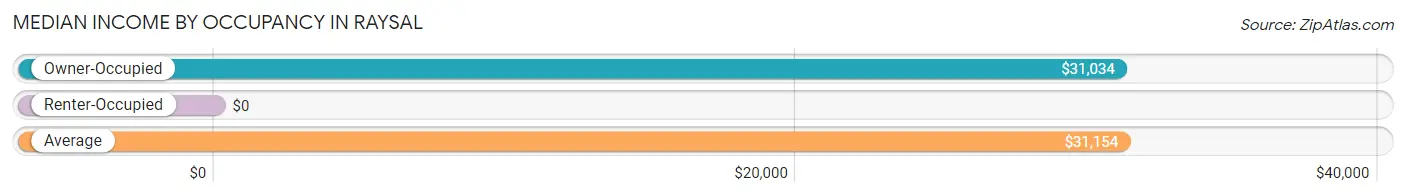
| Occupancy Type | # Households | Median Income |
| Owner-Occupied | 194 (84.4%) | $31,034 |
| Renter-Occupied | 36 (15.7%) | $0 |
| Average | 230 (100.0%) | $31,154 |
Occupancy by Householder Income Bracket in Raysal
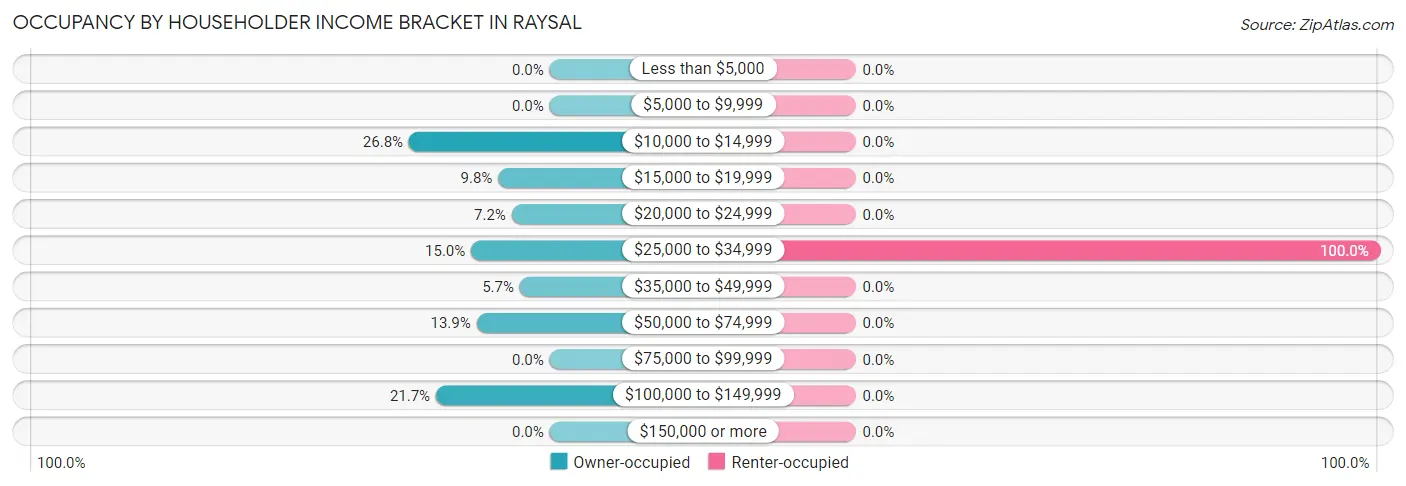
| Income Bracket | Owner-occupied | Renter-occupied |
| Less than $5,000 | 0 (0.0%) | 0 (0.0%) |
| $5,000 to $9,999 | 0 (0.0%) | 0 (0.0%) |
| $10,000 to $14,999 | 52 (26.8%) | 0 (0.0%) |
| $15,000 to $19,999 | 19 (9.8%) | 0 (0.0%) |
| $20,000 to $24,999 | 14 (7.2%) | 0 (0.0%) |
| $25,000 to $34,999 | 29 (14.9%) | 36 (100.0%) |
| $35,000 to $49,999 | 11 (5.7%) | 0 (0.0%) |
| $50,000 to $74,999 | 27 (13.9%) | 0 (0.0%) |
| $75,000 to $99,999 | 0 (0.0%) | 0 (0.0%) |
| $100,000 to $149,999 | 42 (21.6%) | 0 (0.0%) |
| $150,000 or more | 0 (0.0%) | 0 (0.0%) |
| Total | 194 (100.0%) | 36 (100.0%) |
Monthly Housing Cost Tiers in Raysal
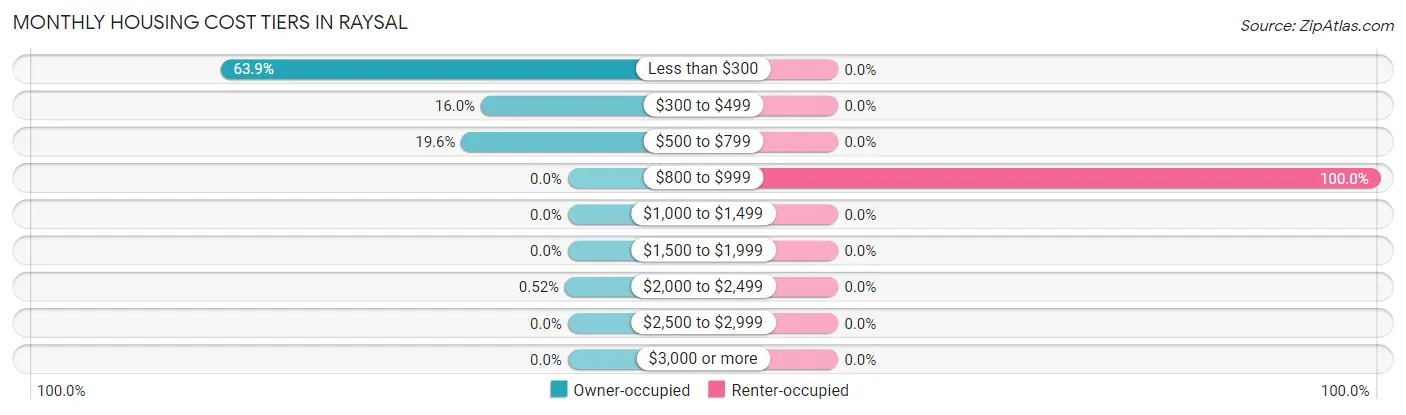
| Monthly Cost | Owner-occupied | Renter-occupied |
| Less than $300 | 124 (63.9%) | 0 (0.0%) |
| $300 to $499 | 31 (16.0%) | 0 (0.0%) |
| $500 to $799 | 38 (19.6%) | 0 (0.0%) |
| $800 to $999 | 0 (0.0%) | 36 (100.0%) |
| $1,000 to $1,499 | 0 (0.0%) | 0 (0.0%) |
| $1,500 to $1,999 | 0 (0.0%) | 0 (0.0%) |
| $2,000 to $2,499 | 1 (0.5%) | 0 (0.0%) |
| $2,500 to $2,999 | 0 (0.0%) | 0 (0.0%) |
| $3,000 or more | 0 (0.0%) | 0 (0.0%) |
| Total | 194 (100.0%) | 36 (100.0%) |
Physical Housing Characteristics in Raysal
Housing Structures in Raysal
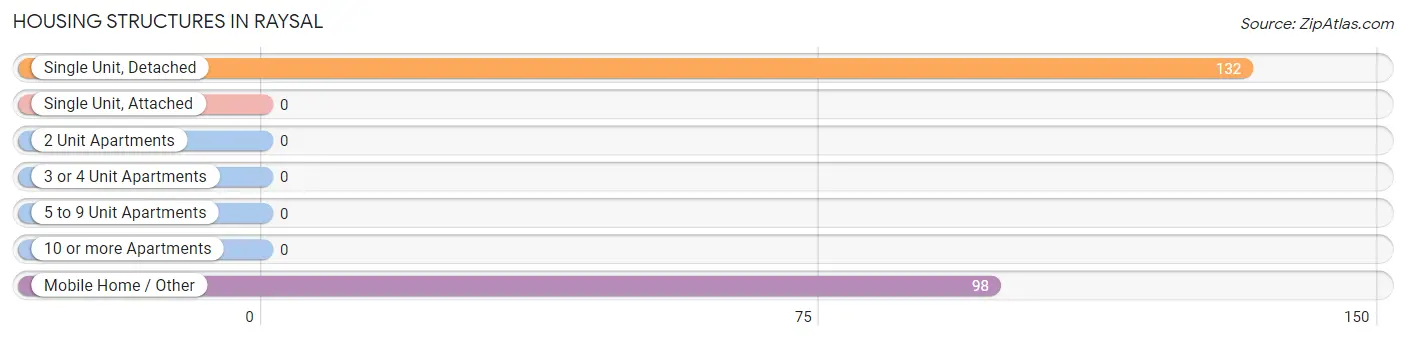
| Structure Type | # Housing Units | % Housing Units |
| Single Unit, Detached | 132 | 57.4% |
| Single Unit, Attached | 0 | 0.0% |
| 2 Unit Apartments | 0 | 0.0% |
| 3 or 4 Unit Apartments | 0 | 0.0% |
| 5 to 9 Unit Apartments | 0 | 0.0% |
| 10 or more Apartments | 0 | 0.0% |
| Mobile Home / Other | 98 | 42.6% |
| Total | 230 | 100.0% |
Housing Structures by Occupancy in Raysal
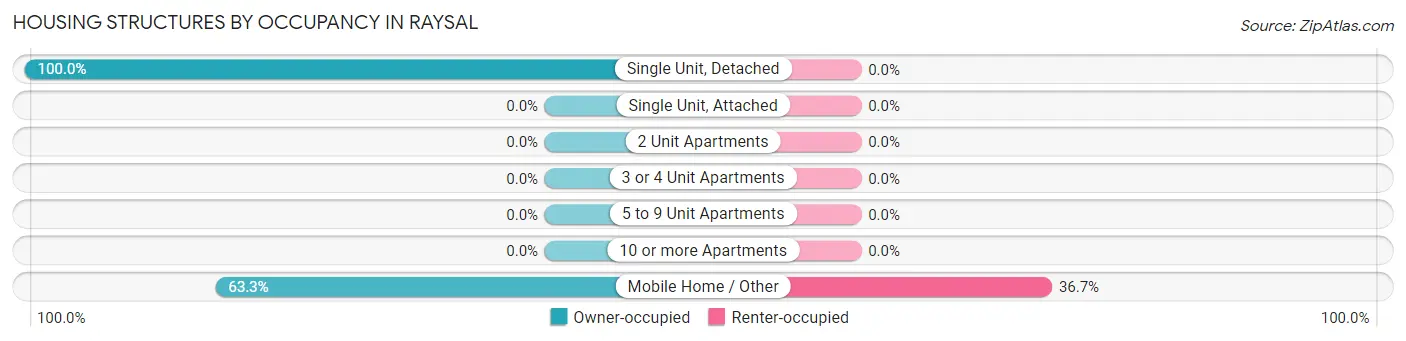
| Structure Type | Owner-occupied | Renter-occupied |
| Single Unit, Detached | 132 (100.0%) | 0 (0.0%) |
| Single Unit, Attached | 0 (0.0%) | 0 (0.0%) |
| 2 Unit Apartments | 0 (0.0%) | 0 (0.0%) |
| 3 or 4 Unit Apartments | 0 (0.0%) | 0 (0.0%) |
| 5 to 9 Unit Apartments | 0 (0.0%) | 0 (0.0%) |
| 10 or more Apartments | 0 (0.0%) | 0 (0.0%) |
| Mobile Home / Other | 62 (63.3%) | 36 (36.7%) |
| Total | 194 (84.4%) | 36 (15.7%) |
Housing Structures by Number of Rooms in Raysal
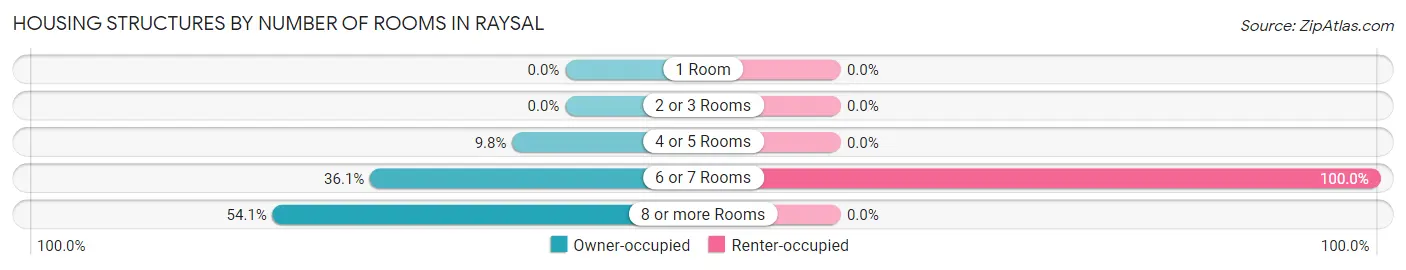
| Number of Rooms | Owner-occupied | Renter-occupied |
| 1 Room | 0 (0.0%) | 0 (0.0%) |
| 2 or 3 Rooms | 0 (0.0%) | 0 (0.0%) |
| 4 or 5 Rooms | 19 (9.8%) | 0 (0.0%) |
| 6 or 7 Rooms | 70 (36.1%) | 36 (100.0%) |
| 8 or more Rooms | 105 (54.1%) | 0 (0.0%) |
| Total | 194 (100.0%) | 36 (100.0%) |
Housing Structure by Heating Type in Raysal
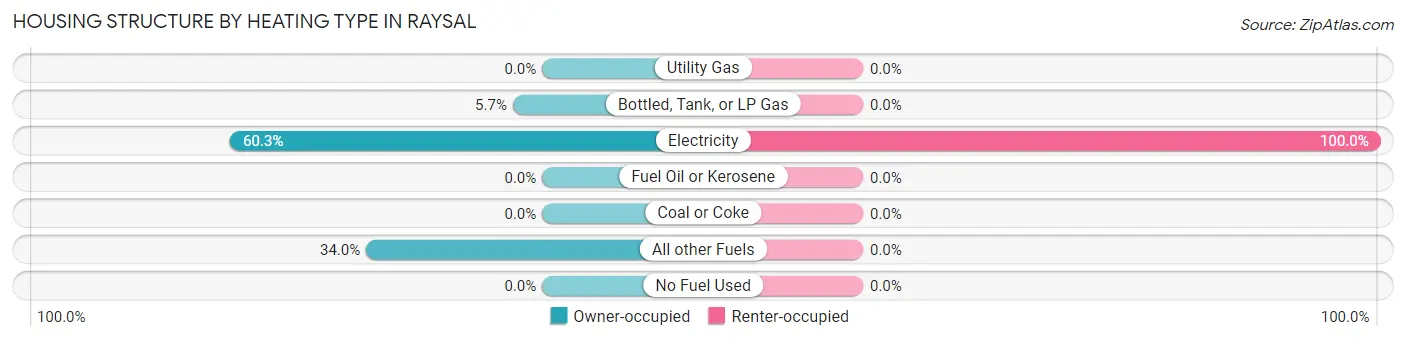
| Heating Type | Owner-occupied | Renter-occupied |
| Utility Gas | 0 (0.0%) | 0 (0.0%) |
| Bottled, Tank, or LP Gas | 11 (5.7%) | 0 (0.0%) |
| Electricity | 117 (60.3%) | 36 (100.0%) |
| Fuel Oil or Kerosene | 0 (0.0%) | 0 (0.0%) |
| Coal or Coke | 0 (0.0%) | 0 (0.0%) |
| All other Fuels | 66 (34.0%) | 0 (0.0%) |
| No Fuel Used | 0 (0.0%) | 0 (0.0%) |
| Total | 194 (100.0%) | 36 (100.0%) |
Household Vehicle Usage in Raysal
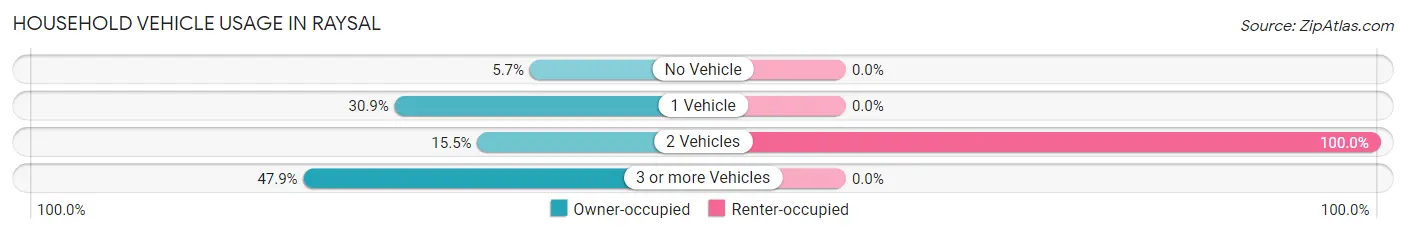
| Vehicles per Household | Owner-occupied | Renter-occupied |
| No Vehicle | 11 (5.7%) | 0 (0.0%) |
| 1 Vehicle | 60 (30.9%) | 0 (0.0%) |
| 2 Vehicles | 30 (15.5%) | 36 (100.0%) |
| 3 or more Vehicles | 93 (47.9%) | 0 (0.0%) |
| Total | 194 (100.0%) | 36 (100.0%) |
Real Estate & Mortgages in Raysal
Real Estate and Mortgage Overview in Raysal
| Characteristic | Without Mortgage | With Mortgage |
| Housing Units | 193 | 1 |
| Median Property Value | - | - |
| Median Household Income | $30,991 | $0 |
| Monthly Housing Costs | $237 | $0 |
| Real Estate Taxes | - | - |
Property Value by Mortgage Status in Raysal
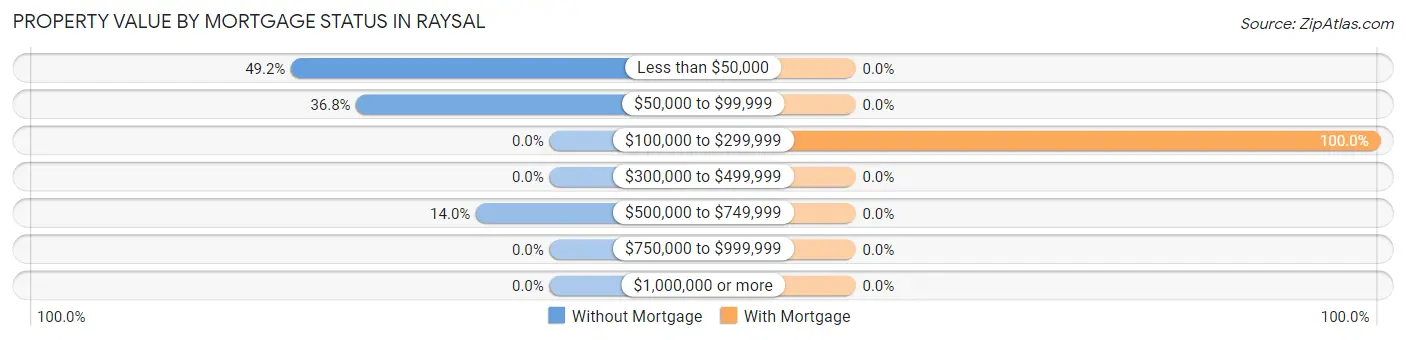
| Property Value | Without Mortgage | With Mortgage |
| Less than $50,000 | 95 (49.2%) | 0 (0.0%) |
| $50,000 to $99,999 | 71 (36.8%) | 0 (0.0%) |
| $100,000 to $299,999 | 0 (0.0%) | 1 (100.0%) |
| $300,000 to $499,999 | 0 (0.0%) | 0 (0.0%) |
| $500,000 to $749,999 | 27 (14.0%) | 0 (0.0%) |
| $750,000 to $999,999 | 0 (0.0%) | 0 (0.0%) |
| $1,000,000 or more | 0 (0.0%) | 0 (0.0%) |
| Total | 193 (100.0%) | 1 (100.0%) |
Household Income by Mortgage Status in Raysal
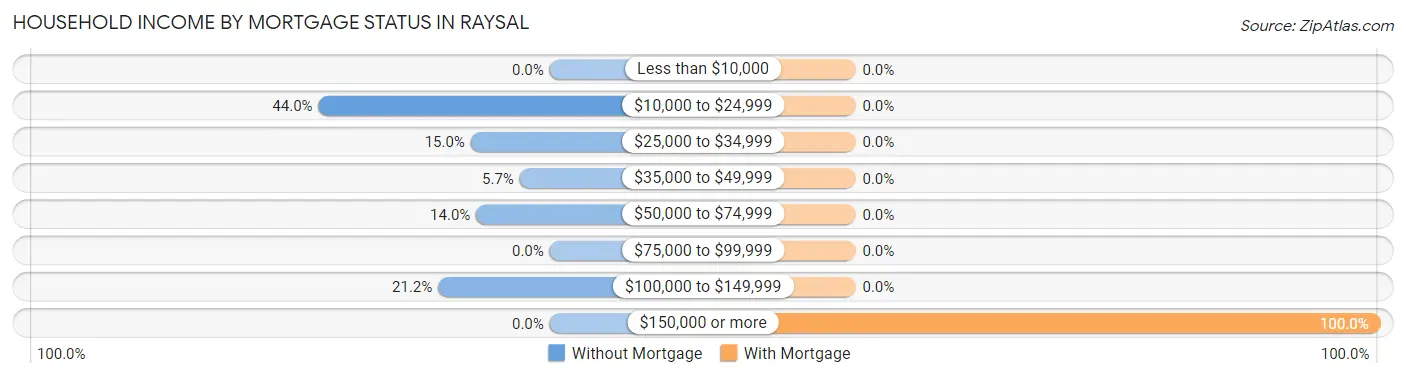
| Household Income | Without Mortgage | With Mortgage |
| Less than $10,000 | 0 (0.0%) | 0 (0.0%) |
| $10,000 to $24,999 | 85 (44.0%) | 0 (0.0%) |
| $25,000 to $34,999 | 29 (15.0%) | 0 (0.0%) |
| $35,000 to $49,999 | 11 (5.7%) | 0 (0.0%) |
| $50,000 to $74,999 | 27 (14.0%) | 0 (0.0%) |
| $75,000 to $99,999 | 0 (0.0%) | 0 (0.0%) |
| $100,000 to $149,999 | 41 (21.2%) | 0 (0.0%) |
| $150,000 or more | 0 (0.0%) | 1 (100.0%) |
| Total | 193 (100.0%) | 1 (100.0%) |
Property Value to Household Income Ratio in Raysal
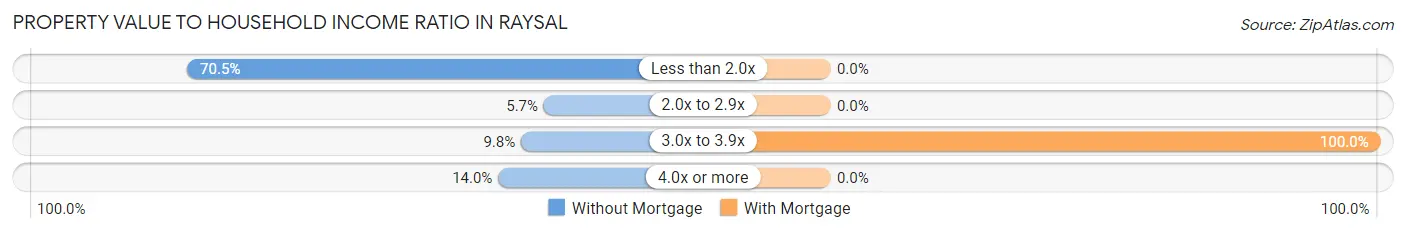
| Value-to-Income Ratio | Without Mortgage | With Mortgage |
| Less than 2.0x | 136 (70.5%) | 0 (0.0%) |
| 2.0x to 2.9x | 11 (5.7%) | 0 (0.0%) |
| 3.0x to 3.9x | 19 (9.8%) | 1 (100.0%) |
| 4.0x or more | 27 (14.0%) | 0 (0.0%) |
| Total | 193 (100.0%) | 1 (100.0%) |
Real Estate Taxes by Mortgage Status in Raysal
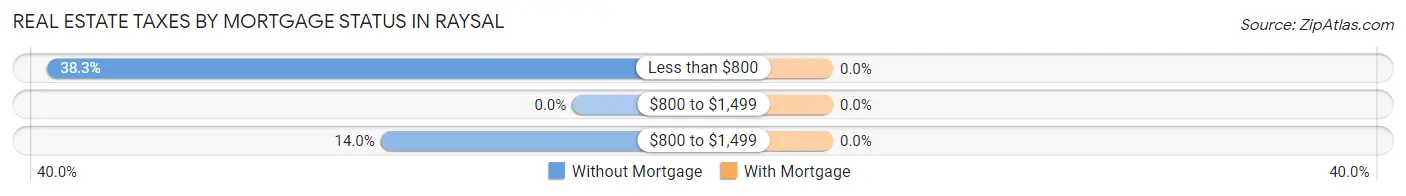
| Property Taxes | Without Mortgage | With Mortgage |
| Less than $800 | 74 (38.3%) | 0 (0.0%) |
| $800 to $1,499 | 0 (0.0%) | 0 (0.0%) |
| $800 to $1,499 | 27 (14.0%) | 0 (0.0%) |
| Total | 193 (100.0%) | 1 (100.0%) |
Health & Disability in Raysal
Health Insurance Coverage by Age in Raysal
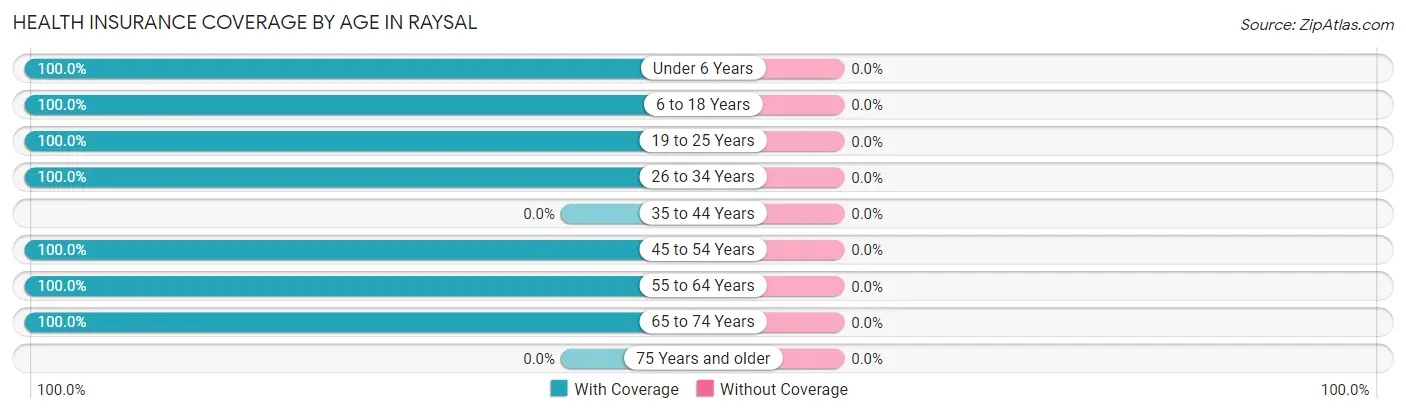
| Age Bracket | With Coverage | Without Coverage |
| Under 6 Years | 99 (100.0%) | 0 (0.0%) |
| 6 to 18 Years | 46 (100.0%) | 0 (0.0%) |
| 19 to 25 Years | 72 (100.0%) | 0 (0.0%) |
| 26 to 34 Years | 82 (100.0%) | 0 (0.0%) |
| 35 to 44 Years | 0 (0.0%) | 0 (0.0%) |
| 45 to 54 Years | 46 (100.0%) | 0 (0.0%) |
| 55 to 64 Years | 111 (100.0%) | 0 (0.0%) |
| 65 to 74 Years | 188 (100.0%) | 0 (0.0%) |
| 75 Years and older | 0 (0.0%) | 0 (0.0%) |
| Total | 644 (100.0%) | 0 (0.0%) |
Health Insurance Coverage by Citizenship Status in Raysal
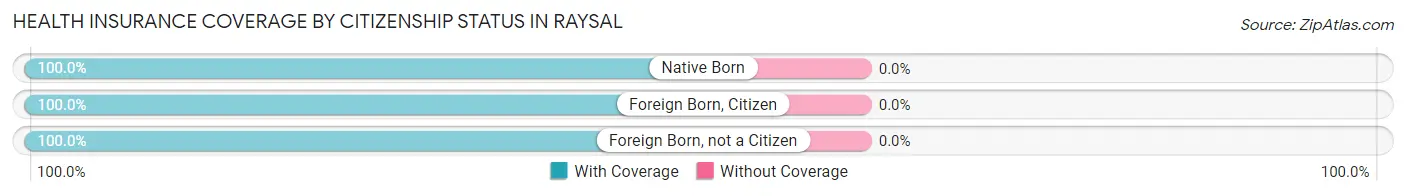
| Citizenship Status | With Coverage | Without Coverage |
| Native Born | 99 (100.0%) | 0 (0.0%) |
| Foreign Born, Citizen | 46 (100.0%) | 0 (0.0%) |
| Foreign Born, not a Citizen | 72 (100.0%) | 0 (0.0%) |
Health Insurance Coverage by Household Income in Raysal
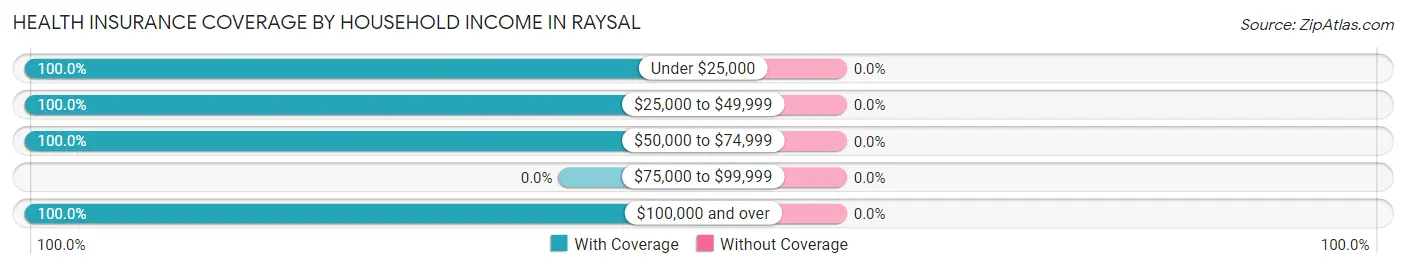
| Household Income | With Coverage | Without Coverage |
| Under $25,000 | 341 (100.0%) | 0 (0.0%) |
| $25,000 to $49,999 | 176 (100.0%) | 0 (0.0%) |
| $50,000 to $74,999 | 27 (100.0%) | 0 (0.0%) |
| $75,000 to $99,999 | 0 (0.0%) | 0 (0.0%) |
| $100,000 and over | 100 (100.0%) | 0 (0.0%) |
Public vs Private Health Insurance Coverage by Age in Raysal
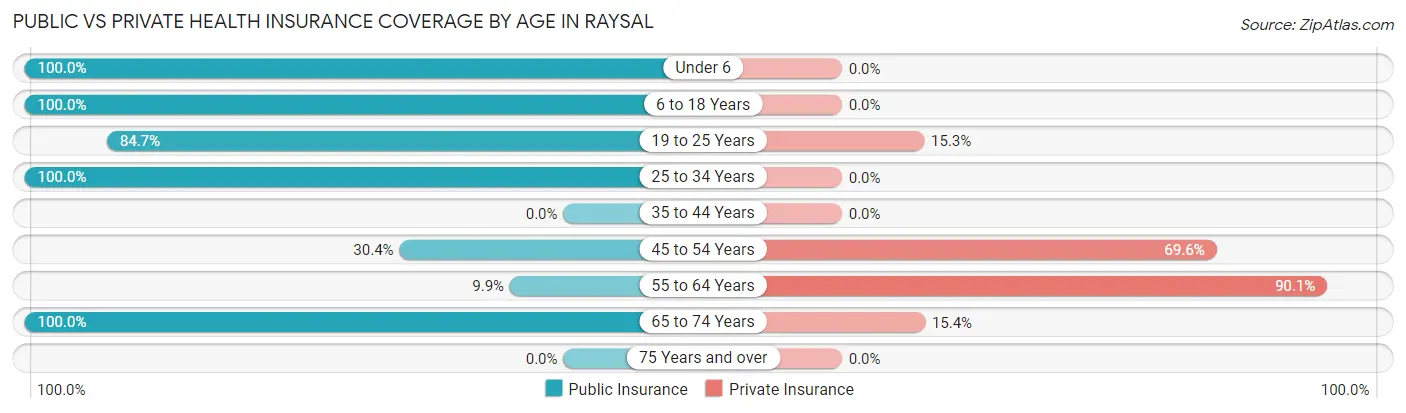
| Age Bracket | Public Insurance | Private Insurance |
| Under 6 | 99 (100.0%) | 0 (0.0%) |
| 6 to 18 Years | 46 (100.0%) | 0 (0.0%) |
| 19 to 25 Years | 61 (84.7%) | 11 (15.3%) |
| 25 to 34 Years | 82 (100.0%) | 0 (0.0%) |
| 35 to 44 Years | 0 (0.0%) | 0 (0.0%) |
| 45 to 54 Years | 14 (30.4%) | 32 (69.6%) |
| 55 to 64 Years | 11 (9.9%) | 100 (90.1%) |
| 65 to 74 Years | 188 (100.0%) | 29 (15.4%) |
| 75 Years and over | 0 (0.0%) | 0 (0.0%) |
| Total | 501 (77.8%) | 172 (26.7%) |
Disability Status by Sex by Age in Raysal
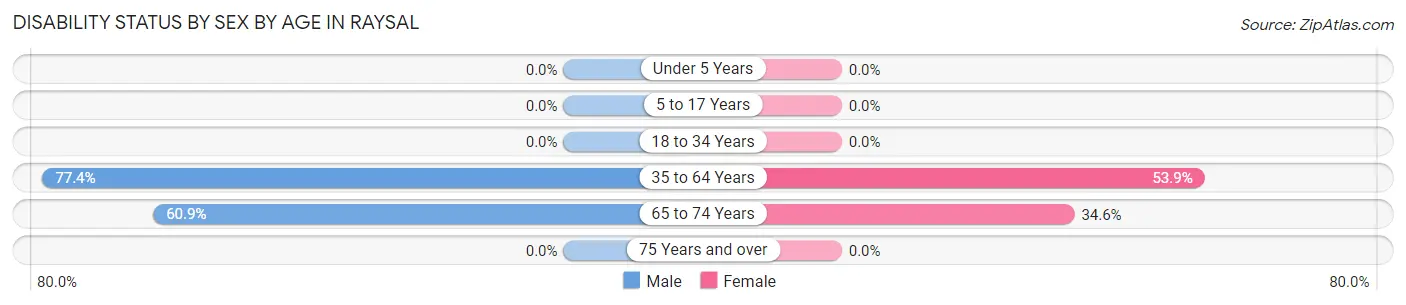
| Age Bracket | Male | Female |
| Under 5 Years | 0 (0.0%) | 0 (0.0%) |
| 5 to 17 Years | 0 (0.0%) | 0 (0.0%) |
| 18 to 34 Years | 0 (0.0%) | 0 (0.0%) |
| 35 to 64 Years | 41 (77.4%) | 56 (53.8%) |
| 65 to 74 Years | 81 (60.9%) | 19 (34.5%) |
| 75 Years and over | 0 (0.0%) | 0 (0.0%) |
Disability Class by Sex by Age in Raysal
Disability Class: Hearing Difficulty
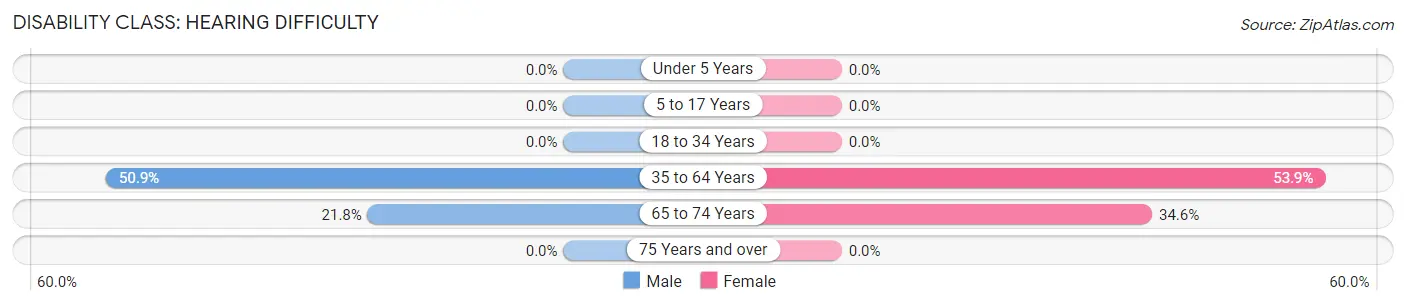
| Age Bracket | Male | Female |
| Under 5 Years | 0 (0.0%) | 0 (0.0%) |
| 5 to 17 Years | 0 (0.0%) | 0 (0.0%) |
| 18 to 34 Years | 0 (0.0%) | 0 (0.0%) |
| 35 to 64 Years | 27 (50.9%) | 56 (53.8%) |
| 65 to 74 Years | 29 (21.8%) | 19 (34.5%) |
| 75 Years and over | 0 (0.0%) | 0 (0.0%) |
Disability Class: Vision Difficulty
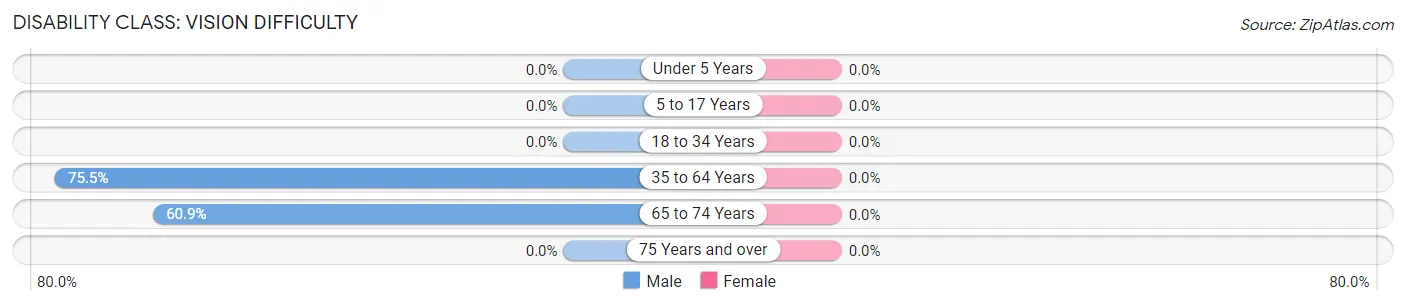
| Age Bracket | Male | Female |
| Under 5 Years | 0 (0.0%) | 0 (0.0%) |
| 5 to 17 Years | 0 (0.0%) | 0 (0.0%) |
| 18 to 34 Years | 0 (0.0%) | 0 (0.0%) |
| 35 to 64 Years | 40 (75.5%) | 0 (0.0%) |
| 65 to 74 Years | 81 (60.9%) | 0 (0.0%) |
| 75 Years and over | 0 (0.0%) | 0 (0.0%) |
Disability Class: Cognitive Difficulty
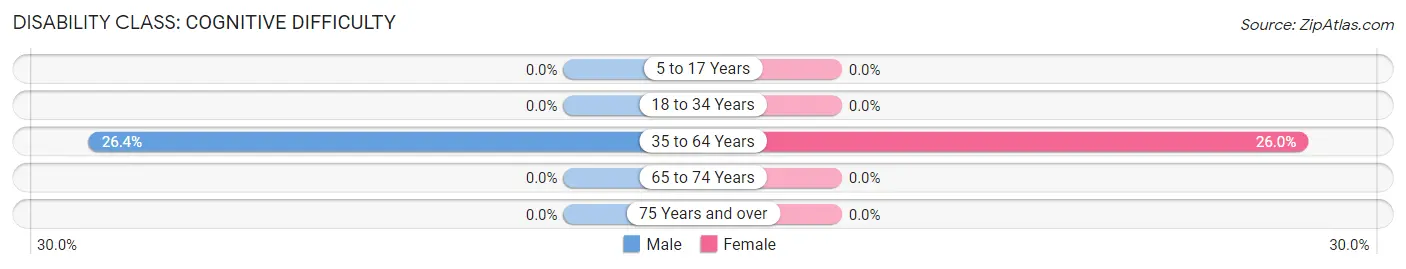
| Age Bracket | Male | Female |
| 5 to 17 Years | 0 (0.0%) | 0 (0.0%) |
| 18 to 34 Years | 0 (0.0%) | 0 (0.0%) |
| 35 to 64 Years | 14 (26.4%) | 27 (26.0%) |
| 65 to 74 Years | 0 (0.0%) | 0 (0.0%) |
| 75 Years and over | 0 (0.0%) | 0 (0.0%) |
Disability Class: Ambulatory Difficulty
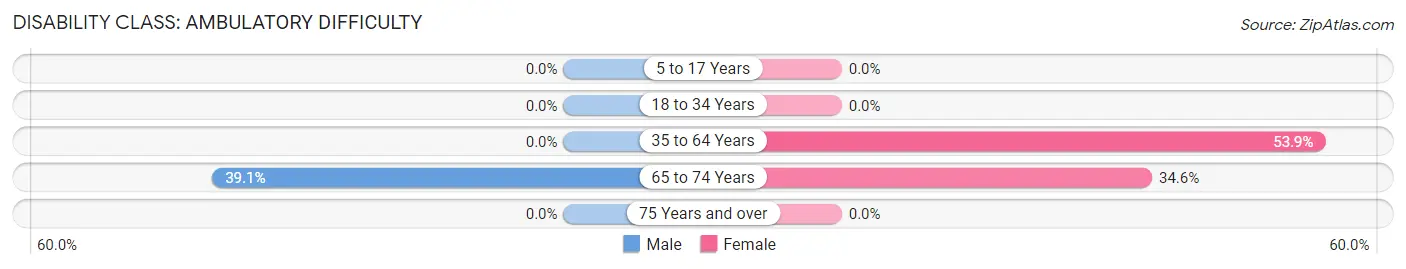
| Age Bracket | Male | Female |
| 5 to 17 Years | 0 (0.0%) | 0 (0.0%) |
| 18 to 34 Years | 0 (0.0%) | 0 (0.0%) |
| 35 to 64 Years | 0 (0.0%) | 56 (53.8%) |
| 65 to 74 Years | 52 (39.1%) | 19 (34.5%) |
| 75 Years and over | 0 (0.0%) | 0 (0.0%) |
Disability Class: Self-Care Difficulty
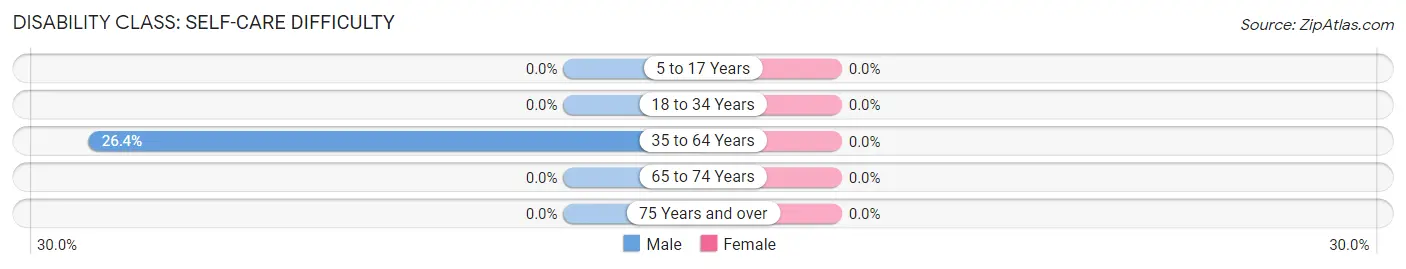
| Age Bracket | Male | Female |
| 5 to 17 Years | 0 (0.0%) | 0 (0.0%) |
| 18 to 34 Years | 0 (0.0%) | 0 (0.0%) |
| 35 to 64 Years | 14 (26.4%) | 0 (0.0%) |
| 65 to 74 Years | 0 (0.0%) | 0 (0.0%) |
| 75 Years and over | 0 (0.0%) | 0 (0.0%) |
Technology Access in Raysal
Computing Device Access in Raysal
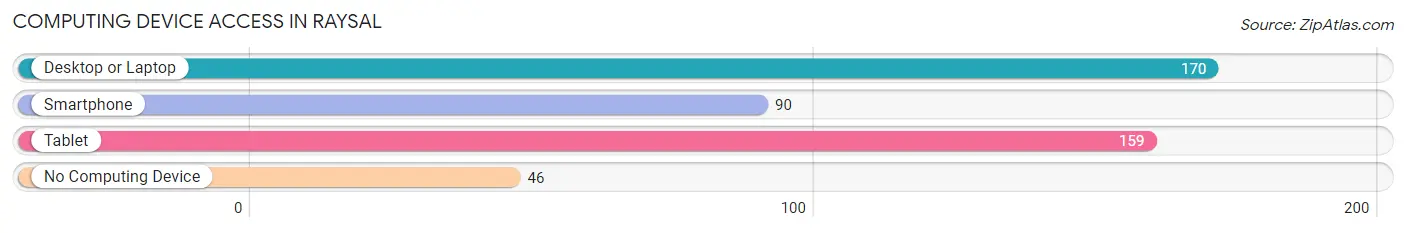
| Device Type | # Households | % Households |
| Desktop or Laptop | 170 | 73.9% |
| Smartphone | 90 | 39.1% |
| Tablet | 159 | 69.1% |
| No Computing Device | 46 | 20.0% |
| Total | 230 | 100.0% |
Internet Access in Raysal
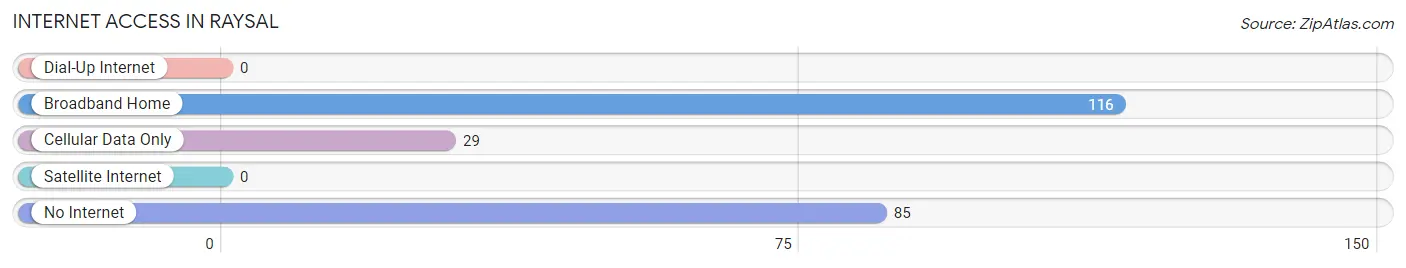
| Internet Type | # Households | % Households |
| Dial-Up Internet | 0 | 0.0% |
| Broadband Home | 116 | 50.4% |
| Cellular Data Only | 29 | 12.6% |
| Satellite Internet | 0 | 0.0% |
| No Internet | 85 | 37.0% |
| Total | 230 | 100.0% |
Raysal Summary
Raysal is a small unincorporated community located in McDowell County, West Virginia. It is situated in the Appalachian Mountains, and is part of the Appalachian Regional Commission. The population of Raysal was estimated to be around 500 in 2000.
History
Raysal was founded in the late 19th century by coal miners who were looking for work in the area. The town was named after a local coal mine, and the name is derived from the Welsh word for coal. The town was originally a small mining camp, but it grew in size and population over the years. The town was incorporated in 1912, and it was the first town in McDowell County to be incorporated.
The town was home to a number of coal mines, and the coal industry was the main source of employment for the town's residents. The coal industry declined in the mid-20th century, and the town's population began to decline as well. The town was also affected by the decline of the railroad industry, as the town was located on the Norfolk and Western Railway line.
Geography
Raysal is located in the Appalachian Mountains, and is part of the Appalachian Regional Commission. The town is situated in the Tug Fork Valley, and is surrounded by mountains on all sides. The town is located near the border of Virginia and Kentucky, and is about 30 miles from the city of Welch.
The town is located at an elevation of 1,890 feet, and the climate is classified as humid continental. The average temperature in the summer is around 75 degrees Fahrenheit, and the average temperature in the winter is around 40 degrees Fahrenheit. The town receives an average of 40 inches of precipitation per year.
Economy
The economy of Raysal is largely based on the coal industry, which has been in decline since the mid-20th century. The town is also home to a number of small businesses, including a grocery store, a hardware store, and a few restaurants. The town is also home to a number of churches, and there is a post office located in the town.
Demographics
The population of Raysal was estimated to be around 500 in 2000. The town is predominantly white, with a small African American population. The median household income in the town is around $25,000, and the median home value is around $50,000. The town has a high poverty rate, with around 30% of the population living below the poverty line.
Common Questions
What is Per Capita Income in Raysal?
Per Capita income in Raysal is $15,123.
What is the Median Family Income in Raysal?
Median Family Income in Raysal is $31,000.
What is the Median Household income in Raysal?
Median Household Income in Raysal is $31,154.
What is Inequality or Gini Index in Raysal?
Inequality or Gini Index in Raysal is 0.41.
What is the Total Population of Raysal?
Total Population of Raysal is 644.
What is the Total Male Population of Raysal?
Total Male Population of Raysal is 277.
What is the Total Female Population of Raysal?
Total Female Population of Raysal is 367.
What is the Ratio of Males per 100 Females in Raysal?
There are 75.48 Males per 100 Females in Raysal.
What is the Ratio of Females per 100 Males in Raysal?
There are 132.49 Females per 100 Males in Raysal.
What is the Median Population Age in Raysal?
Median Population Age in Raysal is 47.7 Years.
What is the Average Family Size in Raysal
Average Family Size in Raysal is 2.9 People.
What is the Average Household Size in Raysal
Average Household Size in Raysal is 2.8 People.
How Large is the Labor Force in Raysal?
There are 154 People in the Labor Forcein in Raysal.
What is the Percentage of People in the Labor Force in Raysal?
28.9% of People are in the Labor Force in Raysal.
What is the Unemployment Rate in Raysal?
Unemployment Rate in Raysal is 74.7%.