Baker, MT Map & Demographics
Baker Map
Baker Overview
$41,742
PER CAPITA INCOME
$114,688
AVG FAMILY INCOME
$96,667
AVG HOUSEHOLD INCOME
51.8%
WAGE / INCOME GAP [ % ]
48.2¢/ $1
WAGE / INCOME GAP [ $ ]
0.43
INEQUALITY / GINI INDEX
1,500
TOTAL POPULATION
720
MALE POPULATION
780
FEMALE POPULATION
92.31
MALES / 100 FEMALES
108.33
FEMALES / 100 MALES
35.6
MEDIAN AGE
3.1
AVG FAMILY SIZE
2.4
AVG HOUSEHOLD SIZE
708
LABOR FORCE [ PEOPLE ]
59.3%
PERCENT IN LABOR FORCE
Baker Zip Codes
Baker Area Codes
Income in Baker
Income Overview in Baker
Per Capita Income in Baker is $41,742, while median incomes of families and households are $114,688 and $96,667 respectively.
| Characteristic | Number | Measure |
| Per Capita Income | 1,500 | $41,742 |
| Median Family Income | 369 | $114,688 |
| Mean Family Income | 369 | $129,901 |
| Median Household Income | 600 | $96,667 |
| Mean Household Income | 600 | $94,094 |
| Income Deficit | 369 | $0 |
| Wage / Income Gap (%) | 1,500 | 51.75% |
| Wage / Income Gap ($) | 1,500 | 48.25¢ per $1 |
| Gini / Inequality Index | 1,500 | 0.43 |
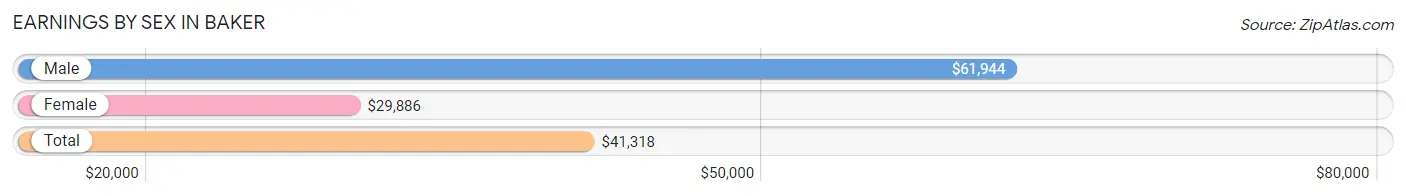
Earnings by Sex in Baker
Average Earnings in Baker are $41,318, $61,944 for men and $29,886 for women, a difference of 51.7%.
| Sex | Number | Average Earnings |
| Male | 396 (48.7%) | $61,944 |
| Female | 417 (51.3%) | $29,886 |
| Total | 813 (100.0%) | $41,318 |
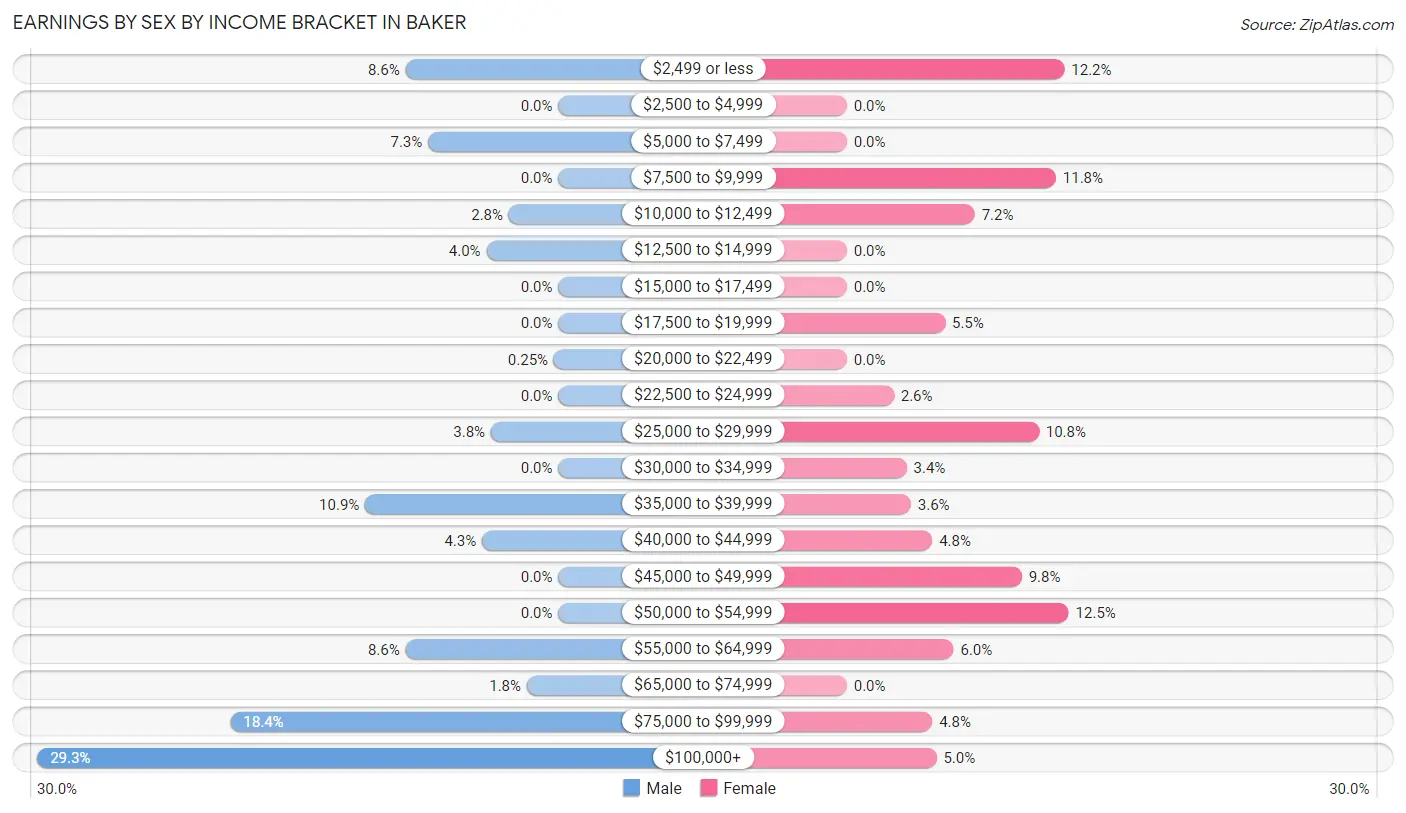
Earnings by Sex by Income Bracket in Baker
The most common earnings brackets in Baker are $100,000+ for men (116 | 29.3%) and $50,000 to $54,999 for women (52 | 12.5%).
| Income | Male | Female |
| $2,499 or less | 34 (8.6%) | 51 (12.2%) |
| $2,500 to $4,999 | 0 (0.0%) | 0 (0.0%) |
| $5,000 to $7,499 | 29 (7.3%) | 0 (0.0%) |
| $7,500 to $9,999 | 0 (0.0%) | 49 (11.7%) |
| $10,000 to $12,499 | 11 (2.8%) | 30 (7.2%) |
| $12,500 to $14,999 | 16 (4.0%) | 0 (0.0%) |
| $15,000 to $17,499 | 0 (0.0%) | 0 (0.0%) |
| $17,500 to $19,999 | 0 (0.0%) | 23 (5.5%) |
| $20,000 to $22,499 | 1 (0.3%) | 0 (0.0%) |
| $22,500 to $24,999 | 0 (0.0%) | 11 (2.6%) |
| $25,000 to $29,999 | 15 (3.8%) | 45 (10.8%) |
| $30,000 to $34,999 | 0 (0.0%) | 14 (3.4%) |
| $35,000 to $39,999 | 43 (10.9%) | 15 (3.6%) |
| $40,000 to $44,999 | 17 (4.3%) | 20 (4.8%) |
| $45,000 to $49,999 | 0 (0.0%) | 41 (9.8%) |
| $50,000 to $54,999 | 0 (0.0%) | 52 (12.5%) |
| $55,000 to $64,999 | 34 (8.6%) | 25 (6.0%) |
| $65,000 to $74,999 | 7 (1.8%) | 0 (0.0%) |
| $75,000 to $99,999 | 73 (18.4%) | 20 (4.8%) |
| $100,000+ | 116 (29.3%) | 21 (5.0%) |
| Total | 396 (100.0%) | 417 (100.0%) |
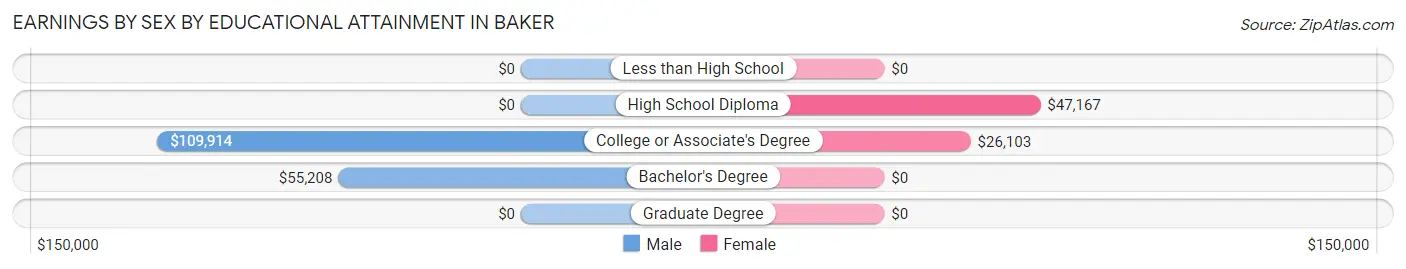
Earnings by Sex by Educational Attainment in Baker
Average earnings in Baker are $86,406 for men and $37,667 for women, a difference of 56.4%. Men with an educational attainment of college or associate's degree enjoy the highest average annual earnings of $109,914, while those with bachelor's degree education earn the least with $55,208. Women with an educational attainment of high school diploma earn the most with the average annual earnings of $47,167, while those with college or associate's degree education have the smallest earnings of $26,103.
| Educational Attainment | Male Income | Female Income |
| Less than High School | - | - |
| High School Diploma | - | - |
| College or Associate's Degree | $109,914 | $26,103 |
| Bachelor's Degree | $55,208 | $0 |
| Graduate Degree | - | - |
| Total | $86,406 | $37,667 |
Family Income in Baker
Family Income Brackets in Baker
According to the Baker family income data, there are 151 families falling into the $100,000 to $149,999 income range, which is the most common income bracket and makes up 40.9% of all families.

| Income Bracket | # Families | % Families |
| Less than $10,000 | 3 | 0.8% |
| $10,000 to $14,999 | 20 | 5.4% |
| $15,000 to $24,999 | 9 | 2.4% |
| $25,000 to $34,999 | 0 | 0.0% |
| $35,000 to $49,999 | 8 | 2.2% |
| $50,000 to $74,999 | 30 | 8.1% |
| $75,000 to $99,999 | 38 | 10.3% |
| $100,000 to $149,999 | 151 | 40.9% |
| $150,000 to $199,999 | 50 | 13.6% |
| $200,000+ | 60 | 16.3% |
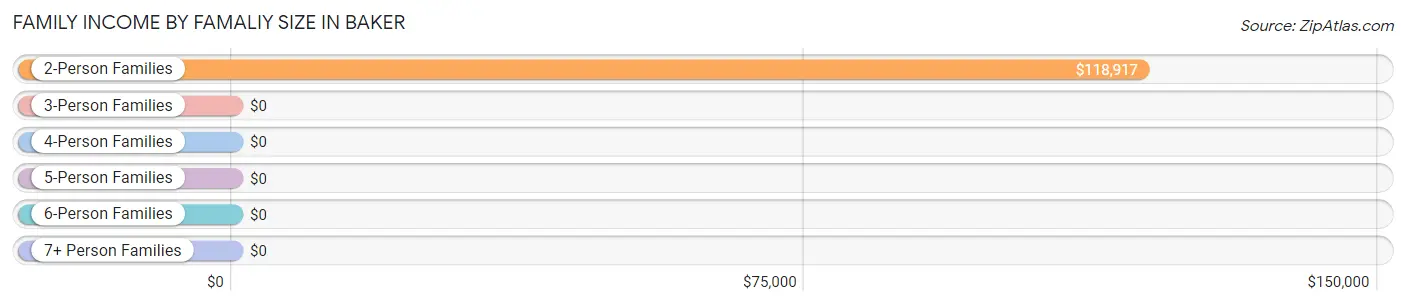
Family Income by Famaliy Size in Baker
2-person families (231 | 62.6%) account for the highest median family income in Baker with $118,917 per family, while 2-person families (231 | 62.6%) have the highest median income of $59,458 per family member.
| Income Bracket | # Families | Median Income |
| 2-Person Families | 231 (62.6%) | $118,917 |
| 3-Person Families | 50 (13.6%) | $0 |
| 4-Person Families | 44 (11.9%) | $0 |
| 5-Person Families | 29 (7.9%) | $0 |
| 6-Person Families | 0 (0.0%) | $0 |
| 7+ Person Families | 15 (4.1%) | $0 |
| Total | 369 (100.0%) | $114,688 |
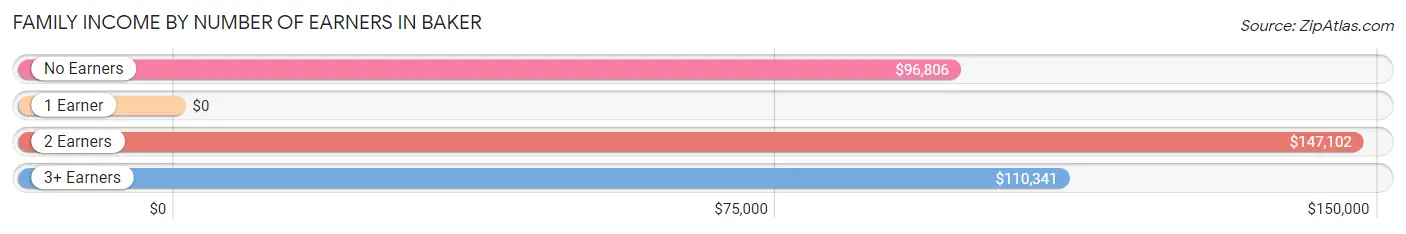
Family Income by Number of Earners in Baker
| Number of Earners | # Families | Median Income |
| No Earners | 65 (17.6%) | $96,806 |
| 1 Earner | 104 (28.2%) | $0 |
| 2 Earners | 167 (45.3%) | $147,102 |
| 3+ Earners | 33 (8.9%) | $110,341 |
| Total | 369 (100.0%) | $114,688 |
Household Income in Baker
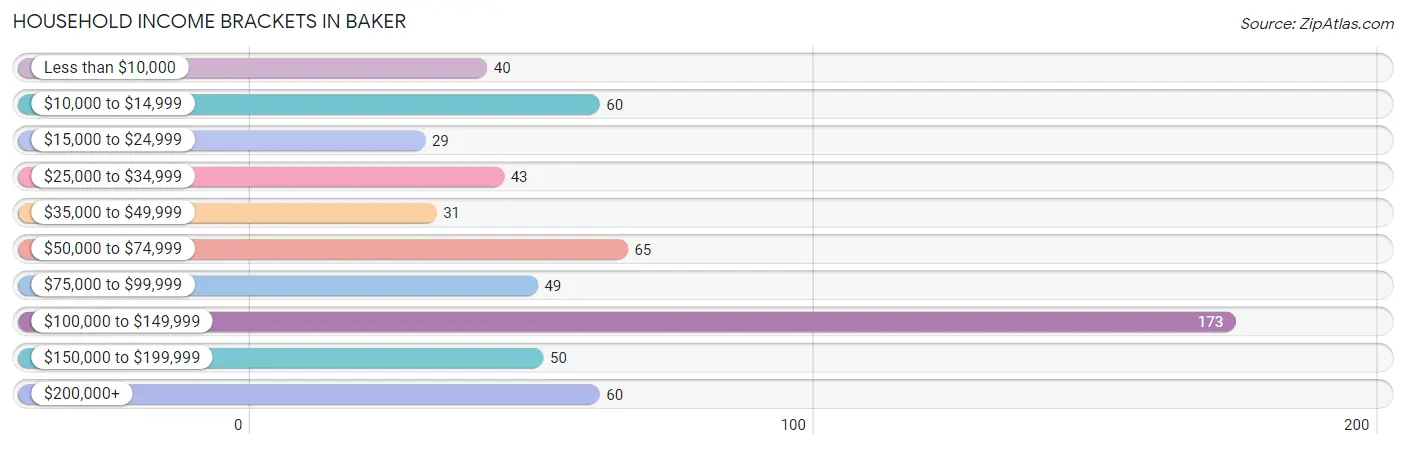
Household Income Brackets in Baker
With 173 households falling in the category, the $100,000 to $149,999 income range is the most frequent in Baker, accounting for 28.8% of all households. In contrast, only 29 households (4.8%) fall into the $15,000 to $24,999 income bracket, making it the least populous group.
| Income Bracket | # Households | % Households |
| Less than $10,000 | 40 | 6.7% |
| $10,000 to $14,999 | 60 | 10.0% |
| $15,000 to $24,999 | 29 | 4.8% |
| $25,000 to $34,999 | 43 | 7.2% |
| $35,000 to $49,999 | 31 | 5.2% |
| $50,000 to $74,999 | 65 | 10.8% |
| $75,000 to $99,999 | 49 | 8.2% |
| $100,000 to $149,999 | 173 | 28.8% |
| $150,000 to $199,999 | 50 | 8.3% |
| $200,000+ | 60 | 10.0% |
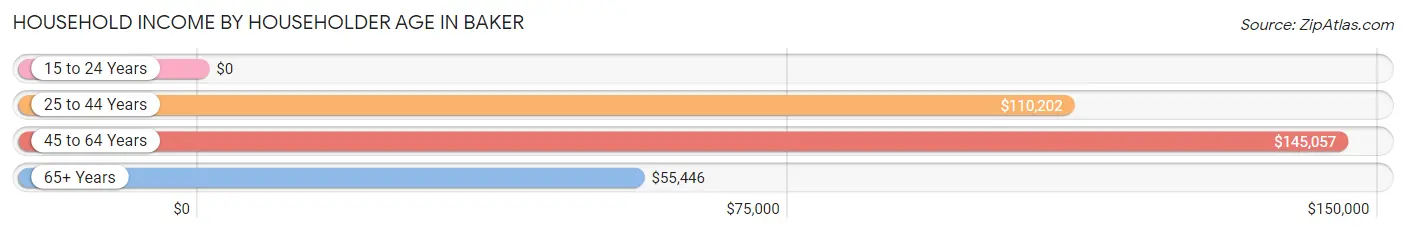
Household Income by Householder Age in Baker
The median household income in Baker is $96,667, with the highest median household income of $145,057 found in the 45 to 64 years age bracket for the primary householder. A total of 183 households (30.5%) fall into this category. Meanwhile, the 15 to 24 years age bracket for the primary householder has the lowest median household income of $0, with 23 households (3.8%) in this group.
| Income Bracket | # Households | Median Income |
| 15 to 24 Years | 23 (3.8%) | $0 |
| 25 to 44 Years | 237 (39.5%) | $110,202 |
| 45 to 64 Years | 183 (30.5%) | $145,057 |
| 65+ Years | 157 (26.2%) | $55,446 |
| Total | 600 (100.0%) | $96,667 |
Poverty in Baker
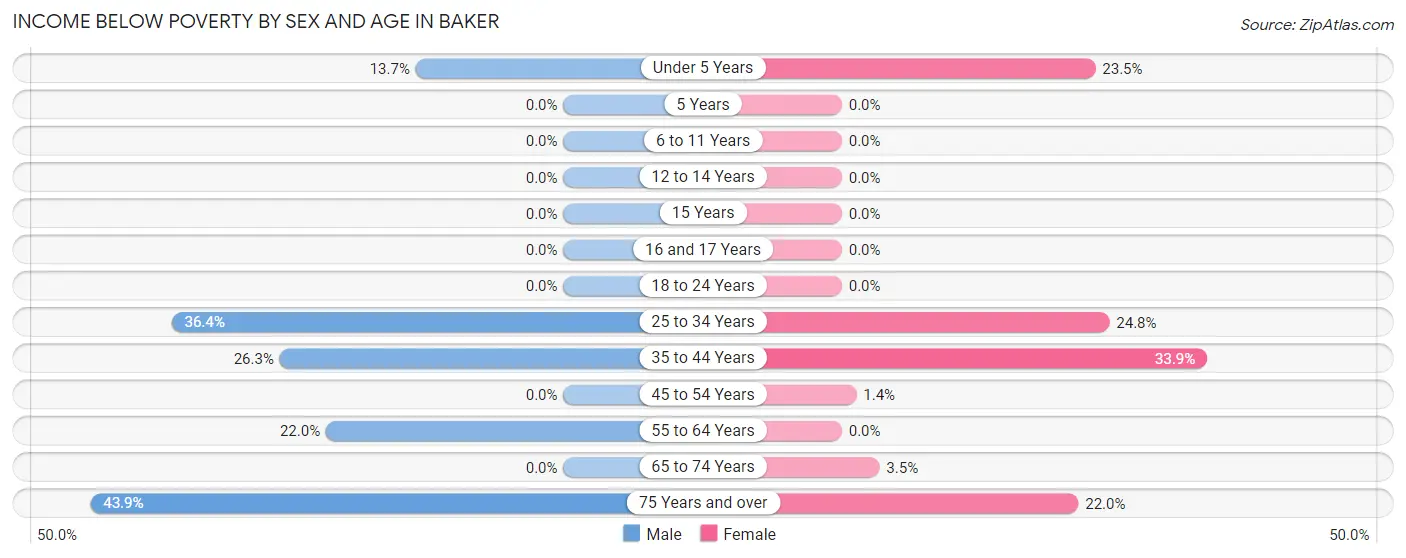
Income Below Poverty by Sex and Age in Baker
With 15.5% poverty level for males and 12.5% for females among the residents of Baker, 75 year old and over males and 35 to 44 year old females are the most vulnerable to poverty, with 18 males (43.9%) and 20 females (33.9%) in their respective age groups living below the poverty level.
| Age Bracket | Male | Female |
| Under 5 Years | 10 (13.7%) | 20 (23.5%) |
| 5 Years | 0 (0.0%) | 0 (0.0%) |
| 6 to 11 Years | 0 (0.0%) | 0 (0.0%) |
| 12 to 14 Years | 0 (0.0%) | 0 (0.0%) |
| 15 Years | 0 (0.0%) | 0 (0.0%) |
| 16 and 17 Years | 0 (0.0%) | 0 (0.0%) |
| 18 to 24 Years | 0 (0.0%) | 0 (0.0%) |
| 25 to 34 Years | 40 (36.4%) | 37 (24.8%) |
| 35 to 44 Years | 15 (26.3%) | 20 (33.9%) |
| 45 to 54 Years | 0 (0.0%) | 1 (1.3%) |
| 55 to 64 Years | 26 (22.0%) | 0 (0.0%) |
| 65 to 74 Years | 0 (0.0%) | 3 (3.5%) |
| 75 Years and over | 18 (43.9%) | 9 (22.0%) |
| Total | 109 (15.5%) | 90 (12.5%) |
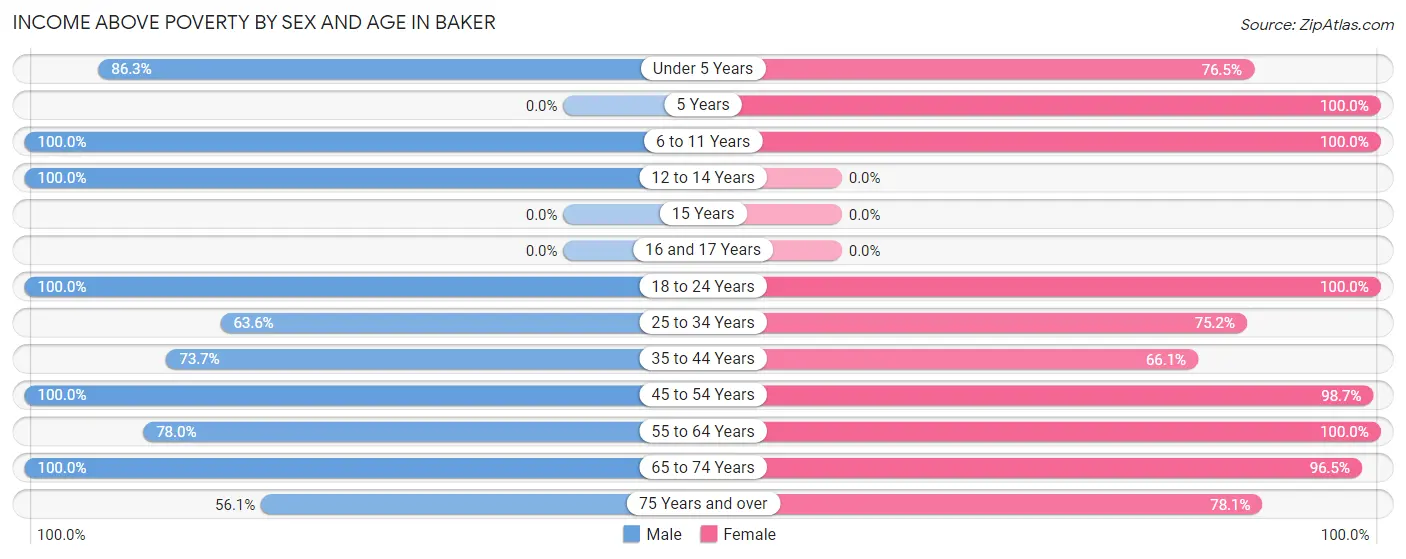
Income Above Poverty by Sex and Age in Baker
According to the poverty statistics in Baker, males aged 6 to 11 years and females aged 5 years are the age groups that are most secure financially, with 100.0% of males and 100.0% of females in these age groups living above the poverty line.
| Age Bracket | Male | Female |
| Under 5 Years | 63 (86.3%) | 65 (76.5%) |
| 5 Years | 0 (0.0%) | 16 (100.0%) |
| 6 to 11 Years | 83 (100.0%) | 30 (100.0%) |
| 12 to 14 Years | 16 (100.0%) | 0 (0.0%) |
| 15 Years | 0 (0.0%) | 0 (0.0%) |
| 16 and 17 Years | 0 (0.0%) | 0 (0.0%) |
| 18 to 24 Years | 69 (100.0%) | 91 (100.0%) |
| 25 to 34 Years | 70 (63.6%) | 112 (75.2%) |
| 35 to 44 Years | 42 (73.7%) | 39 (66.1%) |
| 45 to 54 Years | 58 (100.0%) | 73 (98.7%) |
| 55 to 64 Years | 92 (78.0%) | 87 (100.0%) |
| 65 to 74 Years | 79 (100.0%) | 83 (96.5%) |
| 75 Years and over | 23 (56.1%) | 32 (78.0%) |
| Total | 595 (84.5%) | 628 (87.5%) |
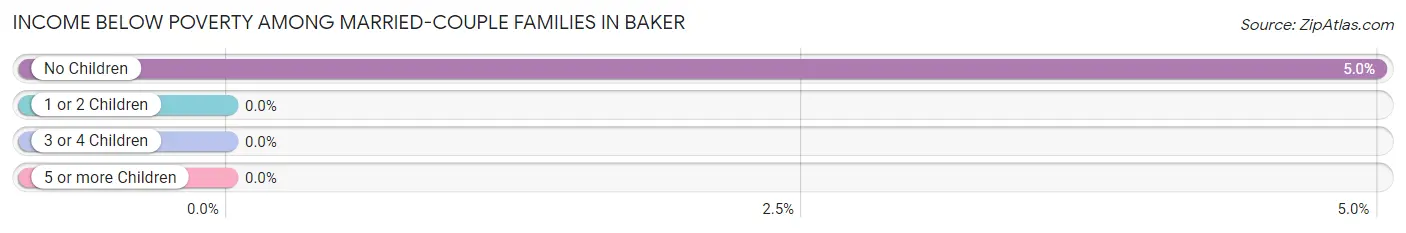
Income Below Poverty Among Married-Couple Families in Baker
The poverty statistics for married-couple families in Baker show that 3.8% or 12 of the total 313 families live below the poverty line. Families with no children have the highest poverty rate of 5.0%, comprising of 12 families. On the other hand, families with 1 or 2 children have the lowest poverty rate of 0.0%, which includes 0 families.
| Children | Above Poverty | Below Poverty |
| No Children | 228 (95.0%) | 12 (5.0%) |
| 1 or 2 Children | 44 (100.0%) | 0 (0.0%) |
| 3 or 4 Children | 29 (100.0%) | 0 (0.0%) |
| 5 or more Children | 0 (0.0%) | 0 (0.0%) |
| Total | 301 (96.2%) | 12 (3.8%) |
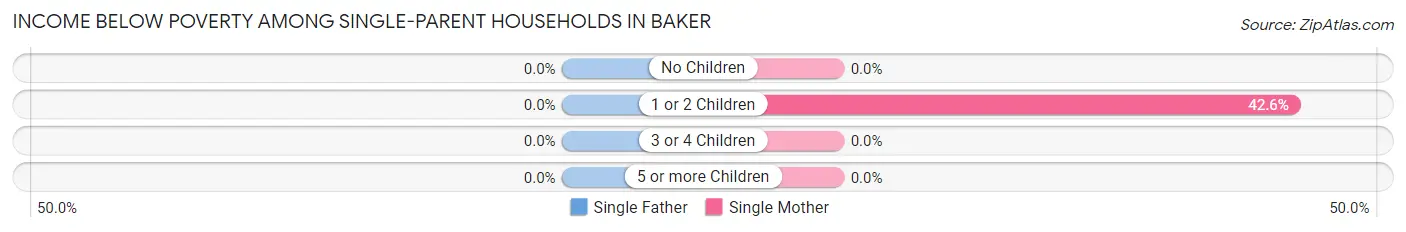
Income Below Poverty Among Single-Parent Households in Baker
| Children | Single Father | Single Mother |
| No Children | 0 (0.0%) | 0 (0.0%) |
| 1 or 2 Children | 0 (0.0%) | 20 (42.5%) |
| 3 or 4 Children | 0 (0.0%) | 0 (0.0%) |
| 5 or more Children | 0 (0.0%) | 0 (0.0%) |
| Total | 0 (0.0%) | 20 (35.7%) |
Income Below Poverty Among Married-Couple vs Single-Parent Households in Baker
The poverty data for Baker shows that 12 of the married-couple family households (3.8%) and 20 of the single-parent households (35.7%) are living below the poverty level. Within the married-couple family households, those with no children have the highest poverty rate, with 12 households (5.0%) falling below the poverty line. Among the single-parent households, those with 1 or 2 children have the highest poverty rate, with 20 household (42.5%) living below poverty.
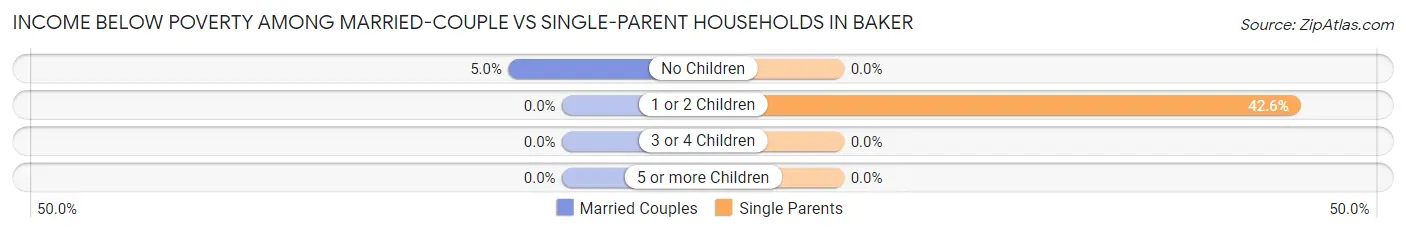
| Children | Married-Couple Families | Single-Parent Households |
| No Children | 12 (5.0%) | 0 (0.0%) |
| 1 or 2 Children | 0 (0.0%) | 20 (42.5%) |
| 3 or 4 Children | 0 (0.0%) | 0 (0.0%) |
| 5 or more Children | 0 (0.0%) | 0 (0.0%) |
| Total | 12 (3.8%) | 20 (35.7%) |
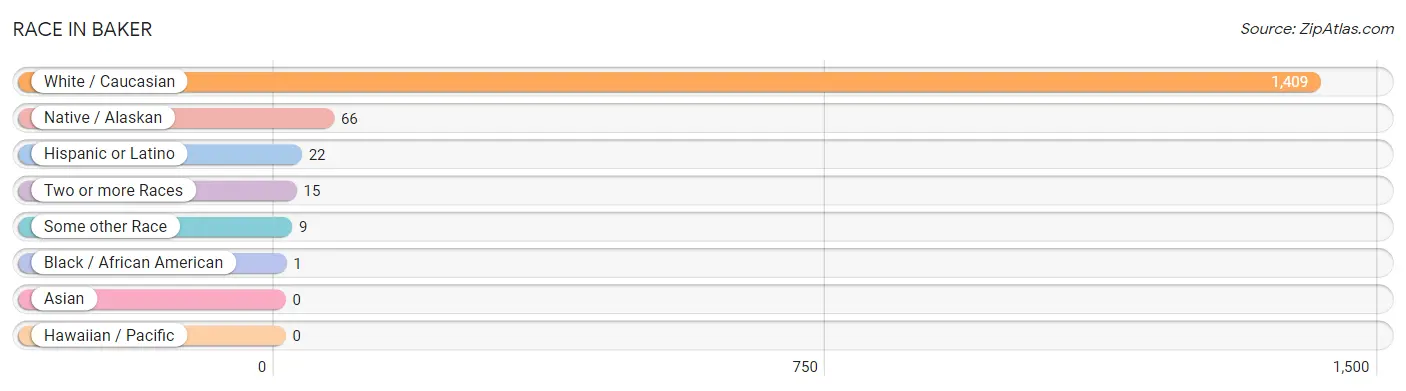
Race in Baker
The most populous races in Baker are White / Caucasian (1,409 | 93.9%), Native / Alaskan (66 | 4.4%), and Hispanic or Latino (22 | 1.5%).
| Race | # Population | % Population |
| Asian | 0 | 0.0% |
| Black / African American | 1 | 0.1% |
| Hawaiian / Pacific | 0 | 0.0% |
| Hispanic or Latino | 22 | 1.5% |
| Native / Alaskan | 66 | 4.4% |
| White / Caucasian | 1,409 | 93.9% |
| Two or more Races | 15 | 1.0% |
| Some other Race | 9 | 0.6% |
| Total | 1,500 | 100.0% |
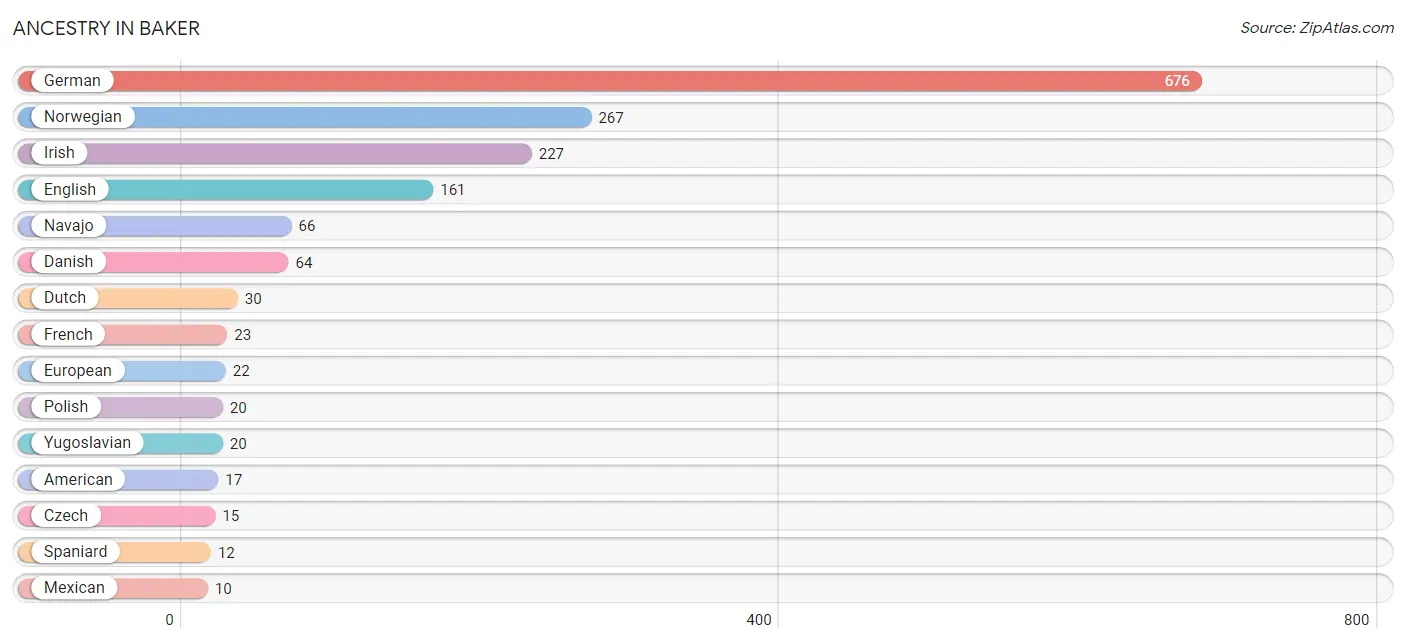
Ancestry in Baker
The most populous ancestries reported in Baker are German (676 | 45.1%), Norwegian (267 | 17.8%), Irish (227 | 15.1%), English (161 | 10.7%), and Navajo (66 | 4.4%), together accounting for 93.1% of all Baker residents.
| Ancestry | # Population | % Population |
| Afghan | 1 | 0.1% |
| American | 17 | 1.1% |
| Czech | 15 | 1.0% |
| Danish | 64 | 4.3% |
| Dutch | 30 | 2.0% |
| English | 161 | 10.7% |
| European | 22 | 1.5% |
| French | 23 | 1.5% |
| French Canadian | 1 | 0.1% |
| German | 676 | 45.1% |
| Irish | 227 | 15.1% |
| Italian | 1 | 0.1% |
| Mexican | 10 | 0.7% |
| Navajo | 66 | 4.4% |
| Norwegian | 267 | 17.8% |
| Polish | 20 | 1.3% |
| Russian | 10 | 0.7% |
| Scandinavian | 9 | 0.6% |
| Scotch-Irish | 4 | 0.3% |
| Spaniard | 12 | 0.8% |
| Ukrainian | 1 | 0.1% |
| Welsh | 3 | 0.2% |
| Yugoslavian | 20 | 1.3% | View All 23 Rows |
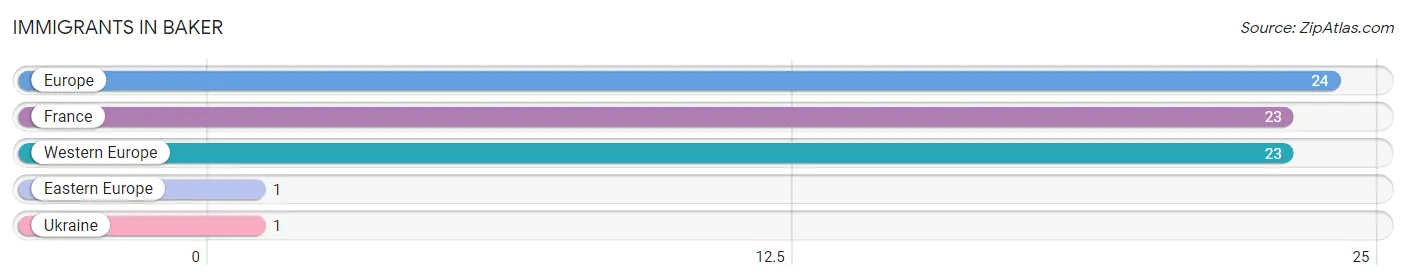
Immigrants in Baker
The most numerous immigrant groups reported in Baker came from Europe (24 | 1.6%), France (23 | 1.5%), Western Europe (23 | 1.5%), Eastern Europe (1 | 0.1%), and Ukraine (1 | 0.1%), together accounting for 4.8% of all Baker residents.
| Immigration Origin | # Population | % Population |
| Eastern Europe | 1 | 0.1% |
| Europe | 24 | 1.6% |
| France | 23 | 1.5% |
| Ukraine | 1 | 0.1% |
| Western Europe | 23 | 1.5% | View All 5 Rows |
Sex and Age in Baker
Sex and Age in Baker
The most populous age groups in Baker are 30 to 34 Years (112 | 15.6%) for men and 25 to 29 Years (95 | 12.2%) for women.
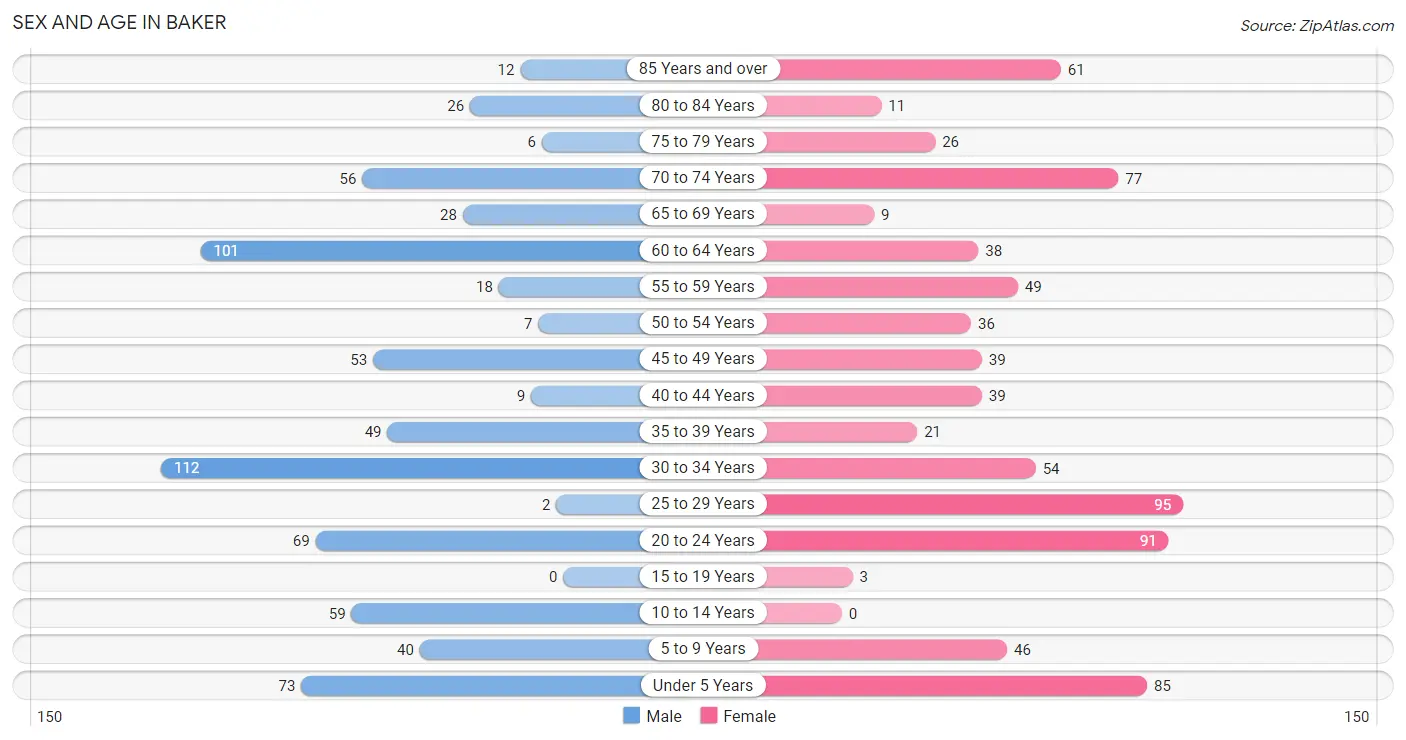
| Age Bracket | Male | Female |
| Under 5 Years | 73 (10.1%) | 85 (10.9%) |
| 5 to 9 Years | 40 (5.6%) | 46 (5.9%) |
| 10 to 14 Years | 59 (8.2%) | 0 (0.0%) |
| 15 to 19 Years | 0 (0.0%) | 3 (0.4%) |
| 20 to 24 Years | 69 (9.6%) | 91 (11.7%) |
| 25 to 29 Years | 2 (0.3%) | 95 (12.2%) |
| 30 to 34 Years | 112 (15.6%) | 54 (6.9%) |
| 35 to 39 Years | 49 (6.8%) | 21 (2.7%) |
| 40 to 44 Years | 9 (1.3%) | 39 (5.0%) |
| 45 to 49 Years | 53 (7.4%) | 39 (5.0%) |
| 50 to 54 Years | 7 (1.0%) | 36 (4.6%) |
| 55 to 59 Years | 18 (2.5%) | 49 (6.3%) |
| 60 to 64 Years | 101 (14.0%) | 38 (4.9%) |
| 65 to 69 Years | 28 (3.9%) | 9 (1.1%) |
| 70 to 74 Years | 56 (7.8%) | 77 (9.9%) |
| 75 to 79 Years | 6 (0.8%) | 26 (3.3%) |
| 80 to 84 Years | 26 (3.6%) | 11 (1.4%) |
| 85 Years and over | 12 (1.7%) | 61 (7.8%) |
| Total | 720 (100.0%) | 780 (100.0%) |
Families and Households in Baker
Median Family Size in Baker
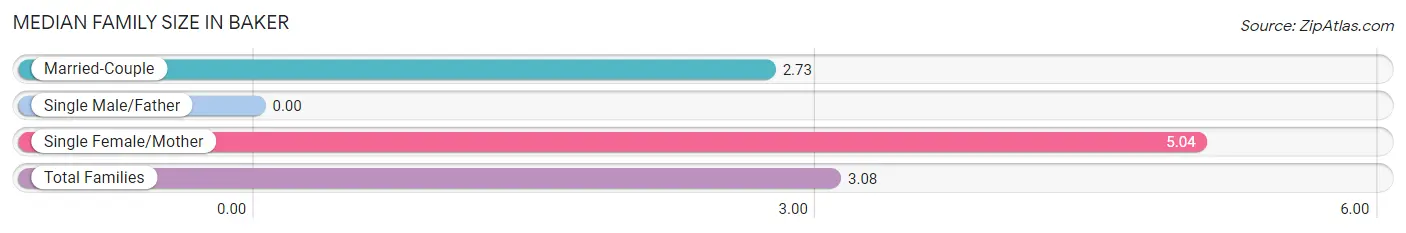
| Family Type | # Families | Family Size |
| Married-Couple | 313 (84.8%) | 2.73 |
| Single Male/Father | 0 (0.0%) | - |
| Single Female/Mother | 56 (15.2%) | 5.04 |
| Total Families | 369 (100.0%) | 3.08 |
Median Household Size in Baker
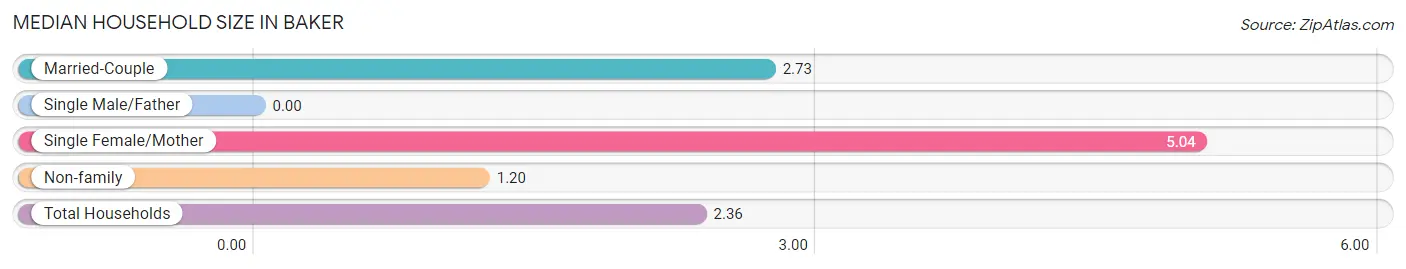
| Household Type | # Households | Household Size |
| Married-Couple | 313 (52.2%) | 2.73 |
| Single Male/Father | 0 (0.0%) | - |
| Single Female/Mother | 56 (9.3%) | 5.04 |
| Non-family | 231 (38.5%) | 1.20 |
| Total Households | 600 (100.0%) | 2.36 |
Household Size by Marriage Status in Baker
Out of a total of 600 households in Baker, 369 (61.5%) are family households, while 231 (38.5%) are nonfamily households. The most numerous type of family households are 2-person households, comprising 231, and the most common type of nonfamily households are 1-person households, comprising 189.
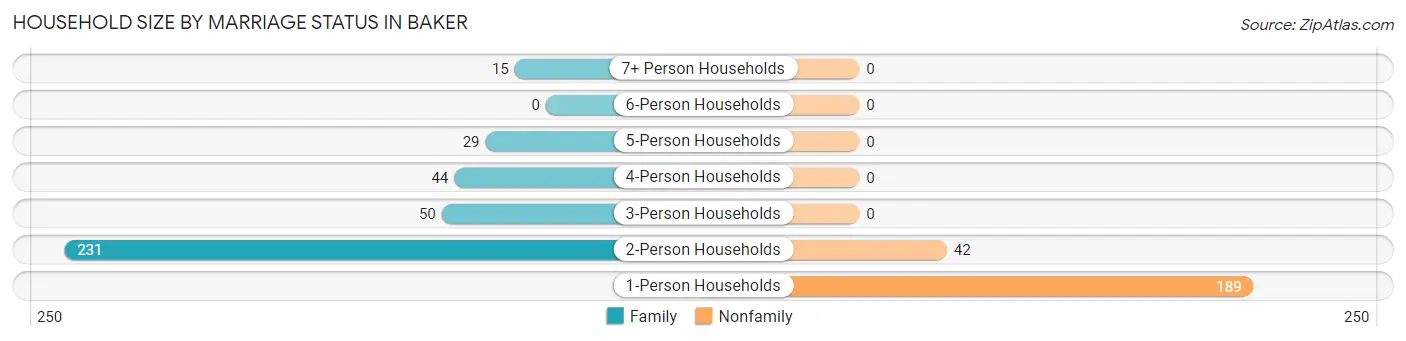
| Household Size | Family Households | Nonfamily Households |
| 1-Person Households | - | 189 (31.5%) |
| 2-Person Households | 231 (38.5%) | 42 (7.0%) |
| 3-Person Households | 50 (8.3%) | 0 (0.0%) |
| 4-Person Households | 44 (7.3%) | 0 (0.0%) |
| 5-Person Households | 29 (4.8%) | 0 (0.0%) |
| 6-Person Households | 0 (0.0%) | 0 (0.0%) |
| 7+ Person Households | 15 (2.5%) | 0 (0.0%) |
| Total | 369 (61.5%) | 231 (38.5%) |
Female Fertility in Baker
Fertility by Age in Baker
Average fertility rate in Baker is 57.0 births per 1,000 women. Women in the age bracket of 35 to 50 years have the highest fertility rate with 185.0 births per 1,000 women. Women in the age bracket of 35 to 50 years acount for 100.0% of all women with births.
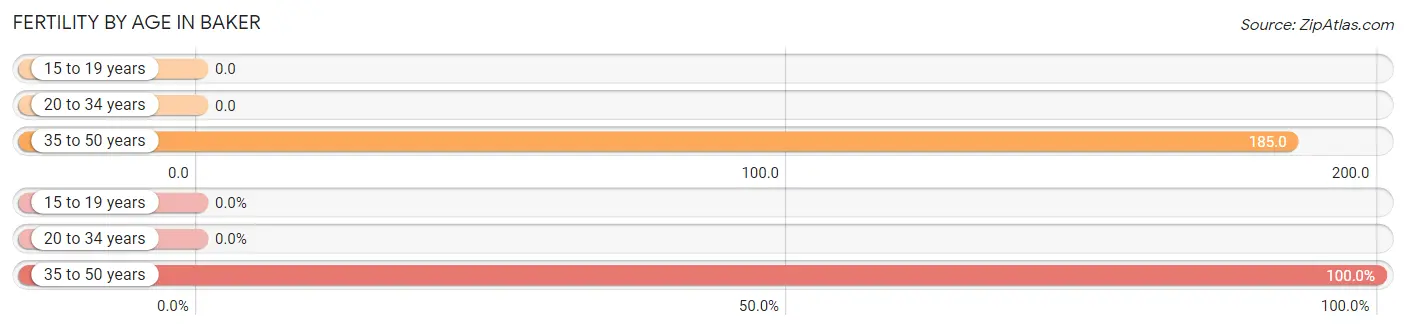
| Age Bracket | Women with Births | Births / 1,000 Women |
| 15 to 19 years | 0 (0.0%) | 0.0 |
| 20 to 34 years | 0 (0.0%) | 0.0 |
| 35 to 50 years | 20 (100.0%) | 185.0 |
| Total | 20 (100.0%) | 57.0 |
Fertility by Age by Marriage Status in Baker
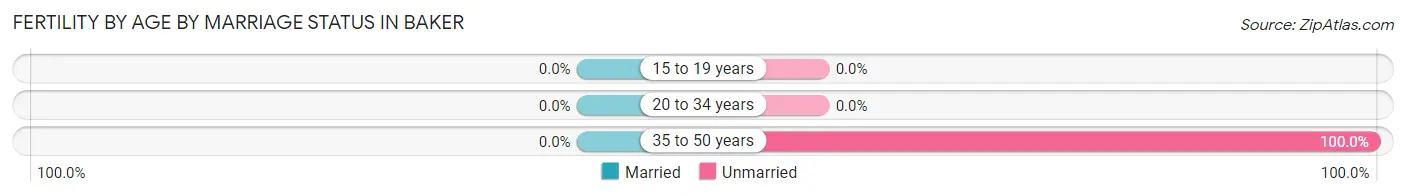
| Age Bracket | Married | Unmarried |
| 15 to 19 years | 0 (0.0%) | 0 (0.0%) |
| 20 to 34 years | 0 (0.0%) | 0 (0.0%) |
| 35 to 50 years | 0 (0.0%) | 20 (100.0%) |
| Total | 0 (0.0%) | 20 (100.0%) |
Fertility by Education in Baker
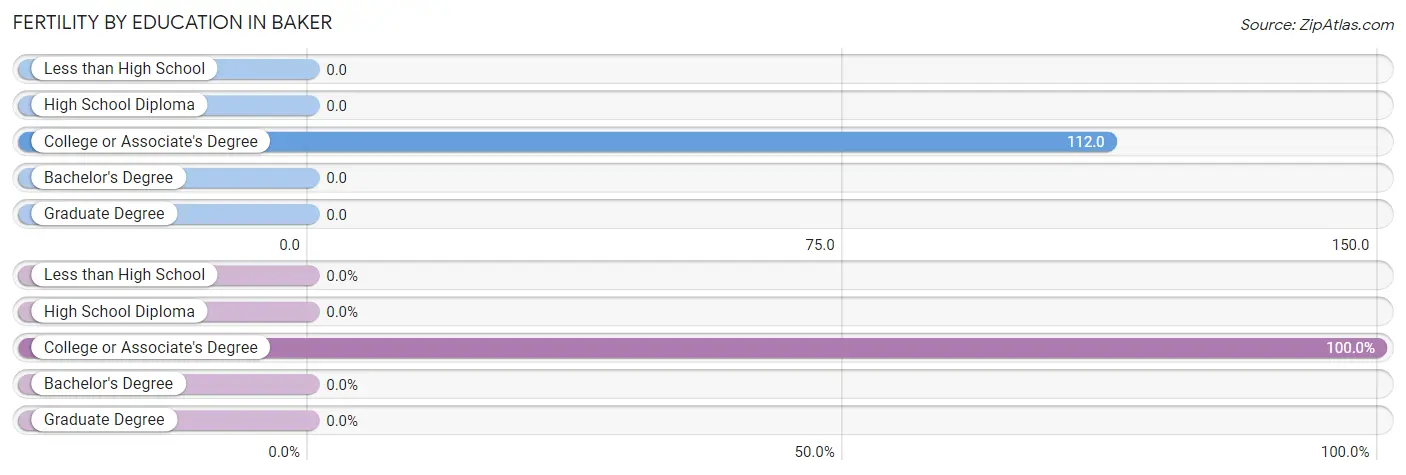
| Educational Attainment | Women with Births | Births / 1,000 Women |
| Less than High School | 0 (0.0%) | 0.0 |
| High School Diploma | 0 (0.0%) | 0.0 |
| College or Associate's Degree | 20 (100.0%) | 112.0 |
| Bachelor's Degree | 0 (0.0%) | 0.0 |
| Graduate Degree | 0 (0.0%) | 0.0 |
| Total | 20 (100.0%) | 57.0 |
Fertility by Education by Marriage Status in Baker
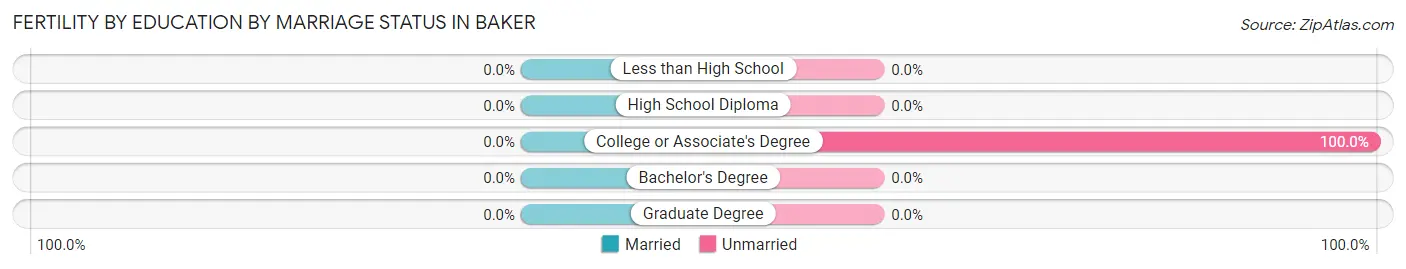
| Educational Attainment | Married | Unmarried |
| Less than High School | 0 (0.0%) | 0 (0.0%) |
| High School Diploma | 0 (0.0%) | 0 (0.0%) |
| College or Associate's Degree | 0 (0.0%) | 20 (100.0%) |
| Bachelor's Degree | 0 (0.0%) | 0 (0.0%) |
| Graduate Degree | 0 (0.0%) | 0 (0.0%) |
| Total | 0 (0.0%) | 20 (100.0%) |
Employment Characteristics in Baker
Employment by Class of Employer in Baker
Among the 708 employed individuals in Baker, private company employees (558 | 78.8%), local government employees (62 | 8.8%), and not-for-profit organizations (46 | 6.5%) make up the most common classes of employment.
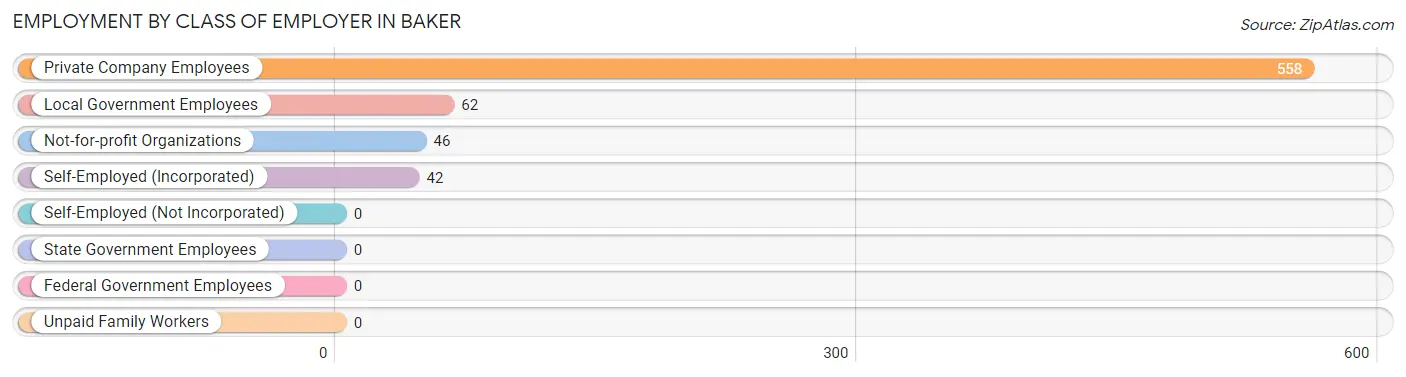
| Employer Class | # Employees | % Employees |
| Private Company Employees | 558 | 78.8% |
| Self-Employed (Incorporated) | 42 | 5.9% |
| Self-Employed (Not Incorporated) | 0 | 0.0% |
| Not-for-profit Organizations | 46 | 6.5% |
| Local Government Employees | 62 | 8.8% |
| State Government Employees | 0 | 0.0% |
| Federal Government Employees | 0 | 0.0% |
| Unpaid Family Workers | 0 | 0.0% |
| Total | 708 | 100.0% |
Employment Status by Age in Baker
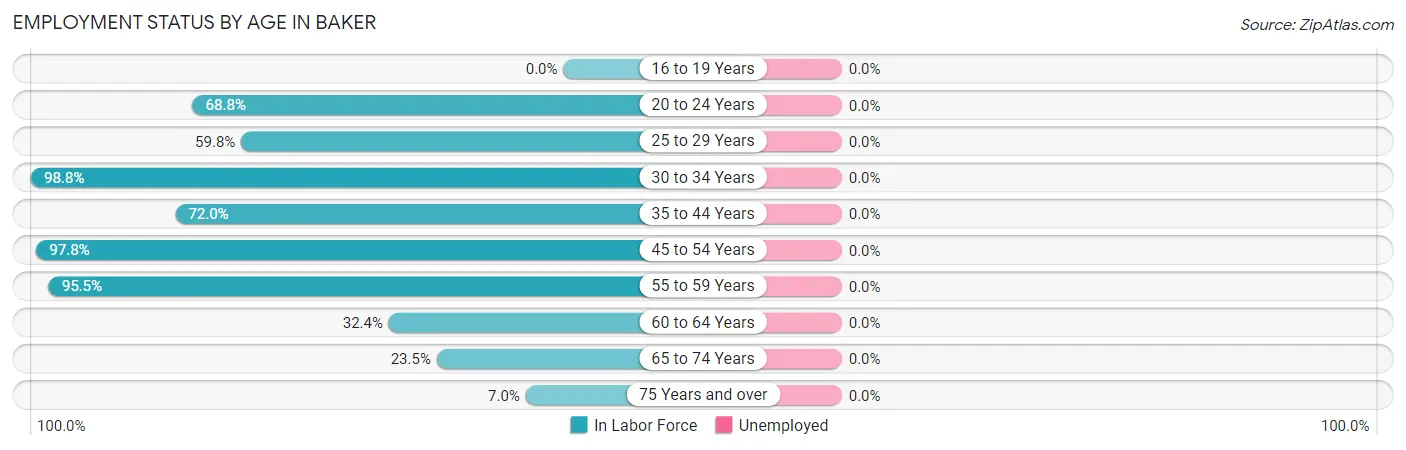
| Age Bracket | In Labor Force | Unemployed |
| 16 to 19 Years | 0 (0.0%) | 0 (0.0%) |
| 20 to 24 Years | 110 (68.8%) | 0 (0.0%) |
| 25 to 29 Years | 58 (59.8%) | 0 (0.0%) |
| 30 to 34 Years | 164 (98.8%) | 0 (0.0%) |
| 35 to 44 Years | 85 (72.0%) | 0 (0.0%) |
| 45 to 54 Years | 132 (97.8%) | 0 (0.0%) |
| 55 to 59 Years | 64 (95.5%) | 0 (0.0%) |
| 60 to 64 Years | 45 (32.4%) | 0 (0.0%) |
| 65 to 74 Years | 40 (23.5%) | 0 (0.0%) |
| 75 Years and over | 10 (7.0%) | 0 (0.0%) |
| Total | 708 (59.3%) | 0 (0.0%) |
Employment Status by Educational Attainment in Baker
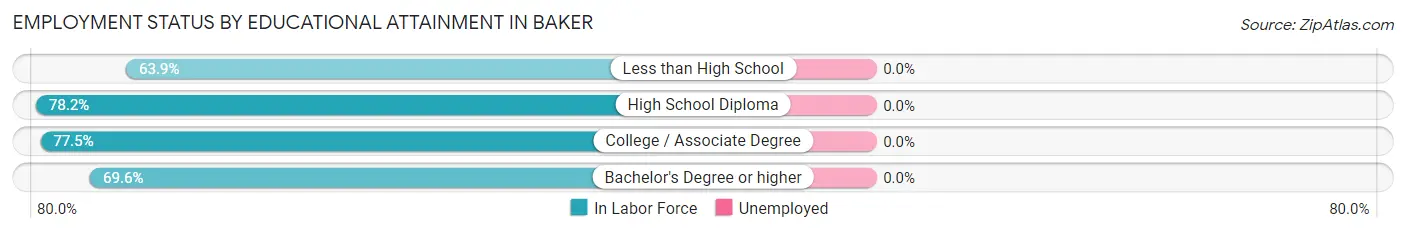
| Educational Attainment | In Labor Force | Unemployed |
| Less than High School | 23 (63.9%) | 0 (0.0%) |
| High School Diploma | 158 (78.2%) | 0 (0.0%) |
| College / Associate Degree | 296 (77.5%) | 0 (0.0%) |
| Bachelor's Degree or higher | 71 (69.6%) | 0 (0.0%) |
| Total | 548 (75.9%) | 0 (0.0%) |
Employment Occupations by Sex in Baker
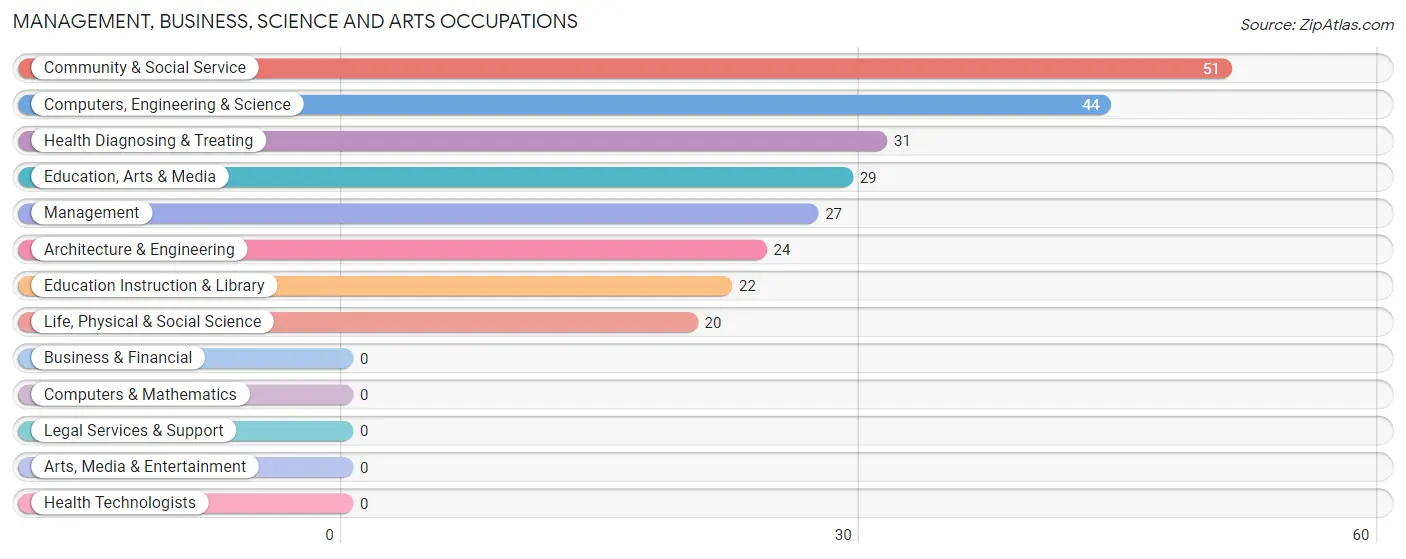
Management, Business, Science and Arts Occupations
The most common Management, Business, Science and Arts occupations in Baker are Community & Social Service (51 | 7.2%), Computers, Engineering & Science (44 | 6.2%), Health Diagnosing & Treating (31 | 4.4%), Education, Arts & Media (29 | 4.1%), and Management (27 | 3.8%).
Management, Business, Science and Arts Occupations by Sex
Within the Management, Business, Science and Arts occupations in Baker, the most male-oriented occupations are Life, Physical & Social Science (100.0%), Education Instruction & Library (100.0%), and Computers, Engineering & Science (72.7%), while the most female-oriented occupations are Education, Arts & Media (100.0%), Health Diagnosing & Treating (100.0%), and Community & Social Service (56.9%).
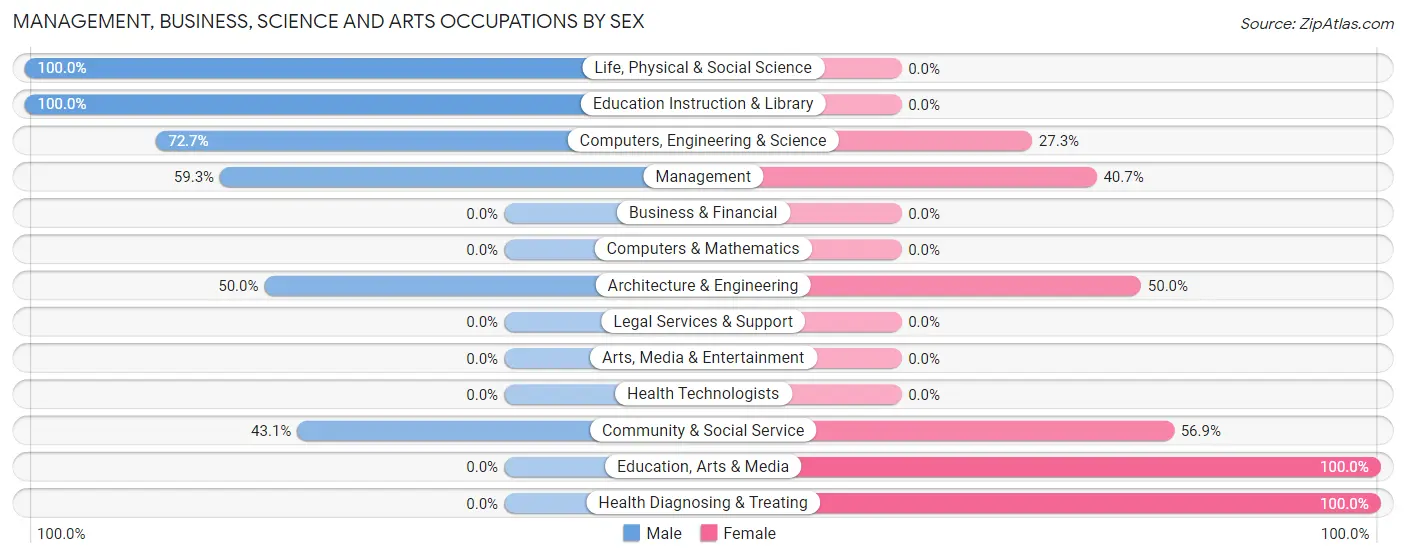
| Occupation | Male | Female |
| Management | 16 (59.3%) | 11 (40.7%) |
| Business & Financial | 0 (0.0%) | 0 (0.0%) |
| Computers, Engineering & Science | 32 (72.7%) | 12 (27.3%) |
| Computers & Mathematics | 0 (0.0%) | 0 (0.0%) |
| Architecture & Engineering | 12 (50.0%) | 12 (50.0%) |
| Life, Physical & Social Science | 20 (100.0%) | 0 (0.0%) |
| Community & Social Service | 22 (43.1%) | 29 (56.9%) |
| Education, Arts & Media | 0 (0.0%) | 29 (100.0%) |
| Legal Services & Support | 0 (0.0%) | 0 (0.0%) |
| Education Instruction & Library | 22 (100.0%) | 0 (0.0%) |
| Arts, Media & Entertainment | 0 (0.0%) | 0 (0.0%) |
| Health Diagnosing & Treating | 0 (0.0%) | 31 (100.0%) |
| Health Technologists | 0 (0.0%) | 0 (0.0%) |
| Total (Category) | 70 (45.8%) | 83 (54.2%) |
| Total (Overall) | 379 (53.5%) | 329 (46.5%) |
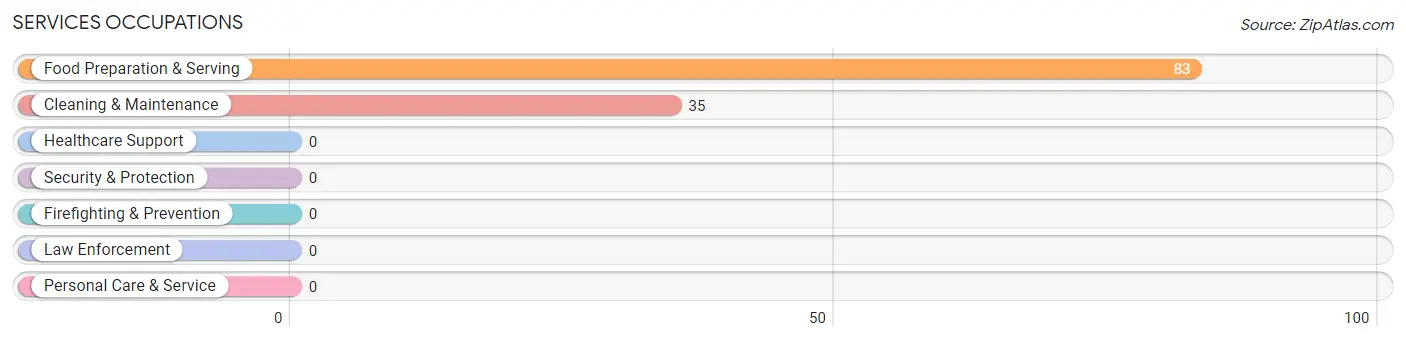
Services Occupations
The most common Services occupations in Baker are Food Preparation & Serving (83 | 11.7%), and Cleaning & Maintenance (35 | 4.9%).
Services Occupations by Sex
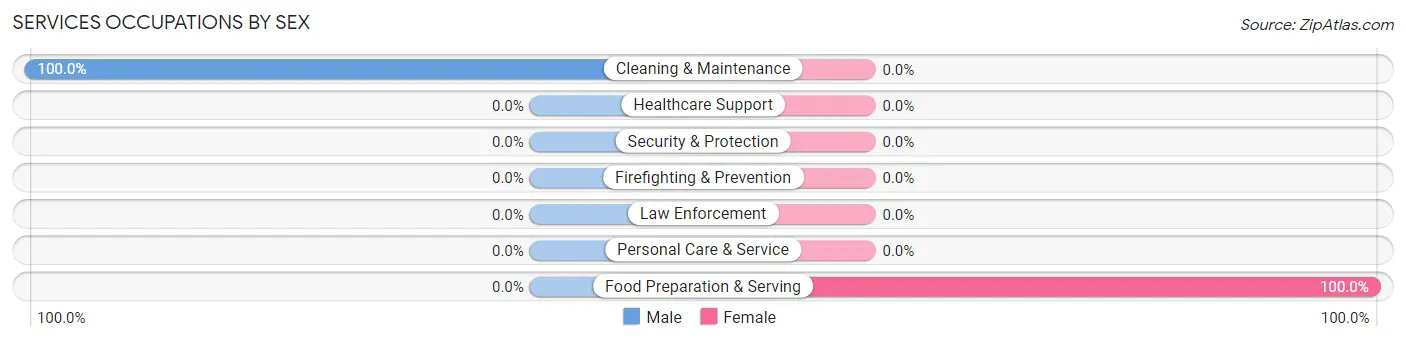
| Occupation | Male | Female |
| Healthcare Support | 0 (0.0%) | 0 (0.0%) |
| Security & Protection | 0 (0.0%) | 0 (0.0%) |
| Firefighting & Prevention | 0 (0.0%) | 0 (0.0%) |
| Law Enforcement | 0 (0.0%) | 0 (0.0%) |
| Food Preparation & Serving | 0 (0.0%) | 83 (100.0%) |
| Cleaning & Maintenance | 35 (100.0%) | 0 (0.0%) |
| Personal Care & Service | 0 (0.0%) | 0 (0.0%) |
| Total (Category) | 35 (29.7%) | 83 (70.3%) |
| Total (Overall) | 379 (53.5%) | 329 (46.5%) |
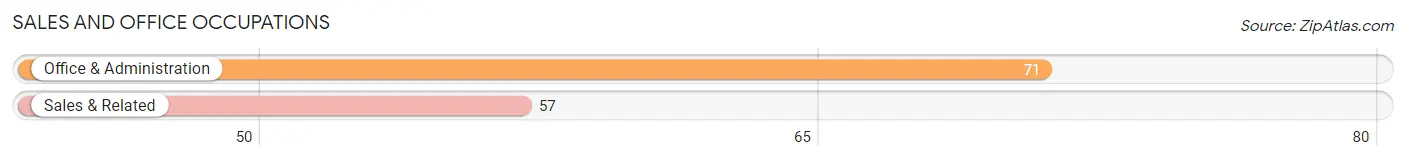
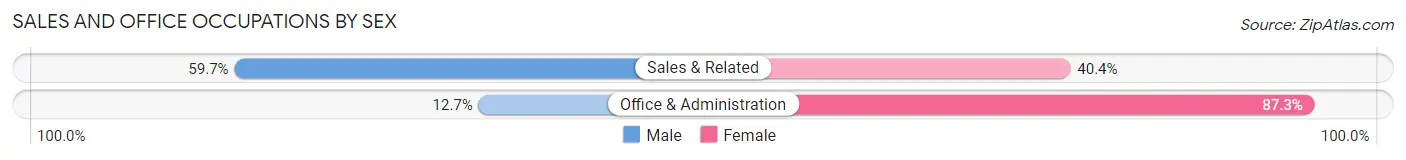
Sales and Office Occupations
The most common Sales and Office occupations in Baker are Office & Administration (71 | 10.0%), and Sales & Related (57 | 8.1%).
Sales and Office Occupations by Sex
| Occupation | Male | Female |
| Sales & Related | 34 (59.7%) | 23 (40.4%) |
| Office & Administration | 9 (12.7%) | 62 (87.3%) |
| Total (Category) | 43 (33.6%) | 85 (66.4%) |
| Total (Overall) | 379 (53.5%) | 329 (46.5%) |
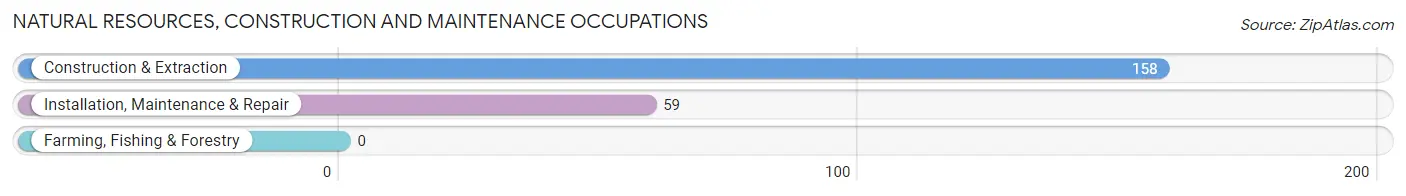
Natural Resources, Construction and Maintenance Occupations
The most common Natural Resources, Construction and Maintenance occupations in Baker are Construction & Extraction (158 | 22.3%), and Installation, Maintenance & Repair (59 | 8.3%).
Natural Resources, Construction and Maintenance Occupations by Sex
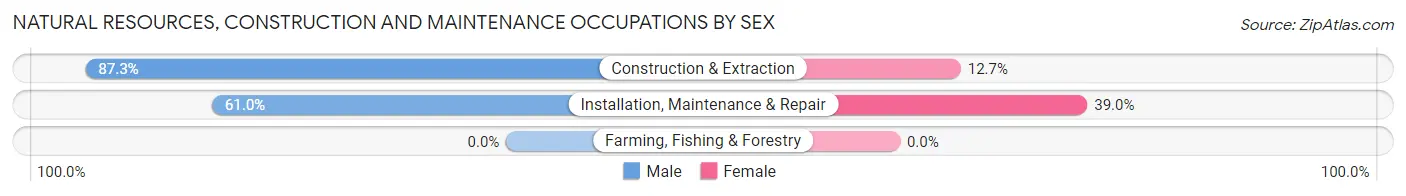
| Occupation | Male | Female |
| Farming, Fishing & Forestry | 0 (0.0%) | 0 (0.0%) |
| Construction & Extraction | 138 (87.3%) | 20 (12.7%) |
| Installation, Maintenance & Repair | 36 (61.0%) | 23 (39.0%) |
| Total (Category) | 174 (80.2%) | 43 (19.8%) |
| Total (Overall) | 379 (53.5%) | 329 (46.5%) |
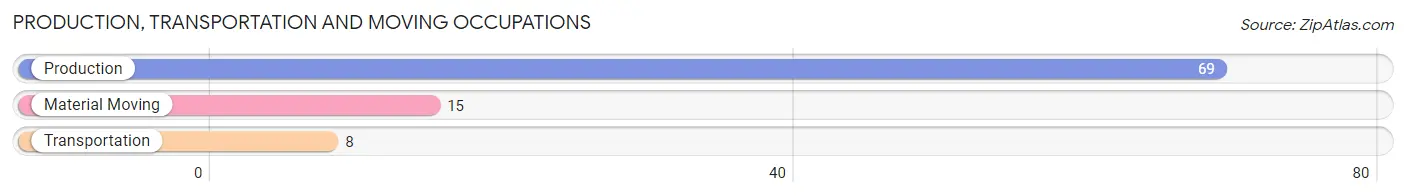
Production, Transportation and Moving Occupations
The most common Production, Transportation and Moving occupations in Baker are Production (69 | 9.8%), Material Moving (15 | 2.1%), and Transportation (8 | 1.1%).
Production, Transportation and Moving Occupations by Sex
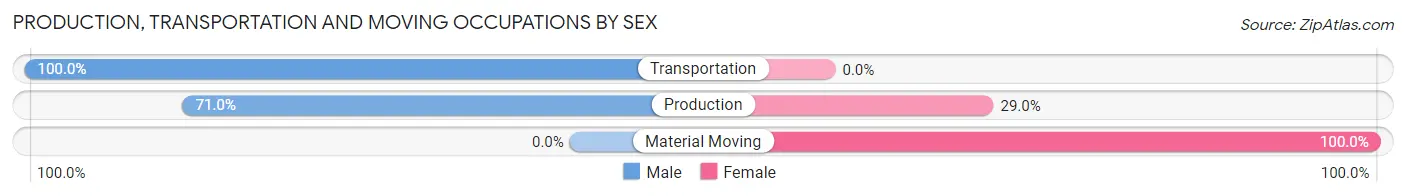
| Occupation | Male | Female |
| Production | 49 (71.0%) | 20 (29.0%) |
| Transportation | 8 (100.0%) | 0 (0.0%) |
| Material Moving | 0 (0.0%) | 15 (100.0%) |
| Total (Category) | 57 (62.0%) | 35 (38.0%) |
| Total (Overall) | 379 (53.5%) | 329 (46.5%) |
Employment Industries by Sex in Baker
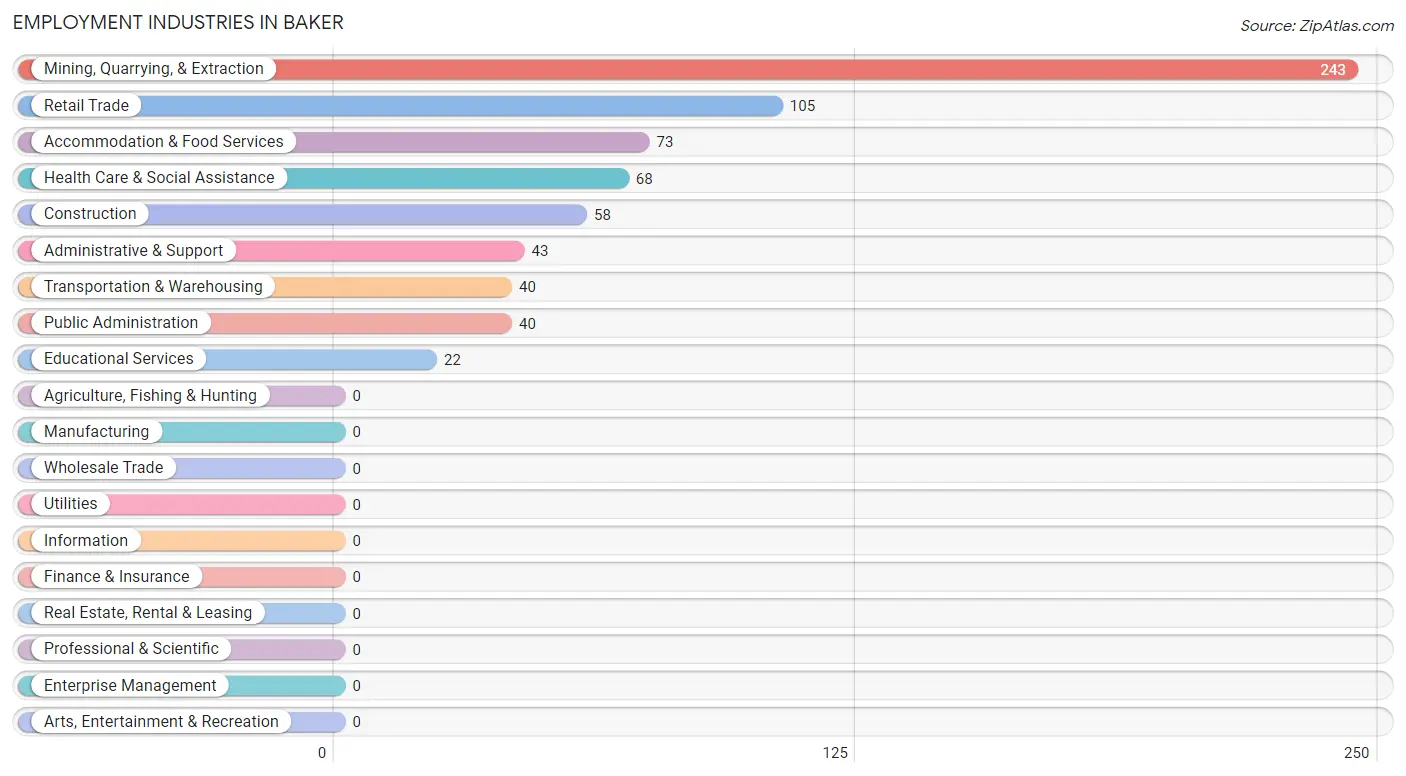
Employment Industries in Baker
The major employment industries in Baker include Mining, Quarrying, & Extraction (243 | 34.3%), Retail Trade (105 | 14.8%), Accommodation & Food Services (73 | 10.3%), Health Care & Social Assistance (68 | 9.6%), and Construction (58 | 8.2%).
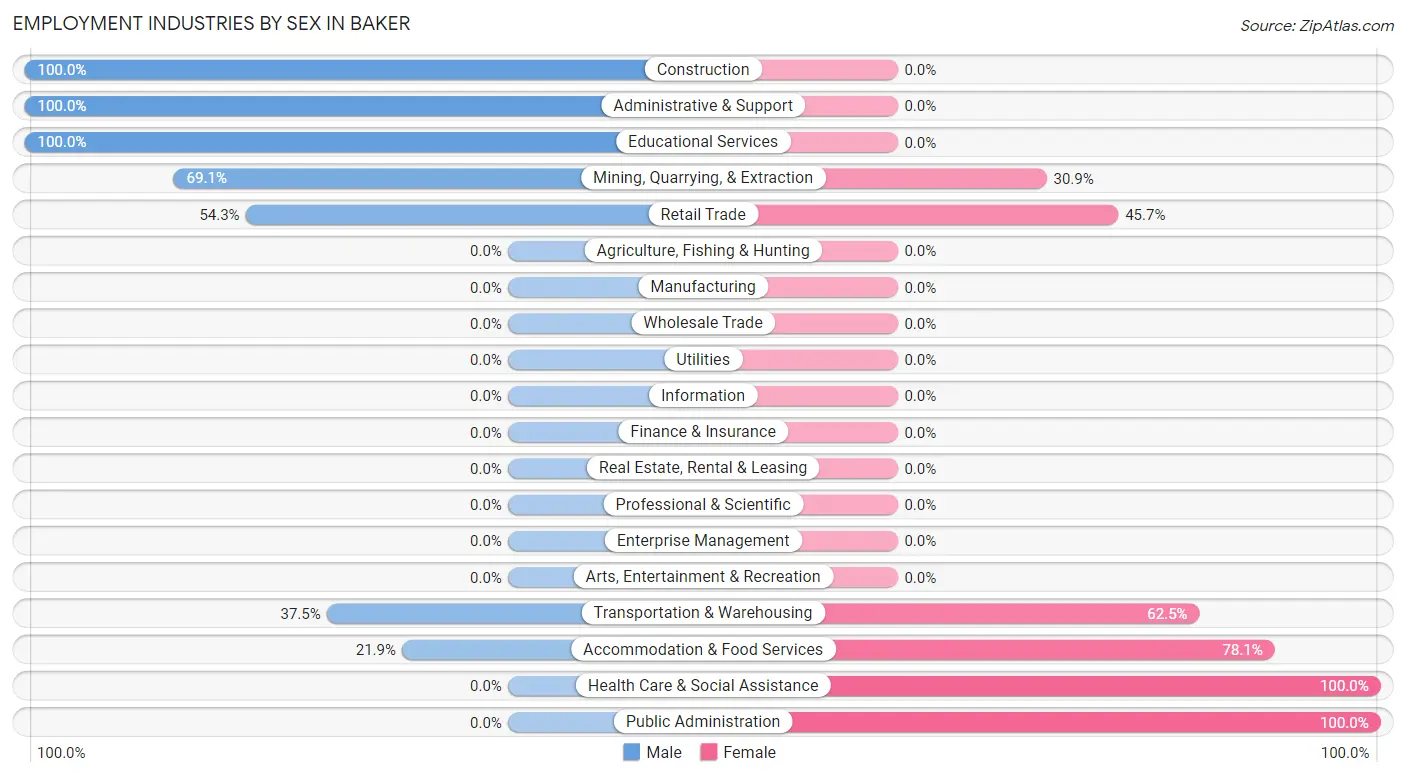
Employment Industries by Sex in Baker
The Baker industries that see more men than women are Construction (100.0%), Administrative & Support (100.0%), and Educational Services (100.0%), whereas the industries that tend to have a higher number of women are Health Care & Social Assistance (100.0%), Public Administration (100.0%), and Accommodation & Food Services (78.1%).
| Industry | Male | Female |
| Agriculture, Fishing & Hunting | 0 (0.0%) | 0 (0.0%) |
| Mining, Quarrying, & Extraction | 168 (69.1%) | 75 (30.9%) |
| Construction | 58 (100.0%) | 0 (0.0%) |
| Manufacturing | 0 (0.0%) | 0 (0.0%) |
| Wholesale Trade | 0 (0.0%) | 0 (0.0%) |
| Retail Trade | 57 (54.3%) | 48 (45.7%) |
| Transportation & Warehousing | 15 (37.5%) | 25 (62.5%) |
| Utilities | 0 (0.0%) | 0 (0.0%) |
| Information | 0 (0.0%) | 0 (0.0%) |
| Finance & Insurance | 0 (0.0%) | 0 (0.0%) |
| Real Estate, Rental & Leasing | 0 (0.0%) | 0 (0.0%) |
| Professional & Scientific | 0 (0.0%) | 0 (0.0%) |
| Enterprise Management | 0 (0.0%) | 0 (0.0%) |
| Administrative & Support | 43 (100.0%) | 0 (0.0%) |
| Educational Services | 22 (100.0%) | 0 (0.0%) |
| Health Care & Social Assistance | 0 (0.0%) | 68 (100.0%) |
| Arts, Entertainment & Recreation | 0 (0.0%) | 0 (0.0%) |
| Accommodation & Food Services | 16 (21.9%) | 57 (78.1%) |
| Public Administration | 0 (0.0%) | 40 (100.0%) |
| Total | 379 (53.5%) | 329 (46.5%) |
Education in Baker
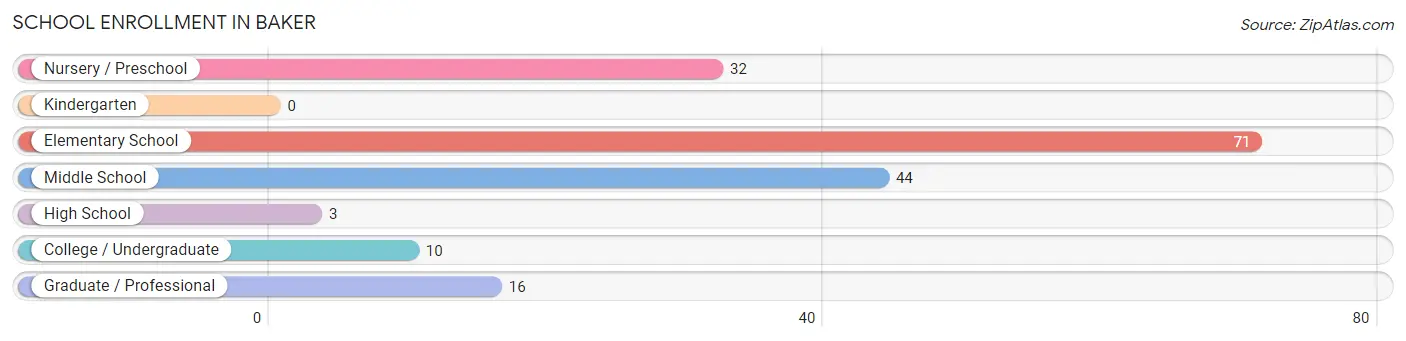
School Enrollment in Baker
The most common levels of schooling among the 176 students in Baker are elementary school (71 | 40.3%), middle school (44 | 25.0%), and nursery / preschool (32 | 18.2%).
| School Level | # Students | % Students |
| Nursery / Preschool | 32 | 18.2% |
| Kindergarten | 0 | 0.0% |
| Elementary School | 71 | 40.3% |
| Middle School | 44 | 25.0% |
| High School | 3 | 1.7% |
| College / Undergraduate | 10 | 5.7% |
| Graduate / Professional | 16 | 9.1% |
| Total | 176 | 100.0% |
School Enrollment by Age by Funding Source in Baker
Out of a total of 176 students who are enrolled in schools in Baker, 39 (22.2%) attend a private institution, while the remaining 137 (77.8%) are enrolled in public schools. The age group of 5 to 9 year old has the highest likelihood of being enrolled in private schools, with 39 (54.2% in the age bracket) enrolled. Conversely, the age group of 3 to 4 year olds has the lowest likelihood of being enrolled in a private school, with 16 (100.0% in the age bracket) attending a public institution.
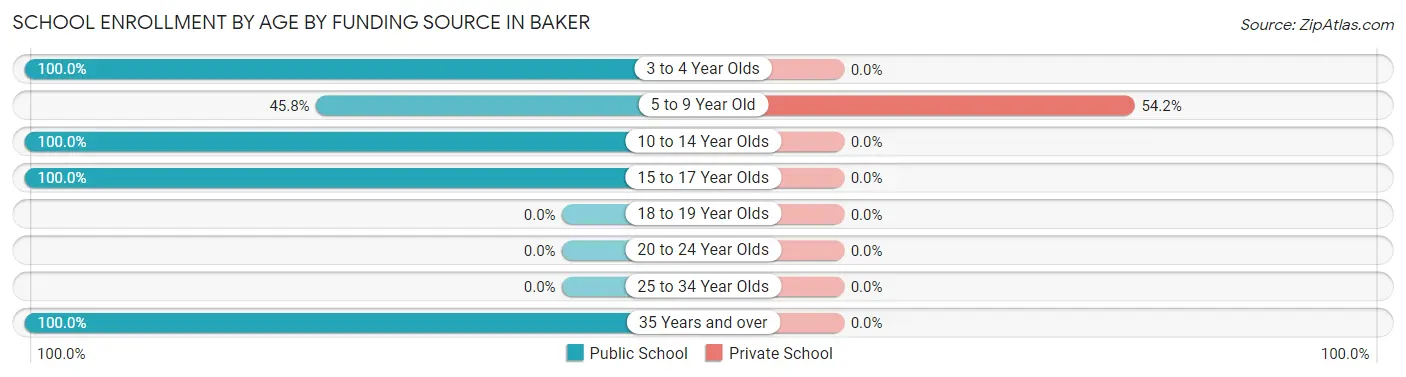
| Age Bracket | Public School | Private School |
| 3 to 4 Year Olds | 16 (100.0%) | 0 (0.0%) |
| 5 to 9 Year Old | 33 (45.8%) | 39 (54.2%) |
| 10 to 14 Year Olds | 59 (100.0%) | 0 (0.0%) |
| 15 to 17 Year Olds | 3 (100.0%) | 0 (0.0%) |
| 18 to 19 Year Olds | 0 (0.0%) | 0 (0.0%) |
| 20 to 24 Year Olds | 0 (0.0%) | 0 (0.0%) |
| 25 to 34 Year Olds | 0 (0.0%) | 0 (0.0%) |
| 35 Years and over | 26 (100.0%) | 0 (0.0%) |
| Total | 137 (77.8%) | 39 (22.2%) |
Educational Attainment by Field of Study in Baker
Business (55 | 32.9%), bio, nature & agricultural (41 | 24.5%), education (31 | 18.6%), social sciences (16 | 9.6%), and physical & health sciences (12 | 7.2%) are the most common fields of study among 167 individuals in Baker who have obtained a bachelor's degree or higher.
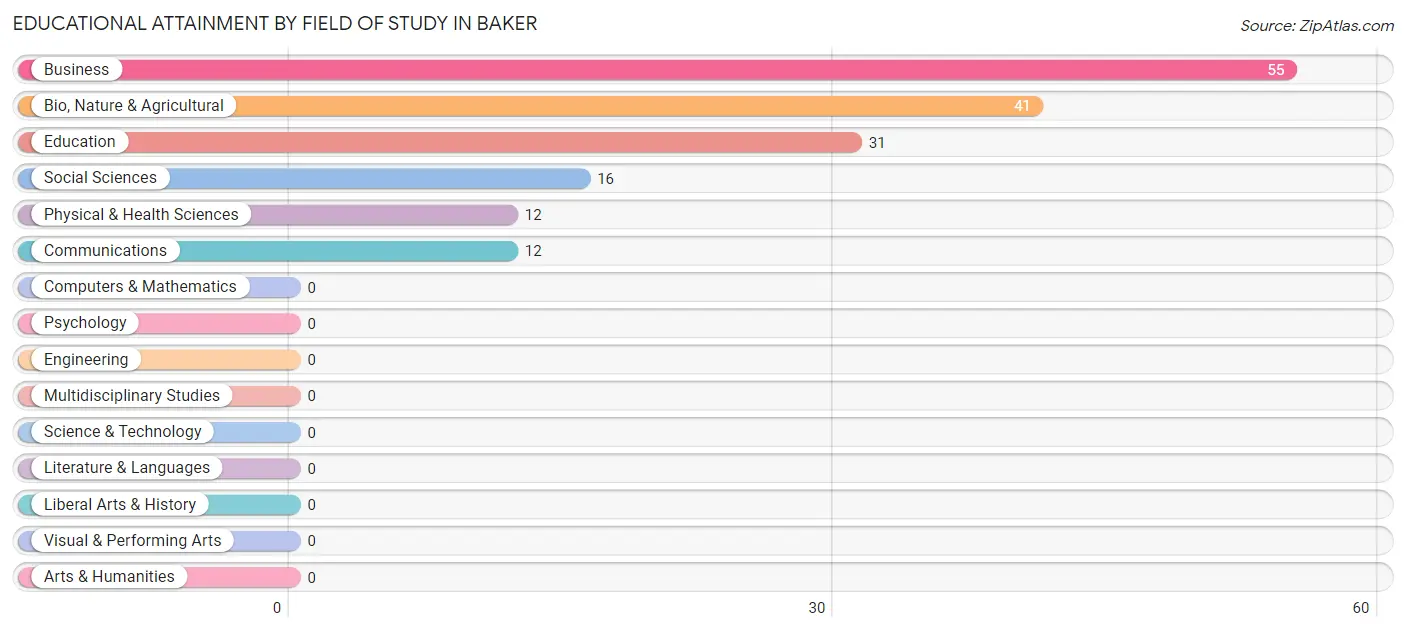
| Field of Study | # Graduates | % Graduates |
| Computers & Mathematics | 0 | 0.0% |
| Bio, Nature & Agricultural | 41 | 24.5% |
| Physical & Health Sciences | 12 | 7.2% |
| Psychology | 0 | 0.0% |
| Social Sciences | 16 | 9.6% |
| Engineering | 0 | 0.0% |
| Multidisciplinary Studies | 0 | 0.0% |
| Science & Technology | 0 | 0.0% |
| Business | 55 | 32.9% |
| Education | 31 | 18.6% |
| Literature & Languages | 0 | 0.0% |
| Liberal Arts & History | 0 | 0.0% |
| Visual & Performing Arts | 0 | 0.0% |
| Communications | 12 | 7.2% |
| Arts & Humanities | 0 | 0.0% |
| Total | 167 | 100.0% |
Transportation & Commute in Baker
Vehicle Availability by Sex in Baker
The most prevalent vehicle ownership categories in Baker are males with 2 vehicles (115, accounting for 30.3%) and females with 2 vehicles (105, making up 35.1%).
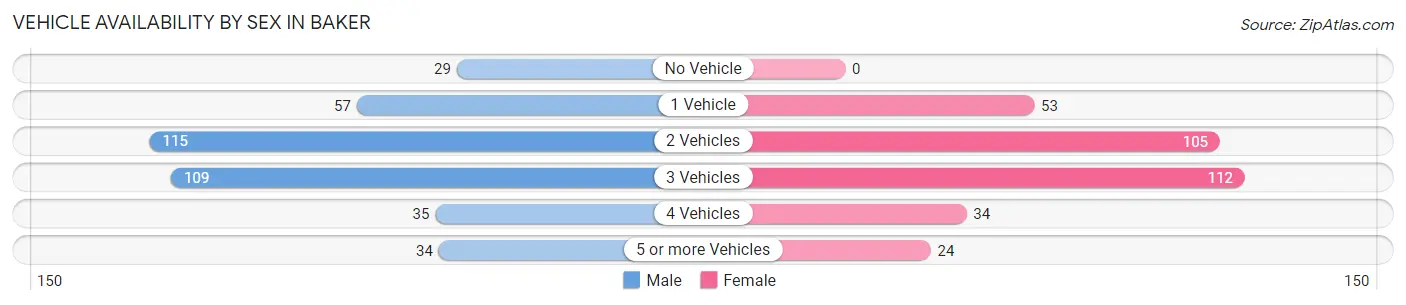
| Vehicles Available | Male | Female |
| No Vehicle | 29 (7.6%) | 0 (0.0%) |
| 1 Vehicle | 57 (15.0%) | 53 (16.2%) |
| 2 Vehicles | 115 (30.3%) | 105 (32.0%) |
| 3 Vehicles | 109 (28.8%) | 112 (34.2%) |
| 4 Vehicles | 35 (9.2%) | 34 (10.4%) |
| 5 or more Vehicles | 34 (9.0%) | 24 (7.3%) |
| Total | 379 (100.0%) | 328 (100.0%) |
Commute Time in Baker
The most frequently occuring commute durations in Baker are 5 to 9 minutes (298 commuters, 43.6%), less than 5 minutes (164 commuters, 24.0%), and 90 or more minutes (53 commuters, 7.8%).
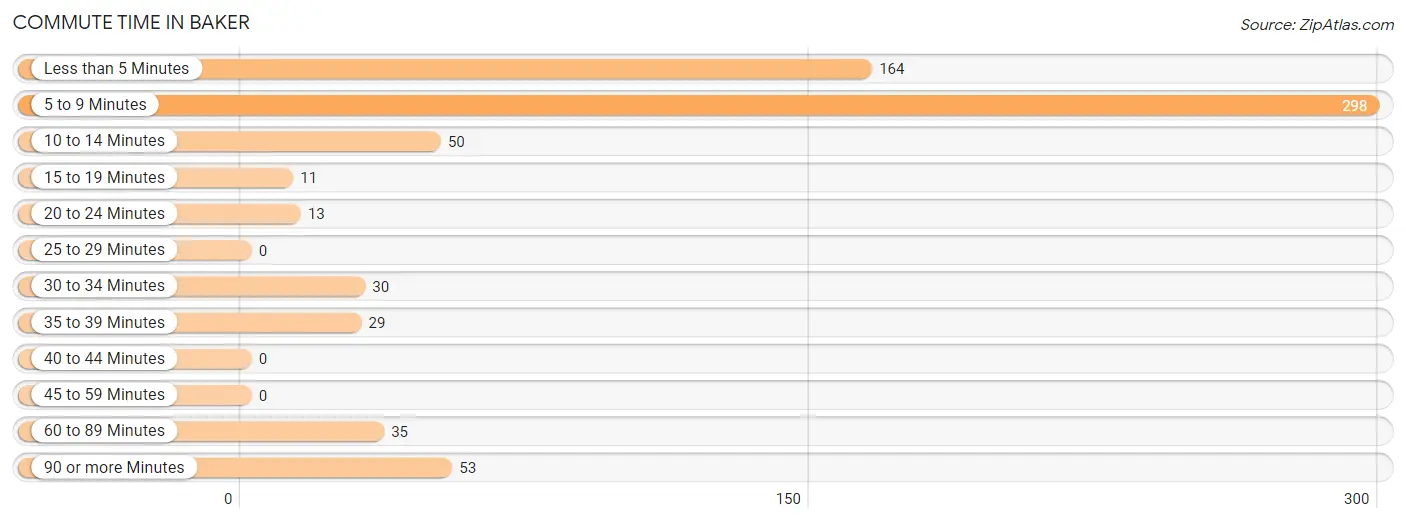
| Commute Time | # Commuters | % Commuters |
| Less than 5 Minutes | 164 | 24.0% |
| 5 to 9 Minutes | 298 | 43.6% |
| 10 to 14 Minutes | 50 | 7.3% |
| 15 to 19 Minutes | 11 | 1.6% |
| 20 to 24 Minutes | 13 | 1.9% |
| 25 to 29 Minutes | 0 | 0.0% |
| 30 to 34 Minutes | 30 | 4.4% |
| 35 to 39 Minutes | 29 | 4.3% |
| 40 to 44 Minutes | 0 | 0.0% |
| 45 to 59 Minutes | 0 | 0.0% |
| 60 to 89 Minutes | 35 | 5.1% |
| 90 or more Minutes | 53 | 7.8% |
Commute Time by Sex in Baker
The most common commute times in Baker are 5 to 9 minutes (172 commuters, 46.2%) for males and 5 to 9 minutes (126 commuters, 40.5%) for females.
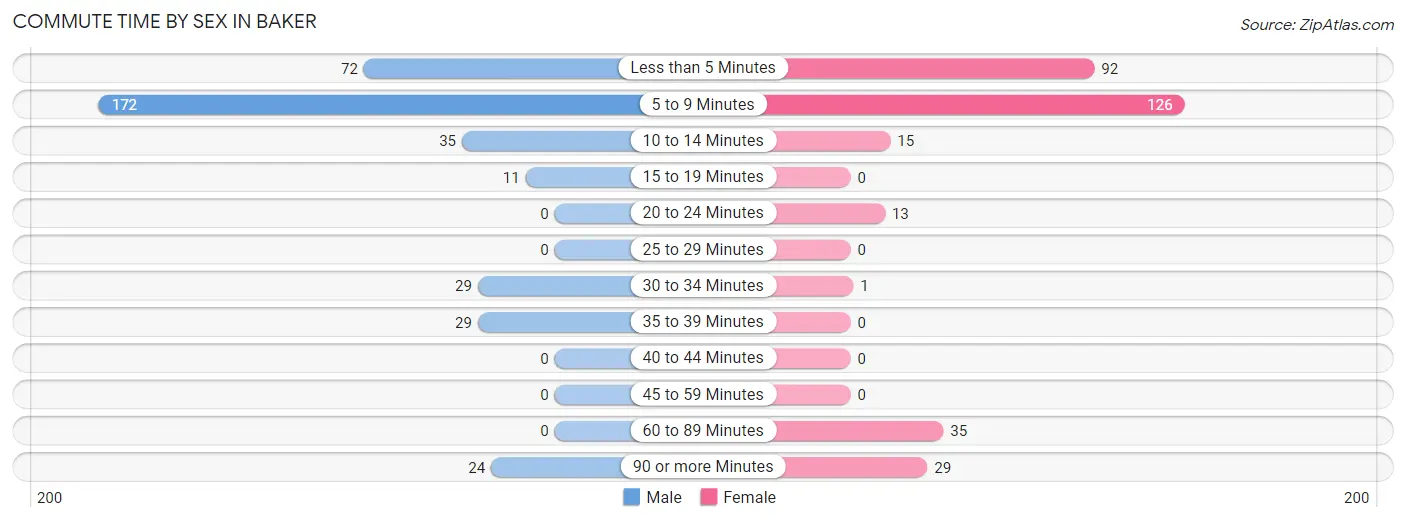
| Commute Time | Male | Female |
| Less than 5 Minutes | 72 (19.4%) | 92 (29.6%) |
| 5 to 9 Minutes | 172 (46.2%) | 126 (40.5%) |
| 10 to 14 Minutes | 35 (9.4%) | 15 (4.8%) |
| 15 to 19 Minutes | 11 (3.0%) | 0 (0.0%) |
| 20 to 24 Minutes | 0 (0.0%) | 13 (4.2%) |
| 25 to 29 Minutes | 0 (0.0%) | 0 (0.0%) |
| 30 to 34 Minutes | 29 (7.8%) | 1 (0.3%) |
| 35 to 39 Minutes | 29 (7.8%) | 0 (0.0%) |
| 40 to 44 Minutes | 0 (0.0%) | 0 (0.0%) |
| 45 to 59 Minutes | 0 (0.0%) | 0 (0.0%) |
| 60 to 89 Minutes | 0 (0.0%) | 35 (11.3%) |
| 90 or more Minutes | 24 (6.5%) | 29 (9.3%) |
Time of Departure to Work by Sex in Baker
The most frequent times of departure to work in Baker are 7:00 AM to 7:29 AM (80, 21.5%) for males and 7:30 AM to 7:59 AM (98, 31.5%) for females.
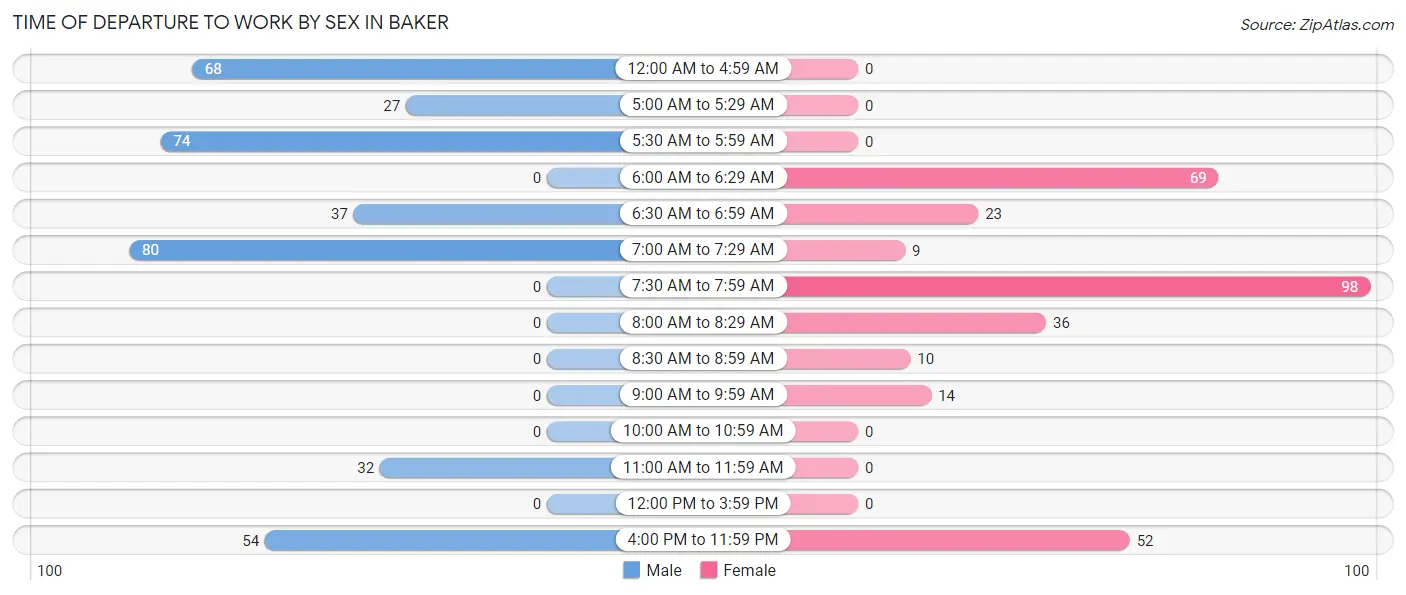
| Time of Departure | Male | Female |
| 12:00 AM to 4:59 AM | 68 (18.3%) | 0 (0.0%) |
| 5:00 AM to 5:29 AM | 27 (7.3%) | 0 (0.0%) |
| 5:30 AM to 5:59 AM | 74 (19.9%) | 0 (0.0%) |
| 6:00 AM to 6:29 AM | 0 (0.0%) | 69 (22.2%) |
| 6:30 AM to 6:59 AM | 37 (10.0%) | 23 (7.4%) |
| 7:00 AM to 7:29 AM | 80 (21.5%) | 9 (2.9%) |
| 7:30 AM to 7:59 AM | 0 (0.0%) | 98 (31.5%) |
| 8:00 AM to 8:29 AM | 0 (0.0%) | 36 (11.6%) |
| 8:30 AM to 8:59 AM | 0 (0.0%) | 10 (3.2%) |
| 9:00 AM to 9:59 AM | 0 (0.0%) | 14 (4.5%) |
| 10:00 AM to 10:59 AM | 0 (0.0%) | 0 (0.0%) |
| 11:00 AM to 11:59 AM | 32 (8.6%) | 0 (0.0%) |
| 12:00 PM to 3:59 PM | 0 (0.0%) | 0 (0.0%) |
| 4:00 PM to 11:59 PM | 54 (14.5%) | 52 (16.7%) |
| Total | 372 (100.0%) | 311 (100.0%) |
Housing Occupancy in Baker
Occupancy by Ownership in Baker
Of the total 600 dwellings in Baker, owner-occupied units account for 446 (74.3%), while renter-occupied units make up 154 (25.7%).
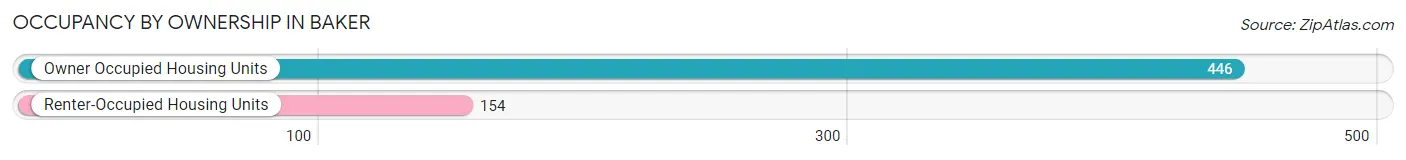
| Occupancy | # Housing Units | % Housing Units |
| Owner Occupied Housing Units | 446 | 74.3% |
| Renter-Occupied Housing Units | 154 | 25.7% |
| Total Occupied Housing Units | 600 | 100.0% |
Occupancy by Household Size in Baker
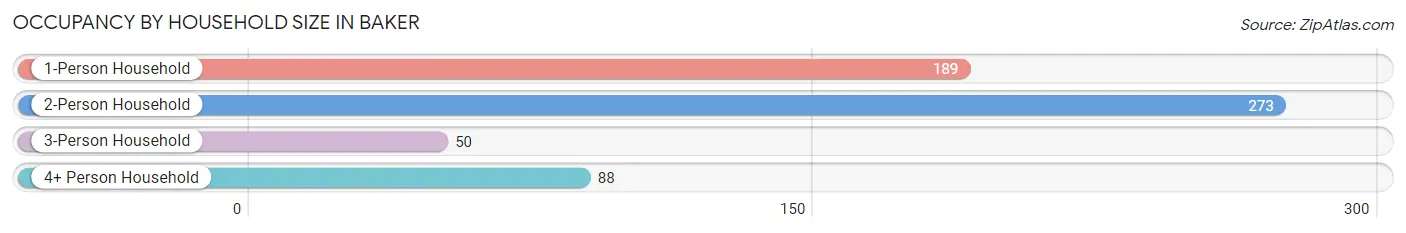
| Household Size | # Housing Units | % Housing Units |
| 1-Person Household | 189 | 31.5% |
| 2-Person Household | 273 | 45.5% |
| 3-Person Household | 50 | 8.3% |
| 4+ Person Household | 88 | 14.7% |
| Total Housing Units | 600 | 100.0% |
Occupancy by Ownership by Household Size in Baker
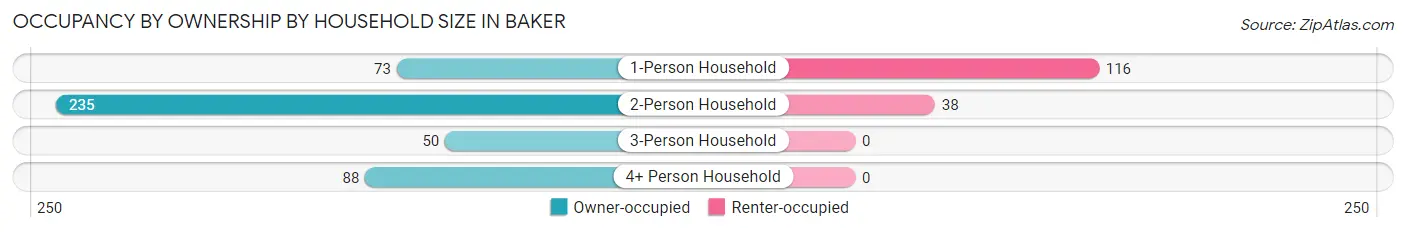
| Household Size | Owner-occupied | Renter-occupied |
| 1-Person Household | 73 (38.6%) | 116 (61.4%) |
| 2-Person Household | 235 (86.1%) | 38 (13.9%) |
| 3-Person Household | 50 (100.0%) | 0 (0.0%) |
| 4+ Person Household | 88 (100.0%) | 0 (0.0%) |
| Total Housing Units | 446 (74.3%) | 154 (25.7%) |
Occupancy by Educational Attainment in Baker
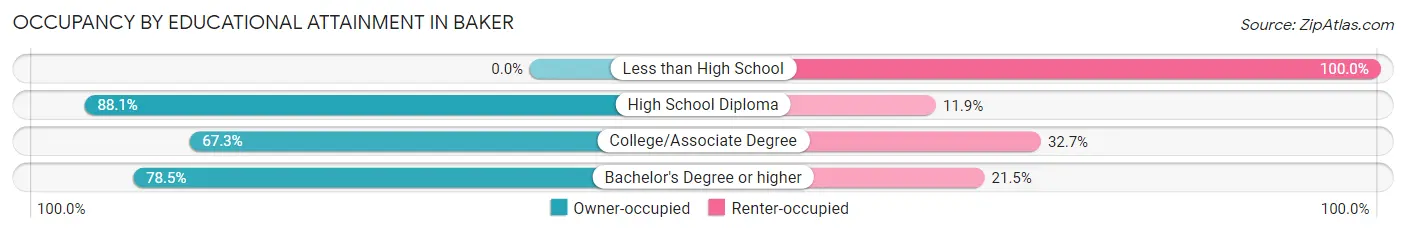
| Household Size | Owner-occupied | Renter-occupied |
| Less than High School | 0 (0.0%) | 23 (100.0%) |
| High School Diploma | 193 (88.1%) | 26 (11.9%) |
| College/Associate Degree | 169 (67.3%) | 82 (32.7%) |
| Bachelor's Degree or higher | 84 (78.5%) | 23 (21.5%) |
Occupancy by Age of Householder in Baker
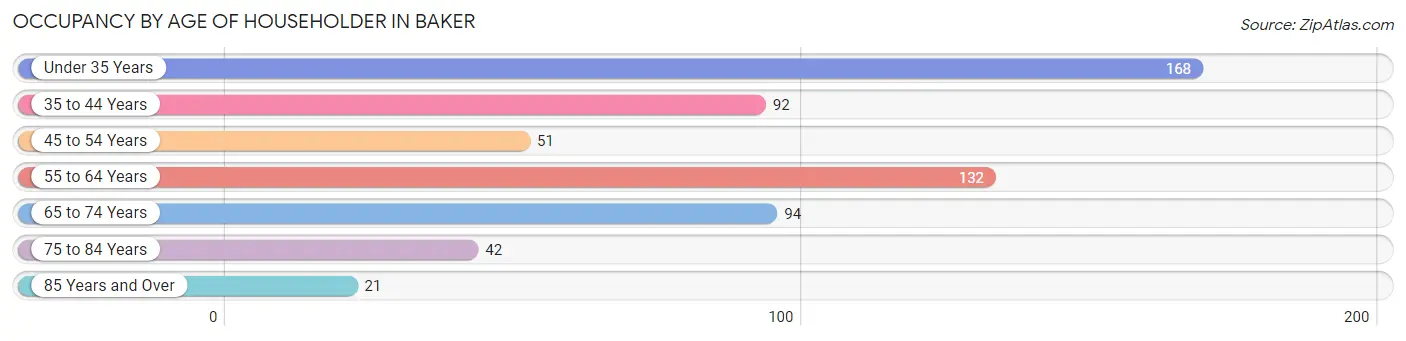
| Age Bracket | # Households | % Households |
| Under 35 Years | 168 | 28.0% |
| 35 to 44 Years | 92 | 15.3% |
| 45 to 54 Years | 51 | 8.5% |
| 55 to 64 Years | 132 | 22.0% |
| 65 to 74 Years | 94 | 15.7% |
| 75 to 84 Years | 42 | 7.0% |
| 85 Years and Over | 21 | 3.5% |
| Total | 600 | 100.0% |
Housing Finances in Baker
Median Income by Occupancy in Baker
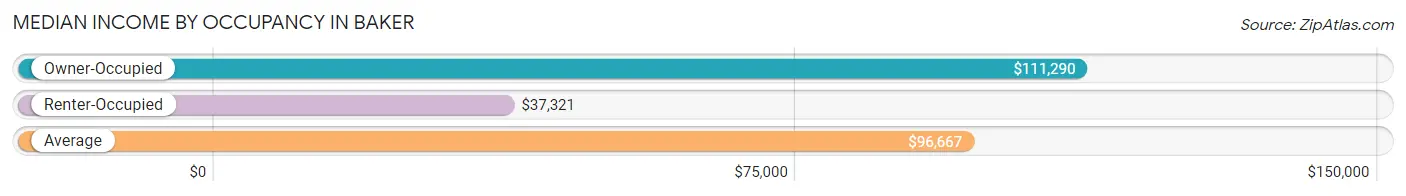
| Occupancy Type | # Households | Median Income |
| Owner-Occupied | 446 (74.3%) | $111,290 |
| Renter-Occupied | 154 (25.7%) | $37,321 |
| Average | 600 (100.0%) | $96,667 |
Occupancy by Householder Income Bracket in Baker
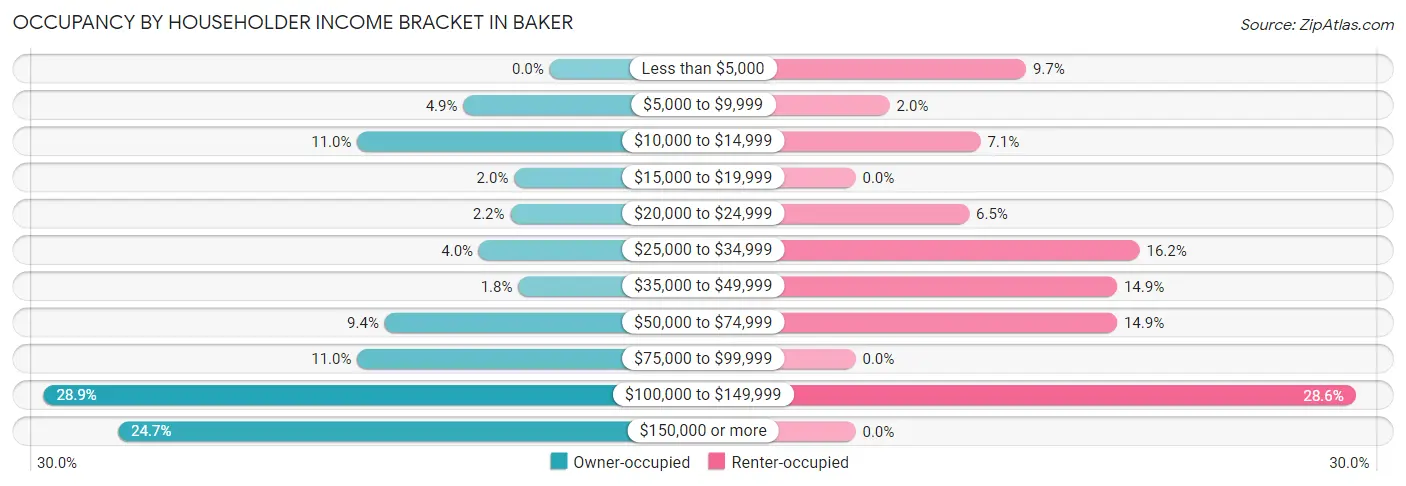
| Income Bracket | Owner-occupied | Renter-occupied |
| Less than $5,000 | 0 (0.0%) | 15 (9.7%) |
| $5,000 to $9,999 | 22 (4.9%) | 3 (1.9%) |
| $10,000 to $14,999 | 49 (11.0%) | 11 (7.1%) |
| $15,000 to $19,999 | 9 (2.0%) | 0 (0.0%) |
| $20,000 to $24,999 | 10 (2.2%) | 10 (6.5%) |
| $25,000 to $34,999 | 18 (4.0%) | 25 (16.2%) |
| $35,000 to $49,999 | 8 (1.8%) | 23 (14.9%) |
| $50,000 to $74,999 | 42 (9.4%) | 23 (14.9%) |
| $75,000 to $99,999 | 49 (11.0%) | 0 (0.0%) |
| $100,000 to $149,999 | 129 (28.9%) | 44 (28.6%) |
| $150,000 or more | 110 (24.7%) | 0 (0.0%) |
| Total | 446 (100.0%) | 154 (100.0%) |
Monthly Housing Cost Tiers in Baker
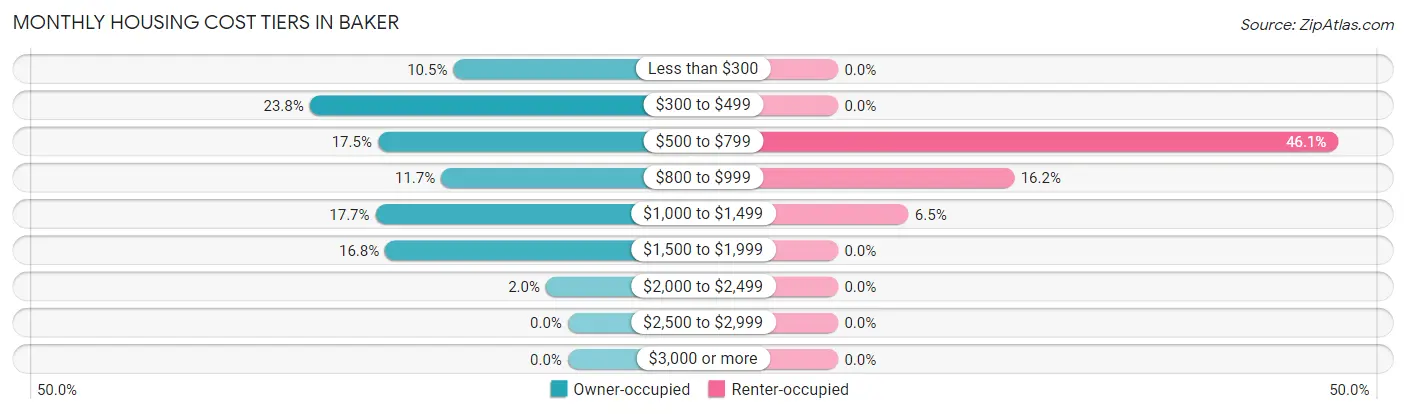
| Monthly Cost | Owner-occupied | Renter-occupied |
| Less than $300 | 47 (10.5%) | 0 (0.0%) |
| $300 to $499 | 106 (23.8%) | 0 (0.0%) |
| $500 to $799 | 78 (17.5%) | 71 (46.1%) |
| $800 to $999 | 52 (11.7%) | 25 (16.2%) |
| $1,000 to $1,499 | 79 (17.7%) | 10 (6.5%) |
| $1,500 to $1,999 | 75 (16.8%) | 0 (0.0%) |
| $2,000 to $2,499 | 9 (2.0%) | 0 (0.0%) |
| $2,500 to $2,999 | 0 (0.0%) | 0 (0.0%) |
| $3,000 or more | 0 (0.0%) | 0 (0.0%) |
| Total | 446 (100.0%) | 154 (100.0%) |
Physical Housing Characteristics in Baker
Housing Structures in Baker
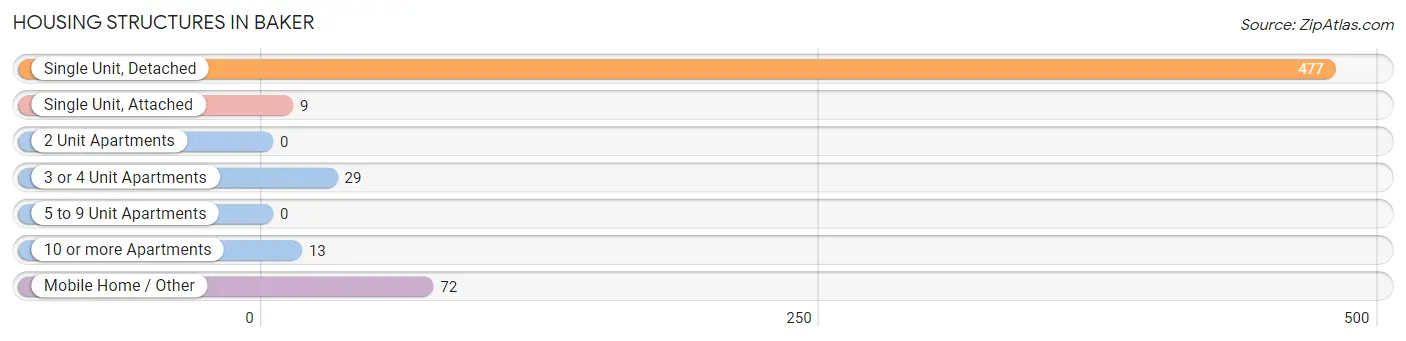
| Structure Type | # Housing Units | % Housing Units |
| Single Unit, Detached | 477 | 79.5% |
| Single Unit, Attached | 9 | 1.5% |
| 2 Unit Apartments | 0 | 0.0% |
| 3 or 4 Unit Apartments | 29 | 4.8% |
| 5 to 9 Unit Apartments | 0 | 0.0% |
| 10 or more Apartments | 13 | 2.2% |
| Mobile Home / Other | 72 | 12.0% |
| Total | 600 | 100.0% |
Housing Structures by Occupancy in Baker
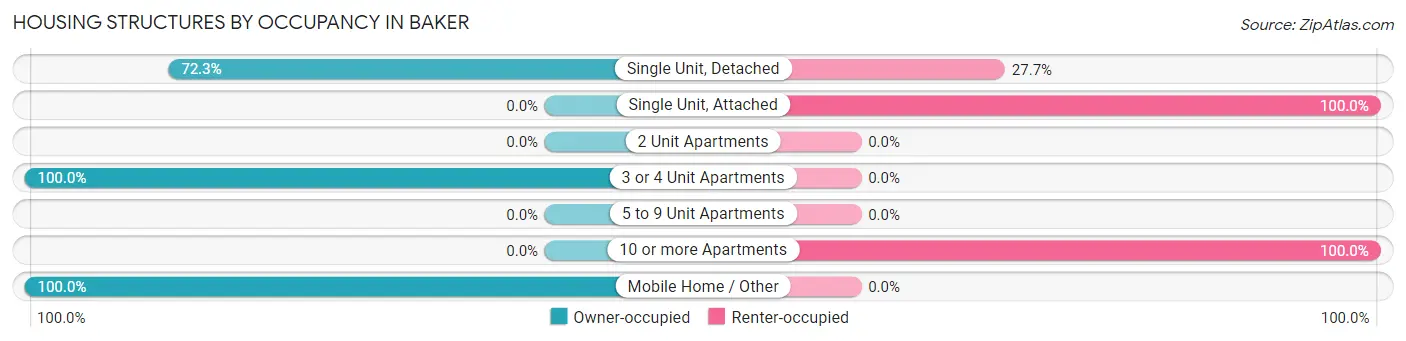
| Structure Type | Owner-occupied | Renter-occupied |
| Single Unit, Detached | 345 (72.3%) | 132 (27.7%) |
| Single Unit, Attached | 0 (0.0%) | 9 (100.0%) |
| 2 Unit Apartments | 0 (0.0%) | 0 (0.0%) |
| 3 or 4 Unit Apartments | 29 (100.0%) | 0 (0.0%) |
| 5 to 9 Unit Apartments | 0 (0.0%) | 0 (0.0%) |
| 10 or more Apartments | 0 (0.0%) | 13 (100.0%) |
| Mobile Home / Other | 72 (100.0%) | 0 (0.0%) |
| Total | 446 (74.3%) | 154 (25.7%) |
Housing Structures by Number of Rooms in Baker
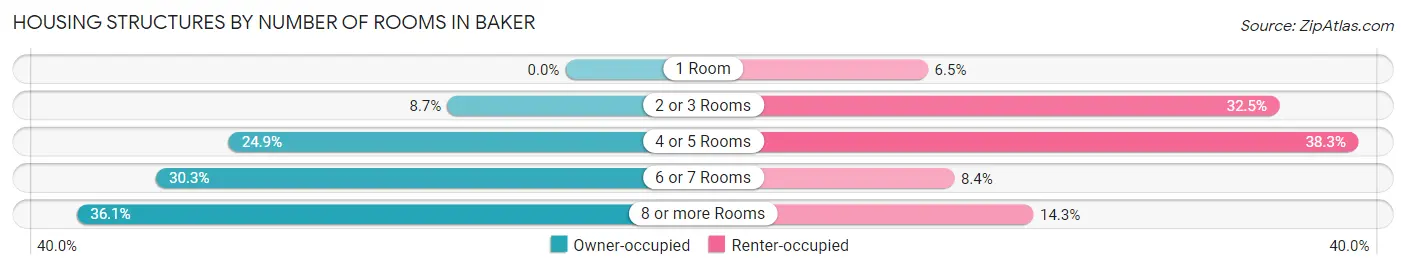
| Number of Rooms | Owner-occupied | Renter-occupied |
| 1 Room | 0 (0.0%) | 10 (6.5%) |
| 2 or 3 Rooms | 39 (8.7%) | 50 (32.5%) |
| 4 or 5 Rooms | 111 (24.9%) | 59 (38.3%) |
| 6 or 7 Rooms | 135 (30.3%) | 13 (8.4%) |
| 8 or more Rooms | 161 (36.1%) | 22 (14.3%) |
| Total | 446 (100.0%) | 154 (100.0%) |
Housing Structure by Heating Type in Baker
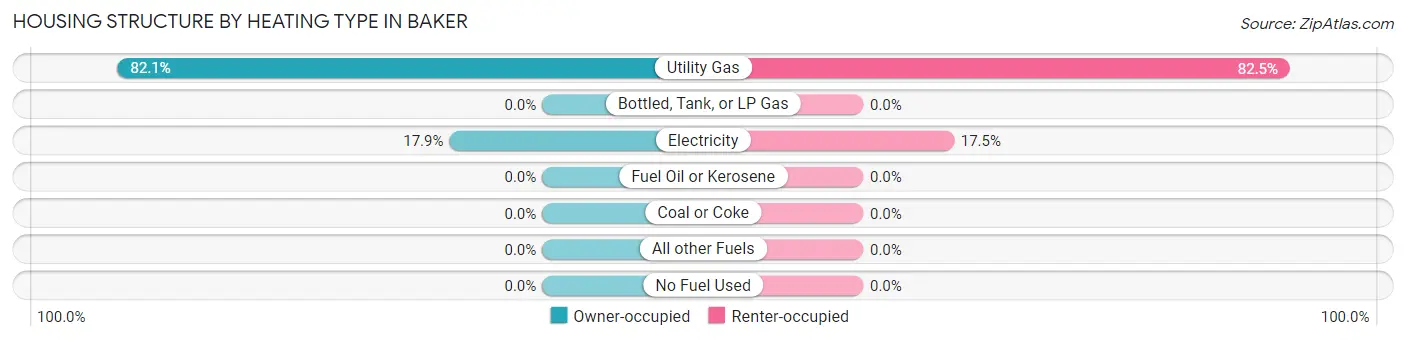
| Heating Type | Owner-occupied | Renter-occupied |
| Utility Gas | 366 (82.1%) | 127 (82.5%) |
| Bottled, Tank, or LP Gas | 0 (0.0%) | 0 (0.0%) |
| Electricity | 80 (17.9%) | 27 (17.5%) |
| Fuel Oil or Kerosene | 0 (0.0%) | 0 (0.0%) |
| Coal or Coke | 0 (0.0%) | 0 (0.0%) |
| All other Fuels | 0 (0.0%) | 0 (0.0%) |
| No Fuel Used | 0 (0.0%) | 0 (0.0%) |
| Total | 446 (100.0%) | 154 (100.0%) |
Household Vehicle Usage in Baker
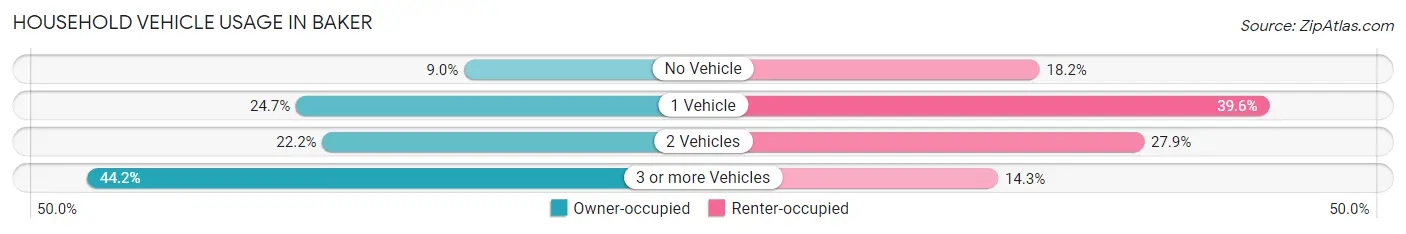
| Vehicles per Household | Owner-occupied | Renter-occupied |
| No Vehicle | 40 (9.0%) | 28 (18.2%) |
| 1 Vehicle | 110 (24.7%) | 61 (39.6%) |
| 2 Vehicles | 99 (22.2%) | 43 (27.9%) |
| 3 or more Vehicles | 197 (44.2%) | 22 (14.3%) |
| Total | 446 (100.0%) | 154 (100.0%) |
Real Estate & Mortgages in Baker
Real Estate and Mortgage Overview in Baker
| Characteristic | Without Mortgage | With Mortgage |
| Housing Units | 246 | 200 |
| Median Property Value | $167,700 | $175,000 |
| Median Household Income | $99,464 | $54 |
| Monthly Housing Costs | $482 | $0 |
| Real Estate Taxes | $1,401 | $0 |
Property Value by Mortgage Status in Baker
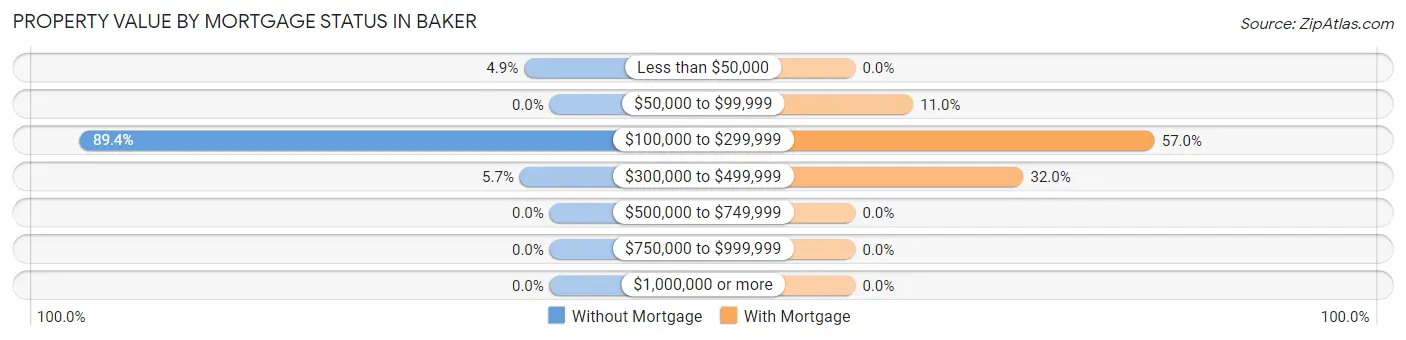
| Property Value | Without Mortgage | With Mortgage |
| Less than $50,000 | 12 (4.9%) | 0 (0.0%) |
| $50,000 to $99,999 | 0 (0.0%) | 22 (11.0%) |
| $100,000 to $299,999 | 220 (89.4%) | 114 (57.0%) |
| $300,000 to $499,999 | 14 (5.7%) | 64 (32.0%) |
| $500,000 to $749,999 | 0 (0.0%) | 0 (0.0%) |
| $750,000 to $999,999 | 0 (0.0%) | 0 (0.0%) |
| $1,000,000 or more | 0 (0.0%) | 0 (0.0%) |
| Total | 246 (100.0%) | 200 (100.0%) |
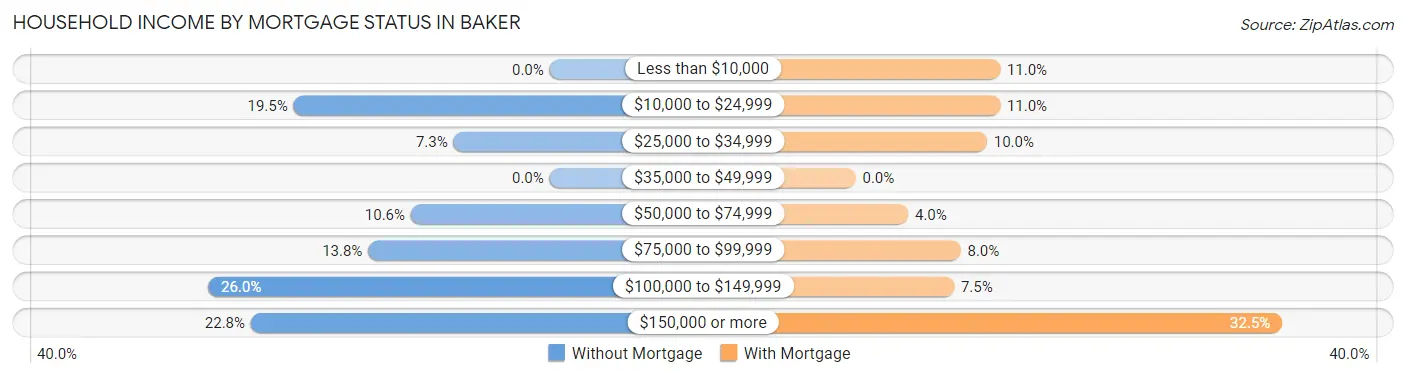
Household Income by Mortgage Status in Baker
| Household Income | Without Mortgage | With Mortgage |
| Less than $10,000 | 0 (0.0%) | 22 (11.0%) |
| $10,000 to $24,999 | 48 (19.5%) | 22 (11.0%) |
| $25,000 to $34,999 | 18 (7.3%) | 20 (10.0%) |
| $35,000 to $49,999 | 0 (0.0%) | 0 (0.0%) |
| $50,000 to $74,999 | 26 (10.6%) | 8 (4.0%) |
| $75,000 to $99,999 | 34 (13.8%) | 16 (8.0%) |
| $100,000 to $149,999 | 64 (26.0%) | 15 (7.5%) |
| $150,000 or more | 56 (22.8%) | 65 (32.5%) |
| Total | 246 (100.0%) | 200 (100.0%) |
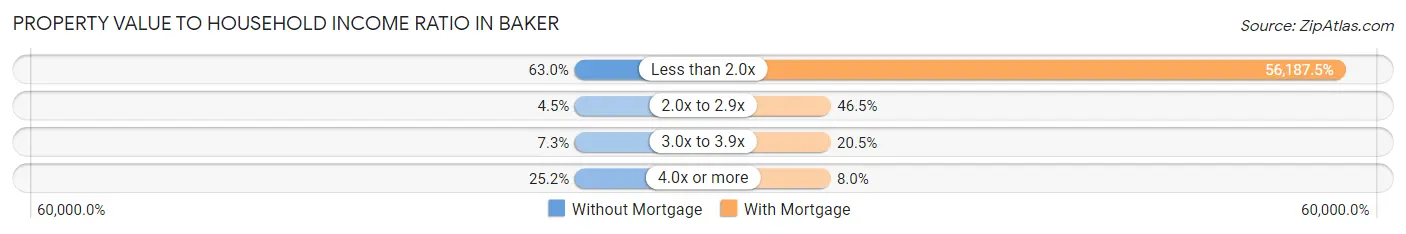
Property Value to Household Income Ratio in Baker
| Value-to-Income Ratio | Without Mortgage | With Mortgage |
| Less than 2.0x | 155 (63.0%) | 112,375 (56,187.5%) |
| 2.0x to 2.9x | 11 (4.5%) | 93 (46.5%) |
| 3.0x to 3.9x | 18 (7.3%) | 41 (20.5%) |
| 4.0x or more | 62 (25.2%) | 16 (8.0%) |
| Total | 246 (100.0%) | 200 (100.0%) |
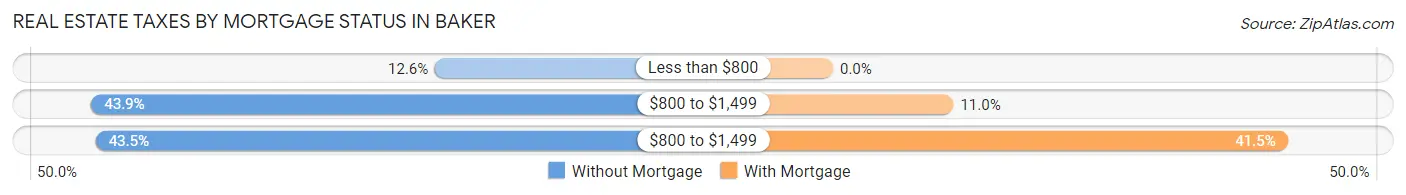
Real Estate Taxes by Mortgage Status in Baker
| Property Taxes | Without Mortgage | With Mortgage |
| Less than $800 | 31 (12.6%) | 0 (0.0%) |
| $800 to $1,499 | 108 (43.9%) | 22 (11.0%) |
| $800 to $1,499 | 107 (43.5%) | 83 (41.5%) |
| Total | 246 (100.0%) | 200 (100.0%) |
Health & Disability in Baker
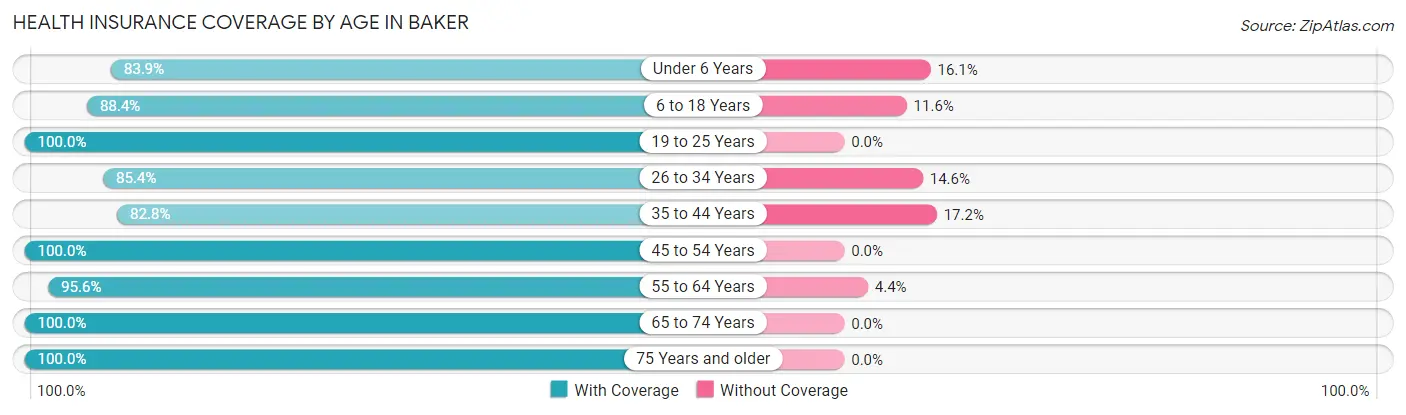
Health Insurance Coverage by Age in Baker
| Age Bracket | With Coverage | Without Coverage |
| Under 6 Years | 146 (83.9%) | 28 (16.1%) |
| 6 to 18 Years | 114 (88.4%) | 15 (11.6%) |
| 19 to 25 Years | 180 (100.0%) | 0 (0.0%) |
| 26 to 34 Years | 204 (85.4%) | 35 (14.6%) |
| 35 to 44 Years | 96 (82.8%) | 20 (17.2%) |
| 45 to 54 Years | 132 (100.0%) | 0 (0.0%) |
| 55 to 64 Years | 196 (95.6%) | 9 (4.4%) |
| 65 to 74 Years | 165 (100.0%) | 0 (0.0%) |
| 75 Years and older | 82 (100.0%) | 0 (0.0%) |
| Total | 1,315 (92.5%) | 107 (7.5%) |
Health Insurance Coverage by Citizenship Status in Baker
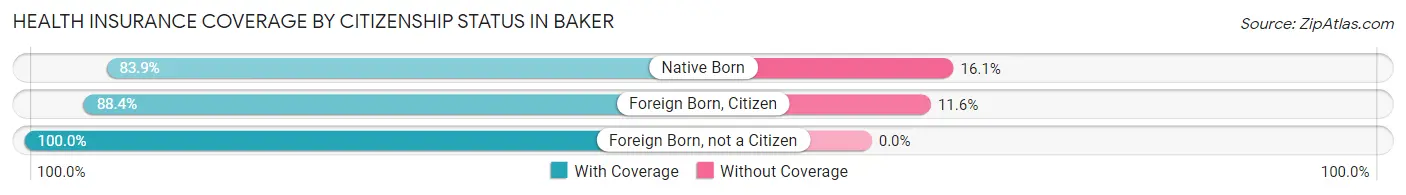
| Citizenship Status | With Coverage | Without Coverage |
| Native Born | 146 (83.9%) | 28 (16.1%) |
| Foreign Born, Citizen | 114 (88.4%) | 15 (11.6%) |
| Foreign Born, not a Citizen | 180 (100.0%) | 0 (0.0%) |
Health Insurance Coverage by Household Income in Baker
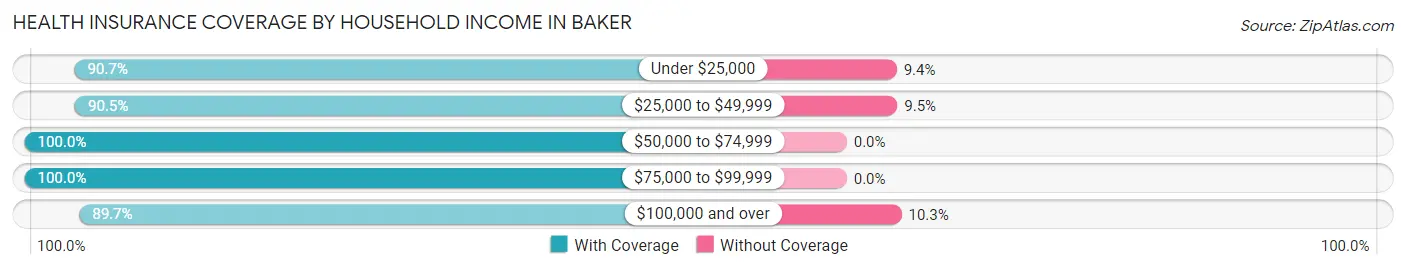
| Household Income | With Coverage | Without Coverage |
| Under $25,000 | 194 (90.6%) | 20 (9.3%) |
| $25,000 to $49,999 | 86 (90.5%) | 9 (9.5%) |
| $50,000 to $74,999 | 117 (100.0%) | 0 (0.0%) |
| $75,000 to $99,999 | 228 (100.0%) | 0 (0.0%) |
| $100,000 and over | 682 (89.7%) | 78 (10.3%) |
Public vs Private Health Insurance Coverage by Age in Baker
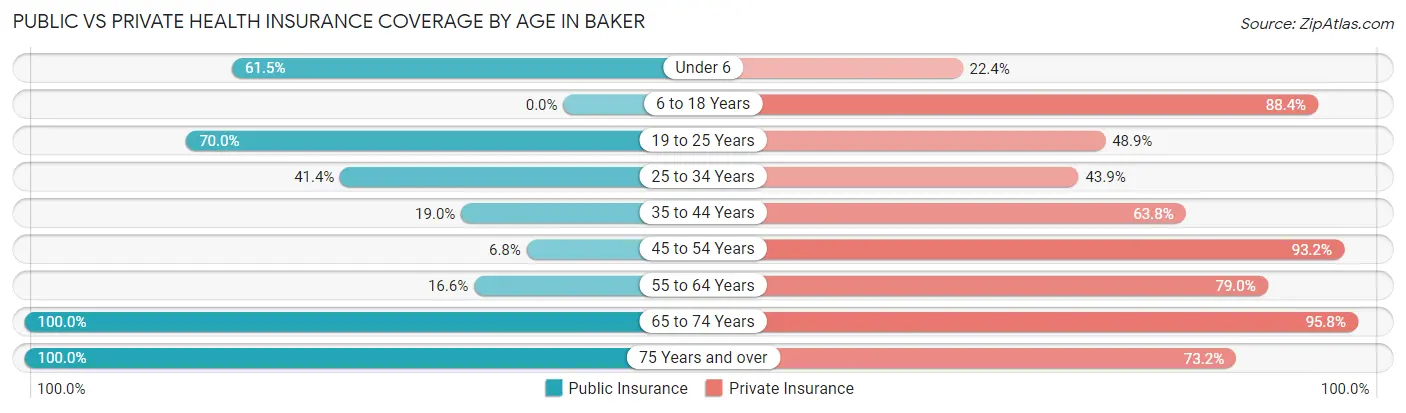
| Age Bracket | Public Insurance | Private Insurance |
| Under 6 | 107 (61.5%) | 39 (22.4%) |
| 6 to 18 Years | 0 (0.0%) | 114 (88.4%) |
| 19 to 25 Years | 126 (70.0%) | 88 (48.9%) |
| 25 to 34 Years | 99 (41.4%) | 105 (43.9%) |
| 35 to 44 Years | 22 (19.0%) | 74 (63.8%) |
| 45 to 54 Years | 9 (6.8%) | 123 (93.2%) |
| 55 to 64 Years | 34 (16.6%) | 162 (79.0%) |
| 65 to 74 Years | 165 (100.0%) | 158 (95.8%) |
| 75 Years and over | 82 (100.0%) | 60 (73.2%) |
| Total | 644 (45.3%) | 923 (64.9%) |
Disability Status by Sex by Age in Baker
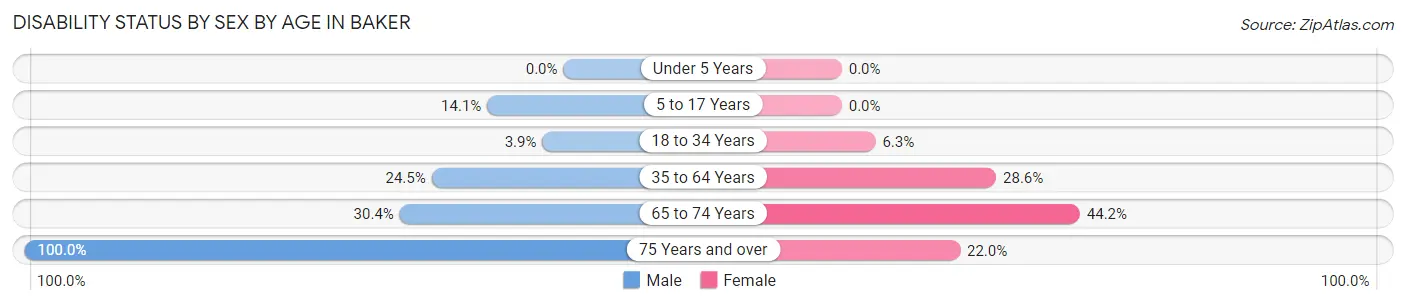
| Age Bracket | Male | Female |
| Under 5 Years | 0 (0.0%) | 0 (0.0%) |
| 5 to 17 Years | 14 (14.1%) | 0 (0.0%) |
| 18 to 34 Years | 7 (3.9%) | 15 (6.2%) |
| 35 to 64 Years | 57 (24.5%) | 63 (28.6%) |
| 65 to 74 Years | 24 (30.4%) | 38 (44.2%) |
| 75 Years and over | 41 (100.0%) | 9 (22.0%) |
Disability Class by Sex by Age in Baker
Disability Class: Hearing Difficulty
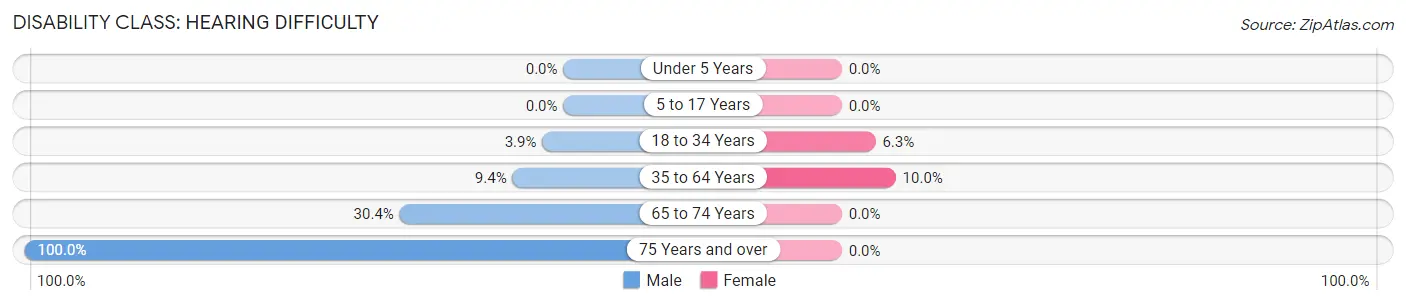
| Age Bracket | Male | Female |
| Under 5 Years | 0 (0.0%) | 0 (0.0%) |
| 5 to 17 Years | 0 (0.0%) | 0 (0.0%) |
| 18 to 34 Years | 7 (3.9%) | 15 (6.2%) |
| 35 to 64 Years | 22 (9.4%) | 22 (10.0%) |
| 65 to 74 Years | 24 (30.4%) | 0 (0.0%) |
| 75 Years and over | 41 (100.0%) | 0 (0.0%) |
Disability Class: Vision Difficulty
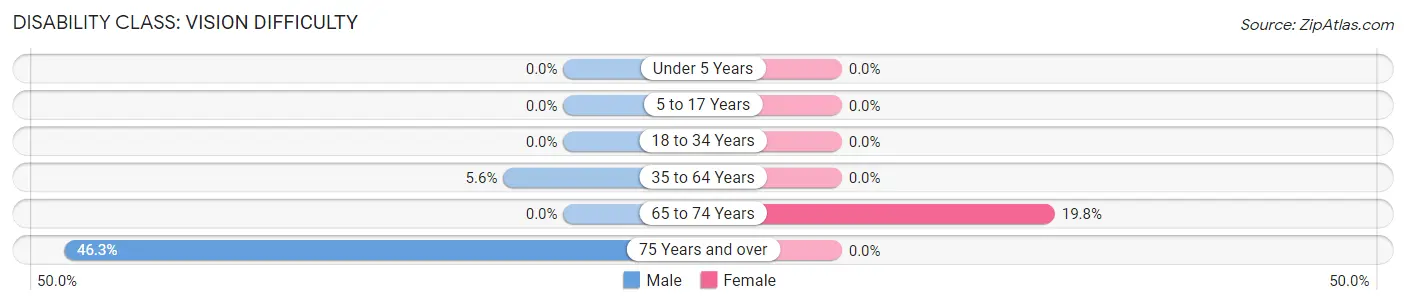
| Age Bracket | Male | Female |
| Under 5 Years | 0 (0.0%) | 0 (0.0%) |
| 5 to 17 Years | 0 (0.0%) | 0 (0.0%) |
| 18 to 34 Years | 0 (0.0%) | 0 (0.0%) |
| 35 to 64 Years | 13 (5.6%) | 0 (0.0%) |
| 65 to 74 Years | 0 (0.0%) | 17 (19.8%) |
| 75 Years and over | 19 (46.3%) | 0 (0.0%) |
Disability Class: Cognitive Difficulty
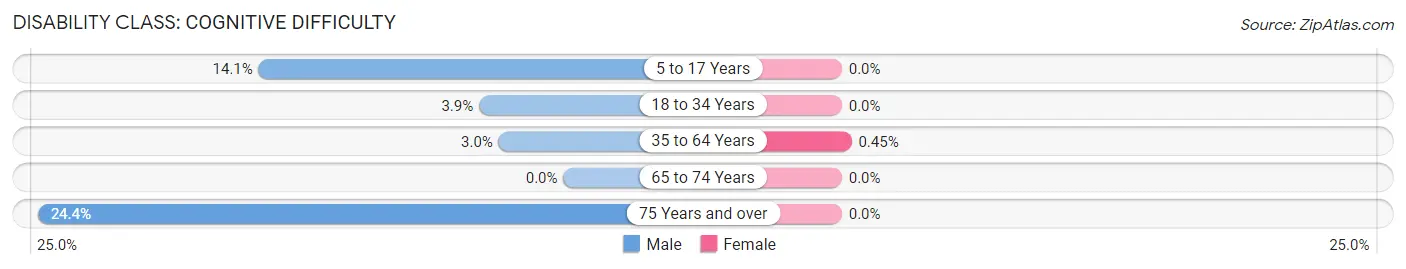
| Age Bracket | Male | Female |
| 5 to 17 Years | 14 (14.1%) | 0 (0.0%) |
| 18 to 34 Years | 7 (3.9%) | 0 (0.0%) |
| 35 to 64 Years | 7 (3.0%) | 1 (0.4%) |
| 65 to 74 Years | 0 (0.0%) | 0 (0.0%) |
| 75 Years and over | 10 (24.4%) | 0 (0.0%) |
Disability Class: Ambulatory Difficulty
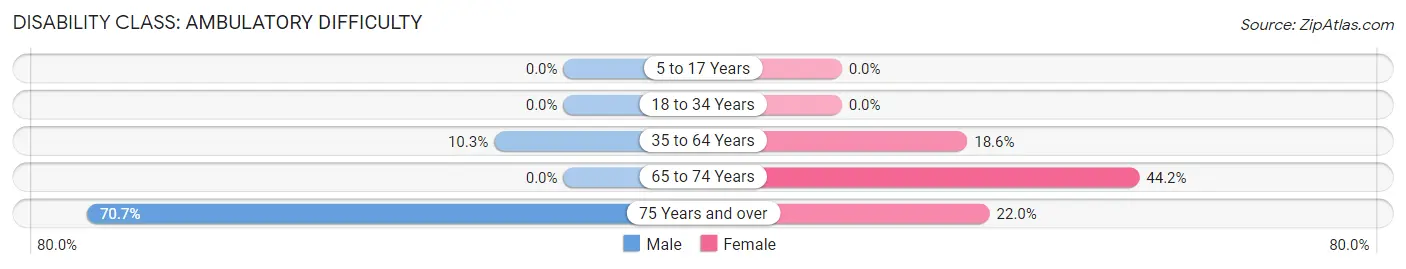
| Age Bracket | Male | Female |
| 5 to 17 Years | 0 (0.0%) | 0 (0.0%) |
| 18 to 34 Years | 0 (0.0%) | 0 (0.0%) |
| 35 to 64 Years | 24 (10.3%) | 41 (18.6%) |
| 65 to 74 Years | 0 (0.0%) | 38 (44.2%) |
| 75 Years and over | 29 (70.7%) | 9 (22.0%) |
Disability Class: Self-Care Difficulty
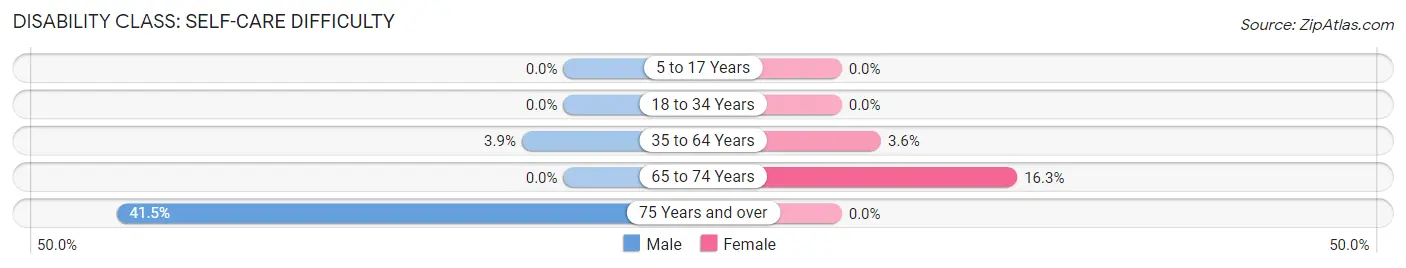
| Age Bracket | Male | Female |
| 5 to 17 Years | 0 (0.0%) | 0 (0.0%) |
| 18 to 34 Years | 0 (0.0%) | 0 (0.0%) |
| 35 to 64 Years | 9 (3.9%) | 8 (3.6%) |
| 65 to 74 Years | 0 (0.0%) | 14 (16.3%) |
| 75 Years and over | 17 (41.5%) | 0 (0.0%) |
Technology Access in Baker
Computing Device Access in Baker
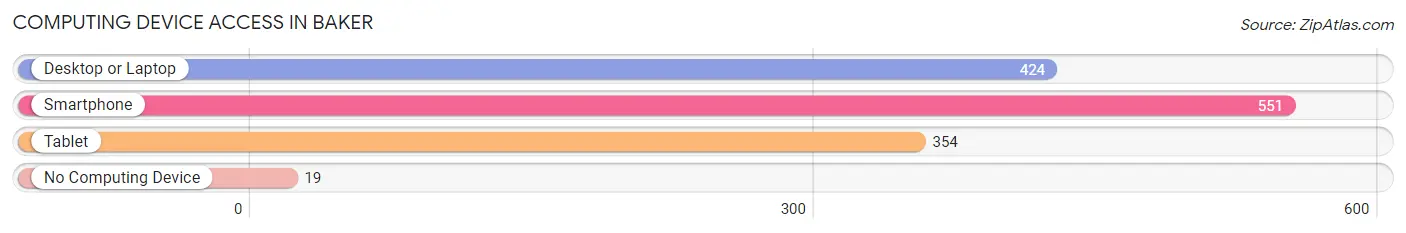
| Device Type | # Households | % Households |
| Desktop or Laptop | 424 | 70.7% |
| Smartphone | 551 | 91.8% |
| Tablet | 354 | 59.0% |
| No Computing Device | 19 | 3.2% |
| Total | 600 | 100.0% |
Internet Access in Baker
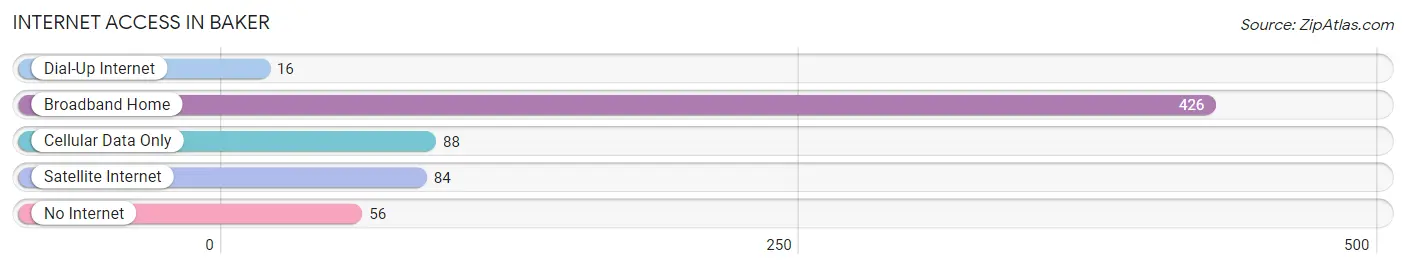
| Internet Type | # Households | % Households |
| Dial-Up Internet | 16 | 2.7% |
| Broadband Home | 426 | 71.0% |
| Cellular Data Only | 88 | 14.7% |
| Satellite Internet | 84 | 14.0% |
| No Internet | 56 | 9.3% |
| Total | 600 | 100.0% |
Baker Summary
Baker, Montana is a small city located in Fallon County, in the eastern part of the state. It is situated on the banks of the Missouri River, and is the county seat of Fallon County. The city has a population of 1,717 people, according to the 2010 census.
History
The area around Baker was first settled in the late 1800s, when homesteaders began to move into the area. The town was officially founded in 1887, and was named after the Baker family, who were among the first settlers in the area. The town was incorporated in 1889, and the first post office was established in 1890.
In the early 1900s, Baker was a thriving agricultural community, with a variety of crops being grown in the area. The town also had a number of businesses, including a bank, a hotel, a newspaper, and a variety of stores.
In the 1920s, the Great Northern Railway built a line through Baker, connecting it to other towns in the area. This allowed for increased trade and commerce, and helped to further develop the town.
Geography
Baker is located in the eastern part of Montana, in Fallon County. It is situated on the banks of the Missouri River, and is surrounded by rolling hills and prairies. The city has a total area of 1.2 square miles, all of which is land.
The climate in Baker is semi-arid, with hot summers and cold winters. The average annual temperature is around 48 degrees Fahrenheit, and the average annual precipitation is around 13 inches.
Economy
The economy of Baker is largely based on agriculture and tourism. The town is home to a number of farms, which produce a variety of crops, including wheat, barley, oats, and hay. The town also has a number of tourist attractions, including the Baker Museum, the Fallon County Historical Society, and the Baker County Fairgrounds.
The town also has a number of businesses, including restaurants, hotels, and retail stores. The town is also home to a number of manufacturing companies, which produce a variety of products, including furniture, clothing, and electronics.
Demographics
According to the 2010 census, the population of Baker was 1,717 people. The racial makeup of the town was 95.3% White, 0.6% African American, 0.3% Native American, 0.2% Asian, 0.1% Pacific Islander, 0.7% from other races, and 2.8% from two or more races. The median household income in Baker was $37,917, and the median family income was $45,625.
Conclusion
Baker, Montana is a small city located in Fallon County, in the eastern part of the state. It is situated on the banks of the Missouri River, and is the county seat of Fallon County. The city has a population of 1,717 people, according to the 2010 census. The economy of Baker is largely based on agriculture and tourism, and the town is home to a number of businesses, including restaurants, hotels, and retail stores. The racial makeup of the town is 95.3% White, 0.6% African American, 0.3% Native American, 0.2% Asian, 0.1% Pacific Islander, 0.7% from other races, and 2.8% from two or more races. The median household income in Baker was $37,917, and the median family income was $45,625.
Common Questions
What is Per Capita Income in Baker?
Per Capita income in Baker is $41,742.
What is the Median Family Income in Baker?
Median Family Income in Baker is $114,688.
What is the Median Household income in Baker?
Median Household Income in Baker is $96,667.
What is Income or Wage Gap in Baker?
Income or Wage Gap in Baker is 51.8%.
Women in Baker earn 48.2 cents for every dollar earned by a man.
What is Inequality or Gini Index in Baker?
Inequality or Gini Index in Baker is 0.43.
What is the Total Population of Baker?
Total Population of Baker is 1,500.
What is the Total Male Population of Baker?
Total Male Population of Baker is 720.
What is the Total Female Population of Baker?
Total Female Population of Baker is 780.
What is the Ratio of Males per 100 Females in Baker?
There are 92.31 Males per 100 Females in Baker.
What is the Ratio of Females per 100 Males in Baker?
There are 108.33 Females per 100 Males in Baker.
What is the Median Population Age in Baker?
Median Population Age in Baker is 35.6 Years.
What is the Average Family Size in Baker
Average Family Size in Baker is 3.1 People.
What is the Average Household Size in Baker
Average Household Size in Baker is 2.4 People.
How Large is the Labor Force in Baker?
There are 708 People in the Labor Forcein in Baker.
What is the Percentage of People in the Labor Force in Baker?
59.3% of People are in the Labor Force in Baker.