Virgil, KS Map & Demographics
Virgil Map
Virgil Overview
$37,782
PER CAPITA INCOME
$77,083
AVG FAMILY INCOME
$43,750
AVG HOUSEHOLD INCOME
0.28
INEQUALITY / GINI INDEX
33
TOTAL POPULATION
8
MALE POPULATION
25
FEMALE POPULATION
32.00
MALES / 100 FEMALES
312.50
FEMALES / 100 MALES
64.5
MEDIAN AGE
2.7
AVG FAMILY SIZE
1.6
AVG HOUSEHOLD SIZE
18
LABOR FORCE [ PEOPLE ]
54.5%
PERCENT IN LABOR FORCE
Virgil Zip Codes
Virgil Area Codes
Income in Virgil
Income Overview in Virgil
Per Capita Income in Virgil is $37,782, while median incomes of families and households are $77,083 and $43,750 respectively.
| Characteristic | Number | Measure |
| Per Capita Income | 33 | $37,782 |
| Median Family Income | 7 | $77,083 |
| Mean Family Income | 7 | $83,114 |
| Median Household Income | 21 | $43,750 |
| Mean Household Income | 21 | $54,243 |
| Income Deficit | 7 | $0 |
| Wage / Income Gap (%) | 33 | 0.00% |
| Wage / Income Gap ($) | 33 | 100.00¢ per $1 |
| Gini / Inequality Index | 33 | 0.28 |
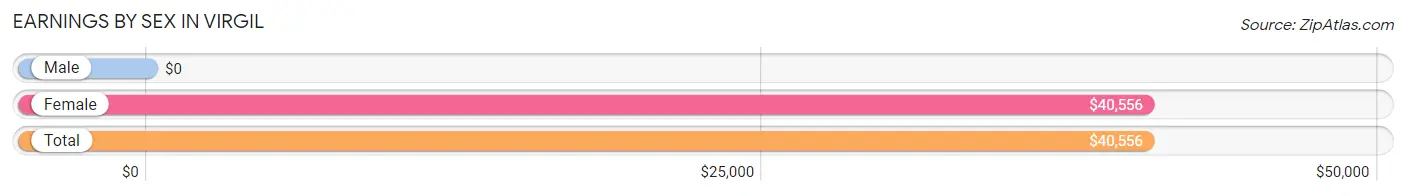
Earnings by Sex in Virgil
| Sex | Number | Average Earnings |
| Male | 0 (0.0%) | $0 |
| Female | 18 (100.0%) | $40,556 |
| Total | 18 (100.0%) | $40,556 |
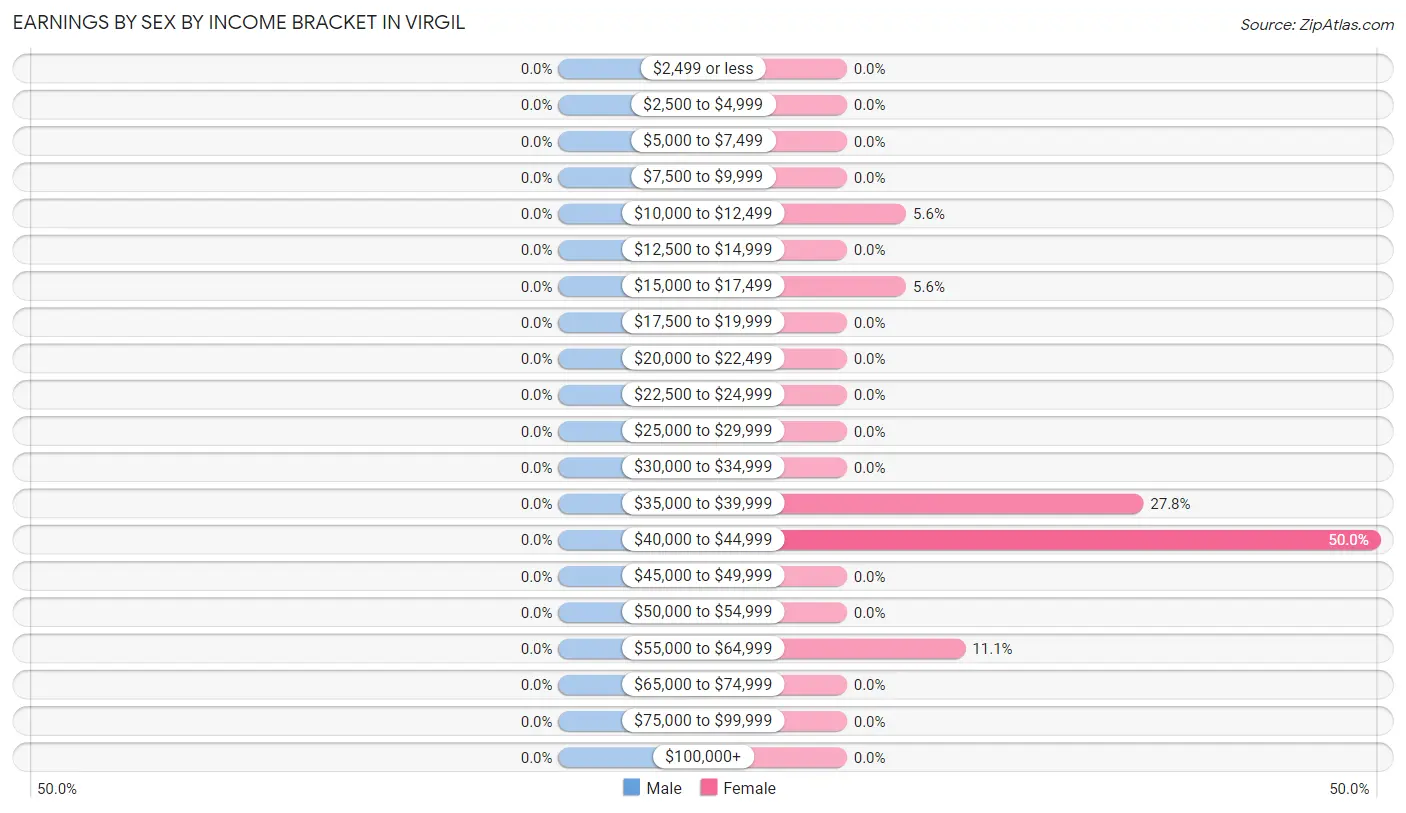
Earnings by Sex by Income Bracket in Virgil
| Income | Male | Female |
| $2,499 or less | 0 (0.0%) | 0 (0.0%) |
| $2,500 to $4,999 | 0 (0.0%) | 0 (0.0%) |
| $5,000 to $7,499 | 0 (0.0%) | 0 (0.0%) |
| $7,500 to $9,999 | 0 (0.0%) | 0 (0.0%) |
| $10,000 to $12,499 | 0 (0.0%) | 1 (5.6%) |
| $12,500 to $14,999 | 0 (0.0%) | 0 (0.0%) |
| $15,000 to $17,499 | 0 (0.0%) | 1 (5.6%) |
| $17,500 to $19,999 | 0 (0.0%) | 0 (0.0%) |
| $20,000 to $22,499 | 0 (0.0%) | 0 (0.0%) |
| $22,500 to $24,999 | 0 (0.0%) | 0 (0.0%) |
| $25,000 to $29,999 | 0 (0.0%) | 0 (0.0%) |
| $30,000 to $34,999 | 0 (0.0%) | 0 (0.0%) |
| $35,000 to $39,999 | 0 (0.0%) | 5 (27.8%) |
| $40,000 to $44,999 | 0 (0.0%) | 9 (50.0%) |
| $45,000 to $49,999 | 0 (0.0%) | 0 (0.0%) |
| $50,000 to $54,999 | 0 (0.0%) | 0 (0.0%) |
| $55,000 to $64,999 | 0 (0.0%) | 2 (11.1%) |
| $65,000 to $74,999 | 0 (0.0%) | 0 (0.0%) |
| $75,000 to $99,999 | 0 (0.0%) | 0 (0.0%) |
| $100,000+ | 0 (0.0%) | 0 (0.0%) |
| Total | 0 (0.0%) | 18 (100.0%) |
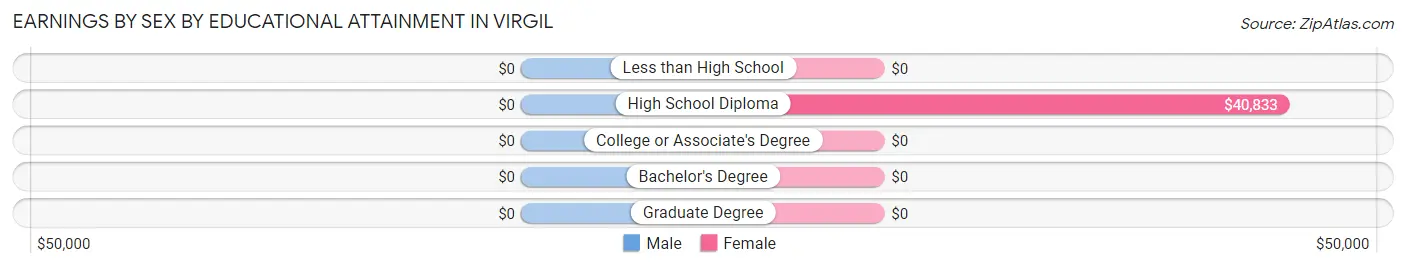
Earnings by Sex by Educational Attainment in Virgil
| Educational Attainment | Male Income | Female Income |
| Less than High School | - | - |
| High School Diploma | - | - |
| College or Associate's Degree | - | - |
| Bachelor's Degree | - | - |
| Graduate Degree | - | - |
| Total | - | - |
Family Income in Virgil
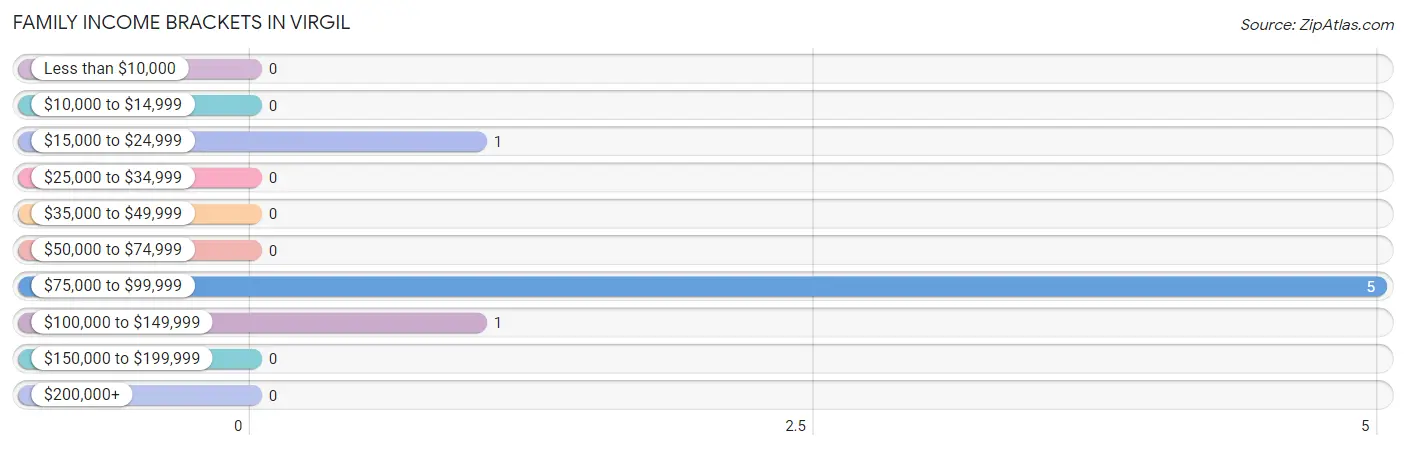
Family Income Brackets in Virgil
According to the Virgil family income data, there are 5 families falling into the $75,000 to $99,999 income range, which is the most common income bracket and makes up 71.4% of all families.
| Income Bracket | # Families | % Families |
| Less than $10,000 | 0 | 0.0% |
| $10,000 to $14,999 | 0 | 0.0% |
| $15,000 to $24,999 | 1 | 14.3% |
| $25,000 to $34,999 | 0 | 0.0% |
| $35,000 to $49,999 | 0 | 0.0% |
| $50,000 to $74,999 | 0 | 0.0% |
| $75,000 to $99,999 | 5 | 71.4% |
| $100,000 to $149,999 | 1 | 14.3% |
| $150,000 to $199,999 | 0 | 0.0% |
| $200,000+ | 0 | 0.0% |
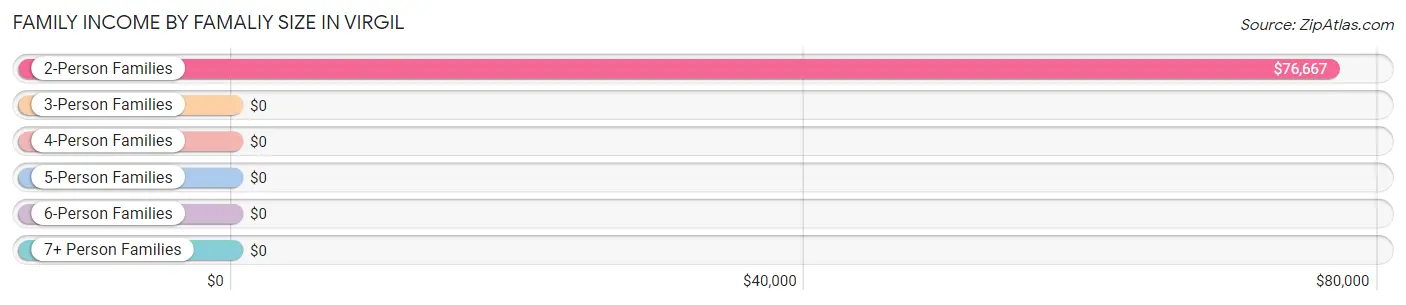
Family Income by Famaliy Size in Virgil
2-person families (6 | 85.7%) account for the highest median family income in Virgil with $76,667 per family, while 2-person families (6 | 85.7%) have the highest median income of $38,334 per family member.
| Income Bracket | # Families | Median Income |
| 2-Person Families | 6 (85.7%) | $76,667 |
| 3-Person Families | 1 (14.3%) | $0 |
| 4-Person Families | 0 (0.0%) | $0 |
| 5-Person Families | 0 (0.0%) | $0 |
| 6-Person Families | 0 (0.0%) | $0 |
| 7+ Person Families | 0 (0.0%) | $0 |
| Total | 7 (100.0%) | $77,083 |
Family Income by Number of Earners in Virgil
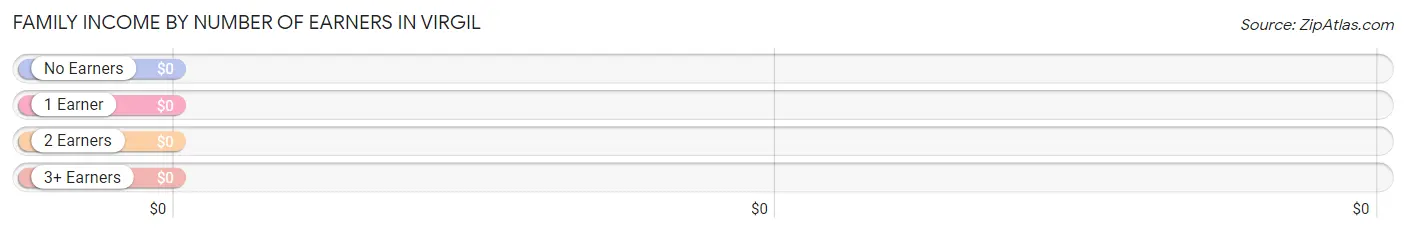
| Number of Earners | # Families | Median Income |
| No Earners | 2 (28.6%) | $0 |
| 1 Earner | 3 (42.9%) | $0 |
| 2 Earners | 2 (28.6%) | $0 |
| 3+ Earners | 0 (0.0%) | $0 |
| Total | 7 (100.0%) | $77,083 |
Household Income in Virgil
Household Income Brackets in Virgil
With 9 households falling in the category, the $35,000 to $49,999 income range is the most frequent in Virgil, accounting for 42.9% of all households.
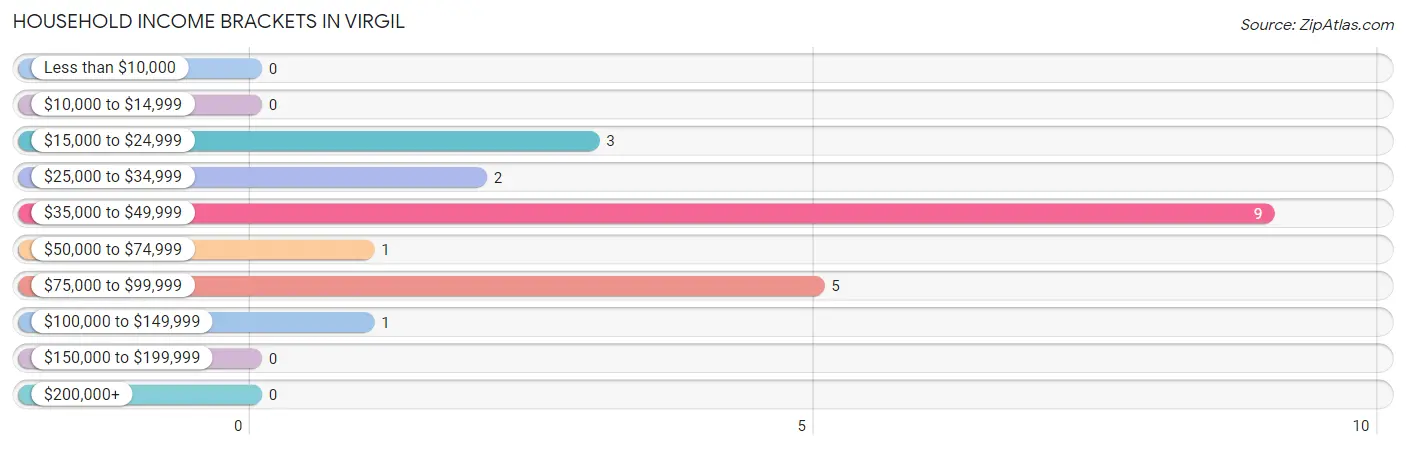
| Income Bracket | # Households | % Households |
| Less than $10,000 | 0 | 0.0% |
| $10,000 to $14,999 | 0 | 0.0% |
| $15,000 to $24,999 | 3 | 14.3% |
| $25,000 to $34,999 | 2 | 9.5% |
| $35,000 to $49,999 | 9 | 42.9% |
| $50,000 to $74,999 | 1 | 4.8% |
| $75,000 to $99,999 | 5 | 23.8% |
| $100,000 to $149,999 | 1 | 4.8% |
| $150,000 to $199,999 | 0 | 0.0% |
| $200,000+ | 0 | 0.0% |
Household Income by Householder Age in Virgil
The median household income in Virgil is $43,750, with the highest median household income of $31,875 found in the 65+ years age bracket for the primary householder. A total of 9 households (42.9%) fall into this category.
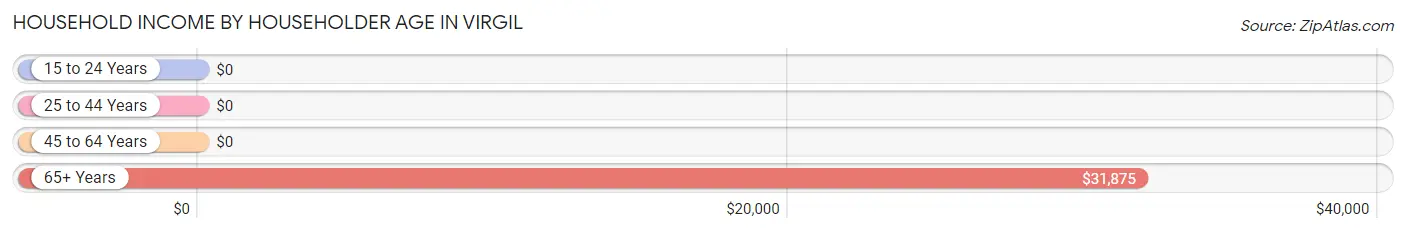
| Income Bracket | # Households | Median Income |
| 15 to 24 Years | 0 (0.0%) | $0 |
| 25 to 44 Years | 2 (9.5%) | $0 |
| 45 to 64 Years | 10 (47.6%) | $0 |
| 65+ Years | 9 (42.9%) | $31,875 |
| Total | 21 (100.0%) | $43,750 |
Poverty in Virgil
Income Below Poverty by Sex and Age in Virgil
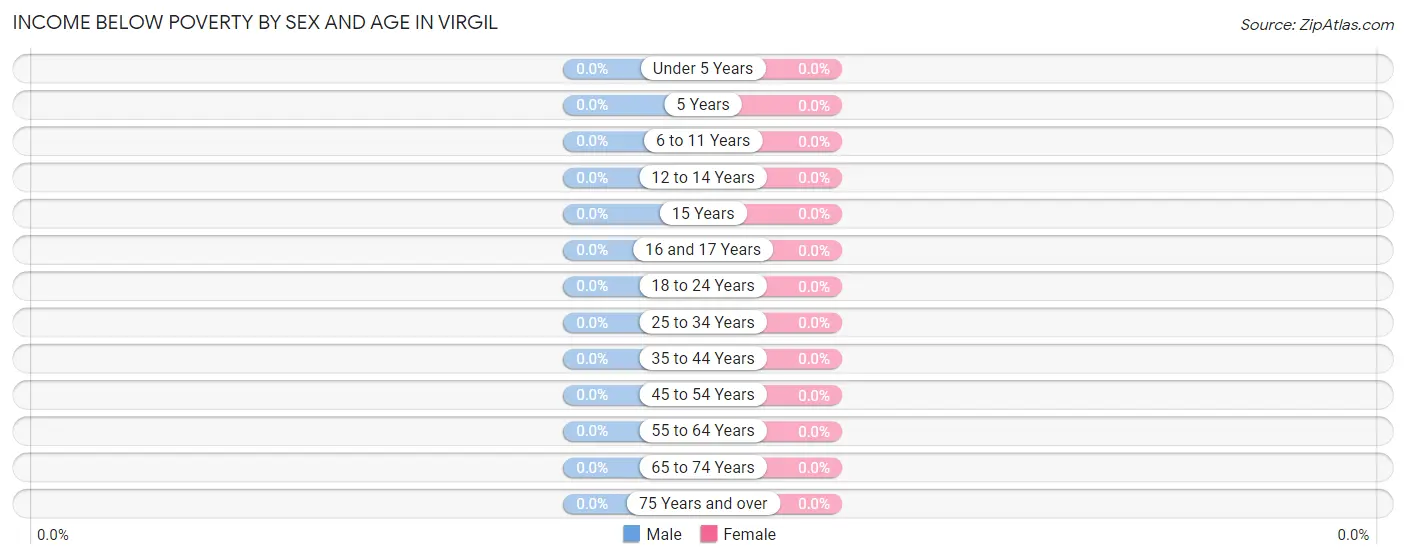
| Age Bracket | Male | Female |
| Under 5 Years | 0 (0.0%) | 0 (0.0%) |
| 5 Years | 0 (0.0%) | 0 (0.0%) |
| 6 to 11 Years | 0 (0.0%) | 0 (0.0%) |
| 12 to 14 Years | 0 (0.0%) | 0 (0.0%) |
| 15 Years | 0 (0.0%) | 0 (0.0%) |
| 16 and 17 Years | 0 (0.0%) | 0 (0.0%) |
| 18 to 24 Years | 0 (0.0%) | 0 (0.0%) |
| 25 to 34 Years | 0 (0.0%) | 0 (0.0%) |
| 35 to 44 Years | 0 (0.0%) | 0 (0.0%) |
| 45 to 54 Years | 0 (0.0%) | 0 (0.0%) |
| 55 to 64 Years | 0 (0.0%) | 0 (0.0%) |
| 65 to 74 Years | 0 (0.0%) | 0 (0.0%) |
| 75 Years and over | 0 (0.0%) | 0 (0.0%) |
| Total | 0 (0.0%) | 0 (0.0%) |
Income Above Poverty by Sex and Age in Virgil
According to the poverty statistics in Virgil, males aged 55 to 64 years and females aged 18 to 24 years are the age groups that are most secure financially, with 100.0% of males and 100.0% of females in these age groups living above the poverty line.
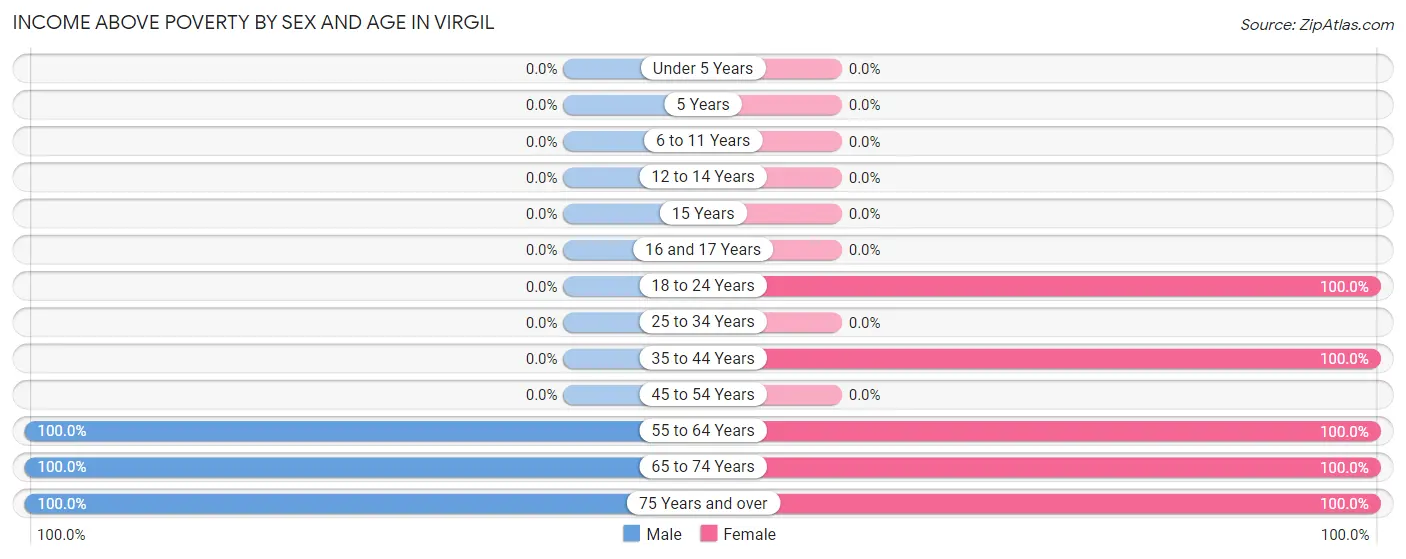
| Age Bracket | Male | Female |
| Under 5 Years | 0 (0.0%) | 0 (0.0%) |
| 5 Years | 0 (0.0%) | 0 (0.0%) |
| 6 to 11 Years | 0 (0.0%) | 0 (0.0%) |
| 12 to 14 Years | 0 (0.0%) | 0 (0.0%) |
| 15 Years | 0 (0.0%) | 0 (0.0%) |
| 16 and 17 Years | 0 (0.0%) | 0 (0.0%) |
| 18 to 24 Years | 0 (0.0%) | 5 (100.0%) |
| 25 to 34 Years | 0 (0.0%) | 0 (0.0%) |
| 35 to 44 Years | 0 (0.0%) | 2 (100.0%) |
| 45 to 54 Years | 0 (0.0%) | 0 (0.0%) |
| 55 to 64 Years | 1 (100.0%) | 9 (100.0%) |
| 65 to 74 Years | 4 (100.0%) | 1 (100.0%) |
| 75 Years and over | 3 (100.0%) | 8 (100.0%) |
| Total | 8 (100.0%) | 25 (100.0%) |
Income Below Poverty Among Married-Couple Families in Virgil
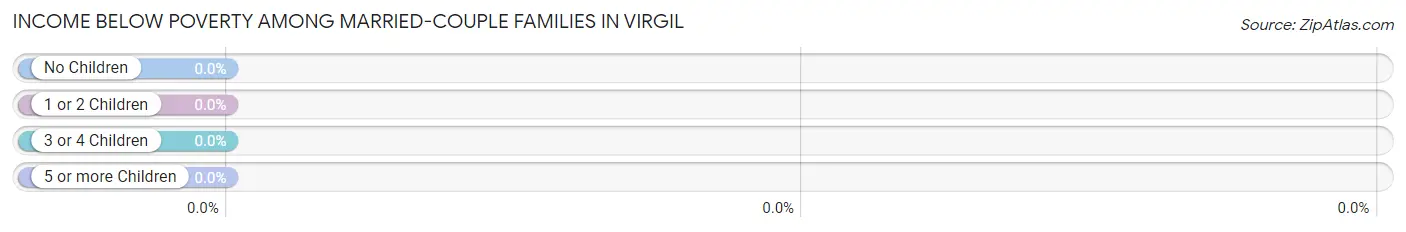
| Children | Above Poverty | Below Poverty |
| No Children | 6 (100.0%) | 0 (0.0%) |
| 1 or 2 Children | 0 (0.0%) | 0 (0.0%) |
| 3 or 4 Children | 0 (0.0%) | 0 (0.0%) |
| 5 or more Children | 0 (0.0%) | 0 (0.0%) |
| Total | 6 (100.0%) | 0 (0.0%) |
Income Below Poverty Among Single-Parent Households in Virgil
| Children | Single Father | Single Mother |
| No Children | 0 (0.0%) | 0 (0.0%) |
| 1 or 2 Children | 0 (0.0%) | 0 (0.0%) |
| 3 or 4 Children | 0 (0.0%) | 0 (0.0%) |
| 5 or more Children | 0 (0.0%) | 0 (0.0%) |
| Total | 0 (0.0%) | 0 (0.0%) |
Income Below Poverty Among Married-Couple vs Single-Parent Households in Virgil
| Children | Married-Couple Families | Single-Parent Households |
| No Children | 0 (0.0%) | 0 (0.0%) |
| 1 or 2 Children | 0 (0.0%) | 0 (0.0%) |
| 3 or 4 Children | 0 (0.0%) | 0 (0.0%) |
| 5 or more Children | 0 (0.0%) | 0 (0.0%) |
| Total | 0 (0.0%) | 0 (0.0%) |
Race in Virgil
The most populous races in Virgil are , and White / Caucasian (33 | 100.0%).
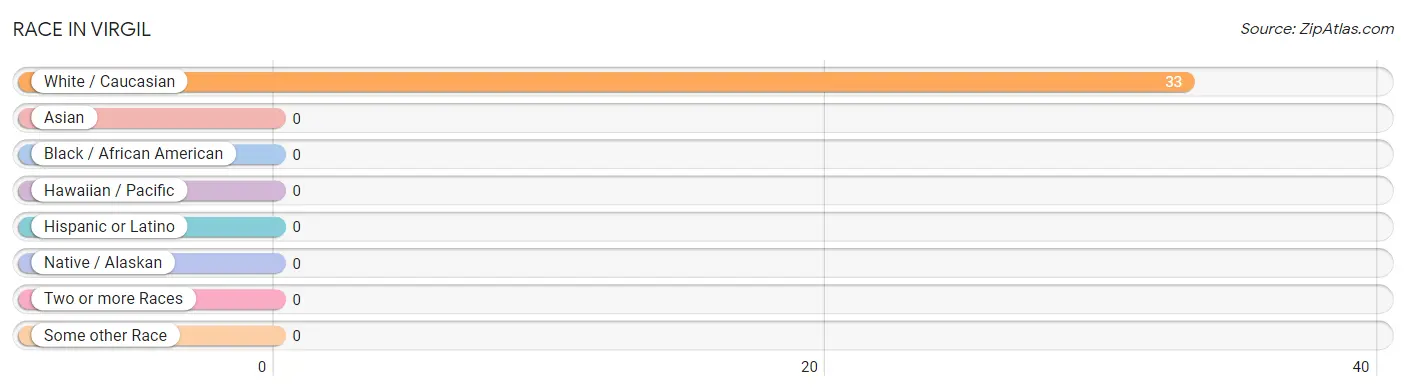
| Race | # Population | % Population |
| Asian | 0 | 0.0% |
| Black / African American | 0 | 0.0% |
| Hawaiian / Pacific | 0 | 0.0% |
| Hispanic or Latino | 0 | 0.0% |
| Native / Alaskan | 0 | 0.0% |
| White / Caucasian | 33 | 100.0% |
| Two or more Races | 0 | 0.0% |
| Some other Race | 0 | 0.0% |
| Total | 33 | 100.0% |
Ancestry in Virgil
The most populous ancestries reported in Virgil are English (11 | 33.3%), American (4 | 12.1%), German (4 | 12.1%), Dutch (1 | 3.0%), and Irish (1 | 3.0%), together accounting for 63.6% of all Virgil residents.
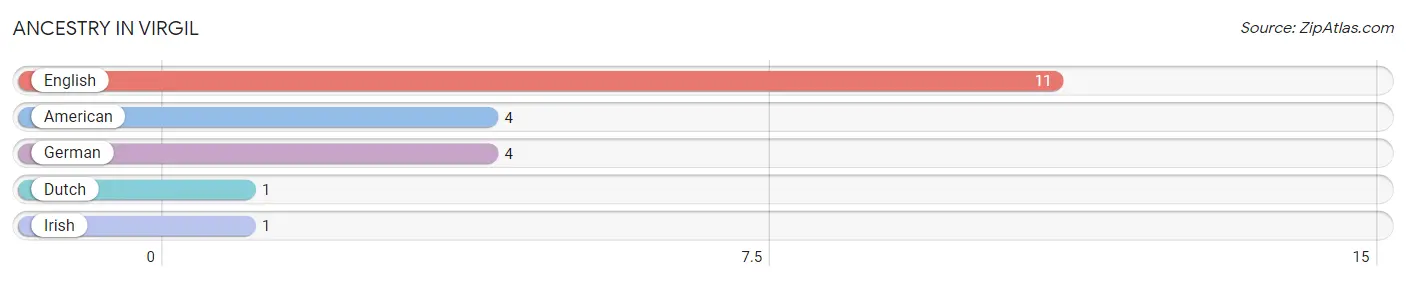
| Ancestry | # Population | % Population |
| American | 4 | 12.1% |
| Dutch | 1 | 3.0% |
| English | 11 | 33.3% |
| German | 4 | 12.1% |
| Irish | 1 | 3.0% | View All 5 Rows |
Immigrants in Virgil

| Immigration Origin | # Population | % Population | View All 0 Rows |
Sex and Age in Virgil
Sex and Age in Virgil
The most populous age groups in Virgil are 65 to 69 Years (4 | 50.0%) for men and 55 to 59 Years (9 | 36.0%) for women.
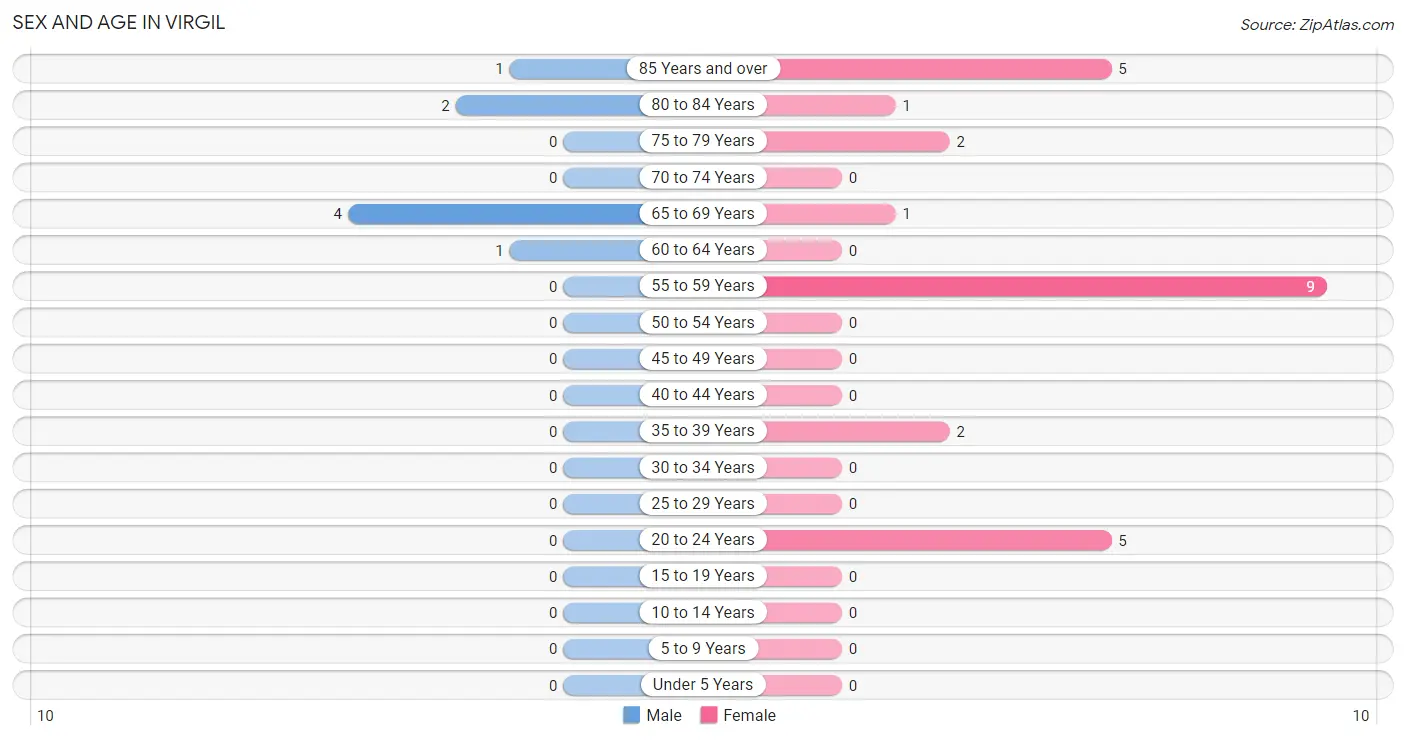
| Age Bracket | Male | Female |
| Under 5 Years | 0 (0.0%) | 0 (0.0%) |
| 5 to 9 Years | 0 (0.0%) | 0 (0.0%) |
| 10 to 14 Years | 0 (0.0%) | 0 (0.0%) |
| 15 to 19 Years | 0 (0.0%) | 0 (0.0%) |
| 20 to 24 Years | 0 (0.0%) | 5 (20.0%) |
| 25 to 29 Years | 0 (0.0%) | 0 (0.0%) |
| 30 to 34 Years | 0 (0.0%) | 0 (0.0%) |
| 35 to 39 Years | 0 (0.0%) | 2 (8.0%) |
| 40 to 44 Years | 0 (0.0%) | 0 (0.0%) |
| 45 to 49 Years | 0 (0.0%) | 0 (0.0%) |
| 50 to 54 Years | 0 (0.0%) | 0 (0.0%) |
| 55 to 59 Years | 0 (0.0%) | 9 (36.0%) |
| 60 to 64 Years | 1 (12.5%) | 0 (0.0%) |
| 65 to 69 Years | 4 (50.0%) | 1 (4.0%) |
| 70 to 74 Years | 0 (0.0%) | 0 (0.0%) |
| 75 to 79 Years | 0 (0.0%) | 2 (8.0%) |
| 80 to 84 Years | 2 (25.0%) | 1 (4.0%) |
| 85 Years and over | 1 (12.5%) | 5 (20.0%) |
| Total | 8 (100.0%) | 25 (100.0%) |
Families and Households in Virgil
Median Family Size in Virgil
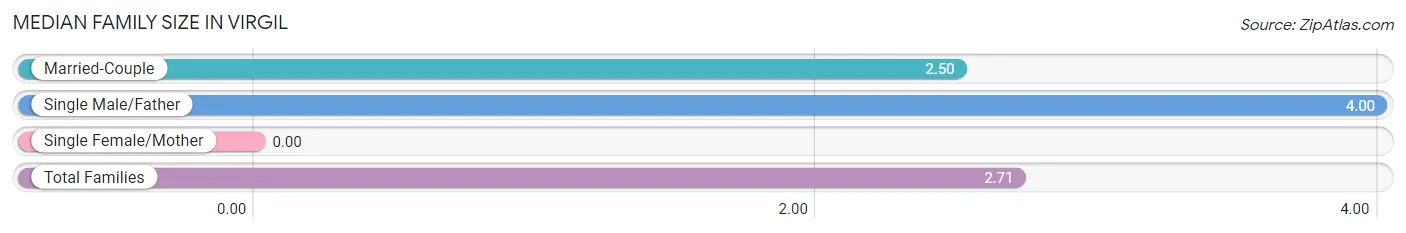
| Family Type | # Families | Family Size |
| Married-Couple | 6 (85.7%) | 2.50 |
| Single Male/Father | 1 (14.3%) | 4.00 |
| Single Female/Mother | 0 (0.0%) | - |
| Total Families | 7 (100.0%) | 2.71 |
Median Household Size in Virgil
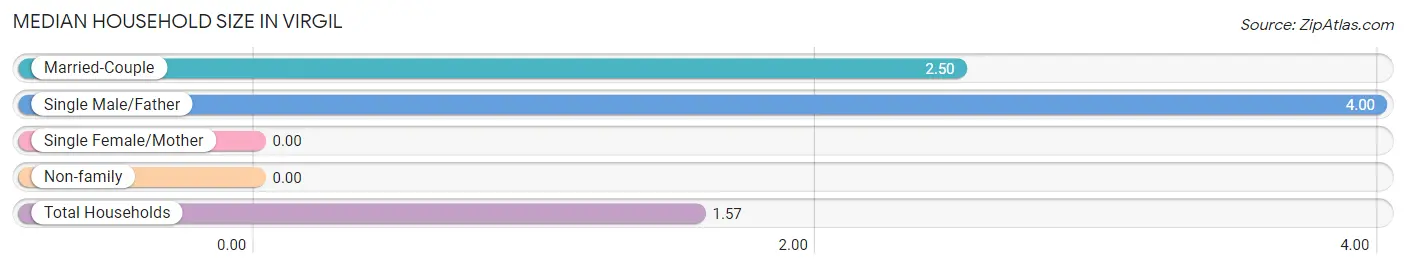
| Household Type | # Households | Household Size |
| Married-Couple | 6 (28.6%) | 2.50 |
| Single Male/Father | 1 (4.8%) | 4.00 |
| Single Female/Mother | 0 (0.0%) | - |
| Non-family | 14 (66.7%) | - |
| Total Households | 21 (100.0%) | 1.57 |
Household Size by Marriage Status in Virgil
Out of a total of 21 households in Virgil, 7 (33.3%) are family households, while 14 (66.7%) are nonfamily households. The most numerous type of family households are 2-person households, comprising 6, and the most common type of nonfamily households are 1-person households, comprising 14.
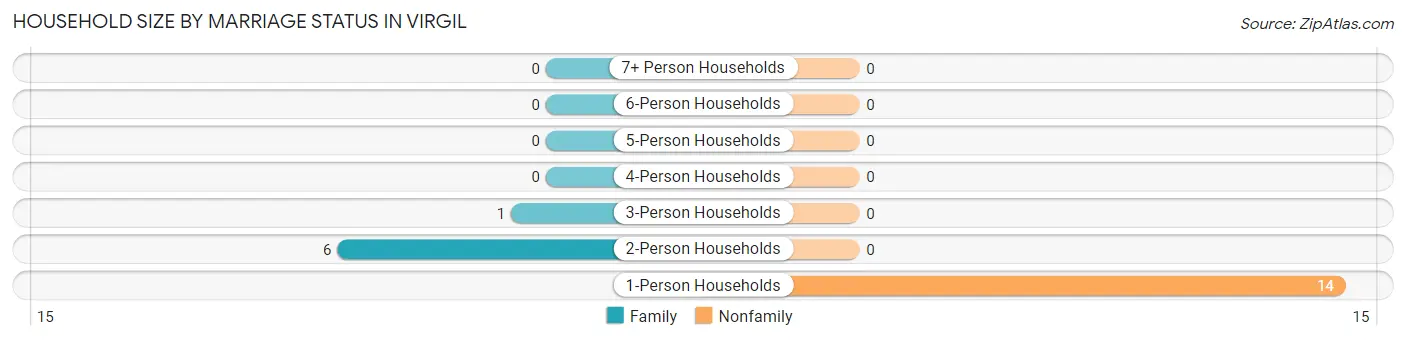
| Household Size | Family Households | Nonfamily Households |
| 1-Person Households | - | 14 (66.7%) |
| 2-Person Households | 6 (28.6%) | 0 (0.0%) |
| 3-Person Households | 1 (4.8%) | 0 (0.0%) |
| 4-Person Households | 0 (0.0%) | 0 (0.0%) |
| 5-Person Households | 0 (0.0%) | 0 (0.0%) |
| 6-Person Households | 0 (0.0%) | 0 (0.0%) |
| 7+ Person Households | 0 (0.0%) | 0 (0.0%) |
| Total | 7 (33.3%) | 14 (66.7%) |
Female Fertility in Virgil
Fertility by Age in Virgil
| Age Bracket | Women with Births | Births / 1,000 Women |
| 15 to 19 years | 0 (0.0%) | 0.0 |
| 20 to 34 years | 0 (0.0%) | 0.0 |
| 35 to 50 years | 0 (0.0%) | 0.0 |
| Total | 0 (0.0%) | 0.0 |
Fertility by Age by Marriage Status in Virgil
| Age Bracket | Married | Unmarried |
| 15 to 19 years | 0 (0.0%) | 0 (0.0%) |
| 20 to 34 years | 0 (0.0%) | 0 (0.0%) |
| 35 to 50 years | 0 (0.0%) | 0 (0.0%) |
| Total | 0 (0.0%) | 0 (0.0%) |
Fertility by Education in Virgil
| Educational Attainment | Women with Births | Births / 1,000 Women |
| Less than High School | 0 (0.0%) | 0.0 |
| High School Diploma | 0 (0.0%) | 0.0 |
| College or Associate's Degree | 0 (0.0%) | 0.0 |
| Bachelor's Degree | 0 (0.0%) | 0.0 |
| Graduate Degree | 0 (0.0%) | 0.0 |
| Total | 0 (0.0%) | 0.0 |
Fertility by Education by Marriage Status in Virgil
| Educational Attainment | Married | Unmarried |
| Less than High School | 0 (0.0%) | 0 (0.0%) |
| High School Diploma | 0 (0.0%) | 0 (0.0%) |
| College or Associate's Degree | 0 (0.0%) | 0 (0.0%) |
| Bachelor's Degree | 0 (0.0%) | 0 (0.0%) |
| Graduate Degree | 0 (0.0%) | 0 (0.0%) |
| Total | 0 (0.0%) | 0 (0.0%) |
Employment Characteristics in Virgil
Employment by Class of Employer in Virgil
Among the 18 employed individuals in Virgil, , and private company employees (18 | 100.0%) make up the most common classes of employment.
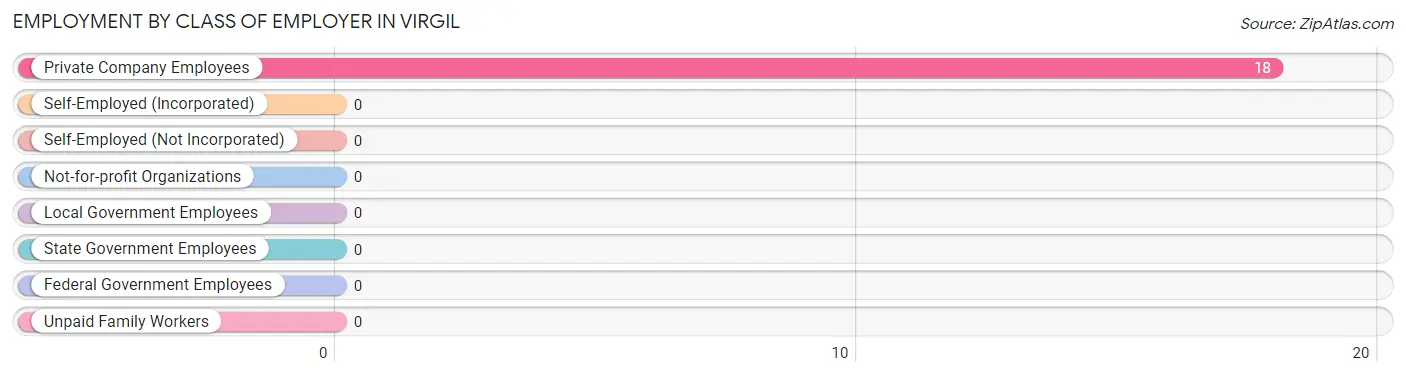
| Employer Class | # Employees | % Employees |
| Private Company Employees | 18 | 100.0% |
| Self-Employed (Incorporated) | 0 | 0.0% |
| Self-Employed (Not Incorporated) | 0 | 0.0% |
| Not-for-profit Organizations | 0 | 0.0% |
| Local Government Employees | 0 | 0.0% |
| State Government Employees | 0 | 0.0% |
| Federal Government Employees | 0 | 0.0% |
| Unpaid Family Workers | 0 | 0.0% |
| Total | 18 | 100.0% |
Employment Status by Age in Virgil
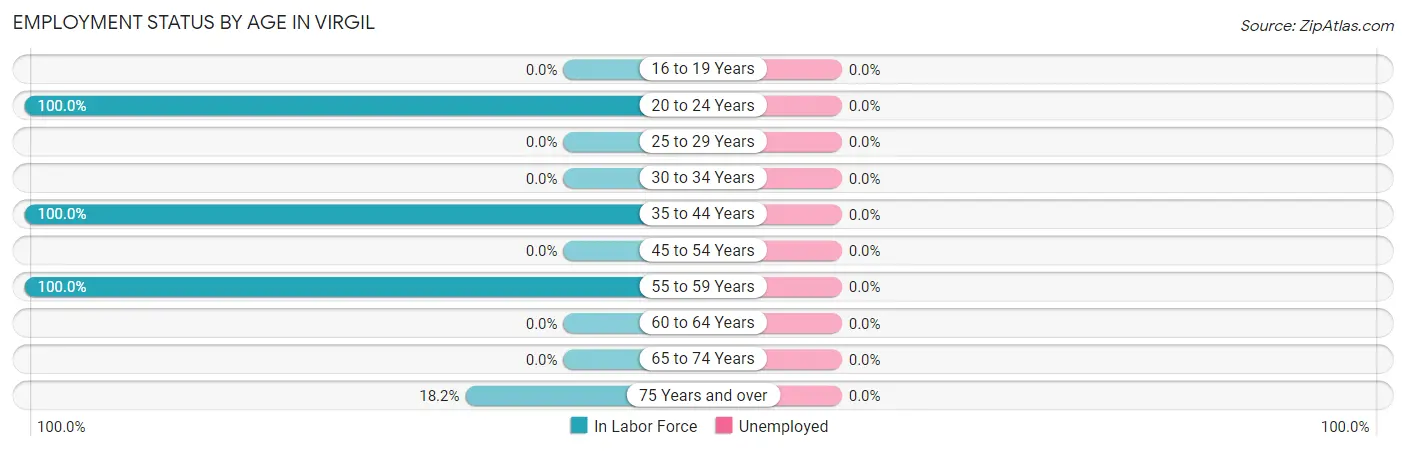
| Age Bracket | In Labor Force | Unemployed |
| 16 to 19 Years | 0 (0.0%) | 0 (0.0%) |
| 20 to 24 Years | 5 (100.0%) | 0 (0.0%) |
| 25 to 29 Years | 0 (0.0%) | 0 (0.0%) |
| 30 to 34 Years | 0 (0.0%) | 0 (0.0%) |
| 35 to 44 Years | 2 (100.0%) | 0 (0.0%) |
| 45 to 54 Years | 0 (0.0%) | 0 (0.0%) |
| 55 to 59 Years | 9 (100.0%) | 0 (0.0%) |
| 60 to 64 Years | 0 (0.0%) | 0 (0.0%) |
| 65 to 74 Years | 0 (0.0%) | 0 (0.0%) |
| 75 Years and over | 2 (18.2%) | 0 (0.0%) |
| Total | 18 (54.5%) | 0 (0.0%) |
Employment Status by Educational Attainment in Virgil
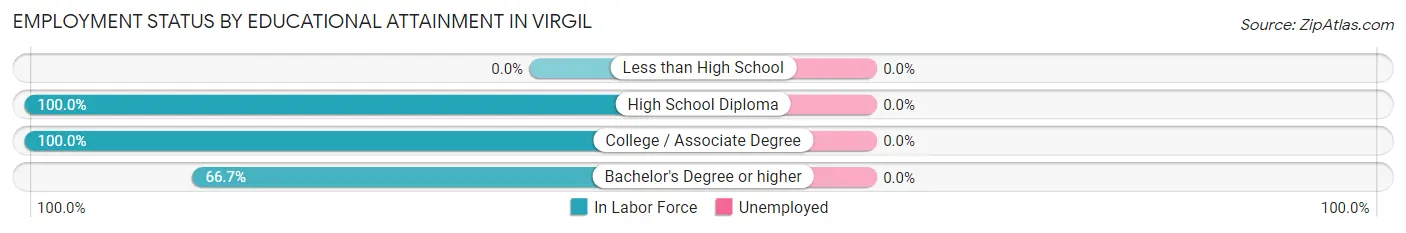
| Educational Attainment | In Labor Force | Unemployed |
| Less than High School | 0 (0.0%) | 0 (0.0%) |
| High School Diploma | 6 (100.0%) | 0 (0.0%) |
| College / Associate Degree | 3 (100.0%) | 0 (0.0%) |
| Bachelor's Degree or higher | 2 (66.7%) | 0 (0.0%) |
| Total | 11 (91.7%) | 0 (0.0%) |
Employment Occupations by Sex in Virgil
Management, Business, Science and Arts Occupations
The most common Management, Business, Science and Arts occupations in Virgil are , and Business & Financial (2 | 11.1%).
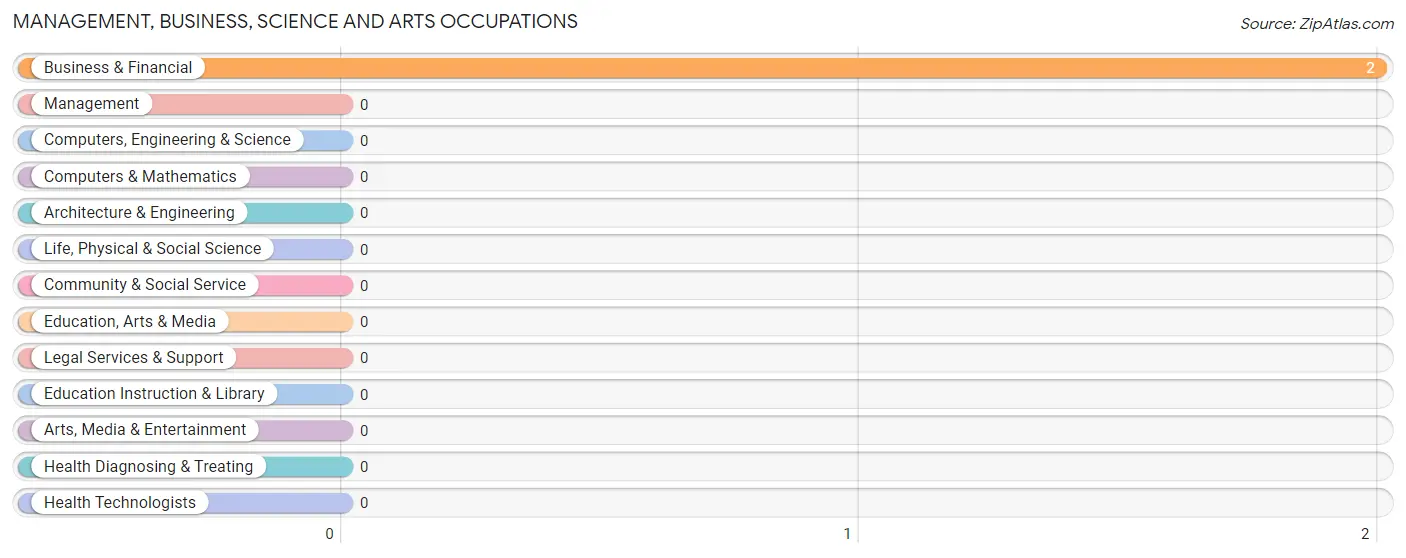
Management, Business, Science and Arts Occupations by Sex
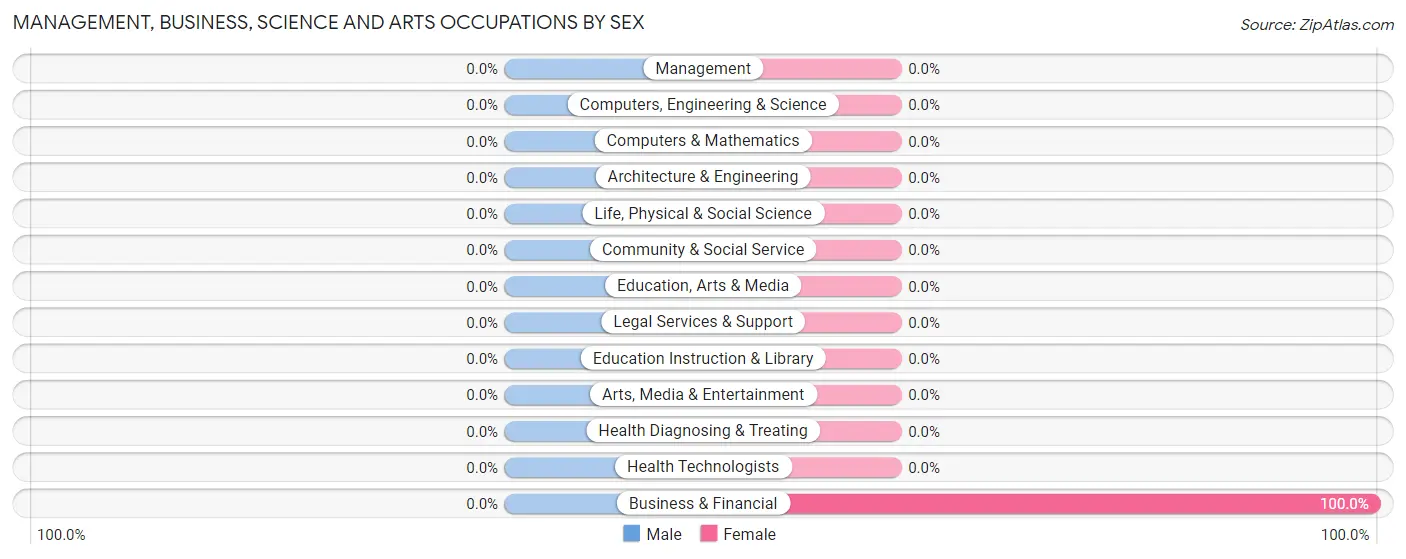
| Occupation | Male | Female |
| Management | 0 (0.0%) | 0 (0.0%) |
| Business & Financial | 0 (0.0%) | 2 (100.0%) |
| Computers, Engineering & Science | 0 (0.0%) | 0 (0.0%) |
| Computers & Mathematics | 0 (0.0%) | 0 (0.0%) |
| Architecture & Engineering | 0 (0.0%) | 0 (0.0%) |
| Life, Physical & Social Science | 0 (0.0%) | 0 (0.0%) |
| Community & Social Service | 0 (0.0%) | 0 (0.0%) |
| Education, Arts & Media | 0 (0.0%) | 0 (0.0%) |
| Legal Services & Support | 0 (0.0%) | 0 (0.0%) |
| Education Instruction & Library | 0 (0.0%) | 0 (0.0%) |
| Arts, Media & Entertainment | 0 (0.0%) | 0 (0.0%) |
| Health Diagnosing & Treating | 0 (0.0%) | 0 (0.0%) |
| Health Technologists | 0 (0.0%) | 0 (0.0%) |
| Total (Category) | 0 (0.0%) | 2 (100.0%) |
| Total (Overall) | 0 (0.0%) | 18 (100.0%) |
Services Occupations
Services Occupations by Sex
| Occupation | Male | Female |
| Healthcare Support | 0 (0.0%) | 0 (0.0%) |
| Security & Protection | 0 (0.0%) | 0 (0.0%) |
| Firefighting & Prevention | 0 (0.0%) | 0 (0.0%) |
| Law Enforcement | 0 (0.0%) | 0 (0.0%) |
| Food Preparation & Serving | 0 (0.0%) | 0 (0.0%) |
| Cleaning & Maintenance | 0 (0.0%) | 0 (0.0%) |
| Personal Care & Service | 0 (0.0%) | 0 (0.0%) |
| Total (Category) | 0 (0.0%) | 0 (0.0%) |
| Total (Overall) | 0 (0.0%) | 18 (100.0%) |
Sales and Office Occupations
The most common Sales and Office occupations in Virgil are , and Office & Administration (2 | 11.1%).
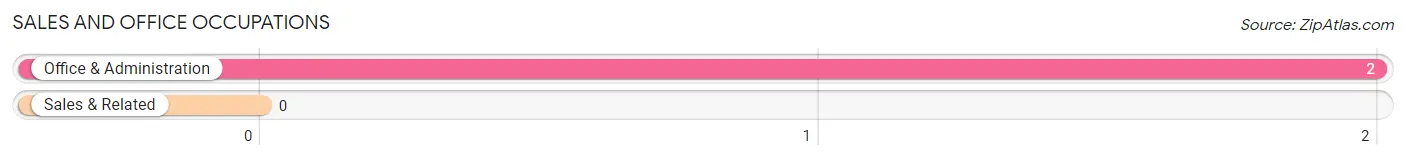
Sales and Office Occupations by Sex
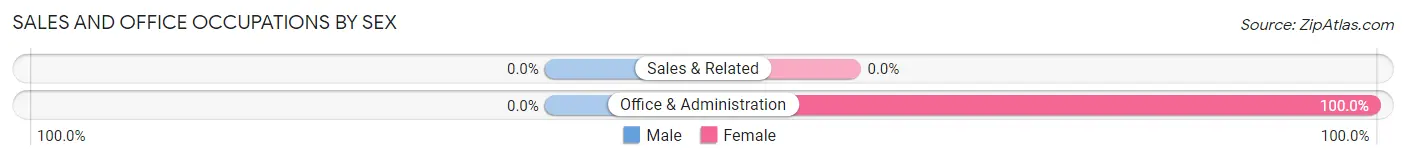
| Occupation | Male | Female |
| Sales & Related | 0 (0.0%) | 0 (0.0%) |
| Office & Administration | 0 (0.0%) | 2 (100.0%) |
| Total (Category) | 0 (0.0%) | 2 (100.0%) |
| Total (Overall) | 0 (0.0%) | 18 (100.0%) |
Natural Resources, Construction and Maintenance Occupations
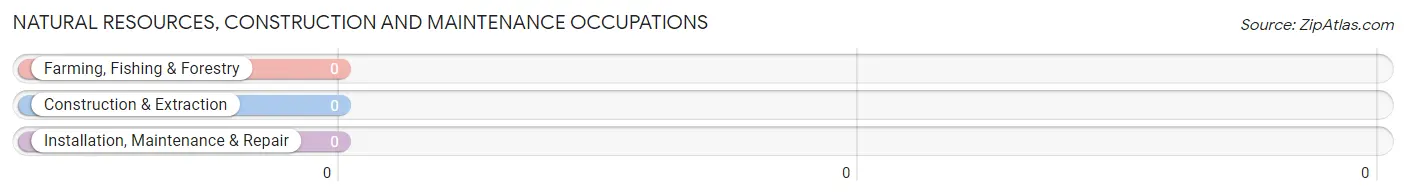
Natural Resources, Construction and Maintenance Occupations by Sex
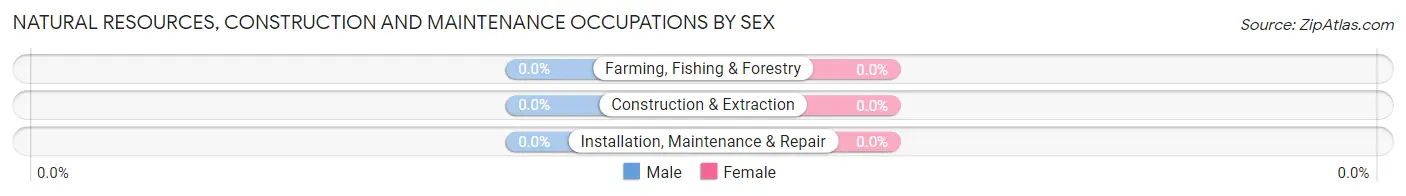
| Occupation | Male | Female |
| Farming, Fishing & Forestry | 0 (0.0%) | 0 (0.0%) |
| Construction & Extraction | 0 (0.0%) | 0 (0.0%) |
| Installation, Maintenance & Repair | 0 (0.0%) | 0 (0.0%) |
| Total (Category) | 0 (0.0%) | 0 (0.0%) |
| Total (Overall) | 0 (0.0%) | 18 (100.0%) |
Production, Transportation and Moving Occupations
The most common Production, Transportation and Moving occupations in Virgil are Production (8 | 44.4%), and Material Moving (6 | 33.3%).
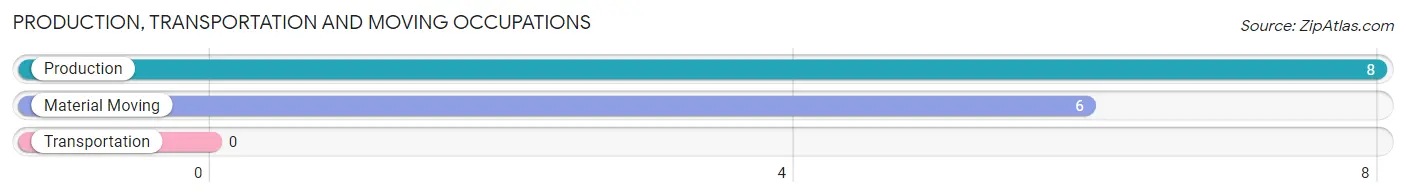
Production, Transportation and Moving Occupations by Sex
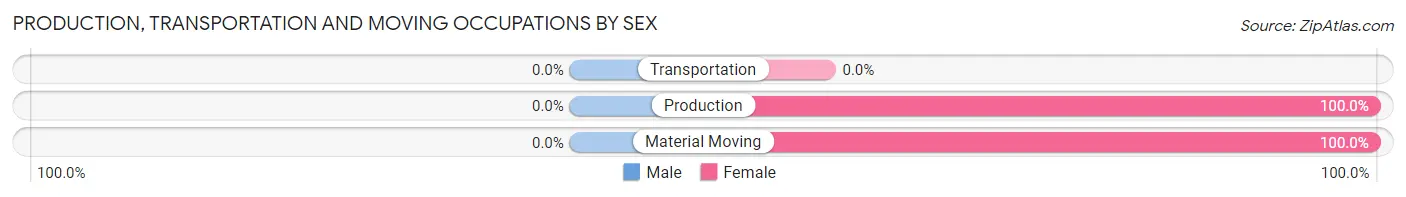
| Occupation | Male | Female |
| Production | 0 (0.0%) | 8 (100.0%) |
| Transportation | 0 (0.0%) | 0 (0.0%) |
| Material Moving | 0 (0.0%) | 6 (100.0%) |
| Total (Category) | 0 (0.0%) | 14 (100.0%) |
| Total (Overall) | 0 (0.0%) | 18 (100.0%) |
Employment Industries by Sex in Virgil
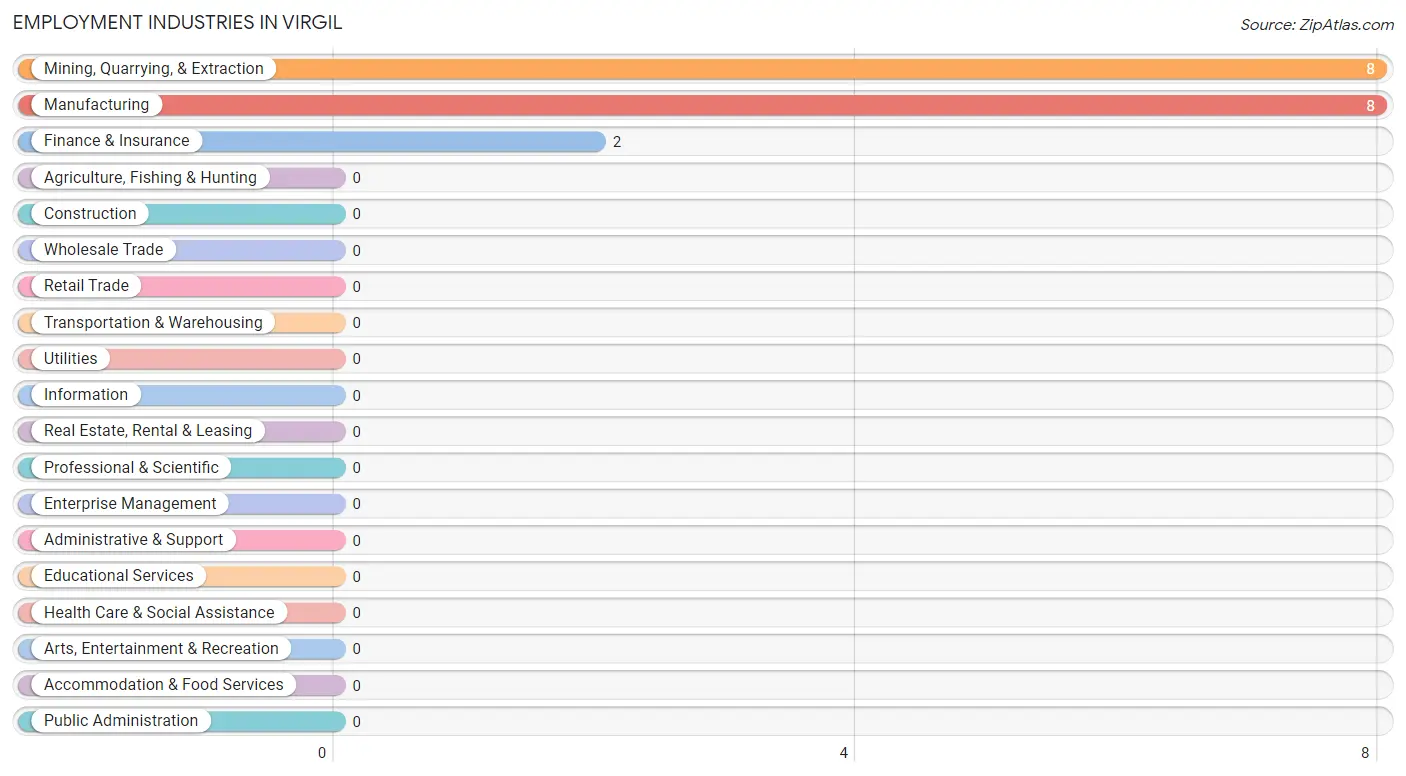
Employment Industries in Virgil
The major employment industries in Virgil include Mining, Quarrying, & Extraction (8 | 44.4%), Manufacturing (8 | 44.4%), and Finance & Insurance (2 | 11.1%).
Employment Industries by Sex in Virgil
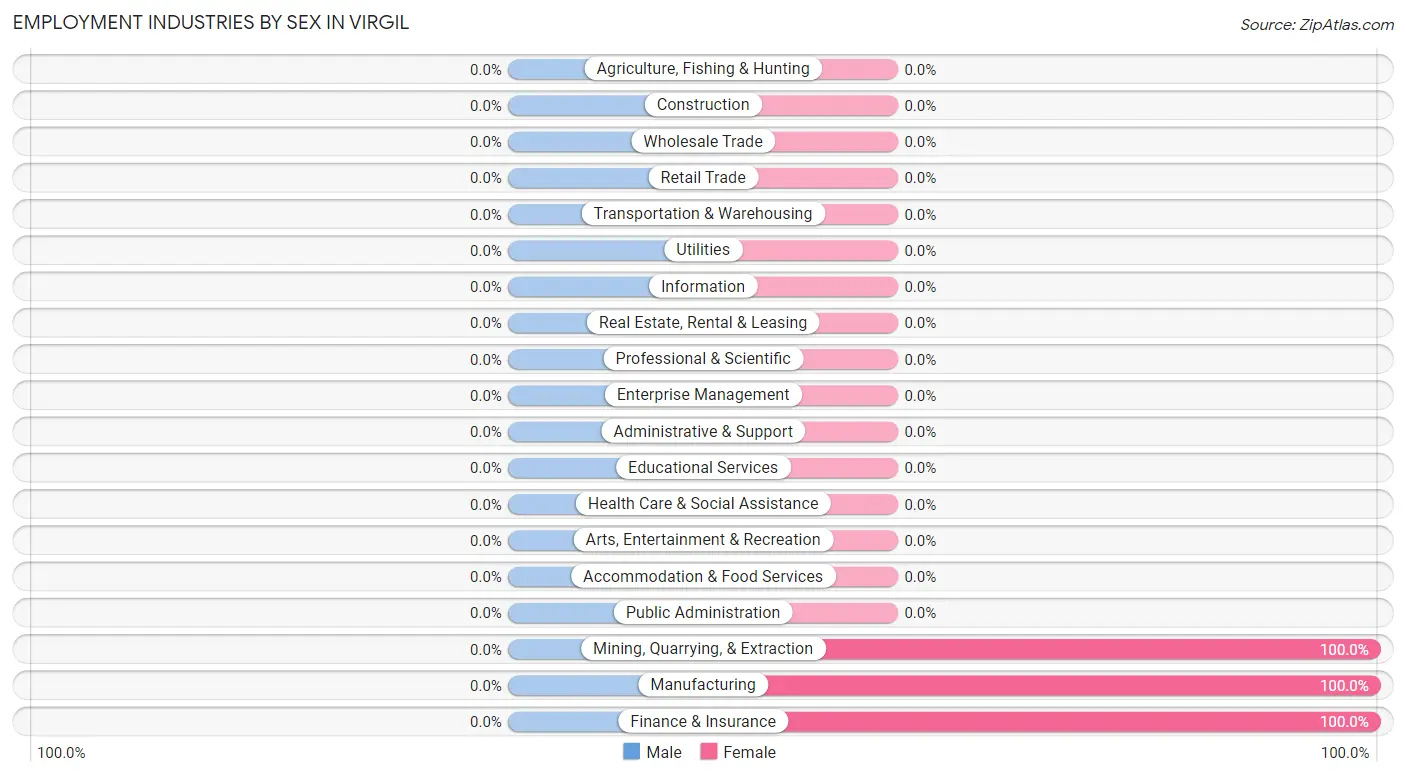
| Industry | Male | Female |
| Agriculture, Fishing & Hunting | 0 (0.0%) | 0 (0.0%) |
| Mining, Quarrying, & Extraction | 0 (0.0%) | 8 (100.0%) |
| Construction | 0 (0.0%) | 0 (0.0%) |
| Manufacturing | 0 (0.0%) | 8 (100.0%) |
| Wholesale Trade | 0 (0.0%) | 0 (0.0%) |
| Retail Trade | 0 (0.0%) | 0 (0.0%) |
| Transportation & Warehousing | 0 (0.0%) | 0 (0.0%) |
| Utilities | 0 (0.0%) | 0 (0.0%) |
| Information | 0 (0.0%) | 0 (0.0%) |
| Finance & Insurance | 0 (0.0%) | 2 (100.0%) |
| Real Estate, Rental & Leasing | 0 (0.0%) | 0 (0.0%) |
| Professional & Scientific | 0 (0.0%) | 0 (0.0%) |
| Enterprise Management | 0 (0.0%) | 0 (0.0%) |
| Administrative & Support | 0 (0.0%) | 0 (0.0%) |
| Educational Services | 0 (0.0%) | 0 (0.0%) |
| Health Care & Social Assistance | 0 (0.0%) | 0 (0.0%) |
| Arts, Entertainment & Recreation | 0 (0.0%) | 0 (0.0%) |
| Accommodation & Food Services | 0 (0.0%) | 0 (0.0%) |
| Public Administration | 0 (0.0%) | 0 (0.0%) |
| Total | 0 (0.0%) | 18 (100.0%) |
Education in Virgil
School Enrollment in Virgil
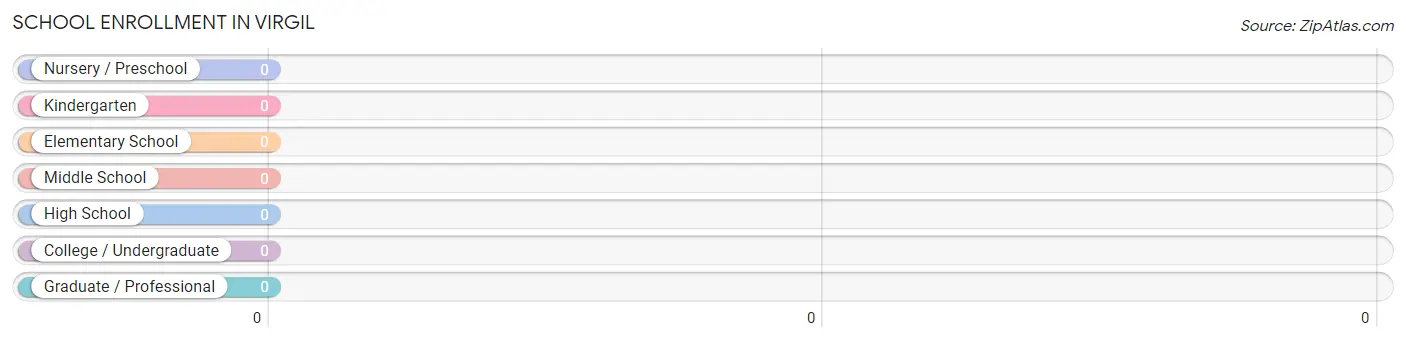
| School Level | # Students | % Students |
| Nursery / Preschool | 0 | 0.0% |
| Kindergarten | 0 | 0.0% |
| Elementary School | 0 | 0.0% |
| Middle School | 0 | 0.0% |
| High School | 0 | 0.0% |
| College / Undergraduate | 0 | 0.0% |
| Graduate / Professional | 0 | 0.0% |
| Total | 0 | 0.0% |
School Enrollment by Age by Funding Source in Virgil
| Age Bracket | Public School | Private School |
| 3 to 4 Year Olds | 0 (0.0%) | 0 (0.0%) |
| 5 to 9 Year Old | 0 (0.0%) | 0 (0.0%) |
| 10 to 14 Year Olds | 0 (0.0%) | 0 (0.0%) |
| 15 to 17 Year Olds | 0 (0.0%) | 0 (0.0%) |
| 18 to 19 Year Olds | 0 (0.0%) | 0 (0.0%) |
| 20 to 24 Year Olds | 0 (0.0%) | 0 (0.0%) |
| 25 to 34 Year Olds | 0 (0.0%) | 0 (0.0%) |
| 35 Years and over | 0 (0.0%) | 0 (0.0%) |
| Total | 0 (0.0%) | 0 (0.0%) |
Educational Attainment by Field of Study in Virgil
Business (3 | 60.0%), and bio, nature & agricultural (2 | 40.0%) are the most common fields of study among 5 individuals in Virgil who have obtained a bachelor's degree or higher.
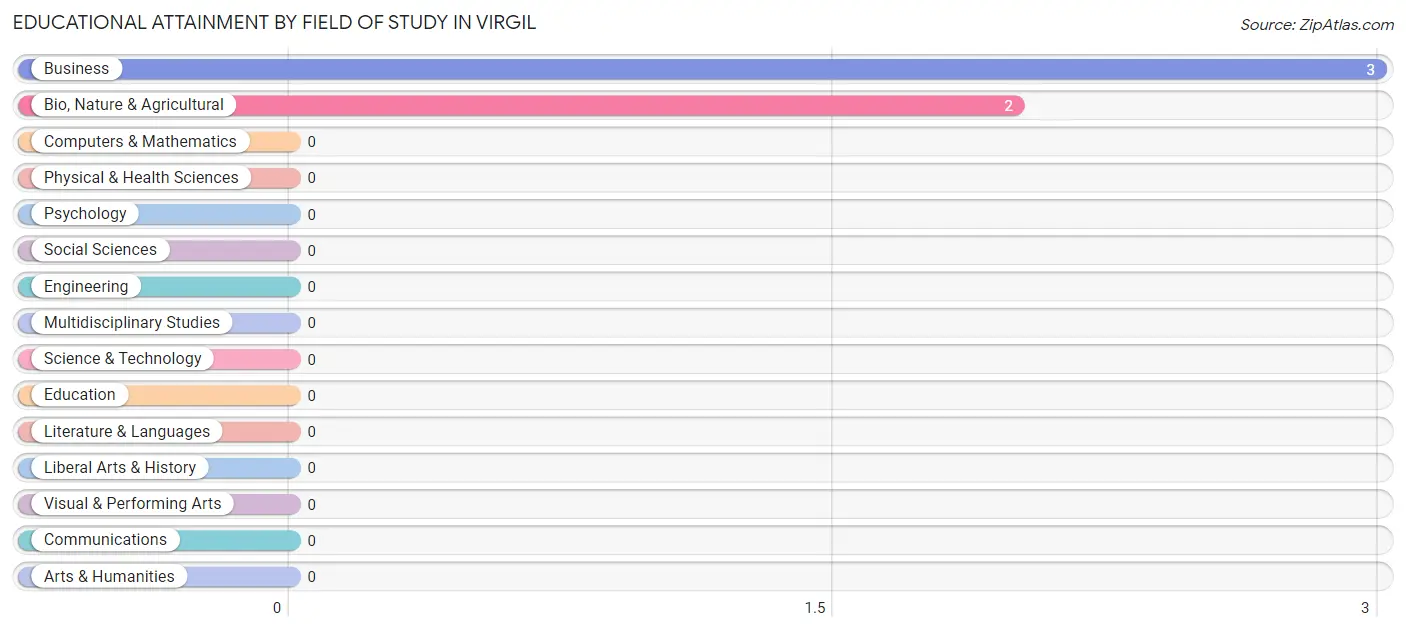
| Field of Study | # Graduates | % Graduates |
| Computers & Mathematics | 0 | 0.0% |
| Bio, Nature & Agricultural | 2 | 40.0% |
| Physical & Health Sciences | 0 | 0.0% |
| Psychology | 0 | 0.0% |
| Social Sciences | 0 | 0.0% |
| Engineering | 0 | 0.0% |
| Multidisciplinary Studies | 0 | 0.0% |
| Science & Technology | 0 | 0.0% |
| Business | 3 | 60.0% |
| Education | 0 | 0.0% |
| Literature & Languages | 0 | 0.0% |
| Liberal Arts & History | 0 | 0.0% |
| Visual & Performing Arts | 0 | 0.0% |
| Communications | 0 | 0.0% |
| Arts & Humanities | 0 | 0.0% |
| Total | 5 | 100.0% |
Transportation & Commute in Virgil
Vehicle Availability by Sex in Virgil
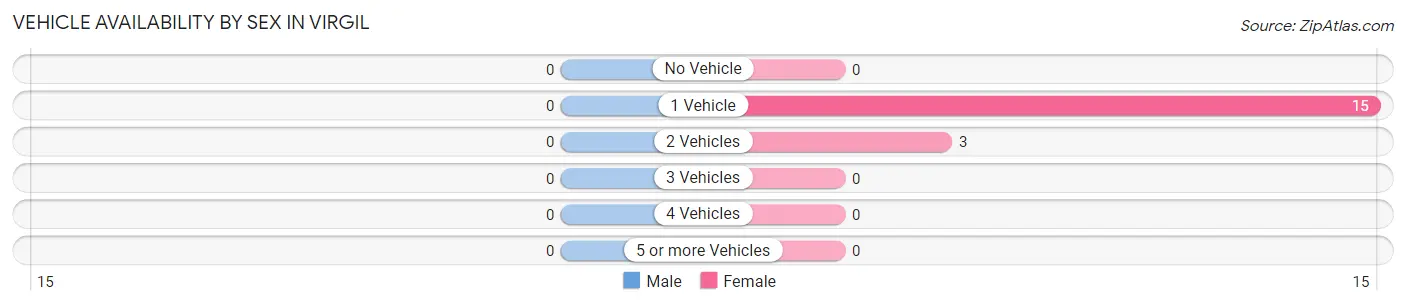
| Vehicles Available | Male | Female |
| No Vehicle | 0 (0.0%) | 0 (0.0%) |
| 1 Vehicle | 0 (0.0%) | 15 (83.3%) |
| 2 Vehicles | 0 (0.0%) | 3 (16.7%) |
| 3 Vehicles | 0 (0.0%) | 0 (0.0%) |
| 4 Vehicles | 0 (0.0%) | 0 (0.0%) |
| 5 or more Vehicles | 0 (0.0%) | 0 (0.0%) |
| Total | 0 (0.0%) | 18 (100.0%) |
Commute Time in Virgil
The most frequently occuring commute durations in Virgil are 25 to 29 minutes (6 commuters, 37.5%), 30 to 34 minutes (5 commuters, 31.2%), and 45 to 59 minutes (3 commuters, 18.8%).
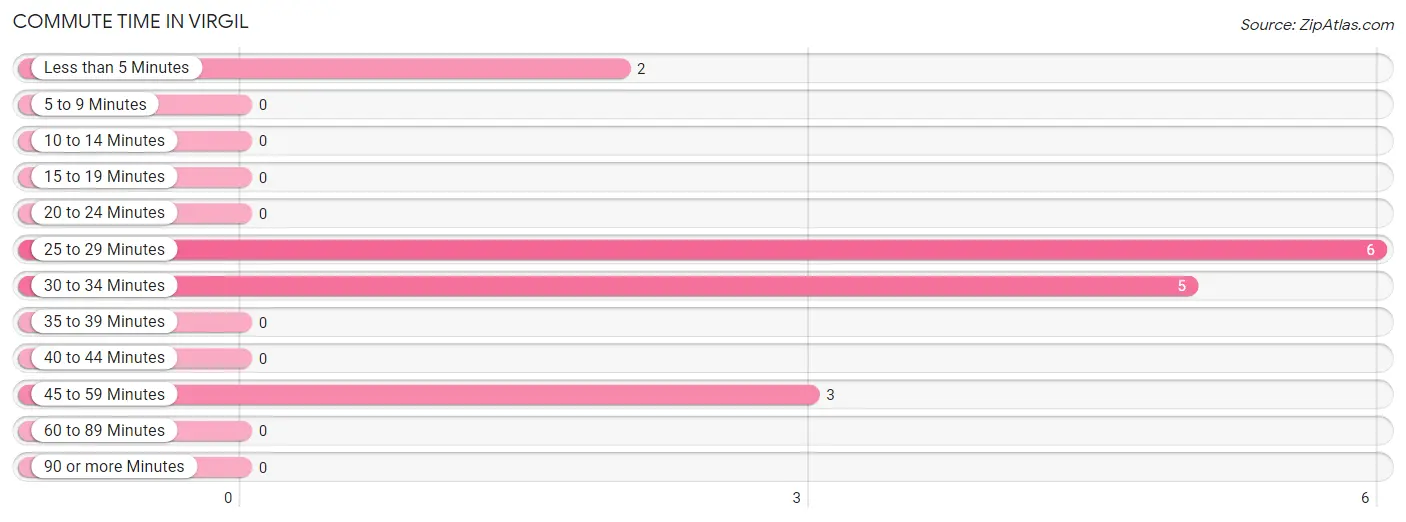
| Commute Time | # Commuters | % Commuters |
| Less than 5 Minutes | 2 | 12.5% |
| 5 to 9 Minutes | 0 | 0.0% |
| 10 to 14 Minutes | 0 | 0.0% |
| 15 to 19 Minutes | 0 | 0.0% |
| 20 to 24 Minutes | 0 | 0.0% |
| 25 to 29 Minutes | 6 | 37.5% |
| 30 to 34 Minutes | 5 | 31.2% |
| 35 to 39 Minutes | 0 | 0.0% |
| 40 to 44 Minutes | 0 | 0.0% |
| 45 to 59 Minutes | 3 | 18.8% |
| 60 to 89 Minutes | 0 | 0.0% |
| 90 or more Minutes | 0 | 0.0% |
Commute Time by Sex in Virgil
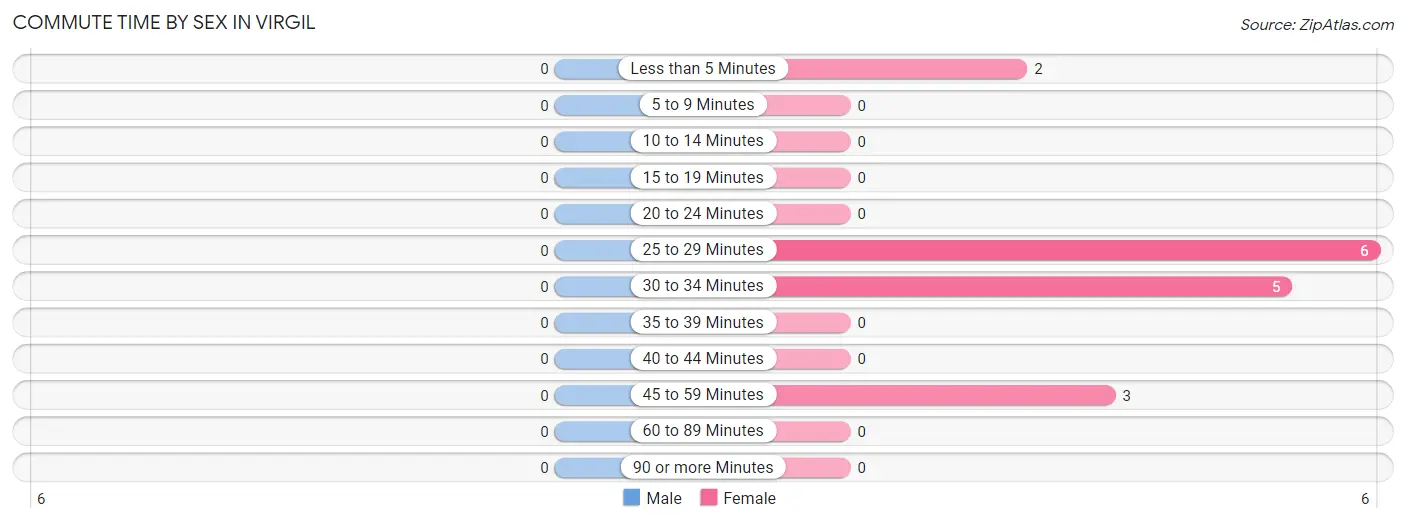
| Commute Time | Male | Female |
| Less than 5 Minutes | 0 (0.0%) | 2 (12.5%) |
| 5 to 9 Minutes | 0 (0.0%) | 0 (0.0%) |
| 10 to 14 Minutes | 0 (0.0%) | 0 (0.0%) |
| 15 to 19 Minutes | 0 (0.0%) | 0 (0.0%) |
| 20 to 24 Minutes | 0 (0.0%) | 0 (0.0%) |
| 25 to 29 Minutes | 0 (0.0%) | 6 (37.5%) |
| 30 to 34 Minutes | 0 (0.0%) | 5 (31.2%) |
| 35 to 39 Minutes | 0 (0.0%) | 0 (0.0%) |
| 40 to 44 Minutes | 0 (0.0%) | 0 (0.0%) |
| 45 to 59 Minutes | 0 (0.0%) | 3 (18.8%) |
| 60 to 89 Minutes | 0 (0.0%) | 0 (0.0%) |
| 90 or more Minutes | 0 (0.0%) | 0 (0.0%) |
Time of Departure to Work by Sex in Virgil
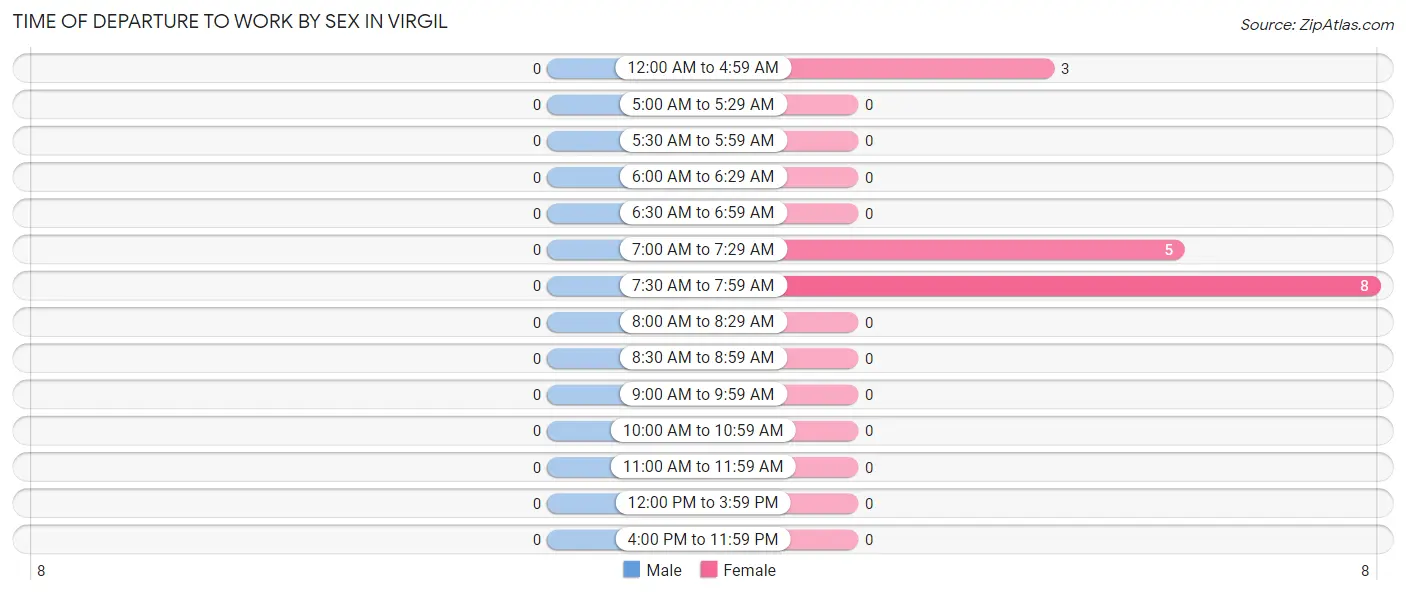
| Time of Departure | Male | Female |
| 12:00 AM to 4:59 AM | 0 (0.0%) | 3 (18.8%) |
| 5:00 AM to 5:29 AM | 0 (0.0%) | 0 (0.0%) |
| 5:30 AM to 5:59 AM | 0 (0.0%) | 0 (0.0%) |
| 6:00 AM to 6:29 AM | 0 (0.0%) | 0 (0.0%) |
| 6:30 AM to 6:59 AM | 0 (0.0%) | 0 (0.0%) |
| 7:00 AM to 7:29 AM | 0 (0.0%) | 5 (31.2%) |
| 7:30 AM to 7:59 AM | 0 (0.0%) | 8 (50.0%) |
| 8:00 AM to 8:29 AM | 0 (0.0%) | 0 (0.0%) |
| 8:30 AM to 8:59 AM | 0 (0.0%) | 0 (0.0%) |
| 9:00 AM to 9:59 AM | 0 (0.0%) | 0 (0.0%) |
| 10:00 AM to 10:59 AM | 0 (0.0%) | 0 (0.0%) |
| 11:00 AM to 11:59 AM | 0 (0.0%) | 0 (0.0%) |
| 12:00 PM to 3:59 PM | 0 (0.0%) | 0 (0.0%) |
| 4:00 PM to 11:59 PM | 0 (0.0%) | 0 (0.0%) |
| Total | 0 (0.0%) | 16 (100.0%) |
Housing Occupancy in Virgil
Occupancy by Ownership in Virgil
Of the total 21 dwellings in Virgil, owner-occupied units account for 20 (95.2%), while renter-occupied units make up 1 (4.8%).
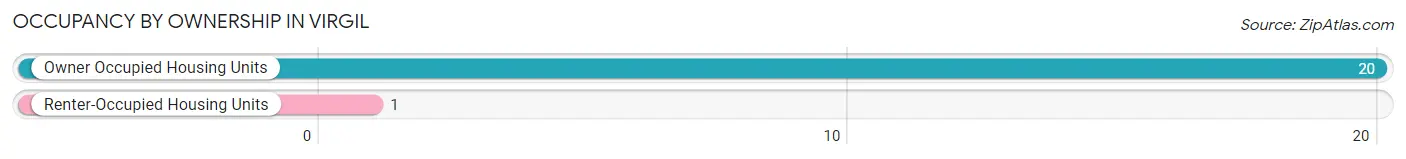
| Occupancy | # Housing Units | % Housing Units |
| Owner Occupied Housing Units | 20 | 95.2% |
| Renter-Occupied Housing Units | 1 | 4.8% |
| Total Occupied Housing Units | 21 | 100.0% |
Occupancy by Household Size in Virgil
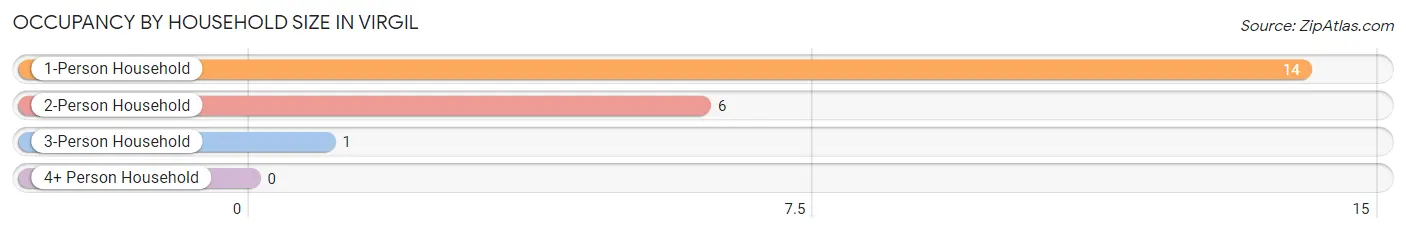
| Household Size | # Housing Units | % Housing Units |
| 1-Person Household | 14 | 66.7% |
| 2-Person Household | 6 | 28.6% |
| 3-Person Household | 1 | 4.8% |
| 4+ Person Household | 0 | 0.0% |
| Total Housing Units | 21 | 100.0% |
Occupancy by Ownership by Household Size in Virgil
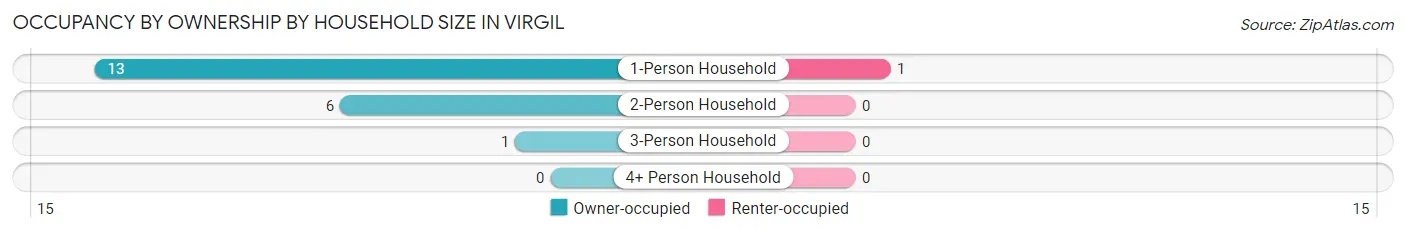
| Household Size | Owner-occupied | Renter-occupied |
| 1-Person Household | 13 (92.9%) | 1 (7.1%) |
| 2-Person Household | 6 (100.0%) | 0 (0.0%) |
| 3-Person Household | 1 (100.0%) | 0 (0.0%) |
| 4+ Person Household | 0 (0.0%) | 0 (0.0%) |
| Total Housing Units | 20 (95.2%) | 1 (4.8%) |
Occupancy by Educational Attainment in Virgil
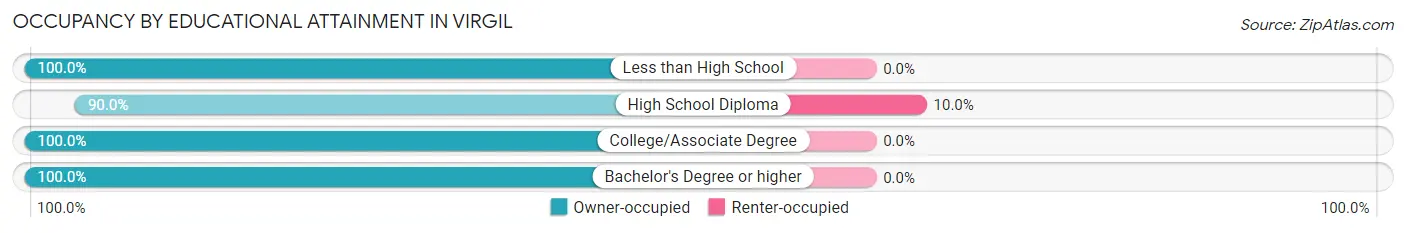
| Household Size | Owner-occupied | Renter-occupied |
| Less than High School | 1 (100.0%) | 0 (0.0%) |
| High School Diploma | 9 (90.0%) | 1 (10.0%) |
| College/Associate Degree | 5 (100.0%) | 0 (0.0%) |
| Bachelor's Degree or higher | 5 (100.0%) | 0 (0.0%) |
Occupancy by Age of Householder in Virgil
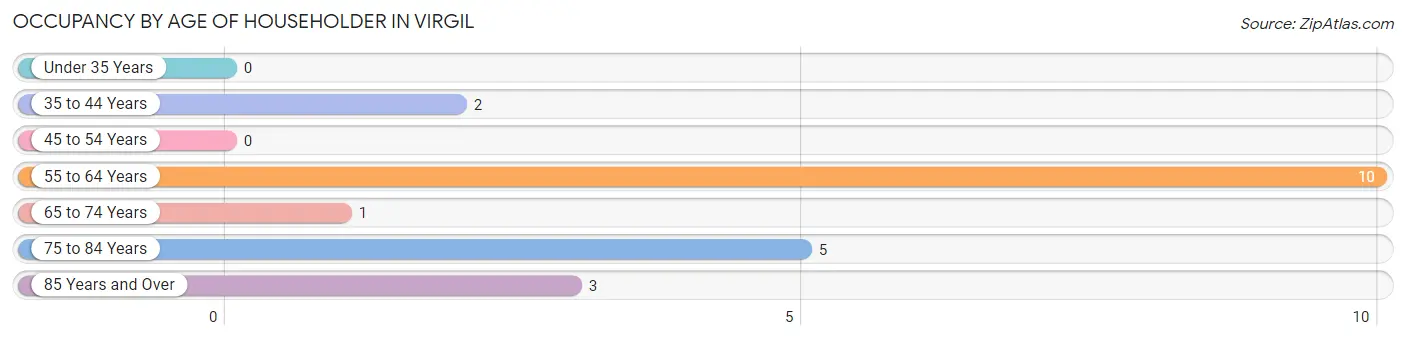
| Age Bracket | # Households | % Households |
| Under 35 Years | 0 | 0.0% |
| 35 to 44 Years | 2 | 9.5% |
| 45 to 54 Years | 0 | 0.0% |
| 55 to 64 Years | 10 | 47.6% |
| 65 to 74 Years | 1 | 4.8% |
| 75 to 84 Years | 5 | 23.8% |
| 85 Years and Over | 3 | 14.3% |
| Total | 21 | 100.0% |
Housing Finances in Virgil
Median Income by Occupancy in Virgil
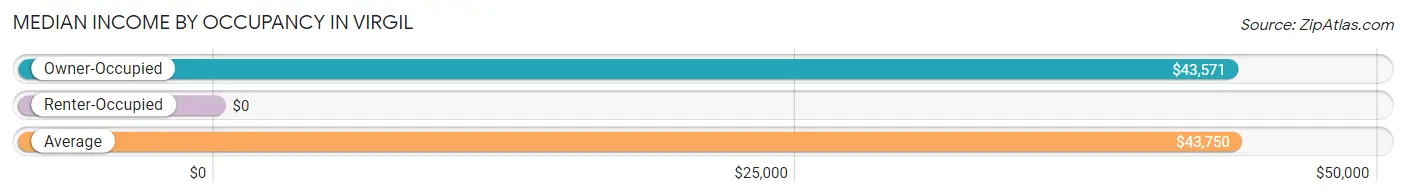
| Occupancy Type | # Households | Median Income |
| Owner-Occupied | 20 (95.2%) | $43,571 |
| Renter-Occupied | 1 (4.8%) | $0 |
| Average | 21 (100.0%) | $43,750 |
Occupancy by Householder Income Bracket in Virgil
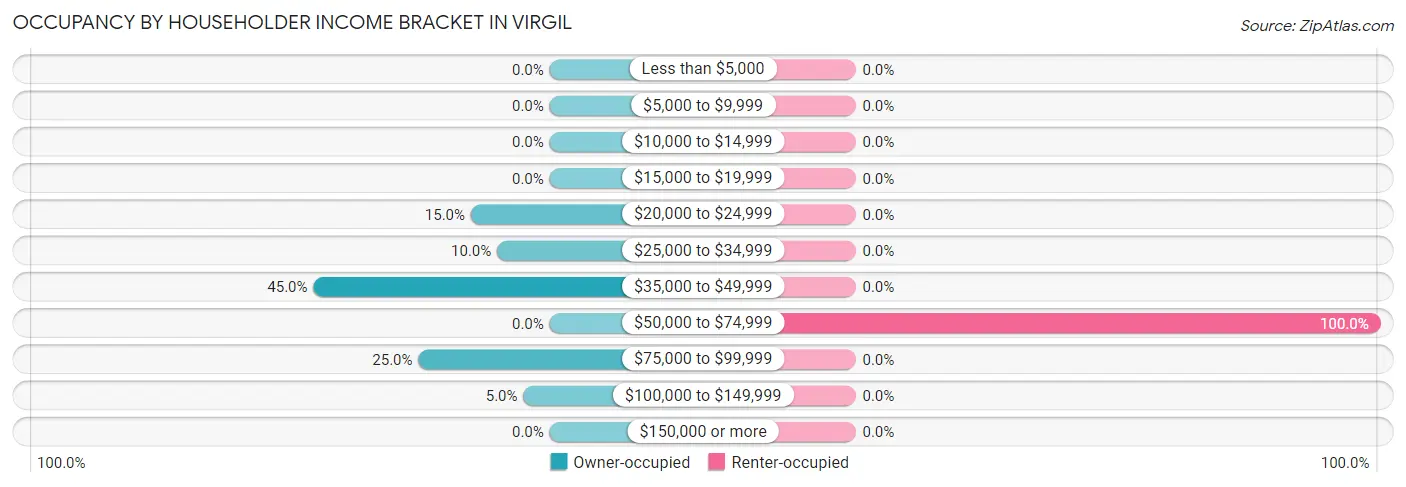
| Income Bracket | Owner-occupied | Renter-occupied |
| Less than $5,000 | 0 (0.0%) | 0 (0.0%) |
| $5,000 to $9,999 | 0 (0.0%) | 0 (0.0%) |
| $10,000 to $14,999 | 0 (0.0%) | 0 (0.0%) |
| $15,000 to $19,999 | 0 (0.0%) | 0 (0.0%) |
| $20,000 to $24,999 | 3 (15.0%) | 0 (0.0%) |
| $25,000 to $34,999 | 2 (10.0%) | 0 (0.0%) |
| $35,000 to $49,999 | 9 (45.0%) | 0 (0.0%) |
| $50,000 to $74,999 | 0 (0.0%) | 1 (100.0%) |
| $75,000 to $99,999 | 5 (25.0%) | 0 (0.0%) |
| $100,000 to $149,999 | 1 (5.0%) | 0 (0.0%) |
| $150,000 or more | 0 (0.0%) | 0 (0.0%) |
| Total | 20 (100.0%) | 1 (100.0%) |
Monthly Housing Cost Tiers in Virgil
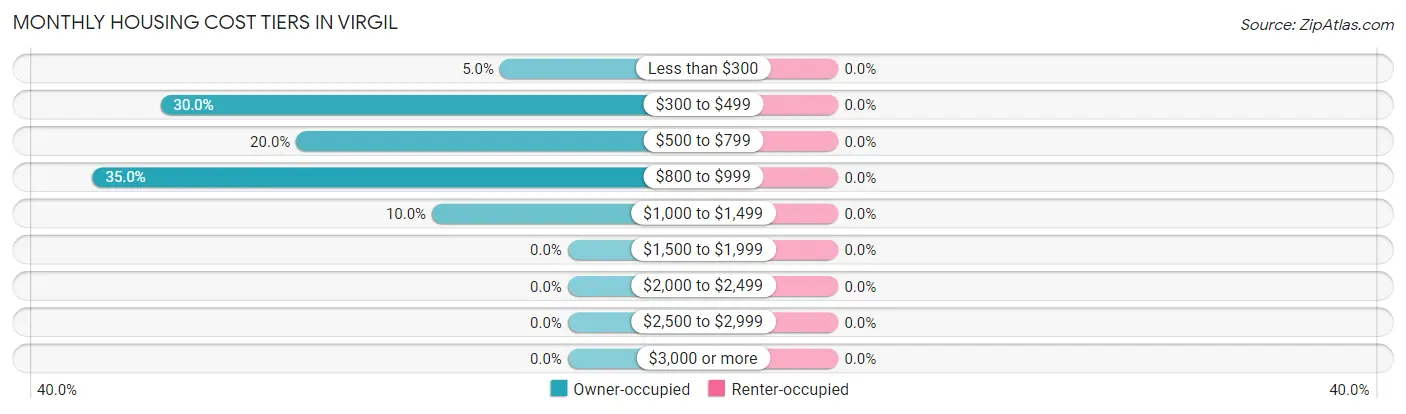
| Monthly Cost | Owner-occupied | Renter-occupied |
| Less than $300 | 1 (5.0%) | 0 (0.0%) |
| $300 to $499 | 6 (30.0%) | 0 (0.0%) |
| $500 to $799 | 4 (20.0%) | 0 (0.0%) |
| $800 to $999 | 7 (35.0%) | 0 (0.0%) |
| $1,000 to $1,499 | 2 (10.0%) | 0 (0.0%) |
| $1,500 to $1,999 | 0 (0.0%) | 0 (0.0%) |
| $2,000 to $2,499 | 0 (0.0%) | 0 (0.0%) |
| $2,500 to $2,999 | 0 (0.0%) | 0 (0.0%) |
| $3,000 or more | 0 (0.0%) | 0 (0.0%) |
| Total | 20 (100.0%) | 1 (100.0%) |
Physical Housing Characteristics in Virgil
Housing Structures in Virgil
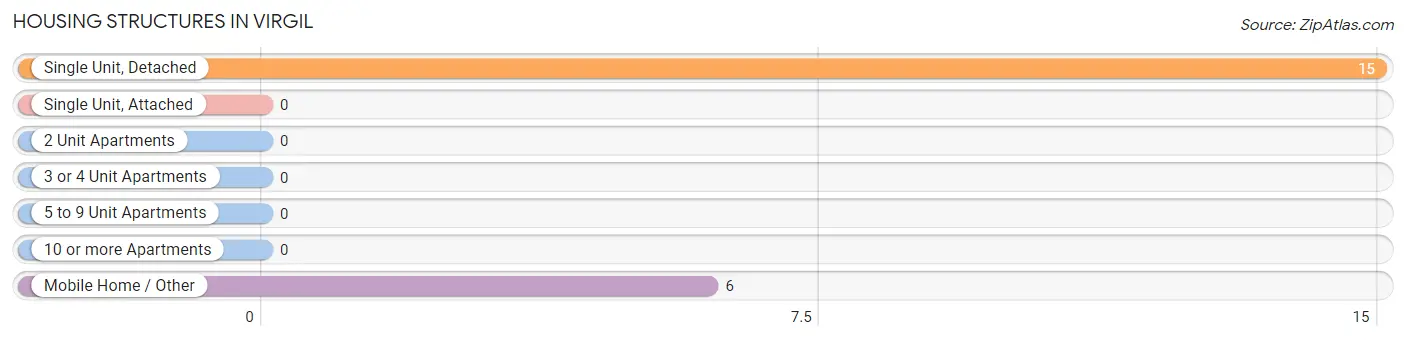
| Structure Type | # Housing Units | % Housing Units |
| Single Unit, Detached | 15 | 71.4% |
| Single Unit, Attached | 0 | 0.0% |
| 2 Unit Apartments | 0 | 0.0% |
| 3 or 4 Unit Apartments | 0 | 0.0% |
| 5 to 9 Unit Apartments | 0 | 0.0% |
| 10 or more Apartments | 0 | 0.0% |
| Mobile Home / Other | 6 | 28.6% |
| Total | 21 | 100.0% |
Housing Structures by Occupancy in Virgil
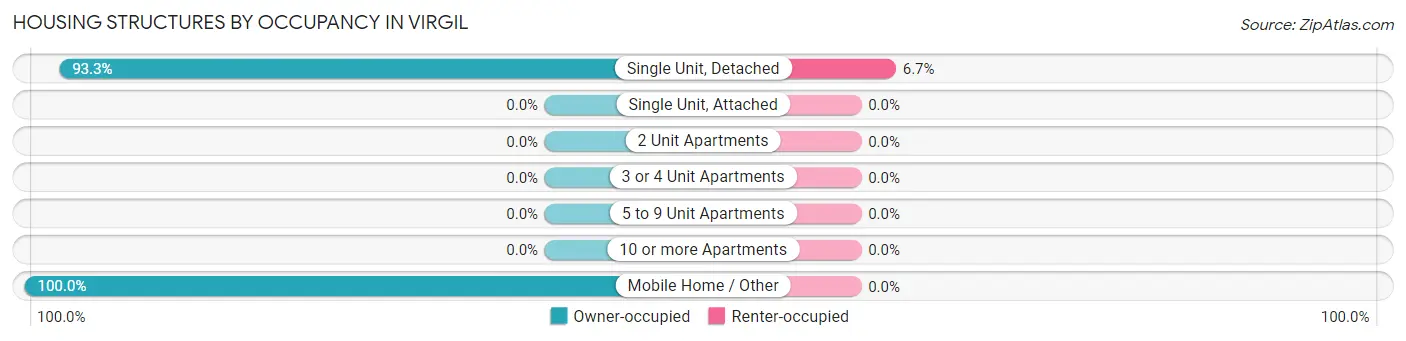
| Structure Type | Owner-occupied | Renter-occupied |
| Single Unit, Detached | 14 (93.3%) | 1 (6.7%) |
| Single Unit, Attached | 0 (0.0%) | 0 (0.0%) |
| 2 Unit Apartments | 0 (0.0%) | 0 (0.0%) |
| 3 or 4 Unit Apartments | 0 (0.0%) | 0 (0.0%) |
| 5 to 9 Unit Apartments | 0 (0.0%) | 0 (0.0%) |
| 10 or more Apartments | 0 (0.0%) | 0 (0.0%) |
| Mobile Home / Other | 6 (100.0%) | 0 (0.0%) |
| Total | 20 (95.2%) | 1 (4.8%) |
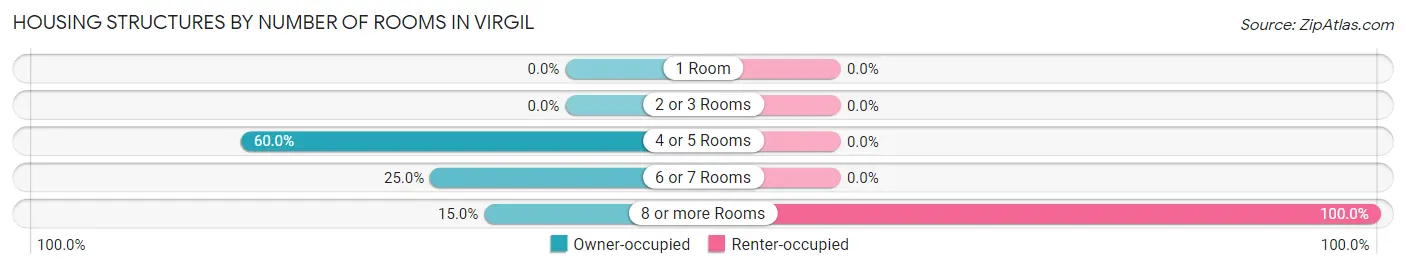
Housing Structures by Number of Rooms in Virgil
| Number of Rooms | Owner-occupied | Renter-occupied |
| 1 Room | 0 (0.0%) | 0 (0.0%) |
| 2 or 3 Rooms | 0 (0.0%) | 0 (0.0%) |
| 4 or 5 Rooms | 12 (60.0%) | 0 (0.0%) |
| 6 or 7 Rooms | 5 (25.0%) | 0 (0.0%) |
| 8 or more Rooms | 3 (15.0%) | 1 (100.0%) |
| Total | 20 (100.0%) | 1 (100.0%) |
Housing Structure by Heating Type in Virgil
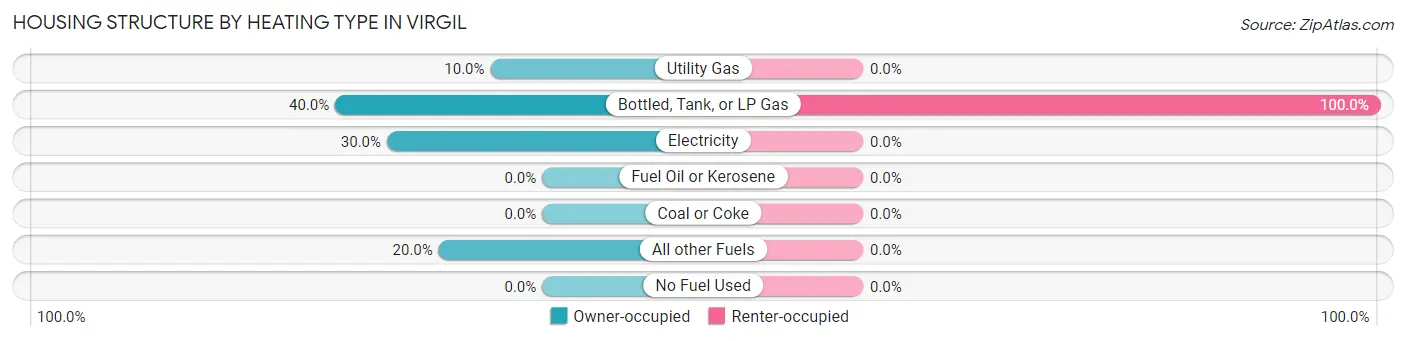
| Heating Type | Owner-occupied | Renter-occupied |
| Utility Gas | 2 (10.0%) | 0 (0.0%) |
| Bottled, Tank, or LP Gas | 8 (40.0%) | 1 (100.0%) |
| Electricity | 6 (30.0%) | 0 (0.0%) |
| Fuel Oil or Kerosene | 0 (0.0%) | 0 (0.0%) |
| Coal or Coke | 0 (0.0%) | 0 (0.0%) |
| All other Fuels | 4 (20.0%) | 0 (0.0%) |
| No Fuel Used | 0 (0.0%) | 0 (0.0%) |
| Total | 20 (100.0%) | 1 (100.0%) |
Household Vehicle Usage in Virgil
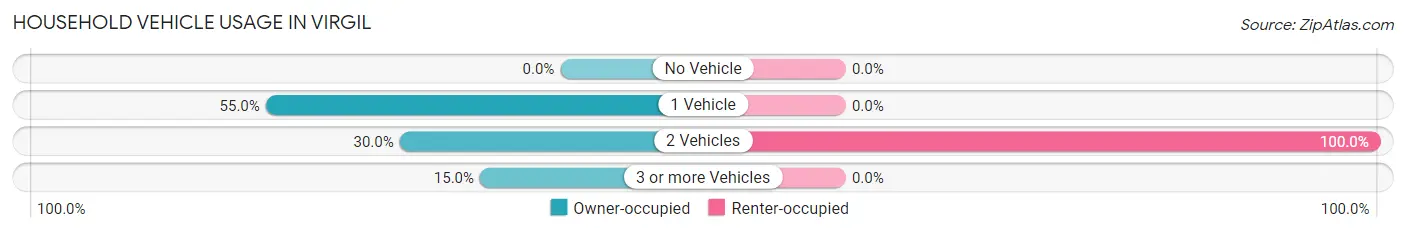
| Vehicles per Household | Owner-occupied | Renter-occupied |
| No Vehicle | 0 (0.0%) | 0 (0.0%) |
| 1 Vehicle | 11 (55.0%) | 0 (0.0%) |
| 2 Vehicles | 6 (30.0%) | 1 (100.0%) |
| 3 or more Vehicles | 3 (15.0%) | 0 (0.0%) |
| Total | 20 (100.0%) | 1 (100.0%) |
Real Estate & Mortgages in Virgil
Real Estate and Mortgage Overview in Virgil
| Characteristic | Without Mortgage | With Mortgage |
| Housing Units | 12 | 8 |
| Median Property Value | - | - |
| Median Household Income | $37,500 | $0 |
| Monthly Housing Costs | $450 | $0 |
| Real Estate Taxes | $367 | $0 |
Property Value by Mortgage Status in Virgil
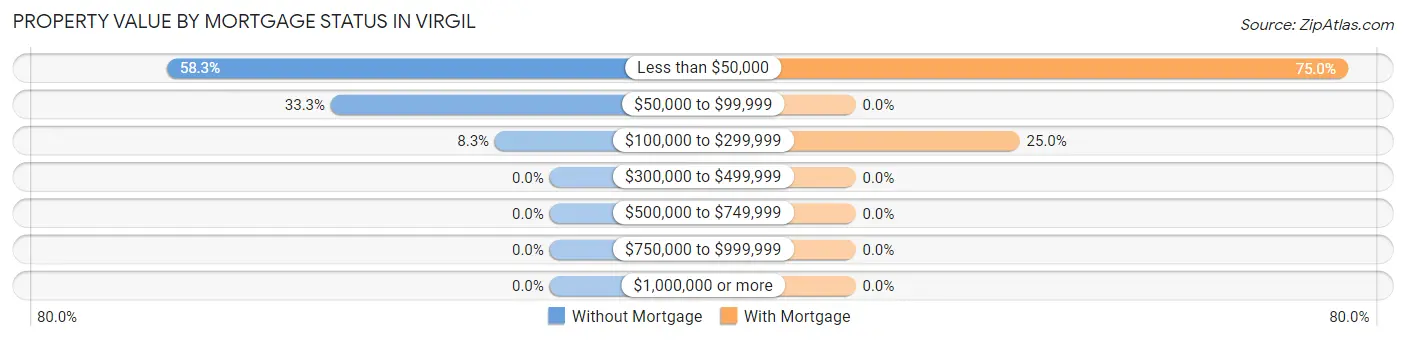
| Property Value | Without Mortgage | With Mortgage |
| Less than $50,000 | 7 (58.3%) | 6 (75.0%) |
| $50,000 to $99,999 | 4 (33.3%) | 0 (0.0%) |
| $100,000 to $299,999 | 1 (8.3%) | 2 (25.0%) |
| $300,000 to $499,999 | 0 (0.0%) | 0 (0.0%) |
| $500,000 to $749,999 | 0 (0.0%) | 0 (0.0%) |
| $750,000 to $999,999 | 0 (0.0%) | 0 (0.0%) |
| $1,000,000 or more | 0 (0.0%) | 0 (0.0%) |
| Total | 12 (100.0%) | 8 (100.0%) |
Household Income by Mortgage Status in Virgil
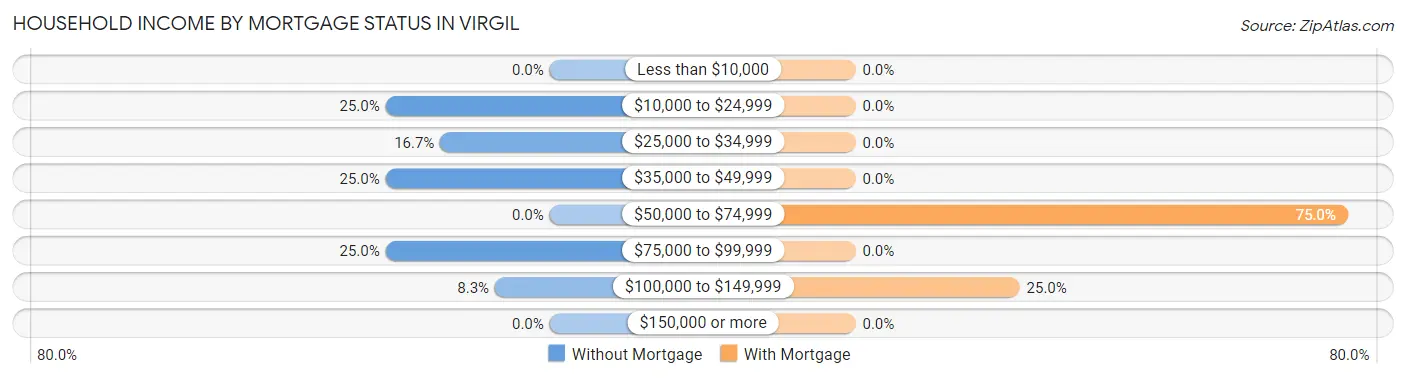
| Household Income | Without Mortgage | With Mortgage |
| Less than $10,000 | 0 (0.0%) | 0 (0.0%) |
| $10,000 to $24,999 | 3 (25.0%) | 0 (0.0%) |
| $25,000 to $34,999 | 2 (16.7%) | 0 (0.0%) |
| $35,000 to $49,999 | 3 (25.0%) | 0 (0.0%) |
| $50,000 to $74,999 | 0 (0.0%) | 6 (75.0%) |
| $75,000 to $99,999 | 3 (25.0%) | 0 (0.0%) |
| $100,000 to $149,999 | 1 (8.3%) | 2 (25.0%) |
| $150,000 or more | 0 (0.0%) | 0 (0.0%) |
| Total | 12 (100.0%) | 8 (100.0%) |
Property Value to Household Income Ratio in Virgil
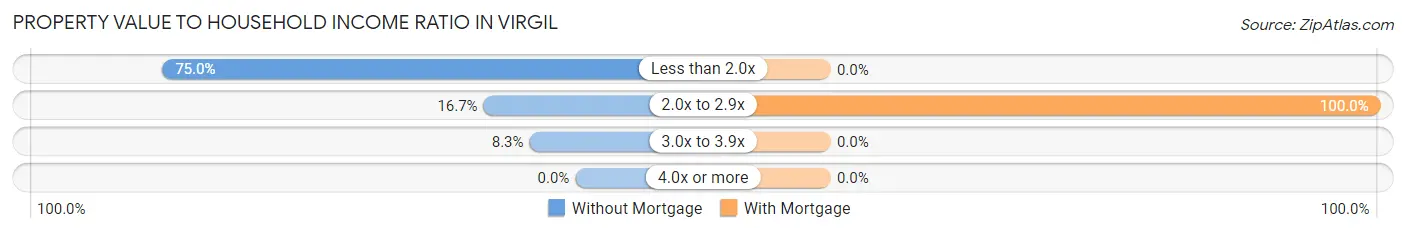
| Value-to-Income Ratio | Without Mortgage | With Mortgage |
| Less than 2.0x | 9 (75.0%) | 0 (0.0%) |
| 2.0x to 2.9x | 2 (16.7%) | 8 (100.0%) |
| 3.0x to 3.9x | 1 (8.3%) | 0 (0.0%) |
| 4.0x or more | 0 (0.0%) | 0 (0.0%) |
| Total | 12 (100.0%) | 8 (100.0%) |
Real Estate Taxes by Mortgage Status in Virgil
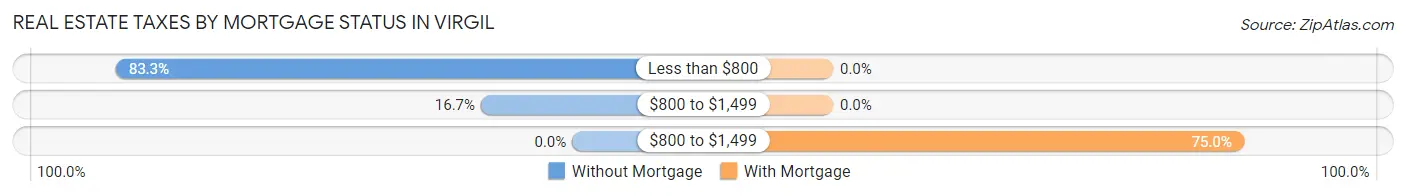
| Property Taxes | Without Mortgage | With Mortgage |
| Less than $800 | 10 (83.3%) | 0 (0.0%) |
| $800 to $1,499 | 2 (16.7%) | 0 (0.0%) |
| $800 to $1,499 | 0 (0.0%) | 6 (75.0%) |
| Total | 12 (100.0%) | 8 (100.0%) |
Health & Disability in Virgil
Health Insurance Coverage by Age in Virgil
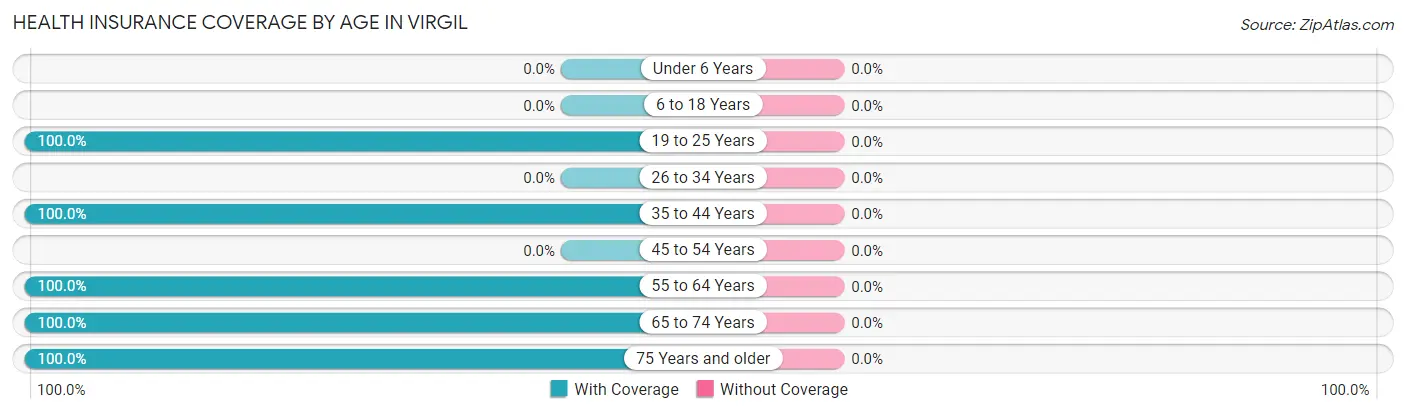
| Age Bracket | With Coverage | Without Coverage |
| Under 6 Years | 0 (0.0%) | 0 (0.0%) |
| 6 to 18 Years | 0 (0.0%) | 0 (0.0%) |
| 19 to 25 Years | 5 (100.0%) | 0 (0.0%) |
| 26 to 34 Years | 0 (0.0%) | 0 (0.0%) |
| 35 to 44 Years | 2 (100.0%) | 0 (0.0%) |
| 45 to 54 Years | 0 (0.0%) | 0 (0.0%) |
| 55 to 64 Years | 10 (100.0%) | 0 (0.0%) |
| 65 to 74 Years | 5 (100.0%) | 0 (0.0%) |
| 75 Years and older | 11 (100.0%) | 0 (0.0%) |
| Total | 33 (100.0%) | 0 (0.0%) |
Health Insurance Coverage by Citizenship Status in Virgil
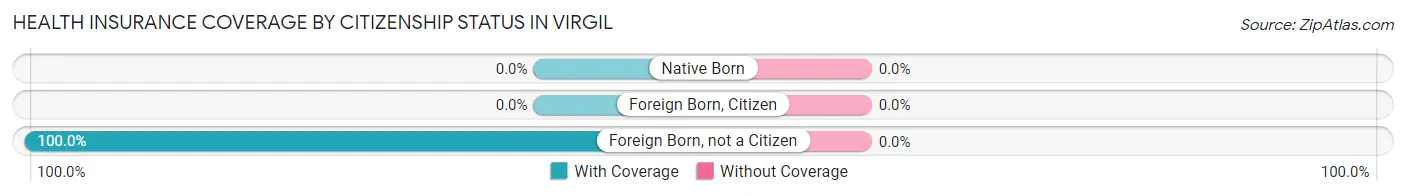
| Citizenship Status | With Coverage | Without Coverage |
| Native Born | 0 (0.0%) | 0 (0.0%) |
| Foreign Born, Citizen | 0 (0.0%) | 0 (0.0%) |
| Foreign Born, not a Citizen | 5 (100.0%) | 0 (0.0%) |
Health Insurance Coverage by Household Income in Virgil
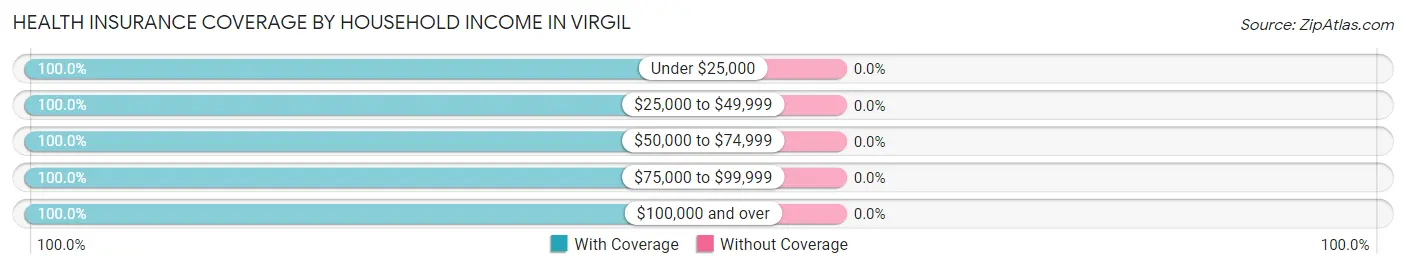
| Household Income | With Coverage | Without Coverage |
| Under $25,000 | 5 (100.0%) | 0 (0.0%) |
| $25,000 to $49,999 | 11 (100.0%) | 0 (0.0%) |
| $50,000 to $74,999 | 1 (100.0%) | 0 (0.0%) |
| $75,000 to $99,999 | 12 (100.0%) | 0 (0.0%) |
| $100,000 and over | 4 (100.0%) | 0 (0.0%) |
Public vs Private Health Insurance Coverage by Age in Virgil
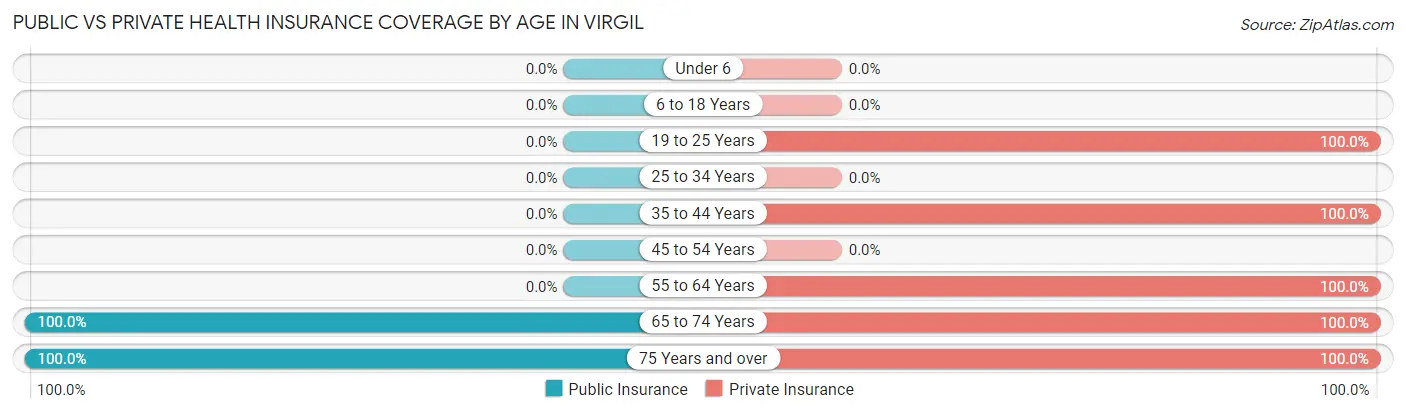
| Age Bracket | Public Insurance | Private Insurance |
| Under 6 | 0 (0.0%) | 0 (0.0%) |
| 6 to 18 Years | 0 (0.0%) | 0 (0.0%) |
| 19 to 25 Years | 0 (0.0%) | 5 (100.0%) |
| 25 to 34 Years | 0 (0.0%) | 0 (0.0%) |
| 35 to 44 Years | 0 (0.0%) | 2 (100.0%) |
| 45 to 54 Years | 0 (0.0%) | 0 (0.0%) |
| 55 to 64 Years | 0 (0.0%) | 10 (100.0%) |
| 65 to 74 Years | 5 (100.0%) | 5 (100.0%) |
| 75 Years and over | 11 (100.0%) | 11 (100.0%) |
| Total | 16 (48.5%) | 33 (100.0%) |
Disability Status by Sex by Age in Virgil
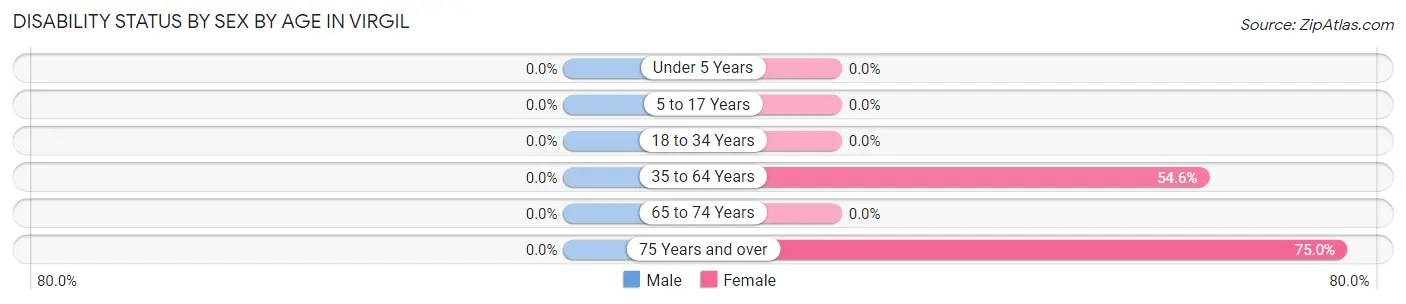
| Age Bracket | Male | Female |
| Under 5 Years | 0 (0.0%) | 0 (0.0%) |
| 5 to 17 Years | 0 (0.0%) | 0 (0.0%) |
| 18 to 34 Years | 0 (0.0%) | 0 (0.0%) |
| 35 to 64 Years | 0 (0.0%) | 6 (54.5%) |
| 65 to 74 Years | 0 (0.0%) | 0 (0.0%) |
| 75 Years and over | 0 (0.0%) | 6 (75.0%) |
Disability Class by Sex by Age in Virgil
Disability Class: Hearing Difficulty
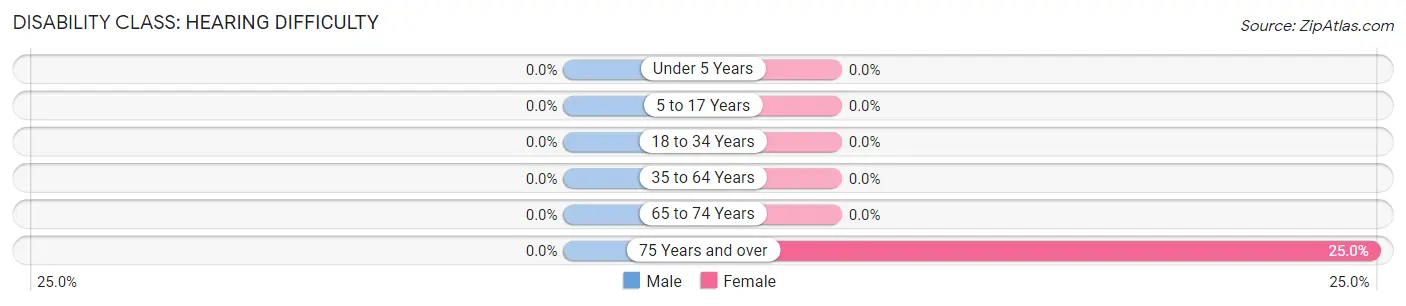
| Age Bracket | Male | Female |
| Under 5 Years | 0 (0.0%) | 0 (0.0%) |
| 5 to 17 Years | 0 (0.0%) | 0 (0.0%) |
| 18 to 34 Years | 0 (0.0%) | 0 (0.0%) |
| 35 to 64 Years | 0 (0.0%) | 0 (0.0%) |
| 65 to 74 Years | 0 (0.0%) | 0 (0.0%) |
| 75 Years and over | 0 (0.0%) | 2 (25.0%) |
Disability Class: Vision Difficulty
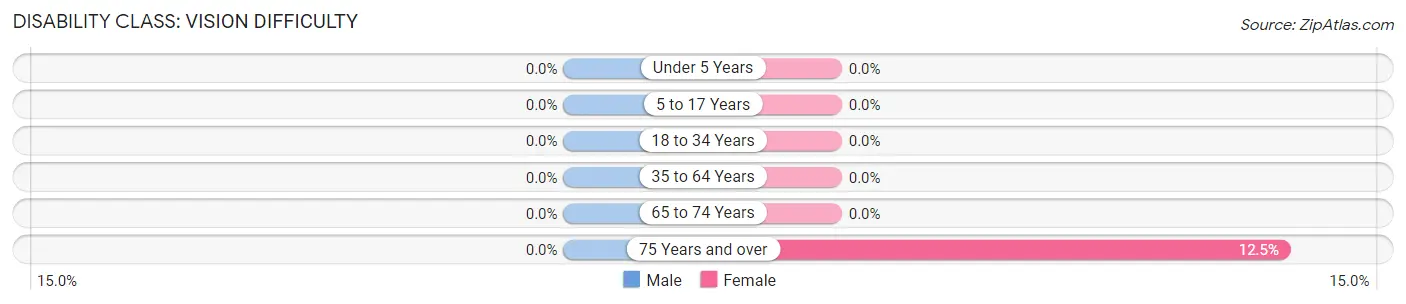
| Age Bracket | Male | Female |
| Under 5 Years | 0 (0.0%) | 0 (0.0%) |
| 5 to 17 Years | 0 (0.0%) | 0 (0.0%) |
| 18 to 34 Years | 0 (0.0%) | 0 (0.0%) |
| 35 to 64 Years | 0 (0.0%) | 0 (0.0%) |
| 65 to 74 Years | 0 (0.0%) | 0 (0.0%) |
| 75 Years and over | 0 (0.0%) | 1 (12.5%) |
Disability Class: Cognitive Difficulty
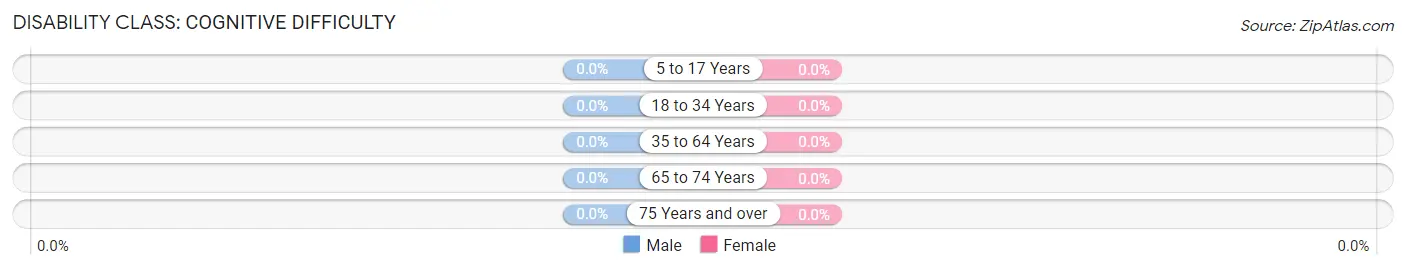
| Age Bracket | Male | Female |
| 5 to 17 Years | 0 (0.0%) | 0 (0.0%) |
| 18 to 34 Years | 0 (0.0%) | 0 (0.0%) |
| 35 to 64 Years | 0 (0.0%) | 0 (0.0%) |
| 65 to 74 Years | 0 (0.0%) | 0 (0.0%) |
| 75 Years and over | 0 (0.0%) | 0 (0.0%) |
Disability Class: Ambulatory Difficulty
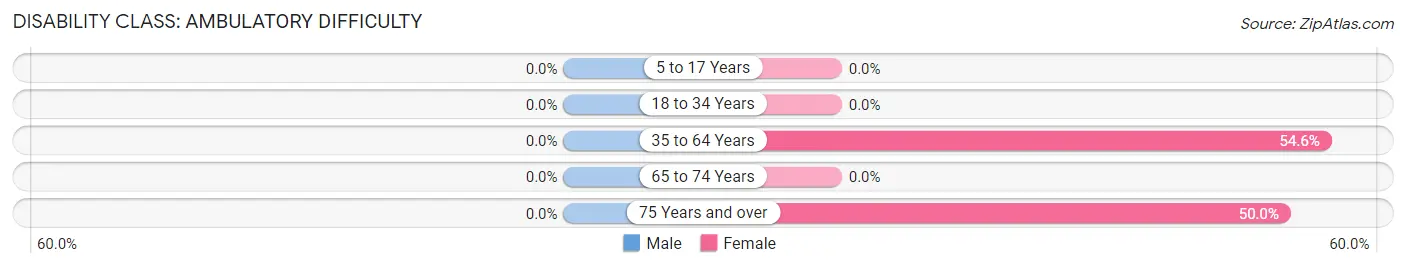
| Age Bracket | Male | Female |
| 5 to 17 Years | 0 (0.0%) | 0 (0.0%) |
| 18 to 34 Years | 0 (0.0%) | 0 (0.0%) |
| 35 to 64 Years | 0 (0.0%) | 6 (54.5%) |
| 65 to 74 Years | 0 (0.0%) | 0 (0.0%) |
| 75 Years and over | 0 (0.0%) | 4 (50.0%) |
Disability Class: Self-Care Difficulty
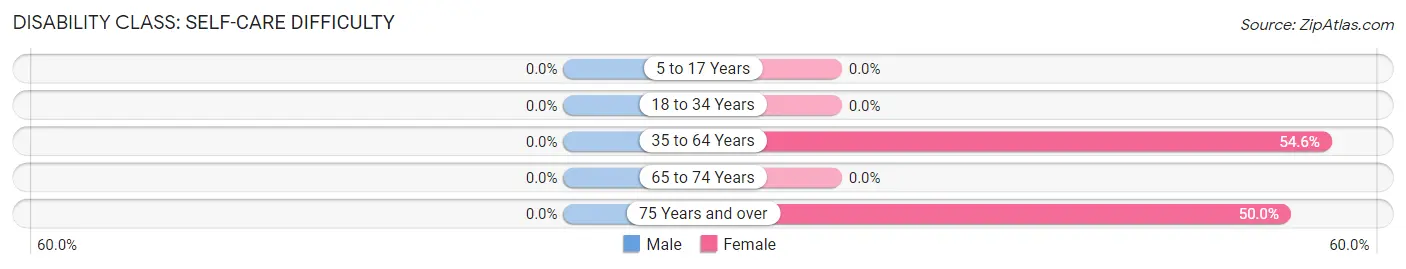
| Age Bracket | Male | Female |
| 5 to 17 Years | 0 (0.0%) | 0 (0.0%) |
| 18 to 34 Years | 0 (0.0%) | 0 (0.0%) |
| 35 to 64 Years | 0 (0.0%) | 6 (54.5%) |
| 65 to 74 Years | 0 (0.0%) | 0 (0.0%) |
| 75 Years and over | 0 (0.0%) | 4 (50.0%) |
Technology Access in Virgil
Computing Device Access in Virgil
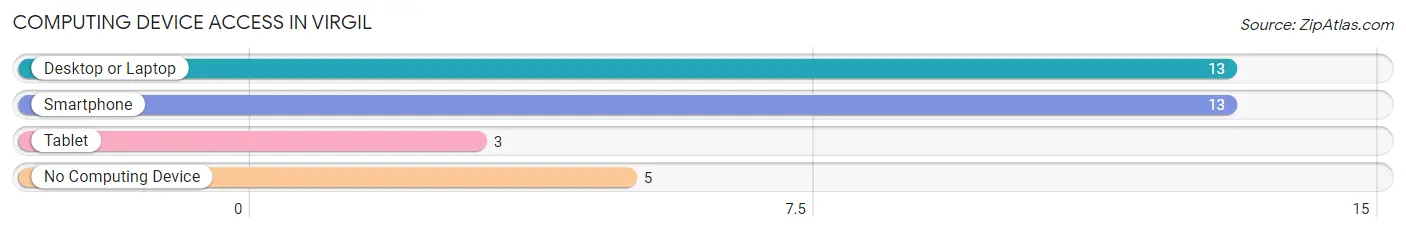
| Device Type | # Households | % Households |
| Desktop or Laptop | 13 | 61.9% |
| Smartphone | 13 | 61.9% |
| Tablet | 3 | 14.3% |
| No Computing Device | 5 | 23.8% |
| Total | 21 | 100.0% |
Internet Access in Virgil
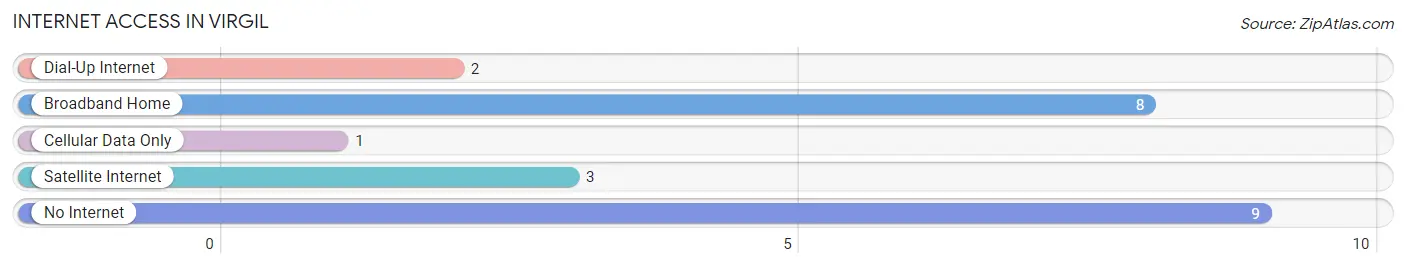
| Internet Type | # Households | % Households |
| Dial-Up Internet | 2 | 9.5% |
| Broadband Home | 8 | 38.1% |
| Cellular Data Only | 1 | 4.8% |
| Satellite Internet | 3 | 14.3% |
| No Internet | 9 | 42.9% |
| Total | 21 | 100.0% |
Virgil Summary
Virgil, Kansas is a small town located in the southeastern corner of the state, in the county of Labette. It is situated on the banks of the Neosho River, and is surrounded by rolling hills and farmland. The town was founded in 1871, and has a population of just over 500 people.
Virgil is a rural community, and the economy is largely based on agriculture. The town is home to several small businesses, including a grocery store, a hardware store, and a few restaurants. The town also has a post office, a bank, and a library.
The geography of Virgil is mostly flat, with some rolling hills in the surrounding area. The town is located in the Neosho River Valley, and is surrounded by farmland. The climate is temperate, with hot summers and cold winters.
The demographics of Virgil are mostly white, with a small percentage of African Americans and Hispanics. The median household income is around $35,000, and the median age is around 40 years old. The town is home to a variety of religious denominations, including Baptist, Methodist, and Catholic.
Virgil is a small town with a rich history. It was founded in 1871, and was originally known as “Virgil Station”. The town was named after Virgil, a Roman poet, and was the first town in Labette County. The town was a stop on the Missouri Pacific Railroad, and was a popular destination for travelers.
In the early 1900s, Virgil was a thriving community, with a variety of businesses and services. The town had a hotel, a bank, a post office, a blacksmith, and a variety of other businesses. The town also had a school, and a variety of churches.
Virgil has seen its share of hard times, but it has managed to remain a vibrant community. The town is home to a variety of businesses, and is a popular destination for tourists. The town is also home to a variety of festivals and events, including the annual Virgil Days celebration.
Virgil is a small town with a big heart. It is a place where people come together to celebrate their heritage and to enjoy the beauty of the surrounding countryside. It is a place where people can come together to share their stories and to build a better future.
Common Questions
What is Per Capita Income in Virgil?
Per Capita income in Virgil is $37,782.
What is the Median Family Income in Virgil?
Median Family Income in Virgil is $77,083.
What is the Median Household income in Virgil?
Median Household Income in Virgil is $43,750.
What is Inequality or Gini Index in Virgil?
Inequality or Gini Index in Virgil is 0.28.
What is the Total Population of Virgil?
Total Population of Virgil is 33.
What is the Total Male Population of Virgil?
Total Male Population of Virgil is 8.
What is the Total Female Population of Virgil?
Total Female Population of Virgil is 25.
What is the Ratio of Males per 100 Females in Virgil?
There are 32.00 Males per 100 Females in Virgil.
What is the Ratio of Females per 100 Males in Virgil?
There are 312.50 Females per 100 Males in Virgil.
What is the Median Population Age in Virgil?
Median Population Age in Virgil is 64.5 Years.
What is the Average Family Size in Virgil
Average Family Size in Virgil is 2.7 People.
What is the Average Household Size in Virgil
Average Household Size in Virgil is 1.6 People.
How Large is the Labor Force in Virgil?
There are 18 People in the Labor Forcein in Virgil.
What is the Percentage of People in the Labor Force in Virgil?
54.5% of People are in the Labor Force in Virgil.