Rogersville, PA Map & Demographics
Rogersville Map
Rogersville Overview
$26,223
PER CAPITA INCOME
$77,824
AVG FAMILY INCOME
$56,667
AVG HOUSEHOLD INCOME
20.3%
WAGE / INCOME GAP [ % ]
79.7¢/ $1
WAGE / INCOME GAP [ $ ]
0.29
INEQUALITY / GINI INDEX
238
TOTAL POPULATION
135
MALE POPULATION
103
FEMALE POPULATION
131.07
MALES / 100 FEMALES
76.30
FEMALES / 100 MALES
36.3
MEDIAN AGE
2.9
AVG FAMILY SIZE
2.5
AVG HOUSEHOLD SIZE
149
LABOR FORCE [ PEOPLE ]
81.0%
PERCENT IN LABOR FORCE
Rogersville Zip Codes
Rogersville Area Codes
Income in Rogersville
Income Overview in Rogersville
Per Capita Income in Rogersville is $26,223, while median incomes of families and households are $77,824 and $56,667 respectively.
| Characteristic | Number | Measure |
| Per Capita Income | 238 | $26,223 |
| Median Family Income | 55 | $77,824 |
| Mean Family Income | 55 | $70,498 |
| Median Household Income | 94 | $56,667 |
| Mean Household Income | 94 | $62,759 |
| Income Deficit | 55 | $0 |
| Wage / Income Gap (%) | 238 | 20.28% |
| Wage / Income Gap ($) | 238 | 79.72¢ per $1 |
| Gini / Inequality Index | 238 | 0.29 |
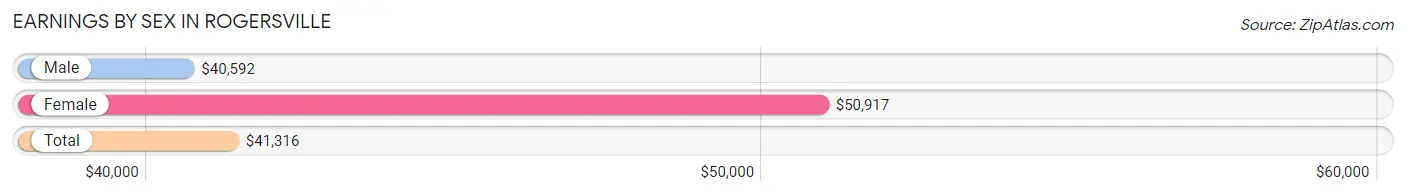
Earnings by Sex in Rogersville
Average Earnings in Rogersville are $41,316, $40,592 for men and $50,917 for women, a difference of 20.3%.
| Sex | Number | Average Earnings |
| Male | 95 (63.3%) | $40,592 |
| Female | 55 (36.7%) | $50,917 |
| Total | 150 (100.0%) | $41,316 |
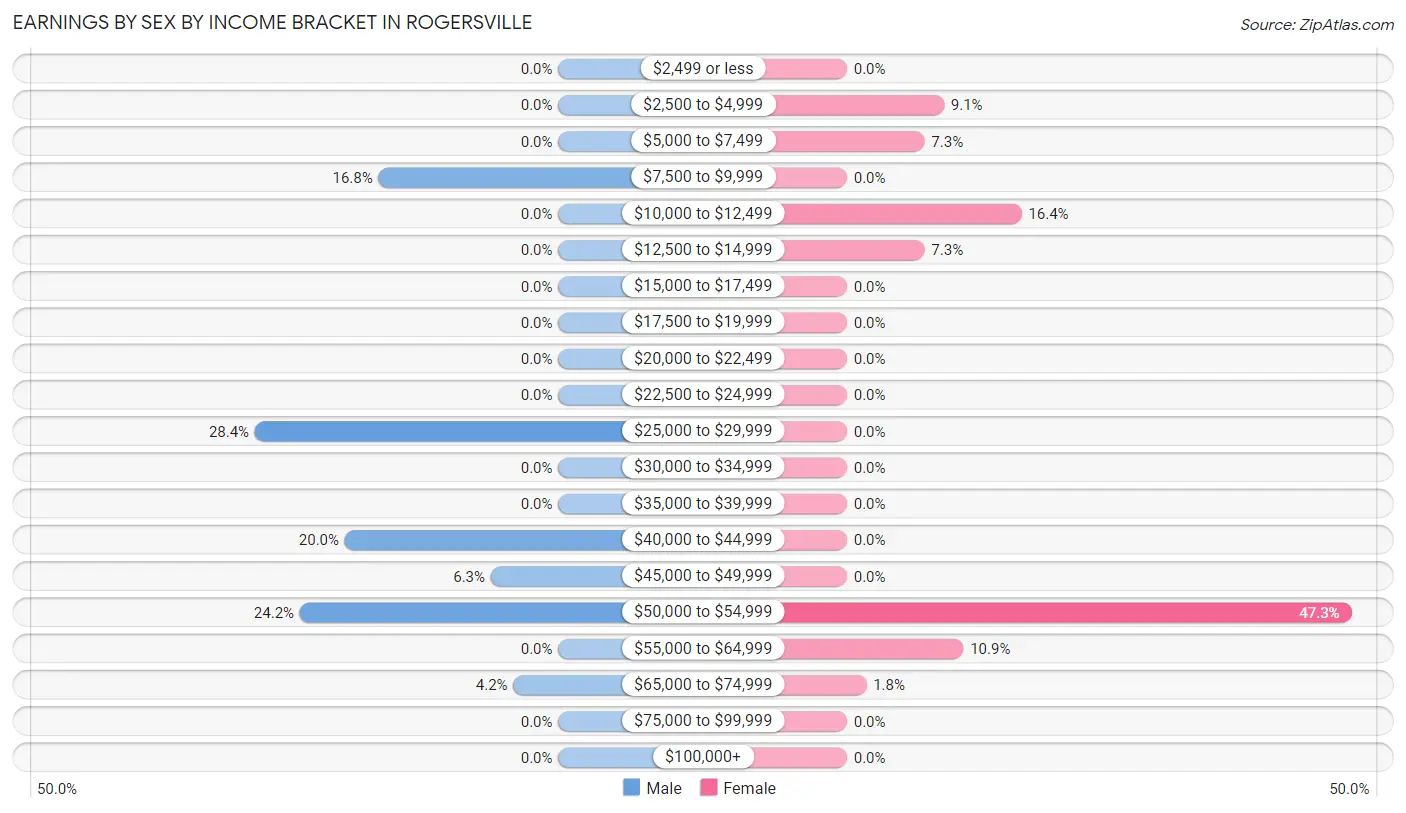
Earnings by Sex by Income Bracket in Rogersville
The most common earnings brackets in Rogersville are $25,000 to $29,999 for men (27 | 28.4%) and $50,000 to $54,999 for women (26 | 47.3%).
| Income | Male | Female |
| $2,499 or less | 0 (0.0%) | 0 (0.0%) |
| $2,500 to $4,999 | 0 (0.0%) | 5 (9.1%) |
| $5,000 to $7,499 | 0 (0.0%) | 4 (7.3%) |
| $7,500 to $9,999 | 16 (16.8%) | 0 (0.0%) |
| $10,000 to $12,499 | 0 (0.0%) | 9 (16.4%) |
| $12,500 to $14,999 | 0 (0.0%) | 4 (7.3%) |
| $15,000 to $17,499 | 0 (0.0%) | 0 (0.0%) |
| $17,500 to $19,999 | 0 (0.0%) | 0 (0.0%) |
| $20,000 to $22,499 | 0 (0.0%) | 0 (0.0%) |
| $22,500 to $24,999 | 0 (0.0%) | 0 (0.0%) |
| $25,000 to $29,999 | 27 (28.4%) | 0 (0.0%) |
| $30,000 to $34,999 | 0 (0.0%) | 0 (0.0%) |
| $35,000 to $39,999 | 0 (0.0%) | 0 (0.0%) |
| $40,000 to $44,999 | 19 (20.0%) | 0 (0.0%) |
| $45,000 to $49,999 | 6 (6.3%) | 0 (0.0%) |
| $50,000 to $54,999 | 23 (24.2%) | 26 (47.3%) |
| $55,000 to $64,999 | 0 (0.0%) | 6 (10.9%) |
| $65,000 to $74,999 | 4 (4.2%) | 1 (1.8%) |
| $75,000 to $99,999 | 0 (0.0%) | 0 (0.0%) |
| $100,000+ | 0 (0.0%) | 0 (0.0%) |
| Total | 95 (100.0%) | 55 (100.0%) |
Earnings by Sex by Educational Attainment in Rogersville
| Educational Attainment | Male Income | Female Income |
| Less than High School | - | - |
| High School Diploma | - | - |
| College or Associate's Degree | - | - |
| Bachelor's Degree | - | - |
| Graduate Degree | - | - |
| Total | - | - |
Family Income in Rogersville
Family Income Brackets in Rogersville
According to the Rogersville family income data, there are 27 families falling into the $75,000 to $99,999 income range, which is the most common income bracket and makes up 49.1% of all families.
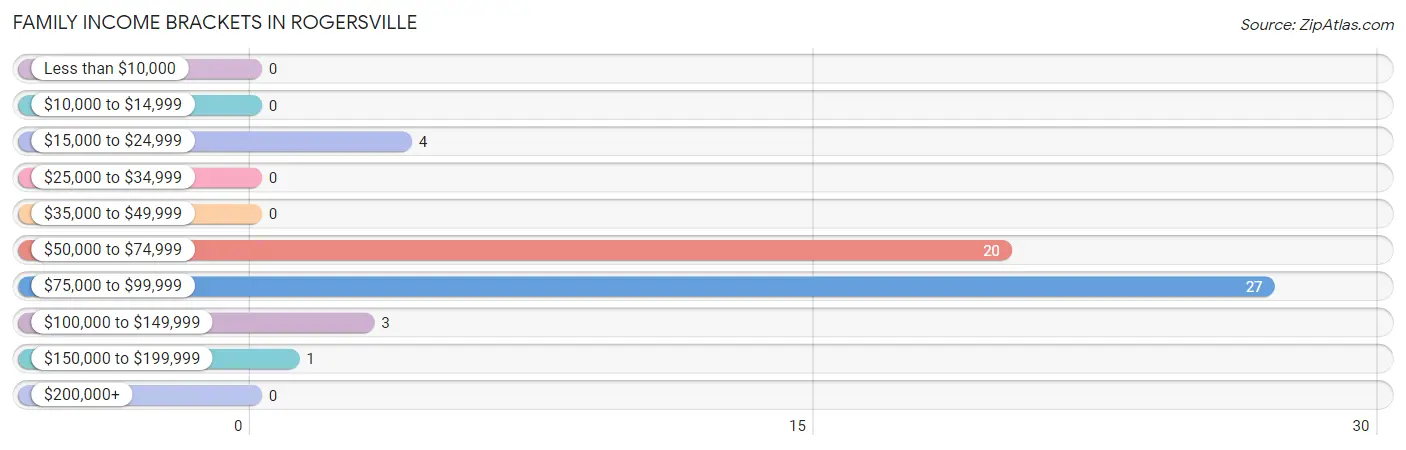
| Income Bracket | # Families | % Families |
| Less than $10,000 | 0 | 0.0% |
| $10,000 to $14,999 | 0 | 0.0% |
| $15,000 to $24,999 | 4 | 7.3% |
| $25,000 to $34,999 | 0 | 0.0% |
| $35,000 to $49,999 | 0 | 0.0% |
| $50,000 to $74,999 | 20 | 36.4% |
| $75,000 to $99,999 | 27 | 49.1% |
| $100,000 to $149,999 | 3 | 5.5% |
| $150,000 to $199,999 | 1 | 1.8% |
| $200,000+ | 0 | 0.0% |
Family Income by Famaliy Size in Rogersville
3-person families (32 | 58.2%) account for the highest median family income in Rogersville with $78,796 per family, while 2-person families (16 | 29.1%) have the highest median income of $26,932 per family member.
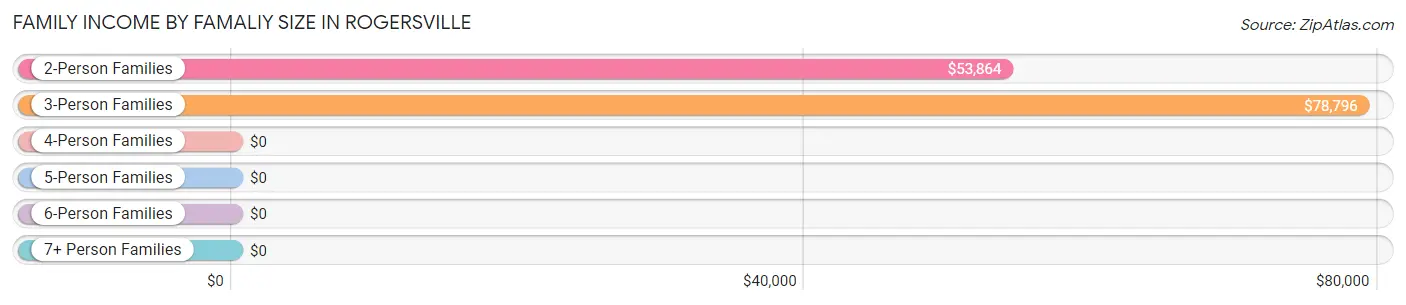
| Income Bracket | # Families | Median Income |
| 2-Person Families | 16 (29.1%) | $53,864 |
| 3-Person Families | 32 (58.2%) | $78,796 |
| 4-Person Families | 6 (10.9%) | $0 |
| 5-Person Families | 0 (0.0%) | $0 |
| 6-Person Families | 1 (1.8%) | $0 |
| 7+ Person Families | 0 (0.0%) | $0 |
| Total | 55 (100.0%) | $77,824 |
Family Income by Number of Earners in Rogersville
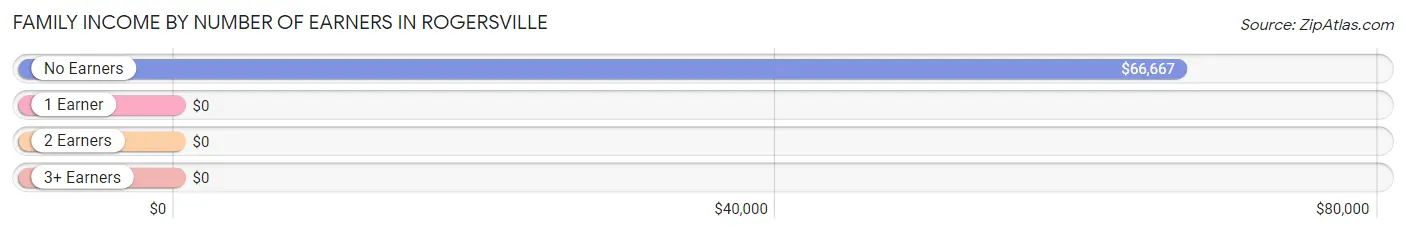
| Number of Earners | # Families | Median Income |
| No Earners | 8 (14.5%) | $66,667 |
| 1 Earner | 17 (30.9%) | $0 |
| 2 Earners | 29 (52.7%) | $0 |
| 3+ Earners | 1 (1.8%) | $0 |
| Total | 55 (100.0%) | $77,824 |
Household Income in Rogersville
Household Income Brackets in Rogersville
With 28 households falling in the category, the $50,000 to $74,999 income range is the most frequent in Rogersville, accounting for 29.8% of all households.
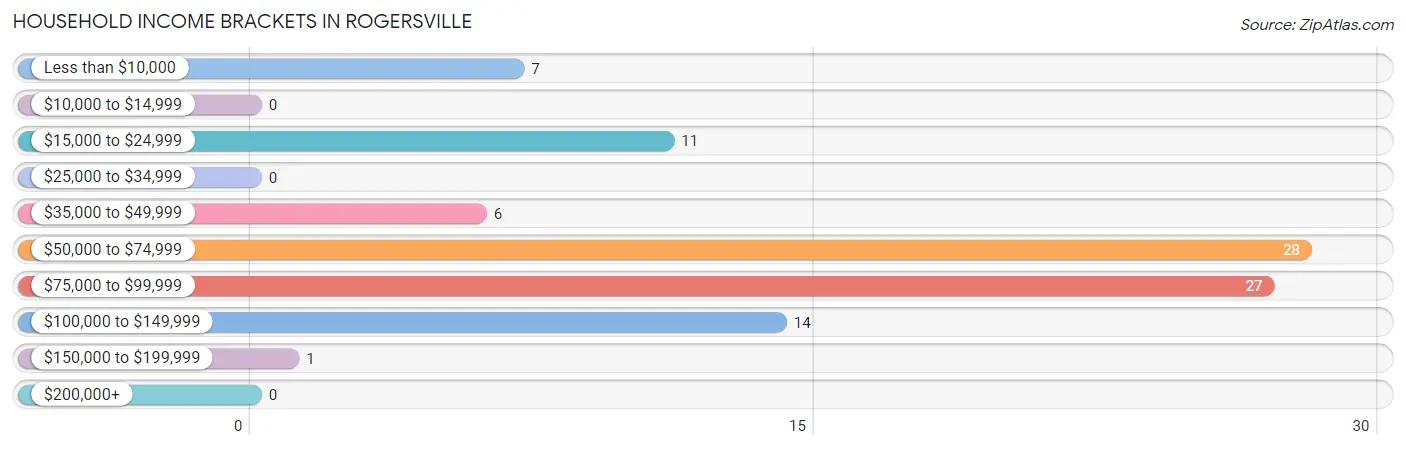
| Income Bracket | # Households | % Households |
| Less than $10,000 | 7 | 7.4% |
| $10,000 to $14,999 | 0 | 0.0% |
| $15,000 to $24,999 | 11 | 11.7% |
| $25,000 to $34,999 | 0 | 0.0% |
| $35,000 to $49,999 | 6 | 6.4% |
| $50,000 to $74,999 | 28 | 29.8% |
| $75,000 to $99,999 | 27 | 28.7% |
| $100,000 to $149,999 | 14 | 14.9% |
| $150,000 to $199,999 | 1 | 1.1% |
| $200,000+ | 0 | 0.0% |
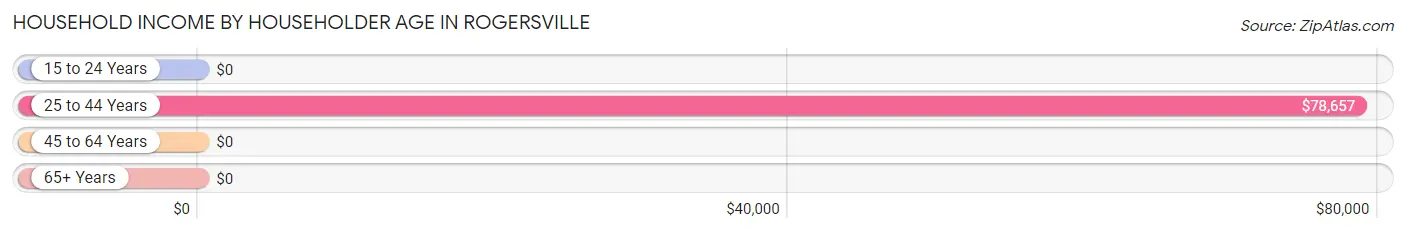
Household Income by Householder Age in Rogersville
The median household income in Rogersville is $56,667, with the highest median household income of $78,657 found in the 25 to 44 years age bracket for the primary householder. A total of 53 households (56.4%) fall into this category. Meanwhile, the 15 to 24 years age bracket for the primary householder has the lowest median household income of $0, with 19 households (20.2%) in this group.
| Income Bracket | # Households | Median Income |
| 15 to 24 Years | 19 (20.2%) | $0 |
| 25 to 44 Years | 53 (56.4%) | $78,657 |
| 45 to 64 Years | 7 (7.4%) | $0 |
| 65+ Years | 15 (16.0%) | $0 |
| Total | 94 (100.0%) | $56,667 |
Poverty in Rogersville
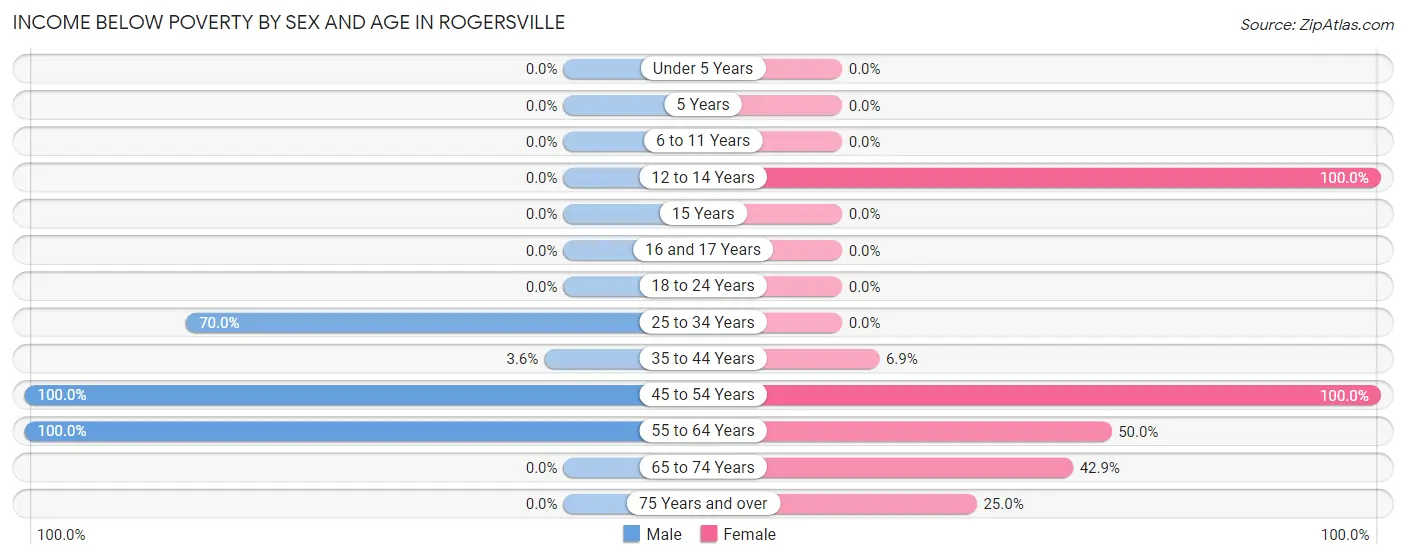
Income Below Poverty by Sex and Age in Rogersville
With 15.6% poverty level for males and 15.5% for females among the residents of Rogersville, 45 to 54 year old males and 12 to 14 year old females are the most vulnerable to poverty, with 2 males (100.0%) and 1 females (100.0%) in their respective age groups living below the poverty level.
| Age Bracket | Male | Female |
| Under 5 Years | 0 (0.0%) | 0 (0.0%) |
| 5 Years | 0 (0.0%) | 0 (0.0%) |
| 6 to 11 Years | 0 (0.0%) | 0 (0.0%) |
| 12 to 14 Years | 0 (0.0%) | 1 (100.0%) |
| 15 Years | 0 (0.0%) | 0 (0.0%) |
| 16 and 17 Years | 0 (0.0%) | 0 (0.0%) |
| 18 to 24 Years | 0 (0.0%) | 0 (0.0%) |
| 25 to 34 Years | 14 (70.0%) | 0 (0.0%) |
| 35 to 44 Years | 2 (3.6%) | 2 (6.9%) |
| 45 to 54 Years | 2 (100.0%) | 2 (100.0%) |
| 55 to 64 Years | 3 (100.0%) | 4 (50.0%) |
| 65 to 74 Years | 0 (0.0%) | 6 (42.9%) |
| 75 Years and over | 0 (0.0%) | 1 (25.0%) |
| Total | 21 (15.6%) | 16 (15.5%) |
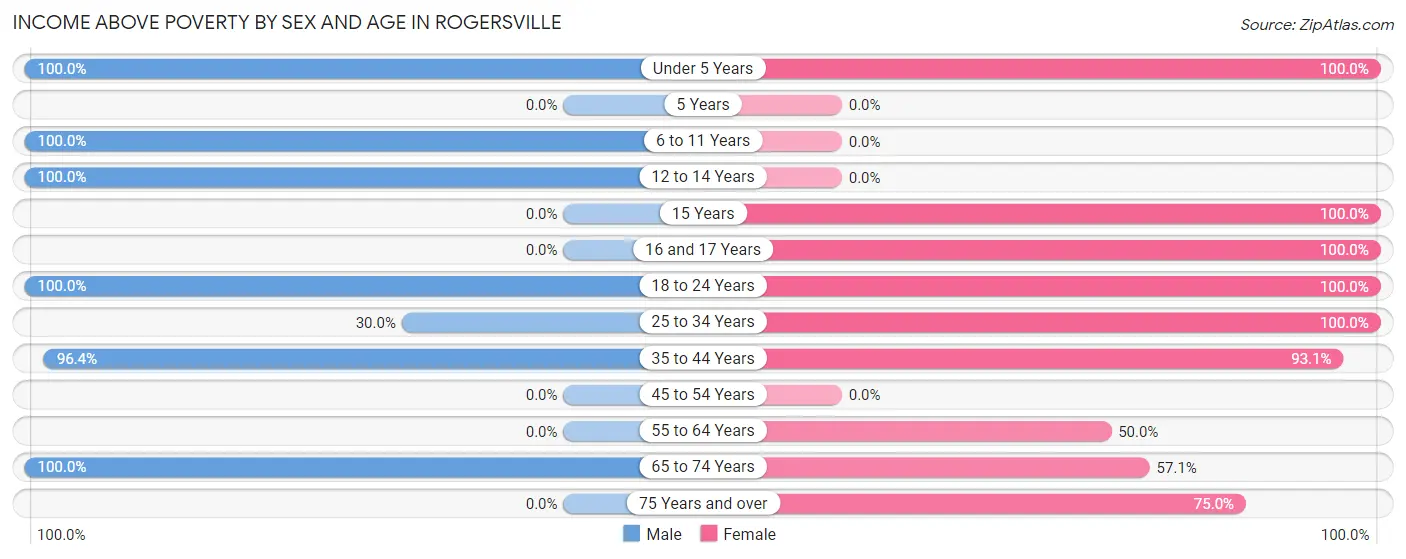
Income Above Poverty by Sex and Age in Rogersville
According to the poverty statistics in Rogersville, males aged under 5 years and females aged under 5 years are the age groups that are most secure financially, with 100.0% of males and 100.0% of females in these age groups living above the poverty line.
| Age Bracket | Male | Female |
| Under 5 Years | 5 (100.0%) | 4 (100.0%) |
| 5 Years | 0 (0.0%) | 0 (0.0%) |
| 6 to 11 Years | 21 (100.0%) | 0 (0.0%) |
| 12 to 14 Years | 3 (100.0%) | 0 (0.0%) |
| 15 Years | 0 (0.0%) | 20 (100.0%) |
| 16 and 17 Years | 0 (0.0%) | 9 (100.0%) |
| 18 to 24 Years | 19 (100.0%) | 6 (100.0%) |
| 25 to 34 Years | 6 (30.0%) | 6 (100.0%) |
| 35 to 44 Years | 54 (96.4%) | 27 (93.1%) |
| 45 to 54 Years | 0 (0.0%) | 0 (0.0%) |
| 55 to 64 Years | 0 (0.0%) | 4 (50.0%) |
| 65 to 74 Years | 6 (100.0%) | 8 (57.1%) |
| 75 Years and over | 0 (0.0%) | 3 (75.0%) |
| Total | 114 (84.4%) | 87 (84.5%) |
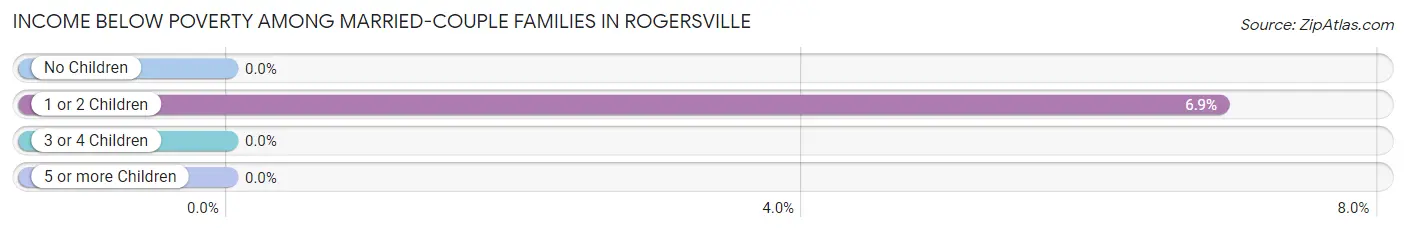
Income Below Poverty Among Married-Couple Families in Rogersville
The poverty statistics for married-couple families in Rogersville show that 5.6% or 2 of the total 36 families live below the poverty line. Families with 1 or 2 children have the highest poverty rate of 6.9%, comprising of 2 families. On the other hand, families with no children have the lowest poverty rate of 0.0%, which includes 0 families.
| Children | Above Poverty | Below Poverty |
| No Children | 6 (100.0%) | 0 (0.0%) |
| 1 or 2 Children | 27 (93.1%) | 2 (6.9%) |
| 3 or 4 Children | 1 (100.0%) | 0 (0.0%) |
| 5 or more Children | 0 (0.0%) | 0 (0.0%) |
| Total | 34 (94.4%) | 2 (5.6%) |
Income Below Poverty Among Single-Parent Households in Rogersville
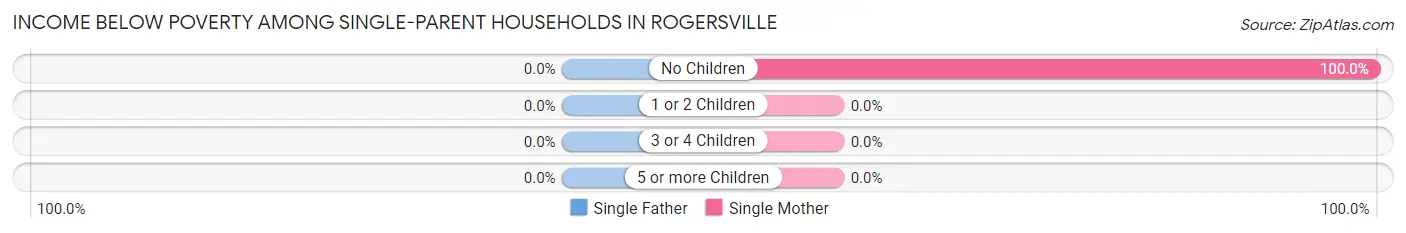
| Children | Single Father | Single Mother |
| No Children | 0 (0.0%) | 2 (100.0%) |
| 1 or 2 Children | 0 (0.0%) | 0 (0.0%) |
| 3 or 4 Children | 0 (0.0%) | 0 (0.0%) |
| 5 or more Children | 0 (0.0%) | 0 (0.0%) |
| Total | 0 (0.0%) | 2 (10.5%) |
Income Below Poverty Among Married-Couple vs Single-Parent Households in Rogersville
The poverty data for Rogersville shows that 2 of the married-couple family households (5.6%) and 2 of the single-parent households (10.5%) are living below the poverty level. Within the married-couple family households, those with 1 or 2 children have the highest poverty rate, with 2 households (6.9%) falling below the poverty line. Among the single-parent households, those with no children have the highest poverty rate, with 2 household (100.0%) living below poverty.
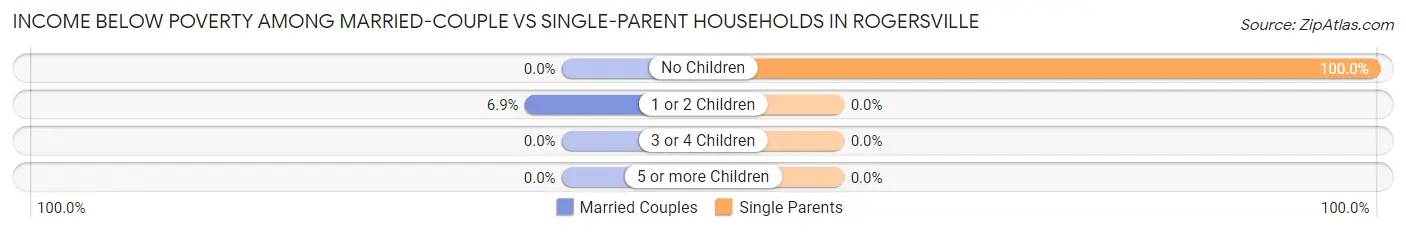
| Children | Married-Couple Families | Single-Parent Households |
| No Children | 0 (0.0%) | 2 (100.0%) |
| 1 or 2 Children | 2 (6.9%) | 0 (0.0%) |
| 3 or 4 Children | 0 (0.0%) | 0 (0.0%) |
| 5 or more Children | 0 (0.0%) | 0 (0.0%) |
| Total | 2 (5.6%) | 2 (10.5%) |
Race in Rogersville
The most populous races in Rogersville are White / Caucasian (237 | 99.6%), and Two or more Races (1 | 0.4%).
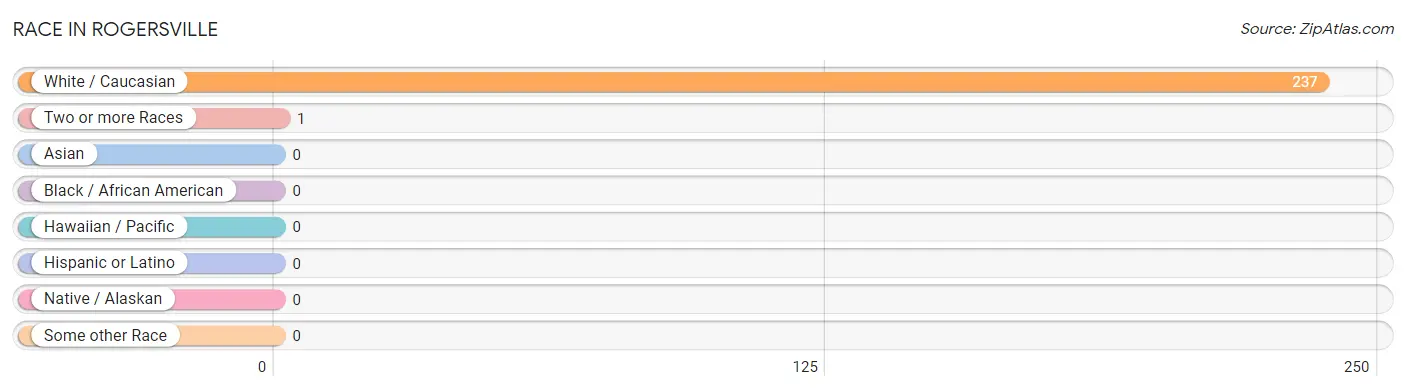
| Race | # Population | % Population |
| Asian | 0 | 0.0% |
| Black / African American | 0 | 0.0% |
| Hawaiian / Pacific | 0 | 0.0% |
| Hispanic or Latino | 0 | 0.0% |
| Native / Alaskan | 0 | 0.0% |
| White / Caucasian | 237 | 99.6% |
| Two or more Races | 1 | 0.4% |
| Some other Race | 0 | 0.0% |
| Total | 238 | 100.0% |
Ancestry in Rogersville
The most populous ancestries reported in Rogersville are American (72 | 30.2%), Irish (44 | 18.5%), Italian (23 | 9.7%), German (16 | 6.7%), and English (13 | 5.5%), together accounting for 70.6% of all Rogersville residents.
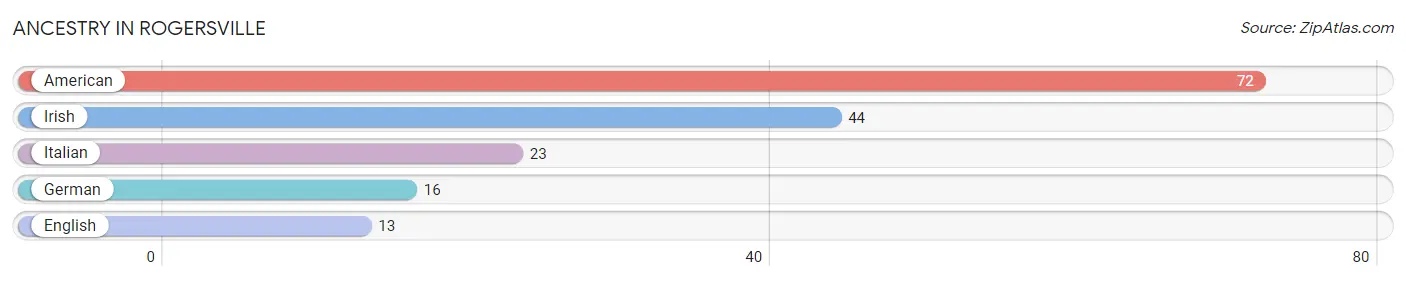
| Ancestry | # Population | % Population |
| American | 72 | 30.2% |
| English | 13 | 5.5% |
| German | 16 | 6.7% |
| Irish | 44 | 18.5% |
| Italian | 23 | 9.7% | View All 5 Rows |
Immigrants in Rogersville

| Immigration Origin | # Population | % Population | View All 0 Rows |
Sex and Age in Rogersville
Sex and Age in Rogersville
The most populous age groups in Rogersville are 35 to 39 Years (29 | 21.5%) for men and 15 to 19 Years (29 | 28.2%) for women.
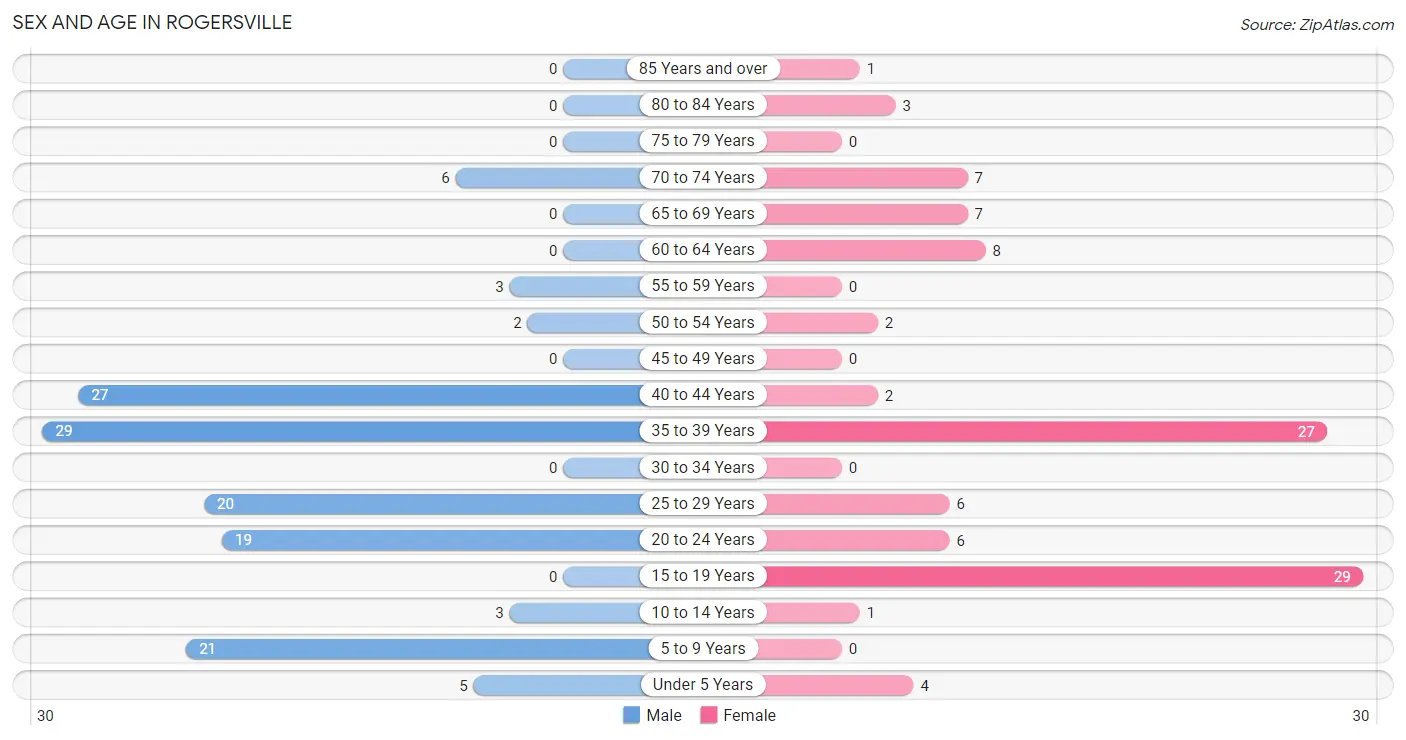
| Age Bracket | Male | Female |
| Under 5 Years | 5 (3.7%) | 4 (3.9%) |
| 5 to 9 Years | 21 (15.6%) | 0 (0.0%) |
| 10 to 14 Years | 3 (2.2%) | 1 (1.0%) |
| 15 to 19 Years | 0 (0.0%) | 29 (28.2%) |
| 20 to 24 Years | 19 (14.1%) | 6 (5.8%) |
| 25 to 29 Years | 20 (14.8%) | 6 (5.8%) |
| 30 to 34 Years | 0 (0.0%) | 0 (0.0%) |
| 35 to 39 Years | 29 (21.5%) | 27 (26.2%) |
| 40 to 44 Years | 27 (20.0%) | 2 (1.9%) |
| 45 to 49 Years | 0 (0.0%) | 0 (0.0%) |
| 50 to 54 Years | 2 (1.5%) | 2 (1.9%) |
| 55 to 59 Years | 3 (2.2%) | 0 (0.0%) |
| 60 to 64 Years | 0 (0.0%) | 8 (7.8%) |
| 65 to 69 Years | 0 (0.0%) | 7 (6.8%) |
| 70 to 74 Years | 6 (4.4%) | 7 (6.8%) |
| 75 to 79 Years | 0 (0.0%) | 0 (0.0%) |
| 80 to 84 Years | 0 (0.0%) | 3 (2.9%) |
| 85 Years and over | 0 (0.0%) | 1 (1.0%) |
| Total | 135 (100.0%) | 103 (100.0%) |
Families and Households in Rogersville
Median Family Size in Rogersville
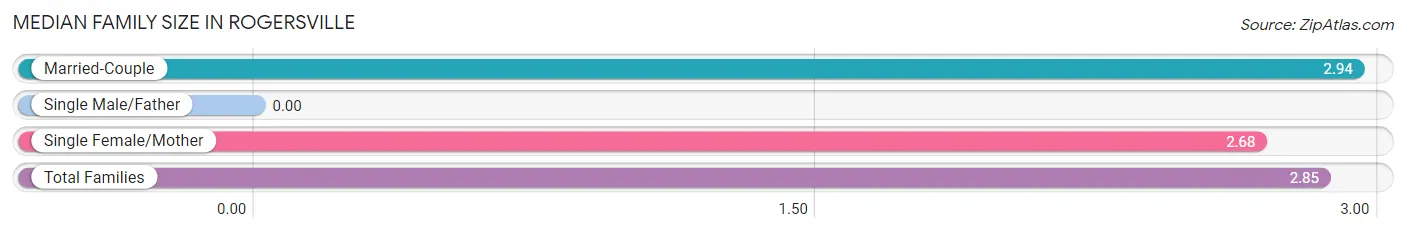
| Family Type | # Families | Family Size |
| Married-Couple | 36 (65.4%) | 2.94 |
| Single Male/Father | 0 (0.0%) | - |
| Single Female/Mother | 19 (34.5%) | 2.68 |
| Total Families | 55 (100.0%) | 2.85 |
Median Household Size in Rogersville
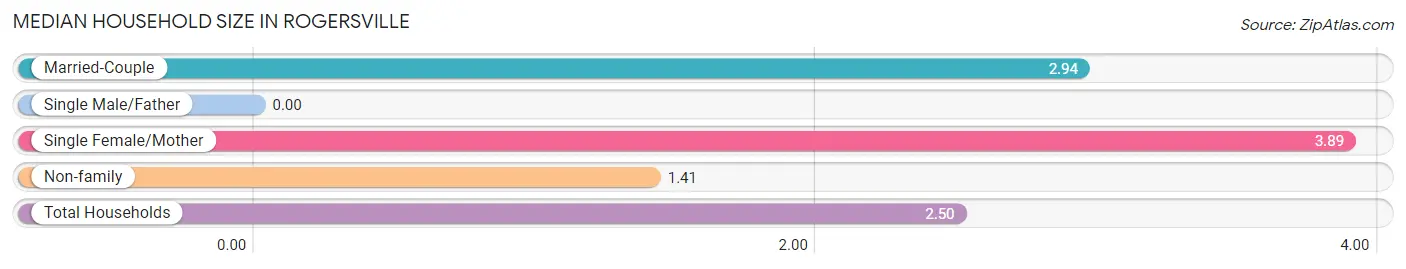
| Household Type | # Households | Household Size |
| Married-Couple | 36 (38.3%) | 2.94 |
| Single Male/Father | 0 (0.0%) | - |
| Single Female/Mother | 19 (20.2%) | 3.89 |
| Non-family | 39 (41.5%) | 1.41 |
| Total Households | 94 (100.0%) | 2.50 |
Household Size by Marriage Status in Rogersville
Out of a total of 94 households in Rogersville, 55 (58.5%) are family households, while 39 (41.5%) are nonfamily households. The most numerous type of family households are 3-person households, comprising 43, and the most common type of nonfamily households are 2-person households, comprising 22.
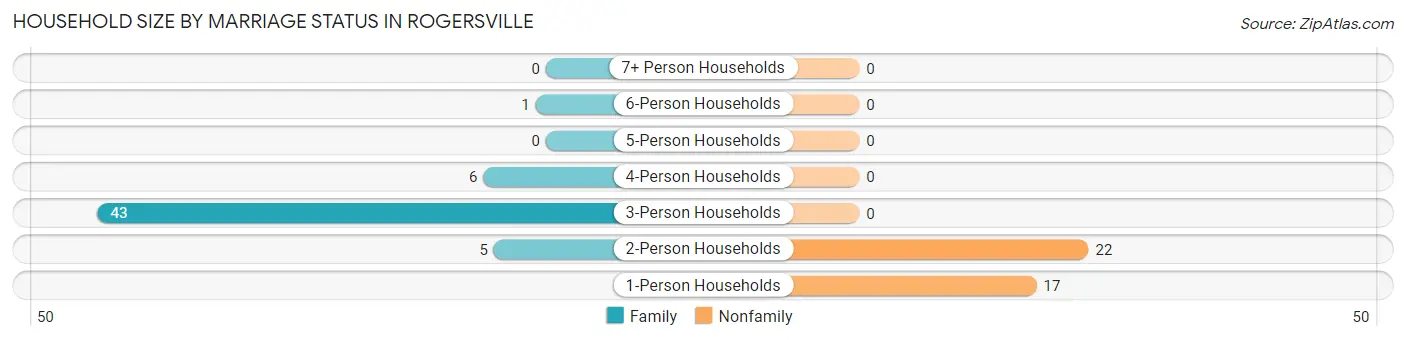
| Household Size | Family Households | Nonfamily Households |
| 1-Person Households | - | 17 (18.1%) |
| 2-Person Households | 5 (5.3%) | 22 (23.4%) |
| 3-Person Households | 43 (45.7%) | 0 (0.0%) |
| 4-Person Households | 6 (6.4%) | 0 (0.0%) |
| 5-Person Households | 0 (0.0%) | 0 (0.0%) |
| 6-Person Households | 1 (1.1%) | 0 (0.0%) |
| 7+ Person Households | 0 (0.0%) | 0 (0.0%) |
| Total | 55 (58.5%) | 39 (41.5%) |
Female Fertility in Rogersville
Fertility by Age in Rogersville
| Age Bracket | Women with Births | Births / 1,000 Women |
| 15 to 19 years | 0 (0.0%) | 0.0 |
| 20 to 34 years | 0 (0.0%) | 0.0 |
| 35 to 50 years | 0 (0.0%) | 0.0 |
| Total | 0 (0.0%) | 0.0 |
Fertility by Age by Marriage Status in Rogersville
| Age Bracket | Married | Unmarried |
| 15 to 19 years | 0 (0.0%) | 0 (0.0%) |
| 20 to 34 years | 0 (0.0%) | 0 (0.0%) |
| 35 to 50 years | 0 (0.0%) | 0 (0.0%) |
| Total | 0 (0.0%) | 0 (0.0%) |
Fertility by Education in Rogersville
| Educational Attainment | Women with Births | Births / 1,000 Women |
| Less than High School | 0 (0.0%) | 0.0 |
| High School Diploma | 0 (0.0%) | 0.0 |
| College or Associate's Degree | 0 (0.0%) | 0.0 |
| Bachelor's Degree | 0 (0.0%) | 0.0 |
| Graduate Degree | 0 (0.0%) | 0.0 |
| Total | 0 (0.0%) | 0.0 |
Fertility by Education by Marriage Status in Rogersville
| Educational Attainment | Married | Unmarried |
| Less than High School | 0 (0.0%) | 0 (0.0%) |
| High School Diploma | 0 (0.0%) | 0 (0.0%) |
| College or Associate's Degree | 0 (0.0%) | 0 (0.0%) |
| Bachelor's Degree | 0 (0.0%) | 0 (0.0%) |
| Graduate Degree | 0 (0.0%) | 0 (0.0%) |
| Total | 0 (0.0%) | 0 (0.0%) |
Employment Characteristics in Rogersville
Employment by Class of Employer in Rogersville
Among the 149 employed individuals in Rogersville, private company employees (125 | 83.9%), local government employees (19 | 12.8%), and not-for-profit organizations (5 | 3.4%) make up the most common classes of employment.
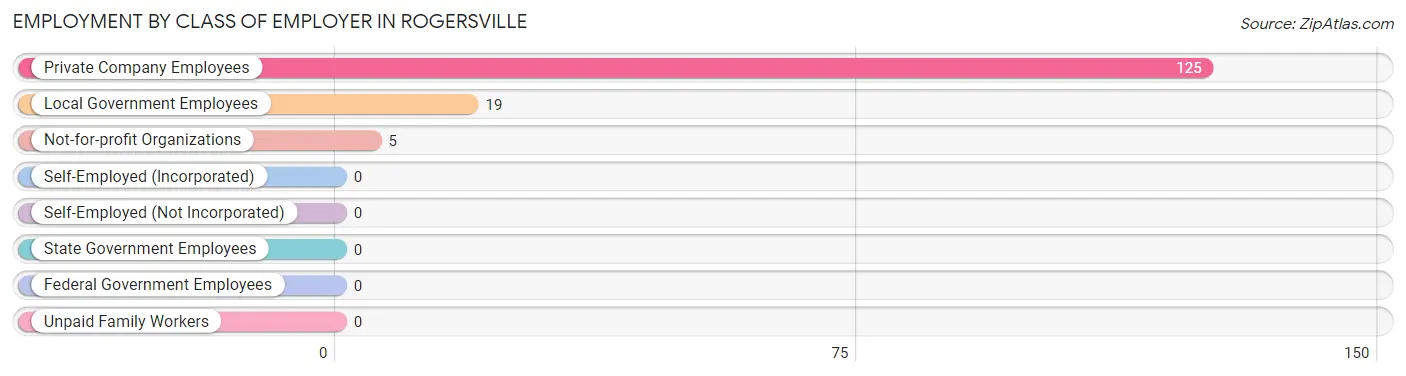
| Employer Class | # Employees | % Employees |
| Private Company Employees | 125 | 83.9% |
| Self-Employed (Incorporated) | 0 | 0.0% |
| Self-Employed (Not Incorporated) | 0 | 0.0% |
| Not-for-profit Organizations | 5 | 3.4% |
| Local Government Employees | 19 | 12.8% |
| State Government Employees | 0 | 0.0% |
| Federal Government Employees | 0 | 0.0% |
| Unpaid Family Workers | 0 | 0.0% |
| Total | 149 | 100.0% |
Employment Status by Age in Rogersville
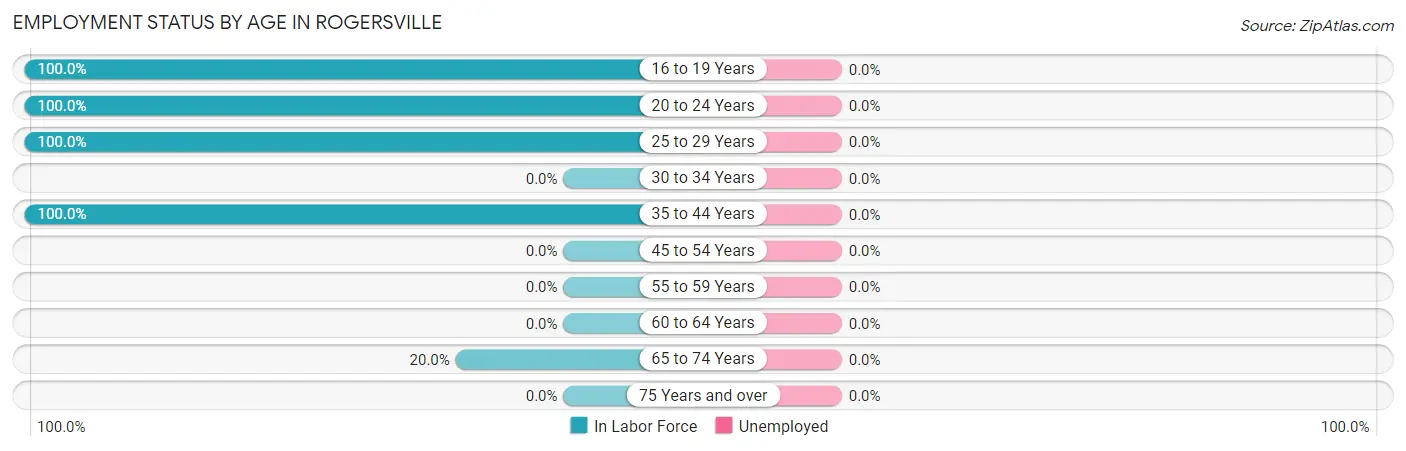
| Age Bracket | In Labor Force | Unemployed |
| 16 to 19 Years | 9 (100.0%) | 0 (0.0%) |
| 20 to 24 Years | 25 (100.0%) | 0 (0.0%) |
| 25 to 29 Years | 26 (100.0%) | 0 (0.0%) |
| 30 to 34 Years | 0 (0.0%) | 0 (0.0%) |
| 35 to 44 Years | 85 (100.0%) | 0 (0.0%) |
| 45 to 54 Years | 0 (0.0%) | 0 (0.0%) |
| 55 to 59 Years | 0 (0.0%) | 0 (0.0%) |
| 60 to 64 Years | 0 (0.0%) | 0 (0.0%) |
| 65 to 74 Years | 4 (20.0%) | 0 (0.0%) |
| 75 Years and over | 0 (0.0%) | 0 (0.0%) |
| Total | 149 (81.0%) | 0 (0.0%) |
Employment Status by Educational Attainment in Rogersville
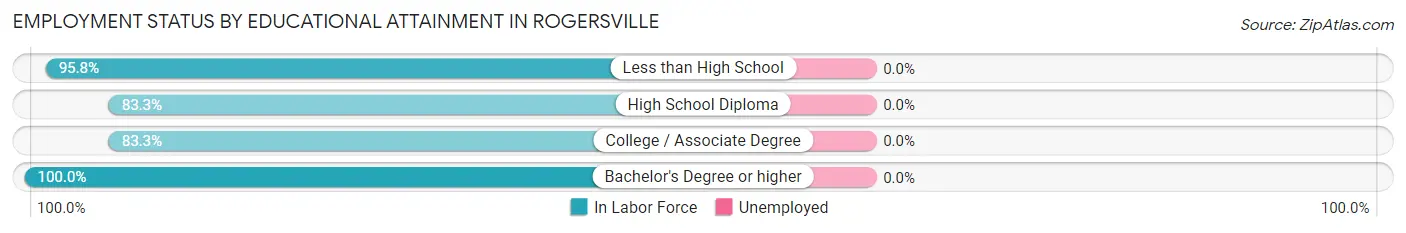
| Educational Attainment | In Labor Force | Unemployed |
| Less than High School | 23 (95.8%) | 0 (0.0%) |
| High School Diploma | 55 (83.3%) | 0 (0.0%) |
| College / Associate Degree | 15 (83.3%) | 0 (0.0%) |
| Bachelor's Degree or higher | 18 (100.0%) | 0 (0.0%) |
| Total | 111 (88.1%) | 0 (0.0%) |
Employment Occupations by Sex in Rogersville
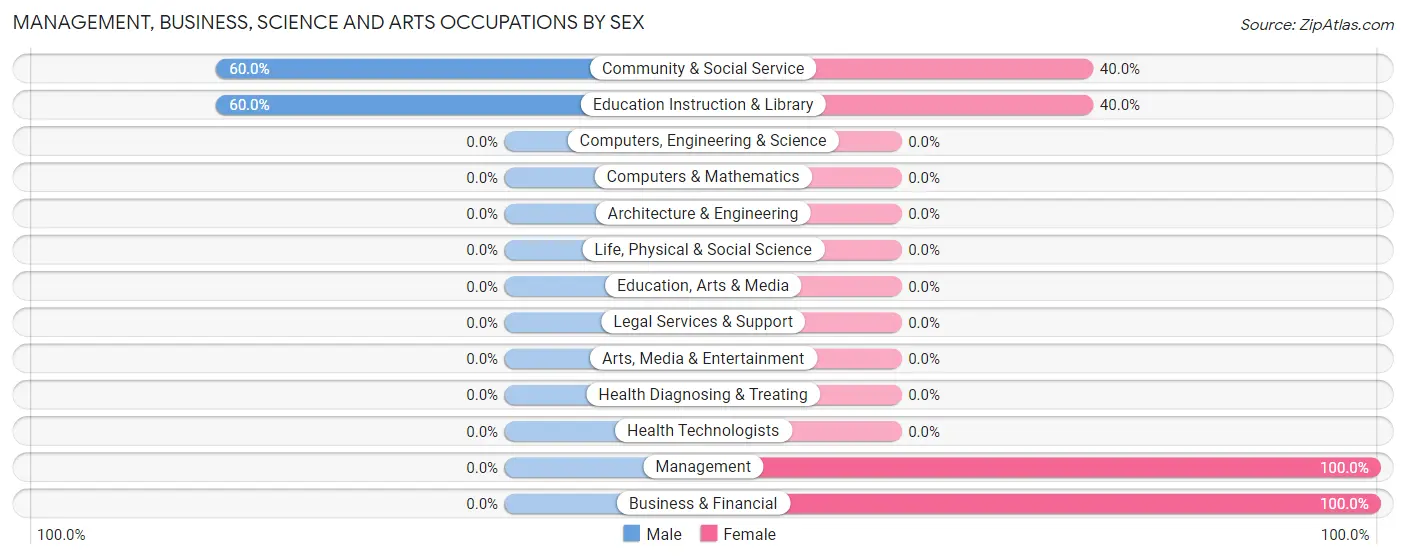
Management, Business, Science and Arts Occupations
The most common Management, Business, Science and Arts occupations in Rogersville are Community & Social Service (10 | 6.7%), Education Instruction & Library (10 | 6.7%), Management (6 | 4.0%), and Business & Financial (1 | 0.7%).
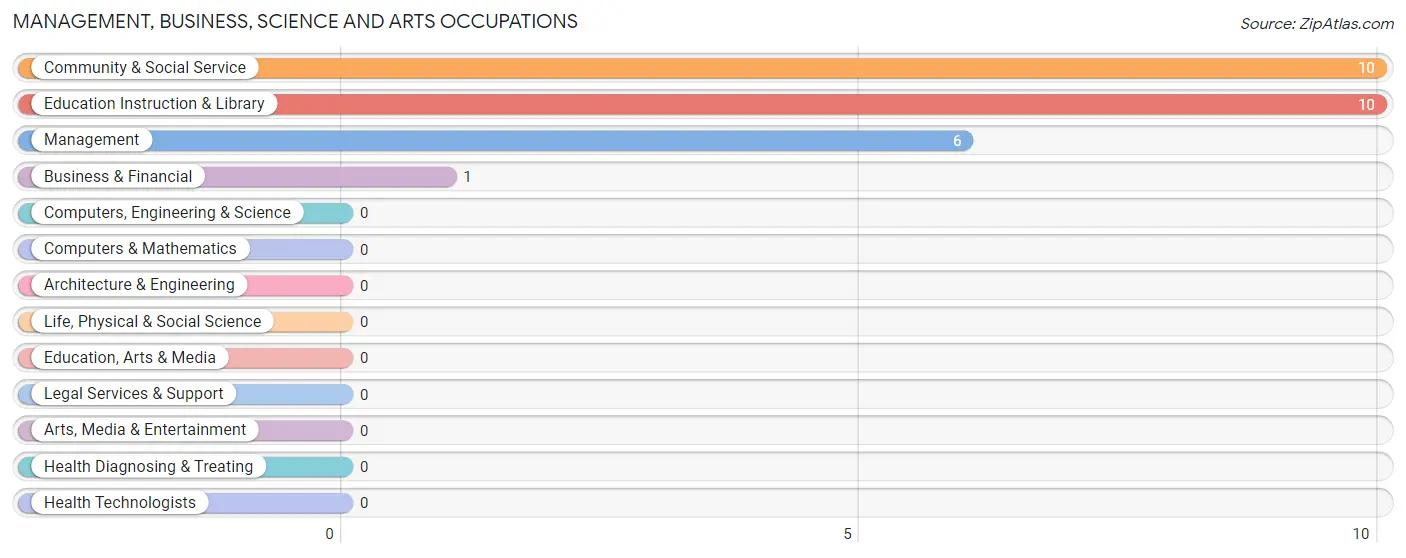
Management, Business, Science and Arts Occupations by Sex
Within the Management, Business, Science and Arts occupations in Rogersville, the most male-oriented occupations are Community & Social Service (60.0%), and Education Instruction & Library (60.0%), while the most female-oriented occupations are Management (100.0%), Business & Financial (100.0%), and Community & Social Service (40.0%).
| Occupation | Male | Female |
| Management | 0 (0.0%) | 6 (100.0%) |
| Business & Financial | 0 (0.0%) | 1 (100.0%) |
| Computers, Engineering & Science | 0 (0.0%) | 0 (0.0%) |
| Computers & Mathematics | 0 (0.0%) | 0 (0.0%) |
| Architecture & Engineering | 0 (0.0%) | 0 (0.0%) |
| Life, Physical & Social Science | 0 (0.0%) | 0 (0.0%) |
| Community & Social Service | 6 (60.0%) | 4 (40.0%) |
| Education, Arts & Media | 0 (0.0%) | 0 (0.0%) |
| Legal Services & Support | 0 (0.0%) | 0 (0.0%) |
| Education Instruction & Library | 6 (60.0%) | 4 (40.0%) |
| Arts, Media & Entertainment | 0 (0.0%) | 0 (0.0%) |
| Health Diagnosing & Treating | 0 (0.0%) | 0 (0.0%) |
| Health Technologists | 0 (0.0%) | 0 (0.0%) |
| Total (Category) | 6 (35.3%) | 11 (64.7%) |
| Total (Overall) | 95 (63.8%) | 54 (36.2%) |
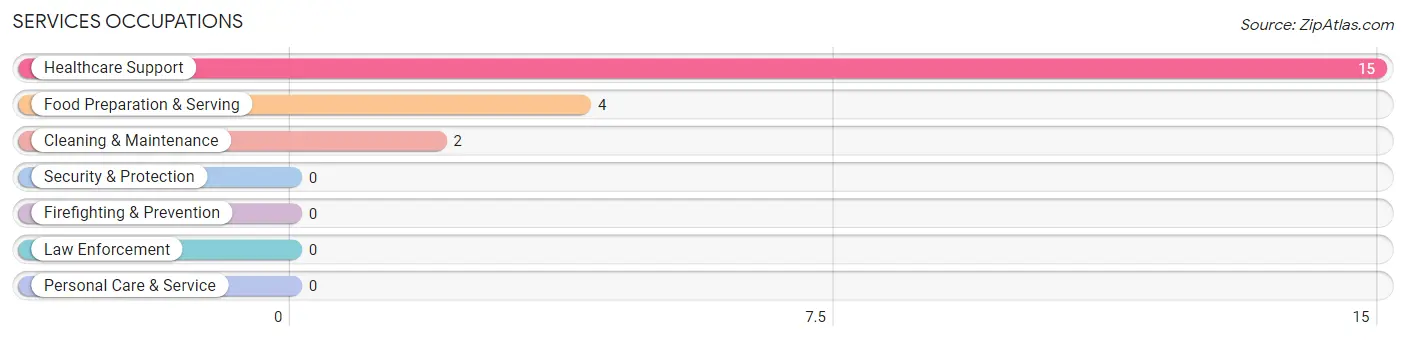
Services Occupations
The most common Services occupations in Rogersville are Healthcare Support (15 | 10.1%), Food Preparation & Serving (4 | 2.7%), and Cleaning & Maintenance (2 | 1.3%).
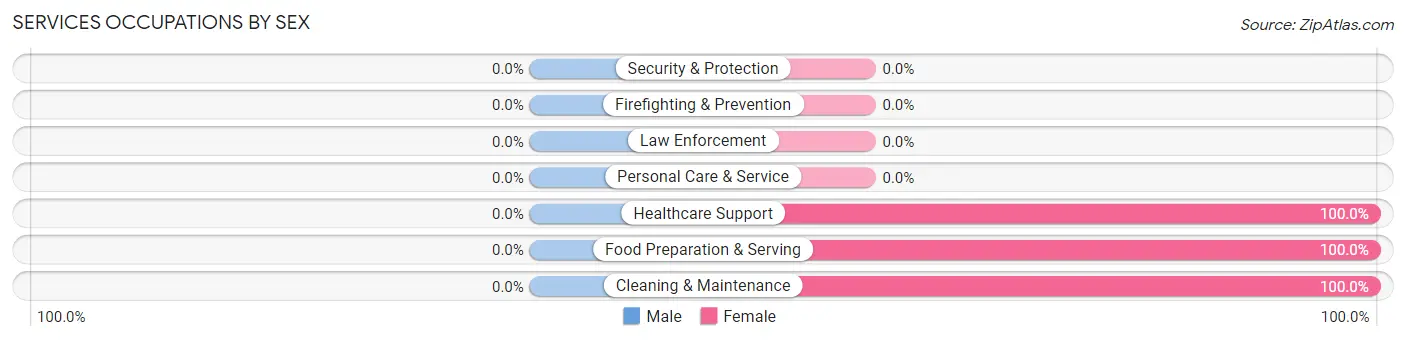
Services Occupations by Sex
| Occupation | Male | Female |
| Healthcare Support | 0 (0.0%) | 15 (100.0%) |
| Security & Protection | 0 (0.0%) | 0 (0.0%) |
| Firefighting & Prevention | 0 (0.0%) | 0 (0.0%) |
| Law Enforcement | 0 (0.0%) | 0 (0.0%) |
| Food Preparation & Serving | 0 (0.0%) | 4 (100.0%) |
| Cleaning & Maintenance | 0 (0.0%) | 2 (100.0%) |
| Personal Care & Service | 0 (0.0%) | 0 (0.0%) |
| Total (Category) | 0 (0.0%) | 21 (100.0%) |
| Total (Overall) | 95 (63.8%) | 54 (36.2%) |
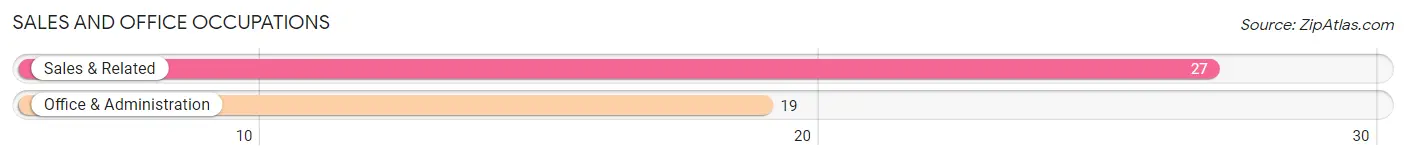
Sales and Office Occupations
The most common Sales and Office occupations in Rogersville are Sales & Related (27 | 18.1%), and Office & Administration (19 | 12.8%).
Sales and Office Occupations by Sex

| Occupation | Male | Female |
| Sales & Related | 27 (100.0%) | 0 (0.0%) |
| Office & Administration | 14 (73.7%) | 5 (26.3%) |
| Total (Category) | 41 (89.1%) | 5 (10.9%) |
| Total (Overall) | 95 (63.8%) | 54 (36.2%) |
Natural Resources, Construction and Maintenance Occupations
The most common Natural Resources, Construction and Maintenance occupations in Rogersville are , and Construction & Extraction (48 | 32.2%).
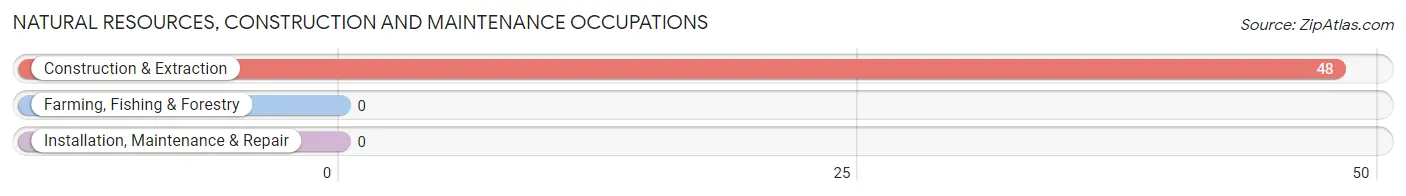
Natural Resources, Construction and Maintenance Occupations by Sex
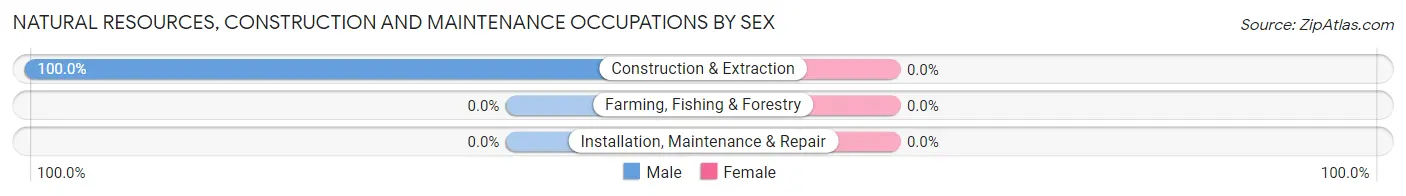
| Occupation | Male | Female |
| Farming, Fishing & Forestry | 0 (0.0%) | 0 (0.0%) |
| Construction & Extraction | 48 (100.0%) | 0 (0.0%) |
| Installation, Maintenance & Repair | 0 (0.0%) | 0 (0.0%) |
| Total (Category) | 48 (100.0%) | 0 (0.0%) |
| Total (Overall) | 95 (63.8%) | 54 (36.2%) |
Production, Transportation and Moving Occupations
The most common Production, Transportation and Moving occupations in Rogersville are Production (11 | 7.4%), and Material Moving (6 | 4.0%).
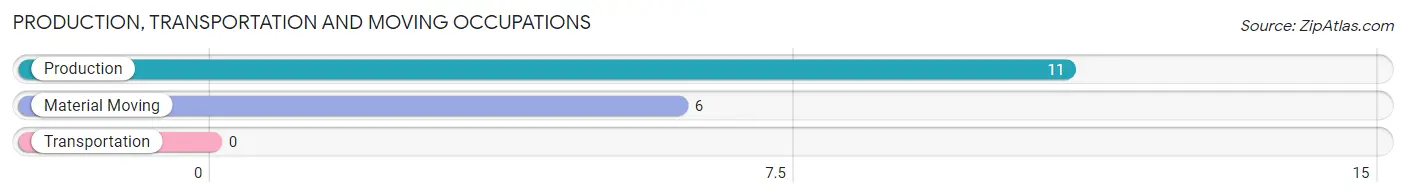
Production, Transportation and Moving Occupations by Sex
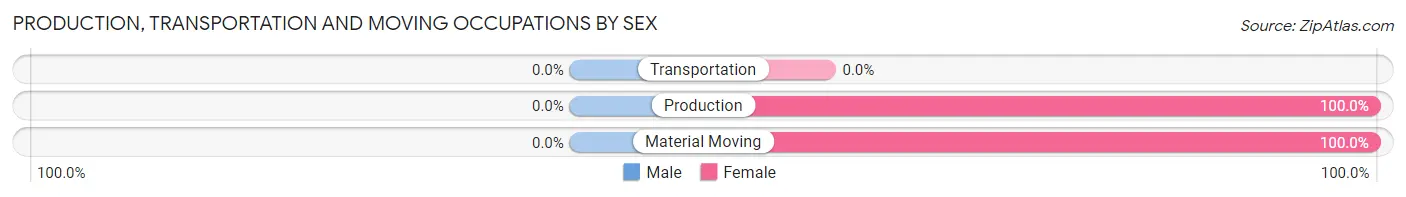
| Occupation | Male | Female |
| Production | 0 (0.0%) | 11 (100.0%) |
| Transportation | 0 (0.0%) | 0 (0.0%) |
| Material Moving | 0 (0.0%) | 6 (100.0%) |
| Total (Category) | 0 (0.0%) | 17 (100.0%) |
| Total (Overall) | 95 (63.8%) | 54 (36.2%) |
Employment Industries by Sex in Rogersville
Employment Industries in Rogersville
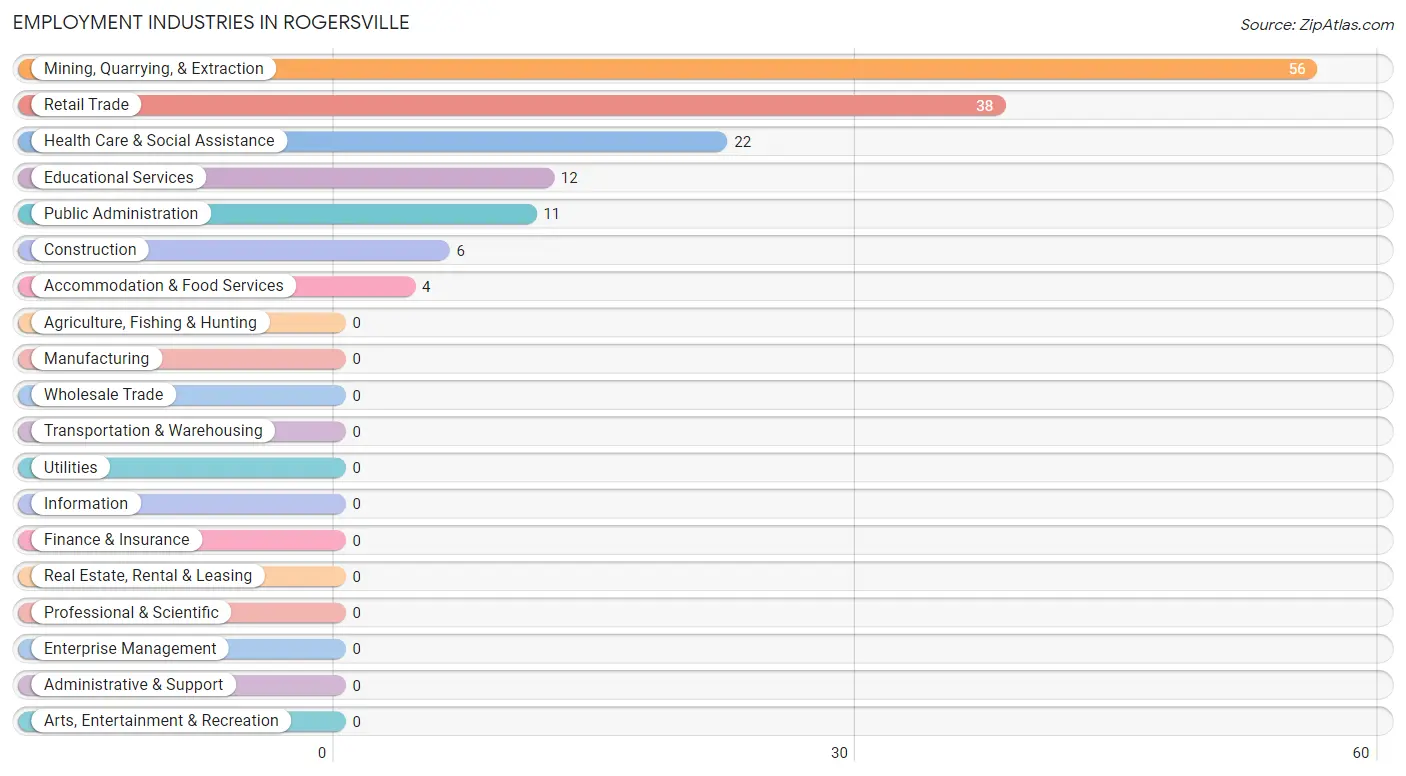
The major employment industries in Rogersville include Mining, Quarrying, & Extraction (56 | 37.6%), Retail Trade (38 | 25.5%), Health Care & Social Assistance (22 | 14.8%), Educational Services (12 | 8.1%), and Public Administration (11 | 7.4%).
Employment Industries by Sex in Rogersville
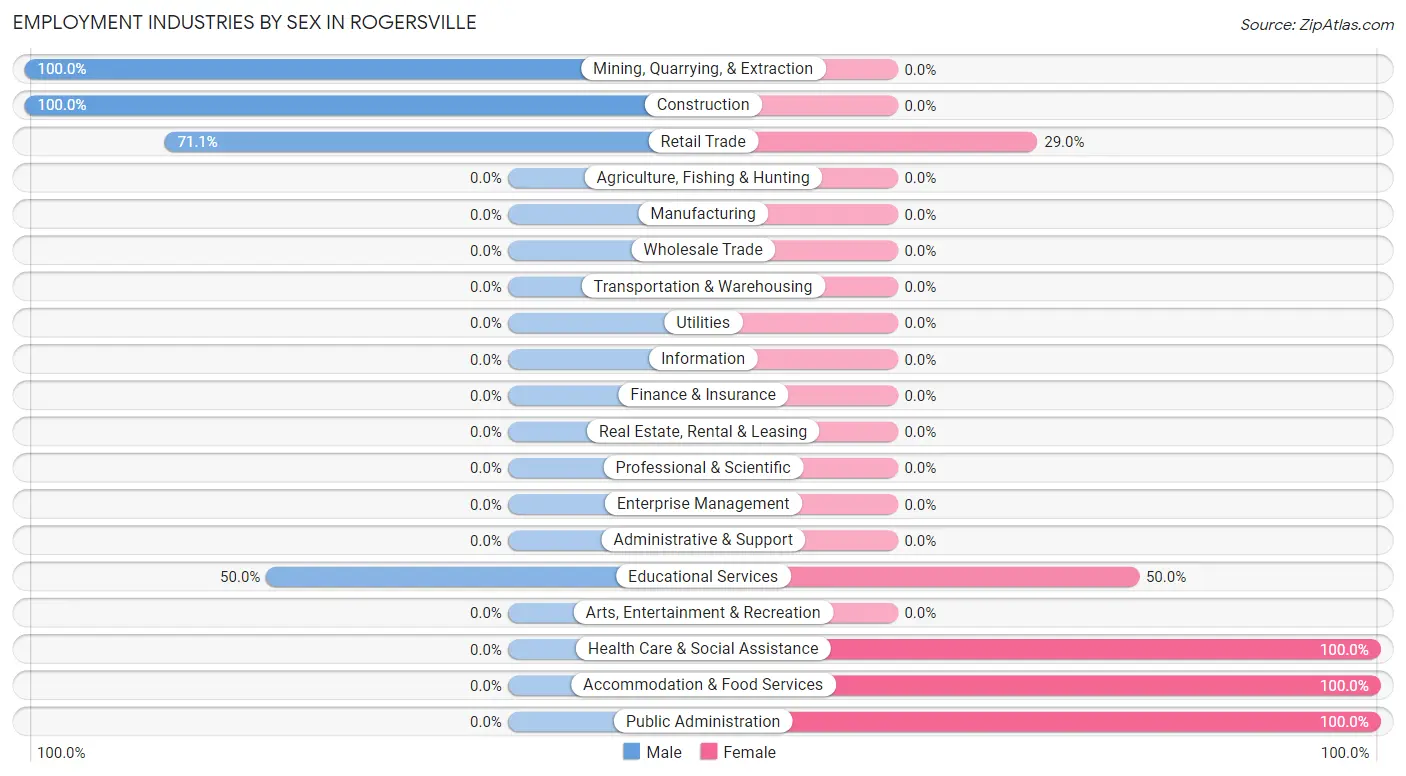
The Rogersville industries that see more men than women are Mining, Quarrying, & Extraction (100.0%), Construction (100.0%), and Retail Trade (71.1%), whereas the industries that tend to have a higher number of women are Health Care & Social Assistance (100.0%), Accommodation & Food Services (100.0%), and Public Administration (100.0%).
| Industry | Male | Female |
| Agriculture, Fishing & Hunting | 0 (0.0%) | 0 (0.0%) |
| Mining, Quarrying, & Extraction | 56 (100.0%) | 0 (0.0%) |
| Construction | 6 (100.0%) | 0 (0.0%) |
| Manufacturing | 0 (0.0%) | 0 (0.0%) |
| Wholesale Trade | 0 (0.0%) | 0 (0.0%) |
| Retail Trade | 27 (71.1%) | 11 (28.9%) |
| Transportation & Warehousing | 0 (0.0%) | 0 (0.0%) |
| Utilities | 0 (0.0%) | 0 (0.0%) |
| Information | 0 (0.0%) | 0 (0.0%) |
| Finance & Insurance | 0 (0.0%) | 0 (0.0%) |
| Real Estate, Rental & Leasing | 0 (0.0%) | 0 (0.0%) |
| Professional & Scientific | 0 (0.0%) | 0 (0.0%) |
| Enterprise Management | 0 (0.0%) | 0 (0.0%) |
| Administrative & Support | 0 (0.0%) | 0 (0.0%) |
| Educational Services | 6 (50.0%) | 6 (50.0%) |
| Health Care & Social Assistance | 0 (0.0%) | 22 (100.0%) |
| Arts, Entertainment & Recreation | 0 (0.0%) | 0 (0.0%) |
| Accommodation & Food Services | 0 (0.0%) | 4 (100.0%) |
| Public Administration | 0 (0.0%) | 11 (100.0%) |
| Total | 95 (63.8%) | 54 (36.2%) |
Education in Rogersville
School Enrollment in Rogersville
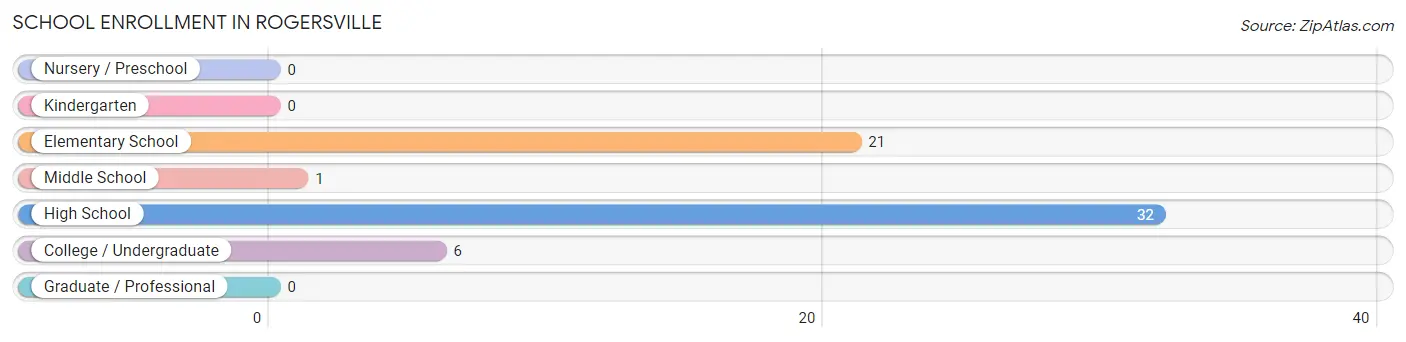
The most common levels of schooling among the 60 students in Rogersville are high school (32 | 53.3%), elementary school (21 | 35.0%), and college / undergraduate (6 | 10.0%).
| School Level | # Students | % Students |
| Nursery / Preschool | 0 | 0.0% |
| Kindergarten | 0 | 0.0% |
| Elementary School | 21 | 35.0% |
| Middle School | 1 | 1.7% |
| High School | 32 | 53.3% |
| College / Undergraduate | 6 | 10.0% |
| Graduate / Professional | 0 | 0.0% |
| Total | 60 | 100.0% |
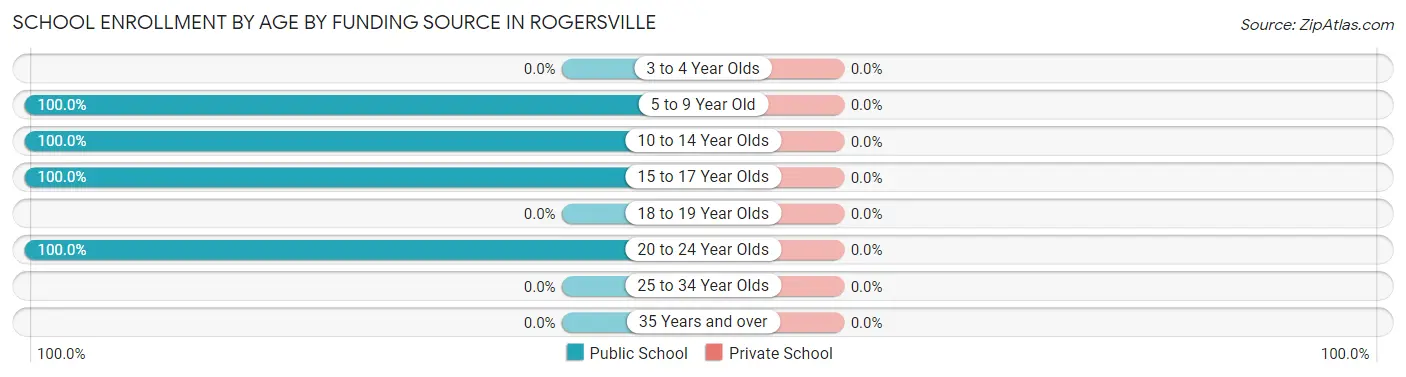
School Enrollment by Age by Funding Source in Rogersville
| Age Bracket | Public School | Private School |
| 3 to 4 Year Olds | 0 (0.0%) | 0 (0.0%) |
| 5 to 9 Year Old | 21 (100.0%) | 0 (0.0%) |
| 10 to 14 Year Olds | 4 (100.0%) | 0 (0.0%) |
| 15 to 17 Year Olds | 29 (100.0%) | 0 (0.0%) |
| 18 to 19 Year Olds | 0 (0.0%) | 0 (0.0%) |
| 20 to 24 Year Olds | 6 (100.0%) | 0 (0.0%) |
| 25 to 34 Year Olds | 0 (0.0%) | 0 (0.0%) |
| 35 Years and over | 0 (0.0%) | 0 (0.0%) |
| Total | 60 (100.0%) | 0 (0.0%) |
Educational Attainment by Field of Study in Rogersville
Arts & humanities (11 | 50.0%), education (10 | 45.5%), and communications (1 | 4.5%) are the most common fields of study among 22 individuals in Rogersville who have obtained a bachelor's degree or higher.
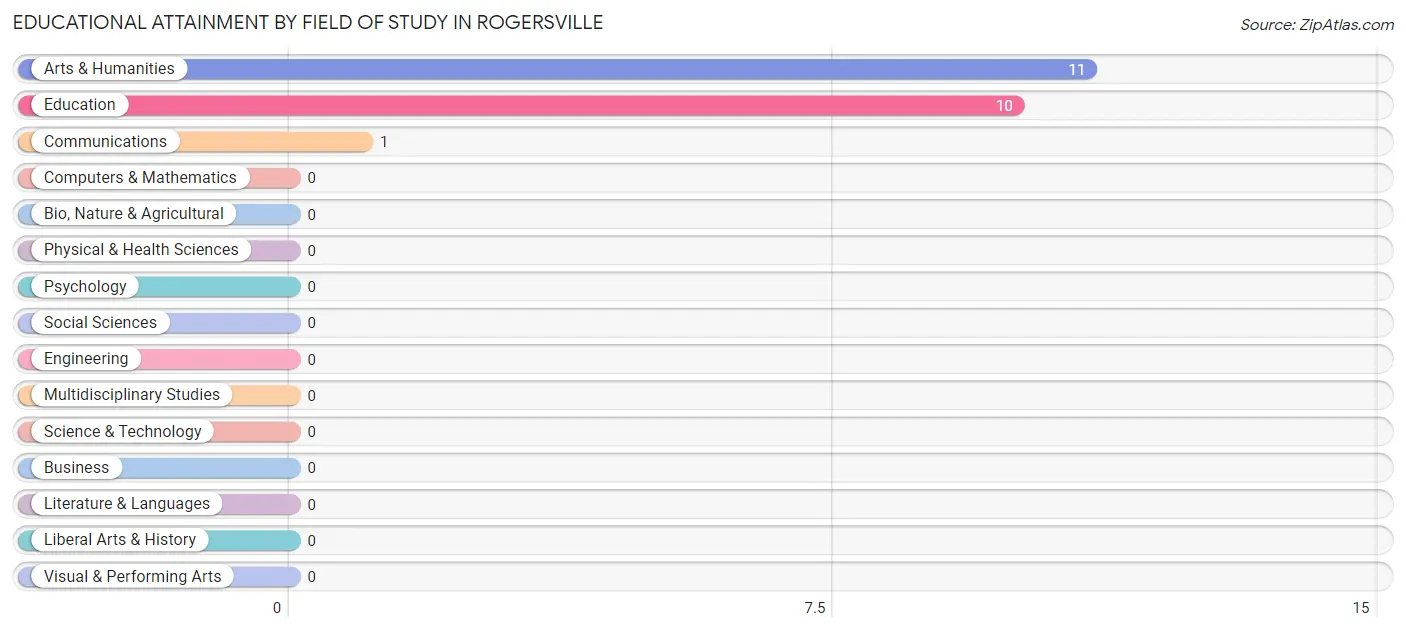
| Field of Study | # Graduates | % Graduates |
| Computers & Mathematics | 0 | 0.0% |
| Bio, Nature & Agricultural | 0 | 0.0% |
| Physical & Health Sciences | 0 | 0.0% |
| Psychology | 0 | 0.0% |
| Social Sciences | 0 | 0.0% |
| Engineering | 0 | 0.0% |
| Multidisciplinary Studies | 0 | 0.0% |
| Science & Technology | 0 | 0.0% |
| Business | 0 | 0.0% |
| Education | 10 | 45.5% |
| Literature & Languages | 0 | 0.0% |
| Liberal Arts & History | 0 | 0.0% |
| Visual & Performing Arts | 0 | 0.0% |
| Communications | 1 | 4.5% |
| Arts & Humanities | 11 | 50.0% |
| Total | 22 | 100.0% |
Transportation & Commute in Rogersville
Vehicle Availability by Sex in Rogersville
The most prevalent vehicle ownership categories in Rogersville are males with 2 vehicles (56, accounting for 59.0%) and females with 2 vehicles (11, making up 103.7%).
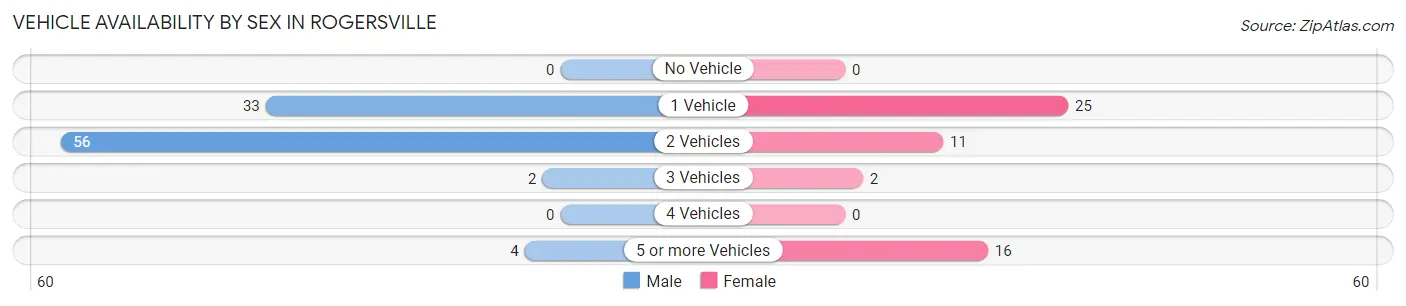
| Vehicles Available | Male | Female |
| No Vehicle | 0 (0.0%) | 0 (0.0%) |
| 1 Vehicle | 33 (34.7%) | 25 (46.3%) |
| 2 Vehicles | 56 (59.0%) | 11 (20.4%) |
| 3 Vehicles | 2 (2.1%) | 2 (3.7%) |
| 4 Vehicles | 0 (0.0%) | 0 (0.0%) |
| 5 or more Vehicles | 4 (4.2%) | 16 (29.6%) |
| Total | 95 (100.0%) | 54 (100.0%) |
Commute Time in Rogersville
The most frequently occuring commute durations in Rogersville are 10 to 14 minutes (42 commuters, 28.2%), 30 to 34 minutes (29 commuters, 19.5%), and 5 to 9 minutes (27 commuters, 18.1%).
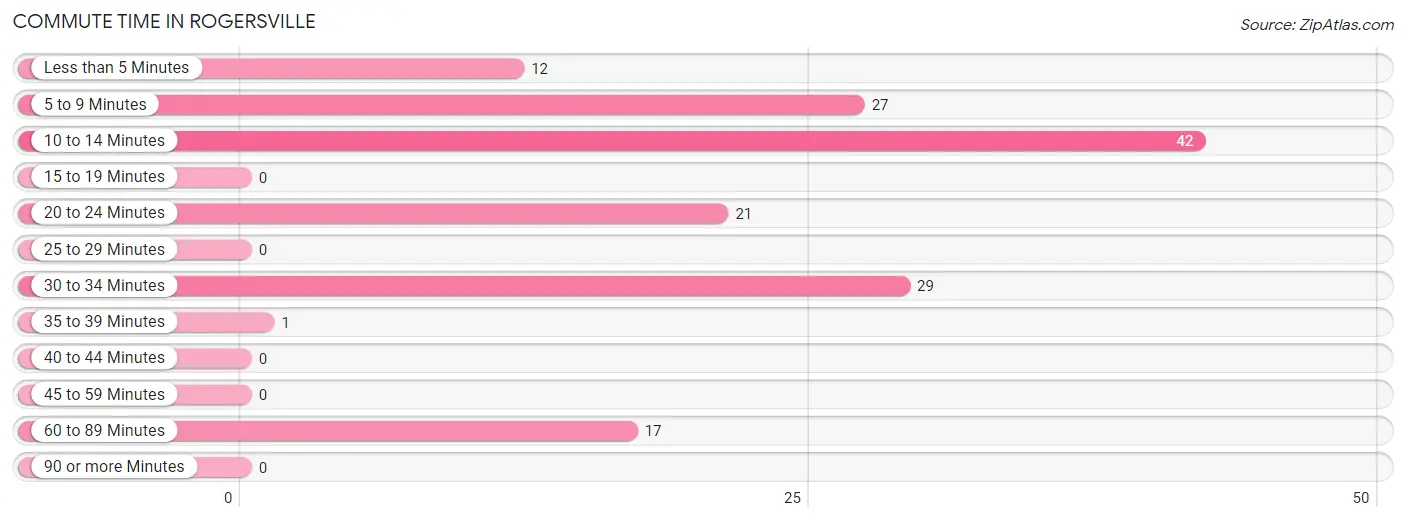
| Commute Time | # Commuters | % Commuters |
| Less than 5 Minutes | 12 | 8.1% |
| 5 to 9 Minutes | 27 | 18.1% |
| 10 to 14 Minutes | 42 | 28.2% |
| 15 to 19 Minutes | 0 | 0.0% |
| 20 to 24 Minutes | 21 | 14.1% |
| 25 to 29 Minutes | 0 | 0.0% |
| 30 to 34 Minutes | 29 | 19.5% |
| 35 to 39 Minutes | 1 | 0.7% |
| 40 to 44 Minutes | 0 | 0.0% |
| 45 to 59 Minutes | 0 | 0.0% |
| 60 to 89 Minutes | 17 | 11.4% |
| 90 or more Minutes | 0 | 0.0% |
Commute Time by Sex in Rogersville
The most common commute times in Rogersville are 10 to 14 minutes (33 commuters, 34.7%) for males and 20 to 24 minutes (21 commuters, 38.9%) for females.
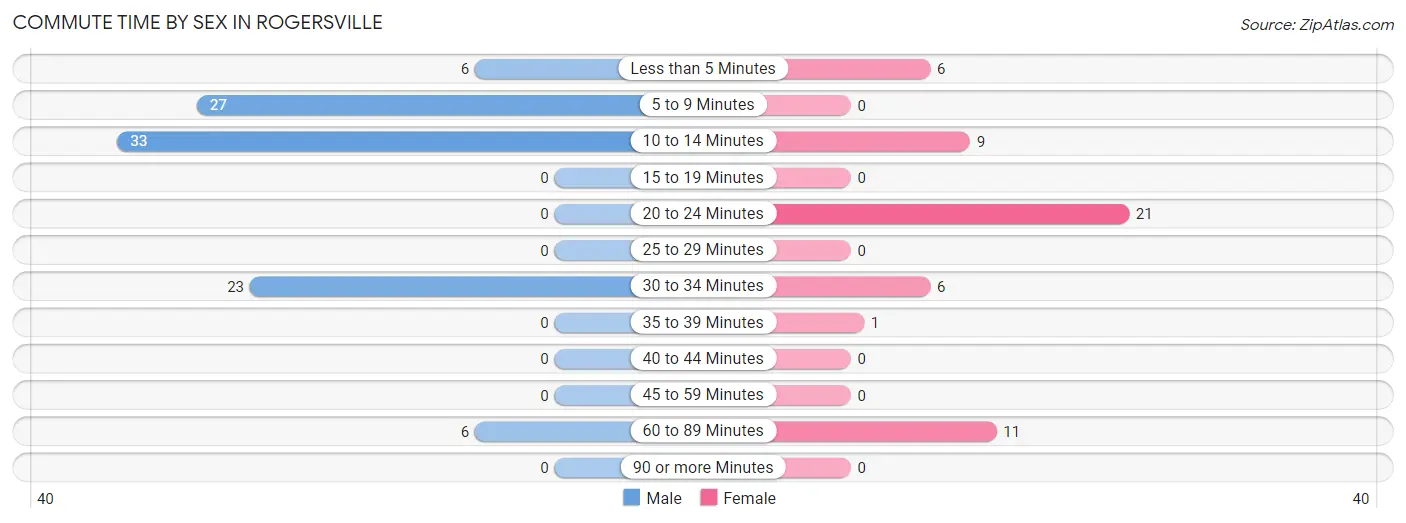
| Commute Time | Male | Female |
| Less than 5 Minutes | 6 (6.3%) | 6 (11.1%) |
| 5 to 9 Minutes | 27 (28.4%) | 0 (0.0%) |
| 10 to 14 Minutes | 33 (34.7%) | 9 (16.7%) |
| 15 to 19 Minutes | 0 (0.0%) | 0 (0.0%) |
| 20 to 24 Minutes | 0 (0.0%) | 21 (38.9%) |
| 25 to 29 Minutes | 0 (0.0%) | 0 (0.0%) |
| 30 to 34 Minutes | 23 (24.2%) | 6 (11.1%) |
| 35 to 39 Minutes | 0 (0.0%) | 1 (1.8%) |
| 40 to 44 Minutes | 0 (0.0%) | 0 (0.0%) |
| 45 to 59 Minutes | 0 (0.0%) | 0 (0.0%) |
| 60 to 89 Minutes | 6 (6.3%) | 11 (20.4%) |
| 90 or more Minutes | 0 (0.0%) | 0 (0.0%) |
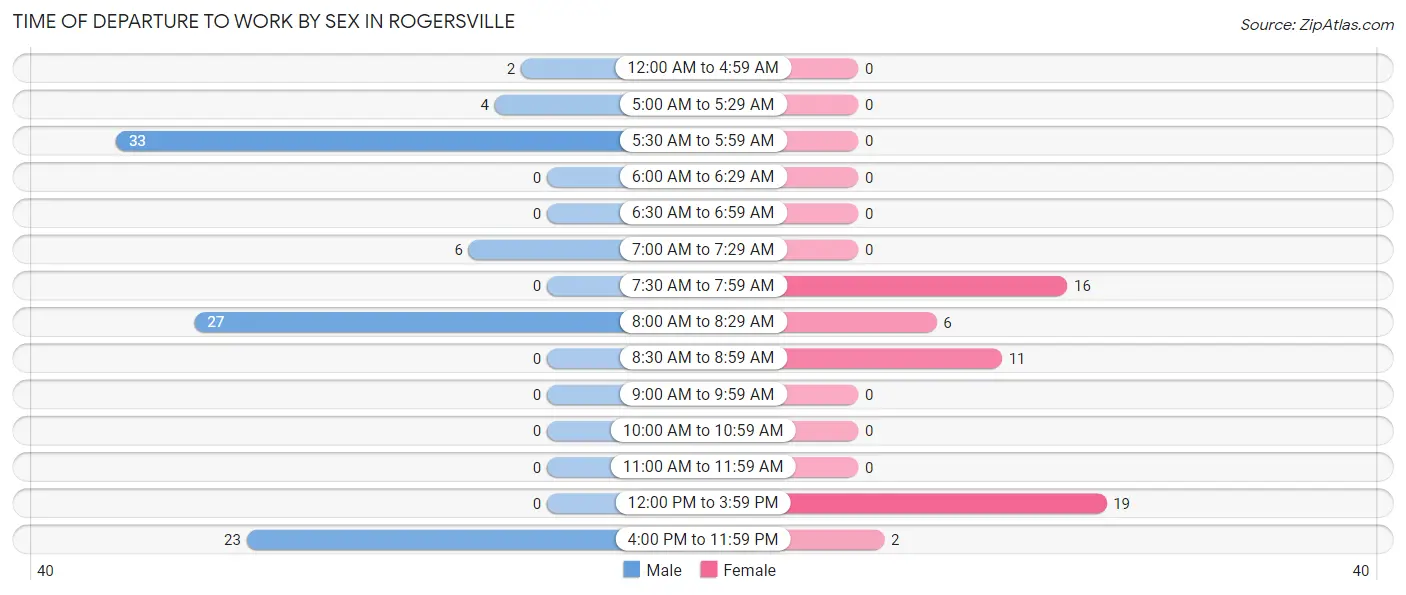
Time of Departure to Work by Sex in Rogersville
The most frequent times of departure to work in Rogersville are 5:30 AM to 5:59 AM (33, 34.7%) for males and 12:00 PM to 3:59 PM (19, 35.2%) for females.
| Time of Departure | Male | Female |
| 12:00 AM to 4:59 AM | 2 (2.1%) | 0 (0.0%) |
| 5:00 AM to 5:29 AM | 4 (4.2%) | 0 (0.0%) |
| 5:30 AM to 5:59 AM | 33 (34.7%) | 0 (0.0%) |
| 6:00 AM to 6:29 AM | 0 (0.0%) | 0 (0.0%) |
| 6:30 AM to 6:59 AM | 0 (0.0%) | 0 (0.0%) |
| 7:00 AM to 7:29 AM | 6 (6.3%) | 0 (0.0%) |
| 7:30 AM to 7:59 AM | 0 (0.0%) | 16 (29.6%) |
| 8:00 AM to 8:29 AM | 27 (28.4%) | 6 (11.1%) |
| 8:30 AM to 8:59 AM | 0 (0.0%) | 11 (20.4%) |
| 9:00 AM to 9:59 AM | 0 (0.0%) | 0 (0.0%) |
| 10:00 AM to 10:59 AM | 0 (0.0%) | 0 (0.0%) |
| 11:00 AM to 11:59 AM | 0 (0.0%) | 0 (0.0%) |
| 12:00 PM to 3:59 PM | 0 (0.0%) | 19 (35.2%) |
| 4:00 PM to 11:59 PM | 23 (24.2%) | 2 (3.7%) |
| Total | 95 (100.0%) | 54 (100.0%) |
Housing Occupancy in Rogersville
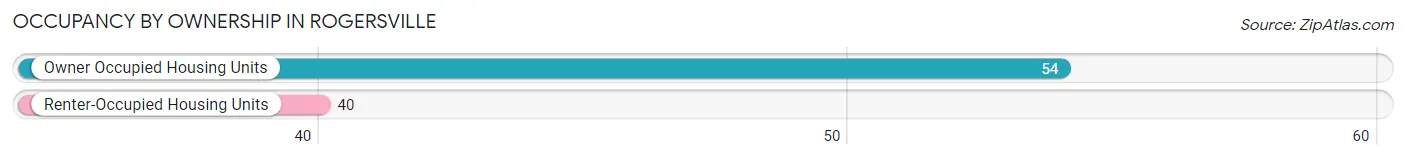
Occupancy by Ownership in Rogersville
Of the total 94 dwellings in Rogersville, owner-occupied units account for 54 (57.5%), while renter-occupied units make up 40 (42.5%).
| Occupancy | # Housing Units | % Housing Units |
| Owner Occupied Housing Units | 54 | 57.5% |
| Renter-Occupied Housing Units | 40 | 42.5% |
| Total Occupied Housing Units | 94 | 100.0% |
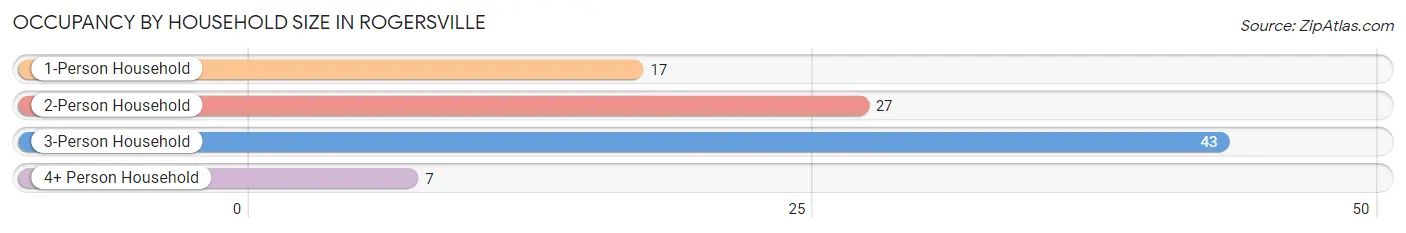
Occupancy by Household Size in Rogersville
| Household Size | # Housing Units | % Housing Units |
| 1-Person Household | 17 | 18.1% |
| 2-Person Household | 27 | 28.7% |
| 3-Person Household | 43 | 45.7% |
| 4+ Person Household | 7 | 7.4% |
| Total Housing Units | 94 | 100.0% |
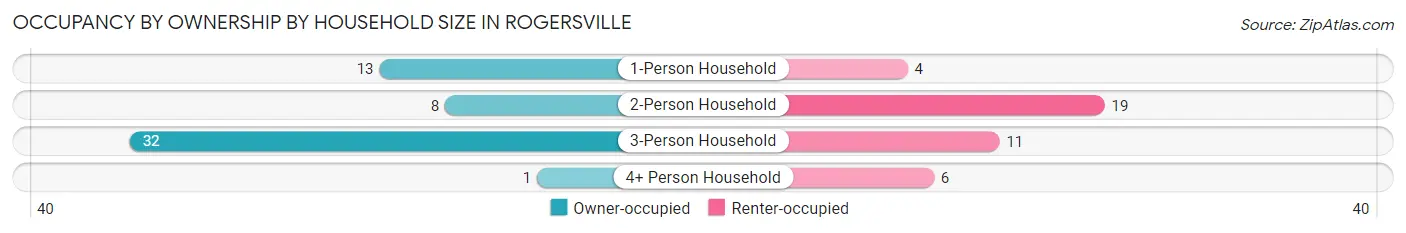
Occupancy by Ownership by Household Size in Rogersville
| Household Size | Owner-occupied | Renter-occupied |
| 1-Person Household | 13 (76.5%) | 4 (23.5%) |
| 2-Person Household | 8 (29.6%) | 19 (70.4%) |
| 3-Person Household | 32 (74.4%) | 11 (25.6%) |
| 4+ Person Household | 1 (14.3%) | 6 (85.7%) |
| Total Housing Units | 54 (57.5%) | 40 (42.5%) |
Occupancy by Educational Attainment in Rogersville
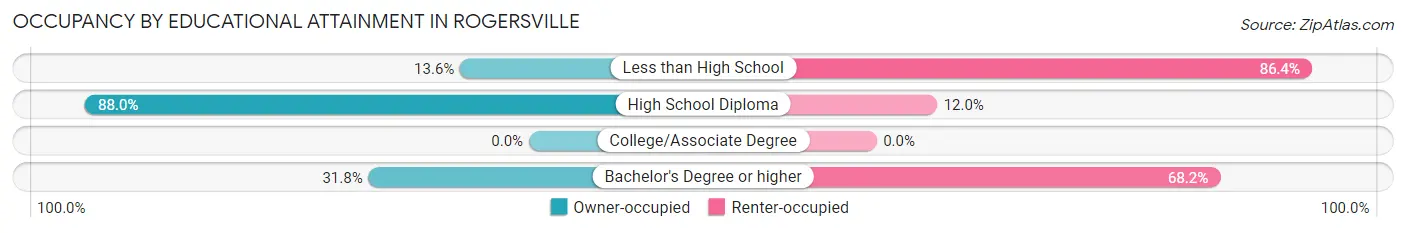
| Household Size | Owner-occupied | Renter-occupied |
| Less than High School | 3 (13.6%) | 19 (86.4%) |
| High School Diploma | 44 (88.0%) | 6 (12.0%) |
| College/Associate Degree | 0 (0.0%) | 0 (0.0%) |
| Bachelor's Degree or higher | 7 (31.8%) | 15 (68.2%) |
Occupancy by Age of Householder in Rogersville
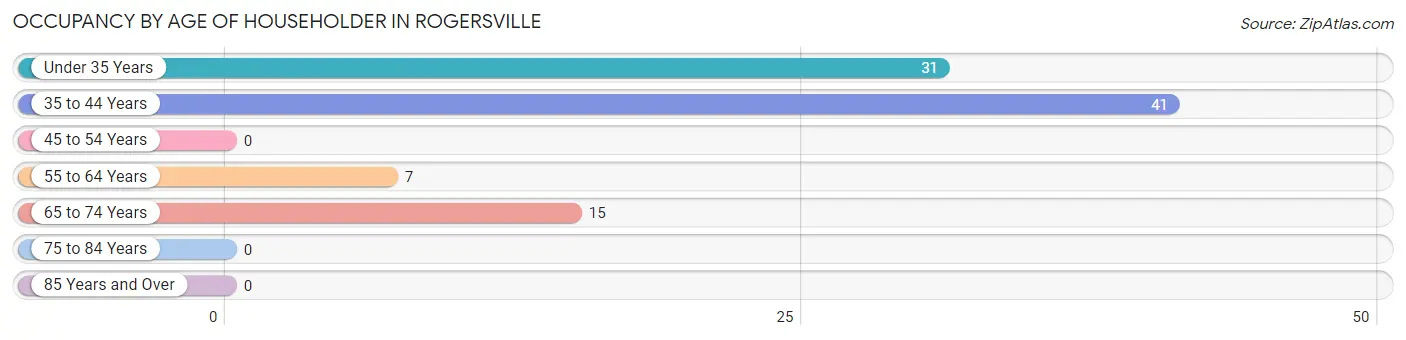
| Age Bracket | # Households | % Households |
| Under 35 Years | 31 | 33.0% |
| 35 to 44 Years | 41 | 43.6% |
| 45 to 54 Years | 0 | 0.0% |
| 55 to 64 Years | 7 | 7.4% |
| 65 to 74 Years | 15 | 16.0% |
| 75 to 84 Years | 0 | 0.0% |
| 85 Years and Over | 0 | 0.0% |
| Total | 94 | 100.0% |
Housing Finances in Rogersville
Median Income by Occupancy in Rogersville
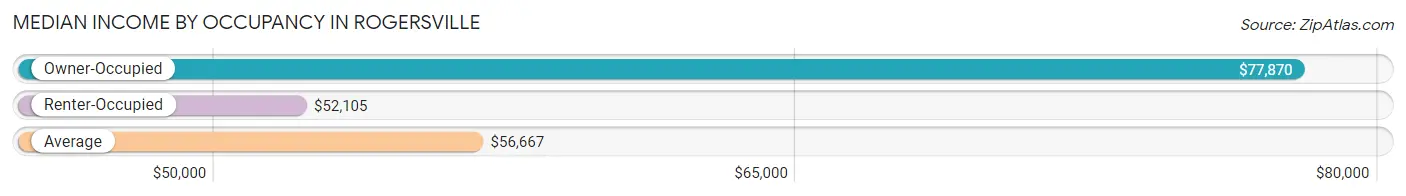
| Occupancy Type | # Households | Median Income |
| Owner-Occupied | 54 (57.5%) | $77,870 |
| Renter-Occupied | 40 (42.5%) | $52,105 |
| Average | 94 (100.0%) | $56,667 |
Occupancy by Householder Income Bracket in Rogersville
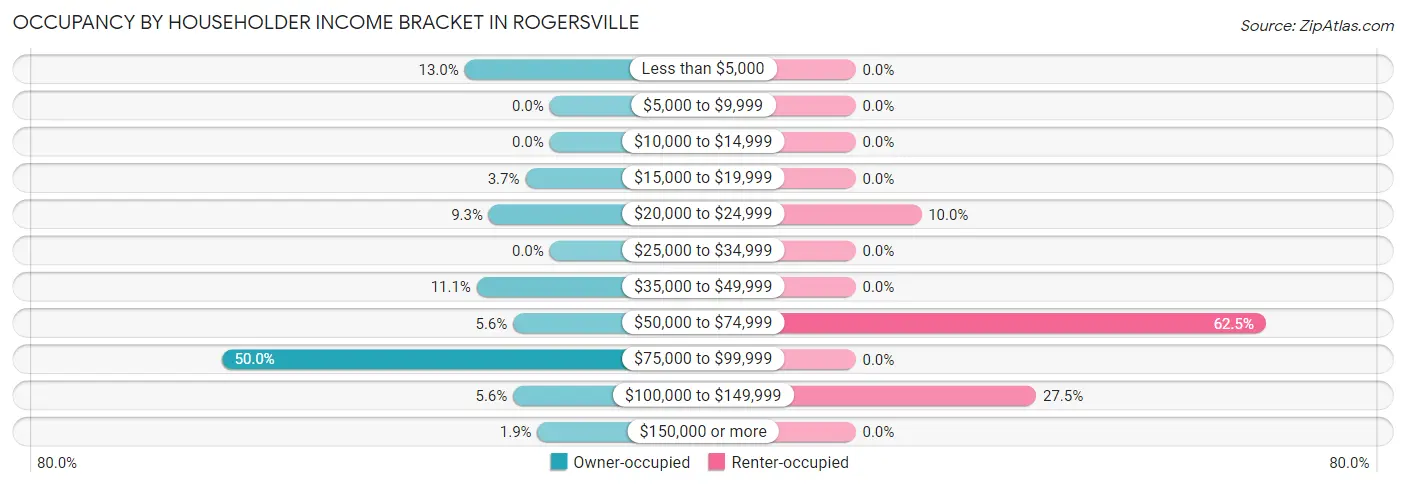
| Income Bracket | Owner-occupied | Renter-occupied |
| Less than $5,000 | 7 (13.0%) | 0 (0.0%) |
| $5,000 to $9,999 | 0 (0.0%) | 0 (0.0%) |
| $10,000 to $14,999 | 0 (0.0%) | 0 (0.0%) |
| $15,000 to $19,999 | 2 (3.7%) | 0 (0.0%) |
| $20,000 to $24,999 | 5 (9.3%) | 4 (10.0%) |
| $25,000 to $34,999 | 0 (0.0%) | 0 (0.0%) |
| $35,000 to $49,999 | 6 (11.1%) | 0 (0.0%) |
| $50,000 to $74,999 | 3 (5.6%) | 25 (62.5%) |
| $75,000 to $99,999 | 27 (50.0%) | 0 (0.0%) |
| $100,000 to $149,999 | 3 (5.6%) | 11 (27.5%) |
| $150,000 or more | 1 (1.8%) | 0 (0.0%) |
| Total | 54 (100.0%) | 40 (100.0%) |
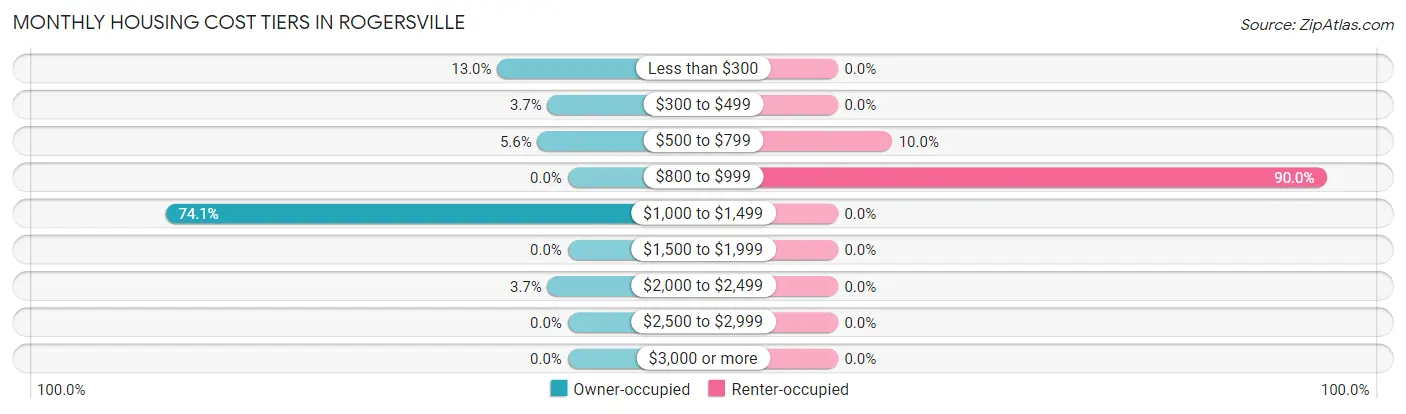
Monthly Housing Cost Tiers in Rogersville
| Monthly Cost | Owner-occupied | Renter-occupied |
| Less than $300 | 7 (13.0%) | 0 (0.0%) |
| $300 to $499 | 2 (3.7%) | 0 (0.0%) |
| $500 to $799 | 3 (5.6%) | 4 (10.0%) |
| $800 to $999 | 0 (0.0%) | 36 (90.0%) |
| $1,000 to $1,499 | 40 (74.1%) | 0 (0.0%) |
| $1,500 to $1,999 | 0 (0.0%) | 0 (0.0%) |
| $2,000 to $2,499 | 2 (3.7%) | 0 (0.0%) |
| $2,500 to $2,999 | 0 (0.0%) | 0 (0.0%) |
| $3,000 or more | 0 (0.0%) | 0 (0.0%) |
| Total | 54 (100.0%) | 40 (100.0%) |
Physical Housing Characteristics in Rogersville
Housing Structures in Rogersville
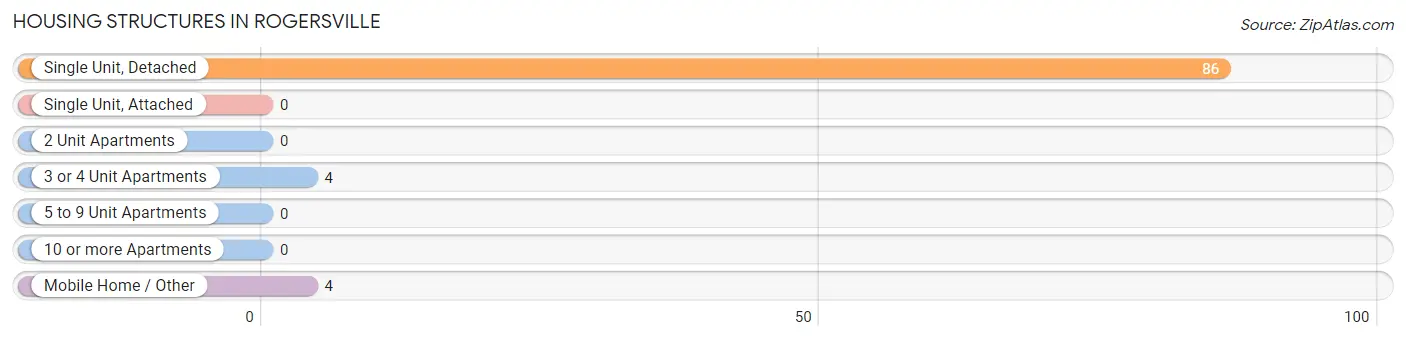
| Structure Type | # Housing Units | % Housing Units |
| Single Unit, Detached | 86 | 91.5% |
| Single Unit, Attached | 0 | 0.0% |
| 2 Unit Apartments | 0 | 0.0% |
| 3 or 4 Unit Apartments | 4 | 4.3% |
| 5 to 9 Unit Apartments | 0 | 0.0% |
| 10 or more Apartments | 0 | 0.0% |
| Mobile Home / Other | 4 | 4.3% |
| Total | 94 | 100.0% |
Housing Structures by Occupancy in Rogersville
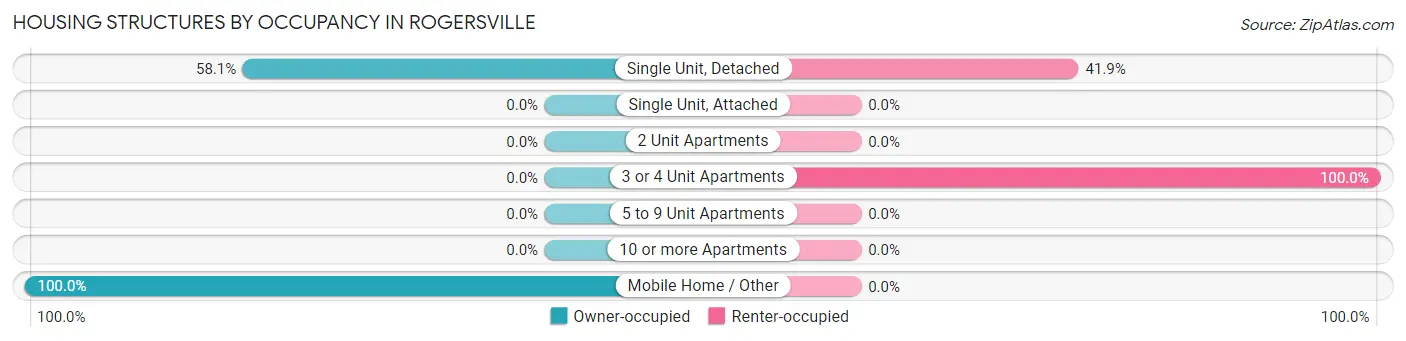
| Structure Type | Owner-occupied | Renter-occupied |
| Single Unit, Detached | 50 (58.1%) | 36 (41.9%) |
| Single Unit, Attached | 0 (0.0%) | 0 (0.0%) |
| 2 Unit Apartments | 0 (0.0%) | 0 (0.0%) |
| 3 or 4 Unit Apartments | 0 (0.0%) | 4 (100.0%) |
| 5 to 9 Unit Apartments | 0 (0.0%) | 0 (0.0%) |
| 10 or more Apartments | 0 (0.0%) | 0 (0.0%) |
| Mobile Home / Other | 4 (100.0%) | 0 (0.0%) |
| Total | 54 (57.5%) | 40 (42.5%) |
Housing Structures by Number of Rooms in Rogersville
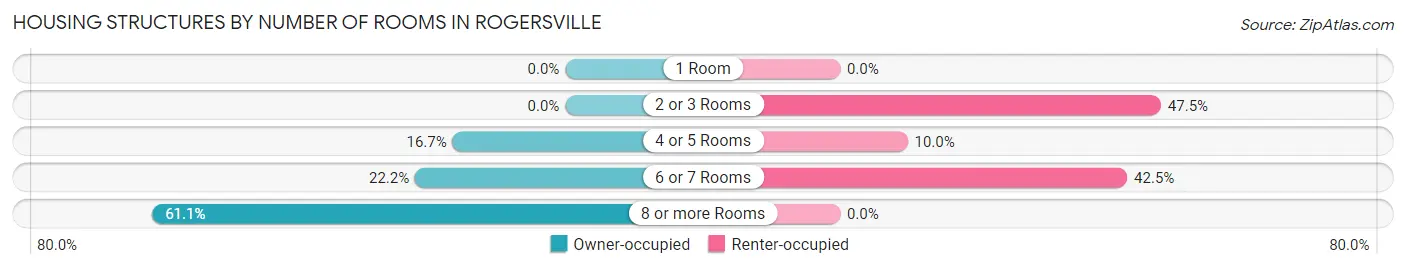
| Number of Rooms | Owner-occupied | Renter-occupied |
| 1 Room | 0 (0.0%) | 0 (0.0%) |
| 2 or 3 Rooms | 0 (0.0%) | 19 (47.5%) |
| 4 or 5 Rooms | 9 (16.7%) | 4 (10.0%) |
| 6 or 7 Rooms | 12 (22.2%) | 17 (42.5%) |
| 8 or more Rooms | 33 (61.1%) | 0 (0.0%) |
| Total | 54 (100.0%) | 40 (100.0%) |
Housing Structure by Heating Type in Rogersville
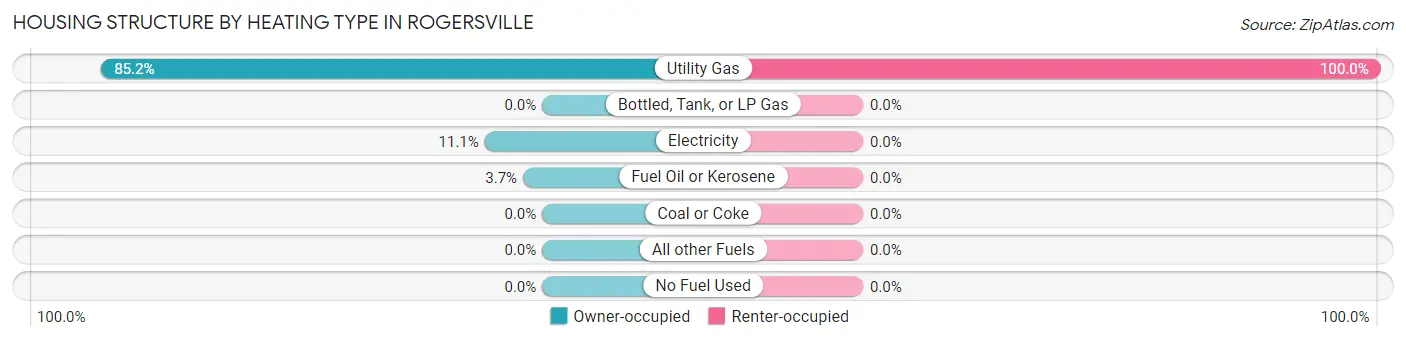
| Heating Type | Owner-occupied | Renter-occupied |
| Utility Gas | 46 (85.2%) | 40 (100.0%) |
| Bottled, Tank, or LP Gas | 0 (0.0%) | 0 (0.0%) |
| Electricity | 6 (11.1%) | 0 (0.0%) |
| Fuel Oil or Kerosene | 2 (3.7%) | 0 (0.0%) |
| Coal or Coke | 0 (0.0%) | 0 (0.0%) |
| All other Fuels | 0 (0.0%) | 0 (0.0%) |
| No Fuel Used | 0 (0.0%) | 0 (0.0%) |
| Total | 54 (100.0%) | 40 (100.0%) |
Household Vehicle Usage in Rogersville
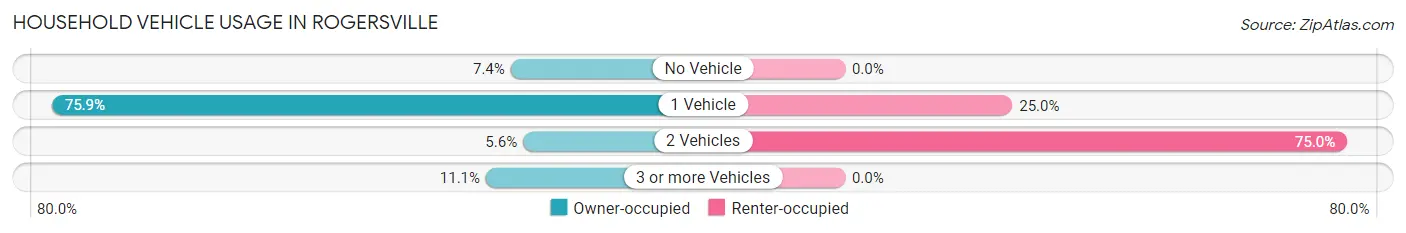
| Vehicles per Household | Owner-occupied | Renter-occupied |
| No Vehicle | 4 (7.4%) | 0 (0.0%) |
| 1 Vehicle | 41 (75.9%) | 10 (25.0%) |
| 2 Vehicles | 3 (5.6%) | 30 (75.0%) |
| 3 or more Vehicles | 6 (11.1%) | 0 (0.0%) |
| Total | 54 (100.0%) | 40 (100.0%) |
Real Estate & Mortgages in Rogersville
Real Estate and Mortgage Overview in Rogersville
| Characteristic | Without Mortgage | With Mortgage |
| Housing Units | 12 | 42 |
| Median Property Value | - | - |
| Median Household Income | $20,000 | $1 |
| Monthly Housing Costs | - | - |
| Real Estate Taxes | - | - |
Property Value by Mortgage Status in Rogersville
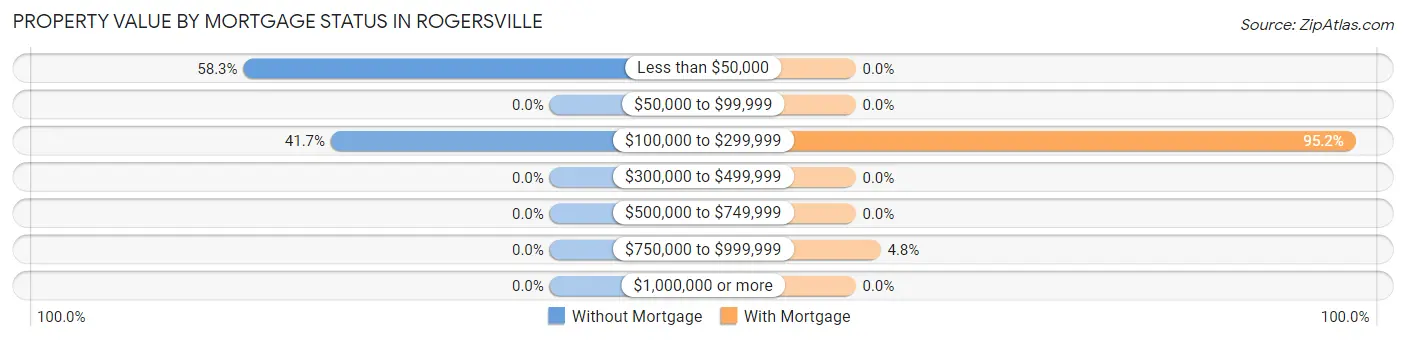
| Property Value | Without Mortgage | With Mortgage |
| Less than $50,000 | 7 (58.3%) | 0 (0.0%) |
| $50,000 to $99,999 | 0 (0.0%) | 0 (0.0%) |
| $100,000 to $299,999 | 5 (41.7%) | 40 (95.2%) |
| $300,000 to $499,999 | 0 (0.0%) | 0 (0.0%) |
| $500,000 to $749,999 | 0 (0.0%) | 0 (0.0%) |
| $750,000 to $999,999 | 0 (0.0%) | 2 (4.8%) |
| $1,000,000 or more | 0 (0.0%) | 0 (0.0%) |
| Total | 12 (100.0%) | 42 (100.0%) |
Household Income by Mortgage Status in Rogersville
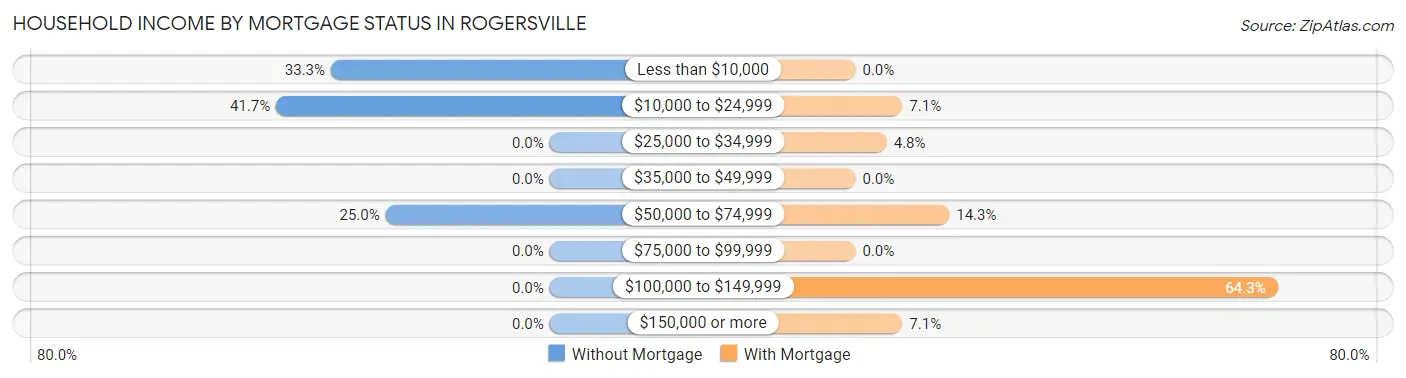
| Household Income | Without Mortgage | With Mortgage |
| Less than $10,000 | 4 (33.3%) | 0 (0.0%) |
| $10,000 to $24,999 | 5 (41.7%) | 3 (7.1%) |
| $25,000 to $34,999 | 0 (0.0%) | 2 (4.8%) |
| $35,000 to $49,999 | 0 (0.0%) | 0 (0.0%) |
| $50,000 to $74,999 | 3 (25.0%) | 6 (14.3%) |
| $75,000 to $99,999 | 0 (0.0%) | 0 (0.0%) |
| $100,000 to $149,999 | 0 (0.0%) | 27 (64.3%) |
| $150,000 or more | 0 (0.0%) | 3 (7.1%) |
| Total | 12 (100.0%) | 42 (100.0%) |
Property Value to Household Income Ratio in Rogersville
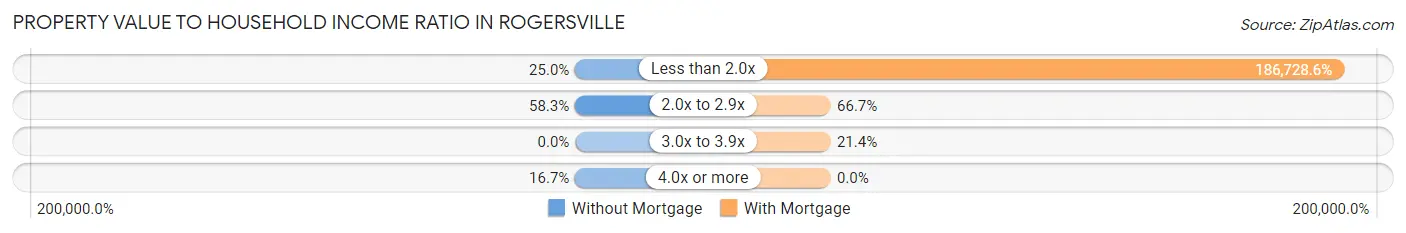
| Value-to-Income Ratio | Without Mortgage | With Mortgage |
| Less than 2.0x | 3 (25.0%) | 78,426 (186,728.6%) |
| 2.0x to 2.9x | 7 (58.3%) | 28 (66.7%) |
| 3.0x to 3.9x | 0 (0.0%) | 9 (21.4%) |
| 4.0x or more | 2 (16.7%) | 0 (0.0%) |
| Total | 12 (100.0%) | 42 (100.0%) |
Real Estate Taxes by Mortgage Status in Rogersville
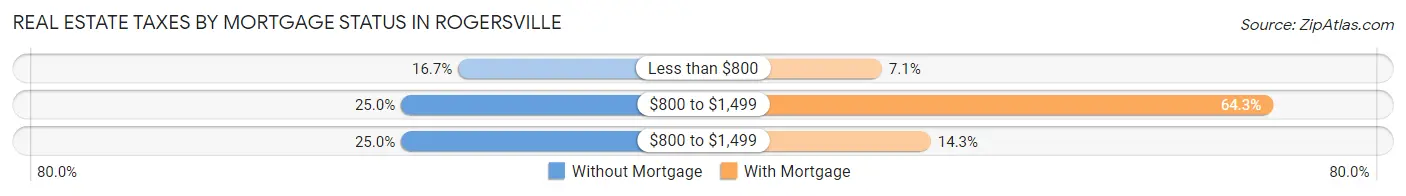
| Property Taxes | Without Mortgage | With Mortgage |
| Less than $800 | 2 (16.7%) | 3 (7.1%) |
| $800 to $1,499 | 3 (25.0%) | 27 (64.3%) |
| $800 to $1,499 | 3 (25.0%) | 6 (14.3%) |
| Total | 12 (100.0%) | 42 (100.0%) |
Health & Disability in Rogersville
Health Insurance Coverage by Age in Rogersville
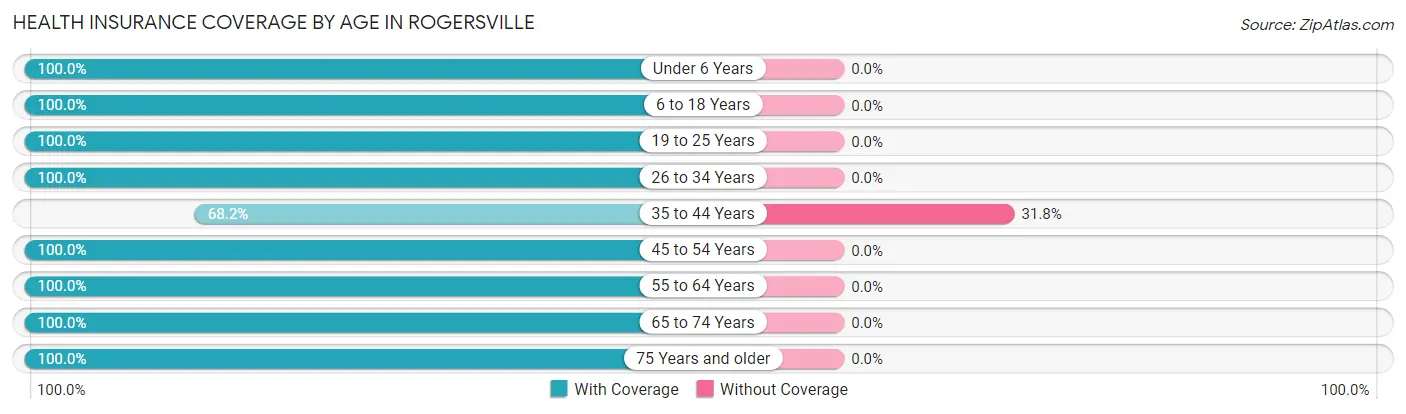
| Age Bracket | With Coverage | Without Coverage |
| Under 6 Years | 9 (100.0%) | 0 (0.0%) |
| 6 to 18 Years | 54 (100.0%) | 0 (0.0%) |
| 19 to 25 Years | 31 (100.0%) | 0 (0.0%) |
| 26 to 34 Years | 20 (100.0%) | 0 (0.0%) |
| 35 to 44 Years | 58 (68.2%) | 27 (31.8%) |
| 45 to 54 Years | 4 (100.0%) | 0 (0.0%) |
| 55 to 64 Years | 11 (100.0%) | 0 (0.0%) |
| 65 to 74 Years | 20 (100.0%) | 0 (0.0%) |
| 75 Years and older | 4 (100.0%) | 0 (0.0%) |
| Total | 211 (88.7%) | 27 (11.3%) |
Health Insurance Coverage by Citizenship Status in Rogersville
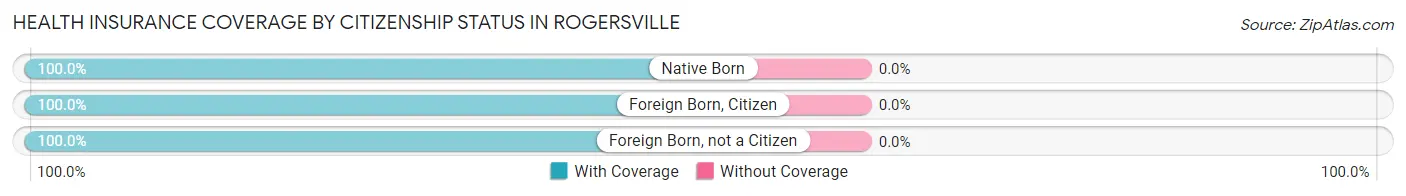
| Citizenship Status | With Coverage | Without Coverage |
| Native Born | 9 (100.0%) | 0 (0.0%) |
| Foreign Born, Citizen | 54 (100.0%) | 0 (0.0%) |
| Foreign Born, not a Citizen | 31 (100.0%) | 0 (0.0%) |
Health Insurance Coverage by Household Income in Rogersville
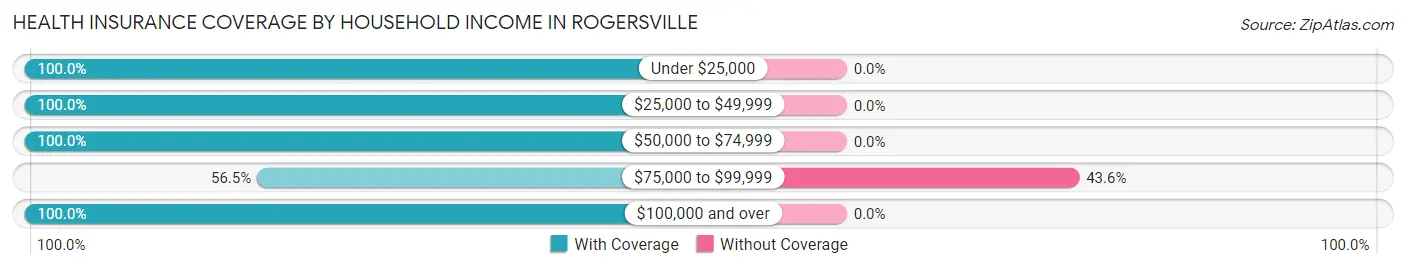
| Household Income | With Coverage | Without Coverage |
| Under $25,000 | 25 (100.0%) | 0 (0.0%) |
| $25,000 to $49,999 | 6 (100.0%) | 0 (0.0%) |
| $50,000 to $74,999 | 59 (100.0%) | 0 (0.0%) |
| $75,000 to $99,999 | 35 (56.5%) | 27 (43.5%) |
| $100,000 and over | 83 (100.0%) | 0 (0.0%) |
Public vs Private Health Insurance Coverage by Age in Rogersville
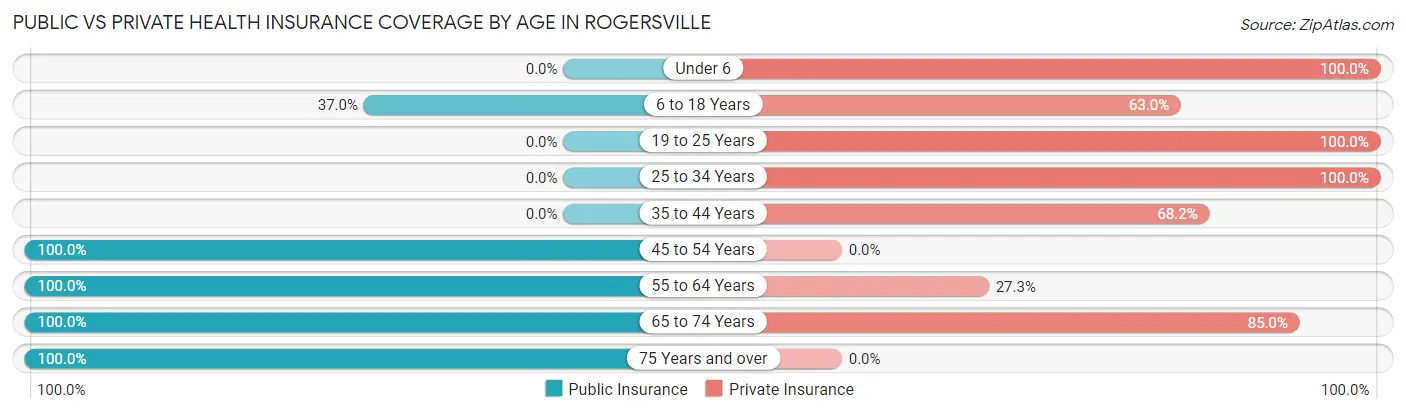
| Age Bracket | Public Insurance | Private Insurance |
| Under 6 | 0 (0.0%) | 9 (100.0%) |
| 6 to 18 Years | 20 (37.0%) | 34 (63.0%) |
| 19 to 25 Years | 0 (0.0%) | 31 (100.0%) |
| 25 to 34 Years | 0 (0.0%) | 20 (100.0%) |
| 35 to 44 Years | 0 (0.0%) | 58 (68.2%) |
| 45 to 54 Years | 4 (100.0%) | 0 (0.0%) |
| 55 to 64 Years | 11 (100.0%) | 3 (27.3%) |
| 65 to 74 Years | 20 (100.0%) | 17 (85.0%) |
| 75 Years and over | 4 (100.0%) | 0 (0.0%) |
| Total | 59 (24.8%) | 172 (72.3%) |
Disability Status by Sex by Age in Rogersville
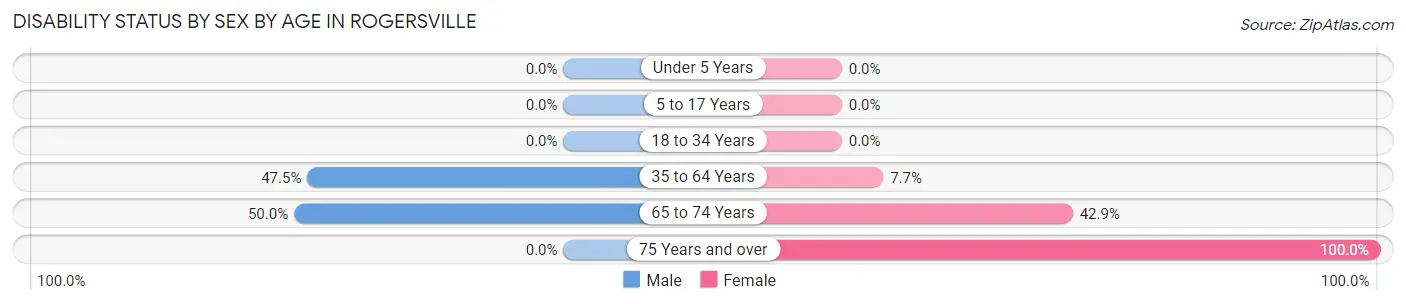
| Age Bracket | Male | Female |
| Under 5 Years | 0 (0.0%) | 0 (0.0%) |
| 5 to 17 Years | 0 (0.0%) | 0 (0.0%) |
| 18 to 34 Years | 0 (0.0%) | 0 (0.0%) |
| 35 to 64 Years | 29 (47.5%) | 3 (7.7%) |
| 65 to 74 Years | 3 (50.0%) | 6 (42.9%) |
| 75 Years and over | 0 (0.0%) | 4 (100.0%) |
Disability Class by Sex by Age in Rogersville
Disability Class: Hearing Difficulty
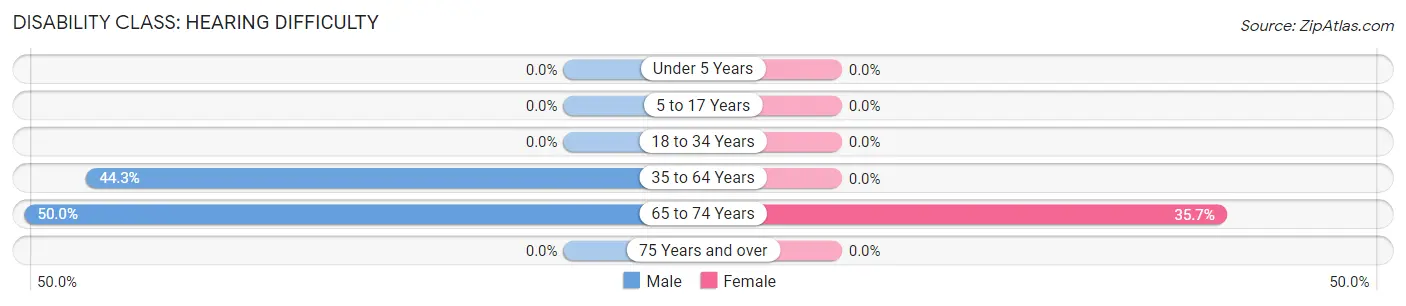
| Age Bracket | Male | Female |
| Under 5 Years | 0 (0.0%) | 0 (0.0%) |
| 5 to 17 Years | 0 (0.0%) | 0 (0.0%) |
| 18 to 34 Years | 0 (0.0%) | 0 (0.0%) |
| 35 to 64 Years | 27 (44.3%) | 0 (0.0%) |
| 65 to 74 Years | 3 (50.0%) | 5 (35.7%) |
| 75 Years and over | 0 (0.0%) | 0 (0.0%) |
Disability Class: Vision Difficulty
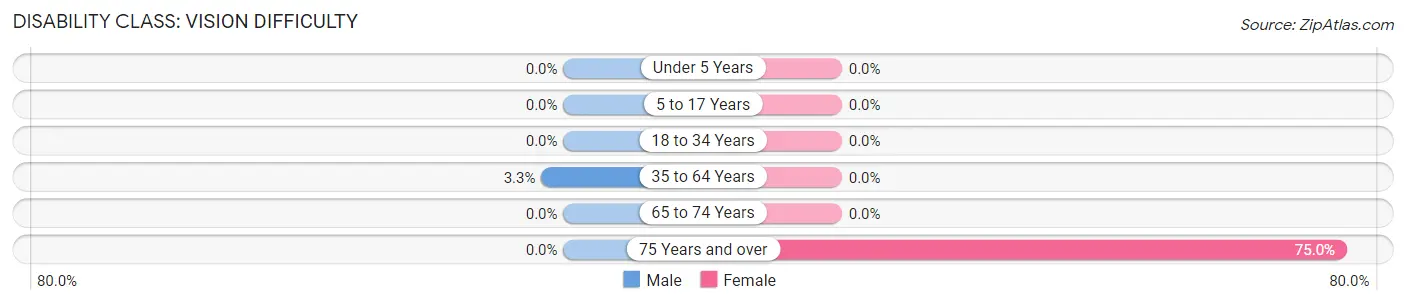
| Age Bracket | Male | Female |
| Under 5 Years | 0 (0.0%) | 0 (0.0%) |
| 5 to 17 Years | 0 (0.0%) | 0 (0.0%) |
| 18 to 34 Years | 0 (0.0%) | 0 (0.0%) |
| 35 to 64 Years | 2 (3.3%) | 0 (0.0%) |
| 65 to 74 Years | 0 (0.0%) | 0 (0.0%) |
| 75 Years and over | 0 (0.0%) | 3 (75.0%) |
Disability Class: Cognitive Difficulty
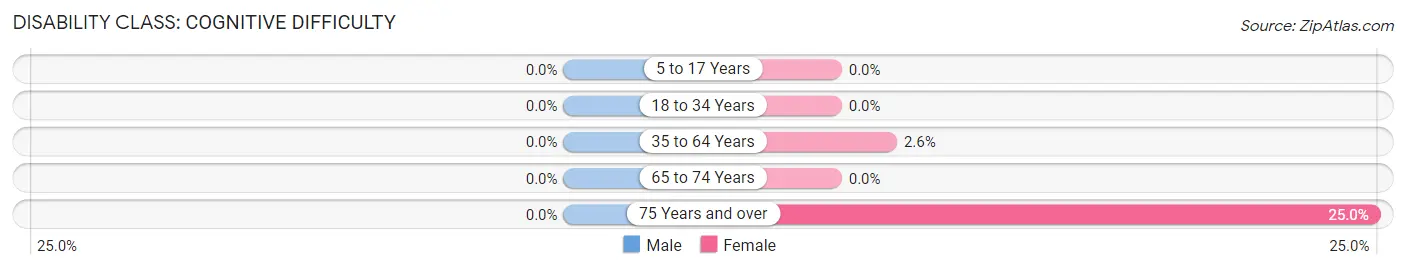
| Age Bracket | Male | Female |
| 5 to 17 Years | 0 (0.0%) | 0 (0.0%) |
| 18 to 34 Years | 0 (0.0%) | 0 (0.0%) |
| 35 to 64 Years | 0 (0.0%) | 1 (2.6%) |
| 65 to 74 Years | 0 (0.0%) | 0 (0.0%) |
| 75 Years and over | 0 (0.0%) | 1 (25.0%) |
Disability Class: Ambulatory Difficulty
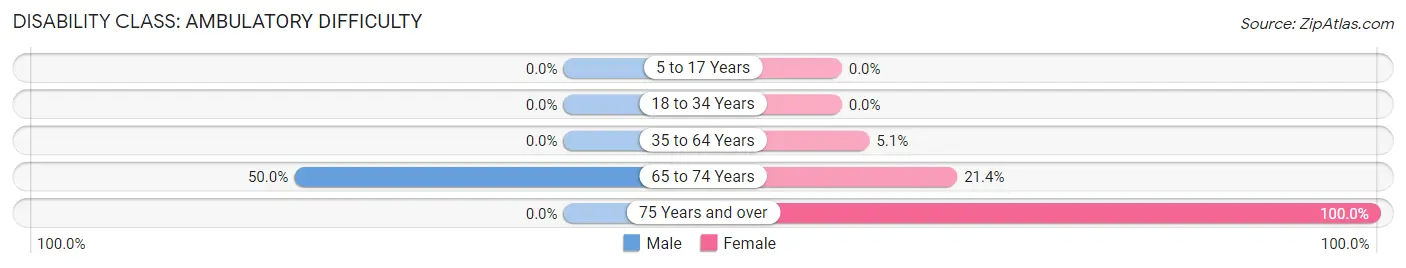
| Age Bracket | Male | Female |
| 5 to 17 Years | 0 (0.0%) | 0 (0.0%) |
| 18 to 34 Years | 0 (0.0%) | 0 (0.0%) |
| 35 to 64 Years | 0 (0.0%) | 2 (5.1%) |
| 65 to 74 Years | 3 (50.0%) | 3 (21.4%) |
| 75 Years and over | 0 (0.0%) | 4 (100.0%) |
Disability Class: Self-Care Difficulty
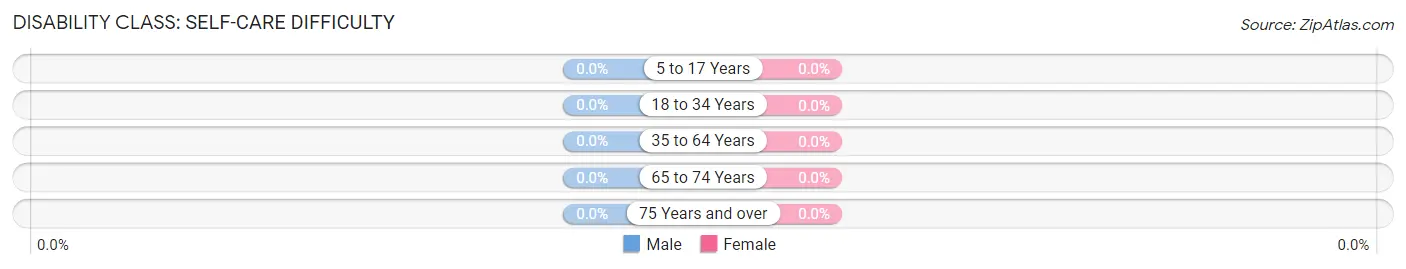
| Age Bracket | Male | Female |
| 5 to 17 Years | 0 (0.0%) | 0 (0.0%) |
| 18 to 34 Years | 0 (0.0%) | 0 (0.0%) |
| 35 to 64 Years | 0 (0.0%) | 0 (0.0%) |
| 65 to 74 Years | 0 (0.0%) | 0 (0.0%) |
| 75 Years and over | 0 (0.0%) | 0 (0.0%) |
Technology Access in Rogersville
Computing Device Access in Rogersville
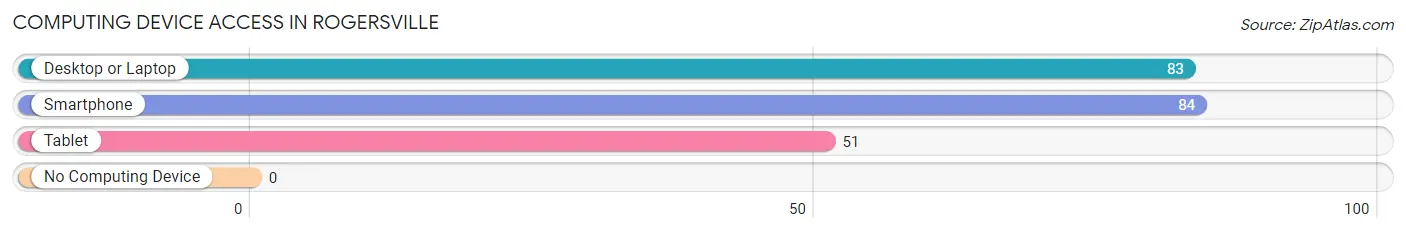
| Device Type | # Households | % Households |
| Desktop or Laptop | 83 | 88.3% |
| Smartphone | 84 | 89.4% |
| Tablet | 51 | 54.3% |
| No Computing Device | 0 | 0.0% |
| Total | 94 | 100.0% |
Internet Access in Rogersville
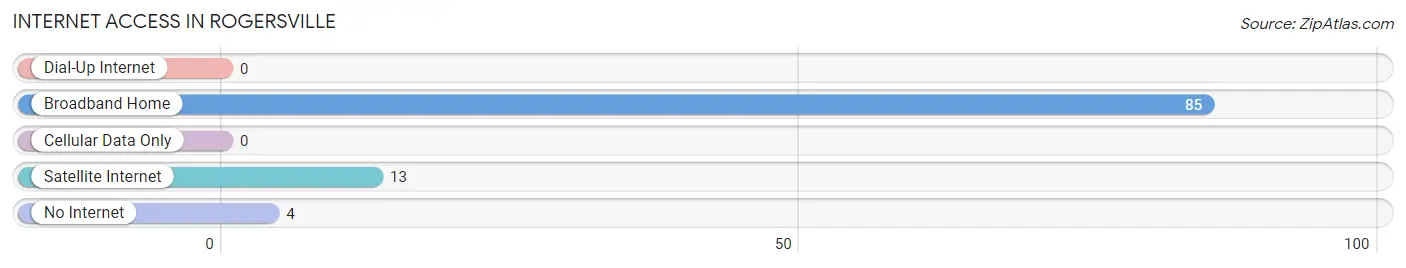
| Internet Type | # Households | % Households |
| Dial-Up Internet | 0 | 0.0% |
| Broadband Home | 85 | 90.4% |
| Cellular Data Only | 0 | 0.0% |
| Satellite Internet | 13 | 13.8% |
| No Internet | 4 | 4.3% |
| Total | 94 | 100.0% |
Rogersville Summary
Rogersville, Pennsylvania is a small borough located in Greene County, Pennsylvania. It is situated in the foothills of the Allegheny Mountains, approximately 40 miles south of Pittsburgh. The population of Rogersville was 1,093 at the 2010 census.
History
The area that is now Rogersville was first settled in 1772 by a group of settlers from Virginia. The settlement was originally known as “Rogers’s Station” after the first settler, John Rogers. The settlement was later renamed “Rogersville” in 1817.
The town was officially incorporated in 1832 and was the first borough in Greene County. The town was named after the Rogers family, who were prominent in the area.
The town was an important stop on the Pittsburgh and Connellsville Railroad, which was built in 1871. The railroad was a major factor in the growth of the town, as it allowed for the transportation of goods and people to and from the area.
The town was also home to several industries, including a brickyard, a sawmill, a gristmill, and a tannery. The town also had several stores, a post office, and a school.
Geography
Rogersville is located at 39°51'N, 79°59'W (39.851, -79.983). It is situated in the foothills of the Allegheny Mountains, approximately 40 miles south of Pittsburgh.
The borough has a total area of 0.6 square miles, all of which is land. The town is located along the Monongahela River, which is a major tributary of the Ohio River.
Economy
The economy of Rogersville is largely based on agriculture and tourism. The town is home to several farms, which produce a variety of crops, including corn, soybeans, hay, and wheat.
The town is also home to several small businesses, including restaurants, antique stores, and gift shops. The town is also home to a few bed and breakfasts, which attract tourists from all over the country.
Demographics
As of the 2010 census, the population of Rogersville was 1,093. The racial makeup of the town was 97.2% White, 0.7% African American, 0.2% Native American, 0.2% Asian, 0.1% from other races, and 1.7% from two or more races. Hispanic or Latino of any race were 0.7% of the population.
The median income for a household in the town was $37,500, and the median income for a family was $41,250. The per capita income for the town was $17,845. About 11.2% of families and 13.2% of the population were below the poverty line, including 16.7% of those under age 18 and 8.3% of those age 65 or over.
Common Questions
What is Per Capita Income in Rogersville?
Per Capita income in Rogersville is $26,223.
What is the Median Family Income in Rogersville?
Median Family Income in Rogersville is $77,824.
What is the Median Household income in Rogersville?
Median Household Income in Rogersville is $56,667.
What is Income or Wage Gap in Rogersville?
Income or Wage Gap in Rogersville is 20.3%.
Women in Rogersville earn 79.7 cents for every dollar earned by a man.
What is Inequality or Gini Index in Rogersville?
Inequality or Gini Index in Rogersville is 0.29.
What is the Total Population of Rogersville?
Total Population of Rogersville is 238.
What is the Total Male Population of Rogersville?
Total Male Population of Rogersville is 135.
What is the Total Female Population of Rogersville?
Total Female Population of Rogersville is 103.
What is the Ratio of Males per 100 Females in Rogersville?
There are 131.07 Males per 100 Females in Rogersville.
What is the Ratio of Females per 100 Males in Rogersville?
There are 76.30 Females per 100 Males in Rogersville.
What is the Median Population Age in Rogersville?
Median Population Age in Rogersville is 36.3 Years.
What is the Average Family Size in Rogersville
Average Family Size in Rogersville is 2.9 People.
What is the Average Household Size in Rogersville
Average Household Size in Rogersville is 2.5 People.
How Large is the Labor Force in Rogersville?
There are 149 People in the Labor Forcein in Rogersville.
What is the Percentage of People in the Labor Force in Rogersville?
81.0% of People are in the Labor Force in Rogersville.