Hayden, AZ Map & Demographics
Hayden Map
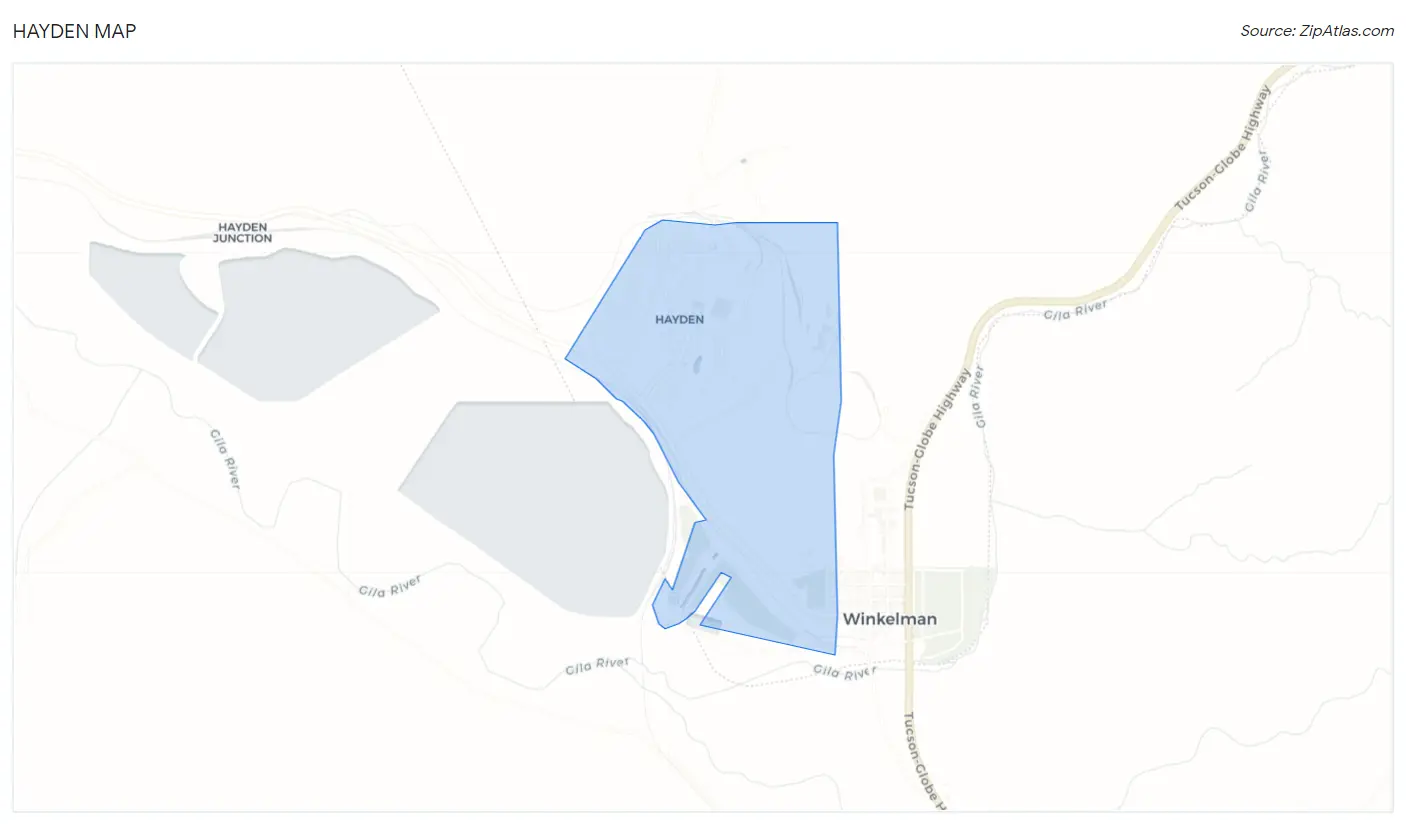
Hayden Overview
$19,167
PER CAPITA INCOME
$39,712
AVG FAMILY INCOME
$33,182
AVG HOUSEHOLD INCOME
0.47
INEQUALITY / GINI INDEX
525
TOTAL POPULATION
296
MALE POPULATION
229
FEMALE POPULATION
129.26
MALES / 100 FEMALES
77.36
FEMALES / 100 MALES
47.1
MEDIAN AGE
4.0
AVG FAMILY SIZE
2.6
AVG HOUSEHOLD SIZE
222
LABOR FORCE [ PEOPLE ]
46.9%
PERCENT IN LABOR FORCE
33.8%
UNEMPLOYMENT RATE
Hayden Zip Codes
Income in Hayden
Income Overview in Hayden
Per Capita Income in Hayden is $19,167, while median incomes of families and households are $39,712 and $33,182 respectively.
| Characteristic | Number | Measure |
| Per Capita Income | 525 | $19,167 |
| Median Family Income | 97 | $39,712 |
| Mean Family Income | 97 | $69,154 |
| Median Household Income | 202 | $33,182 |
| Mean Household Income | 202 | $46,971 |
| Income Deficit | 97 | $0 |
| Wage / Income Gap (%) | 525 | 0.00% |
| Wage / Income Gap ($) | 525 | 100.00¢ per $1 |
| Gini / Inequality Index | 525 | 0.47 |
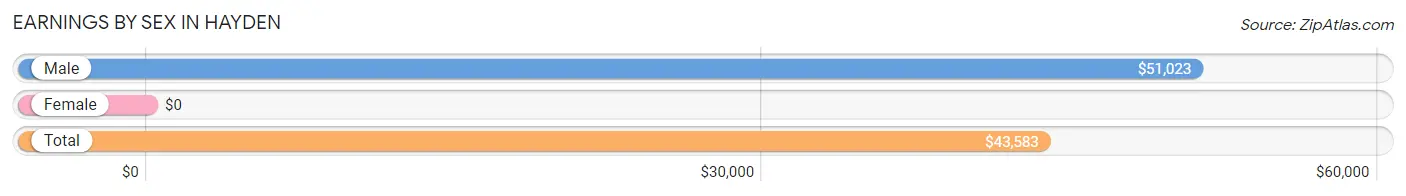
Earnings by Sex in Hayden
| Sex | Number | Average Earnings |
| Male | 101 (62.7%) | $51,023 |
| Female | 60 (37.3%) | $0 |
| Total | 161 (100.0%) | $43,583 |
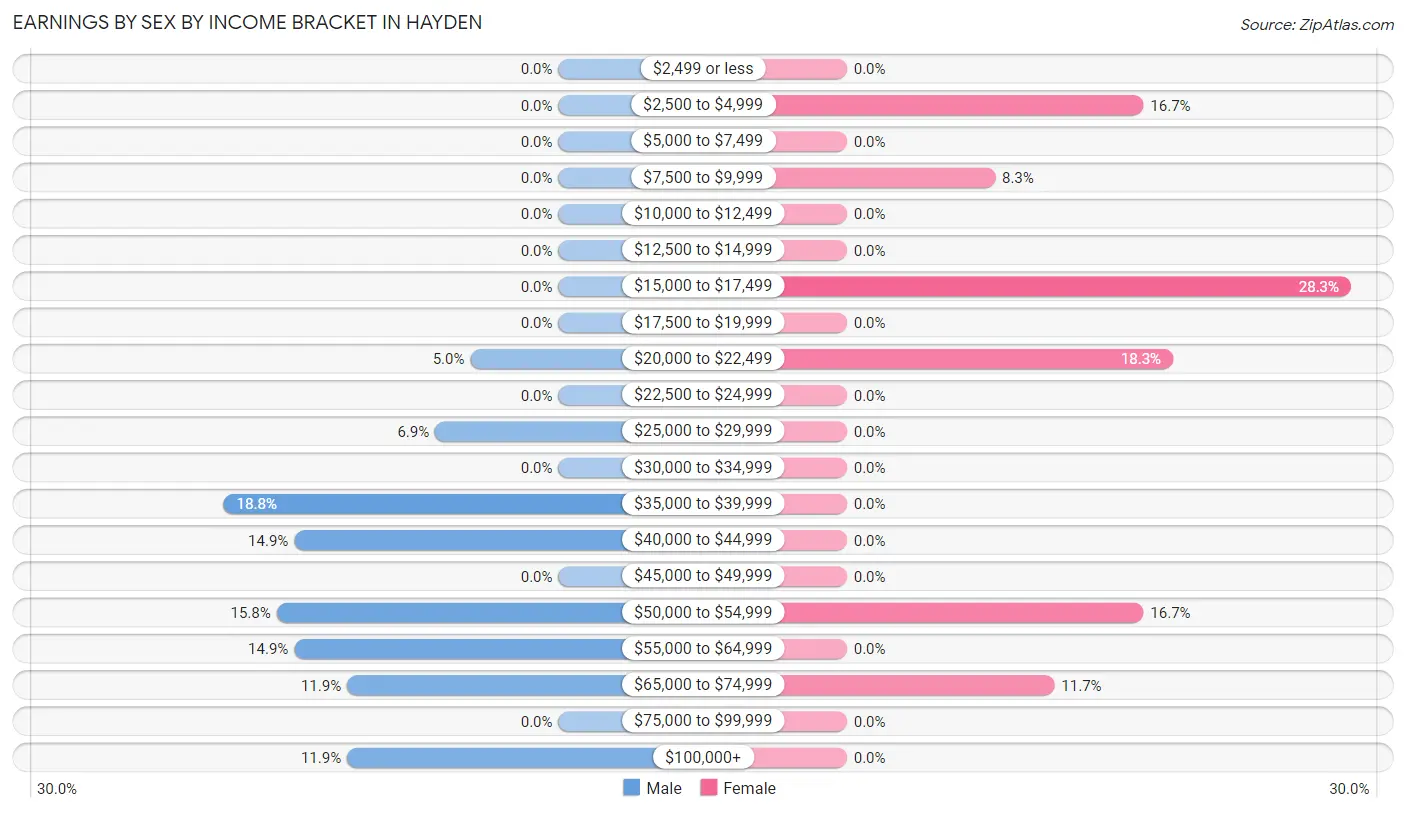
Earnings by Sex by Income Bracket in Hayden
The most common earnings brackets in Hayden are $35,000 to $39,999 for men (19 | 18.8%) and $15,000 to $17,499 for women (17 | 28.3%).
| Income | Male | Female |
| $2,499 or less | 0 (0.0%) | 0 (0.0%) |
| $2,500 to $4,999 | 0 (0.0%) | 10 (16.7%) |
| $5,000 to $7,499 | 0 (0.0%) | 0 (0.0%) |
| $7,500 to $9,999 | 0 (0.0%) | 5 (8.3%) |
| $10,000 to $12,499 | 0 (0.0%) | 0 (0.0%) |
| $12,500 to $14,999 | 0 (0.0%) | 0 (0.0%) |
| $15,000 to $17,499 | 0 (0.0%) | 17 (28.3%) |
| $17,500 to $19,999 | 0 (0.0%) | 0 (0.0%) |
| $20,000 to $22,499 | 5 (5.0%) | 11 (18.3%) |
| $22,500 to $24,999 | 0 (0.0%) | 0 (0.0%) |
| $25,000 to $29,999 | 7 (6.9%) | 0 (0.0%) |
| $30,000 to $34,999 | 0 (0.0%) | 0 (0.0%) |
| $35,000 to $39,999 | 19 (18.8%) | 0 (0.0%) |
| $40,000 to $44,999 | 15 (14.8%) | 0 (0.0%) |
| $45,000 to $49,999 | 0 (0.0%) | 0 (0.0%) |
| $50,000 to $54,999 | 16 (15.8%) | 10 (16.7%) |
| $55,000 to $64,999 | 15 (14.8%) | 0 (0.0%) |
| $65,000 to $74,999 | 12 (11.9%) | 7 (11.7%) |
| $75,000 to $99,999 | 0 (0.0%) | 0 (0.0%) |
| $100,000+ | 12 (11.9%) | 0 (0.0%) |
| Total | 101 (100.0%) | 60 (100.0%) |
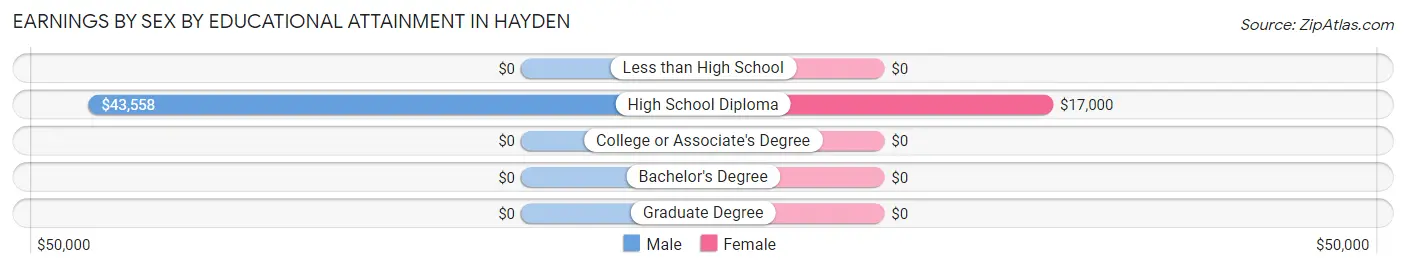
Earnings by Sex by Educational Attainment in Hayden
| Educational Attainment | Male Income | Female Income |
| Less than High School | - | - |
| High School Diploma | $43,558 | $17,000 |
| College or Associate's Degree | - | - |
| Bachelor's Degree | - | - |
| Graduate Degree | - | - |
| Total | $53,750 | $0 |
Family Income in Hayden
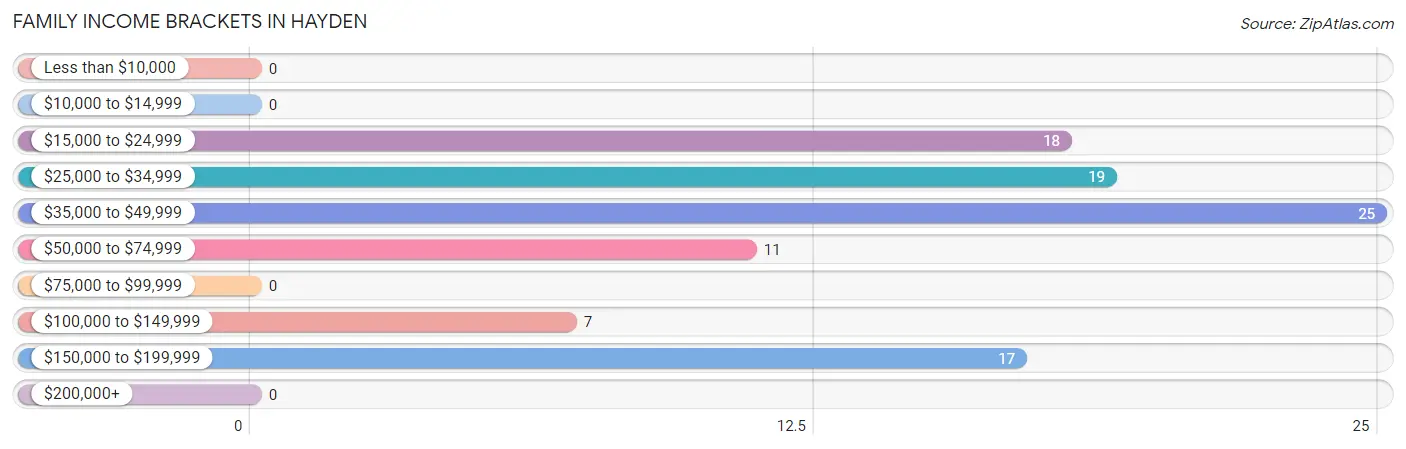
Family Income Brackets in Hayden
According to the Hayden family income data, there are 25 families falling into the $35,000 to $49,999 income range, which is the most common income bracket and makes up 25.8% of all families.
| Income Bracket | # Families | % Families |
| Less than $10,000 | 0 | 0.0% |
| $10,000 to $14,999 | 0 | 0.0% |
| $15,000 to $24,999 | 18 | 18.6% |
| $25,000 to $34,999 | 19 | 19.6% |
| $35,000 to $49,999 | 25 | 25.8% |
| $50,000 to $74,999 | 11 | 11.3% |
| $75,000 to $99,999 | 0 | 0.0% |
| $100,000 to $149,999 | 7 | 7.2% |
| $150,000 to $199,999 | 17 | 17.5% |
| $200,000+ | 0 | 0.0% |
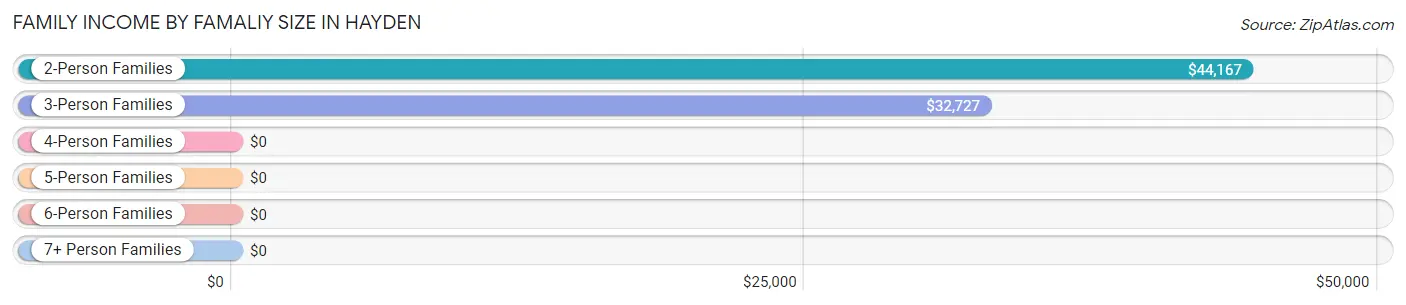
Family Income by Famaliy Size in Hayden
2-person families (12 | 12.4%) account for the highest median family income in Hayden with $44,167 per family, while 2-person families (12 | 12.4%) have the highest median income of $22,084 per family member.
| Income Bracket | # Families | Median Income |
| 2-Person Families | 12 (12.4%) | $44,167 |
| 3-Person Families | 46 (47.4%) | $32,727 |
| 4-Person Families | 16 (16.5%) | $0 |
| 5-Person Families | 6 (6.2%) | $0 |
| 6-Person Families | 12 (12.4%) | $0 |
| 7+ Person Families | 5 (5.1%) | $0 |
| Total | 97 (100.0%) | $39,712 |
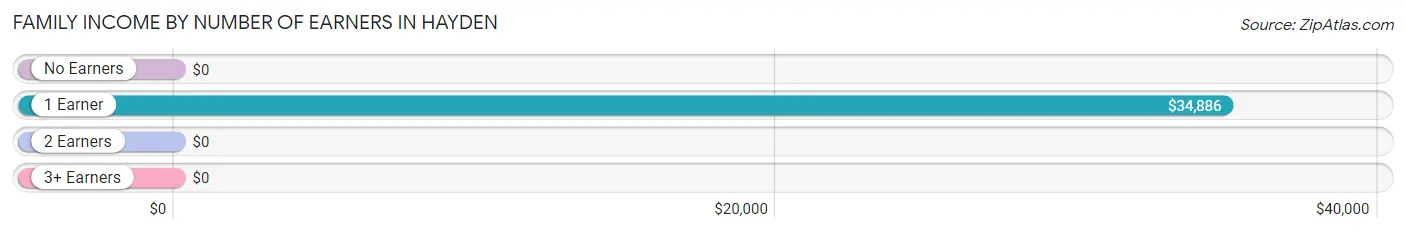
Family Income by Number of Earners in Hayden
| Number of Earners | # Families | Median Income |
| No Earners | 31 (32.0%) | $0 |
| 1 Earner | 37 (38.1%) | $34,886 |
| 2 Earners | 12 (12.4%) | $0 |
| 3+ Earners | 17 (17.5%) | $0 |
| Total | 97 (100.0%) | $39,712 |
Household Income in Hayden
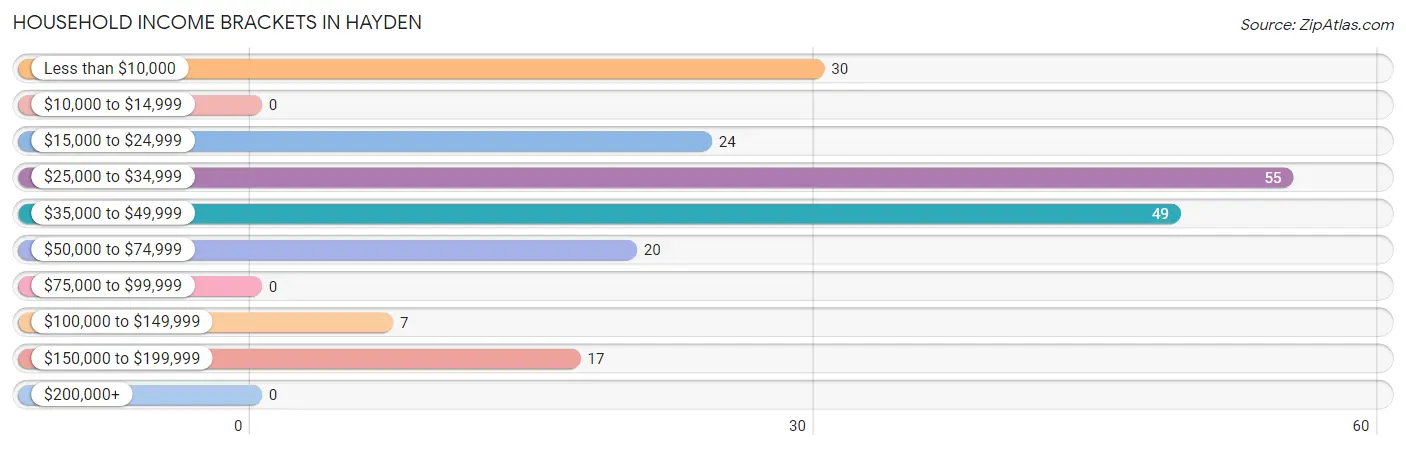
Household Income Brackets in Hayden
With 55 households falling in the category, the $25,000 to $34,999 income range is the most frequent in Hayden, accounting for 27.2% of all households.
| Income Bracket | # Households | % Households |
| Less than $10,000 | 30 | 14.9% |
| $10,000 to $14,999 | 0 | 0.0% |
| $15,000 to $24,999 | 24 | 11.9% |
| $25,000 to $34,999 | 55 | 27.2% |
| $35,000 to $49,999 | 49 | 24.3% |
| $50,000 to $74,999 | 20 | 9.9% |
| $75,000 to $99,999 | 0 | 0.0% |
| $100,000 to $149,999 | 7 | 3.5% |
| $150,000 to $199,999 | 17 | 8.4% |
| $200,000+ | 0 | 0.0% |
Household Income by Householder Age in Hayden
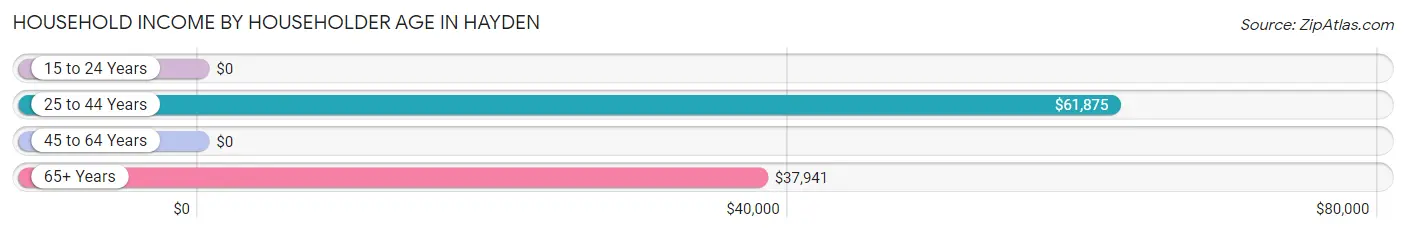
The median household income in Hayden is $33,182, with the highest median household income of $61,875 found in the 25 to 44 years age bracket for the primary householder. A total of 13 households (6.4%) fall into this category. Meanwhile, the 15 to 24 years age bracket for the primary householder has the lowest median household income of $0, with 23 households (11.4%) in this group.
| Income Bracket | # Households | Median Income |
| 15 to 24 Years | 23 (11.4%) | $0 |
| 25 to 44 Years | 13 (6.4%) | $61,875 |
| 45 to 64 Years | 78 (38.6%) | $0 |
| 65+ Years | 88 (43.6%) | $37,941 |
| Total | 202 (100.0%) | $33,182 |
Poverty in Hayden
Income Below Poverty by Sex and Age in Hayden
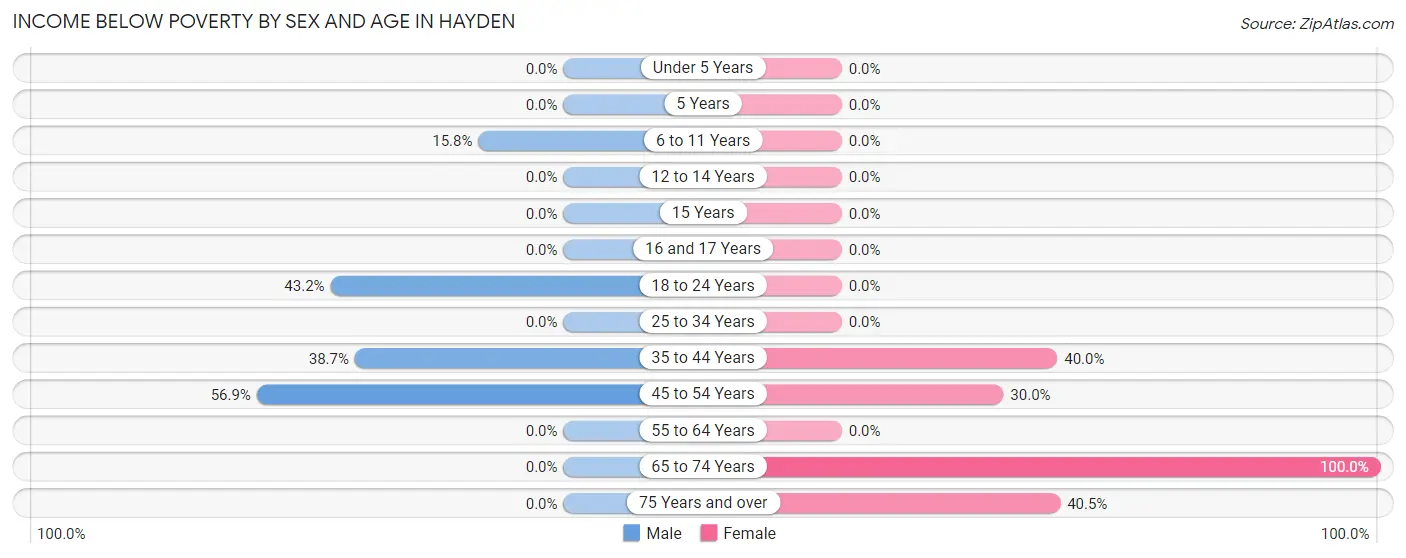
With 28.4% poverty level for males and 16.2% for females among the residents of Hayden, 45 to 54 year old males and 65 to 74 year old females are the most vulnerable to poverty, with 37 males (56.9%) and 6 females (100.0%) in their respective age groups living below the poverty level.
| Age Bracket | Male | Female |
| Under 5 Years | 0 (0.0%) | 0 (0.0%) |
| 5 Years | 0 (0.0%) | 0 (0.0%) |
| 6 to 11 Years | 3 (15.8%) | 0 (0.0%) |
| 12 to 14 Years | 0 (0.0%) | 0 (0.0%) |
| 15 Years | 0 (0.0%) | 0 (0.0%) |
| 16 and 17 Years | 0 (0.0%) | 0 (0.0%) |
| 18 to 24 Years | 32 (43.2%) | 0 (0.0%) |
| 25 to 34 Years | 0 (0.0%) | 0 (0.0%) |
| 35 to 44 Years | 12 (38.7%) | 4 (40.0%) |
| 45 to 54 Years | 37 (56.9%) | 12 (30.0%) |
| 55 to 64 Years | 0 (0.0%) | 0 (0.0%) |
| 65 to 74 Years | 0 (0.0%) | 6 (100.0%) |
| 75 Years and over | 0 (0.0%) | 15 (40.5%) |
| Total | 84 (28.4%) | 37 (16.2%) |
Income Above Poverty by Sex and Age in Hayden
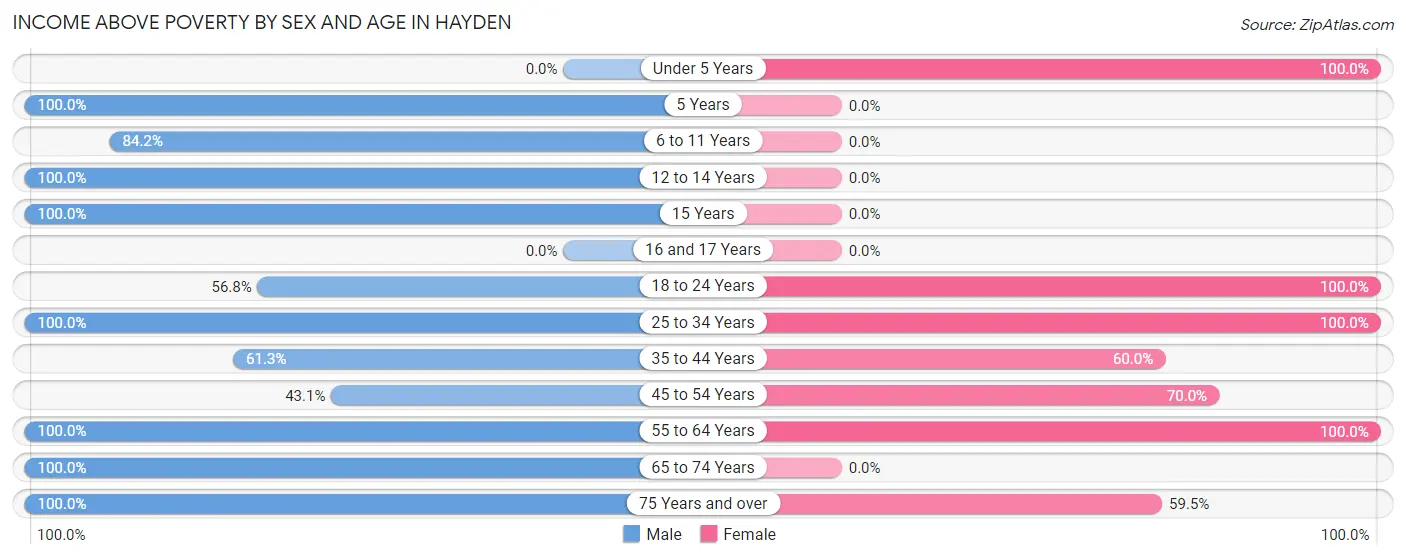
According to the poverty statistics in Hayden, males aged 5 years and females aged under 5 years are the age groups that are most secure financially, with 100.0% of males and 100.0% of females in these age groups living above the poverty line.
| Age Bracket | Male | Female |
| Under 5 Years | 0 (0.0%) | 13 (100.0%) |
| 5 Years | 6 (100.0%) | 0 (0.0%) |
| 6 to 11 Years | 16 (84.2%) | 0 (0.0%) |
| 12 to 14 Years | 9 (100.0%) | 0 (0.0%) |
| 15 Years | 5 (100.0%) | 0 (0.0%) |
| 16 and 17 Years | 0 (0.0%) | 0 (0.0%) |
| 18 to 24 Years | 42 (56.8%) | 61 (100.0%) |
| 25 to 34 Years | 22 (100.0%) | 11 (100.0%) |
| 35 to 44 Years | 19 (61.3%) | 6 (60.0%) |
| 45 to 54 Years | 28 (43.1%) | 28 (70.0%) |
| 55 to 64 Years | 12 (100.0%) | 51 (100.0%) |
| 65 to 74 Years | 37 (100.0%) | 0 (0.0%) |
| 75 Years and over | 16 (100.0%) | 22 (59.5%) |
| Total | 212 (71.6%) | 192 (83.8%) |
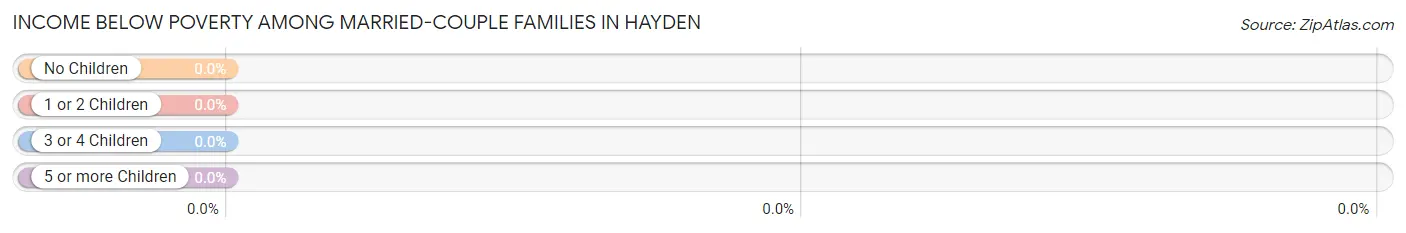
Income Below Poverty Among Married-Couple Families in Hayden
| Children | Above Poverty | Below Poverty |
| No Children | 22 (100.0%) | 0 (0.0%) |
| 1 or 2 Children | 23 (100.0%) | 0 (0.0%) |
| 3 or 4 Children | 0 (0.0%) | 0 (0.0%) |
| 5 or more Children | 0 (0.0%) | 0 (0.0%) |
| Total | 45 (100.0%) | 0 (0.0%) |
Income Below Poverty Among Single-Parent Households in Hayden
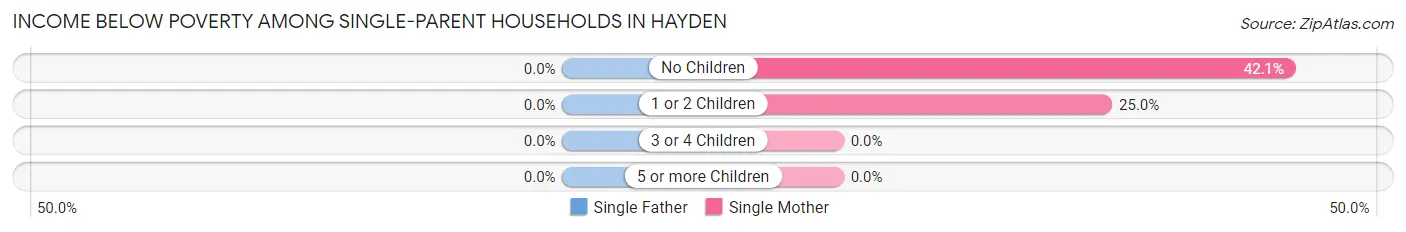
| Children | Single Father | Single Mother |
| No Children | 0 (0.0%) | 8 (42.1%) |
| 1 or 2 Children | 0 (0.0%) | 6 (25.0%) |
| 3 or 4 Children | 0 (0.0%) | 0 (0.0%) |
| 5 or more Children | 0 (0.0%) | 0 (0.0%) |
| Total | 0 (0.0%) | 14 (32.6%) |
Income Below Poverty Among Married-Couple vs Single-Parent Households in Hayden
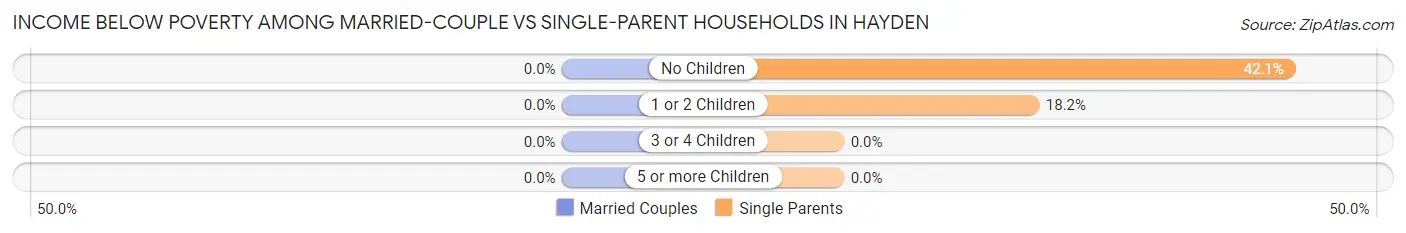
| Children | Married-Couple Families | Single-Parent Households |
| No Children | 0 (0.0%) | 8 (42.1%) |
| 1 or 2 Children | 0 (0.0%) | 6 (18.2%) |
| 3 or 4 Children | 0 (0.0%) | 0 (0.0%) |
| 5 or more Children | 0 (0.0%) | 0 (0.0%) |
| Total | 0 (0.0%) | 14 (26.9%) |
Race in Hayden
The most populous races in Hayden are Hispanic or Latino (495 | 94.3%), White / Caucasian (314 | 59.8%), and Two or more Races (165 | 31.4%).
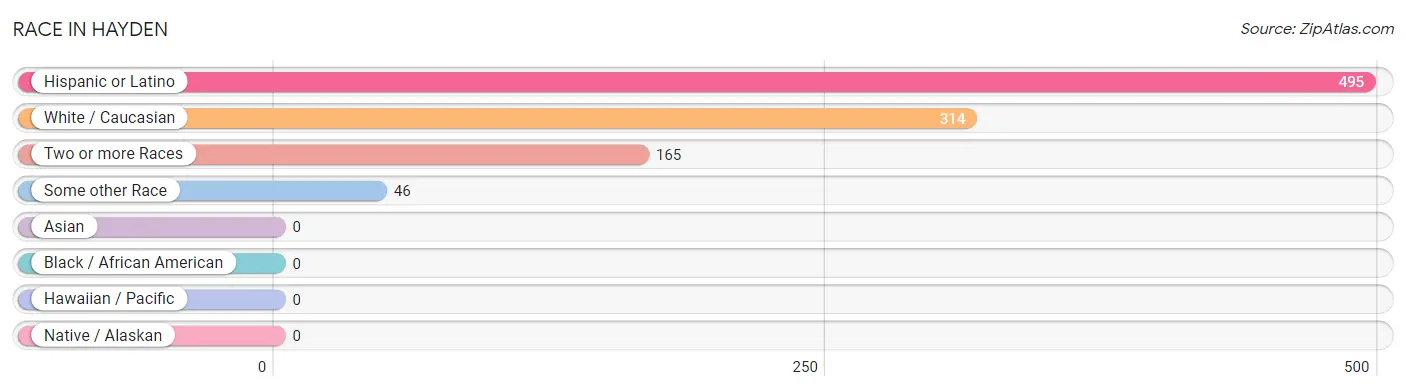
| Race | # Population | % Population |
| Asian | 0 | 0.0% |
| Black / African American | 0 | 0.0% |
| Hawaiian / Pacific | 0 | 0.0% |
| Hispanic or Latino | 495 | 94.3% |
| Native / Alaskan | 0 | 0.0% |
| White / Caucasian | 314 | 59.8% |
| Two or more Races | 165 | 31.4% |
| Some other Race | 46 | 8.8% |
| Total | 525 | 100.0% |
Ancestry in Hayden
The most populous ancestries reported in Hayden are Mexican (495 | 94.3%), Irish (76 | 14.5%), German (19 | 3.6%), Italian (18 | 3.4%), and Apache (14 | 2.7%), together accounting for 118.5% of all Hayden residents.
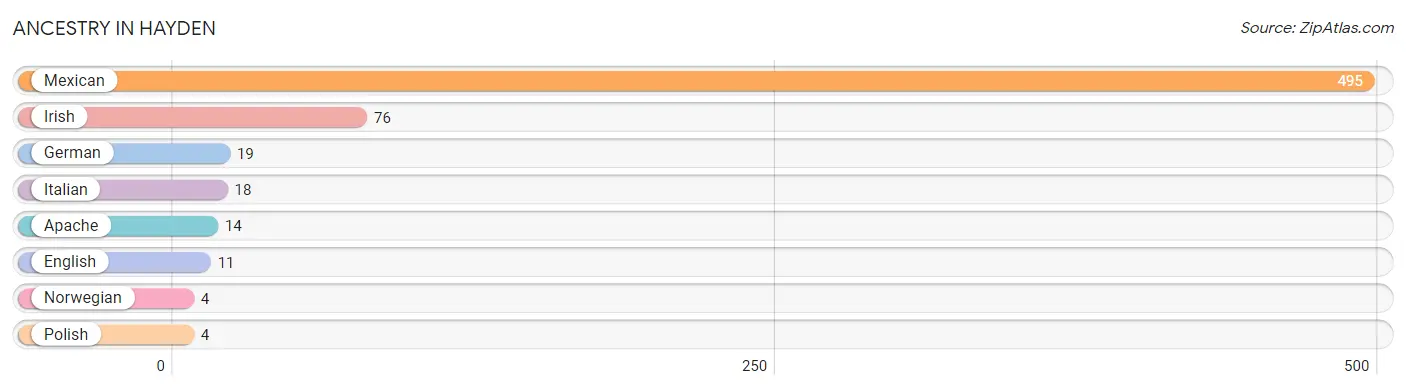
| Ancestry | # Population | % Population |
| Apache | 14 | 2.7% |
| English | 11 | 2.1% |
| German | 19 | 3.6% |
| Irish | 76 | 14.5% |
| Italian | 18 | 3.4% |
| Mexican | 495 | 94.3% |
| Norwegian | 4 | 0.8% |
| Polish | 4 | 0.8% | View All 8 Rows |
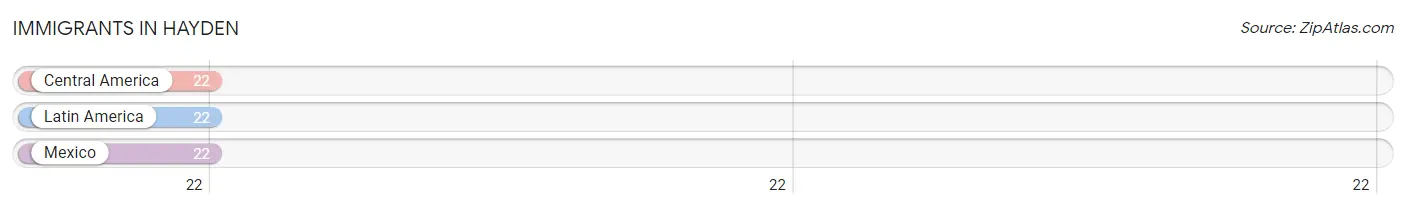
Immigrants in Hayden
The most numerous immigrant groups reported in Hayden came from Central America (22 | 4.2%), Latin America (22 | 4.2%), and Mexico (22 | 4.2%), together accounting for 12.6% of all Hayden residents.
| Immigration Origin | # Population | % Population |
| Central America | 22 | 4.2% |
| Latin America | 22 | 4.2% |
| Mexico | 22 | 4.2% | View All 3 Rows |
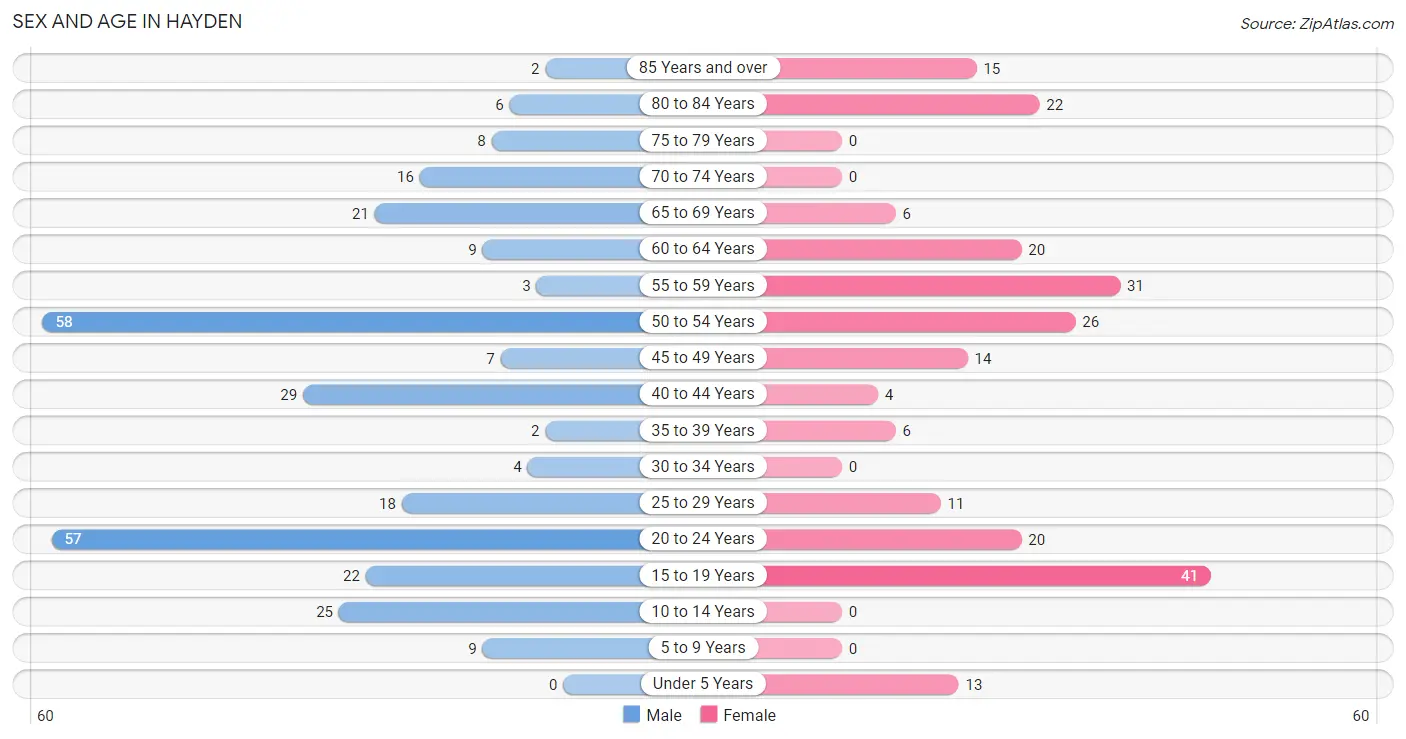
Sex and Age in Hayden
Sex and Age in Hayden
The most populous age groups in Hayden are 50 to 54 Years (58 | 19.6%) for men and 15 to 19 Years (41 | 17.9%) for women.
| Age Bracket | Male | Female |
| Under 5 Years | 0 (0.0%) | 13 (5.7%) |
| 5 to 9 Years | 9 (3.0%) | 0 (0.0%) |
| 10 to 14 Years | 25 (8.5%) | 0 (0.0%) |
| 15 to 19 Years | 22 (7.4%) | 41 (17.9%) |
| 20 to 24 Years | 57 (19.3%) | 20 (8.7%) |
| 25 to 29 Years | 18 (6.1%) | 11 (4.8%) |
| 30 to 34 Years | 4 (1.3%) | 0 (0.0%) |
| 35 to 39 Years | 2 (0.7%) | 6 (2.6%) |
| 40 to 44 Years | 29 (9.8%) | 4 (1.8%) |
| 45 to 49 Years | 7 (2.4%) | 14 (6.1%) |
| 50 to 54 Years | 58 (19.6%) | 26 (11.4%) |
| 55 to 59 Years | 3 (1.0%) | 31 (13.5%) |
| 60 to 64 Years | 9 (3.0%) | 20 (8.7%) |
| 65 to 69 Years | 21 (7.1%) | 6 (2.6%) |
| 70 to 74 Years | 16 (5.4%) | 0 (0.0%) |
| 75 to 79 Years | 8 (2.7%) | 0 (0.0%) |
| 80 to 84 Years | 6 (2.0%) | 22 (9.6%) |
| 85 Years and over | 2 (0.7%) | 15 (6.6%) |
| Total | 296 (100.0%) | 229 (100.0%) |
Families and Households in Hayden
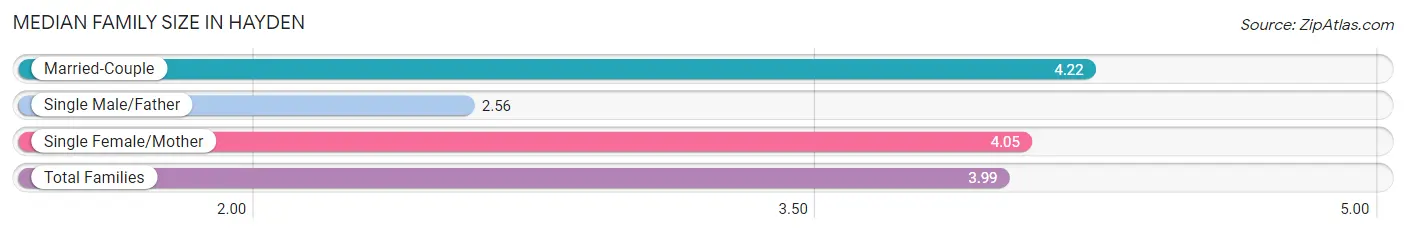
Median Family Size in Hayden
The median family size in Hayden is 3.99 persons per family, with married-couple families (45 | 46.4%) accounting for the largest median family size of 4.22 persons per family. On the other hand, single male/father families (9 | 9.3%) represent the smallest median family size with 2.56 persons per family.
| Family Type | # Families | Family Size |
| Married-Couple | 45 (46.4%) | 4.22 |
| Single Male/Father | 9 (9.3%) | 2.56 |
| Single Female/Mother | 43 (44.3%) | 4.05 |
| Total Families | 97 (100.0%) | 3.99 |
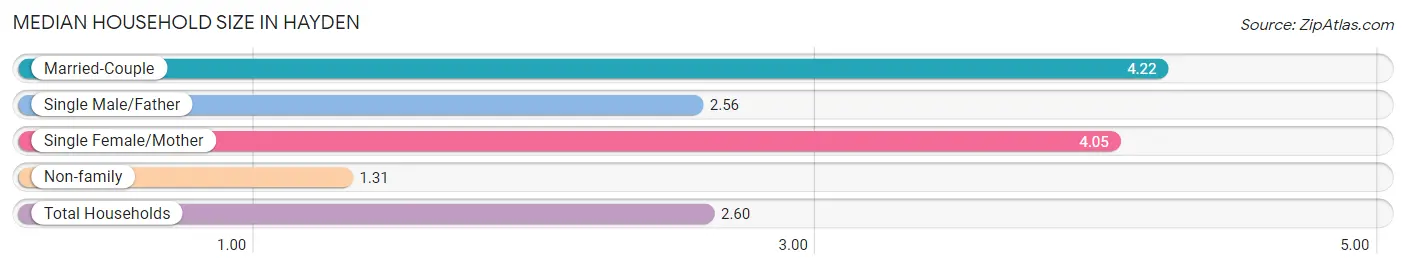
Median Household Size in Hayden
The median household size in Hayden is 2.60 persons per household, with married-couple households (45 | 22.3%) accounting for the largest median household size of 4.22 persons per household. non-family households (105 | 52.0%) represent the smallest median household size with 1.31 persons per household.
| Household Type | # Households | Household Size |
| Married-Couple | 45 (22.3%) | 4.22 |
| Single Male/Father | 9 (4.5%) | 2.56 |
| Single Female/Mother | 43 (21.3%) | 4.05 |
| Non-family | 105 (52.0%) | 1.31 |
| Total Households | 202 (100.0%) | 2.60 |
Household Size by Marriage Status in Hayden
Out of a total of 202 households in Hayden, 97 (48.0%) are family households, while 105 (52.0%) are nonfamily households. The most numerous type of family households are 3-person households, comprising 46, and the most common type of nonfamily households are 1-person households, comprising 63.
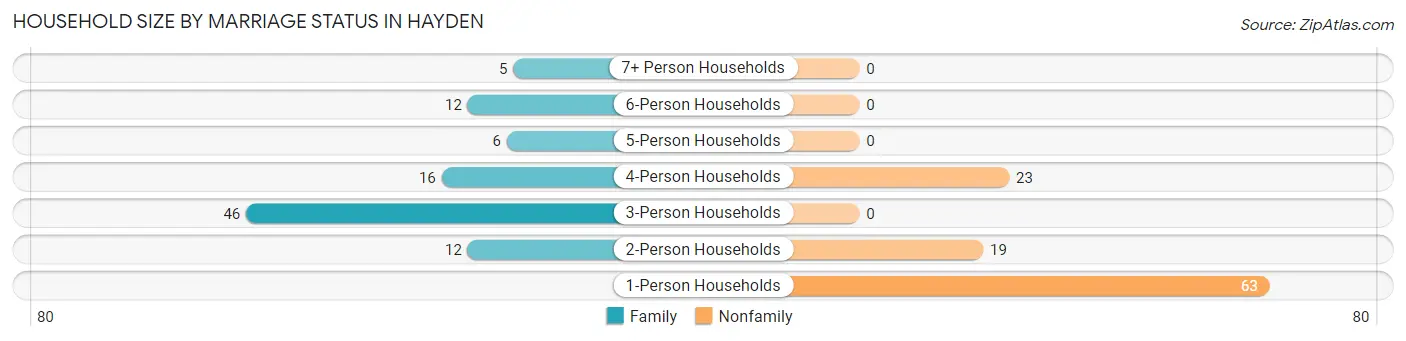
| Household Size | Family Households | Nonfamily Households |
| 1-Person Households | - | 63 (31.2%) |
| 2-Person Households | 12 (5.9%) | 19 (9.4%) |
| 3-Person Households | 46 (22.8%) | 0 (0.0%) |
| 4-Person Households | 16 (7.9%) | 23 (11.4%) |
| 5-Person Households | 6 (3.0%) | 0 (0.0%) |
| 6-Person Households | 12 (5.9%) | 0 (0.0%) |
| 7+ Person Households | 5 (2.5%) | 0 (0.0%) |
| Total | 97 (48.0%) | 105 (52.0%) |
Female Fertility in Hayden
Fertility by Age in Hayden
| Age Bracket | Women with Births | Births / 1,000 Women |
| 15 to 19 years | 0 (0.0%) | 0.0 |
| 20 to 34 years | 0 (0.0%) | 0.0 |
| 35 to 50 years | 0 (0.0%) | 0.0 |
| Total | 0 (0.0%) | 0.0 |
Fertility by Age by Marriage Status in Hayden
| Age Bracket | Married | Unmarried |
| 15 to 19 years | 0 (0.0%) | 0 (0.0%) |
| 20 to 34 years | 0 (0.0%) | 0 (0.0%) |
| 35 to 50 years | 0 (0.0%) | 0 (0.0%) |
| Total | 0 (0.0%) | 0 (0.0%) |
Fertility by Education in Hayden
| Educational Attainment | Women with Births | Births / 1,000 Women |
| Less than High School | 0 (0.0%) | 0.0 |
| High School Diploma | 0 (0.0%) | 0.0 |
| College or Associate's Degree | 0 (0.0%) | 0.0 |
| Bachelor's Degree | 0 (0.0%) | 0.0 |
| Graduate Degree | 0 (0.0%) | 0.0 |
| Total | 0 (0.0%) | 0.0 |
Fertility by Education by Marriage Status in Hayden
| Educational Attainment | Married | Unmarried |
| Less than High School | 0 (0.0%) | 0 (0.0%) |
| High School Diploma | 0 (0.0%) | 0 (0.0%) |
| College or Associate's Degree | 0 (0.0%) | 0 (0.0%) |
| Bachelor's Degree | 0 (0.0%) | 0 (0.0%) |
| Graduate Degree | 0 (0.0%) | 0 (0.0%) |
| Total | 0 (0.0%) | 0 (0.0%) |
Employment Characteristics in Hayden
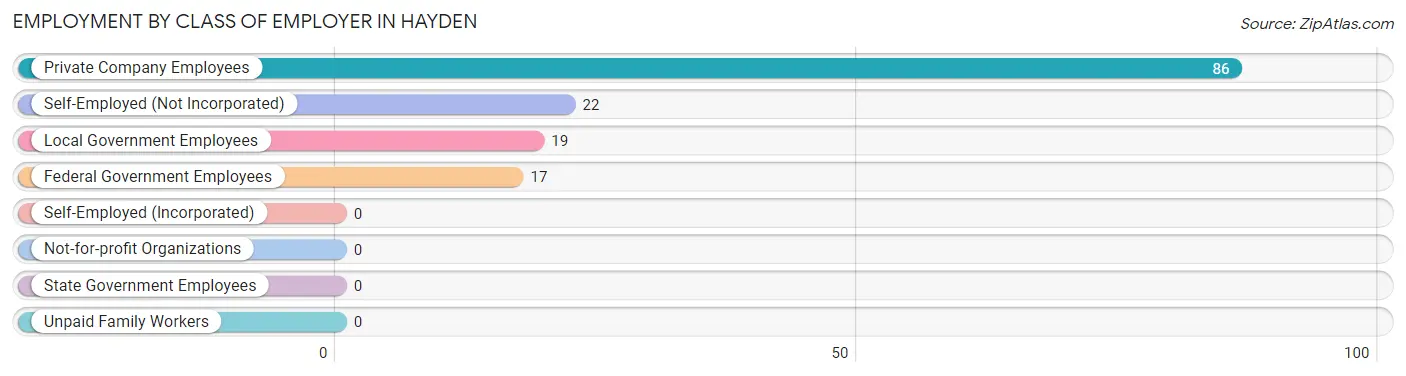
Employment by Class of Employer in Hayden
Among the 144 employed individuals in Hayden, private company employees (86 | 59.7%), self-employed (not incorporated) (22 | 15.3%), and local government employees (19 | 13.2%) make up the most common classes of employment.
| Employer Class | # Employees | % Employees |
| Private Company Employees | 86 | 59.7% |
| Self-Employed (Incorporated) | 0 | 0.0% |
| Self-Employed (Not Incorporated) | 22 | 15.3% |
| Not-for-profit Organizations | 0 | 0.0% |
| Local Government Employees | 19 | 13.2% |
| State Government Employees | 0 | 0.0% |
| Federal Government Employees | 17 | 11.8% |
| Unpaid Family Workers | 0 | 0.0% |
| Total | 144 | 100.0% |
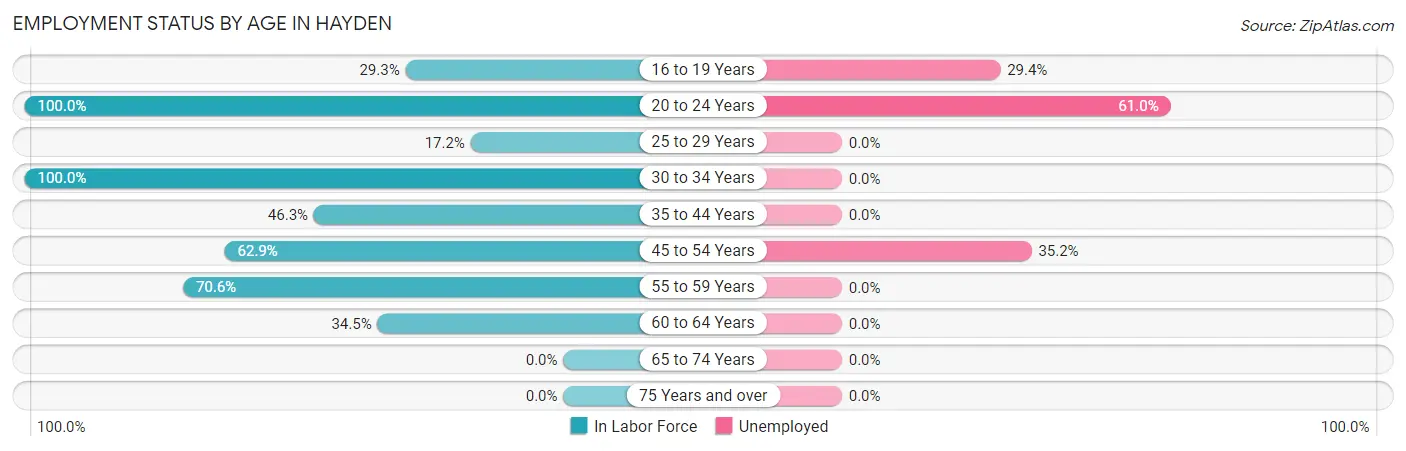
Employment Status by Age in Hayden
According to the labor force statistics for Hayden, out of the total population over 16 years of age (473), 46.9% or 222 individuals are in the labor force, with 33.8% or 75 of them unemployed. The age group with the highest labor force participation rate is 20 to 24 years, with 100.0% or 77 individuals in the labor force. Within the labor force, the 20 to 24 years age range has the highest percentage of unemployed individuals, with 61.0% or 47 of them being unemployed.
| Age Bracket | In Labor Force | Unemployed |
| 16 to 19 Years | 17 (29.3%) | 5 (29.4%) |
| 20 to 24 Years | 77 (100.0%) | 47 (61.0%) |
| 25 to 29 Years | 5 (17.2%) | 0 (0.0%) |
| 30 to 34 Years | 4 (100.0%) | 0 (0.0%) |
| 35 to 44 Years | 19 (46.3%) | 0 (0.0%) |
| 45 to 54 Years | 66 (62.9%) | 23 (35.2%) |
| 55 to 59 Years | 24 (70.6%) | 0 (0.0%) |
| 60 to 64 Years | 10 (34.5%) | 0 (0.0%) |
| 65 to 74 Years | 0 (0.0%) | 0 (0.0%) |
| 75 Years and over | 0 (0.0%) | 0 (0.0%) |
| Total | 222 (46.9%) | 75 (33.8%) |
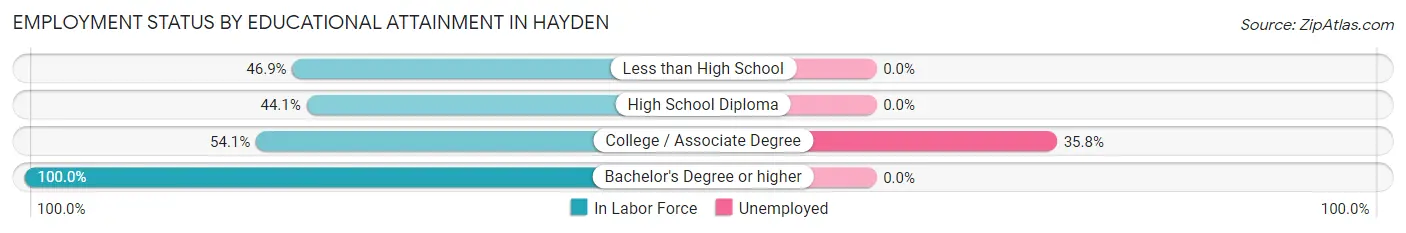
Employment Status by Educational Attainment in Hayden
According to labor force statistics for Hayden, 52.9% of individuals (128) out of the total population between 25 and 64 years of age (242) are in the labor force, with 16.4% or 21 of them being unemployed. The group with the highest labor force participation rate are those with the educational attainment of bachelor's degree or higher, with 100.0% or 19 individuals in the labor force. Within the labor force, individuals with college / associate degree education have the highest percentage of unemployment, with 35.8% or 19 of them being unemployed.
| Educational Attainment | In Labor Force | Unemployed |
| Less than High School | 15 (46.9%) | 0 (0.0%) |
| High School Diploma | 41 (44.1%) | 0 (0.0%) |
| College / Associate Degree | 53 (54.1%) | 35 (35.8%) |
| Bachelor's Degree or higher | 19 (100.0%) | 0 (0.0%) |
| Total | 128 (52.9%) | 40 (16.4%) |
Employment Occupations by Sex in Hayden
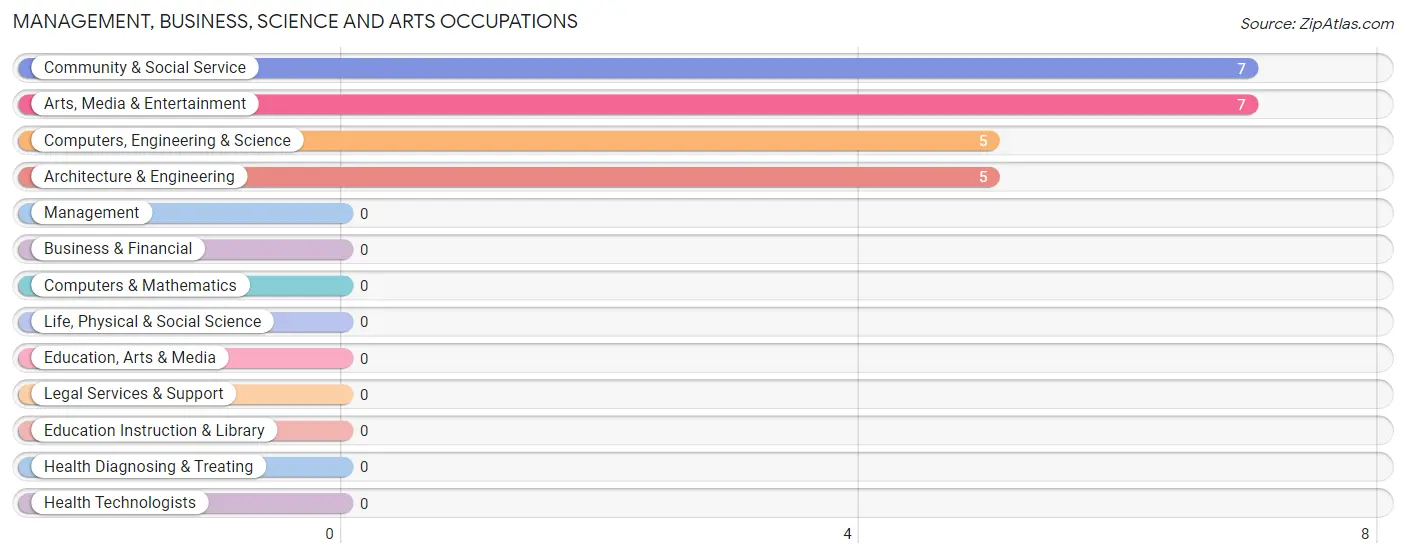
Management, Business, Science and Arts Occupations
The most common Management, Business, Science and Arts occupations in Hayden are Community & Social Service (7 | 5.0%), Arts, Media & Entertainment (7 | 5.0%), Computers, Engineering & Science (5 | 3.6%), and Architecture & Engineering (5 | 3.6%).
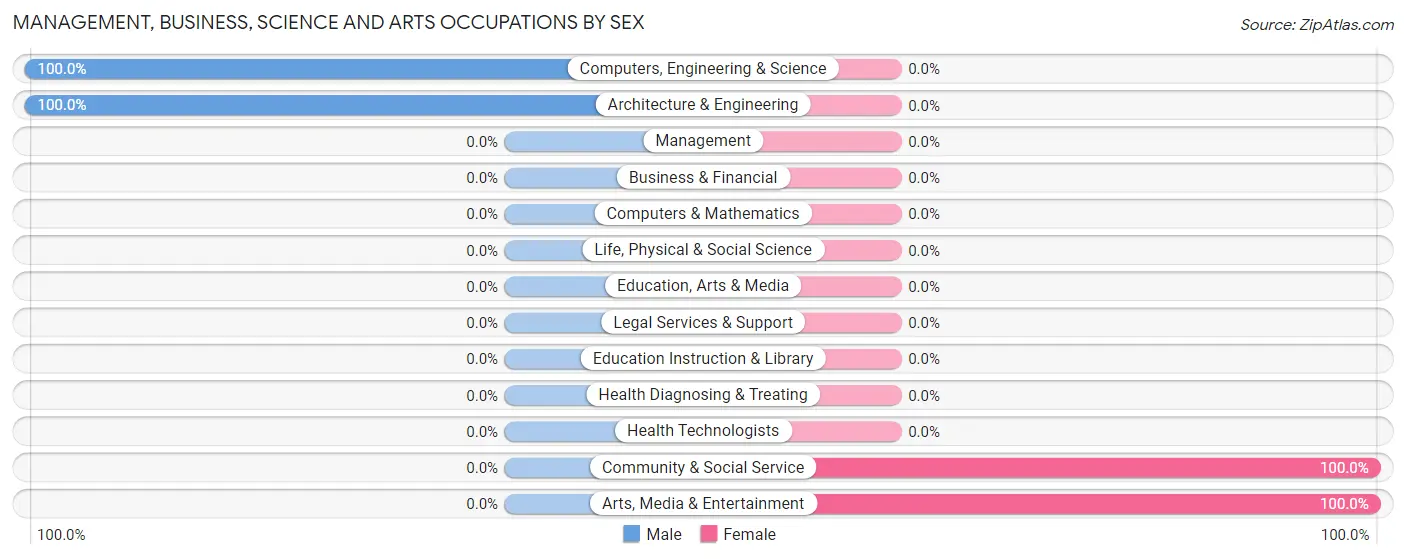
Management, Business, Science and Arts Occupations by Sex
Within the Management, Business, Science and Arts occupations in Hayden, the most male-oriented occupations are Computers, Engineering & Science (100.0%), and Architecture & Engineering (100.0%), while the most female-oriented occupations are Community & Social Service (100.0%), and Arts, Media & Entertainment (100.0%).
| Occupation | Male | Female |
| Management | 0 (0.0%) | 0 (0.0%) |
| Business & Financial | 0 (0.0%) | 0 (0.0%) |
| Computers, Engineering & Science | 5 (100.0%) | 0 (0.0%) |
| Computers & Mathematics | 0 (0.0%) | 0 (0.0%) |
| Architecture & Engineering | 5 (100.0%) | 0 (0.0%) |
| Life, Physical & Social Science | 0 (0.0%) | 0 (0.0%) |
| Community & Social Service | 0 (0.0%) | 7 (100.0%) |
| Education, Arts & Media | 0 (0.0%) | 0 (0.0%) |
| Legal Services & Support | 0 (0.0%) | 0 (0.0%) |
| Education Instruction & Library | 0 (0.0%) | 0 (0.0%) |
| Arts, Media & Entertainment | 0 (0.0%) | 7 (100.0%) |
| Health Diagnosing & Treating | 0 (0.0%) | 0 (0.0%) |
| Health Technologists | 0 (0.0%) | 0 (0.0%) |
| Total (Category) | 5 (41.7%) | 7 (58.3%) |
| Total (Overall) | 89 (64.0%) | 50 (36.0%) |
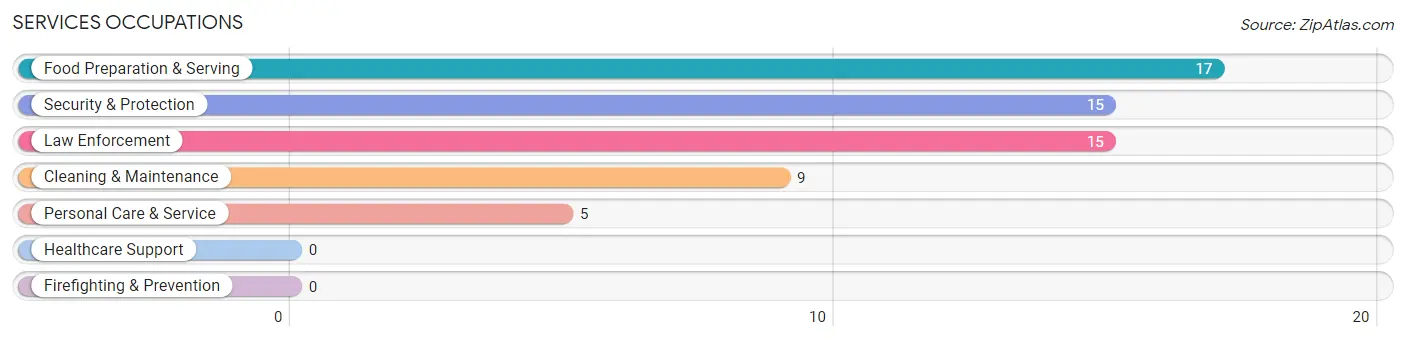
Services Occupations
The most common Services occupations in Hayden are Food Preparation & Serving (17 | 12.2%), Security & Protection (15 | 10.8%), Law Enforcement (15 | 10.8%), Cleaning & Maintenance (9 | 6.5%), and Personal Care & Service (5 | 3.6%).
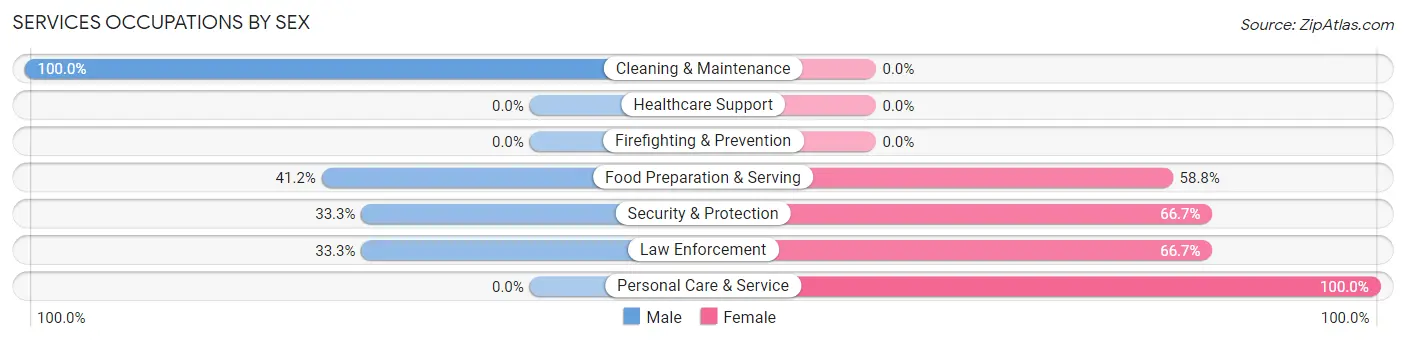
Services Occupations by Sex
Within the Services occupations in Hayden, the most male-oriented occupations are Cleaning & Maintenance (100.0%), Food Preparation & Serving (41.2%), and Security & Protection (33.3%), while the most female-oriented occupations are Personal Care & Service (100.0%), Security & Protection (66.7%), and Law Enforcement (66.7%).
| Occupation | Male | Female |
| Healthcare Support | 0 (0.0%) | 0 (0.0%) |
| Security & Protection | 5 (33.3%) | 10 (66.7%) |
| Firefighting & Prevention | 0 (0.0%) | 0 (0.0%) |
| Law Enforcement | 5 (33.3%) | 10 (66.7%) |
| Food Preparation & Serving | 7 (41.2%) | 10 (58.8%) |
| Cleaning & Maintenance | 9 (100.0%) | 0 (0.0%) |
| Personal Care & Service | 0 (0.0%) | 5 (100.0%) |
| Total (Category) | 21 (45.7%) | 25 (54.3%) |
| Total (Overall) | 89 (64.0%) | 50 (36.0%) |
Sales and Office Occupations
The most common Sales and Office occupations in Hayden are Sales & Related (30 | 21.6%), and Office & Administration (2 | 1.4%).
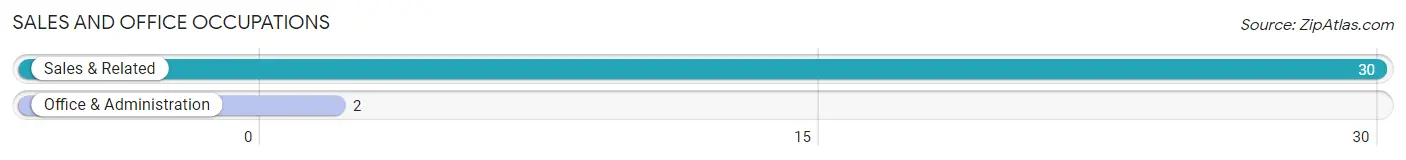
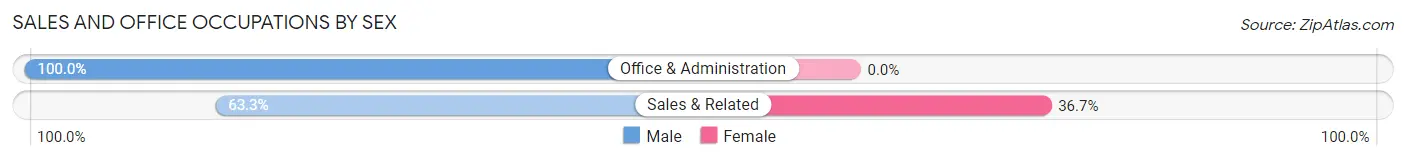
Sales and Office Occupations by Sex
| Occupation | Male | Female |
| Sales & Related | 19 (63.3%) | 11 (36.7%) |
| Office & Administration | 2 (100.0%) | 0 (0.0%) |
| Total (Category) | 21 (65.6%) | 11 (34.4%) |
| Total (Overall) | 89 (64.0%) | 50 (36.0%) |
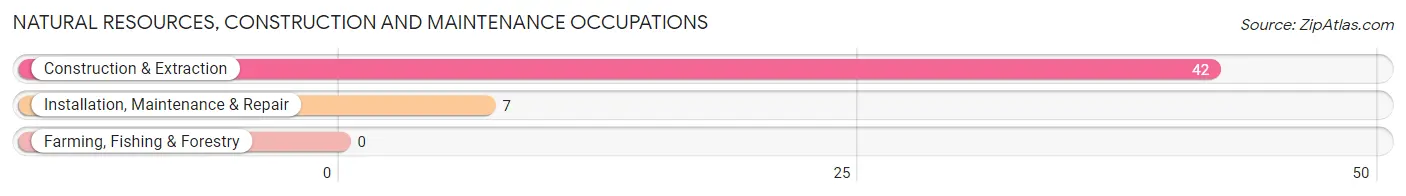
Natural Resources, Construction and Maintenance Occupations
The most common Natural Resources, Construction and Maintenance occupations in Hayden are Construction & Extraction (42 | 30.2%), and Installation, Maintenance & Repair (7 | 5.0%).
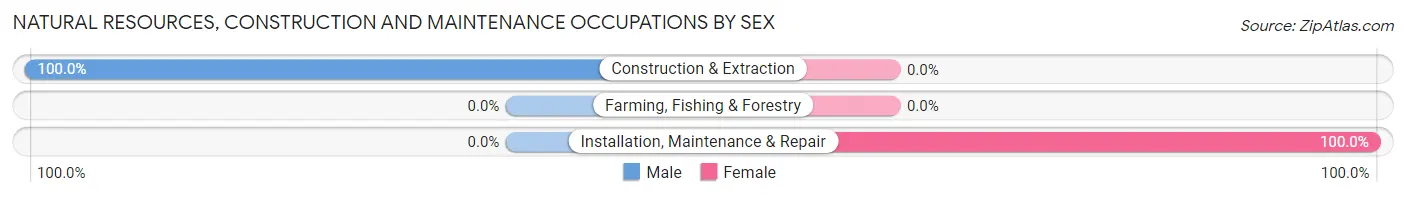
Natural Resources, Construction and Maintenance Occupations by Sex
| Occupation | Male | Female |
| Farming, Fishing & Forestry | 0 (0.0%) | 0 (0.0%) |
| Construction & Extraction | 42 (100.0%) | 0 (0.0%) |
| Installation, Maintenance & Repair | 0 (0.0%) | 7 (100.0%) |
| Total (Category) | 42 (85.7%) | 7 (14.3%) |
| Total (Overall) | 89 (64.0%) | 50 (36.0%) |
Production, Transportation and Moving Occupations
Production, Transportation and Moving Occupations by Sex
| Occupation | Male | Female |
| Production | 0 (0.0%) | 0 (0.0%) |
| Transportation | 0 (0.0%) | 0 (0.0%) |
| Material Moving | 0 (0.0%) | 0 (0.0%) |
| Total (Category) | 0 (0.0%) | 0 (0.0%) |
| Total (Overall) | 89 (64.0%) | 50 (36.0%) |
Employment Industries by Sex in Hayden
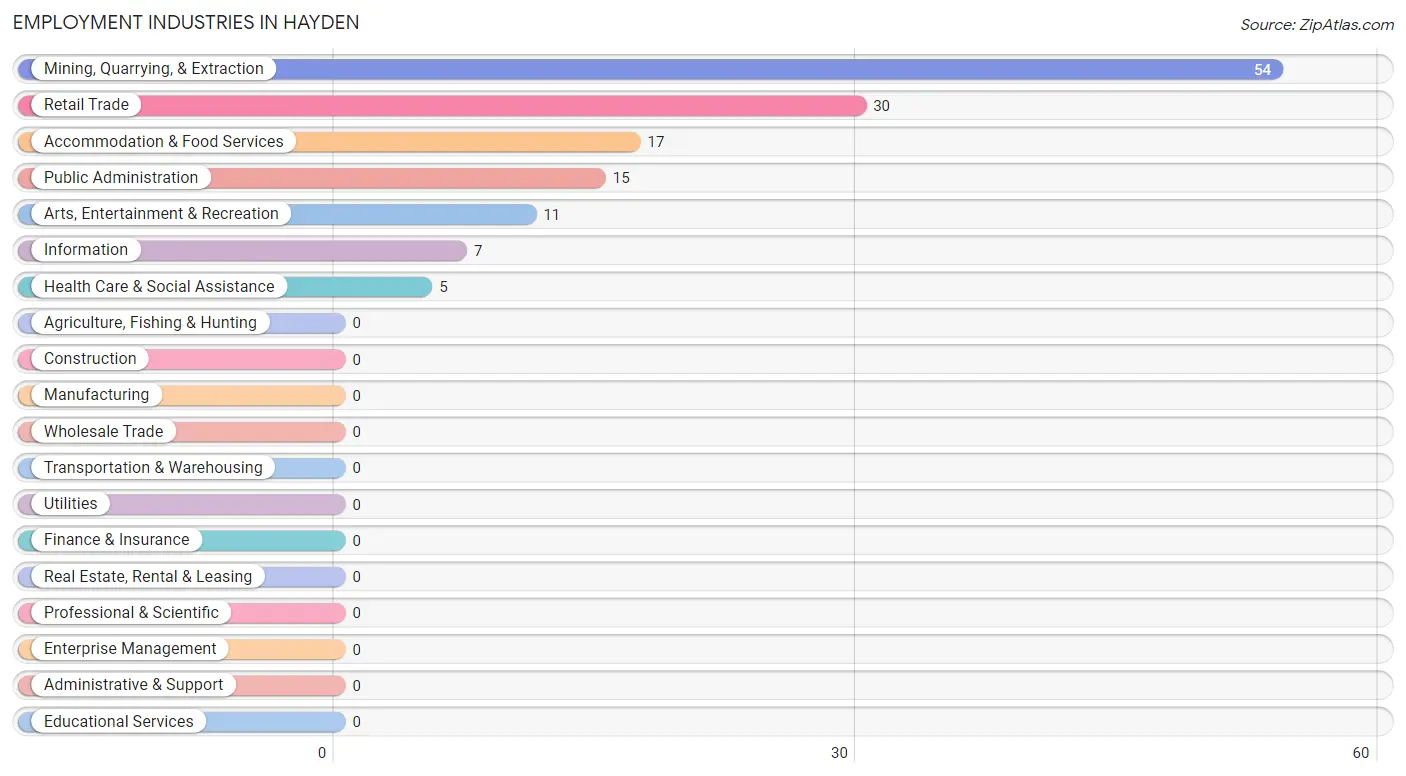
Employment Industries in Hayden
The major employment industries in Hayden include Mining, Quarrying, & Extraction (54 | 38.9%), Retail Trade (30 | 21.6%), Accommodation & Food Services (17 | 12.2%), Public Administration (15 | 10.8%), and Arts, Entertainment & Recreation (11 | 7.9%).
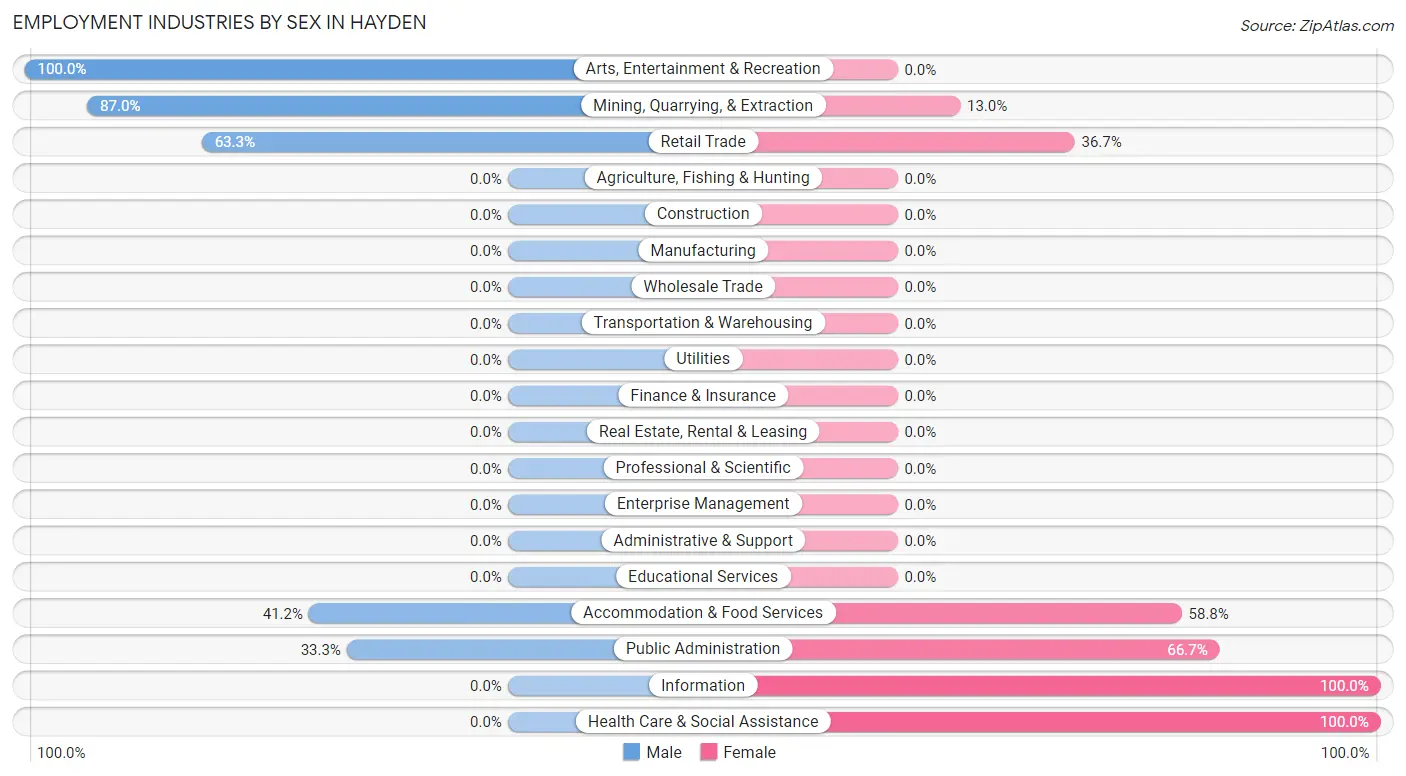
Employment Industries by Sex in Hayden
The Hayden industries that see more men than women are Arts, Entertainment & Recreation (100.0%), Mining, Quarrying, & Extraction (87.0%), and Retail Trade (63.3%), whereas the industries that tend to have a higher number of women are Information (100.0%), Health Care & Social Assistance (100.0%), and Public Administration (66.7%).
| Industry | Male | Female |
| Agriculture, Fishing & Hunting | 0 (0.0%) | 0 (0.0%) |
| Mining, Quarrying, & Extraction | 47 (87.0%) | 7 (13.0%) |
| Construction | 0 (0.0%) | 0 (0.0%) |
| Manufacturing | 0 (0.0%) | 0 (0.0%) |
| Wholesale Trade | 0 (0.0%) | 0 (0.0%) |
| Retail Trade | 19 (63.3%) | 11 (36.7%) |
| Transportation & Warehousing | 0 (0.0%) | 0 (0.0%) |
| Utilities | 0 (0.0%) | 0 (0.0%) |
| Information | 0 (0.0%) | 7 (100.0%) |
| Finance & Insurance | 0 (0.0%) | 0 (0.0%) |
| Real Estate, Rental & Leasing | 0 (0.0%) | 0 (0.0%) |
| Professional & Scientific | 0 (0.0%) | 0 (0.0%) |
| Enterprise Management | 0 (0.0%) | 0 (0.0%) |
| Administrative & Support | 0 (0.0%) | 0 (0.0%) |
| Educational Services | 0 (0.0%) | 0 (0.0%) |
| Health Care & Social Assistance | 0 (0.0%) | 5 (100.0%) |
| Arts, Entertainment & Recreation | 11 (100.0%) | 0 (0.0%) |
| Accommodation & Food Services | 7 (41.2%) | 10 (58.8%) |
| Public Administration | 5 (33.3%) | 10 (66.7%) |
| Total | 89 (64.0%) | 50 (36.0%) |
Education in Hayden
School Enrollment in Hayden
The most common levels of schooling among the 79 students in Hayden are high school (31 | 39.2%), college / undergraduate (26 | 32.9%), and elementary school (16 | 20.3%).
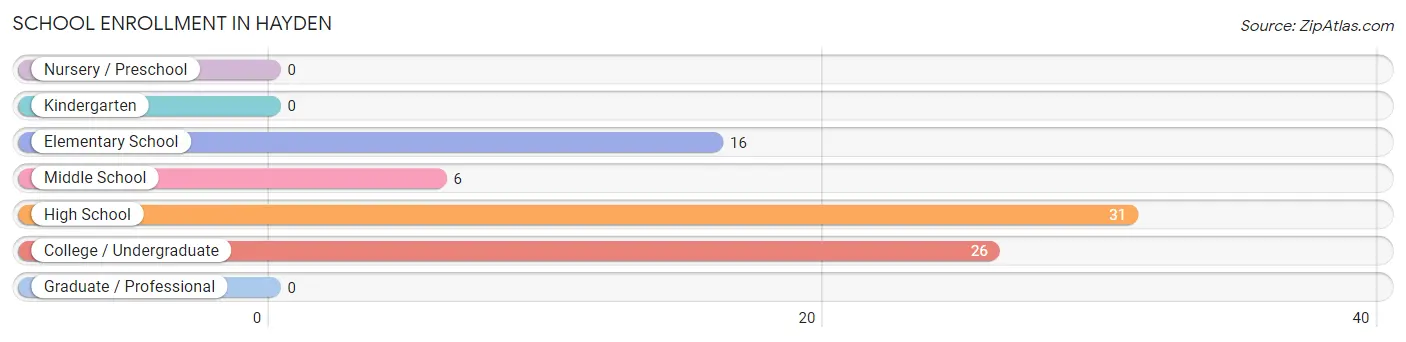
| School Level | # Students | % Students |
| Nursery / Preschool | 0 | 0.0% |
| Kindergarten | 0 | 0.0% |
| Elementary School | 16 | 20.3% |
| Middle School | 6 | 7.6% |
| High School | 31 | 39.2% |
| College / Undergraduate | 26 | 32.9% |
| Graduate / Professional | 0 | 0.0% |
| Total | 79 | 100.0% |
School Enrollment by Age by Funding Source in Hayden
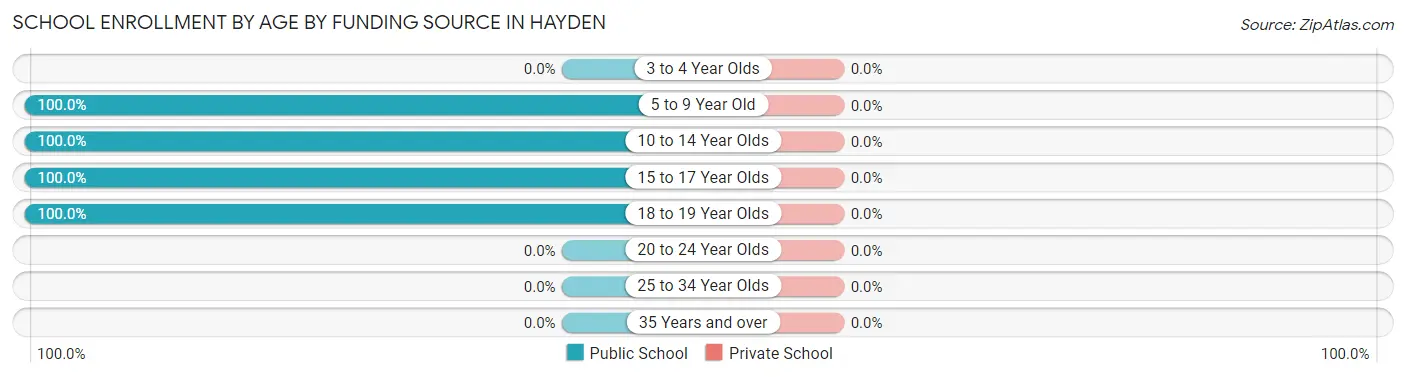
| Age Bracket | Public School | Private School |
| 3 to 4 Year Olds | 0 (0.0%) | 0 (0.0%) |
| 5 to 9 Year Old | 3 (100.0%) | 0 (0.0%) |
| 10 to 14 Year Olds | 25 (100.0%) | 0 (0.0%) |
| 15 to 17 Year Olds | 5 (100.0%) | 0 (0.0%) |
| 18 to 19 Year Olds | 46 (100.0%) | 0 (0.0%) |
| 20 to 24 Year Olds | 0 (0.0%) | 0 (0.0%) |
| 25 to 34 Year Olds | 0 (0.0%) | 0 (0.0%) |
| 35 Years and over | 0 (0.0%) | 0 (0.0%) |
| Total | 79 (100.0%) | 0 (0.0%) |
Educational Attainment by Field of Study in Hayden
Science & technology (19 | 82.6%), and bio, nature & agricultural (4 | 17.4%) are the most common fields of study among 23 individuals in Hayden who have obtained a bachelor's degree or higher.
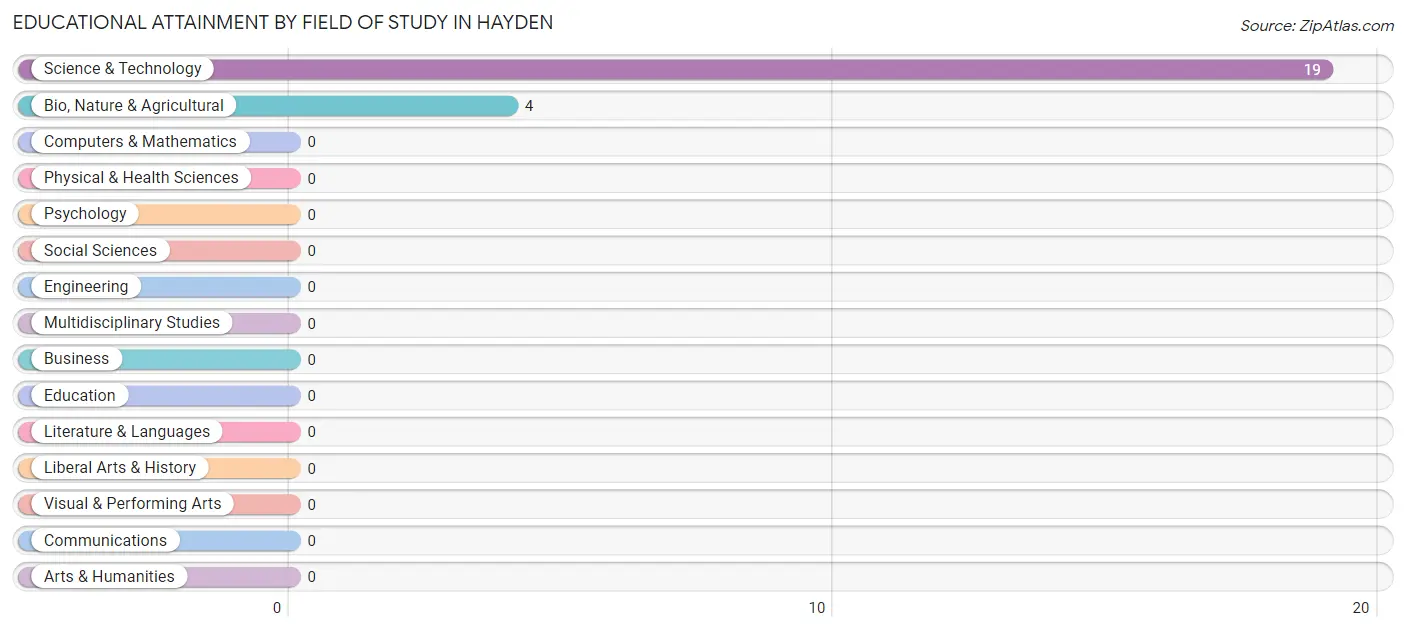
| Field of Study | # Graduates | % Graduates |
| Computers & Mathematics | 0 | 0.0% |
| Bio, Nature & Agricultural | 4 | 17.4% |
| Physical & Health Sciences | 0 | 0.0% |
| Psychology | 0 | 0.0% |
| Social Sciences | 0 | 0.0% |
| Engineering | 0 | 0.0% |
| Multidisciplinary Studies | 0 | 0.0% |
| Science & Technology | 19 | 82.6% |
| Business | 0 | 0.0% |
| Education | 0 | 0.0% |
| Literature & Languages | 0 | 0.0% |
| Liberal Arts & History | 0 | 0.0% |
| Visual & Performing Arts | 0 | 0.0% |
| Communications | 0 | 0.0% |
| Arts & Humanities | 0 | 0.0% |
| Total | 23 | 100.0% |
Transportation & Commute in Hayden
Vehicle Availability by Sex in Hayden
The most prevalent vehicle ownership categories in Hayden are males with 3 vehicles (41, accounting for 43.6%) and females with 3 vehicles (12, making up 82.0%).
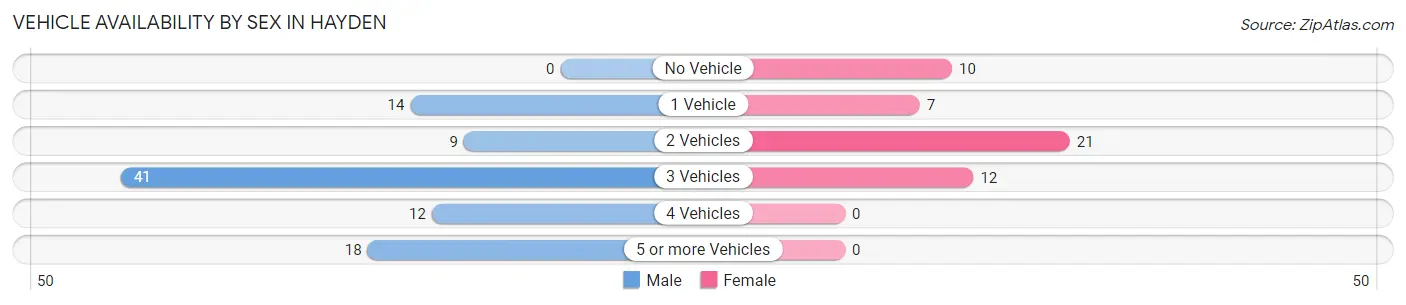
| Vehicles Available | Male | Female |
| No Vehicle | 0 (0.0%) | 10 (20.0%) |
| 1 Vehicle | 14 (14.9%) | 7 (14.0%) |
| 2 Vehicles | 9 (9.6%) | 21 (42.0%) |
| 3 Vehicles | 41 (43.6%) | 12 (24.0%) |
| 4 Vehicles | 12 (12.8%) | 0 (0.0%) |
| 5 or more Vehicles | 18 (19.2%) | 0 (0.0%) |
| Total | 94 (100.0%) | 50 (100.0%) |
Commute Time in Hayden
The most frequently occuring commute durations in Hayden are less than 5 minutes (38 commuters, 27.3%), 20 to 24 minutes (32 commuters, 23.0%), and 60 to 89 minutes (25 commuters, 18.0%).
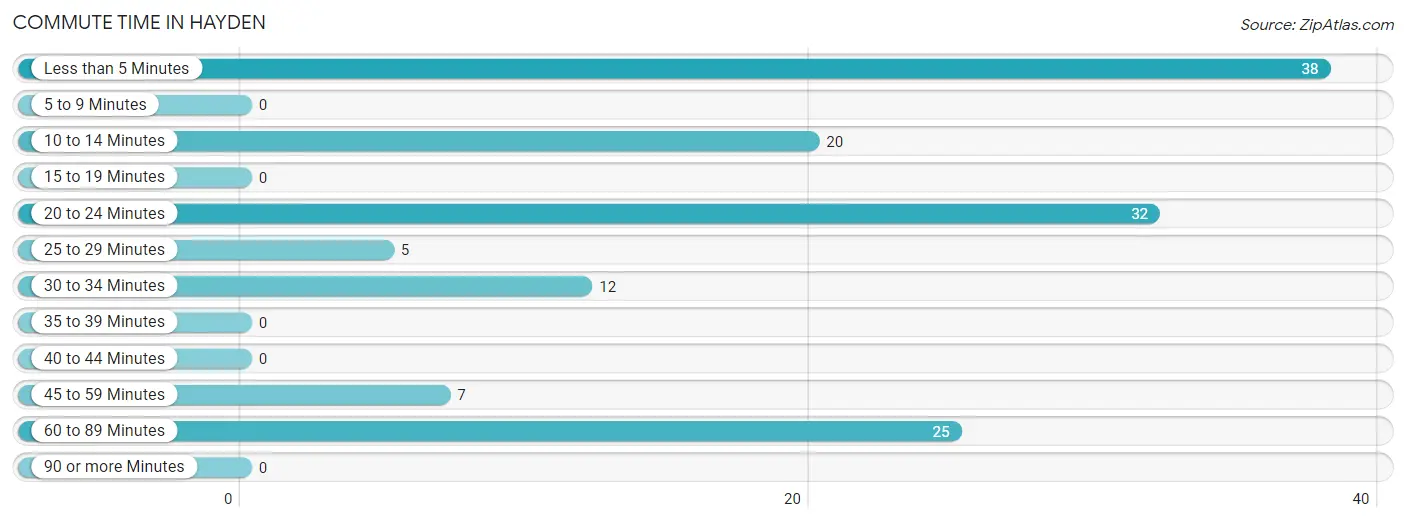
| Commute Time | # Commuters | % Commuters |
| Less than 5 Minutes | 38 | 27.3% |
| 5 to 9 Minutes | 0 | 0.0% |
| 10 to 14 Minutes | 20 | 14.4% |
| 15 to 19 Minutes | 0 | 0.0% |
| 20 to 24 Minutes | 32 | 23.0% |
| 25 to 29 Minutes | 5 | 3.6% |
| 30 to 34 Minutes | 12 | 8.6% |
| 35 to 39 Minutes | 0 | 0.0% |
| 40 to 44 Minutes | 0 | 0.0% |
| 45 to 59 Minutes | 7 | 5.0% |
| 60 to 89 Minutes | 25 | 18.0% |
| 90 or more Minutes | 0 | 0.0% |
Commute Time by Sex in Hayden
The most common commute times in Hayden are 20 to 24 minutes (32 commuters, 36.0%) for males and 60 to 89 minutes (20 commuters, 40.0%) for females.
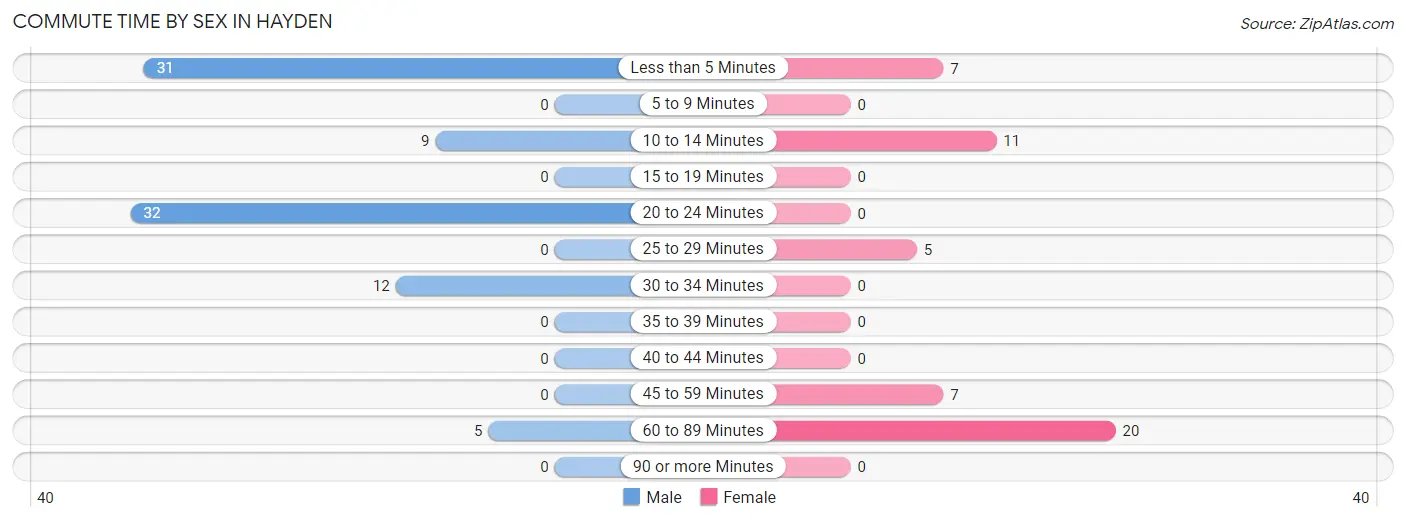
| Commute Time | Male | Female |
| Less than 5 Minutes | 31 (34.8%) | 7 (14.0%) |
| 5 to 9 Minutes | 0 (0.0%) | 0 (0.0%) |
| 10 to 14 Minutes | 9 (10.1%) | 11 (22.0%) |
| 15 to 19 Minutes | 0 (0.0%) | 0 (0.0%) |
| 20 to 24 Minutes | 32 (36.0%) | 0 (0.0%) |
| 25 to 29 Minutes | 0 (0.0%) | 5 (10.0%) |
| 30 to 34 Minutes | 12 (13.5%) | 0 (0.0%) |
| 35 to 39 Minutes | 0 (0.0%) | 0 (0.0%) |
| 40 to 44 Minutes | 0 (0.0%) | 0 (0.0%) |
| 45 to 59 Minutes | 0 (0.0%) | 7 (14.0%) |
| 60 to 89 Minutes | 5 (5.6%) | 20 (40.0%) |
| 90 or more Minutes | 0 (0.0%) | 0 (0.0%) |
Time of Departure to Work by Sex in Hayden
The most frequent times of departure to work in Hayden are 5:00 AM to 5:29 AM (30, 33.7%) for males and 6:30 AM to 6:59 AM (45, 90.0%) for females.
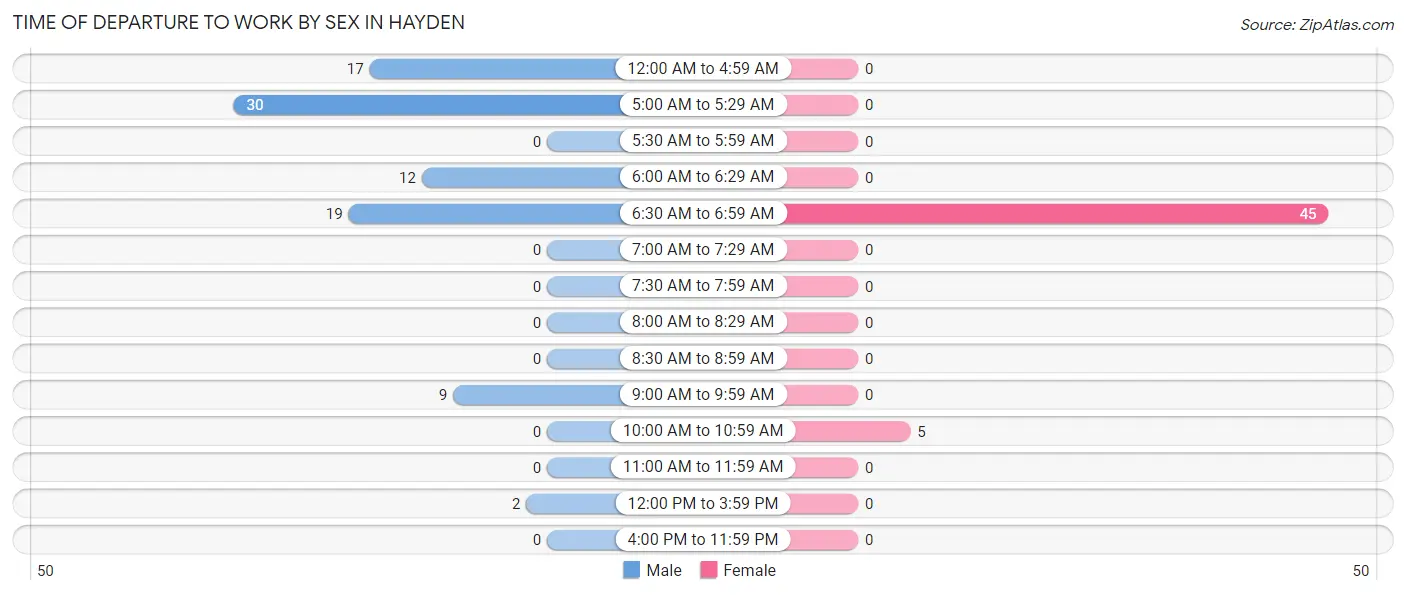
| Time of Departure | Male | Female |
| 12:00 AM to 4:59 AM | 17 (19.1%) | 0 (0.0%) |
| 5:00 AM to 5:29 AM | 30 (33.7%) | 0 (0.0%) |
| 5:30 AM to 5:59 AM | 0 (0.0%) | 0 (0.0%) |
| 6:00 AM to 6:29 AM | 12 (13.5%) | 0 (0.0%) |
| 6:30 AM to 6:59 AM | 19 (21.3%) | 45 (90.0%) |
| 7:00 AM to 7:29 AM | 0 (0.0%) | 0 (0.0%) |
| 7:30 AM to 7:59 AM | 0 (0.0%) | 0 (0.0%) |
| 8:00 AM to 8:29 AM | 0 (0.0%) | 0 (0.0%) |
| 8:30 AM to 8:59 AM | 0 (0.0%) | 0 (0.0%) |
| 9:00 AM to 9:59 AM | 9 (10.1%) | 0 (0.0%) |
| 10:00 AM to 10:59 AM | 0 (0.0%) | 5 (10.0%) |
| 11:00 AM to 11:59 AM | 0 (0.0%) | 0 (0.0%) |
| 12:00 PM to 3:59 PM | 2 (2.2%) | 0 (0.0%) |
| 4:00 PM to 11:59 PM | 0 (0.0%) | 0 (0.0%) |
| Total | 89 (100.0%) | 50 (100.0%) |
Housing Occupancy in Hayden
Occupancy by Ownership in Hayden
Of the total 202 dwellings in Hayden, owner-occupied units account for 156 (77.2%), while renter-occupied units make up 46 (22.8%).
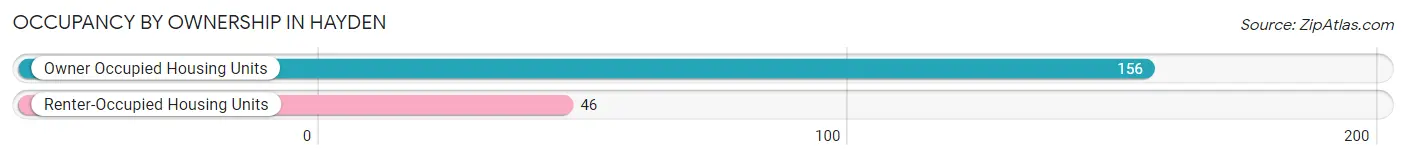
| Occupancy | # Housing Units | % Housing Units |
| Owner Occupied Housing Units | 156 | 77.2% |
| Renter-Occupied Housing Units | 46 | 22.8% |
| Total Occupied Housing Units | 202 | 100.0% |
Occupancy by Household Size in Hayden
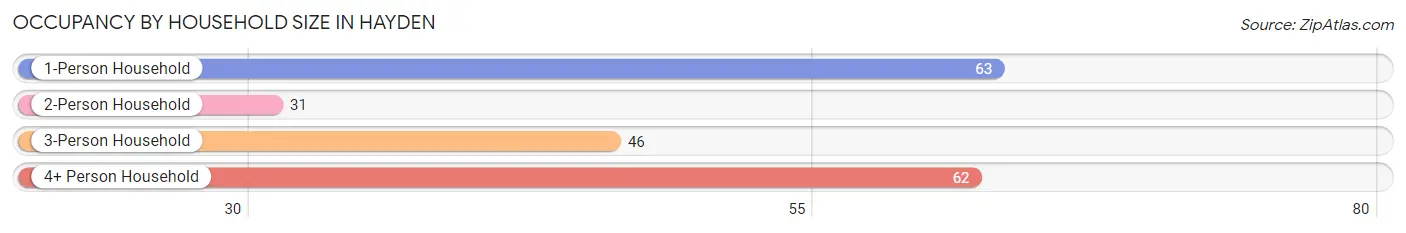
| Household Size | # Housing Units | % Housing Units |
| 1-Person Household | 63 | 31.2% |
| 2-Person Household | 31 | 15.3% |
| 3-Person Household | 46 | 22.8% |
| 4+ Person Household | 62 | 30.7% |
| Total Housing Units | 202 | 100.0% |
Occupancy by Ownership by Household Size in Hayden
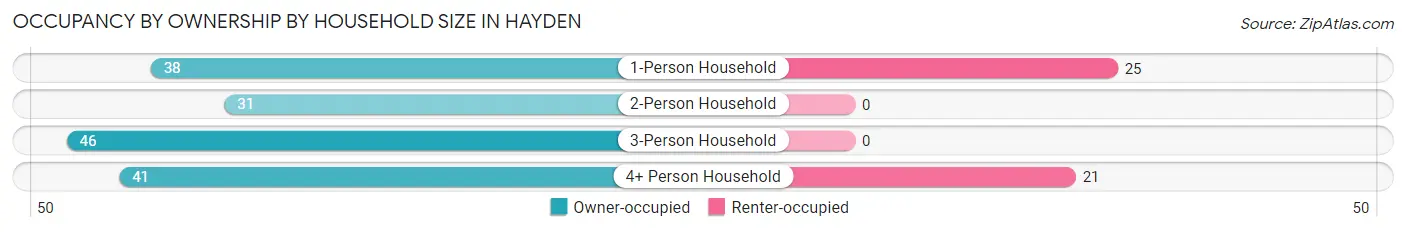
| Household Size | Owner-occupied | Renter-occupied |
| 1-Person Household | 38 (60.3%) | 25 (39.7%) |
| 2-Person Household | 31 (100.0%) | 0 (0.0%) |
| 3-Person Household | 46 (100.0%) | 0 (0.0%) |
| 4+ Person Household | 41 (66.1%) | 21 (33.9%) |
| Total Housing Units | 156 (77.2%) | 46 (22.8%) |
Occupancy by Educational Attainment in Hayden
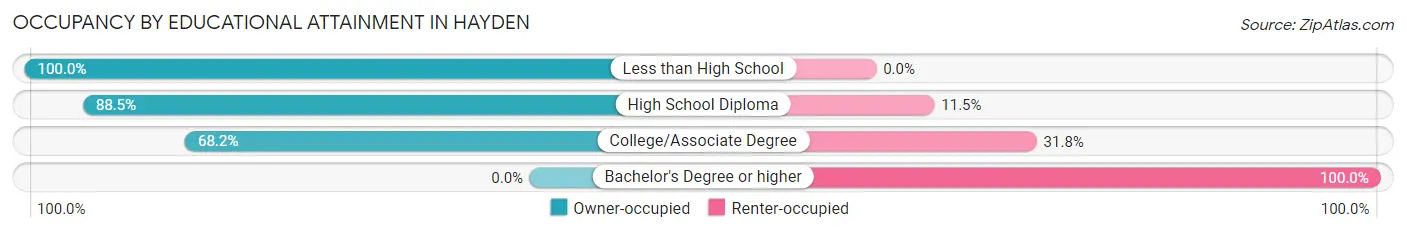
| Household Size | Owner-occupied | Renter-occupied |
| Less than High School | 42 (100.0%) | 0 (0.0%) |
| High School Diploma | 69 (88.5%) | 9 (11.5%) |
| College/Associate Degree | 45 (68.2%) | 21 (31.8%) |
| Bachelor's Degree or higher | 0 (0.0%) | 16 (100.0%) |
Occupancy by Age of Householder in Hayden
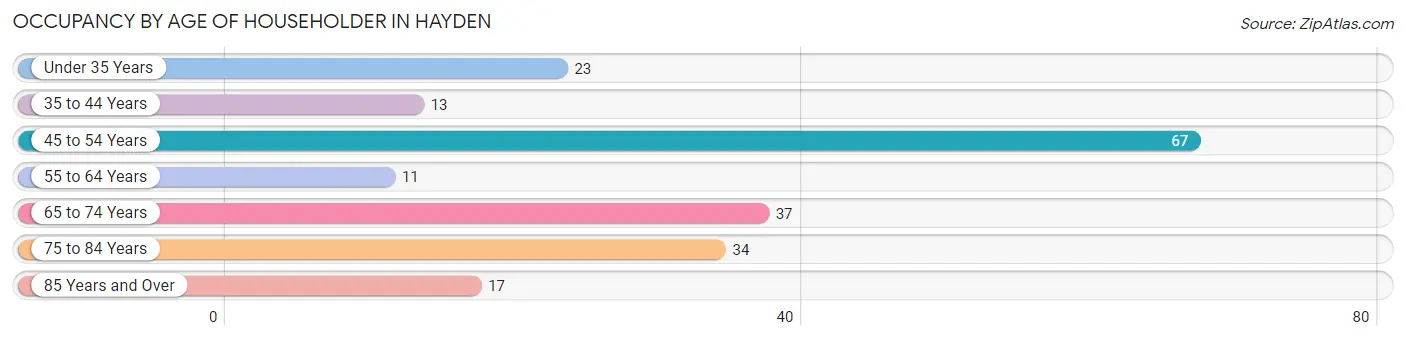
| Age Bracket | # Households | % Households |
| Under 35 Years | 23 | 11.4% |
| 35 to 44 Years | 13 | 6.4% |
| 45 to 54 Years | 67 | 33.2% |
| 55 to 64 Years | 11 | 5.4% |
| 65 to 74 Years | 37 | 18.3% |
| 75 to 84 Years | 34 | 16.8% |
| 85 Years and Over | 17 | 8.4% |
| Total | 202 | 100.0% |
Housing Finances in Hayden
Median Income by Occupancy in Hayden
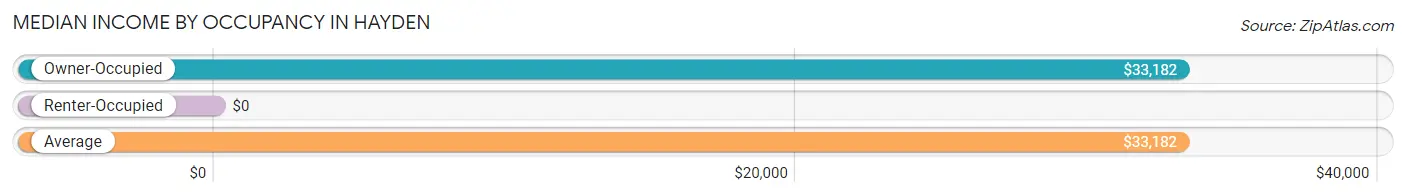
| Occupancy Type | # Households | Median Income |
| Owner-Occupied | 156 (77.2%) | $33,182 |
| Renter-Occupied | 46 (22.8%) | $0 |
| Average | 202 (100.0%) | $33,182 |
Occupancy by Householder Income Bracket in Hayden
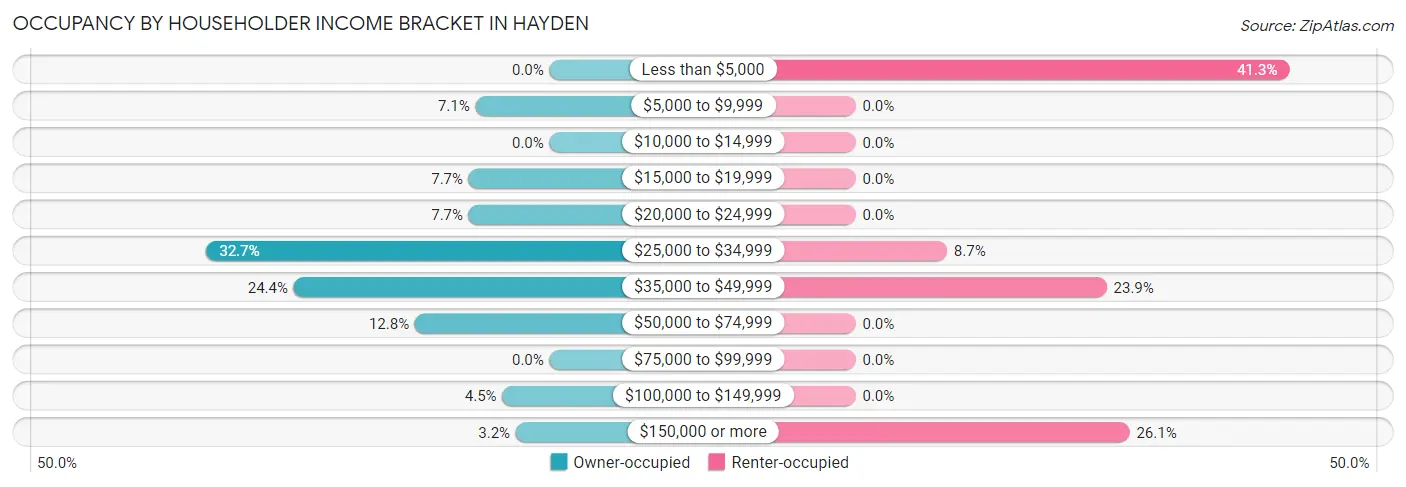
| Income Bracket | Owner-occupied | Renter-occupied |
| Less than $5,000 | 0 (0.0%) | 19 (41.3%) |
| $5,000 to $9,999 | 11 (7.0%) | 0 (0.0%) |
| $10,000 to $14,999 | 0 (0.0%) | 0 (0.0%) |
| $15,000 to $19,999 | 12 (7.7%) | 0 (0.0%) |
| $20,000 to $24,999 | 12 (7.7%) | 0 (0.0%) |
| $25,000 to $34,999 | 51 (32.7%) | 4 (8.7%) |
| $35,000 to $49,999 | 38 (24.4%) | 11 (23.9%) |
| $50,000 to $74,999 | 20 (12.8%) | 0 (0.0%) |
| $75,000 to $99,999 | 0 (0.0%) | 0 (0.0%) |
| $100,000 to $149,999 | 7 (4.5%) | 0 (0.0%) |
| $150,000 or more | 5 (3.2%) | 12 (26.1%) |
| Total | 156 (100.0%) | 46 (100.0%) |
Monthly Housing Cost Tiers in Hayden
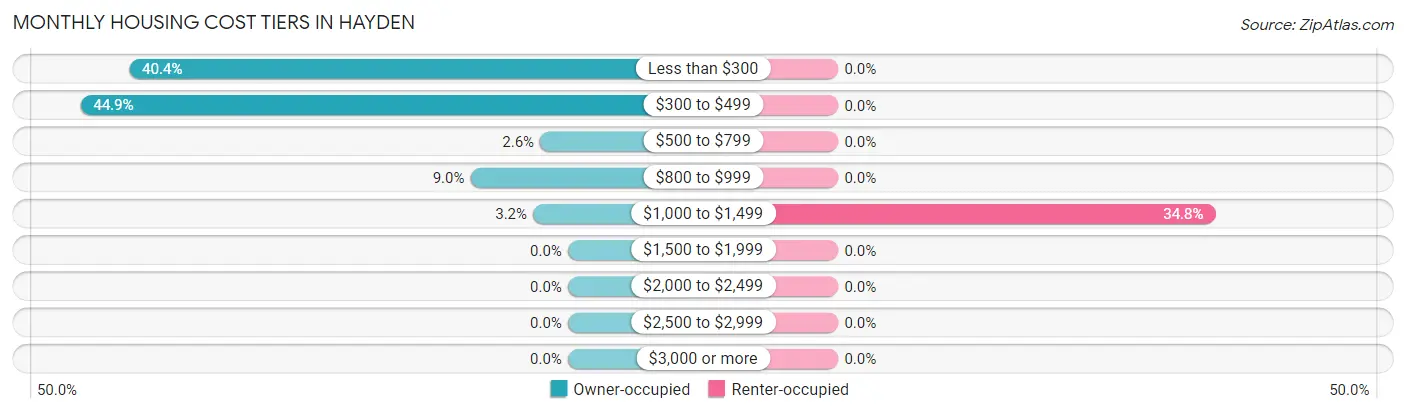
| Monthly Cost | Owner-occupied | Renter-occupied |
| Less than $300 | 63 (40.4%) | 0 (0.0%) |
| $300 to $499 | 70 (44.9%) | 0 (0.0%) |
| $500 to $799 | 4 (2.6%) | 0 (0.0%) |
| $800 to $999 | 14 (9.0%) | 0 (0.0%) |
| $1,000 to $1,499 | 5 (3.2%) | 16 (34.8%) |
| $1,500 to $1,999 | 0 (0.0%) | 0 (0.0%) |
| $2,000 to $2,499 | 0 (0.0%) | 0 (0.0%) |
| $2,500 to $2,999 | 0 (0.0%) | 0 (0.0%) |
| $3,000 or more | 0 (0.0%) | 0 (0.0%) |
| Total | 156 (100.0%) | 46 (100.0%) |
Physical Housing Characteristics in Hayden
Housing Structures in Hayden
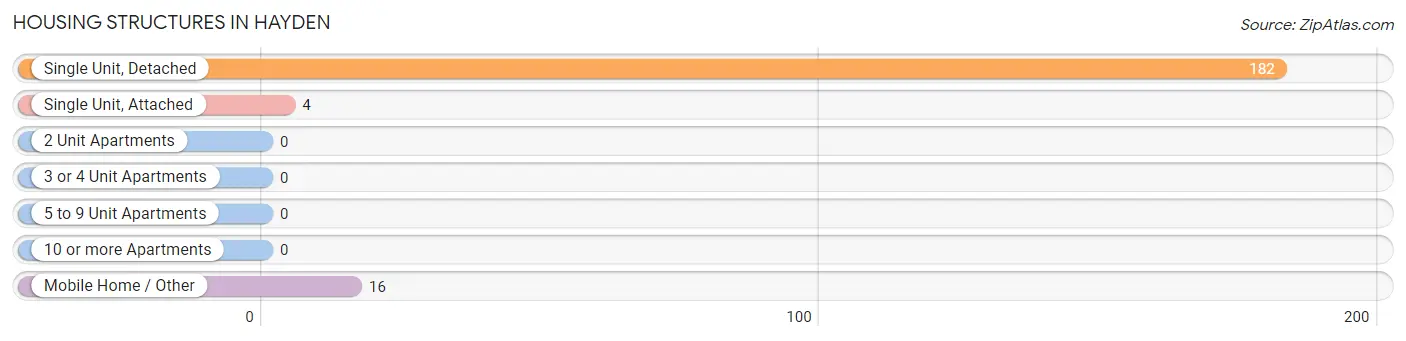
| Structure Type | # Housing Units | % Housing Units |
| Single Unit, Detached | 182 | 90.1% |
| Single Unit, Attached | 4 | 2.0% |
| 2 Unit Apartments | 0 | 0.0% |
| 3 or 4 Unit Apartments | 0 | 0.0% |
| 5 to 9 Unit Apartments | 0 | 0.0% |
| 10 or more Apartments | 0 | 0.0% |
| Mobile Home / Other | 16 | 7.9% |
| Total | 202 | 100.0% |
Housing Structures by Occupancy in Hayden
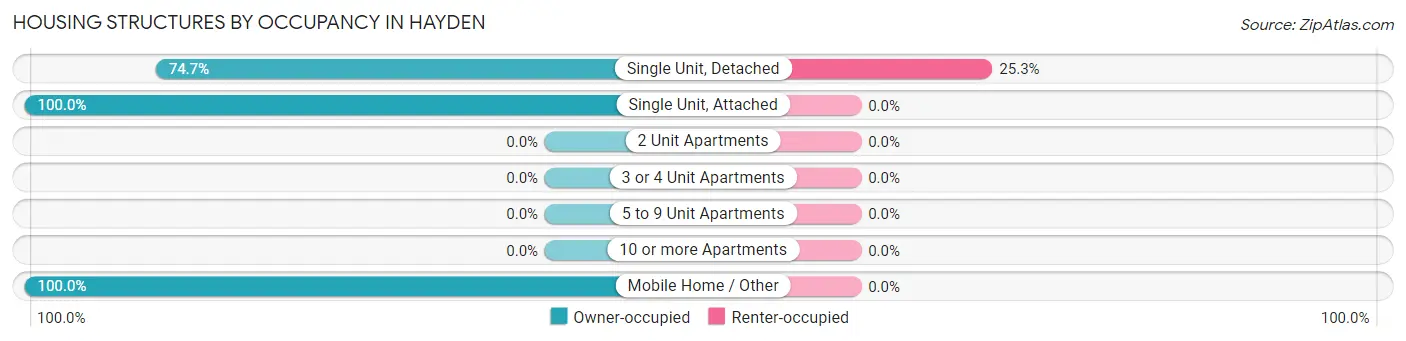
| Structure Type | Owner-occupied | Renter-occupied |
| Single Unit, Detached | 136 (74.7%) | 46 (25.3%) |
| Single Unit, Attached | 4 (100.0%) | 0 (0.0%) |
| 2 Unit Apartments | 0 (0.0%) | 0 (0.0%) |
| 3 or 4 Unit Apartments | 0 (0.0%) | 0 (0.0%) |
| 5 to 9 Unit Apartments | 0 (0.0%) | 0 (0.0%) |
| 10 or more Apartments | 0 (0.0%) | 0 (0.0%) |
| Mobile Home / Other | 16 (100.0%) | 0 (0.0%) |
| Total | 156 (77.2%) | 46 (22.8%) |
Housing Structures by Number of Rooms in Hayden
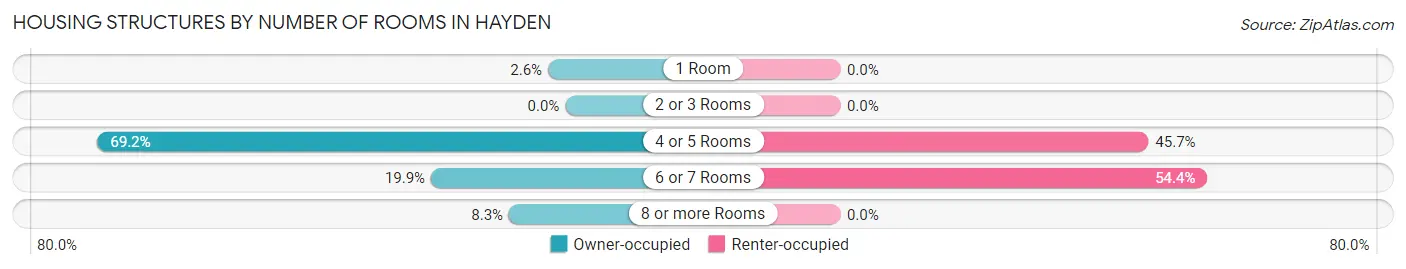
| Number of Rooms | Owner-occupied | Renter-occupied |
| 1 Room | 4 (2.6%) | 0 (0.0%) |
| 2 or 3 Rooms | 0 (0.0%) | 0 (0.0%) |
| 4 or 5 Rooms | 108 (69.2%) | 21 (45.7%) |
| 6 or 7 Rooms | 31 (19.9%) | 25 (54.3%) |
| 8 or more Rooms | 13 (8.3%) | 0 (0.0%) |
| Total | 156 (100.0%) | 46 (100.0%) |
Housing Structure by Heating Type in Hayden
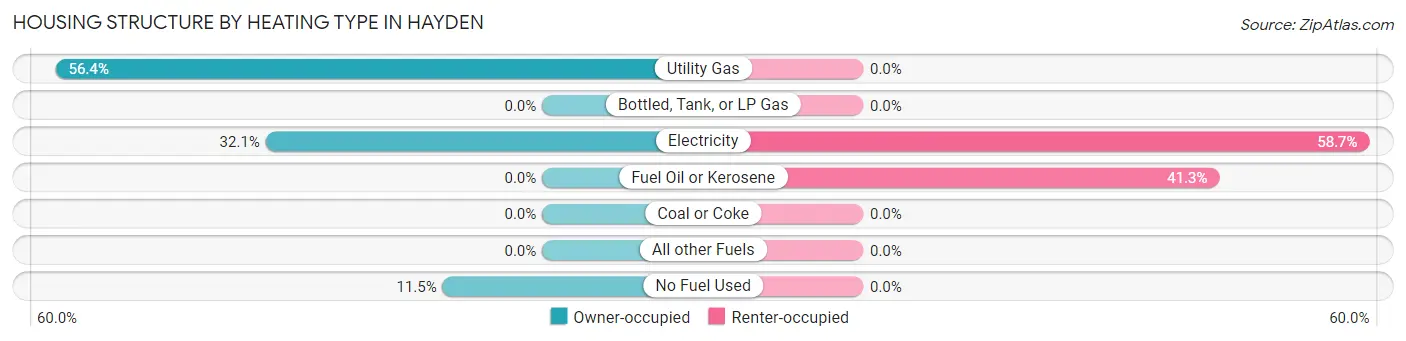
| Heating Type | Owner-occupied | Renter-occupied |
| Utility Gas | 88 (56.4%) | 0 (0.0%) |
| Bottled, Tank, or LP Gas | 0 (0.0%) | 0 (0.0%) |
| Electricity | 50 (32.1%) | 27 (58.7%) |
| Fuel Oil or Kerosene | 0 (0.0%) | 19 (41.3%) |
| Coal or Coke | 0 (0.0%) | 0 (0.0%) |
| All other Fuels | 0 (0.0%) | 0 (0.0%) |
| No Fuel Used | 18 (11.5%) | 0 (0.0%) |
| Total | 156 (100.0%) | 46 (100.0%) |
Household Vehicle Usage in Hayden
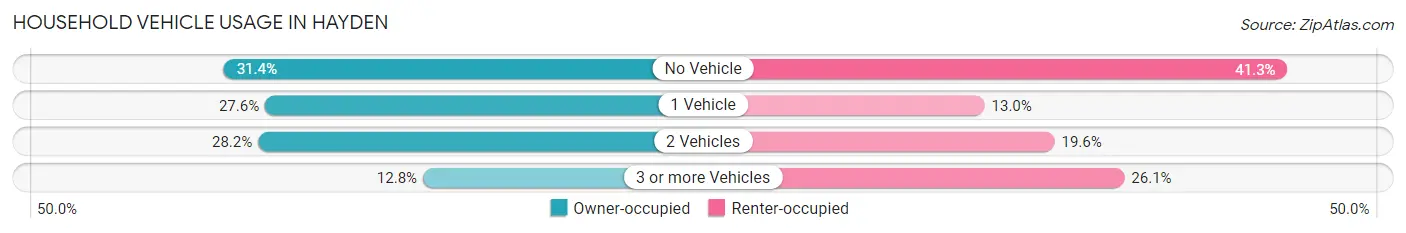
| Vehicles per Household | Owner-occupied | Renter-occupied |
| No Vehicle | 49 (31.4%) | 19 (41.3%) |
| 1 Vehicle | 43 (27.6%) | 6 (13.0%) |
| 2 Vehicles | 44 (28.2%) | 9 (19.6%) |
| 3 or more Vehicles | 20 (12.8%) | 12 (26.1%) |
| Total | 156 (100.0%) | 46 (100.0%) |
Real Estate & Mortgages in Hayden
Real Estate and Mortgage Overview in Hayden
| Characteristic | Without Mortgage | With Mortgage |
| Housing Units | 137 | 19 |
| Median Property Value | $39,200 | $75,000 |
| Median Household Income | $32,614 | $5 |
| Monthly Housing Costs | $312 | $0 |
| Real Estate Taxes | $336 | $0 |
Property Value by Mortgage Status in Hayden
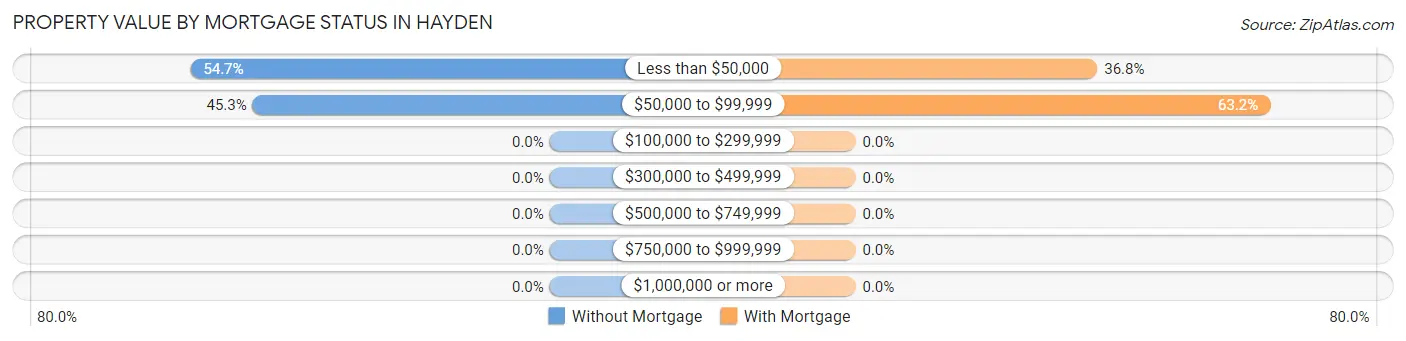
| Property Value | Without Mortgage | With Mortgage |
| Less than $50,000 | 75 (54.7%) | 7 (36.8%) |
| $50,000 to $99,999 | 62 (45.3%) | 12 (63.2%) |
| $100,000 to $299,999 | 0 (0.0%) | 0 (0.0%) |
| $300,000 to $499,999 | 0 (0.0%) | 0 (0.0%) |
| $500,000 to $749,999 | 0 (0.0%) | 0 (0.0%) |
| $750,000 to $999,999 | 0 (0.0%) | 0 (0.0%) |
| $1,000,000 or more | 0 (0.0%) | 0 (0.0%) |
| Total | 137 (100.0%) | 19 (100.0%) |
Household Income by Mortgage Status in Hayden
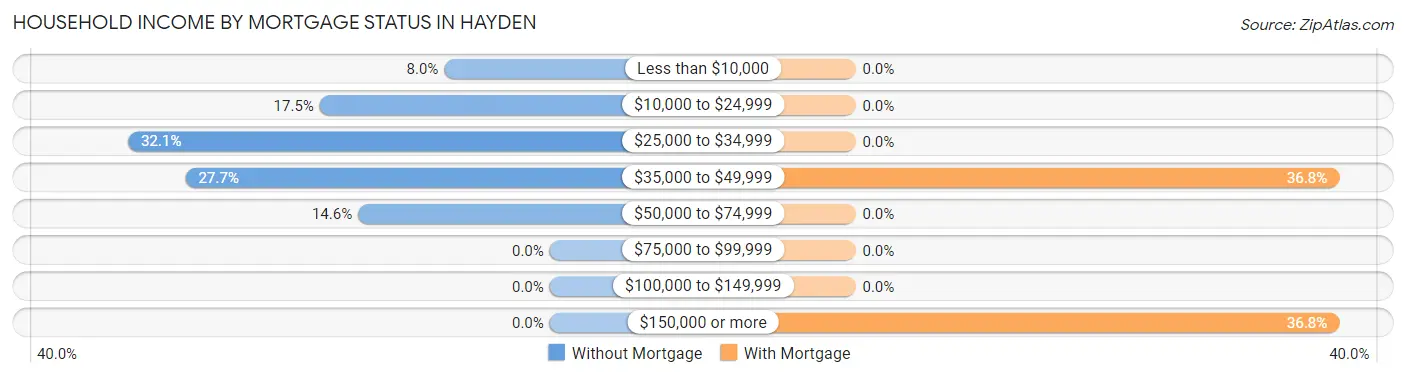
| Household Income | Without Mortgage | With Mortgage |
| Less than $10,000 | 11 (8.0%) | 0 (0.0%) |
| $10,000 to $24,999 | 24 (17.5%) | 0 (0.0%) |
| $25,000 to $34,999 | 44 (32.1%) | 0 (0.0%) |
| $35,000 to $49,999 | 38 (27.7%) | 7 (36.8%) |
| $50,000 to $74,999 | 20 (14.6%) | 0 (0.0%) |
| $75,000 to $99,999 | 0 (0.0%) | 0 (0.0%) |
| $100,000 to $149,999 | 0 (0.0%) | 0 (0.0%) |
| $150,000 or more | 0 (0.0%) | 7 (36.8%) |
| Total | 137 (100.0%) | 19 (100.0%) |
Property Value to Household Income Ratio in Hayden
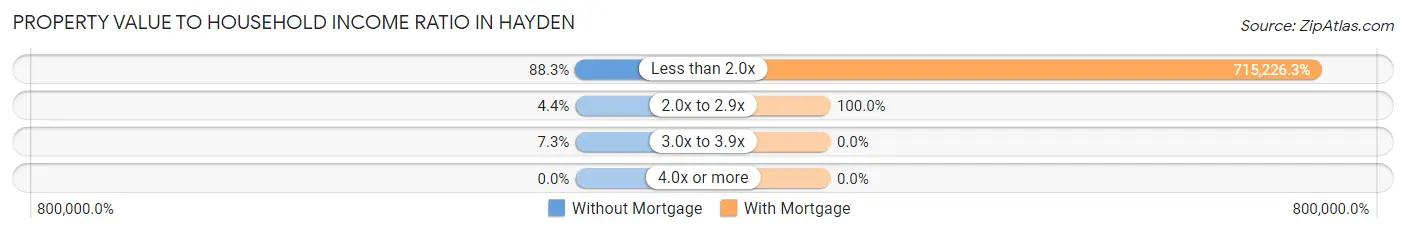
| Value-to-Income Ratio | Without Mortgage | With Mortgage |
| Less than 2.0x | 121 (88.3%) | 135,893 (715,226.3%) |
| 2.0x to 2.9x | 6 (4.4%) | 19 (100.0%) |
| 3.0x to 3.9x | 10 (7.3%) | 0 (0.0%) |
| 4.0x or more | 0 (0.0%) | 0 (0.0%) |
| Total | 137 (100.0%) | 19 (100.0%) |
Real Estate Taxes by Mortgage Status in Hayden
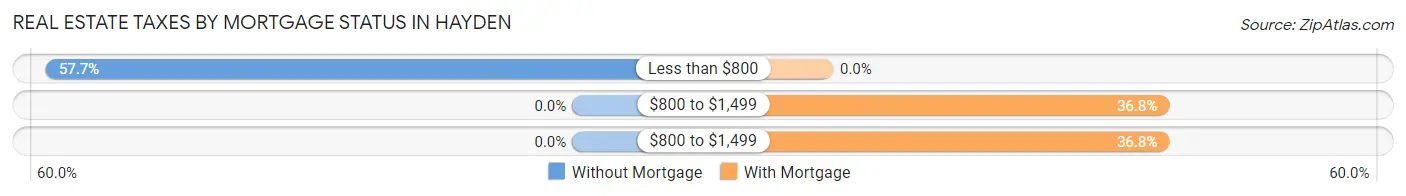
| Property Taxes | Without Mortgage | With Mortgage |
| Less than $800 | 79 (57.7%) | 0 (0.0%) |
| $800 to $1,499 | 0 (0.0%) | 7 (36.8%) |
| $800 to $1,499 | 0 (0.0%) | 7 (36.8%) |
| Total | 137 (100.0%) | 19 (100.0%) |
Health & Disability in Hayden
Health Insurance Coverage by Age in Hayden
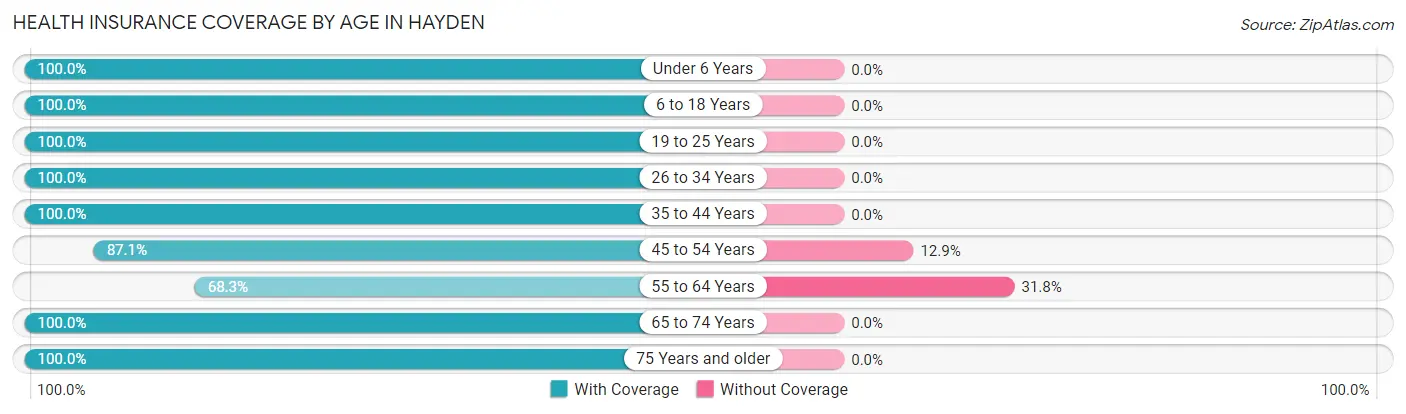
| Age Bracket | With Coverage | Without Coverage |
| Under 6 Years | 19 (100.0%) | 0 (0.0%) |
| 6 to 18 Years | 53 (100.0%) | 0 (0.0%) |
| 19 to 25 Years | 120 (100.0%) | 0 (0.0%) |
| 26 to 34 Years | 28 (100.0%) | 0 (0.0%) |
| 35 to 44 Years | 41 (100.0%) | 0 (0.0%) |
| 45 to 54 Years | 81 (87.1%) | 12 (12.9%) |
| 55 to 64 Years | 43 (68.2%) | 20 (31.8%) |
| 65 to 74 Years | 43 (100.0%) | 0 (0.0%) |
| 75 Years and older | 53 (100.0%) | 0 (0.0%) |
| Total | 481 (93.8%) | 32 (6.2%) |
Health Insurance Coverage by Citizenship Status in Hayden
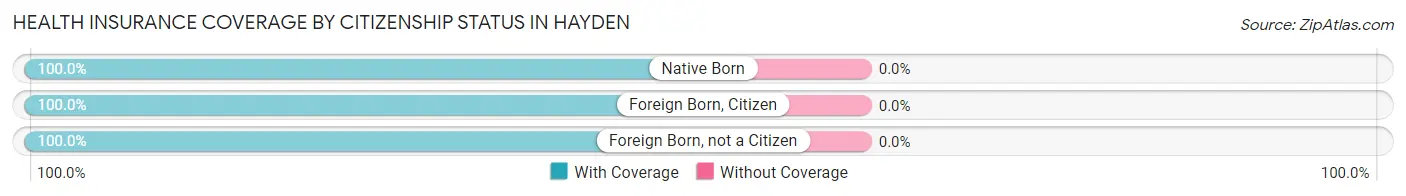
| Citizenship Status | With Coverage | Without Coverage |
| Native Born | 19 (100.0%) | 0 (0.0%) |
| Foreign Born, Citizen | 53 (100.0%) | 0 (0.0%) |
| Foreign Born, not a Citizen | 120 (100.0%) | 0 (0.0%) |
Health Insurance Coverage by Household Income in Hayden
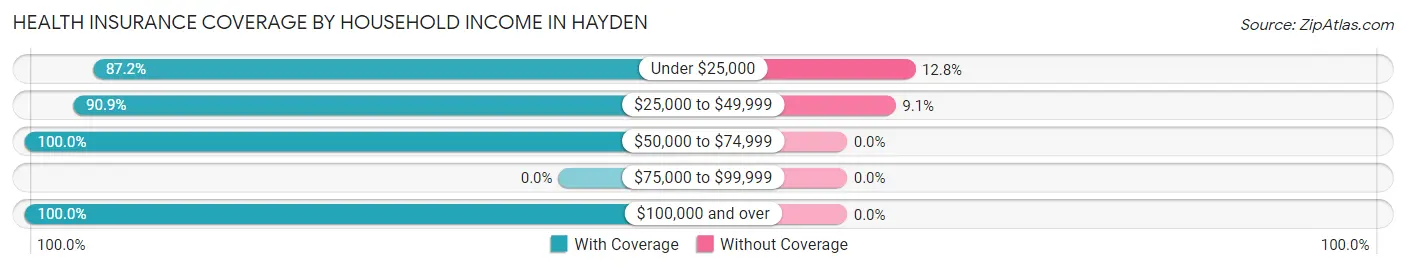
| Household Income | With Coverage | Without Coverage |
| Under $25,000 | 82 (87.2%) | 12 (12.8%) |
| $25,000 to $49,999 | 200 (90.9%) | 20 (9.1%) |
| $50,000 to $74,999 | 74 (100.0%) | 0 (0.0%) |
| $75,000 to $99,999 | 0 (0.0%) | 0 (0.0%) |
| $100,000 and over | 125 (100.0%) | 0 (0.0%) |
Public vs Private Health Insurance Coverage by Age in Hayden
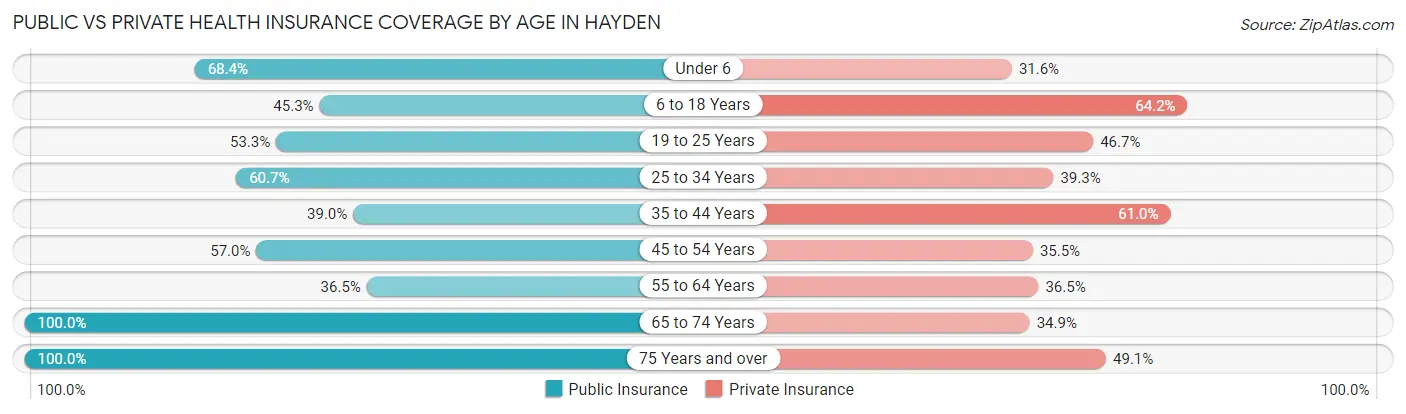
| Age Bracket | Public Insurance | Private Insurance |
| Under 6 | 13 (68.4%) | 6 (31.6%) |
| 6 to 18 Years | 24 (45.3%) | 34 (64.1%) |
| 19 to 25 Years | 64 (53.3%) | 56 (46.7%) |
| 25 to 34 Years | 17 (60.7%) | 11 (39.3%) |
| 35 to 44 Years | 16 (39.0%) | 25 (61.0%) |
| 45 to 54 Years | 53 (57.0%) | 33 (35.5%) |
| 55 to 64 Years | 23 (36.5%) | 23 (36.5%) |
| 65 to 74 Years | 43 (100.0%) | 15 (34.9%) |
| 75 Years and over | 53 (100.0%) | 26 (49.1%) |
| Total | 306 (59.7%) | 229 (44.6%) |
Disability Status by Sex by Age in Hayden
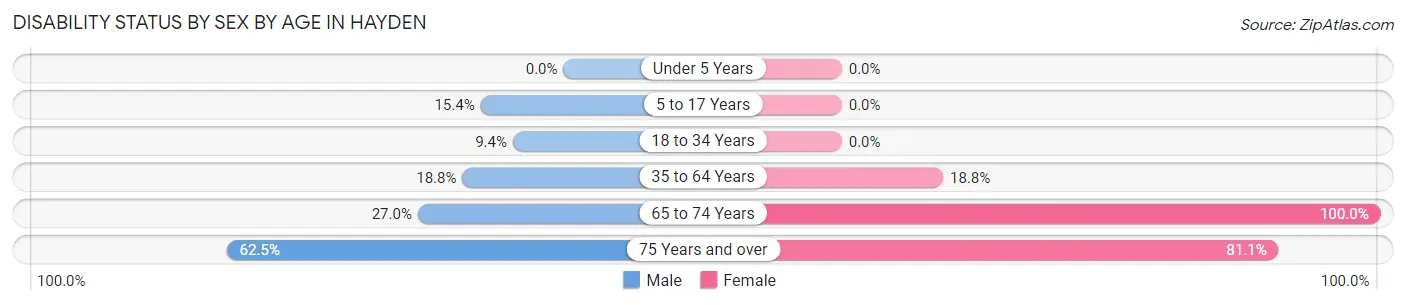
| Age Bracket | Male | Female |
| Under 5 Years | 0 (0.0%) | 0 (0.0%) |
| 5 to 17 Years | 6 (15.4%) | 0 (0.0%) |
| 18 to 34 Years | 9 (9.4%) | 0 (0.0%) |
| 35 to 64 Years | 18 (18.8%) | 19 (18.8%) |
| 65 to 74 Years | 10 (27.0%) | 6 (100.0%) |
| 75 Years and over | 10 (62.5%) | 30 (81.1%) |
Disability Class by Sex by Age in Hayden
Disability Class: Hearing Difficulty
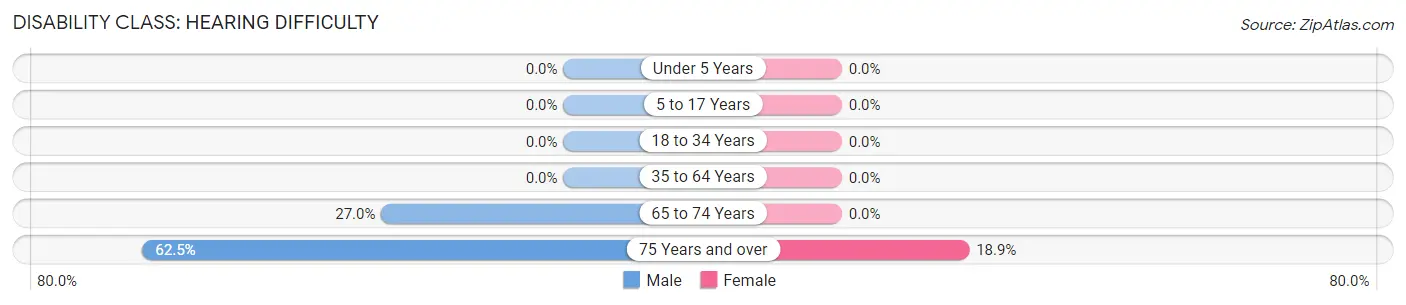
| Age Bracket | Male | Female |
| Under 5 Years | 0 (0.0%) | 0 (0.0%) |
| 5 to 17 Years | 0 (0.0%) | 0 (0.0%) |
| 18 to 34 Years | 0 (0.0%) | 0 (0.0%) |
| 35 to 64 Years | 0 (0.0%) | 0 (0.0%) |
| 65 to 74 Years | 10 (27.0%) | 0 (0.0%) |
| 75 Years and over | 10 (62.5%) | 7 (18.9%) |
Disability Class: Vision Difficulty
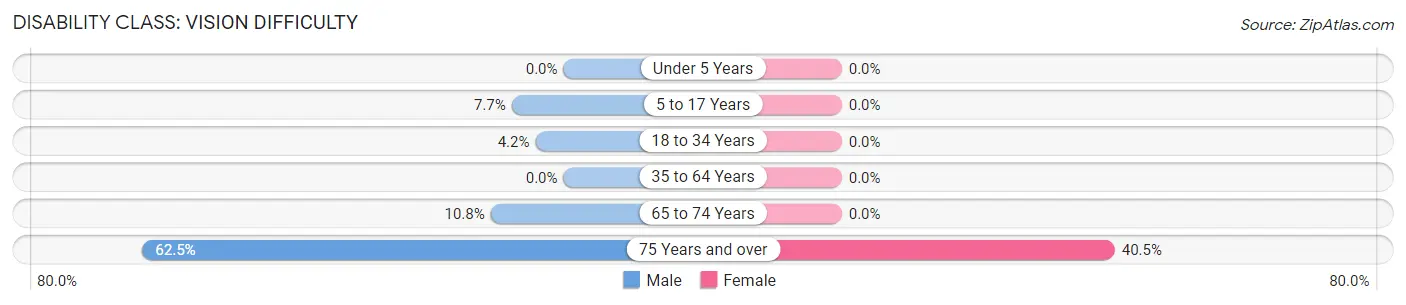
| Age Bracket | Male | Female |
| Under 5 Years | 0 (0.0%) | 0 (0.0%) |
| 5 to 17 Years | 3 (7.7%) | 0 (0.0%) |
| 18 to 34 Years | 4 (4.2%) | 0 (0.0%) |
| 35 to 64 Years | 0 (0.0%) | 0 (0.0%) |
| 65 to 74 Years | 4 (10.8%) | 0 (0.0%) |
| 75 Years and over | 10 (62.5%) | 15 (40.5%) |
Disability Class: Cognitive Difficulty
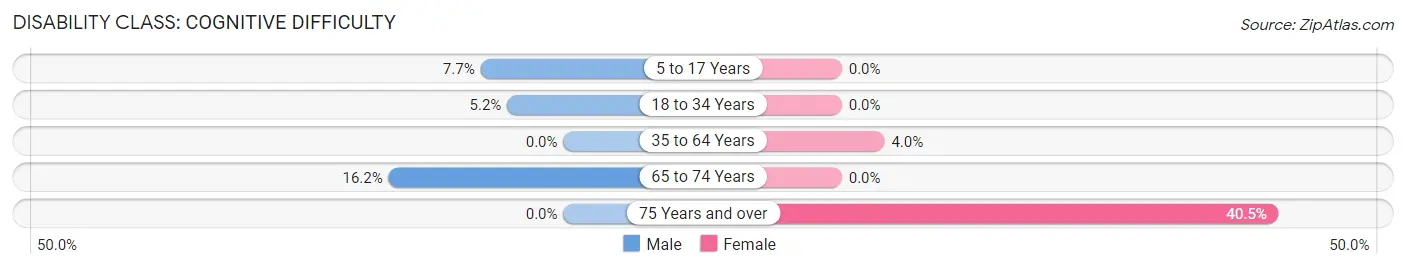
| Age Bracket | Male | Female |
| 5 to 17 Years | 3 (7.7%) | 0 (0.0%) |
| 18 to 34 Years | 5 (5.2%) | 0 (0.0%) |
| 35 to 64 Years | 0 (0.0%) | 4 (4.0%) |
| 65 to 74 Years | 6 (16.2%) | 0 (0.0%) |
| 75 Years and over | 0 (0.0%) | 15 (40.5%) |
Disability Class: Ambulatory Difficulty
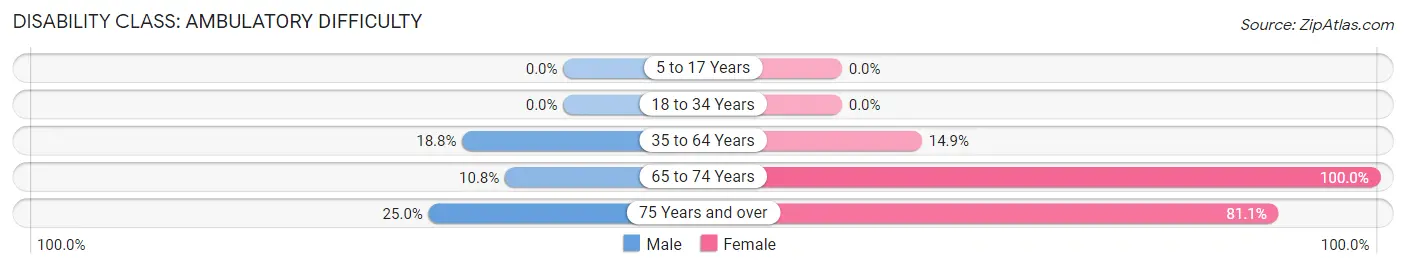
| Age Bracket | Male | Female |
| 5 to 17 Years | 0 (0.0%) | 0 (0.0%) |
| 18 to 34 Years | 0 (0.0%) | 0 (0.0%) |
| 35 to 64 Years | 18 (18.8%) | 15 (14.8%) |
| 65 to 74 Years | 4 (10.8%) | 6 (100.0%) |
| 75 Years and over | 4 (25.0%) | 30 (81.1%) |
Disability Class: Self-Care Difficulty
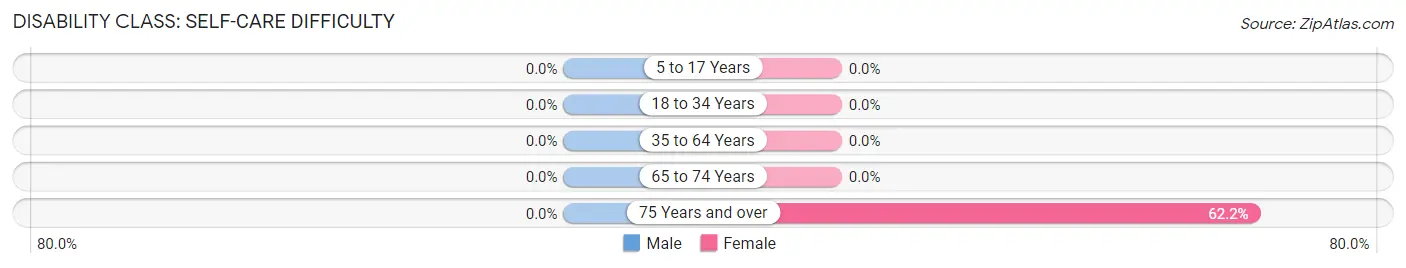
| Age Bracket | Male | Female |
| 5 to 17 Years | 0 (0.0%) | 0 (0.0%) |
| 18 to 34 Years | 0 (0.0%) | 0 (0.0%) |
| 35 to 64 Years | 0 (0.0%) | 0 (0.0%) |
| 65 to 74 Years | 0 (0.0%) | 0 (0.0%) |
| 75 Years and over | 0 (0.0%) | 23 (62.2%) |
Technology Access in Hayden
Computing Device Access in Hayden
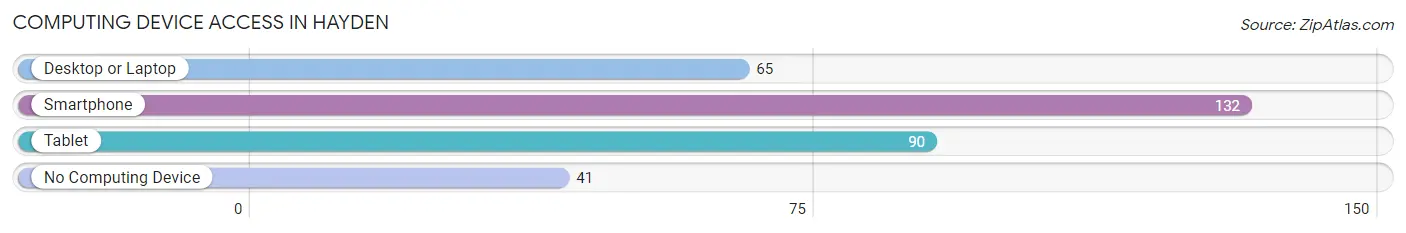
| Device Type | # Households | % Households |
| Desktop or Laptop | 65 | 32.2% |
| Smartphone | 132 | 65.3% |
| Tablet | 90 | 44.6% |
| No Computing Device | 41 | 20.3% |
| Total | 202 | 100.0% |
Internet Access in Hayden
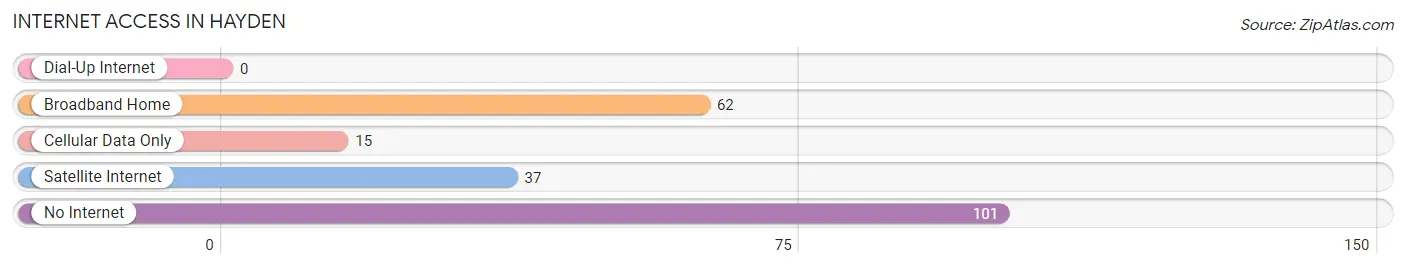
| Internet Type | # Households | % Households |
| Dial-Up Internet | 0 | 0.0% |
| Broadband Home | 62 | 30.7% |
| Cellular Data Only | 15 | 7.4% |
| Satellite Internet | 37 | 18.3% |
| No Internet | 101 | 50.0% |
| Total | 202 | 100.0% |
Hayden Summary
Hayden, Arizona is a small town located in Gila County, Arizona. It is situated in the northern part of the state, approximately 40 miles east of Phoenix. The town was founded in 1876 and was named after Charles T. Hayden, a prominent Arizona pioneer. The population of Hayden was 1,822 as of the 2010 census.
Geography
Hayden is located in the northern part of Gila County, Arizona, approximately 40 miles east of Phoenix. The town is situated in the Sonoran Desert, at an elevation of 1,822 feet. The town is surrounded by the Tonto National Forest and is located near the Salt River. The climate in Hayden is hot and dry, with temperatures ranging from the mid-90s in the summer to the mid-50s in the winter.
Economy
The economy of Hayden is largely based on agriculture and tourism. The town is home to several farms and ranches, which produce a variety of crops, including alfalfa, cotton, and hay. The town is also home to several tourist attractions, including the Tonto National Monument, the Salt River Canyon, and the Gila River Indian Reservation.
Demographics
As of the 2010 census, the population of Hayden was 1,822. The racial makeup of the town was 94.3% White, 0.7% African American, 0.7% Native American, 0.3% Asian, 0.1% Pacific Islander, 2.2% from other races, and 1.9% from two or more races. Hispanic or Latino of any race were 6.2% of the population.
The median income for a household in Hayden was $31,250, and the median income for a family was $35,000. The per capita income for the town was $14,945. About 16.2% of families and 19.2% of the population were below the poverty line, including 25.2% of those under age 18 and 8.3% of those age 65 or over.
Conclusion
Hayden, Arizona is a small town located in Gila County, Arizona. It is situated in the northern part of the state, approximately 40 miles east of Phoenix. The town was founded in 1876 and was named after Charles T. Hayden, a prominent Arizona pioneer. The population of Hayden was 1,822 as of the 2010 census. The economy of Hayden is largely based on agriculture and tourism, and the town is home to several farms and ranches, as well as several tourist attractions. The racial makeup of the town was 94.3% White, 0.7% African American, 0.7% Native American, 0.3% Asian, 0.1% Pacific Islander, 2.2% from other races, and 1.9% from two or more races. The median income for a household in Hayden was $31,250, and the median income for a family was $35,000. About 16.2% of families and 19.2% of the population were below the poverty line.
Common Questions
What is Per Capita Income in Hayden?
Per Capita income in Hayden is $19,167.
What is the Median Family Income in Hayden?
Median Family Income in Hayden is $39,712.
What is the Median Household income in Hayden?
Median Household Income in Hayden is $33,182.
What is Inequality or Gini Index in Hayden?
Inequality or Gini Index in Hayden is 0.47.
What is the Total Population of Hayden?
Total Population of Hayden is 525.
What is the Total Male Population of Hayden?
Total Male Population of Hayden is 296.
What is the Total Female Population of Hayden?
Total Female Population of Hayden is 229.
What is the Ratio of Males per 100 Females in Hayden?
There are 129.26 Males per 100 Females in Hayden.
What is the Ratio of Females per 100 Males in Hayden?
There are 77.36 Females per 100 Males in Hayden.
What is the Median Population Age in Hayden?
Median Population Age in Hayden is 47.1 Years.
What is the Average Family Size in Hayden
Average Family Size in Hayden is 4.0 People.
What is the Average Household Size in Hayden
Average Household Size in Hayden is 2.6 People.
How Large is the Labor Force in Hayden?
There are 222 People in the Labor Forcein in Hayden.
What is the Percentage of People in the Labor Force in Hayden?
46.9% of People are in the Labor Force in Hayden.
What is the Unemployment Rate in Hayden?
Unemployment Rate in Hayden is 33.8%.