Las Palomas, NM Map & Demographics
Las Palomas Map
Las Palomas Overview
$35,290
PER CAPITA INCOME
$96,188
AVG FAMILY INCOME
0.19
INEQUALITY / GINI INDEX
288
TOTAL POPULATION
73
MALE POPULATION
215
FEMALE POPULATION
33.95
MALES / 100 FEMALES
294.52
FEMALES / 100 MALES
63.3
MEDIAN AGE
3.7
AVG FAMILY SIZE
2.4
AVG HOUSEHOLD SIZE
127
LABOR FORCE [ PEOPLE ]
44.1%
PERCENT IN LABOR FORCE
Income in Las Palomas
Income Overview in Las Palomas
| Characteristic | Number | Measure |
| Per Capita Income | 288 | $35,290 |
| Median Family Income | 62 | $96,188 |
| Mean Family Income | 62 | $87,076 |
| Median Household Income | 122 | $0 |
| Mean Household Income | 122 | $70,411 |
| Income Deficit | 62 | $0 |
| Wage / Income Gap (%) | 288 | 0.00% |
| Wage / Income Gap ($) | 288 | 100.00¢ per $1 |
| Gini / Inequality Index | 288 | 0.19 |
Earnings by Sex in Las Palomas
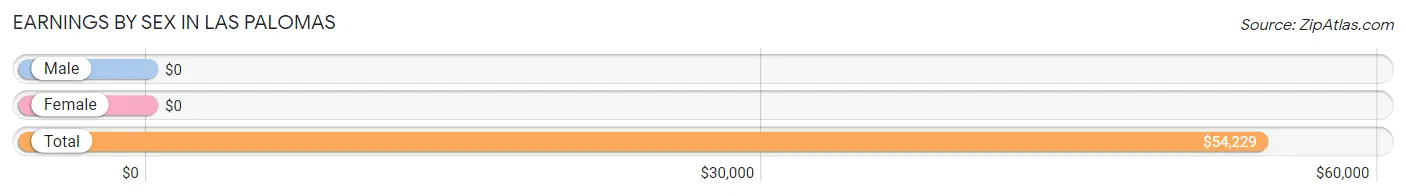
| Sex | Number | Average Earnings |
| Male | 57 (44.9%) | $0 |
| Female | 70 (55.1%) | $0 |
| Total | 127 (100.0%) | $54,229 |
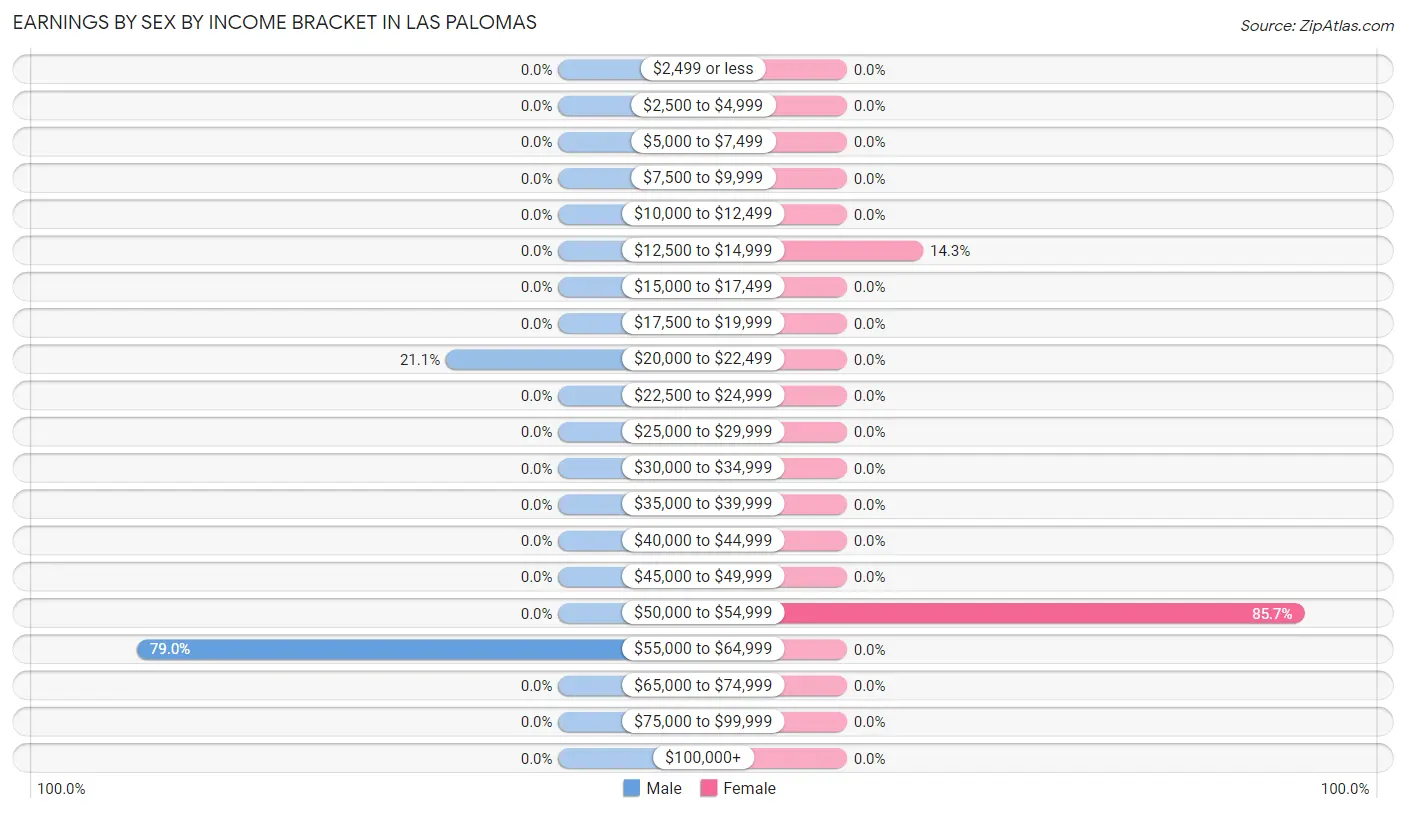
Earnings by Sex by Income Bracket in Las Palomas
The most common earnings brackets in Las Palomas are $55,000 to $64,999 for men (45 | 78.9%) and $50,000 to $54,999 for women (60 | 85.7%).
| Income | Male | Female |
| $2,499 or less | 0 (0.0%) | 0 (0.0%) |
| $2,500 to $4,999 | 0 (0.0%) | 0 (0.0%) |
| $5,000 to $7,499 | 0 (0.0%) | 0 (0.0%) |
| $7,500 to $9,999 | 0 (0.0%) | 0 (0.0%) |
| $10,000 to $12,499 | 0 (0.0%) | 0 (0.0%) |
| $12,500 to $14,999 | 0 (0.0%) | 10 (14.3%) |
| $15,000 to $17,499 | 0 (0.0%) | 0 (0.0%) |
| $17,500 to $19,999 | 0 (0.0%) | 0 (0.0%) |
| $20,000 to $22,499 | 12 (21.0%) | 0 (0.0%) |
| $22,500 to $24,999 | 0 (0.0%) | 0 (0.0%) |
| $25,000 to $29,999 | 0 (0.0%) | 0 (0.0%) |
| $30,000 to $34,999 | 0 (0.0%) | 0 (0.0%) |
| $35,000 to $39,999 | 0 (0.0%) | 0 (0.0%) |
| $40,000 to $44,999 | 0 (0.0%) | 0 (0.0%) |
| $45,000 to $49,999 | 0 (0.0%) | 0 (0.0%) |
| $50,000 to $54,999 | 0 (0.0%) | 60 (85.7%) |
| $55,000 to $64,999 | 45 (78.9%) | 0 (0.0%) |
| $65,000 to $74,999 | 0 (0.0%) | 0 (0.0%) |
| $75,000 to $99,999 | 0 (0.0%) | 0 (0.0%) |
| $100,000+ | 0 (0.0%) | 0 (0.0%) |
| Total | 57 (100.0%) | 70 (100.0%) |
Earnings by Sex by Educational Attainment in Las Palomas
| Educational Attainment | Male Income | Female Income |
| Less than High School | - | - |
| High School Diploma | - | - |
| College or Associate's Degree | - | - |
| Bachelor's Degree | - | - |
| Graduate Degree | - | - |
| Total | - | - |
Family Income in Las Palomas
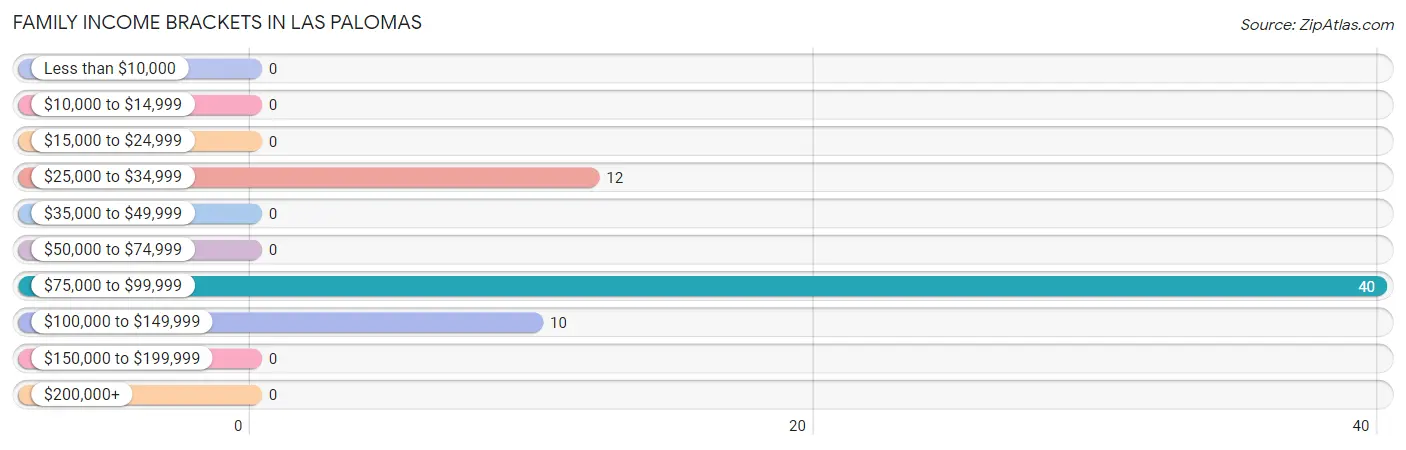
Family Income Brackets in Las Palomas
According to the Las Palomas family income data, there are 40 families falling into the $75,000 to $99,999 income range, which is the most common income bracket and makes up 64.5% of all families.
| Income Bracket | # Families | % Families |
| Less than $10,000 | 0 | 0.0% |
| $10,000 to $14,999 | 0 | 0.0% |
| $15,000 to $24,999 | 0 | 0.0% |
| $25,000 to $34,999 | 12 | 19.4% |
| $35,000 to $49,999 | 0 | 0.0% |
| $50,000 to $74,999 | 0 | 0.0% |
| $75,000 to $99,999 | 40 | 64.5% |
| $100,000 to $149,999 | 10 | 16.1% |
| $150,000 to $199,999 | 0 | 0.0% |
| $200,000+ | 0 | 0.0% |
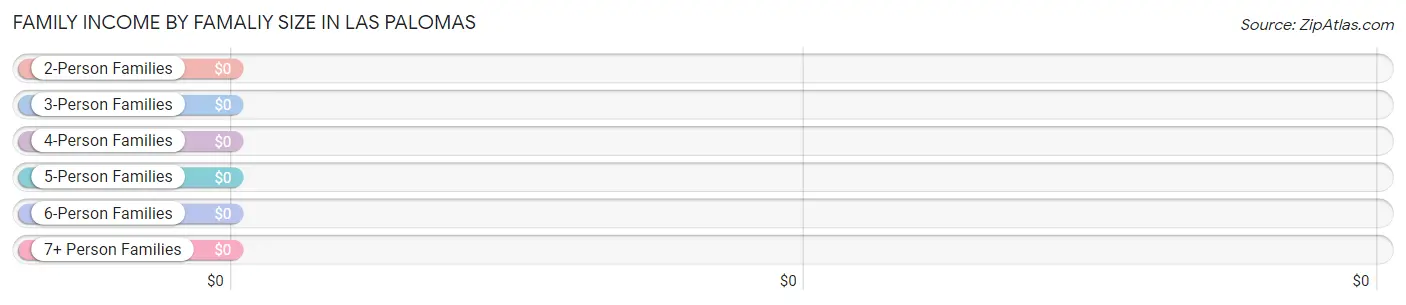
Family Income by Famaliy Size in Las Palomas
| Income Bracket | # Families | Median Income |
| 2-Person Families | 22 (35.5%) | $0 |
| 3-Person Families | 40 (64.5%) | $0 |
| 4-Person Families | 0 (0.0%) | $0 |
| 5-Person Families | 0 (0.0%) | $0 |
| 6-Person Families | 0 (0.0%) | $0 |
| 7+ Person Families | 0 (0.0%) | $0 |
| Total | 62 (100.0%) | $96,188 |
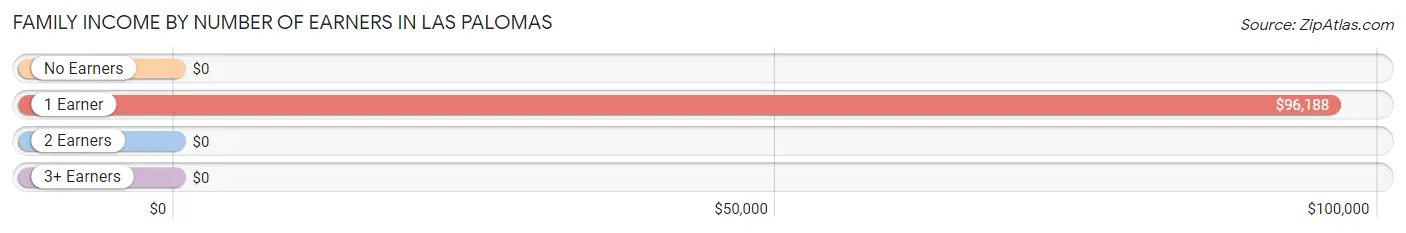
Family Income by Number of Earners in Las Palomas
| Number of Earners | # Families | Median Income |
| No Earners | 0 (0.0%) | $0 |
| 1 Earner | 62 (100.0%) | $96,188 |
| 2 Earners | 0 (0.0%) | $0 |
| 3+ Earners | 0 (0.0%) | $0 |
| Total | 62 (100.0%) | $96,188 |
Household Income in Las Palomas
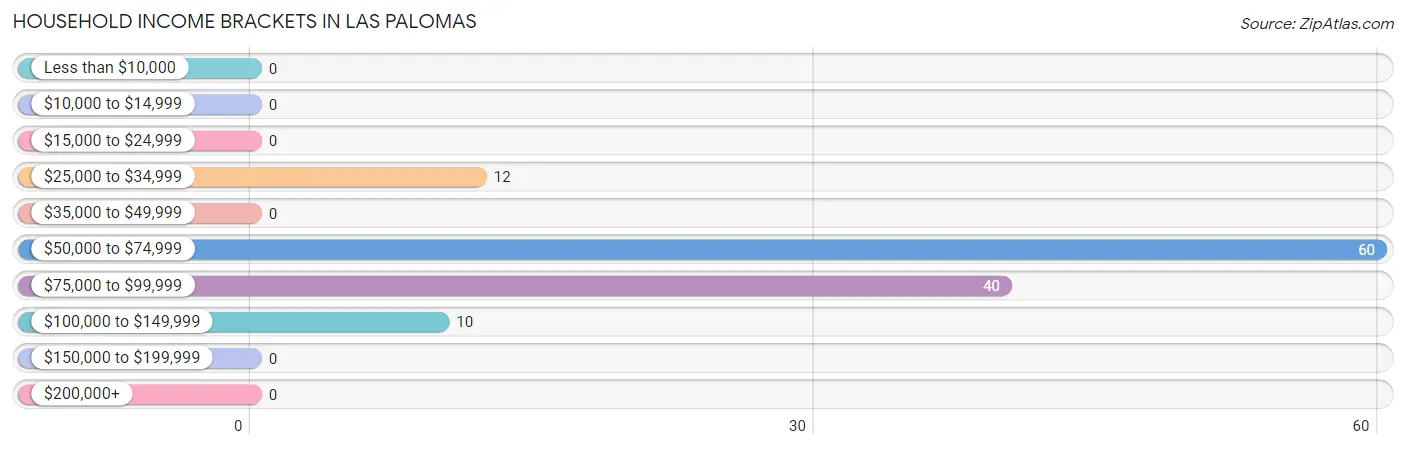
Household Income Brackets in Las Palomas
With 60 households falling in the category, the $50,000 to $74,999 income range is the most frequent in Las Palomas, accounting for 49.2% of all households.
| Income Bracket | # Households | % Households |
| Less than $10,000 | 0 | 0.0% |
| $10,000 to $14,999 | 0 | 0.0% |
| $15,000 to $24,999 | 0 | 0.0% |
| $25,000 to $34,999 | 12 | 9.8% |
| $35,000 to $49,999 | 0 | 0.0% |
| $50,000 to $74,999 | 60 | 49.2% |
| $75,000 to $99,999 | 40 | 32.8% |
| $100,000 to $149,999 | 10 | 8.2% |
| $150,000 to $199,999 | 0 | 0.0% |
| $200,000+ | 0 | 0.0% |
Household Income by Householder Age in Las Palomas
| Income Bracket | # Households | Median Income |
| 15 to 24 Years | 0 (0.0%) | $0 |
| 25 to 44 Years | 0 (0.0%) | $0 |
| 45 to 64 Years | 112 (91.8%) | $0 |
| 65+ Years | 10 (8.2%) | $0 |
| Total | 122 (100.0%) | $0 |
Poverty in Las Palomas
Income Below Poverty by Sex and Age in Las Palomas
| Age Bracket | Male | Female |
| Under 5 Years | 0 (0.0%) | 0 (0.0%) |
| 5 Years | 0 (0.0%) | 0 (0.0%) |
| 6 to 11 Years | 0 (0.0%) | 0 (0.0%) |
| 12 to 14 Years | 0 (0.0%) | 0 (0.0%) |
| 15 Years | 0 (0.0%) | 0 (0.0%) |
| 16 and 17 Years | 0 (0.0%) | 0 (0.0%) |
| 18 to 24 Years | 0 (0.0%) | 0 (0.0%) |
| 25 to 34 Years | 0 (0.0%) | 0 (0.0%) |
| 35 to 44 Years | 0 (0.0%) | 0 (0.0%) |
| 45 to 54 Years | 0 (0.0%) | 0 (0.0%) |
| 55 to 64 Years | 0 (0.0%) | 0 (0.0%) |
| 65 to 74 Years | 0 (0.0%) | 0 (0.0%) |
| 75 Years and over | 0 (0.0%) | 0 (0.0%) |
| Total | 0 (0.0%) | 0 (0.0%) |
Income Above Poverty by Sex and Age in Las Palomas
According to the poverty statistics in Las Palomas, males aged 45 to 54 years and females aged 45 to 54 years are the age groups that are most secure financially, with 100.0% of males and 100.0% of females in these age groups living above the poverty line.
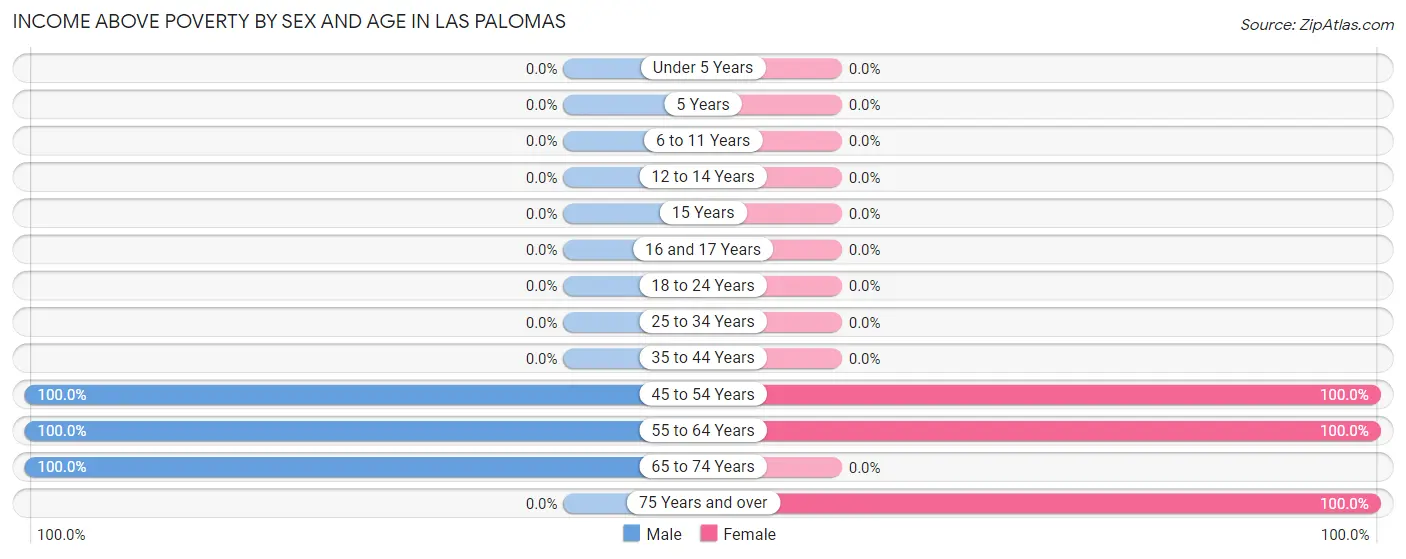
| Age Bracket | Male | Female |
| Under 5 Years | 0 (0.0%) | 0 (0.0%) |
| 5 Years | 0 (0.0%) | 0 (0.0%) |
| 6 to 11 Years | 0 (0.0%) | 0 (0.0%) |
| 12 to 14 Years | 0 (0.0%) | 0 (0.0%) |
| 15 Years | 0 (0.0%) | 0 (0.0%) |
| 16 and 17 Years | 0 (0.0%) | 0 (0.0%) |
| 18 to 24 Years | 0 (0.0%) | 0 (0.0%) |
| 25 to 34 Years | 0 (0.0%) | 0 (0.0%) |
| 35 to 44 Years | 0 (0.0%) | 0 (0.0%) |
| 45 to 54 Years | 12 (100.0%) | 17 (100.0%) |
| 55 to 64 Years | 45 (100.0%) | 100 (100.0%) |
| 65 to 74 Years | 16 (100.0%) | 0 (0.0%) |
| 75 Years and over | 0 (0.0%) | 98 (100.0%) |
| Total | 73 (100.0%) | 215 (100.0%) |
Income Below Poverty Among Married-Couple Families in Las Palomas
| Children | Above Poverty | Below Poverty |
| No Children | 62 (100.0%) | 0 (0.0%) |
| 1 or 2 Children | 0 (0.0%) | 0 (0.0%) |
| 3 or 4 Children | 0 (0.0%) | 0 (0.0%) |
| 5 or more Children | 0 (0.0%) | 0 (0.0%) |
| Total | 62 (100.0%) | 0 (0.0%) |
Income Below Poverty Among Single-Parent Households in Las Palomas
| Children | Single Father | Single Mother |
| No Children | 0 (0.0%) | 0 (0.0%) |
| 1 or 2 Children | 0 (0.0%) | 0 (0.0%) |
| 3 or 4 Children | 0 (0.0%) | 0 (0.0%) |
| 5 or more Children | 0 (0.0%) | 0 (0.0%) |
| Total | 0 (0.0%) | 0 (0.0%) |
Income Below Poverty Among Married-Couple vs Single-Parent Households in Las Palomas
| Children | Married-Couple Families | Single-Parent Households |
| No Children | 0 (0.0%) | 0 (0.0%) |
| 1 or 2 Children | 0 (0.0%) | 0 (0.0%) |
| 3 or 4 Children | 0 (0.0%) | 0 (0.0%) |
| 5 or more Children | 0 (0.0%) | 0 (0.0%) |
| Total | 0 (0.0%) | 0 (0.0%) |
Race in Las Palomas
The most populous races in Las Palomas are , and White / Caucasian (288 | 100.0%).
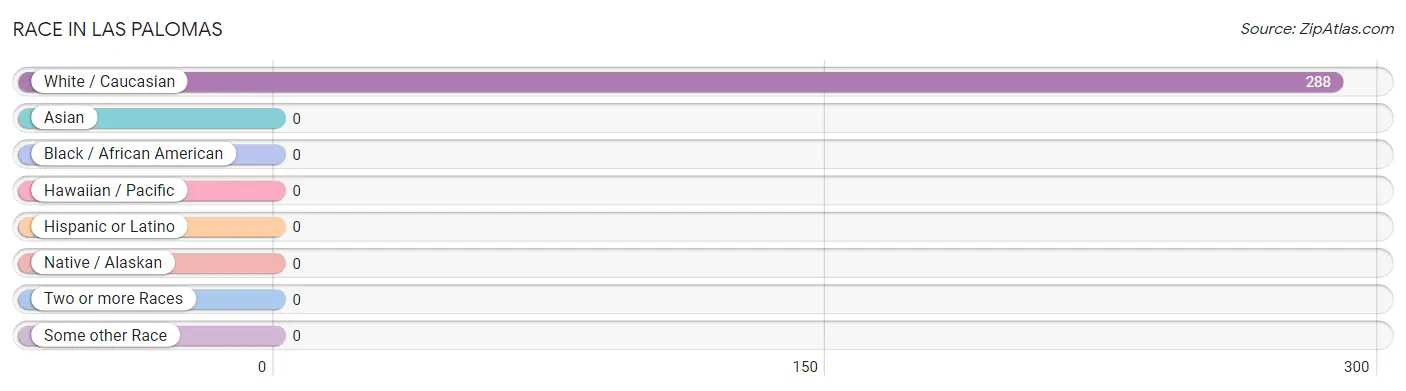
| Race | # Population | % Population |
| Asian | 0 | 0.0% |
| Black / African American | 0 | 0.0% |
| Hawaiian / Pacific | 0 | 0.0% |
| Hispanic or Latino | 0 | 0.0% |
| Native / Alaskan | 0 | 0.0% |
| White / Caucasian | 288 | 100.0% |
| Two or more Races | 0 | 0.0% |
| Some other Race | 0 | 0.0% |
| Total | 288 | 100.0% |
Ancestry in Las Palomas
The most populous ancestries reported in Las Palomas are English (133 | 46.2%), Scottish (100 | 34.7%), Lithuanian (60 | 20.8%), and Welsh (40 | 13.9%), together accounting for 115.6% of all Las Palomas residents.
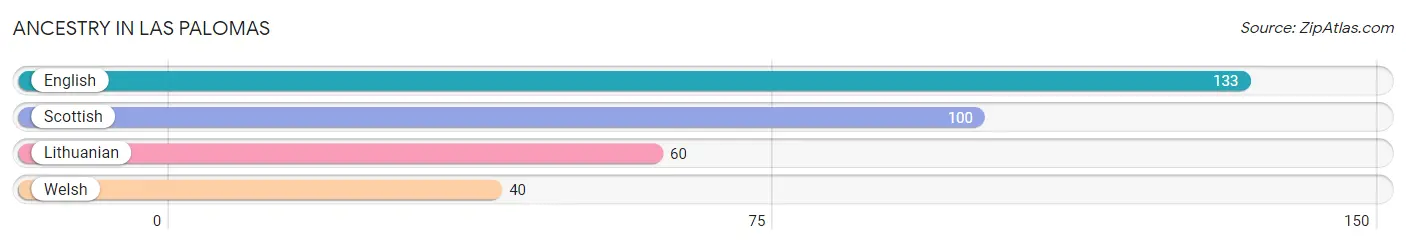
| Ancestry | # Population | % Population |
| English | 133 | 46.2% |
| Lithuanian | 60 | 20.8% |
| Scottish | 100 | 34.7% |
| Welsh | 40 | 13.9% | View All 4 Rows |
Immigrants in Las Palomas

| Immigration Origin | # Population | % Population | View All 0 Rows |
Sex and Age in Las Palomas
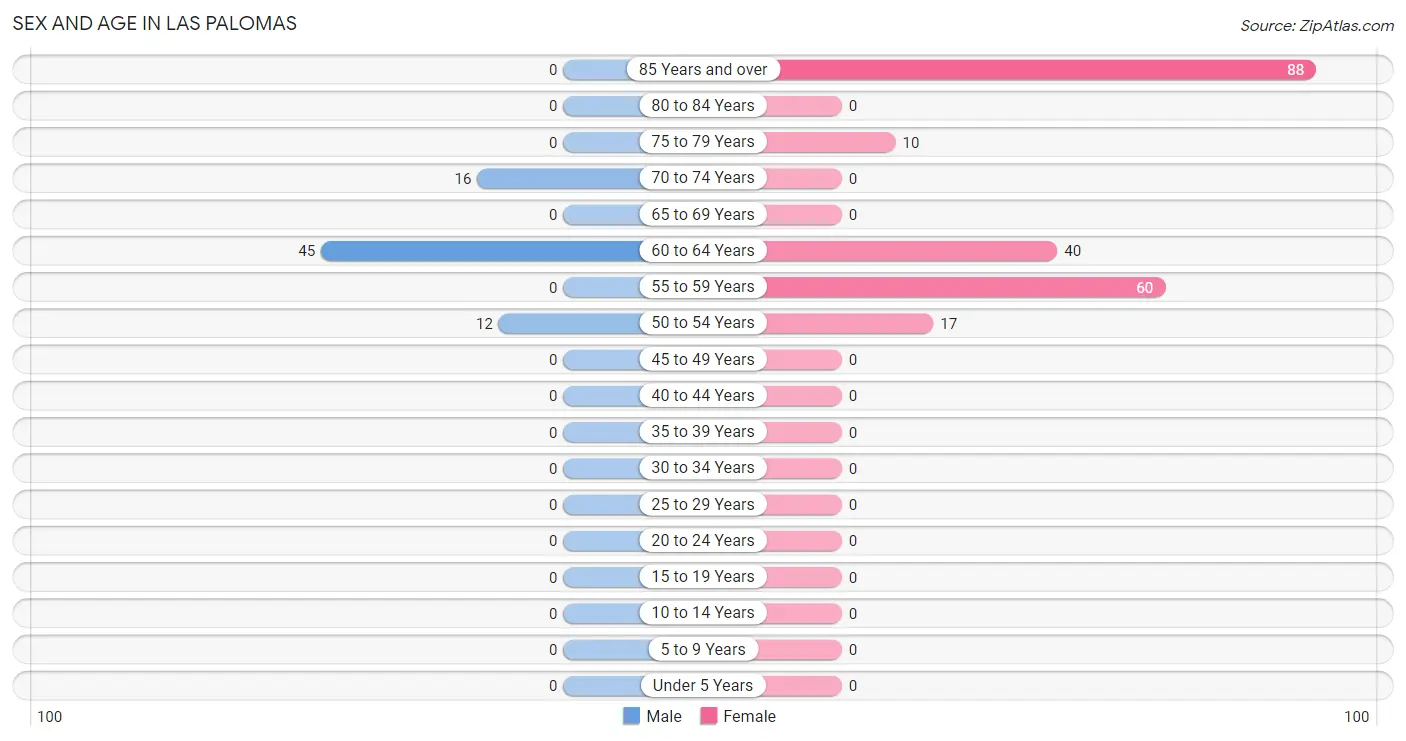
Sex and Age in Las Palomas
The most populous age groups in Las Palomas are 60 to 64 Years (45 | 61.6%) for men and 85 Years and over (88 | 40.9%) for women.
| Age Bracket | Male | Female |
| Under 5 Years | 0 (0.0%) | 0 (0.0%) |
| 5 to 9 Years | 0 (0.0%) | 0 (0.0%) |
| 10 to 14 Years | 0 (0.0%) | 0 (0.0%) |
| 15 to 19 Years | 0 (0.0%) | 0 (0.0%) |
| 20 to 24 Years | 0 (0.0%) | 0 (0.0%) |
| 25 to 29 Years | 0 (0.0%) | 0 (0.0%) |
| 30 to 34 Years | 0 (0.0%) | 0 (0.0%) |
| 35 to 39 Years | 0 (0.0%) | 0 (0.0%) |
| 40 to 44 Years | 0 (0.0%) | 0 (0.0%) |
| 45 to 49 Years | 0 (0.0%) | 0 (0.0%) |
| 50 to 54 Years | 12 (16.4%) | 17 (7.9%) |
| 55 to 59 Years | 0 (0.0%) | 60 (27.9%) |
| 60 to 64 Years | 45 (61.6%) | 40 (18.6%) |
| 65 to 69 Years | 0 (0.0%) | 0 (0.0%) |
| 70 to 74 Years | 16 (21.9%) | 0 (0.0%) |
| 75 to 79 Years | 0 (0.0%) | 10 (4.6%) |
| 80 to 84 Years | 0 (0.0%) | 0 (0.0%) |
| 85 Years and over | 0 (0.0%) | 88 (40.9%) |
| Total | 73 (100.0%) | 215 (100.0%) |
Families and Households in Las Palomas
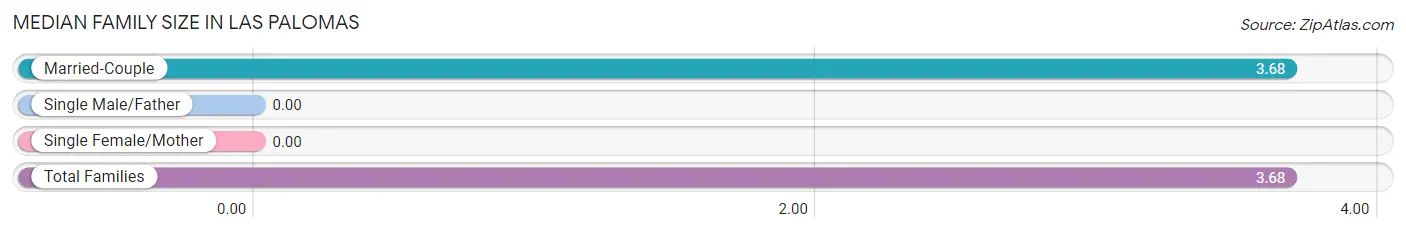
Median Family Size in Las Palomas
| Family Type | # Families | Family Size |
| Married-Couple | 62 (100.0%) | 3.68 |
| Single Male/Father | 0 (0.0%) | - |
| Single Female/Mother | 0 (0.0%) | - |
| Total Families | 62 (100.0%) | 3.68 |
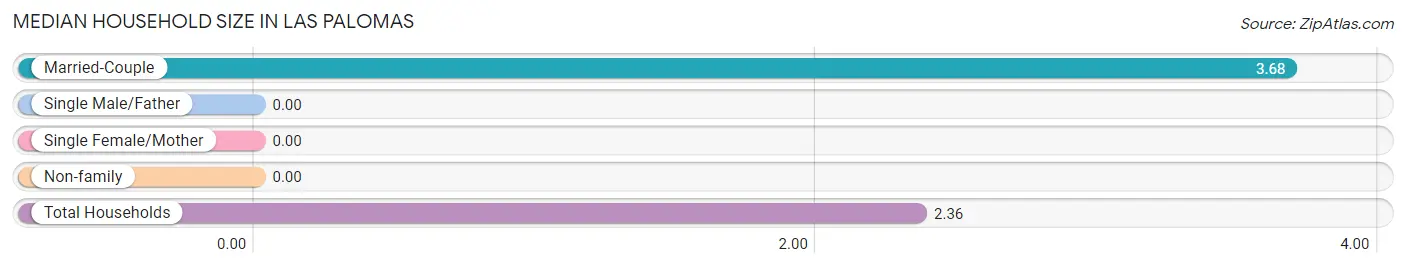
Median Household Size in Las Palomas
| Household Type | # Households | Household Size |
| Married-Couple | 62 (50.8%) | 3.68 |
| Single Male/Father | 0 (0.0%) | - |
| Single Female/Mother | 0 (0.0%) | - |
| Non-family | 60 (49.2%) | - |
| Total Households | 122 (100.0%) | 2.36 |
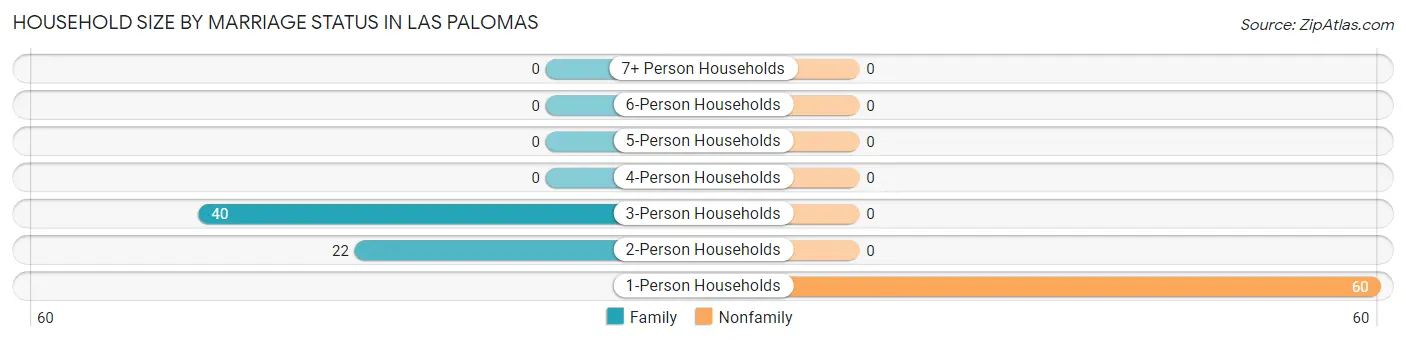
Household Size by Marriage Status in Las Palomas
Out of a total of 122 households in Las Palomas, 62 (50.8%) are family households, while 60 (49.2%) are nonfamily households. The most numerous type of family households are 3-person households, comprising 40, and the most common type of nonfamily households are 1-person households, comprising 60.
| Household Size | Family Households | Nonfamily Households |
| 1-Person Households | - | 60 (49.2%) |
| 2-Person Households | 22 (18.0%) | 0 (0.0%) |
| 3-Person Households | 40 (32.8%) | 0 (0.0%) |
| 4-Person Households | 0 (0.0%) | 0 (0.0%) |
| 5-Person Households | 0 (0.0%) | 0 (0.0%) |
| 6-Person Households | 0 (0.0%) | 0 (0.0%) |
| 7+ Person Households | 0 (0.0%) | 0 (0.0%) |
| Total | 62 (50.8%) | 60 (49.2%) |
Female Fertility in Las Palomas
Fertility by Age in Las Palomas
| Age Bracket | Women with Births | Births / 1,000 Women |
| 15 to 19 years | 0 (0.0%) | 0.0 |
| 20 to 34 years | 0 (0.0%) | 0.0 |
| 35 to 50 years | 0 (0.0%) | 0.0 |
| Total | 0 (0.0%) | 0.0 |
Fertility by Age by Marriage Status in Las Palomas
| Age Bracket | Married | Unmarried |
| 15 to 19 years | 0 (0.0%) | 0 (0.0%) |
| 20 to 34 years | 0 (0.0%) | 0 (0.0%) |
| 35 to 50 years | 0 (0.0%) | 0 (0.0%) |
| Total | 0 (0.0%) | 0 (0.0%) |
Fertility by Education in Las Palomas
| Educational Attainment | Women with Births | Births / 1,000 Women |
| Less than High School | 0 (0.0%) | 0.0 |
| High School Diploma | 0 (0.0%) | 0.0 |
| College or Associate's Degree | 0 (0.0%) | 0.0 |
| Bachelor's Degree | 0 (0.0%) | 0.0 |
| Graduate Degree | 0 (0.0%) | 0.0 |
| Total | 0 (0.0%) | 0.0 |
Fertility by Education by Marriage Status in Las Palomas
| Educational Attainment | Married | Unmarried |
| Less than High School | 0 (0.0%) | 0 (0.0%) |
| High School Diploma | 0 (0.0%) | 0 (0.0%) |
| College or Associate's Degree | 0 (0.0%) | 0 (0.0%) |
| Bachelor's Degree | 0 (0.0%) | 0 (0.0%) |
| Graduate Degree | 0 (0.0%) | 0 (0.0%) |
| Total | 0 (0.0%) | 0 (0.0%) |
Employment Characteristics in Las Palomas
Employment by Class of Employer in Las Palomas
Among the 127 employed individuals in Las Palomas, self-employed (not incorporated) (60 | 47.2%), private company employees (45 | 35.4%), and local government employees (12 | 9.5%) make up the most common classes of employment.
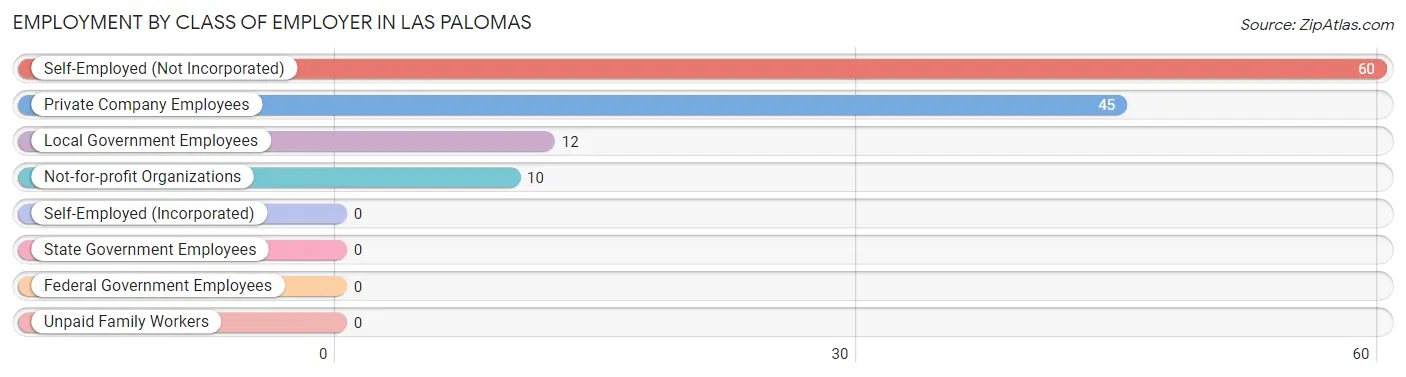
| Employer Class | # Employees | % Employees |
| Private Company Employees | 45 | 35.4% |
| Self-Employed (Incorporated) | 0 | 0.0% |
| Self-Employed (Not Incorporated) | 60 | 47.2% |
| Not-for-profit Organizations | 10 | 7.9% |
| Local Government Employees | 12 | 9.5% |
| State Government Employees | 0 | 0.0% |
| Federal Government Employees | 0 | 0.0% |
| Unpaid Family Workers | 0 | 0.0% |
| Total | 127 | 100.0% |
Employment Status by Age in Las Palomas
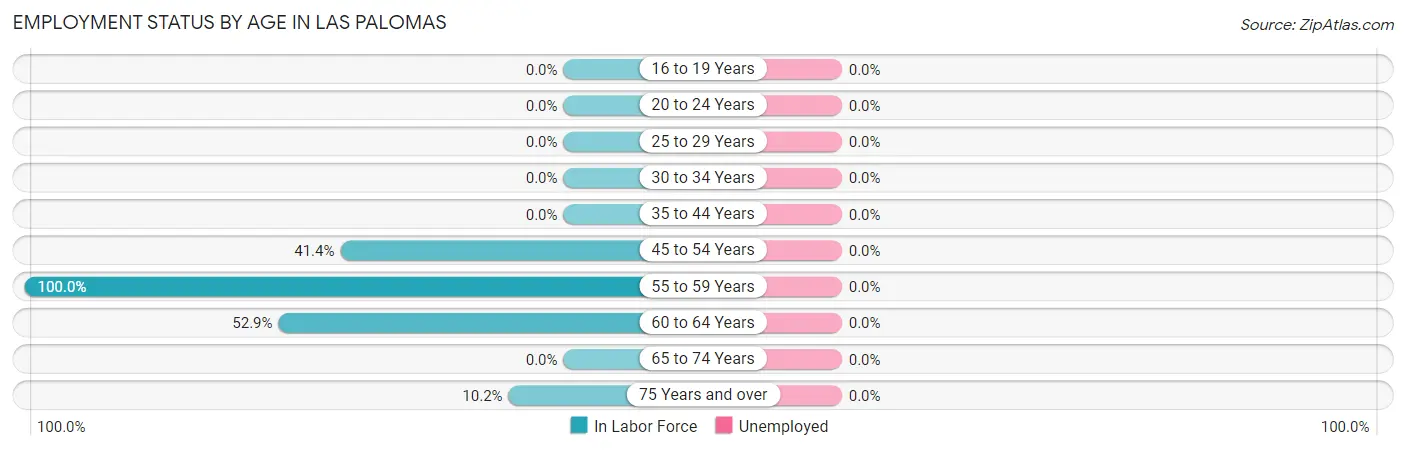
| Age Bracket | In Labor Force | Unemployed |
| 16 to 19 Years | 0 (0.0%) | 0 (0.0%) |
| 20 to 24 Years | 0 (0.0%) | 0 (0.0%) |
| 25 to 29 Years | 0 (0.0%) | 0 (0.0%) |
| 30 to 34 Years | 0 (0.0%) | 0 (0.0%) |
| 35 to 44 Years | 0 (0.0%) | 0 (0.0%) |
| 45 to 54 Years | 12 (41.4%) | 0 (0.0%) |
| 55 to 59 Years | 60 (100.0%) | 0 (0.0%) |
| 60 to 64 Years | 45 (52.9%) | 0 (0.0%) |
| 65 to 74 Years | 0 (0.0%) | 0 (0.0%) |
| 75 Years and over | 10 (10.2%) | 0 (0.0%) |
| Total | 127 (44.1%) | 0 (0.0%) |
Employment Status by Educational Attainment in Las Palomas
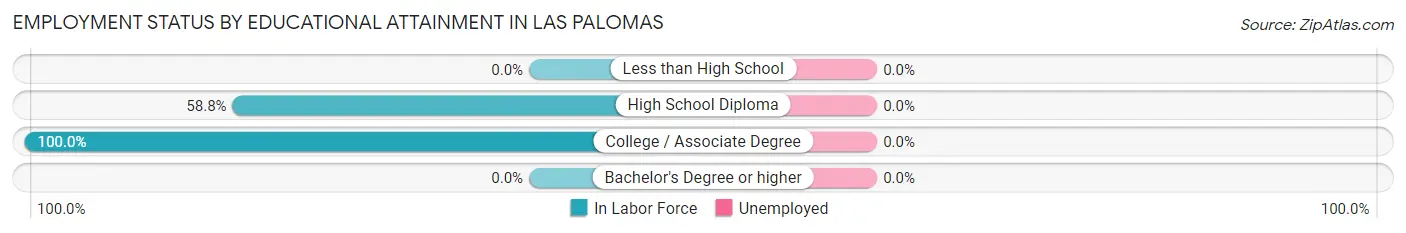
| Educational Attainment | In Labor Force | Unemployed |
| Less than High School | 0 (0.0%) | 0 (0.0%) |
| High School Diploma | 57 (58.8%) | 0 (0.0%) |
| College / Associate Degree | 60 (100.0%) | 0 (0.0%) |
| Bachelor's Degree or higher | 0 (0.0%) | 0 (0.0%) |
| Total | 117 (67.2%) | 0 (0.0%) |
Employment Occupations by Sex in Las Palomas
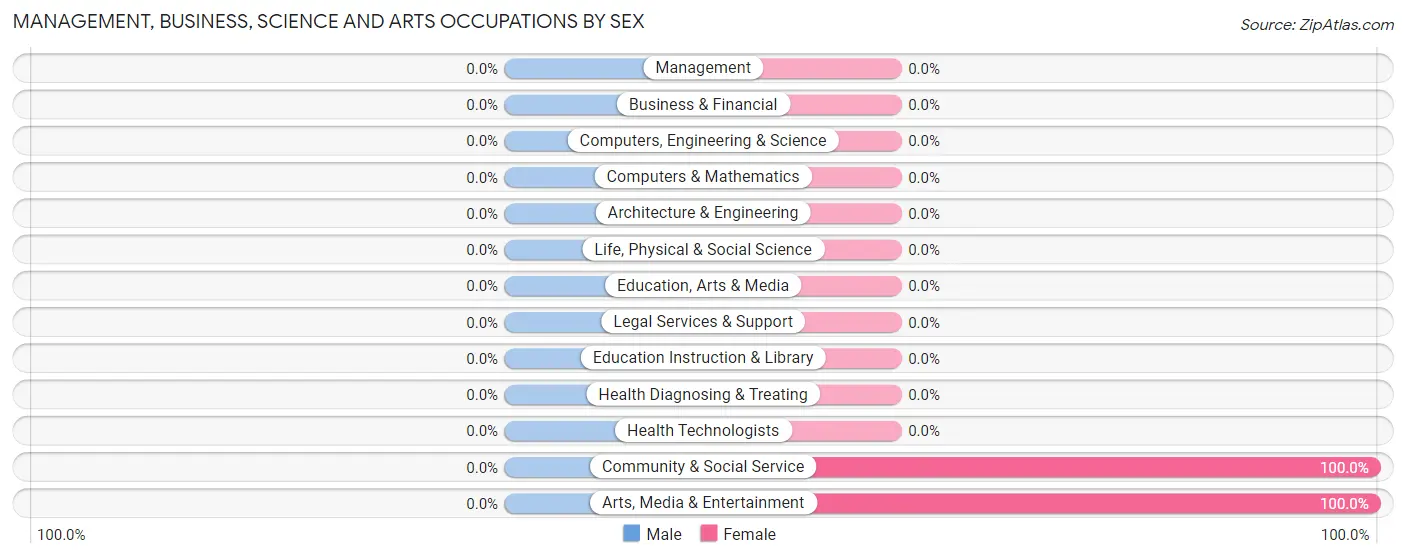
Management, Business, Science and Arts Occupations
The most common Management, Business, Science and Arts occupations in Las Palomas are Community & Social Service (60 | 47.2%), and Arts, Media & Entertainment (60 | 47.2%).
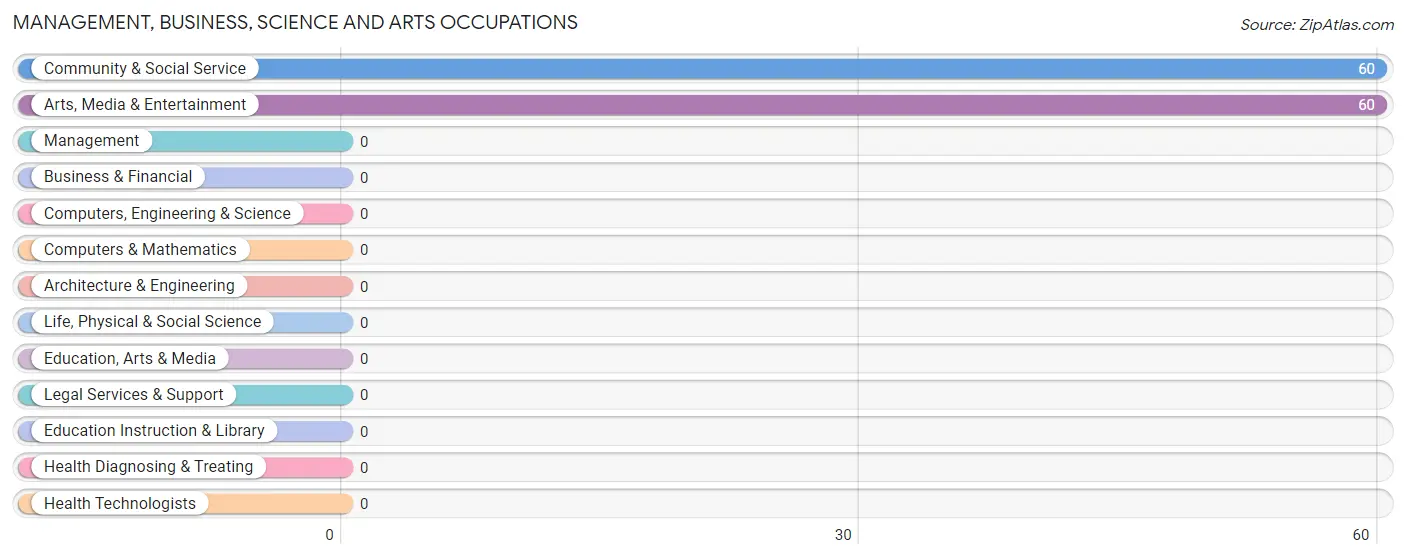
Management, Business, Science and Arts Occupations by Sex
| Occupation | Male | Female |
| Management | 0 (0.0%) | 0 (0.0%) |
| Business & Financial | 0 (0.0%) | 0 (0.0%) |
| Computers, Engineering & Science | 0 (0.0%) | 0 (0.0%) |
| Computers & Mathematics | 0 (0.0%) | 0 (0.0%) |
| Architecture & Engineering | 0 (0.0%) | 0 (0.0%) |
| Life, Physical & Social Science | 0 (0.0%) | 0 (0.0%) |
| Community & Social Service | 0 (0.0%) | 60 (100.0%) |
| Education, Arts & Media | 0 (0.0%) | 0 (0.0%) |
| Legal Services & Support | 0 (0.0%) | 0 (0.0%) |
| Education Instruction & Library | 0 (0.0%) | 0 (0.0%) |
| Arts, Media & Entertainment | 0 (0.0%) | 60 (100.0%) |
| Health Diagnosing & Treating | 0 (0.0%) | 0 (0.0%) |
| Health Technologists | 0 (0.0%) | 0 (0.0%) |
| Total (Category) | 0 (0.0%) | 60 (100.0%) |
| Total (Overall) | 57 (44.9%) | 70 (55.1%) |
Services Occupations
The most common Services occupations in Las Palomas are , and Cleaning & Maintenance (12 | 9.5%).
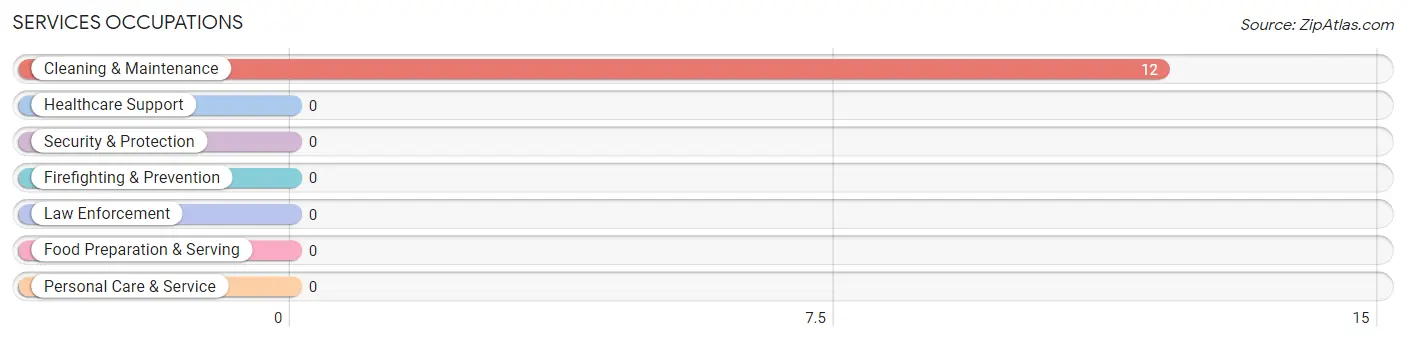
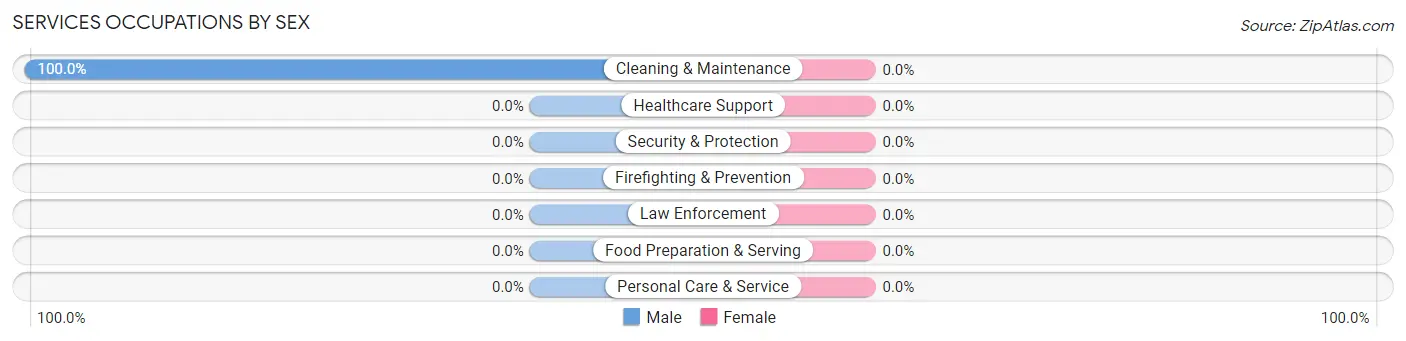
Services Occupations by Sex
| Occupation | Male | Female |
| Healthcare Support | 0 (0.0%) | 0 (0.0%) |
| Security & Protection | 0 (0.0%) | 0 (0.0%) |
| Firefighting & Prevention | 0 (0.0%) | 0 (0.0%) |
| Law Enforcement | 0 (0.0%) | 0 (0.0%) |
| Food Preparation & Serving | 0 (0.0%) | 0 (0.0%) |
| Cleaning & Maintenance | 12 (100.0%) | 0 (0.0%) |
| Personal Care & Service | 0 (0.0%) | 0 (0.0%) |
| Total (Category) | 12 (100.0%) | 0 (0.0%) |
| Total (Overall) | 57 (44.9%) | 70 (55.1%) |
Sales and Office Occupations
The most common Sales and Office occupations in Las Palomas are , and Office & Administration (10 | 7.9%).
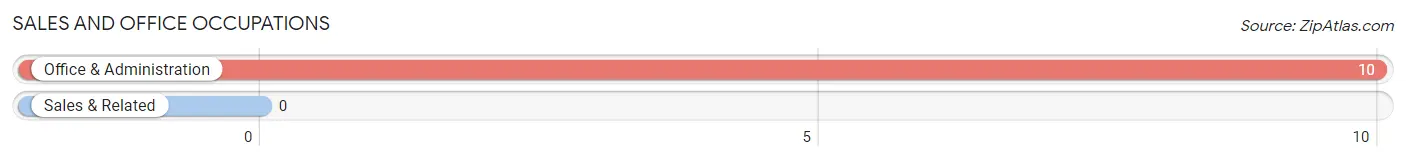
Sales and Office Occupations by Sex

| Occupation | Male | Female |
| Sales & Related | 0 (0.0%) | 0 (0.0%) |
| Office & Administration | 0 (0.0%) | 10 (100.0%) |
| Total (Category) | 0 (0.0%) | 10 (100.0%) |
| Total (Overall) | 57 (44.9%) | 70 (55.1%) |
Natural Resources, Construction and Maintenance Occupations
Natural Resources, Construction and Maintenance Occupations by Sex
| Occupation | Male | Female |
| Farming, Fishing & Forestry | 0 (0.0%) | 0 (0.0%) |
| Construction & Extraction | 0 (0.0%) | 0 (0.0%) |
| Installation, Maintenance & Repair | 0 (0.0%) | 0 (0.0%) |
| Total (Category) | 0 (0.0%) | 0 (0.0%) |
| Total (Overall) | 57 (44.9%) | 70 (55.1%) |
Production, Transportation and Moving Occupations
The most common Production, Transportation and Moving occupations in Las Palomas are , and Production (45 | 35.4%).
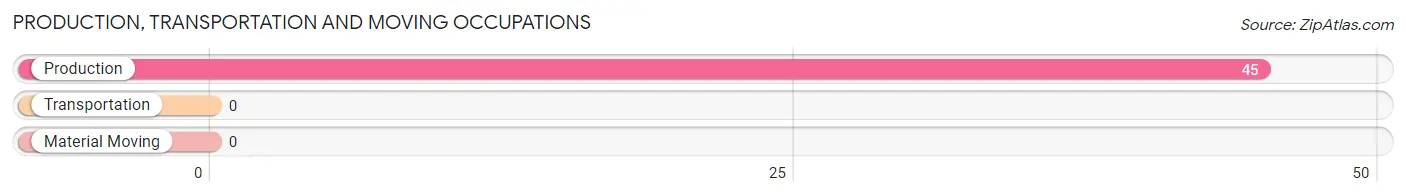
Production, Transportation and Moving Occupations by Sex
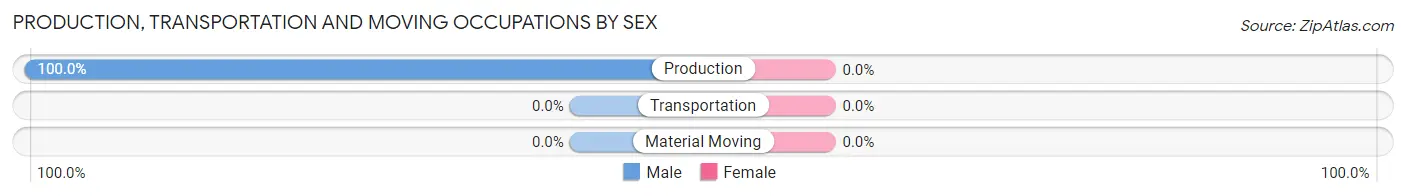
| Occupation | Male | Female |
| Production | 45 (100.0%) | 0 (0.0%) |
| Transportation | 0 (0.0%) | 0 (0.0%) |
| Material Moving | 0 (0.0%) | 0 (0.0%) |
| Total (Category) | 45 (100.0%) | 0 (0.0%) |
| Total (Overall) | 57 (44.9%) | 70 (55.1%) |
Employment Industries by Sex in Las Palomas
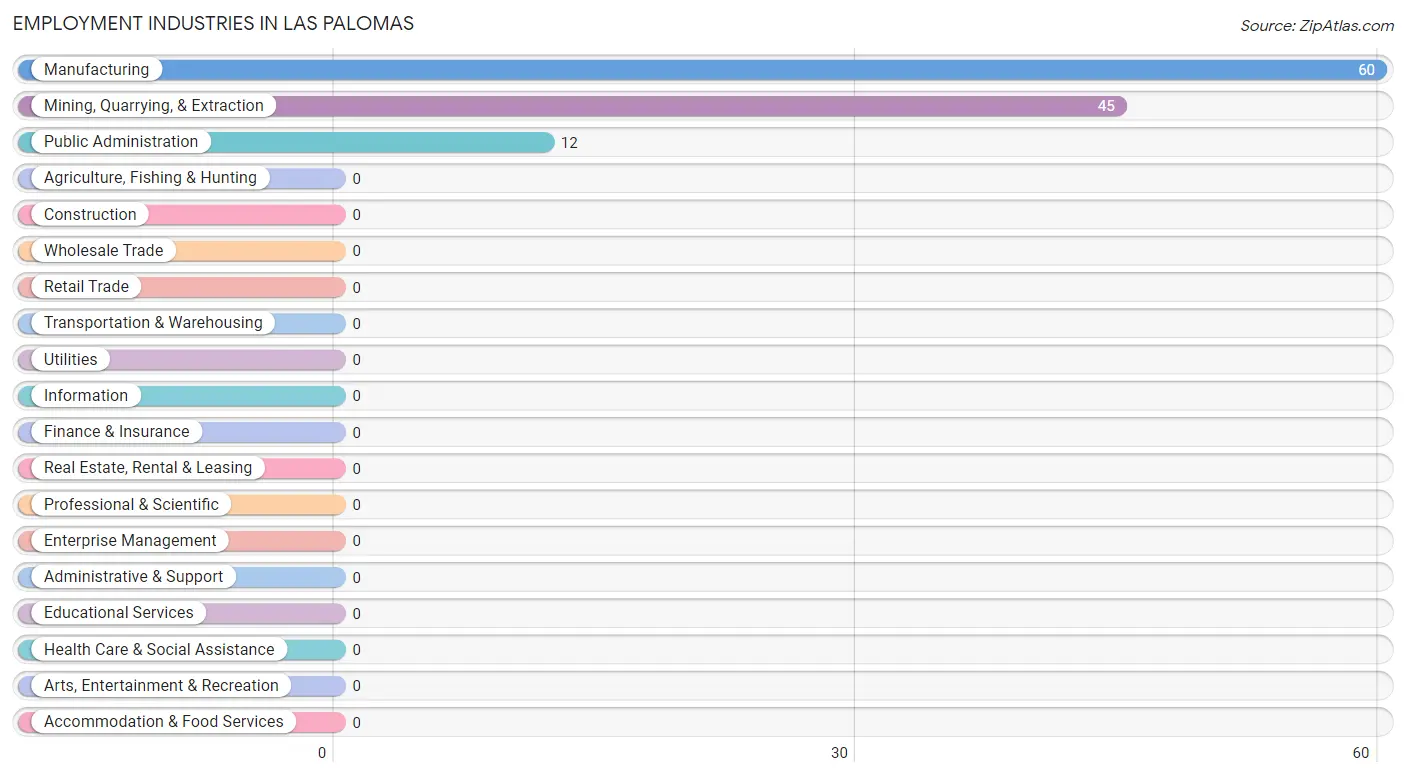
Employment Industries in Las Palomas
The major employment industries in Las Palomas include Manufacturing (60 | 47.2%), Mining, Quarrying, & Extraction (45 | 35.4%), and Public Administration (12 | 9.5%).
Employment Industries by Sex in Las Palomas
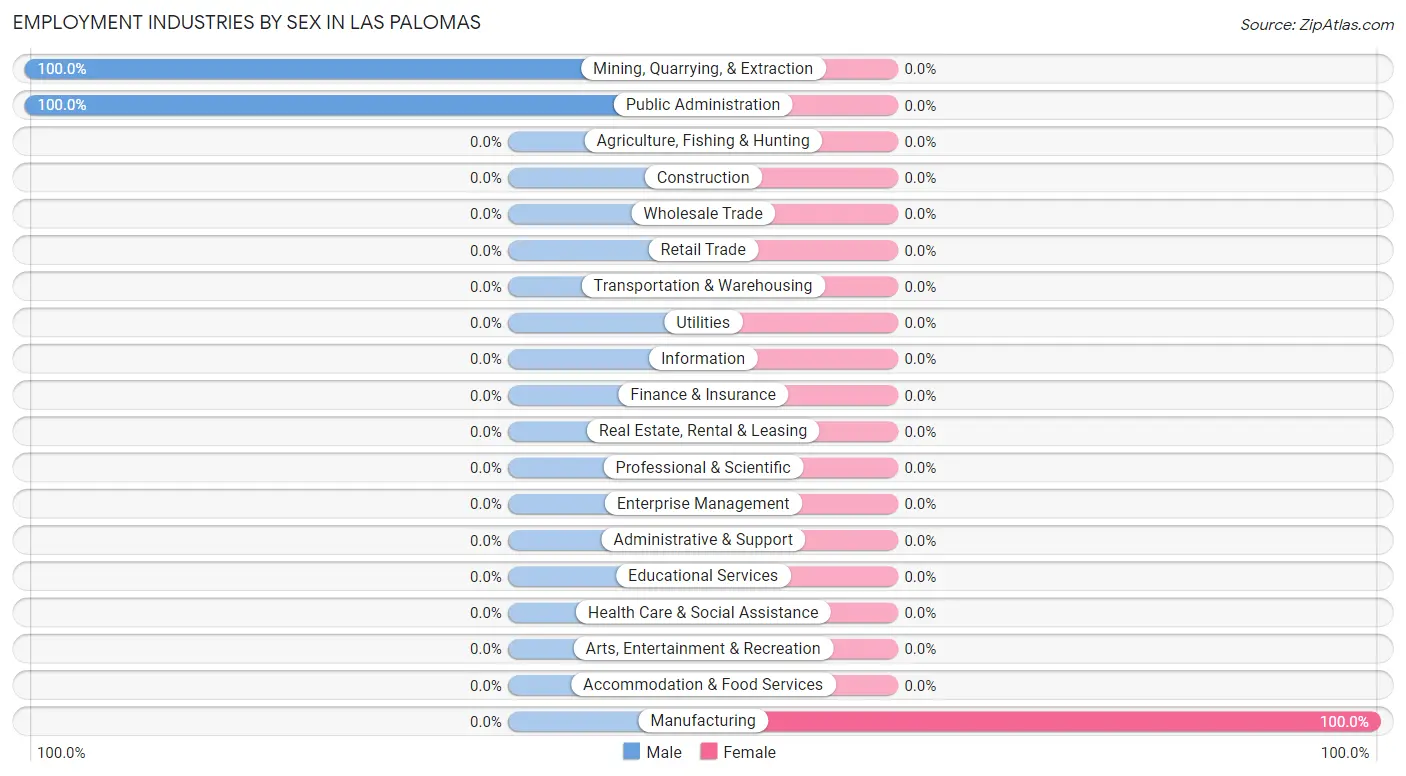
| Industry | Male | Female |
| Agriculture, Fishing & Hunting | 0 (0.0%) | 0 (0.0%) |
| Mining, Quarrying, & Extraction | 45 (100.0%) | 0 (0.0%) |
| Construction | 0 (0.0%) | 0 (0.0%) |
| Manufacturing | 0 (0.0%) | 60 (100.0%) |
| Wholesale Trade | 0 (0.0%) | 0 (0.0%) |
| Retail Trade | 0 (0.0%) | 0 (0.0%) |
| Transportation & Warehousing | 0 (0.0%) | 0 (0.0%) |
| Utilities | 0 (0.0%) | 0 (0.0%) |
| Information | 0 (0.0%) | 0 (0.0%) |
| Finance & Insurance | 0 (0.0%) | 0 (0.0%) |
| Real Estate, Rental & Leasing | 0 (0.0%) | 0 (0.0%) |
| Professional & Scientific | 0 (0.0%) | 0 (0.0%) |
| Enterprise Management | 0 (0.0%) | 0 (0.0%) |
| Administrative & Support | 0 (0.0%) | 0 (0.0%) |
| Educational Services | 0 (0.0%) | 0 (0.0%) |
| Health Care & Social Assistance | 0 (0.0%) | 0 (0.0%) |
| Arts, Entertainment & Recreation | 0 (0.0%) | 0 (0.0%) |
| Accommodation & Food Services | 0 (0.0%) | 0 (0.0%) |
| Public Administration | 12 (100.0%) | 0 (0.0%) |
| Total | 57 (44.9%) | 70 (55.1%) |
Education in Las Palomas
School Enrollment in Las Palomas
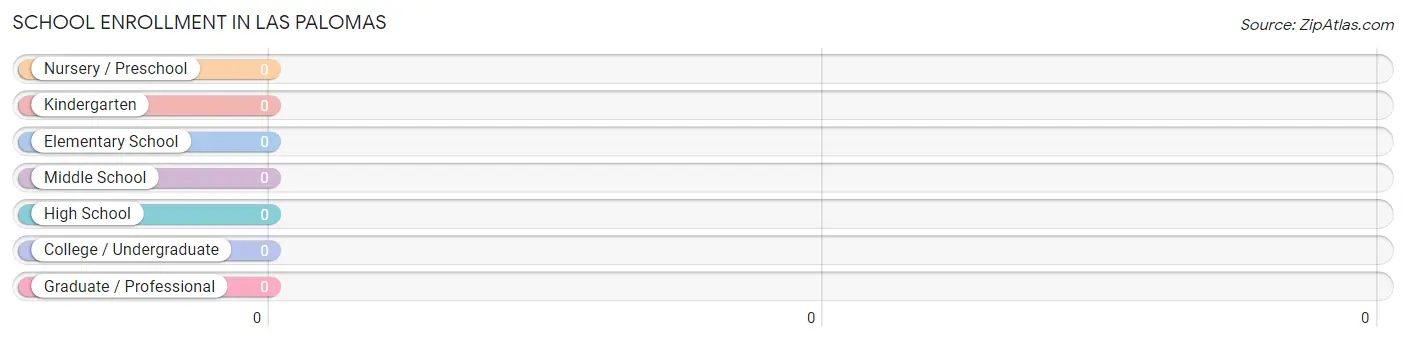
| School Level | # Students | % Students |
| Nursery / Preschool | 0 | 0.0% |
| Kindergarten | 0 | 0.0% |
| Elementary School | 0 | 0.0% |
| Middle School | 0 | 0.0% |
| High School | 0 | 0.0% |
| College / Undergraduate | 0 | 0.0% |
| Graduate / Professional | 0 | 0.0% |
| Total | 0 | 0.0% |
School Enrollment by Age by Funding Source in Las Palomas
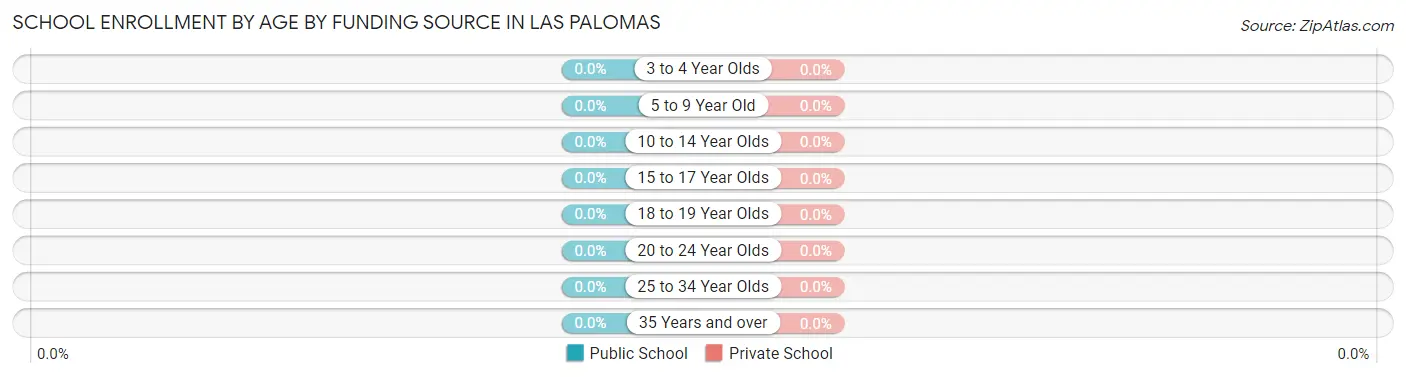
| Age Bracket | Public School | Private School |
| 3 to 4 Year Olds | 0 (0.0%) | 0 (0.0%) |
| 5 to 9 Year Old | 0 (0.0%) | 0 (0.0%) |
| 10 to 14 Year Olds | 0 (0.0%) | 0 (0.0%) |
| 15 to 17 Year Olds | 0 (0.0%) | 0 (0.0%) |
| 18 to 19 Year Olds | 0 (0.0%) | 0 (0.0%) |
| 20 to 24 Year Olds | 0 (0.0%) | 0 (0.0%) |
| 25 to 34 Year Olds | 0 (0.0%) | 0 (0.0%) |
| 35 Years and over | 0 (0.0%) | 0 (0.0%) |
| Total | 0 (0.0%) | 0 (0.0%) |
Educational Attainment by Field of Study in Las Palomas
| Field of Study | # Graduates | % Graduates |
| Computers & Mathematics | 0 | 0.0% |
| Bio, Nature & Agricultural | 0 | 0.0% |
| Physical & Health Sciences | 0 | 0.0% |
| Psychology | 0 | 0.0% |
| Social Sciences | 0 | 0.0% |
| Engineering | 0 | 0.0% |
| Multidisciplinary Studies | 0 | 0.0% |
| Science & Technology | 0 | 0.0% |
| Business | 0 | 0.0% |
| Education | 0 | 0.0% |
| Literature & Languages | 0 | 0.0% |
| Liberal Arts & History | 0 | 0.0% |
| Visual & Performing Arts | 0 | 0.0% |
| Communications | 0 | 0.0% |
| Arts & Humanities | 0 | 0.0% |
| Total | 0 | 0.0% |
Transportation & Commute in Las Palomas
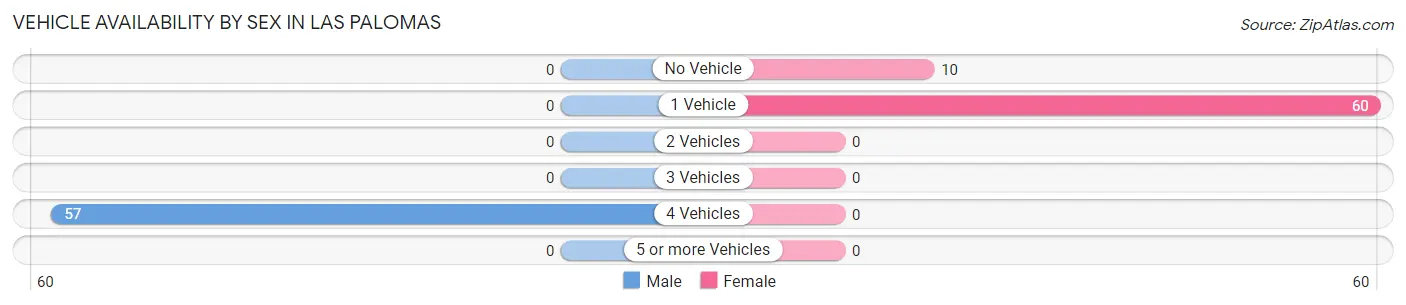
Vehicle Availability by Sex in Las Palomas
The most prevalent vehicle ownership categories in Las Palomas are males with 4 vehicles (57, accounting for 100.0%) and females with 4 vehicles (0, making up 81.4%).
| Vehicles Available | Male | Female |
| No Vehicle | 0 (0.0%) | 10 (14.3%) |
| 1 Vehicle | 0 (0.0%) | 60 (85.7%) |
| 2 Vehicles | 0 (0.0%) | 0 (0.0%) |
| 3 Vehicles | 0 (0.0%) | 0 (0.0%) |
| 4 Vehicles | 57 (100.0%) | 0 (0.0%) |
| 5 or more Vehicles | 0 (0.0%) | 0 (0.0%) |
| Total | 57 (100.0%) | 70 (100.0%) |
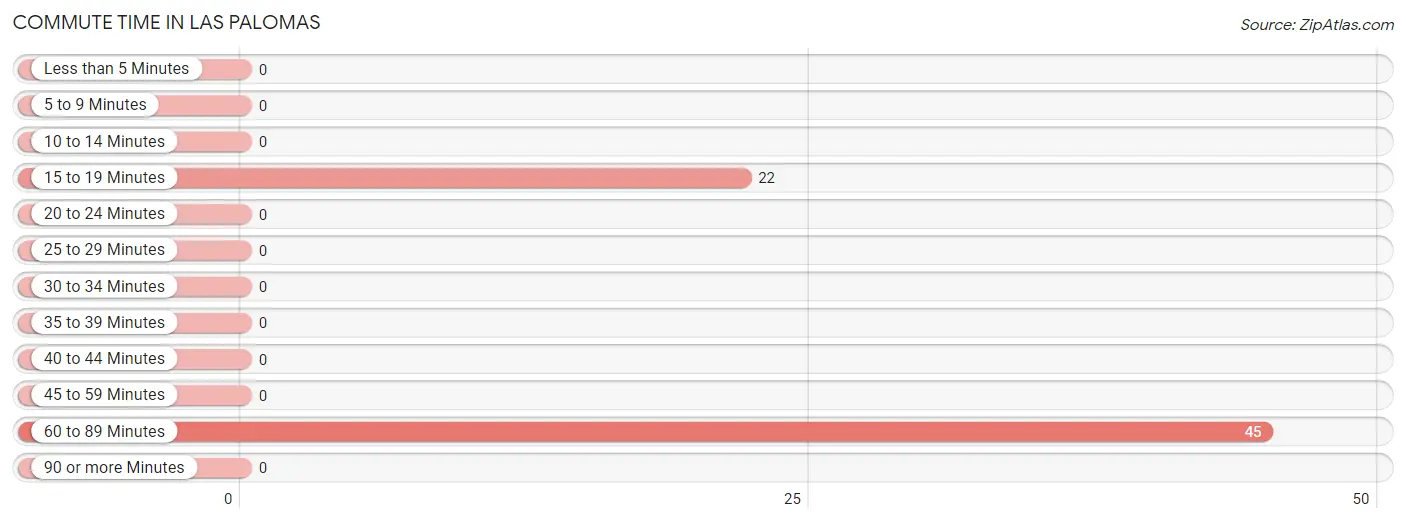
Commute Time in Las Palomas
The most frequently occuring commute durations in Las Palomas are 60 to 89 minutes (45 commuters, 67.2%), 15 to 19 minutes (22 commuters, 32.8%), and less than 5 minutes (0 commuters, 0.0%).
| Commute Time | # Commuters | % Commuters |
| Less than 5 Minutes | 0 | 0.0% |
| 5 to 9 Minutes | 0 | 0.0% |
| 10 to 14 Minutes | 0 | 0.0% |
| 15 to 19 Minutes | 22 | 32.8% |
| 20 to 24 Minutes | 0 | 0.0% |
| 25 to 29 Minutes | 0 | 0.0% |
| 30 to 34 Minutes | 0 | 0.0% |
| 35 to 39 Minutes | 0 | 0.0% |
| 40 to 44 Minutes | 0 | 0.0% |
| 45 to 59 Minutes | 0 | 0.0% |
| 60 to 89 Minutes | 45 | 67.2% |
| 90 or more Minutes | 0 | 0.0% |
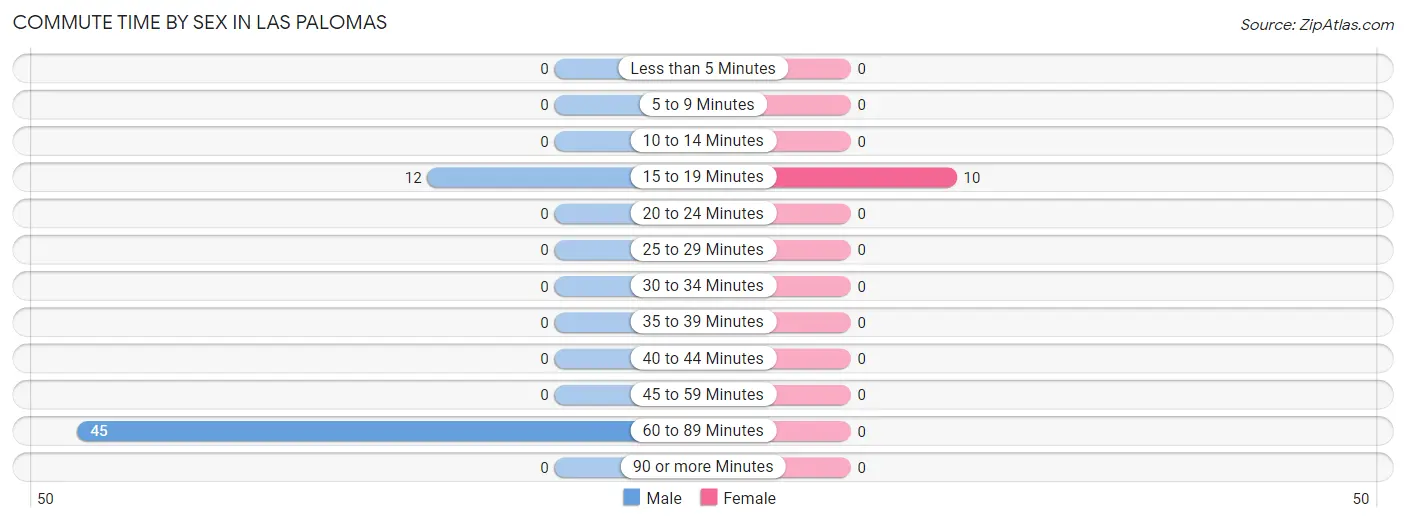
Commute Time by Sex in Las Palomas
The most common commute times in Las Palomas are 60 to 89 minutes (45 commuters, 78.9%) for males and 15 to 19 minutes (10 commuters, 100.0%) for females.
| Commute Time | Male | Female |
| Less than 5 Minutes | 0 (0.0%) | 0 (0.0%) |
| 5 to 9 Minutes | 0 (0.0%) | 0 (0.0%) |
| 10 to 14 Minutes | 0 (0.0%) | 0 (0.0%) |
| 15 to 19 Minutes | 12 (21.0%) | 10 (100.0%) |
| 20 to 24 Minutes | 0 (0.0%) | 0 (0.0%) |
| 25 to 29 Minutes | 0 (0.0%) | 0 (0.0%) |
| 30 to 34 Minutes | 0 (0.0%) | 0 (0.0%) |
| 35 to 39 Minutes | 0 (0.0%) | 0 (0.0%) |
| 40 to 44 Minutes | 0 (0.0%) | 0 (0.0%) |
| 45 to 59 Minutes | 0 (0.0%) | 0 (0.0%) |
| 60 to 89 Minutes | 45 (78.9%) | 0 (0.0%) |
| 90 or more Minutes | 0 (0.0%) | 0 (0.0%) |
Time of Departure to Work by Sex in Las Palomas
The most frequent times of departure to work in Las Palomas are 6:30 AM to 6:59 AM (57, 100.0%) for males and 7:30 AM to 7:59 AM (10, 100.0%) for females.
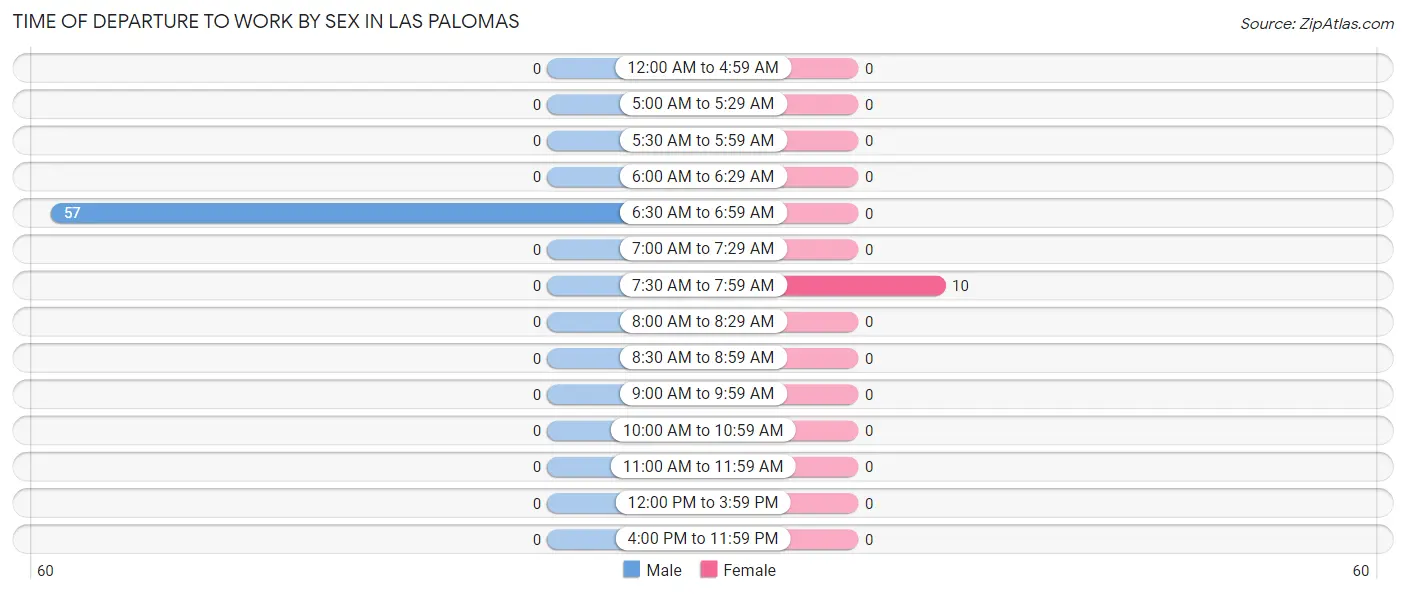
| Time of Departure | Male | Female |
| 12:00 AM to 4:59 AM | 0 (0.0%) | 0 (0.0%) |
| 5:00 AM to 5:29 AM | 0 (0.0%) | 0 (0.0%) |
| 5:30 AM to 5:59 AM | 0 (0.0%) | 0 (0.0%) |
| 6:00 AM to 6:29 AM | 0 (0.0%) | 0 (0.0%) |
| 6:30 AM to 6:59 AM | 57 (100.0%) | 0 (0.0%) |
| 7:00 AM to 7:29 AM | 0 (0.0%) | 0 (0.0%) |
| 7:30 AM to 7:59 AM | 0 (0.0%) | 10 (100.0%) |
| 8:00 AM to 8:29 AM | 0 (0.0%) | 0 (0.0%) |
| 8:30 AM to 8:59 AM | 0 (0.0%) | 0 (0.0%) |
| 9:00 AM to 9:59 AM | 0 (0.0%) | 0 (0.0%) |
| 10:00 AM to 10:59 AM | 0 (0.0%) | 0 (0.0%) |
| 11:00 AM to 11:59 AM | 0 (0.0%) | 0 (0.0%) |
| 12:00 PM to 3:59 PM | 0 (0.0%) | 0 (0.0%) |
| 4:00 PM to 11:59 PM | 0 (0.0%) | 0 (0.0%) |
| Total | 57 (100.0%) | 10 (100.0%) |
Housing Occupancy in Las Palomas
Occupancy by Ownership in Las Palomas
Of the total 122 dwellings in Las Palomas, owner-occupied units account for 122 (100.0%), while renter-occupied units make up 0 (0.0%).
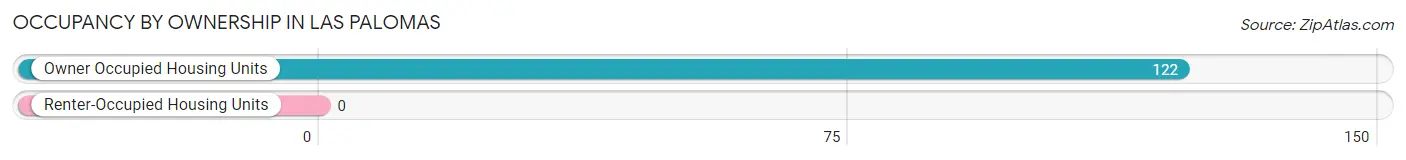
| Occupancy | # Housing Units | % Housing Units |
| Owner Occupied Housing Units | 122 | 100.0% |
| Renter-Occupied Housing Units | 0 | 0.0% |
| Total Occupied Housing Units | 122 | 100.0% |
Occupancy by Household Size in Las Palomas
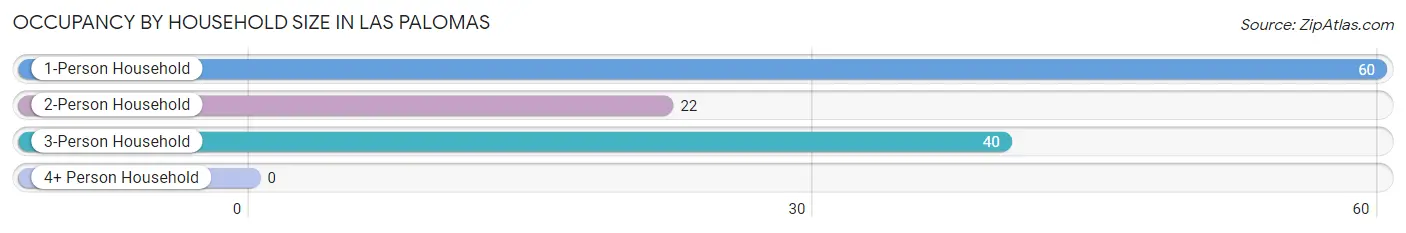
| Household Size | # Housing Units | % Housing Units |
| 1-Person Household | 60 | 49.2% |
| 2-Person Household | 22 | 18.0% |
| 3-Person Household | 40 | 32.8% |
| 4+ Person Household | 0 | 0.0% |
| Total Housing Units | 122 | 100.0% |
Occupancy by Ownership by Household Size in Las Palomas
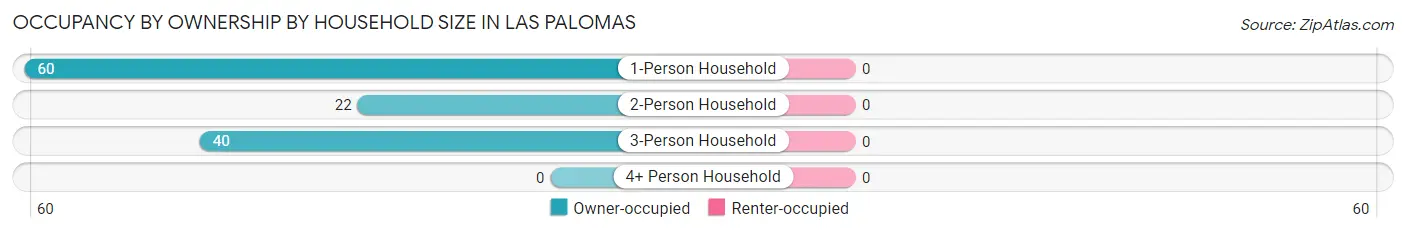
| Household Size | Owner-occupied | Renter-occupied |
| 1-Person Household | 60 (100.0%) | 0 (0.0%) |
| 2-Person Household | 22 (100.0%) | 0 (0.0%) |
| 3-Person Household | 40 (100.0%) | 0 (0.0%) |
| 4+ Person Household | 0 (0.0%) | 0 (0.0%) |
| Total Housing Units | 122 (100.0%) | 0 (0.0%) |
Occupancy by Educational Attainment in Las Palomas
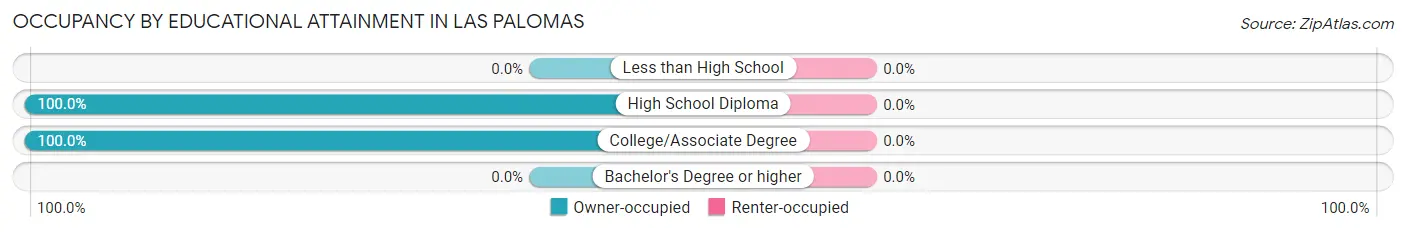
| Household Size | Owner-occupied | Renter-occupied |
| Less than High School | 0 (0.0%) | 0 (0.0%) |
| High School Diploma | 52 (100.0%) | 0 (0.0%) |
| College/Associate Degree | 70 (100.0%) | 0 (0.0%) |
| Bachelor's Degree or higher | 0 (0.0%) | 0 (0.0%) |
Occupancy by Age of Householder in Las Palomas
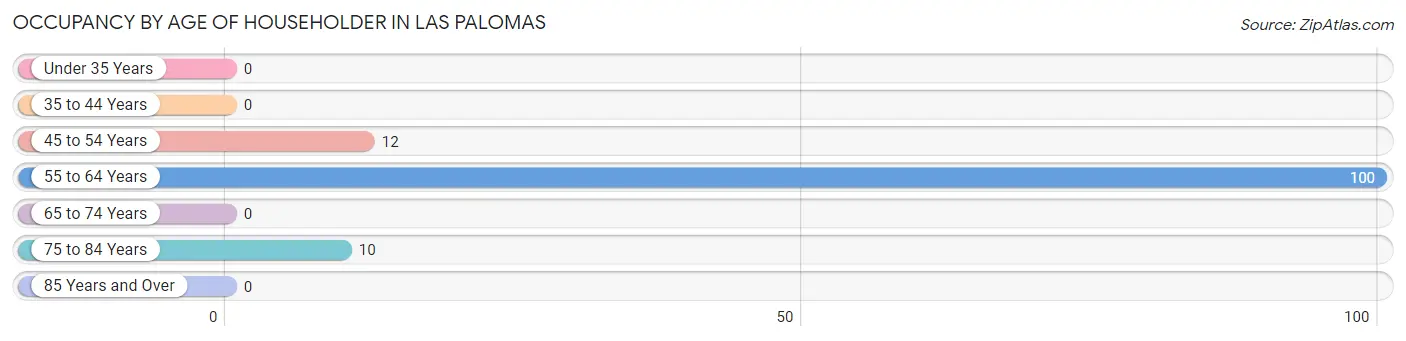
| Age Bracket | # Households | % Households |
| Under 35 Years | 0 | 0.0% |
| 35 to 44 Years | 0 | 0.0% |
| 45 to 54 Years | 12 | 9.8% |
| 55 to 64 Years | 100 | 82.0% |
| 65 to 74 Years | 0 | 0.0% |
| 75 to 84 Years | 10 | 8.2% |
| 85 Years and Over | 0 | 0.0% |
| Total | 122 | 100.0% |
Housing Finances in Las Palomas
Median Income by Occupancy in Las Palomas
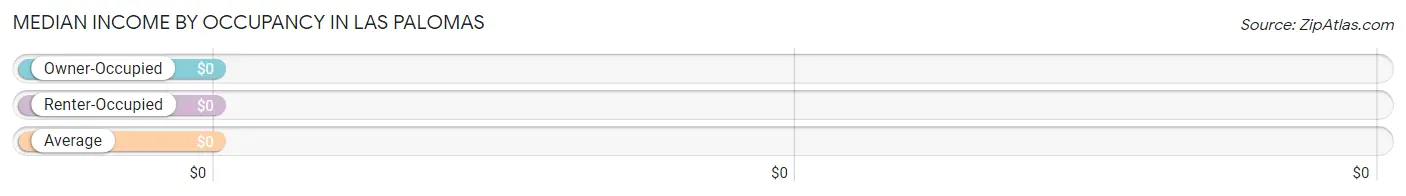
| Occupancy Type | # Households | Median Income |
| Owner-Occupied | 122 (100.0%) | $0 |
| Renter-Occupied | 0 (0.0%) | $0 |
| Average | 122 (100.0%) | $0 |
Occupancy by Householder Income Bracket in Las Palomas
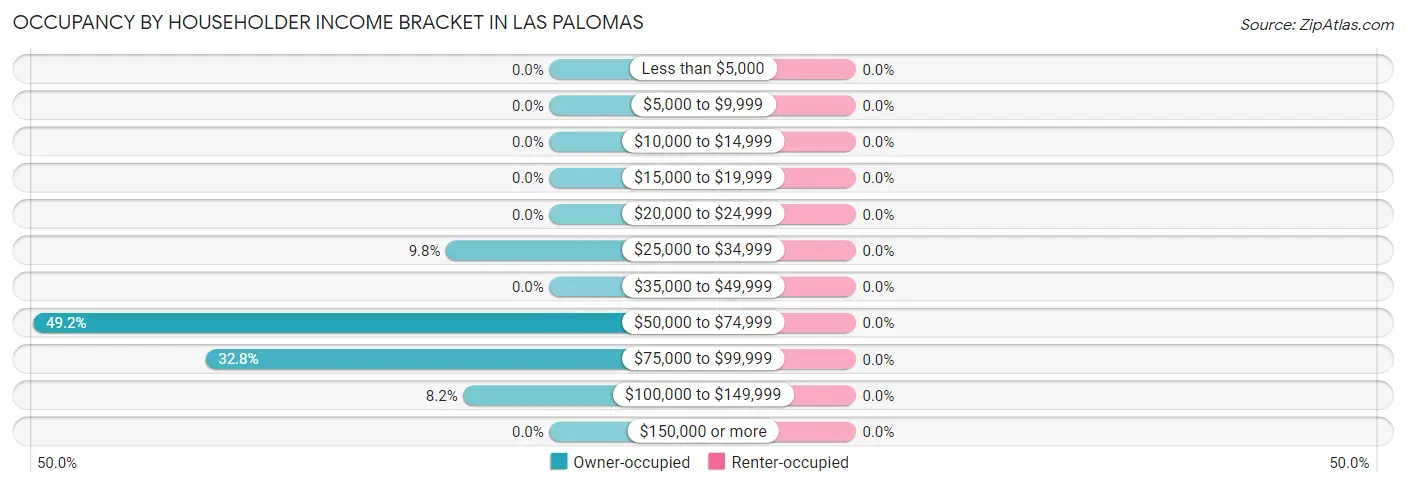
| Income Bracket | Owner-occupied | Renter-occupied |
| Less than $5,000 | 0 (0.0%) | 0 (0.0%) |
| $5,000 to $9,999 | 0 (0.0%) | 0 (0.0%) |
| $10,000 to $14,999 | 0 (0.0%) | 0 (0.0%) |
| $15,000 to $19,999 | 0 (0.0%) | 0 (0.0%) |
| $20,000 to $24,999 | 0 (0.0%) | 0 (0.0%) |
| $25,000 to $34,999 | 12 (9.8%) | 0 (0.0%) |
| $35,000 to $49,999 | 0 (0.0%) | 0 (0.0%) |
| $50,000 to $74,999 | 60 (49.2%) | 0 (0.0%) |
| $75,000 to $99,999 | 40 (32.8%) | 0 (0.0%) |
| $100,000 to $149,999 | 10 (8.2%) | 0 (0.0%) |
| $150,000 or more | 0 (0.0%) | 0 (0.0%) |
| Total | 122 (100.0%) | 0 (0.0%) |
Monthly Housing Cost Tiers in Las Palomas
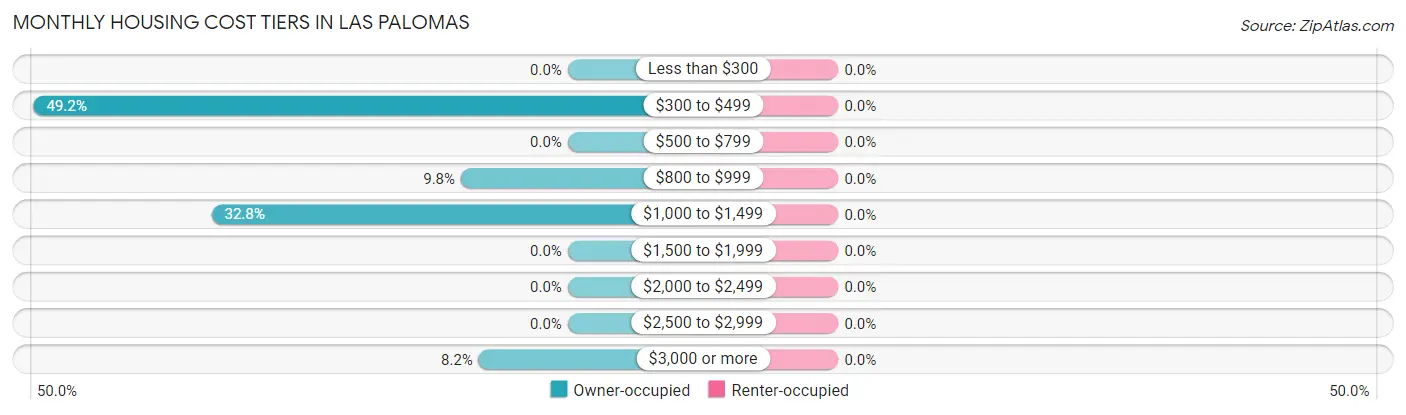
| Monthly Cost | Owner-occupied | Renter-occupied |
| Less than $300 | 0 (0.0%) | 0 (0.0%) |
| $300 to $499 | 60 (49.2%) | 0 (0.0%) |
| $500 to $799 | 0 (0.0%) | 0 (0.0%) |
| $800 to $999 | 12 (9.8%) | 0 (0.0%) |
| $1,000 to $1,499 | 40 (32.8%) | 0 (0.0%) |
| $1,500 to $1,999 | 0 (0.0%) | 0 (0.0%) |
| $2,000 to $2,499 | 0 (0.0%) | 0 (0.0%) |
| $2,500 to $2,999 | 0 (0.0%) | 0 (0.0%) |
| $3,000 or more | 10 (8.2%) | 0 (0.0%) |
| Total | 122 (100.0%) | 0 (0.0%) |
Physical Housing Characteristics in Las Palomas
Housing Structures in Las Palomas
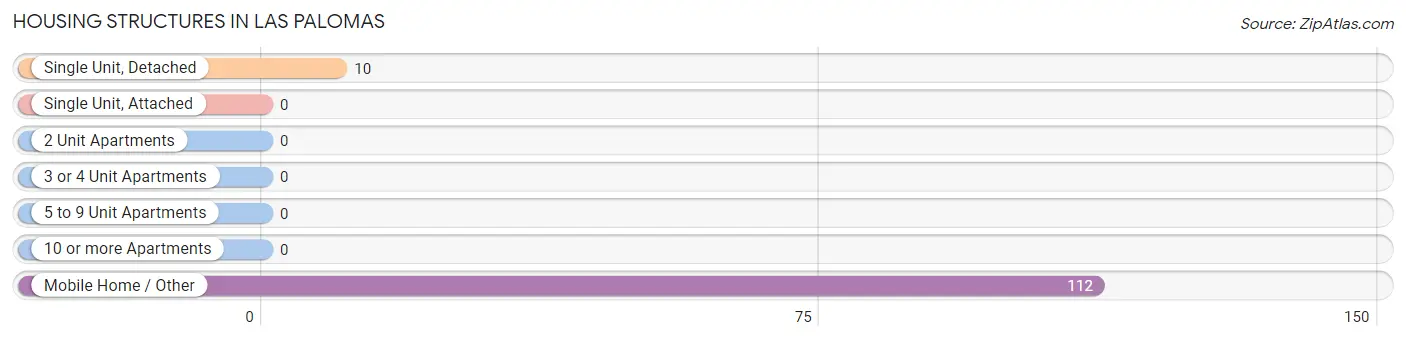
| Structure Type | # Housing Units | % Housing Units |
| Single Unit, Detached | 10 | 8.2% |
| Single Unit, Attached | 0 | 0.0% |
| 2 Unit Apartments | 0 | 0.0% |
| 3 or 4 Unit Apartments | 0 | 0.0% |
| 5 to 9 Unit Apartments | 0 | 0.0% |
| 10 or more Apartments | 0 | 0.0% |
| Mobile Home / Other | 112 | 91.8% |
| Total | 122 | 100.0% |
Housing Structures by Occupancy in Las Palomas
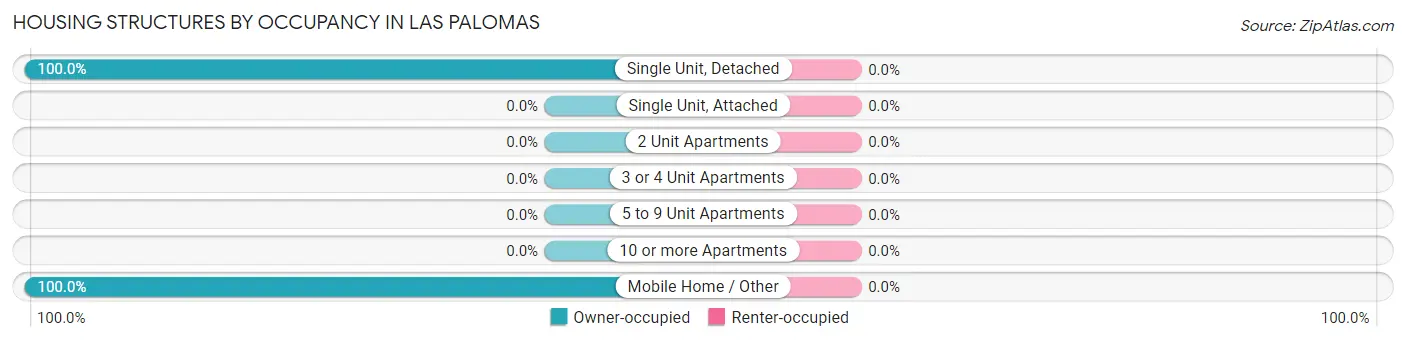
| Structure Type | Owner-occupied | Renter-occupied |
| Single Unit, Detached | 10 (100.0%) | 0 (0.0%) |
| Single Unit, Attached | 0 (0.0%) | 0 (0.0%) |
| 2 Unit Apartments | 0 (0.0%) | 0 (0.0%) |
| 3 or 4 Unit Apartments | 0 (0.0%) | 0 (0.0%) |
| 5 to 9 Unit Apartments | 0 (0.0%) | 0 (0.0%) |
| 10 or more Apartments | 0 (0.0%) | 0 (0.0%) |
| Mobile Home / Other | 112 (100.0%) | 0 (0.0%) |
| Total | 122 (100.0%) | 0 (0.0%) |
Housing Structures by Number of Rooms in Las Palomas
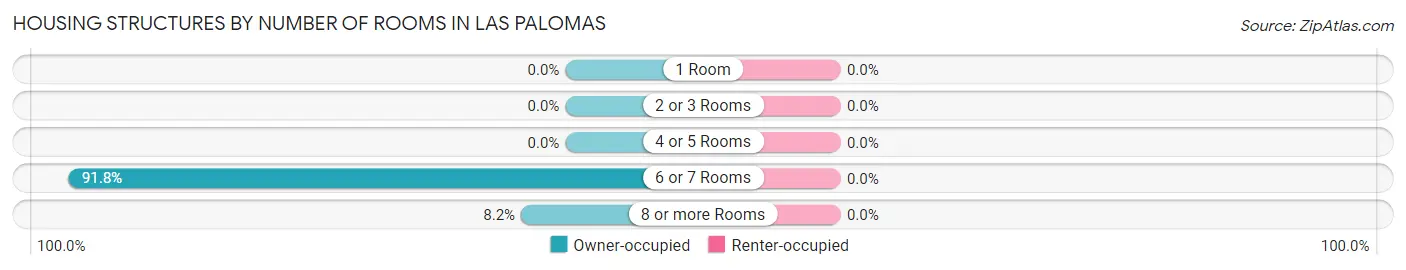
| Number of Rooms | Owner-occupied | Renter-occupied |
| 1 Room | 0 (0.0%) | 0 (0.0%) |
| 2 or 3 Rooms | 0 (0.0%) | 0 (0.0%) |
| 4 or 5 Rooms | 0 (0.0%) | 0 (0.0%) |
| 6 or 7 Rooms | 112 (91.8%) | 0 (0.0%) |
| 8 or more Rooms | 10 (8.2%) | 0 (0.0%) |
| Total | 122 (100.0%) | 0 (0.0%) |
Housing Structure by Heating Type in Las Palomas
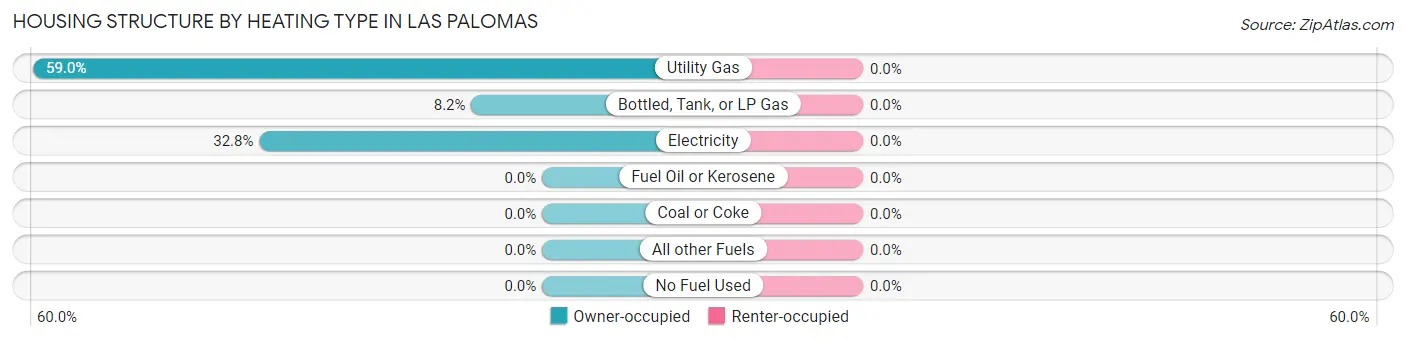
| Heating Type | Owner-occupied | Renter-occupied |
| Utility Gas | 72 (59.0%) | 0 (0.0%) |
| Bottled, Tank, or LP Gas | 10 (8.2%) | 0 (0.0%) |
| Electricity | 40 (32.8%) | 0 (0.0%) |
| Fuel Oil or Kerosene | 0 (0.0%) | 0 (0.0%) |
| Coal or Coke | 0 (0.0%) | 0 (0.0%) |
| All other Fuels | 0 (0.0%) | 0 (0.0%) |
| No Fuel Used | 0 (0.0%) | 0 (0.0%) |
| Total | 122 (100.0%) | 0 (0.0%) |
Household Vehicle Usage in Las Palomas
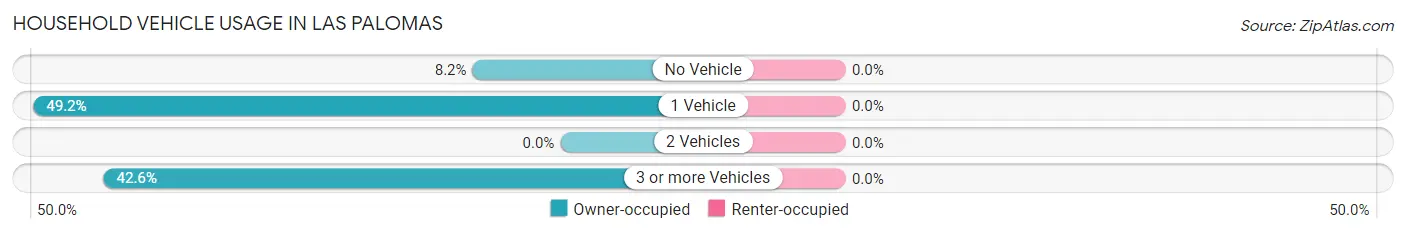
| Vehicles per Household | Owner-occupied | Renter-occupied |
| No Vehicle | 10 (8.2%) | 0 (0.0%) |
| 1 Vehicle | 60 (49.2%) | 0 (0.0%) |
| 2 Vehicles | 0 (0.0%) | 0 (0.0%) |
| 3 or more Vehicles | 52 (42.6%) | 0 (0.0%) |
| Total | 122 (100.0%) | 0 (0.0%) |
Real Estate & Mortgages in Las Palomas
Real Estate and Mortgage Overview in Las Palomas
| Characteristic | Without Mortgage | With Mortgage |
| Housing Units | 60 | 62 |
| Median Property Value | - | - |
| Median Household Income | - | - |
| Monthly Housing Costs | - | - |
| Real Estate Taxes | - | - |
Property Value by Mortgage Status in Las Palomas
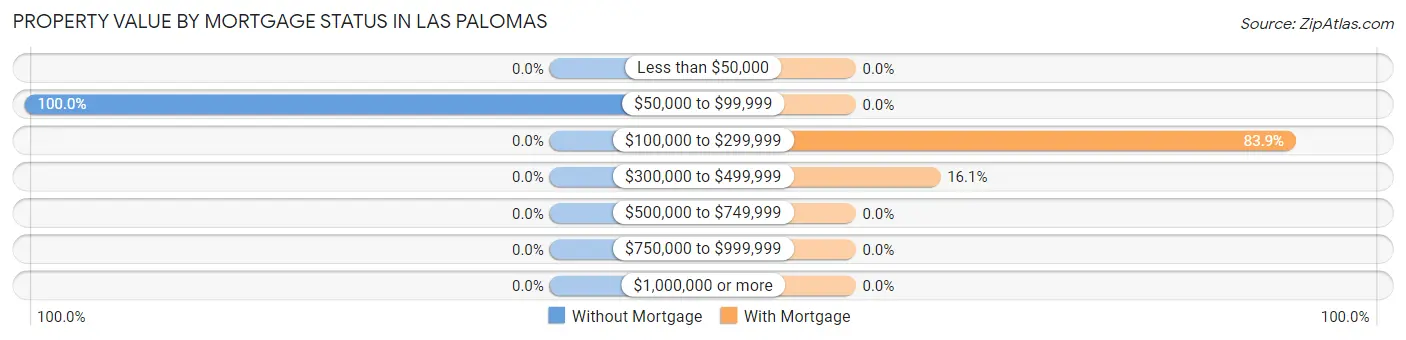
| Property Value | Without Mortgage | With Mortgage |
| Less than $50,000 | 0 (0.0%) | 0 (0.0%) |
| $50,000 to $99,999 | 60 (100.0%) | 0 (0.0%) |
| $100,000 to $299,999 | 0 (0.0%) | 52 (83.9%) |
| $300,000 to $499,999 | 0 (0.0%) | 10 (16.1%) |
| $500,000 to $749,999 | 0 (0.0%) | 0 (0.0%) |
| $750,000 to $999,999 | 0 (0.0%) | 0 (0.0%) |
| $1,000,000 or more | 0 (0.0%) | 0 (0.0%) |
| Total | 60 (100.0%) | 62 (100.0%) |
Household Income by Mortgage Status in Las Palomas
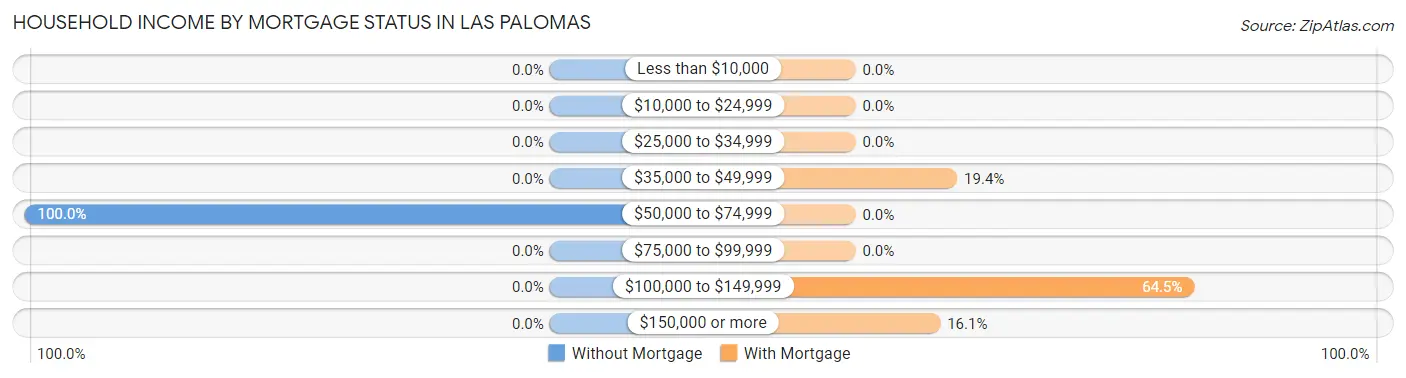
| Household Income | Without Mortgage | With Mortgage |
| Less than $10,000 | 0 (0.0%) | 0 (0.0%) |
| $10,000 to $24,999 | 0 (0.0%) | 0 (0.0%) |
| $25,000 to $34,999 | 0 (0.0%) | 0 (0.0%) |
| $35,000 to $49,999 | 0 (0.0%) | 12 (19.4%) |
| $50,000 to $74,999 | 60 (100.0%) | 0 (0.0%) |
| $75,000 to $99,999 | 0 (0.0%) | 0 (0.0%) |
| $100,000 to $149,999 | 0 (0.0%) | 40 (64.5%) |
| $150,000 or more | 0 (0.0%) | 10 (16.1%) |
| Total | 60 (100.0%) | 62 (100.0%) |
Property Value to Household Income Ratio in Las Palomas
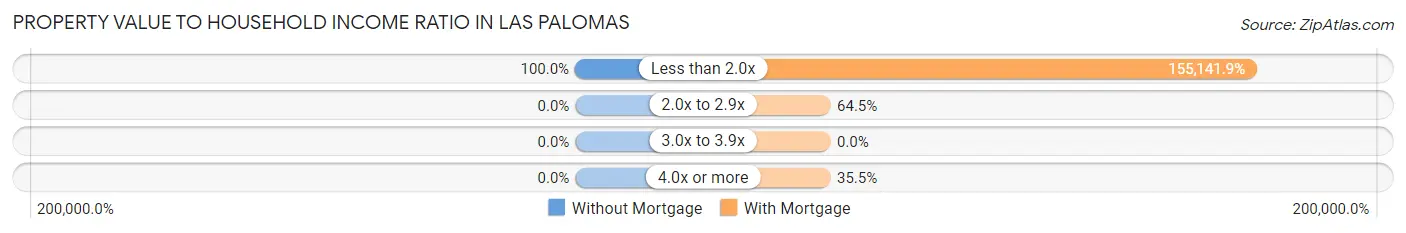
| Value-to-Income Ratio | Without Mortgage | With Mortgage |
| Less than 2.0x | 60 (100.0%) | 96,188 (155,141.9%) |
| 2.0x to 2.9x | 0 (0.0%) | 40 (64.5%) |
| 3.0x to 3.9x | 0 (0.0%) | 0 (0.0%) |
| 4.0x or more | 0 (0.0%) | 22 (35.5%) |
| Total | 60 (100.0%) | 62 (100.0%) |
Real Estate Taxes by Mortgage Status in Las Palomas
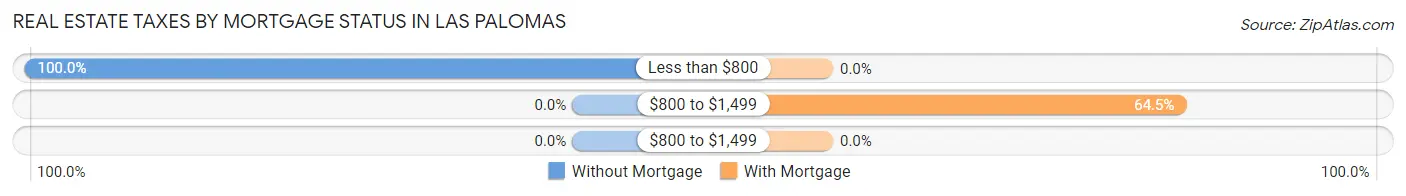
| Property Taxes | Without Mortgage | With Mortgage |
| Less than $800 | 60 (100.0%) | 0 (0.0%) |
| $800 to $1,499 | 0 (0.0%) | 40 (64.5%) |
| $800 to $1,499 | 0 (0.0%) | 0 (0.0%) |
| Total | 60 (100.0%) | 62 (100.0%) |
Health & Disability in Las Palomas
Health Insurance Coverage by Age in Las Palomas
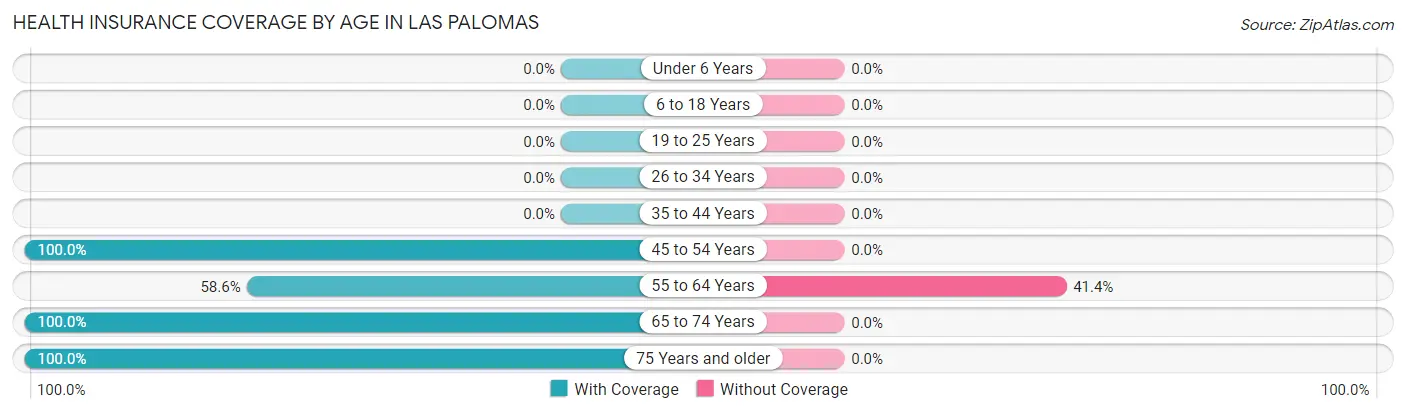
| Age Bracket | With Coverage | Without Coverage |
| Under 6 Years | 0 (0.0%) | 0 (0.0%) |
| 6 to 18 Years | 0 (0.0%) | 0 (0.0%) |
| 19 to 25 Years | 0 (0.0%) | 0 (0.0%) |
| 26 to 34 Years | 0 (0.0%) | 0 (0.0%) |
| 35 to 44 Years | 0 (0.0%) | 0 (0.0%) |
| 45 to 54 Years | 29 (100.0%) | 0 (0.0%) |
| 55 to 64 Years | 85 (58.6%) | 60 (41.4%) |
| 65 to 74 Years | 16 (100.0%) | 0 (0.0%) |
| 75 Years and older | 98 (100.0%) | 0 (0.0%) |
| Total | 228 (79.2%) | 60 (20.8%) |
Health Insurance Coverage by Citizenship Status in Las Palomas
| Citizenship Status | With Coverage | Without Coverage |
| Native Born | 0 (0.0%) | 0 (0.0%) |
| Foreign Born, Citizen | 0 (0.0%) | 0 (0.0%) |
| Foreign Born, not a Citizen | 0 (0.0%) | 0 (0.0%) |
Health Insurance Coverage by Household Income in Las Palomas
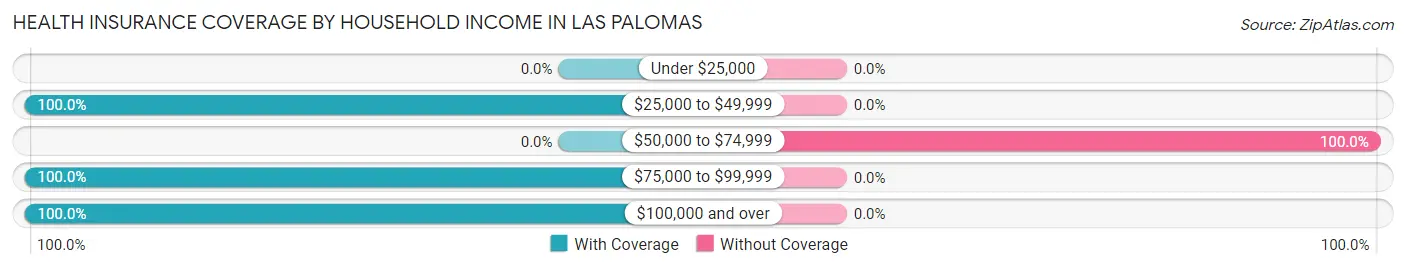
| Household Income | With Coverage | Without Coverage |
| Under $25,000 | 0 (0.0%) | 0 (0.0%) |
| $25,000 to $49,999 | 29 (100.0%) | 0 (0.0%) |
| $50,000 to $74,999 | 0 (0.0%) | 60 (100.0%) |
| $75,000 to $99,999 | 173 (100.0%) | 0 (0.0%) |
| $100,000 and over | 26 (100.0%) | 0 (0.0%) |
Public vs Private Health Insurance Coverage by Age in Las Palomas
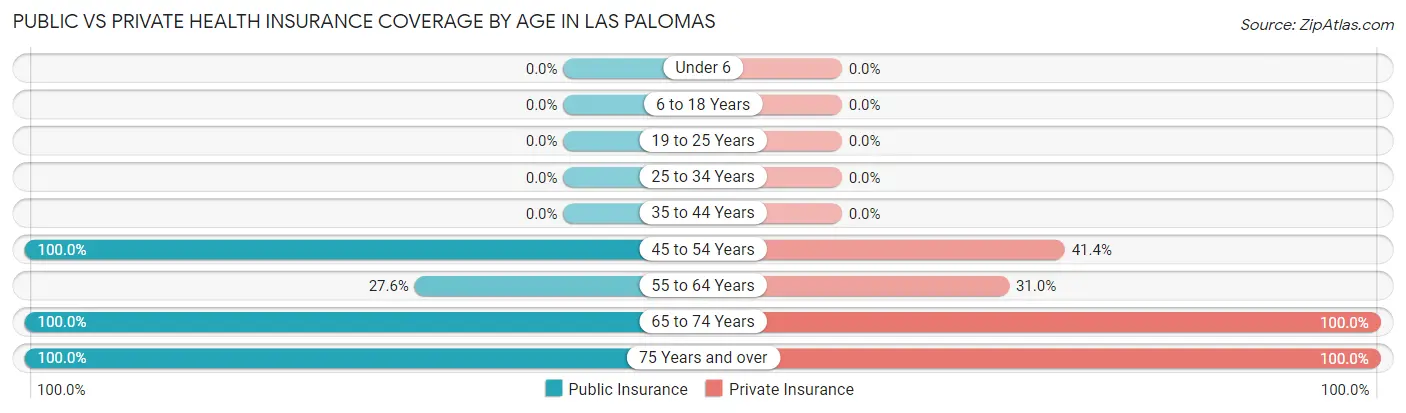
| Age Bracket | Public Insurance | Private Insurance |
| Under 6 | 0 (0.0%) | 0 (0.0%) |
| 6 to 18 Years | 0 (0.0%) | 0 (0.0%) |
| 19 to 25 Years | 0 (0.0%) | 0 (0.0%) |
| 25 to 34 Years | 0 (0.0%) | 0 (0.0%) |
| 35 to 44 Years | 0 (0.0%) | 0 (0.0%) |
| 45 to 54 Years | 29 (100.0%) | 12 (41.4%) |
| 55 to 64 Years | 40 (27.6%) | 45 (31.0%) |
| 65 to 74 Years | 16 (100.0%) | 16 (100.0%) |
| 75 Years and over | 98 (100.0%) | 98 (100.0%) |
| Total | 183 (63.5%) | 171 (59.4%) |
Disability Status by Sex by Age in Las Palomas
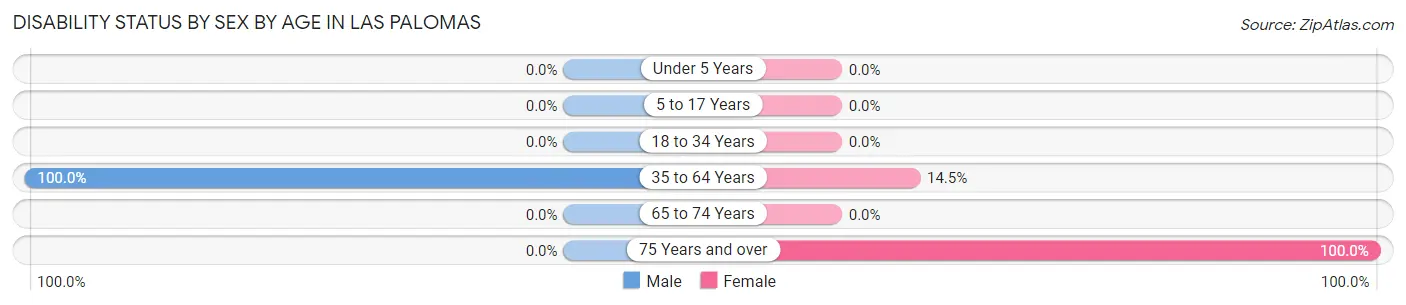
| Age Bracket | Male | Female |
| Under 5 Years | 0 (0.0%) | 0 (0.0%) |
| 5 to 17 Years | 0 (0.0%) | 0 (0.0%) |
| 18 to 34 Years | 0 (0.0%) | 0 (0.0%) |
| 35 to 64 Years | 57 (100.0%) | 17 (14.5%) |
| 65 to 74 Years | 0 (0.0%) | 0 (0.0%) |
| 75 Years and over | 0 (0.0%) | 98 (100.0%) |
Disability Class by Sex by Age in Las Palomas
Disability Class: Hearing Difficulty
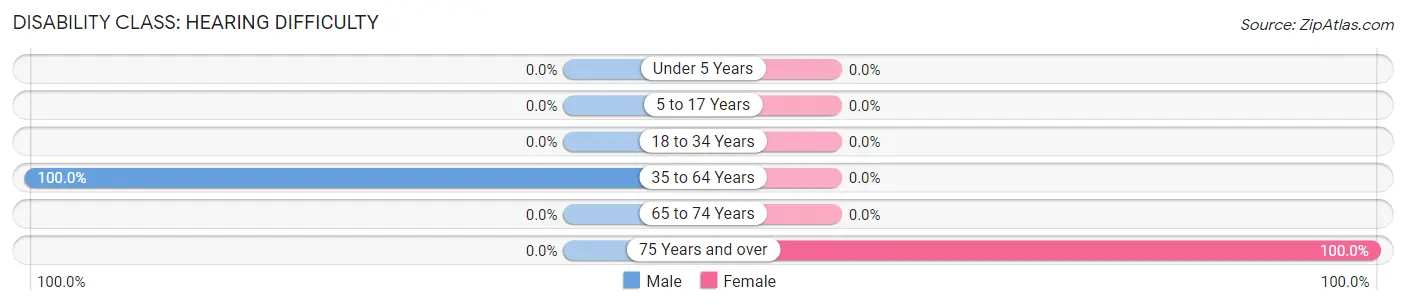
| Age Bracket | Male | Female |
| Under 5 Years | 0 (0.0%) | 0 (0.0%) |
| 5 to 17 Years | 0 (0.0%) | 0 (0.0%) |
| 18 to 34 Years | 0 (0.0%) | 0 (0.0%) |
| 35 to 64 Years | 57 (100.0%) | 0 (0.0%) |
| 65 to 74 Years | 0 (0.0%) | 0 (0.0%) |
| 75 Years and over | 0 (0.0%) | 98 (100.0%) |
Disability Class: Vision Difficulty
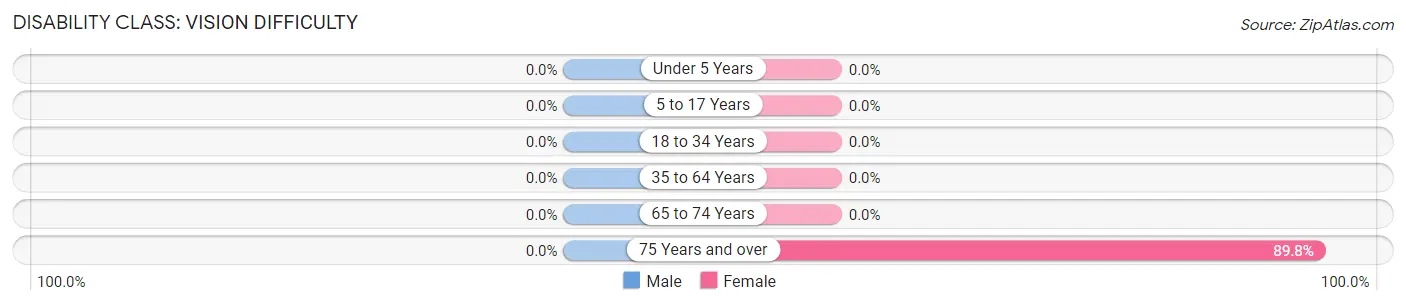
| Age Bracket | Male | Female |
| Under 5 Years | 0 (0.0%) | 0 (0.0%) |
| 5 to 17 Years | 0 (0.0%) | 0 (0.0%) |
| 18 to 34 Years | 0 (0.0%) | 0 (0.0%) |
| 35 to 64 Years | 0 (0.0%) | 0 (0.0%) |
| 65 to 74 Years | 0 (0.0%) | 0 (0.0%) |
| 75 Years and over | 0 (0.0%) | 88 (89.8%) |
Disability Class: Cognitive Difficulty
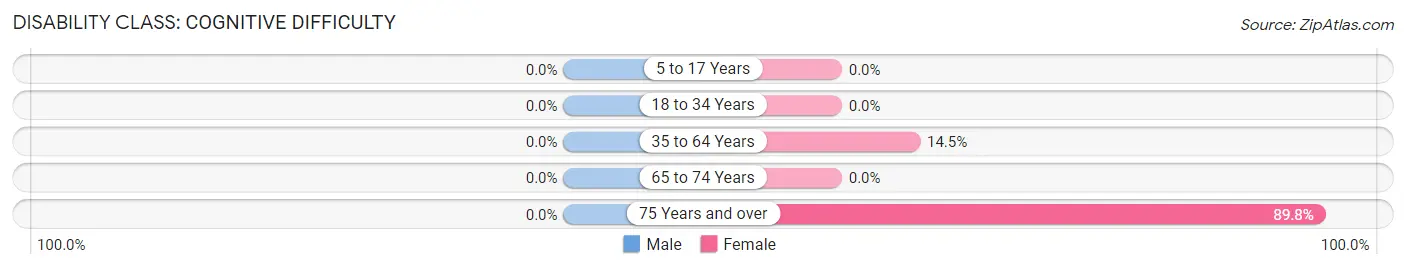
| Age Bracket | Male | Female |
| 5 to 17 Years | 0 (0.0%) | 0 (0.0%) |
| 18 to 34 Years | 0 (0.0%) | 0 (0.0%) |
| 35 to 64 Years | 0 (0.0%) | 17 (14.5%) |
| 65 to 74 Years | 0 (0.0%) | 0 (0.0%) |
| 75 Years and over | 0 (0.0%) | 88 (89.8%) |
Disability Class: Ambulatory Difficulty
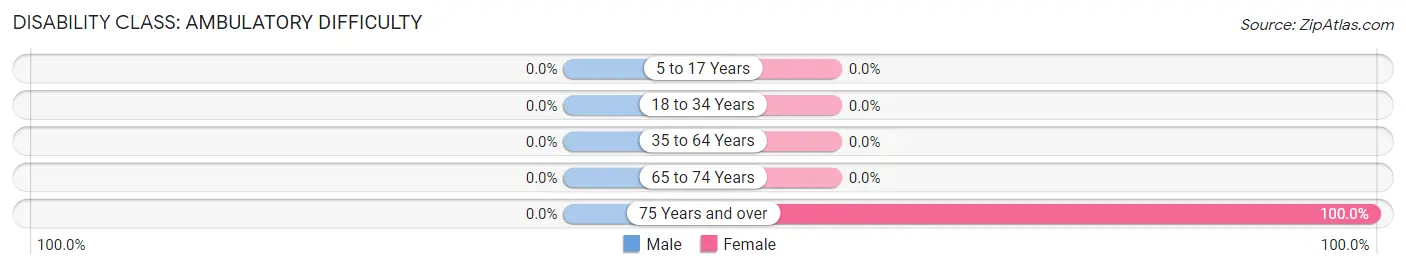
| Age Bracket | Male | Female |
| 5 to 17 Years | 0 (0.0%) | 0 (0.0%) |
| 18 to 34 Years | 0 (0.0%) | 0 (0.0%) |
| 35 to 64 Years | 0 (0.0%) | 0 (0.0%) |
| 65 to 74 Years | 0 (0.0%) | 0 (0.0%) |
| 75 Years and over | 0 (0.0%) | 98 (100.0%) |
Disability Class: Self-Care Difficulty
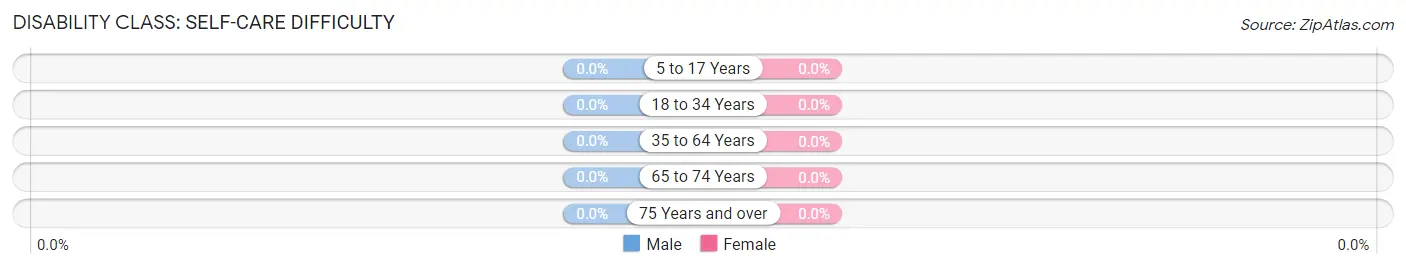
| Age Bracket | Male | Female |
| 5 to 17 Years | 0 (0.0%) | 0 (0.0%) |
| 18 to 34 Years | 0 (0.0%) | 0 (0.0%) |
| 35 to 64 Years | 0 (0.0%) | 0 (0.0%) |
| 65 to 74 Years | 0 (0.0%) | 0 (0.0%) |
| 75 Years and over | 0 (0.0%) | 0 (0.0%) |
Technology Access in Las Palomas
Computing Device Access in Las Palomas
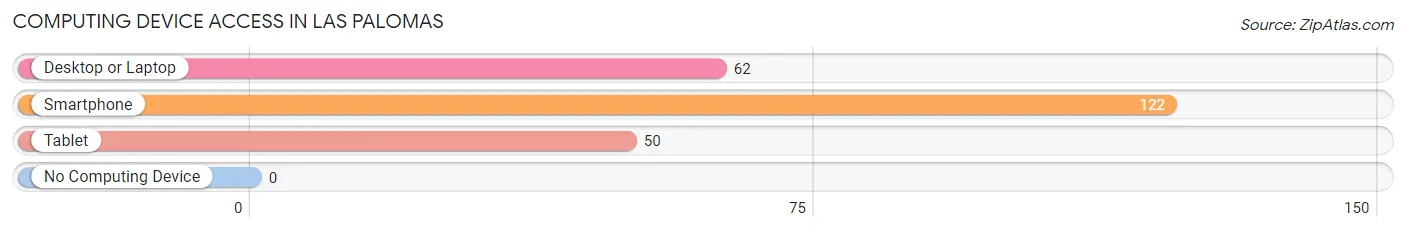
| Device Type | # Households | % Households |
| Desktop or Laptop | 62 | 50.8% |
| Smartphone | 122 | 100.0% |
| Tablet | 50 | 41.0% |
| No Computing Device | 0 | 0.0% |
| Total | 122 | 100.0% |
Internet Access in Las Palomas
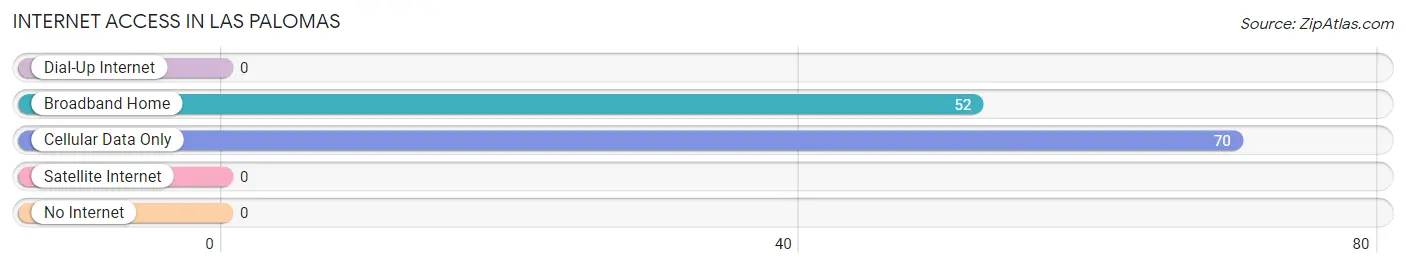
| Internet Type | # Households | % Households |
| Dial-Up Internet | 0 | 0.0% |
| Broadband Home | 52 | 42.6% |
| Cellular Data Only | 70 | 57.4% |
| Satellite Internet | 0 | 0.0% |
| No Internet | 0 | 0.0% |
| Total | 122 | 100.0% |
Las Palomas Summary
Palomas, New Mexico is a small unincorporated community located in the Chihuahuan Desert of the United States. It is situated in the extreme southwestern corner of the state, just north of the Mexican border. The town is located in the county of Luna, and is part of the Deming Micropolitan Statistical Area. As of the 2010 census, the population of Palomas was 1,037.
History
The area that is now Palomas was originally inhabited by the Mescalero Apache, who were later displaced by the Spanish in the late 1700s. The area was then settled by Mexican ranchers, who established the town of Palomas in the late 1800s. The town was named after the Palomino horses that were raised in the area.
In the early 1900s, Palomas became a popular destination for American tourists, who were drawn to the area by its warm climate and proximity to the Mexican border. The town was also a popular destination for smugglers, who used the area to transport illegal goods across the border.
In the mid-1900s, Palomas began to experience a period of economic growth, as the town became a popular destination for Mexican immigrants seeking work in the United States. The town also became a popular destination for American tourists, who were drawn to the area by its warm climate and proximity to the Mexican border.
Geography
Palomas is located in the extreme southwestern corner of New Mexico, just north of the Mexican border. The town is situated in the Chihuahuan Desert, and is surrounded by the San Andres Mountains to the east and the Sierra de Juarez to the west. The town is located at an elevation of 4,000 feet, and has a total area of 0.7 square miles.
The climate in Palomas is arid and semi-arid, with hot summers and mild winters. The average annual temperature is 68°F, and the average annual precipitation is 8.5 inches.
Economy
The economy of Palomas is largely based on agriculture and tourism. The town is home to several farms and ranches, which produce a variety of crops, including alfalfa, cotton, and pecans. The town is also a popular destination for tourists, who are drawn to the area by its warm climate and proximity to the Mexican border.
The town is also home to several small businesses, including restaurants, grocery stores, and gas stations. The town is also home to a small manufacturing plant, which produces a variety of products, including furniture and clothing.
Demographics
As of the 2010 census, the population of Palomas was 1,037. The racial makeup of the town was 94.3% Hispanic or Latino, 4.2% White, 0.3% Native American, and 0.2% Asian. The median household income was $20,938, and the median family income was $25,000. The per capita income was $10,938.
Conclusion
Palomas, New Mexico is a small unincorporated community located in the Chihuahuan Desert of the United States. It is situated in the extreme southwestern corner of the state, just north of the Mexican border. The town is home to several farms and ranches, which produce a variety of crops, and is also a popular destination for tourists, who are drawn to the area by its warm climate and proximity to the Mexican border. As of the 2010 census, the population of Palomas was 1,037, and the median household income was $20,938.
Common Questions
What is Per Capita Income in Las Palomas?
Per Capita income in Las Palomas is $35,290.
What is the Median Family Income in Las Palomas?
Median Family Income in Las Palomas is $96,188.
What is Inequality or Gini Index in Las Palomas?
Inequality or Gini Index in Las Palomas is 0.19.
What is the Total Population of Las Palomas?
Total Population of Las Palomas is 288.
What is the Total Male Population of Las Palomas?
Total Male Population of Las Palomas is 73.
What is the Total Female Population of Las Palomas?
Total Female Population of Las Palomas is 215.
What is the Ratio of Males per 100 Females in Las Palomas?
There are 33.95 Males per 100 Females in Las Palomas.
What is the Ratio of Females per 100 Males in Las Palomas?
There are 294.52 Females per 100 Males in Las Palomas.
What is the Median Population Age in Las Palomas?
Median Population Age in Las Palomas is 63.3 Years.
What is the Average Family Size in Las Palomas
Average Family Size in Las Palomas is 3.7 People.
What is the Average Household Size in Las Palomas
Average Household Size in Las Palomas is 2.4 People.
How Large is the Labor Force in Las Palomas?
There are 127 People in the Labor Forcein in Las Palomas.
What is the Percentage of People in the Labor Force in Las Palomas?
44.1% of People are in the Labor Force in Las Palomas.