Bolt, WV Map & Demographics
Bolt Map
Bolt Overview
$29,879
PER CAPITA INCOME
$66,020
AVG FAMILY INCOME
$66,020
AVG HOUSEHOLD INCOME
0.10
INEQUALITY / GINI INDEX
256
TOTAL POPULATION
150
MALE POPULATION
106
FEMALE POPULATION
141.51
MALES / 100 FEMALES
70.67
FEMALES / 100 MALES
65.6
MEDIAN AGE
2.5
AVG FAMILY SIZE
2.5
AVG HOUSEHOLD SIZE
41
LABOR FORCE [ PEOPLE ]
17.9%
PERCENT IN LABOR FORCE
Bolt Zip Codes
Bolt Area Codes
Income in Bolt
Income Overview in Bolt
Per Capita Income in Bolt is $29,879, while median incomes of families and households are $66,020 and $66,020 respectively.
| Characteristic | Number | Measure |
| Per Capita Income | 256 | $29,879 |
| Median Family Income | 102 | $66,020 |
| Mean Family Income | 102 | $74,077 |
| Median Household Income | 102 | $66,020 |
| Mean Household Income | 102 | $74,077 |
| Income Deficit | 102 | $0 |
| Wage / Income Gap (%) | 256 | 0.00% |
| Wage / Income Gap ($) | 256 | 100.00¢ per $1 |
| Gini / Inequality Index | 256 | 0.10 |
Earnings by Sex in Bolt
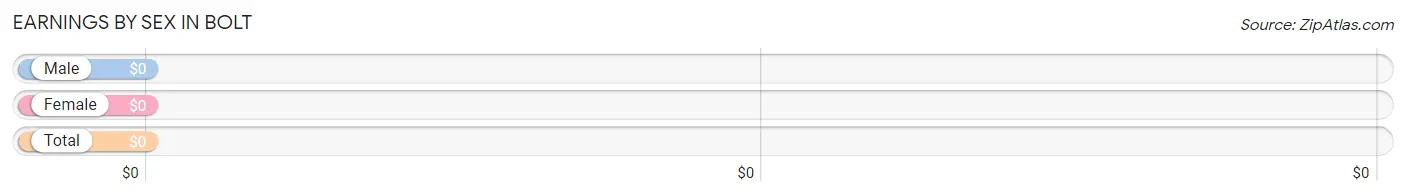
| Sex | Number | Average Earnings |
| Male | 22 (53.7%) | $0 |
| Female | 19 (46.3%) | $0 |
| Total | 41 (100.0%) | $0 |
Earnings by Sex by Income Bracket in Bolt
The most common earnings brackets in Bolt are $75,000 to $99,999 for men (22 | 100.0%) and $10,000 to $12,499 for women (19 | 100.0%).
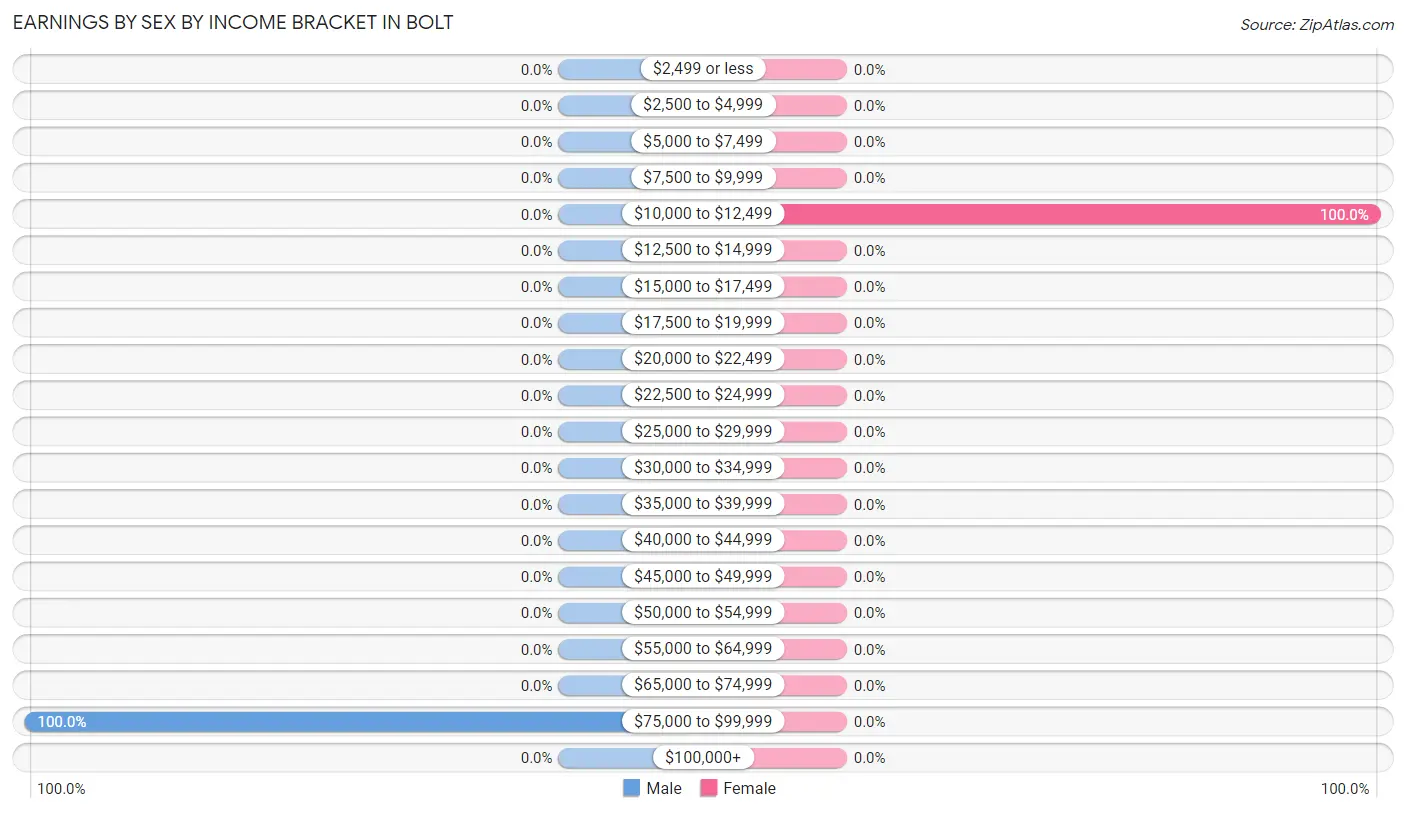
| Income | Male | Female |
| $2,499 or less | 0 (0.0%) | 0 (0.0%) |
| $2,500 to $4,999 | 0 (0.0%) | 0 (0.0%) |
| $5,000 to $7,499 | 0 (0.0%) | 0 (0.0%) |
| $7,500 to $9,999 | 0 (0.0%) | 0 (0.0%) |
| $10,000 to $12,499 | 0 (0.0%) | 19 (100.0%) |
| $12,500 to $14,999 | 0 (0.0%) | 0 (0.0%) |
| $15,000 to $17,499 | 0 (0.0%) | 0 (0.0%) |
| $17,500 to $19,999 | 0 (0.0%) | 0 (0.0%) |
| $20,000 to $22,499 | 0 (0.0%) | 0 (0.0%) |
| $22,500 to $24,999 | 0 (0.0%) | 0 (0.0%) |
| $25,000 to $29,999 | 0 (0.0%) | 0 (0.0%) |
| $30,000 to $34,999 | 0 (0.0%) | 0 (0.0%) |
| $35,000 to $39,999 | 0 (0.0%) | 0 (0.0%) |
| $40,000 to $44,999 | 0 (0.0%) | 0 (0.0%) |
| $45,000 to $49,999 | 0 (0.0%) | 0 (0.0%) |
| $50,000 to $54,999 | 0 (0.0%) | 0 (0.0%) |
| $55,000 to $64,999 | 0 (0.0%) | 0 (0.0%) |
| $65,000 to $74,999 | 0 (0.0%) | 0 (0.0%) |
| $75,000 to $99,999 | 22 (100.0%) | 0 (0.0%) |
| $100,000+ | 0 (0.0%) | 0 (0.0%) |
| Total | 22 (100.0%) | 19 (100.0%) |
Earnings by Sex by Educational Attainment in Bolt
| Educational Attainment | Male Income | Female Income |
| Less than High School | - | - |
| High School Diploma | - | - |
| College or Associate's Degree | - | - |
| Bachelor's Degree | - | - |
| Graduate Degree | - | - |
| Total | - | - |
Family Income in Bolt
Family Income Brackets in Bolt
According to the Bolt family income data, there are 80 families falling into the $50,000 to $74,999 income range, which is the most common income bracket and makes up 78.4% of all families.
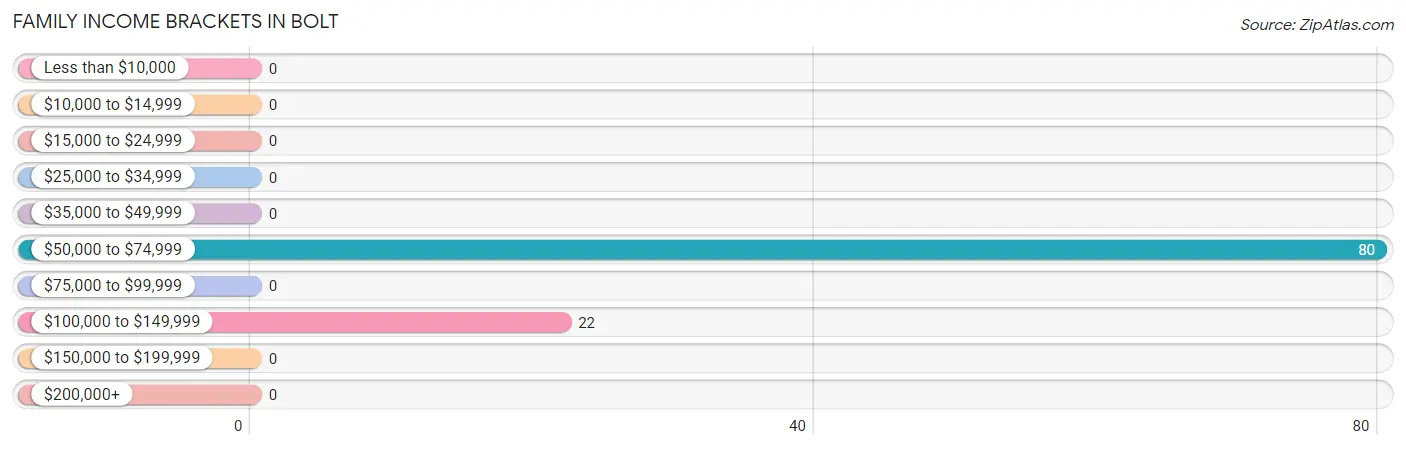
| Income Bracket | # Families | % Families |
| Less than $10,000 | 0 | 0.0% |
| $10,000 to $14,999 | 0 | 0.0% |
| $15,000 to $24,999 | 0 | 0.0% |
| $25,000 to $34,999 | 0 | 0.0% |
| $35,000 to $49,999 | 0 | 0.0% |
| $50,000 to $74,999 | 80 | 78.4% |
| $75,000 to $99,999 | 0 | 0.0% |
| $100,000 to $149,999 | 22 | 21.6% |
| $150,000 to $199,999 | 0 | 0.0% |
| $200,000+ | 0 | 0.0% |
Family Income by Famaliy Size in Bolt
| Income Bracket | # Families | Median Income |
| 2-Person Families | 49 (48.0%) | $0 |
| 3-Person Families | 53 (52.0%) | $0 |
| 4-Person Families | 0 (0.0%) | $0 |
| 5-Person Families | 0 (0.0%) | $0 |
| 6-Person Families | 0 (0.0%) | $0 |
| 7+ Person Families | 0 (0.0%) | $0 |
| Total | 102 (100.0%) | $66,020 |
Family Income by Number of Earners in Bolt
| Number of Earners | # Families | Median Income |
| No Earners | 80 (78.4%) | $0 |
| 1 Earner | 0 (0.0%) | $0 |
| 2 Earners | 22 (21.6%) | $0 |
| 3+ Earners | 0 (0.0%) | $0 |
| Total | 102 (100.0%) | $66,020 |
Household Income in Bolt
Household Income Brackets in Bolt
With 80 households falling in the category, the $50,000 to $74,999 income range is the most frequent in Bolt, accounting for 78.4% of all households.
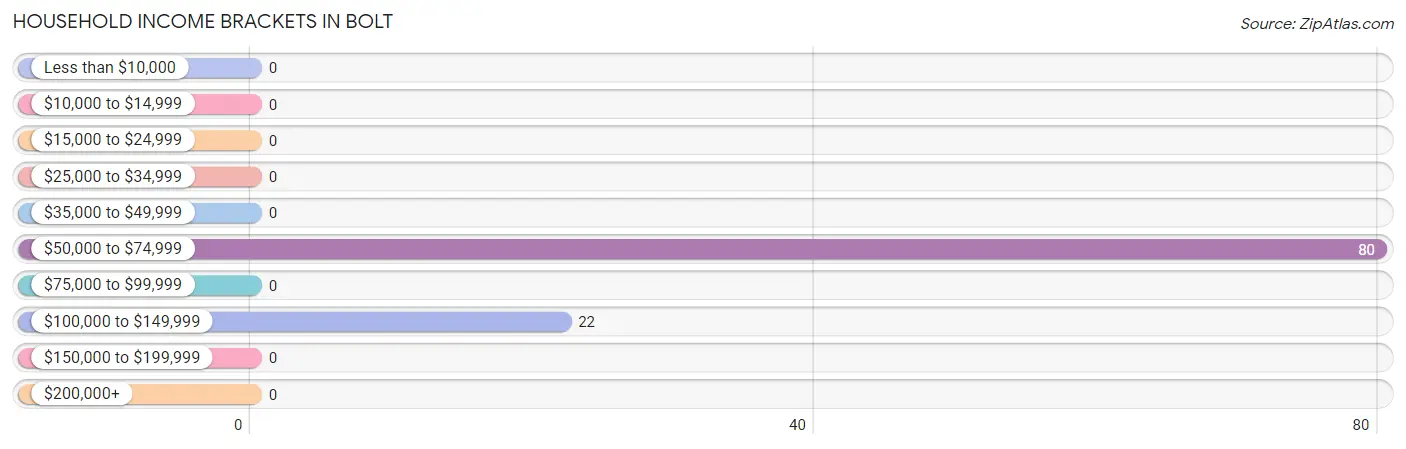
| Income Bracket | # Households | % Households |
| Less than $10,000 | 0 | 0.0% |
| $10,000 to $14,999 | 0 | 0.0% |
| $15,000 to $24,999 | 0 | 0.0% |
| $25,000 to $34,999 | 0 | 0.0% |
| $35,000 to $49,999 | 0 | 0.0% |
| $50,000 to $74,999 | 80 | 78.4% |
| $75,000 to $99,999 | 0 | 0.0% |
| $100,000 to $149,999 | 22 | 21.6% |
| $150,000 to $199,999 | 0 | 0.0% |
| $200,000+ | 0 | 0.0% |
Household Income by Householder Age in Bolt
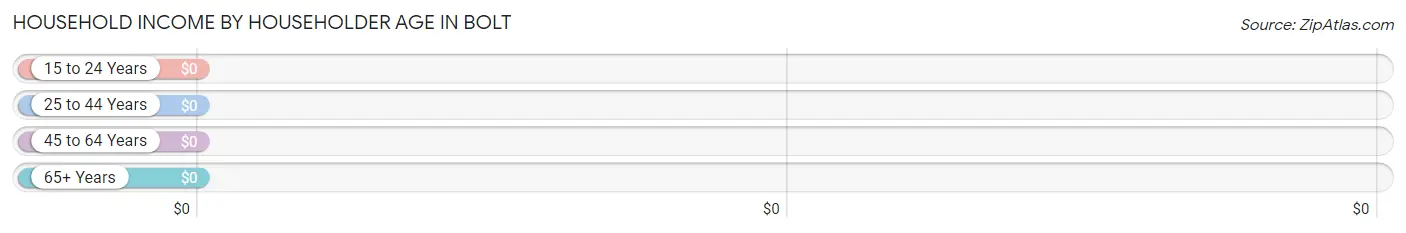
| Income Bracket | # Households | Median Income |
| 15 to 24 Years | 0 (0.0%) | $0 |
| 25 to 44 Years | 22 (21.6%) | $0 |
| 45 to 64 Years | 0 (0.0%) | $0 |
| 65+ Years | 80 (78.4%) | $0 |
| Total | 102 (100.0%) | $66,020 |
Poverty in Bolt
Income Below Poverty by Sex and Age in Bolt
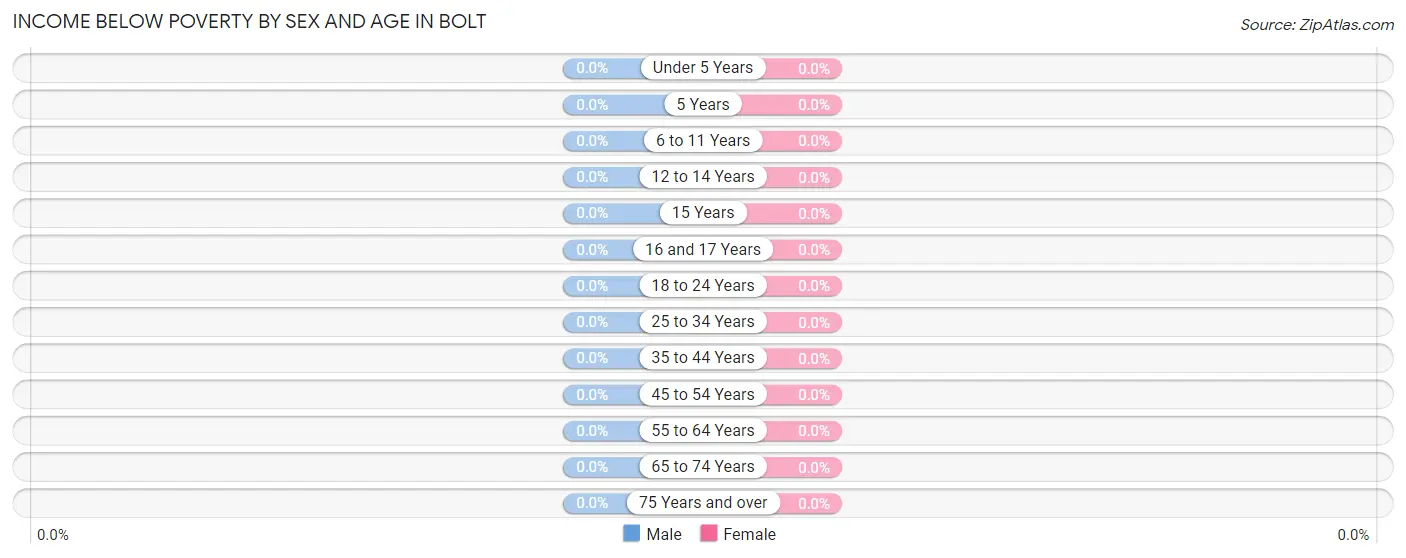
| Age Bracket | Male | Female |
| Under 5 Years | 0 (0.0%) | 0 (0.0%) |
| 5 Years | 0 (0.0%) | 0 (0.0%) |
| 6 to 11 Years | 0 (0.0%) | 0 (0.0%) |
| 12 to 14 Years | 0 (0.0%) | 0 (0.0%) |
| 15 Years | 0 (0.0%) | 0 (0.0%) |
| 16 and 17 Years | 0 (0.0%) | 0 (0.0%) |
| 18 to 24 Years | 0 (0.0%) | 0 (0.0%) |
| 25 to 34 Years | 0 (0.0%) | 0 (0.0%) |
| 35 to 44 Years | 0 (0.0%) | 0 (0.0%) |
| 45 to 54 Years | 0 (0.0%) | 0 (0.0%) |
| 55 to 64 Years | 0 (0.0%) | 0 (0.0%) |
| 65 to 74 Years | 0 (0.0%) | 0 (0.0%) |
| 75 Years and over | 0 (0.0%) | 0 (0.0%) |
| Total | 0 (0.0%) | 0 (0.0%) |
Income Above Poverty by Sex and Age in Bolt
According to the poverty statistics in Bolt, males aged 25 to 34 years and females aged under 5 years are the age groups that are most secure financially, with 100.0% of males and 100.0% of females in these age groups living above the poverty line.
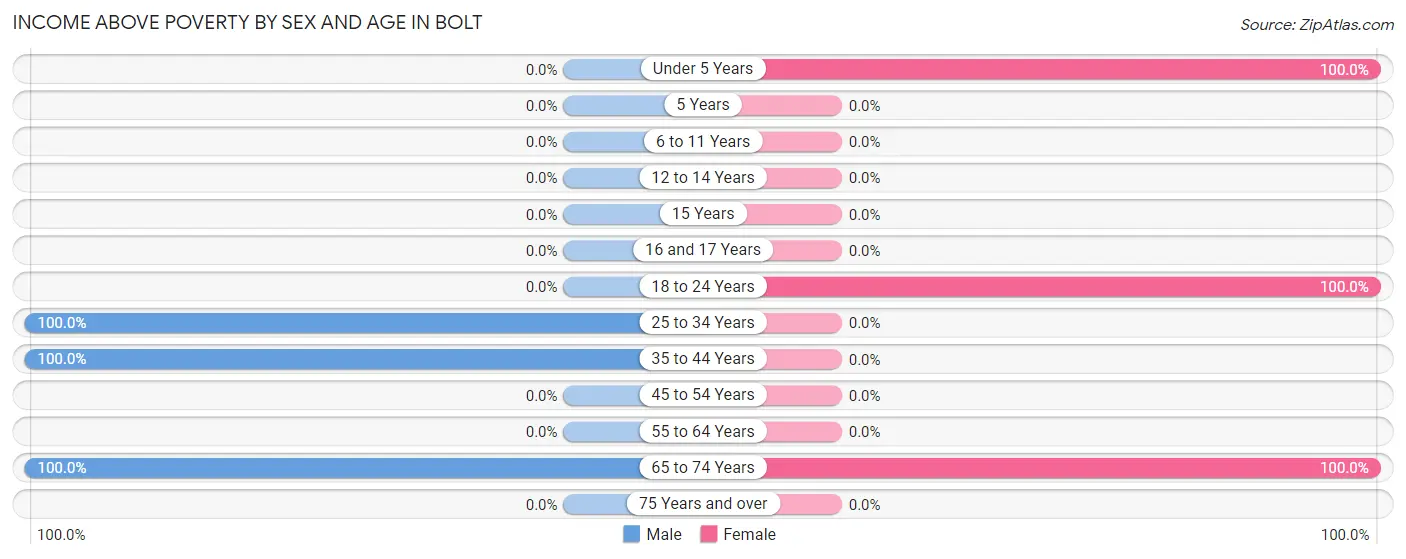
| Age Bracket | Male | Female |
| Under 5 Years | 0 (0.0%) | 27 (100.0%) |
| 5 Years | 0 (0.0%) | 0 (0.0%) |
| 6 to 11 Years | 0 (0.0%) | 0 (0.0%) |
| 12 to 14 Years | 0 (0.0%) | 0 (0.0%) |
| 15 Years | 0 (0.0%) | 0 (0.0%) |
| 16 and 17 Years | 0 (0.0%) | 0 (0.0%) |
| 18 to 24 Years | 0 (0.0%) | 19 (100.0%) |
| 25 to 34 Years | 22 (100.0%) | 0 (0.0%) |
| 35 to 44 Years | 44 (100.0%) | 0 (0.0%) |
| 45 to 54 Years | 0 (0.0%) | 0 (0.0%) |
| 55 to 64 Years | 0 (0.0%) | 0 (0.0%) |
| 65 to 74 Years | 84 (100.0%) | 60 (100.0%) |
| 75 Years and over | 0 (0.0%) | 0 (0.0%) |
| Total | 150 (100.0%) | 106 (100.0%) |
Income Below Poverty Among Married-Couple Families in Bolt
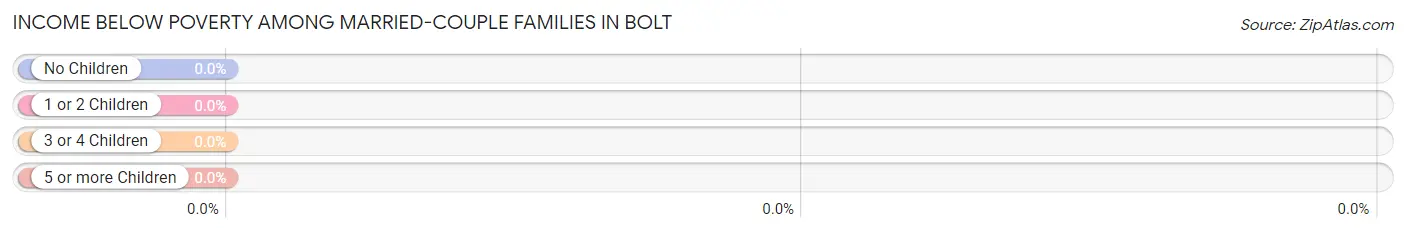
| Children | Above Poverty | Below Poverty |
| No Children | 80 (100.0%) | 0 (0.0%) |
| 1 or 2 Children | 22 (100.0%) | 0 (0.0%) |
| 3 or 4 Children | 0 (0.0%) | 0 (0.0%) |
| 5 or more Children | 0 (0.0%) | 0 (0.0%) |
| Total | 102 (100.0%) | 0 (0.0%) |
Income Below Poverty Among Single-Parent Households in Bolt
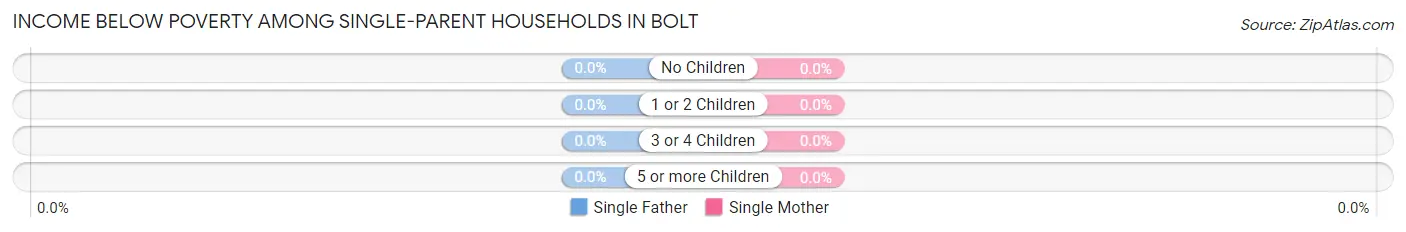
| Children | Single Father | Single Mother |
| No Children | 0 (0.0%) | 0 (0.0%) |
| 1 or 2 Children | 0 (0.0%) | 0 (0.0%) |
| 3 or 4 Children | 0 (0.0%) | 0 (0.0%) |
| 5 or more Children | 0 (0.0%) | 0 (0.0%) |
| Total | 0 (0.0%) | 0 (0.0%) |
Income Below Poverty Among Married-Couple vs Single-Parent Households in Bolt
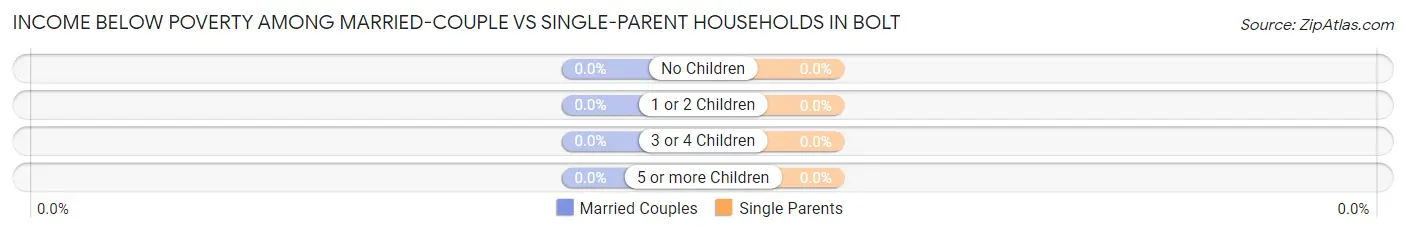
| Children | Married-Couple Families | Single-Parent Households |
| No Children | 0 (0.0%) | 0 (0.0%) |
| 1 or 2 Children | 0 (0.0%) | 0 (0.0%) |
| 3 or 4 Children | 0 (0.0%) | 0 (0.0%) |
| 5 or more Children | 0 (0.0%) | 0 (0.0%) |
| Total | 0 (0.0%) | 0 (0.0%) |
Race in Bolt
The most populous races in Bolt are White / Caucasian (207 | 80.9%), and Two or more Races (49 | 19.1%).
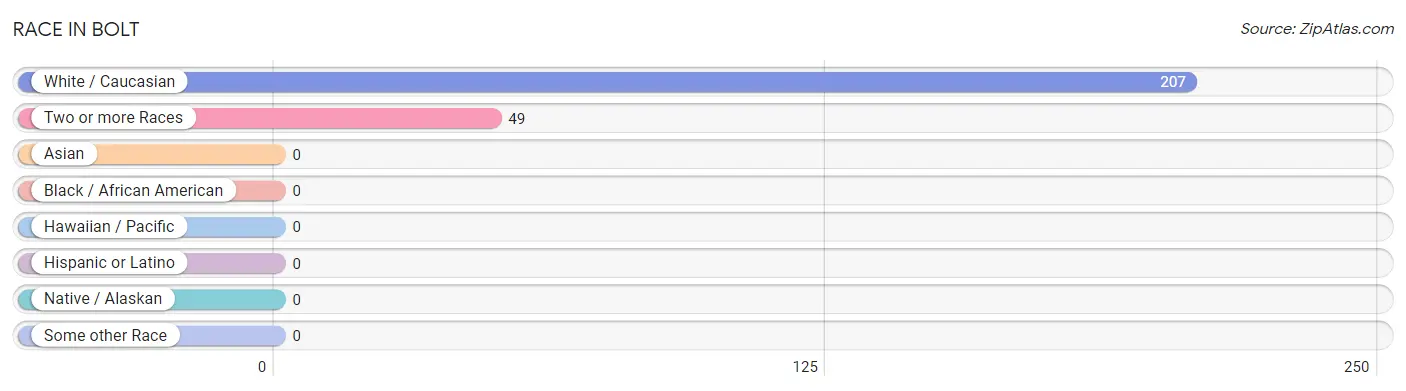
| Race | # Population | % Population |
| Asian | 0 | 0.0% |
| Black / African American | 0 | 0.0% |
| Hawaiian / Pacific | 0 | 0.0% |
| Hispanic or Latino | 0 | 0.0% |
| Native / Alaskan | 0 | 0.0% |
| White / Caucasian | 207 | 80.9% |
| Two or more Races | 49 | 19.1% |
| Some other Race | 0 | 0.0% |
| Total | 256 | 100.0% |
Ancestry in Bolt
The most populous ancestries reported in Bolt are Irish (95 | 37.1%), German (79 | 30.9%), and Sioux (49 | 19.1%), together accounting for 87.1% of all Bolt residents.
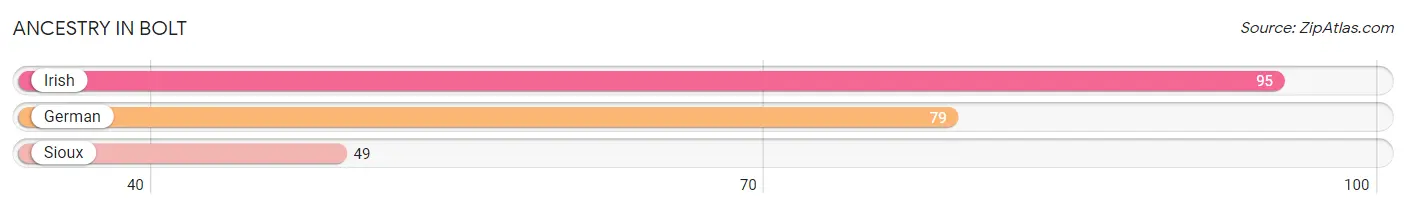
| Ancestry | # Population | % Population |
| German | 79 | 30.9% |
| Irish | 95 | 37.1% |
| Sioux | 49 | 19.1% | View All 3 Rows |
Immigrants in Bolt

| Immigration Origin | # Population | % Population | View All 0 Rows |
Sex and Age in Bolt
Sex and Age in Bolt
The most populous age groups in Bolt are 65 to 69 Years (49 | 32.7%) for men and 65 to 69 Years (60 | 56.6%) for women.
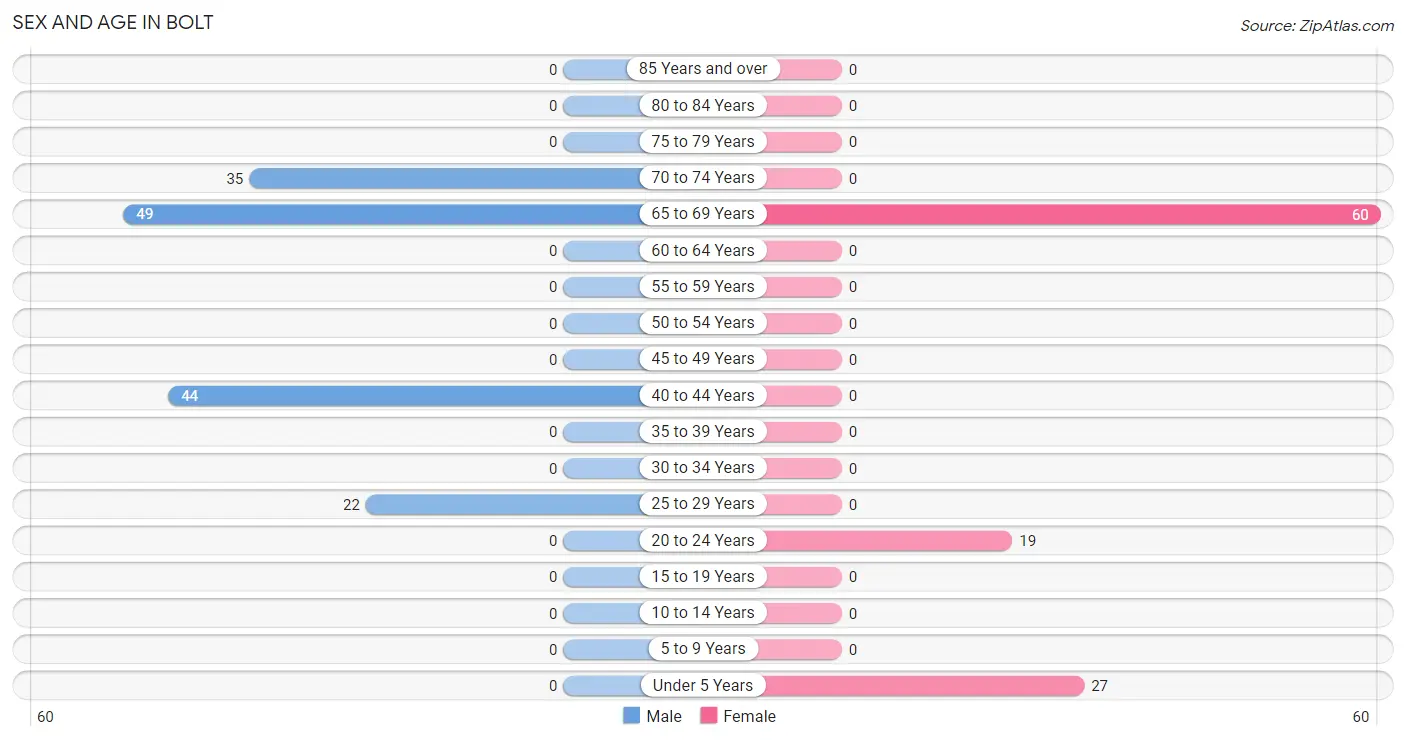
| Age Bracket | Male | Female |
| Under 5 Years | 0 (0.0%) | 27 (25.5%) |
| 5 to 9 Years | 0 (0.0%) | 0 (0.0%) |
| 10 to 14 Years | 0 (0.0%) | 0 (0.0%) |
| 15 to 19 Years | 0 (0.0%) | 0 (0.0%) |
| 20 to 24 Years | 0 (0.0%) | 19 (17.9%) |
| 25 to 29 Years | 22 (14.7%) | 0 (0.0%) |
| 30 to 34 Years | 0 (0.0%) | 0 (0.0%) |
| 35 to 39 Years | 0 (0.0%) | 0 (0.0%) |
| 40 to 44 Years | 44 (29.3%) | 0 (0.0%) |
| 45 to 49 Years | 0 (0.0%) | 0 (0.0%) |
| 50 to 54 Years | 0 (0.0%) | 0 (0.0%) |
| 55 to 59 Years | 0 (0.0%) | 0 (0.0%) |
| 60 to 64 Years | 0 (0.0%) | 0 (0.0%) |
| 65 to 69 Years | 49 (32.7%) | 60 (56.6%) |
| 70 to 74 Years | 35 (23.3%) | 0 (0.0%) |
| 75 to 79 Years | 0 (0.0%) | 0 (0.0%) |
| 80 to 84 Years | 0 (0.0%) | 0 (0.0%) |
| 85 Years and over | 0 (0.0%) | 0 (0.0%) |
| Total | 150 (100.0%) | 106 (100.0%) |
Families and Households in Bolt
Median Family Size in Bolt
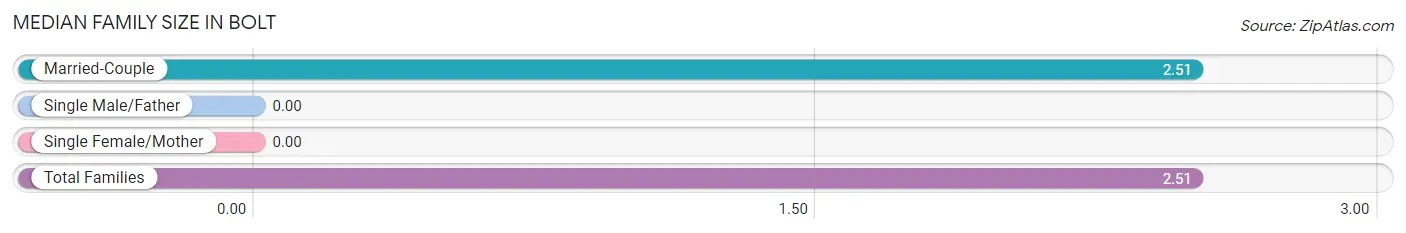
| Family Type | # Families | Family Size |
| Married-Couple | 102 (100.0%) | 2.51 |
| Single Male/Father | 0 (0.0%) | - |
| Single Female/Mother | 0 (0.0%) | - |
| Total Families | 102 (100.0%) | 2.51 |
Median Household Size in Bolt
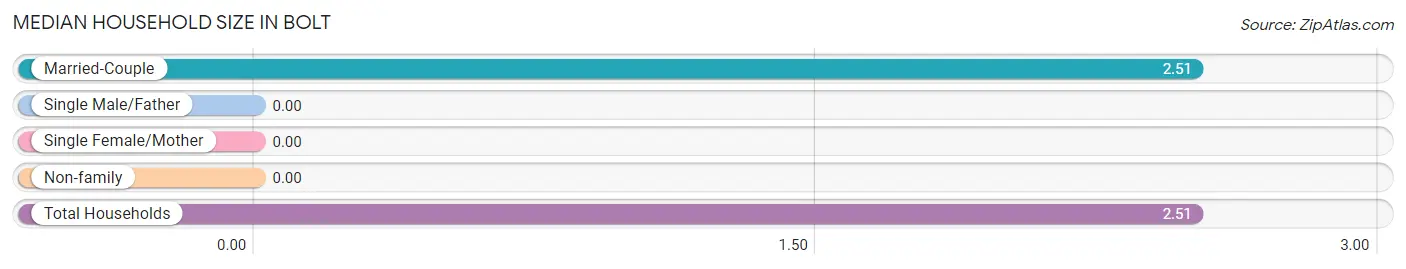
| Household Type | # Households | Household Size |
| Married-Couple | 102 (100.0%) | 2.51 |
| Single Male/Father | 0 (0.0%) | - |
| Single Female/Mother | 0 (0.0%) | - |
| Non-family | 0 (0.0%) | - |
| Total Households | 102 (100.0%) | 2.51 |
Household Size by Marriage Status in Bolt
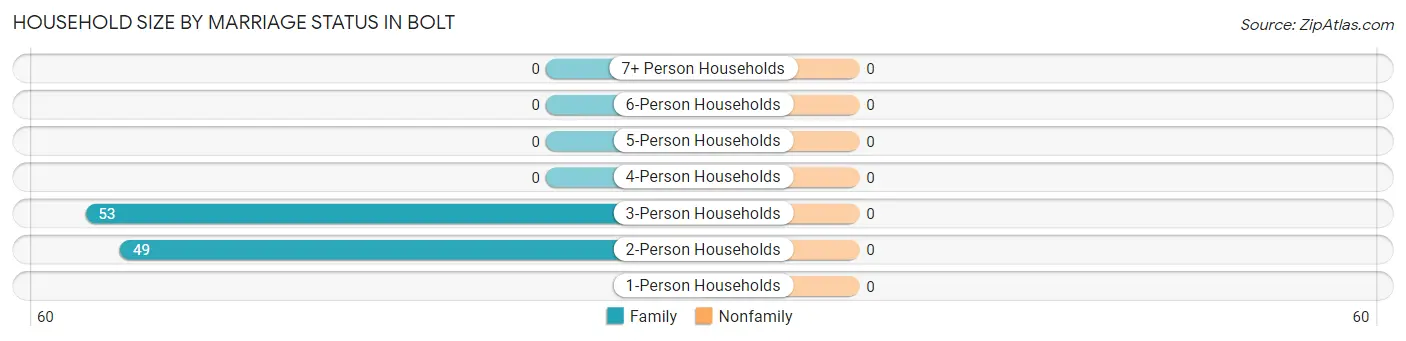
| Household Size | Family Households | Nonfamily Households |
| 1-Person Households | - | 0 (0.0%) |
| 2-Person Households | 49 (48.0%) | 0 (0.0%) |
| 3-Person Households | 53 (52.0%) | 0 (0.0%) |
| 4-Person Households | 0 (0.0%) | 0 (0.0%) |
| 5-Person Households | 0 (0.0%) | 0 (0.0%) |
| 6-Person Households | 0 (0.0%) | 0 (0.0%) |
| 7+ Person Households | 0 (0.0%) | 0 (0.0%) |
| Total | 102 (100.0%) | 0 (0.0%) |
Female Fertility in Bolt
Fertility by Age in Bolt
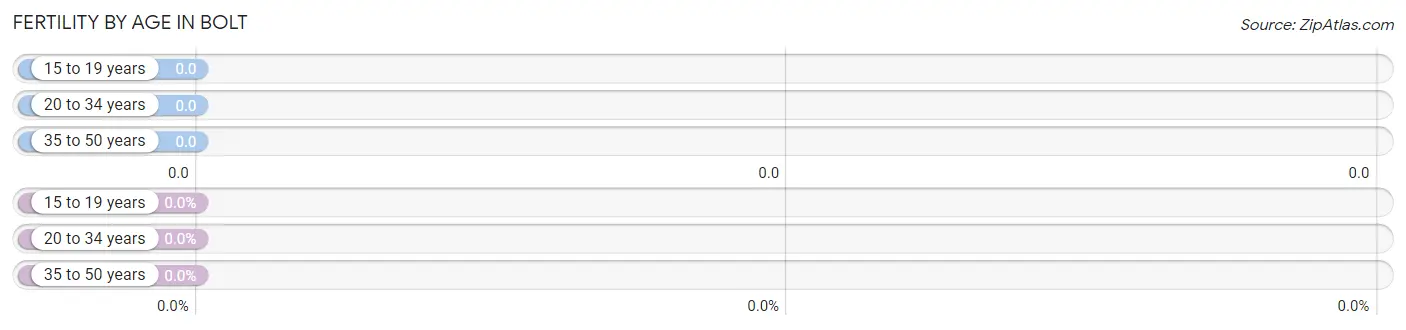
| Age Bracket | Women with Births | Births / 1,000 Women |
| 15 to 19 years | 0 (0.0%) | 0.0 |
| 20 to 34 years | 0 (0.0%) | 0.0 |
| 35 to 50 years | 0 (0.0%) | 0.0 |
| Total | 0 (0.0%) | 0.0 |
Fertility by Age by Marriage Status in Bolt
| Age Bracket | Married | Unmarried |
| 15 to 19 years | 0 (0.0%) | 0 (0.0%) |
| 20 to 34 years | 0 (0.0%) | 0 (0.0%) |
| 35 to 50 years | 0 (0.0%) | 0 (0.0%) |
| Total | 0 (0.0%) | 0 (0.0%) |
Fertility by Education in Bolt
| Educational Attainment | Women with Births | Births / 1,000 Women |
| Less than High School | 0 (0.0%) | 0.0 |
| High School Diploma | 0 (0.0%) | 0.0 |
| College or Associate's Degree | 0 (0.0%) | 0.0 |
| Bachelor's Degree | 0 (0.0%) | 0.0 |
| Graduate Degree | 0 (0.0%) | 0.0 |
| Total | 0 (0.0%) | 0.0 |
Fertility by Education by Marriage Status in Bolt
| Educational Attainment | Married | Unmarried |
| Less than High School | 0 (0.0%) | 0 (0.0%) |
| High School Diploma | 0 (0.0%) | 0 (0.0%) |
| College or Associate's Degree | 0 (0.0%) | 0 (0.0%) |
| Bachelor's Degree | 0 (0.0%) | 0 (0.0%) |
| Graduate Degree | 0 (0.0%) | 0 (0.0%) |
| Total | 0 (0.0%) | 0 (0.0%) |
Employment Characteristics in Bolt
Employment by Class of Employer in Bolt
Among the 41 employed individuals in Bolt, , and private company employees (41 | 100.0%) make up the most common classes of employment.
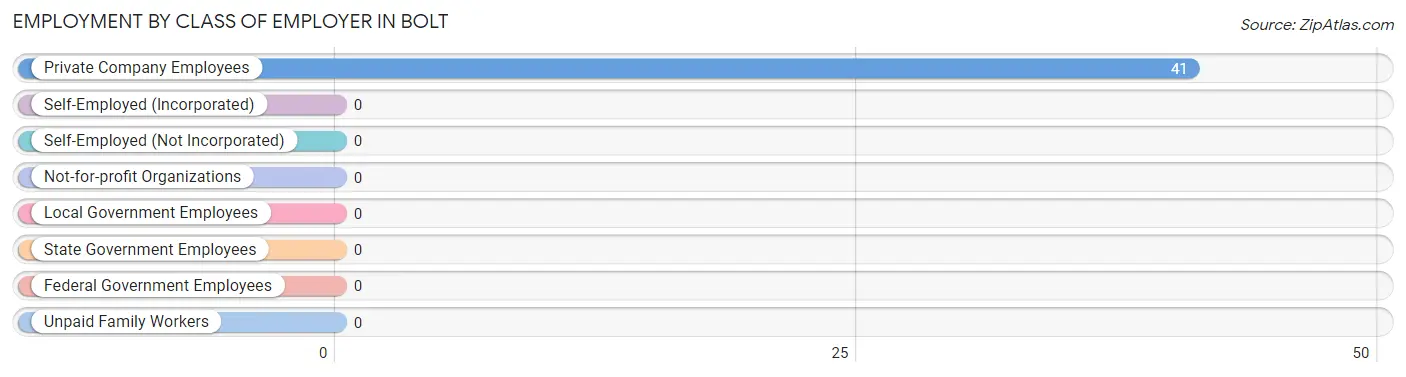
| Employer Class | # Employees | % Employees |
| Private Company Employees | 41 | 100.0% |
| Self-Employed (Incorporated) | 0 | 0.0% |
| Self-Employed (Not Incorporated) | 0 | 0.0% |
| Not-for-profit Organizations | 0 | 0.0% |
| Local Government Employees | 0 | 0.0% |
| State Government Employees | 0 | 0.0% |
| Federal Government Employees | 0 | 0.0% |
| Unpaid Family Workers | 0 | 0.0% |
| Total | 41 | 100.0% |
Employment Status by Age in Bolt
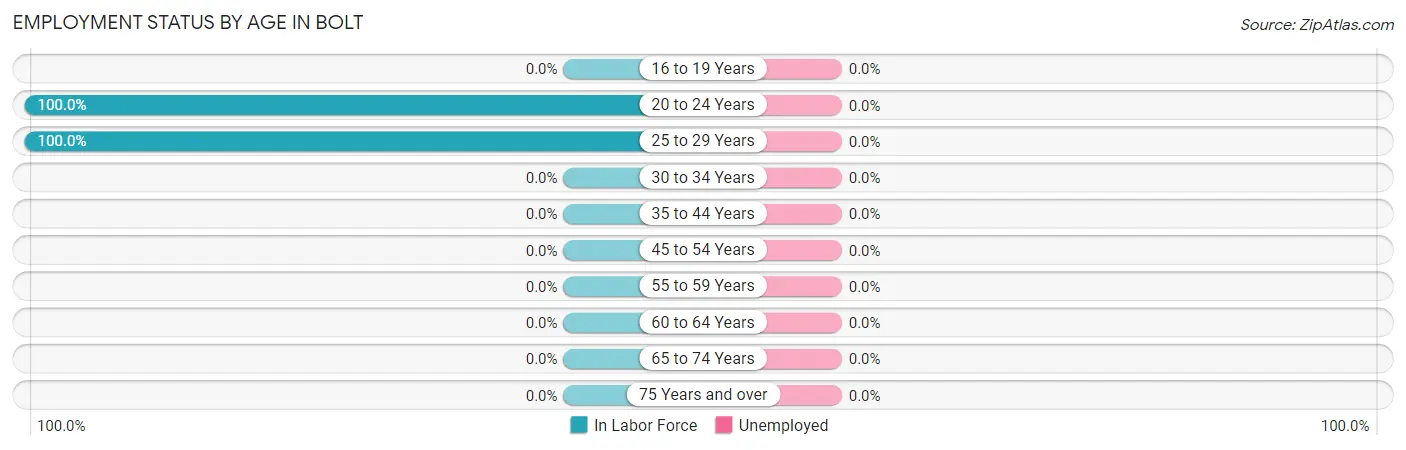
| Age Bracket | In Labor Force | Unemployed |
| 16 to 19 Years | 0 (0.0%) | 0 (0.0%) |
| 20 to 24 Years | 19 (100.0%) | 0 (0.0%) |
| 25 to 29 Years | 22 (100.0%) | 0 (0.0%) |
| 30 to 34 Years | 0 (0.0%) | 0 (0.0%) |
| 35 to 44 Years | 0 (0.0%) | 0 (0.0%) |
| 45 to 54 Years | 0 (0.0%) | 0 (0.0%) |
| 55 to 59 Years | 0 (0.0%) | 0 (0.0%) |
| 60 to 64 Years | 0 (0.0%) | 0 (0.0%) |
| 65 to 74 Years | 0 (0.0%) | 0 (0.0%) |
| 75 Years and over | 0 (0.0%) | 0 (0.0%) |
| Total | 41 (17.9%) | 0 (0.0%) |
Employment Status by Educational Attainment in Bolt
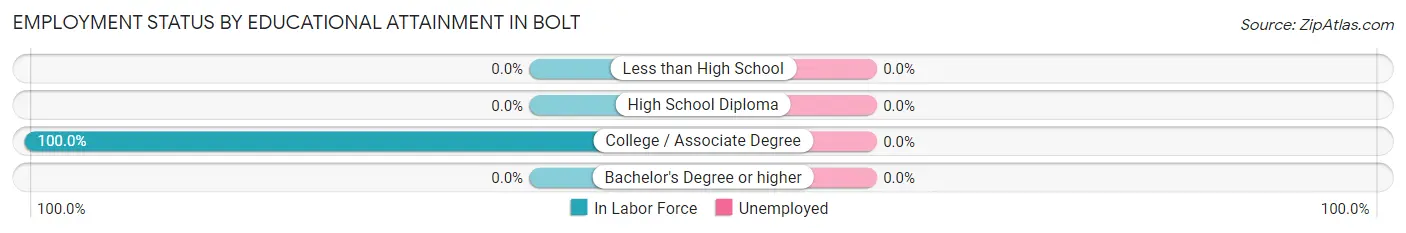
| Educational Attainment | In Labor Force | Unemployed |
| Less than High School | 0 (0.0%) | 0 (0.0%) |
| High School Diploma | 0 (0.0%) | 0 (0.0%) |
| College / Associate Degree | 22 (100.0%) | 0 (0.0%) |
| Bachelor's Degree or higher | 0 (0.0%) | 0 (0.0%) |
| Total | 22 (33.3%) | 0 (0.0%) |
Employment Occupations by Sex in Bolt
Management, Business, Science and Arts Occupations
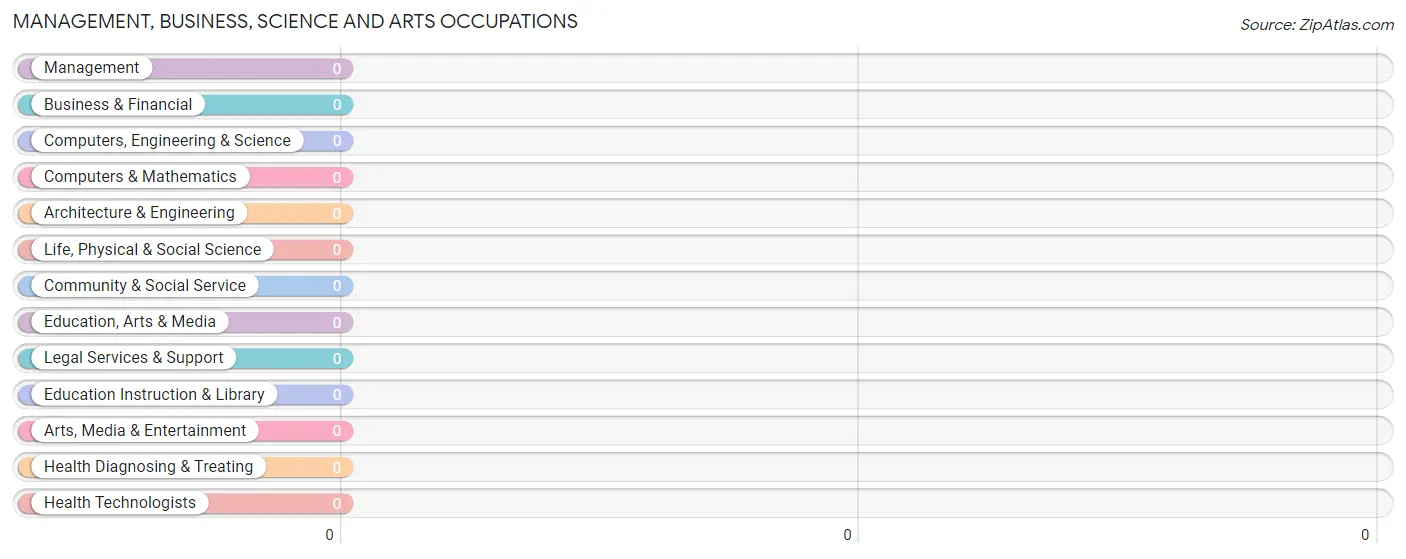
Management, Business, Science and Arts Occupations by Sex
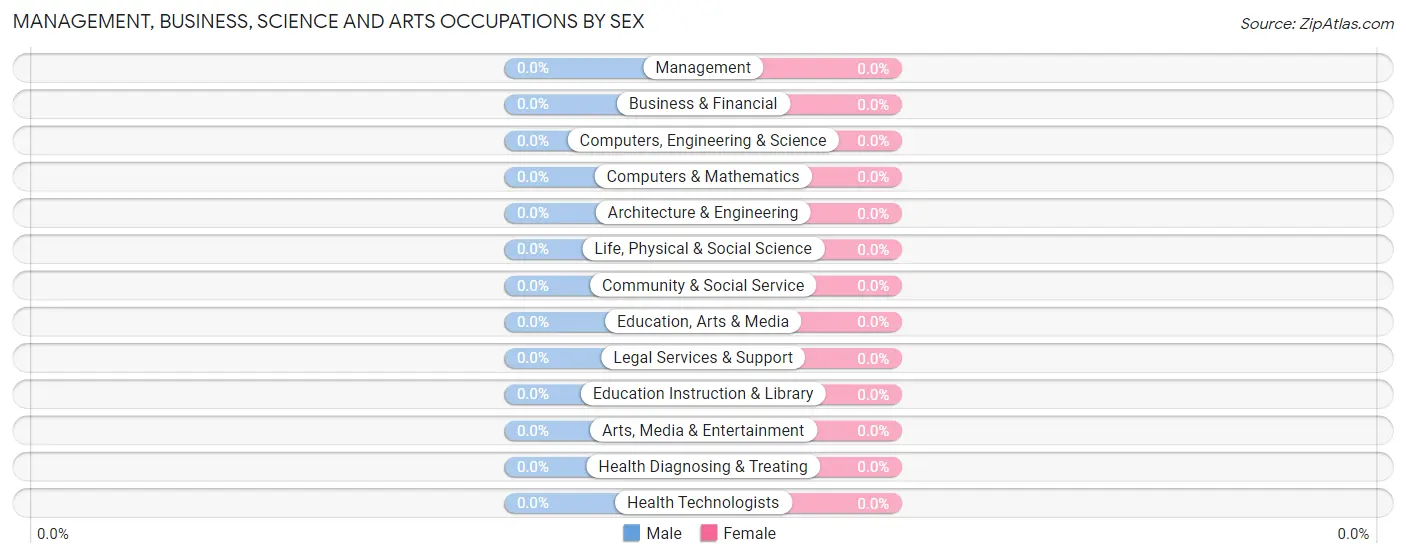
| Occupation | Male | Female |
| Management | 0 (0.0%) | 0 (0.0%) |
| Business & Financial | 0 (0.0%) | 0 (0.0%) |
| Computers, Engineering & Science | 0 (0.0%) | 0 (0.0%) |
| Computers & Mathematics | 0 (0.0%) | 0 (0.0%) |
| Architecture & Engineering | 0 (0.0%) | 0 (0.0%) |
| Life, Physical & Social Science | 0 (0.0%) | 0 (0.0%) |
| Community & Social Service | 0 (0.0%) | 0 (0.0%) |
| Education, Arts & Media | 0 (0.0%) | 0 (0.0%) |
| Legal Services & Support | 0 (0.0%) | 0 (0.0%) |
| Education Instruction & Library | 0 (0.0%) | 0 (0.0%) |
| Arts, Media & Entertainment | 0 (0.0%) | 0 (0.0%) |
| Health Diagnosing & Treating | 0 (0.0%) | 0 (0.0%) |
| Health Technologists | 0 (0.0%) | 0 (0.0%) |
| Total (Category) | 0 (0.0%) | 0 (0.0%) |
| Total (Overall) | 22 (53.7%) | 19 (46.3%) |
Services Occupations
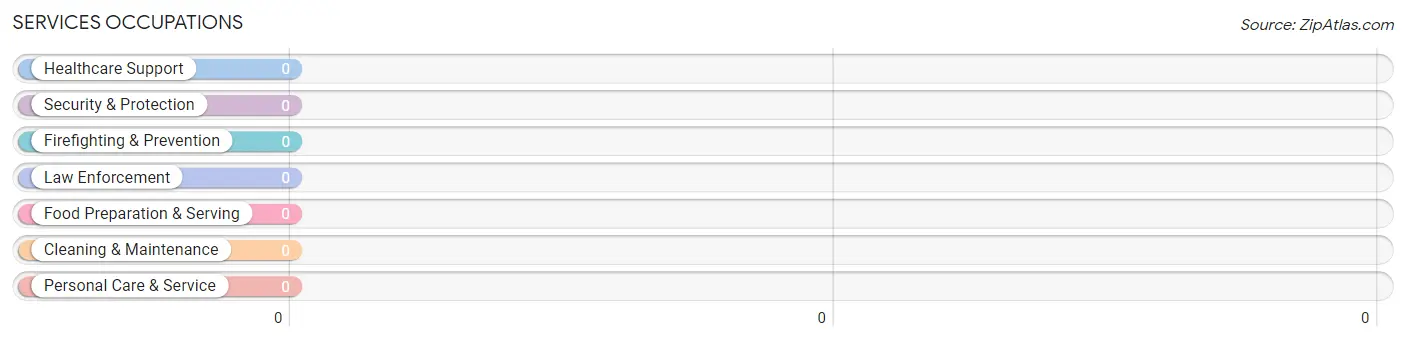
Services Occupations by Sex
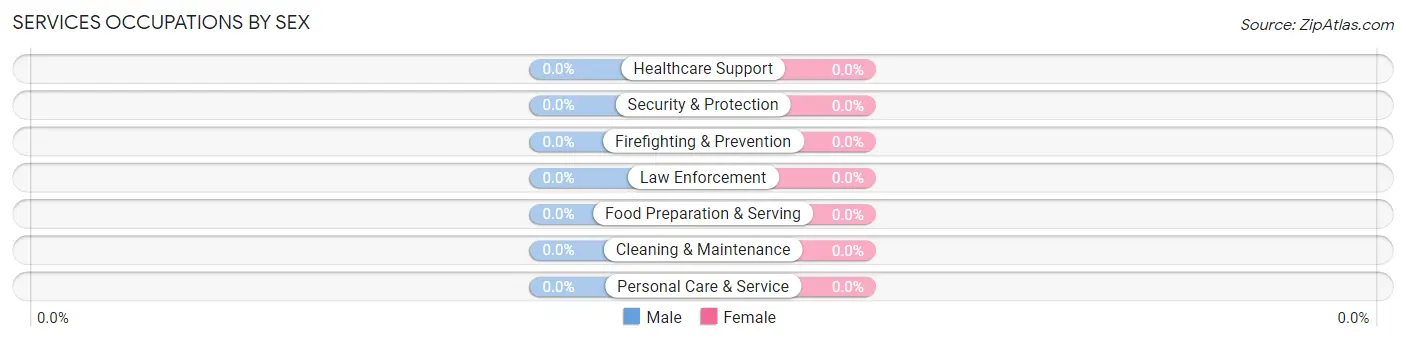
| Occupation | Male | Female |
| Healthcare Support | 0 (0.0%) | 0 (0.0%) |
| Security & Protection | 0 (0.0%) | 0 (0.0%) |
| Firefighting & Prevention | 0 (0.0%) | 0 (0.0%) |
| Law Enforcement | 0 (0.0%) | 0 (0.0%) |
| Food Preparation & Serving | 0 (0.0%) | 0 (0.0%) |
| Cleaning & Maintenance | 0 (0.0%) | 0 (0.0%) |
| Personal Care & Service | 0 (0.0%) | 0 (0.0%) |
| Total (Category) | 0 (0.0%) | 0 (0.0%) |
| Total (Overall) | 22 (53.7%) | 19 (46.3%) |
Sales and Office Occupations
The most common Sales and Office occupations in Bolt are , and Office & Administration (19 | 46.3%).
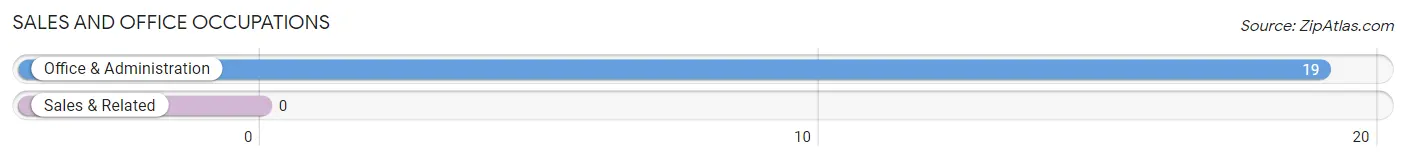
Sales and Office Occupations by Sex
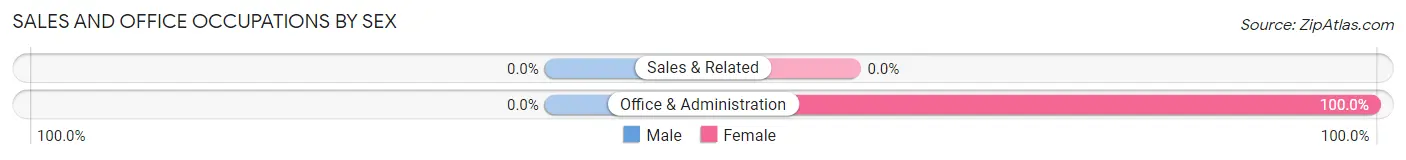
| Occupation | Male | Female |
| Sales & Related | 0 (0.0%) | 0 (0.0%) |
| Office & Administration | 0 (0.0%) | 19 (100.0%) |
| Total (Category) | 0 (0.0%) | 19 (100.0%) |
| Total (Overall) | 22 (53.7%) | 19 (46.3%) |
Natural Resources, Construction and Maintenance Occupations
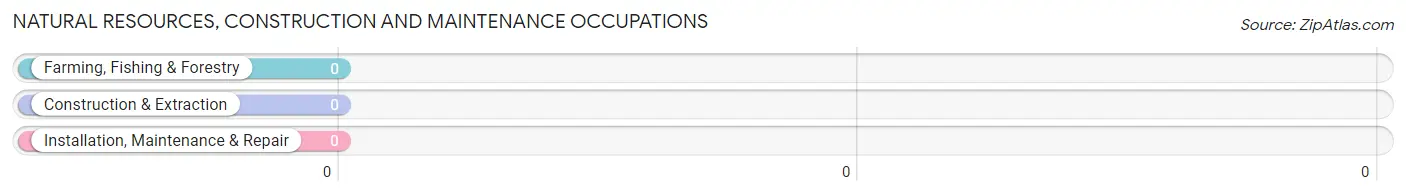
Natural Resources, Construction and Maintenance Occupations by Sex
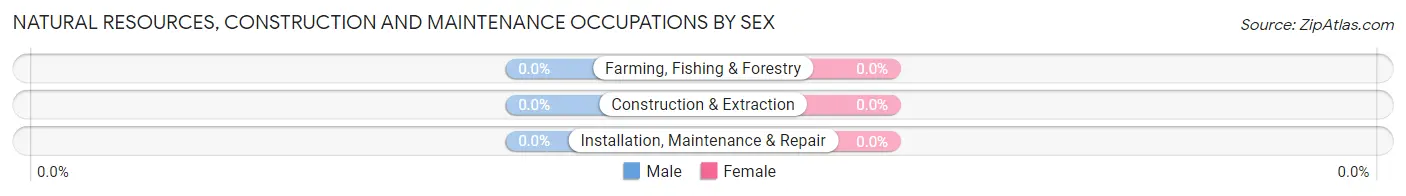
| Occupation | Male | Female |
| Farming, Fishing & Forestry | 0 (0.0%) | 0 (0.0%) |
| Construction & Extraction | 0 (0.0%) | 0 (0.0%) |
| Installation, Maintenance & Repair | 0 (0.0%) | 0 (0.0%) |
| Total (Category) | 0 (0.0%) | 0 (0.0%) |
| Total (Overall) | 22 (53.7%) | 19 (46.3%) |
Production, Transportation and Moving Occupations
The most common Production, Transportation and Moving occupations in Bolt are , and Production (22 | 53.7%).
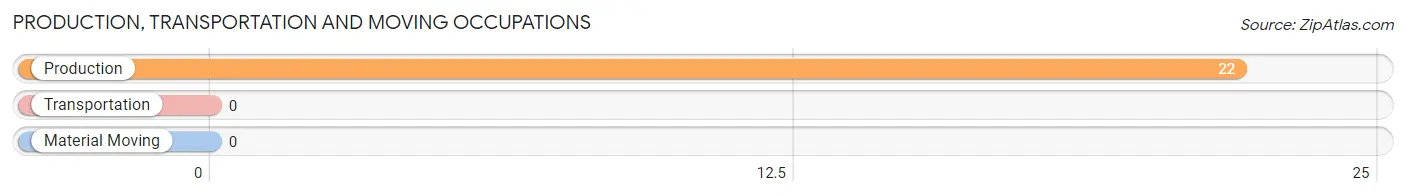
Production, Transportation and Moving Occupations by Sex
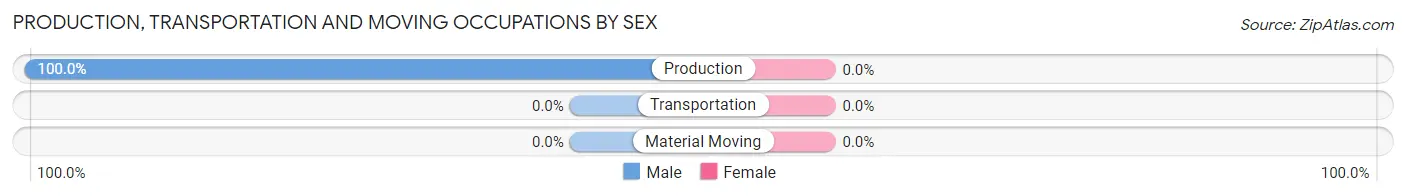
| Occupation | Male | Female |
| Production | 22 (100.0%) | 0 (0.0%) |
| Transportation | 0 (0.0%) | 0 (0.0%) |
| Material Moving | 0 (0.0%) | 0 (0.0%) |
| Total (Category) | 22 (100.0%) | 0 (0.0%) |
| Total (Overall) | 22 (53.7%) | 19 (46.3%) |
Employment Industries by Sex in Bolt
Employment Industries in Bolt
The major employment industries in Bolt include Mining, Quarrying, & Extraction (22 | 53.7%), and Health Care & Social Assistance (19 | 46.3%).
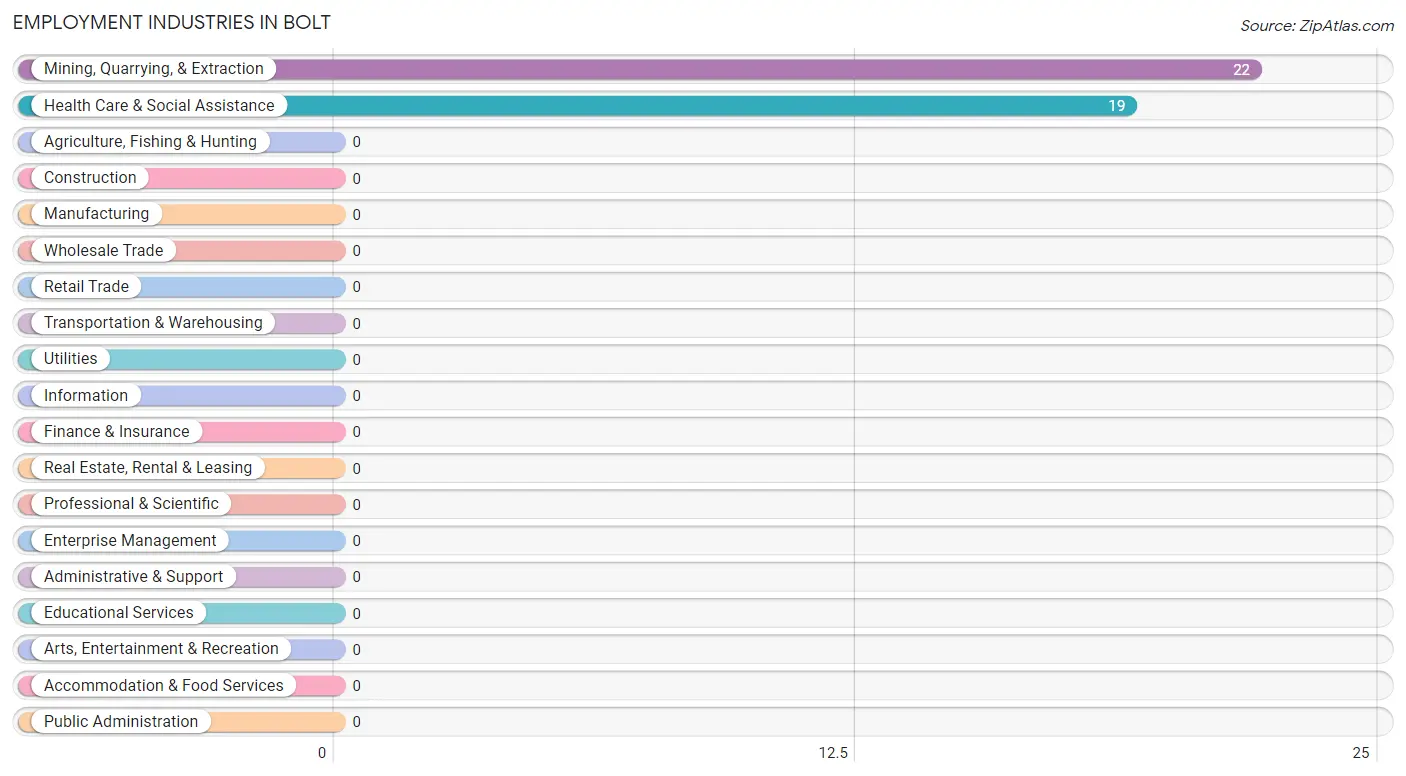
Employment Industries by Sex in Bolt
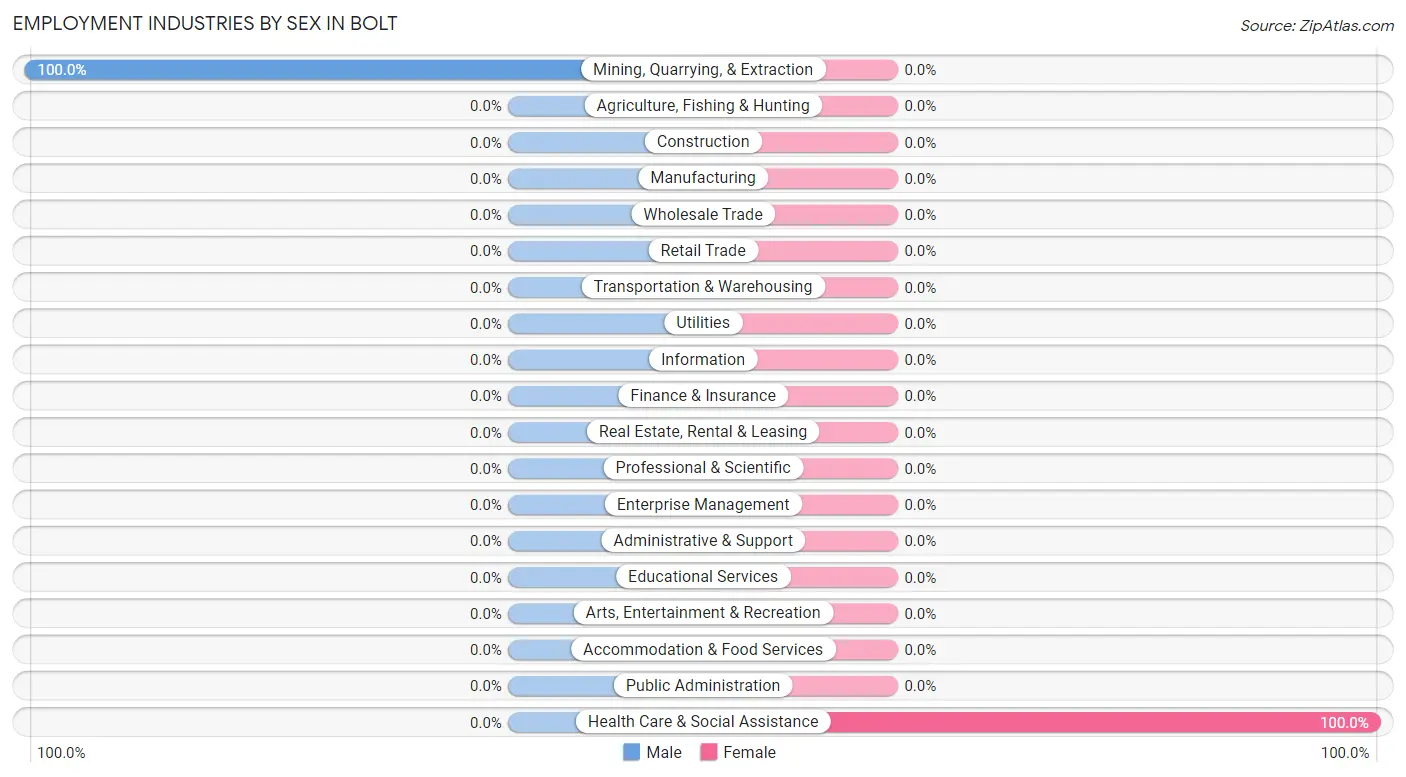
| Industry | Male | Female |
| Agriculture, Fishing & Hunting | 0 (0.0%) | 0 (0.0%) |
| Mining, Quarrying, & Extraction | 22 (100.0%) | 0 (0.0%) |
| Construction | 0 (0.0%) | 0 (0.0%) |
| Manufacturing | 0 (0.0%) | 0 (0.0%) |
| Wholesale Trade | 0 (0.0%) | 0 (0.0%) |
| Retail Trade | 0 (0.0%) | 0 (0.0%) |
| Transportation & Warehousing | 0 (0.0%) | 0 (0.0%) |
| Utilities | 0 (0.0%) | 0 (0.0%) |
| Information | 0 (0.0%) | 0 (0.0%) |
| Finance & Insurance | 0 (0.0%) | 0 (0.0%) |
| Real Estate, Rental & Leasing | 0 (0.0%) | 0 (0.0%) |
| Professional & Scientific | 0 (0.0%) | 0 (0.0%) |
| Enterprise Management | 0 (0.0%) | 0 (0.0%) |
| Administrative & Support | 0 (0.0%) | 0 (0.0%) |
| Educational Services | 0 (0.0%) | 0 (0.0%) |
| Health Care & Social Assistance | 0 (0.0%) | 19 (100.0%) |
| Arts, Entertainment & Recreation | 0 (0.0%) | 0 (0.0%) |
| Accommodation & Food Services | 0 (0.0%) | 0 (0.0%) |
| Public Administration | 0 (0.0%) | 0 (0.0%) |
| Total | 22 (53.7%) | 19 (46.3%) |
Education in Bolt
School Enrollment in Bolt
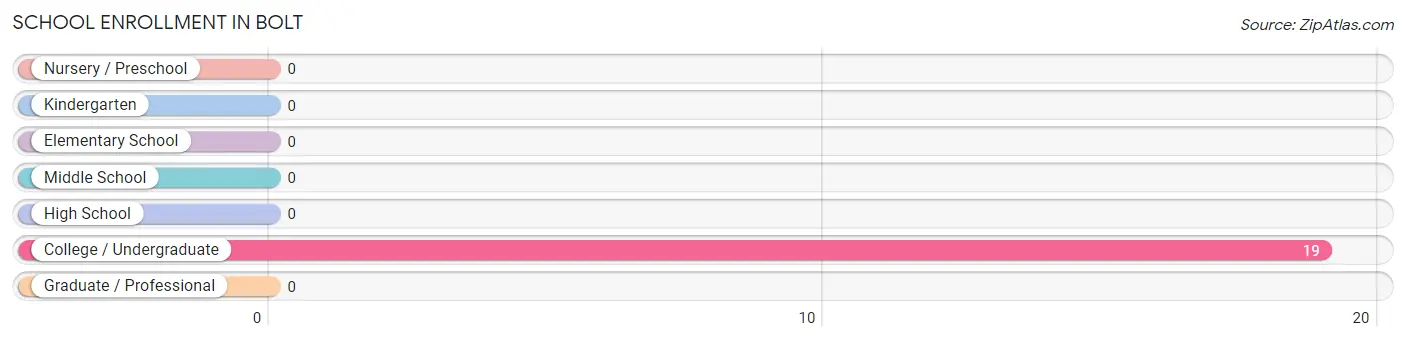
| School Level | # Students | % Students |
| Nursery / Preschool | 0 | 0.0% |
| Kindergarten | 0 | 0.0% |
| Elementary School | 0 | 0.0% |
| Middle School | 0 | 0.0% |
| High School | 0 | 0.0% |
| College / Undergraduate | 19 | 100.0% |
| Graduate / Professional | 0 | 0.0% |
| Total | 19 | 100.0% |
School Enrollment by Age by Funding Source in Bolt
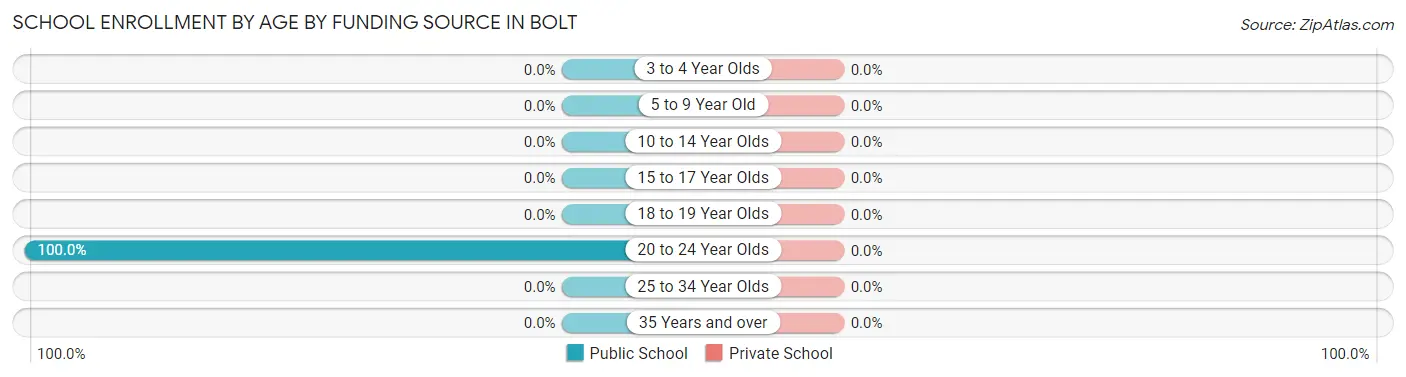
| Age Bracket | Public School | Private School |
| 3 to 4 Year Olds | 0 (0.0%) | 0 (0.0%) |
| 5 to 9 Year Old | 0 (0.0%) | 0 (0.0%) |
| 10 to 14 Year Olds | 0 (0.0%) | 0 (0.0%) |
| 15 to 17 Year Olds | 0 (0.0%) | 0 (0.0%) |
| 18 to 19 Year Olds | 0 (0.0%) | 0 (0.0%) |
| 20 to 24 Year Olds | 19 (100.0%) | 0 (0.0%) |
| 25 to 34 Year Olds | 0 (0.0%) | 0 (0.0%) |
| 35 Years and over | 0 (0.0%) | 0 (0.0%) |
| Total | 19 (100.0%) | 0 (0.0%) |
Educational Attainment by Field of Study in Bolt
| Field of Study | # Graduates | % Graduates |
| Computers & Mathematics | 0 | 0.0% |
| Bio, Nature & Agricultural | 0 | 0.0% |
| Physical & Health Sciences | 0 | 0.0% |
| Psychology | 0 | 0.0% |
| Social Sciences | 0 | 0.0% |
| Engineering | 0 | 0.0% |
| Multidisciplinary Studies | 0 | 0.0% |
| Science & Technology | 0 | 0.0% |
| Business | 0 | 0.0% |
| Education | 0 | 0.0% |
| Literature & Languages | 0 | 0.0% |
| Liberal Arts & History | 0 | 0.0% |
| Visual & Performing Arts | 0 | 0.0% |
| Communications | 0 | 0.0% |
| Arts & Humanities | 0 | 0.0% |
| Total | 0 | 0.0% |
Transportation & Commute in Bolt
Vehicle Availability by Sex in Bolt
The most prevalent vehicle ownership categories in Bolt are males with 3 vehicles (22, accounting for 100.0%) and females with 3 vehicles (19, making up 115.8%).
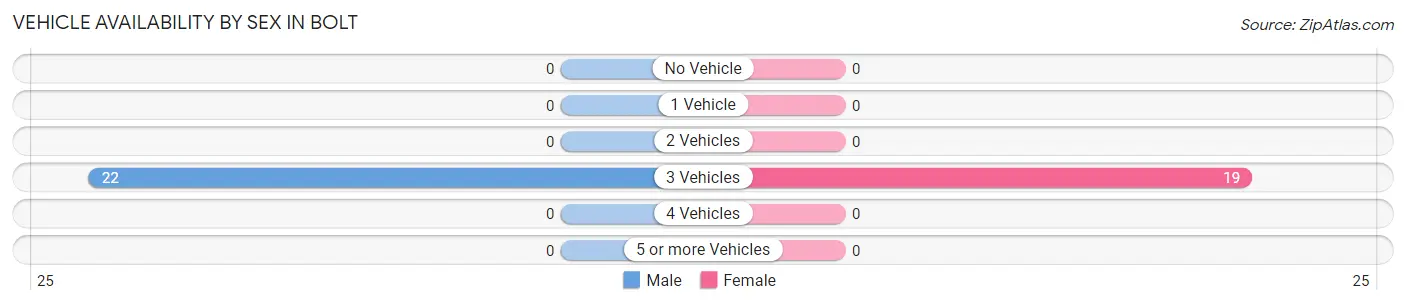
| Vehicles Available | Male | Female |
| No Vehicle | 0 (0.0%) | 0 (0.0%) |
| 1 Vehicle | 0 (0.0%) | 0 (0.0%) |
| 2 Vehicles | 0 (0.0%) | 0 (0.0%) |
| 3 Vehicles | 22 (100.0%) | 19 (100.0%) |
| 4 Vehicles | 0 (0.0%) | 0 (0.0%) |
| 5 or more Vehicles | 0 (0.0%) | 0 (0.0%) |
| Total | 22 (100.0%) | 19 (100.0%) |
Commute Time in Bolt
The most frequently occuring commute durations in Bolt are 45 to 59 minutes (22 commuters, 53.7%), 20 to 24 minutes (19 commuters, 46.3%), and less than 5 minutes (0 commuters, 0.0%).
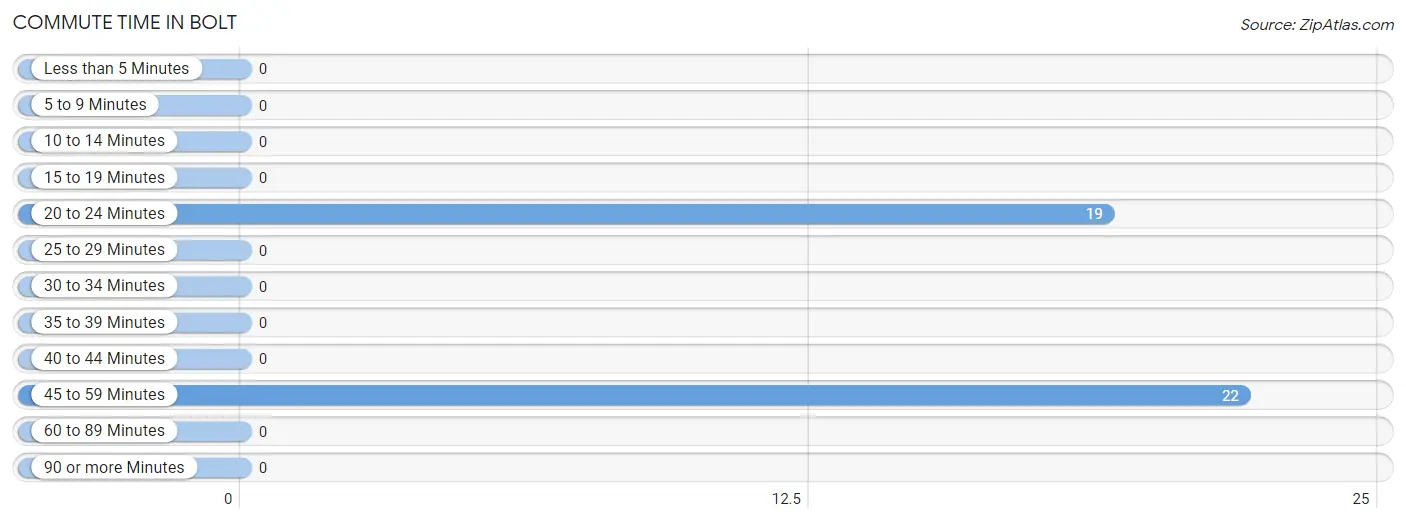
| Commute Time | # Commuters | % Commuters |
| Less than 5 Minutes | 0 | 0.0% |
| 5 to 9 Minutes | 0 | 0.0% |
| 10 to 14 Minutes | 0 | 0.0% |
| 15 to 19 Minutes | 0 | 0.0% |
| 20 to 24 Minutes | 19 | 46.3% |
| 25 to 29 Minutes | 0 | 0.0% |
| 30 to 34 Minutes | 0 | 0.0% |
| 35 to 39 Minutes | 0 | 0.0% |
| 40 to 44 Minutes | 0 | 0.0% |
| 45 to 59 Minutes | 22 | 53.7% |
| 60 to 89 Minutes | 0 | 0.0% |
| 90 or more Minutes | 0 | 0.0% |
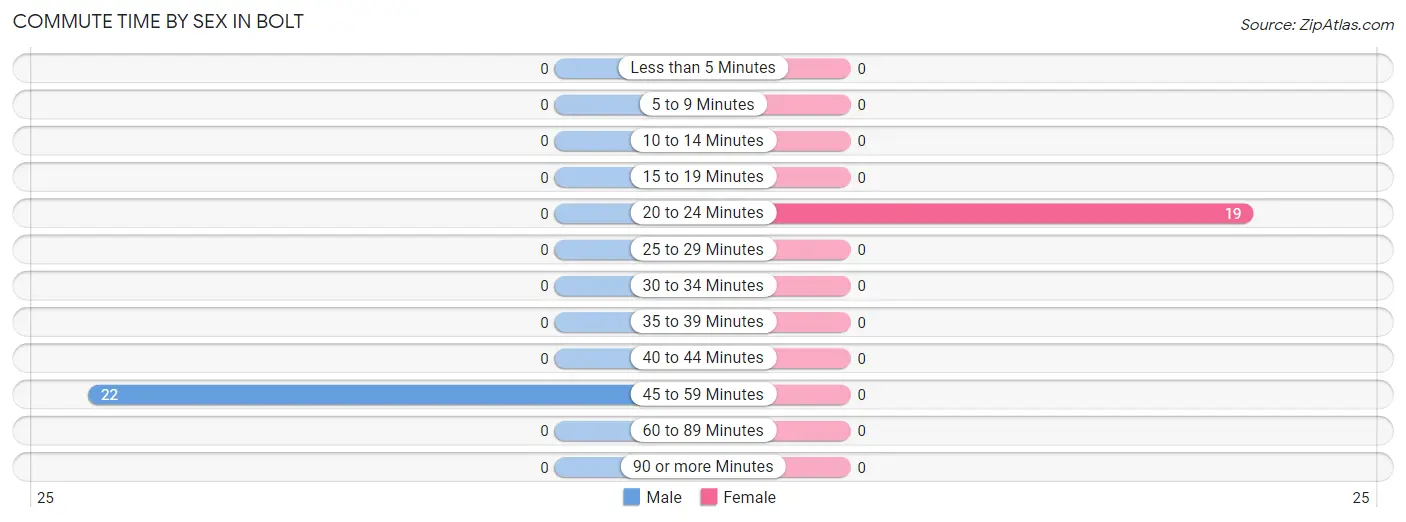
Commute Time by Sex in Bolt
The most common commute times in Bolt are 45 to 59 minutes (22 commuters, 100.0%) for males and 20 to 24 minutes (19 commuters, 100.0%) for females.
| Commute Time | Male | Female |
| Less than 5 Minutes | 0 (0.0%) | 0 (0.0%) |
| 5 to 9 Minutes | 0 (0.0%) | 0 (0.0%) |
| 10 to 14 Minutes | 0 (0.0%) | 0 (0.0%) |
| 15 to 19 Minutes | 0 (0.0%) | 0 (0.0%) |
| 20 to 24 Minutes | 0 (0.0%) | 19 (100.0%) |
| 25 to 29 Minutes | 0 (0.0%) | 0 (0.0%) |
| 30 to 34 Minutes | 0 (0.0%) | 0 (0.0%) |
| 35 to 39 Minutes | 0 (0.0%) | 0 (0.0%) |
| 40 to 44 Minutes | 0 (0.0%) | 0 (0.0%) |
| 45 to 59 Minutes | 22 (100.0%) | 0 (0.0%) |
| 60 to 89 Minutes | 0 (0.0%) | 0 (0.0%) |
| 90 or more Minutes | 0 (0.0%) | 0 (0.0%) |
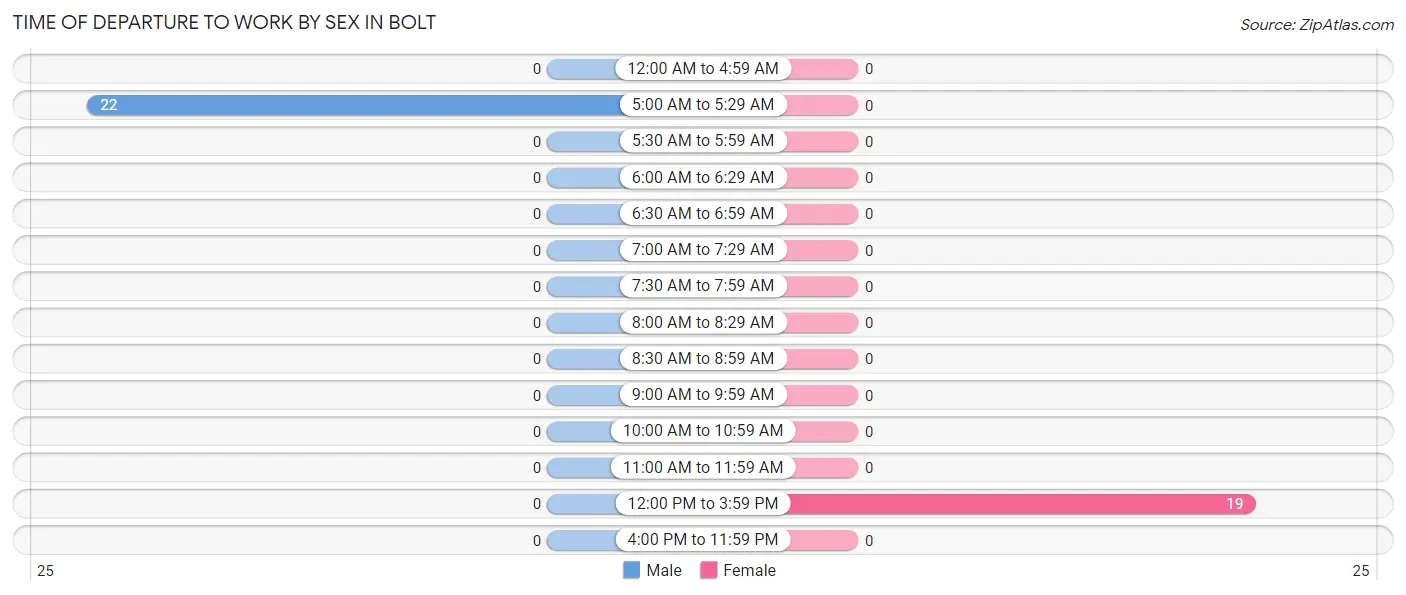
Time of Departure to Work by Sex in Bolt
The most frequent times of departure to work in Bolt are 5:00 AM to 5:29 AM (22, 100.0%) for males and 12:00 PM to 3:59 PM (19, 100.0%) for females.
| Time of Departure | Male | Female |
| 12:00 AM to 4:59 AM | 0 (0.0%) | 0 (0.0%) |
| 5:00 AM to 5:29 AM | 22 (100.0%) | 0 (0.0%) |
| 5:30 AM to 5:59 AM | 0 (0.0%) | 0 (0.0%) |
| 6:00 AM to 6:29 AM | 0 (0.0%) | 0 (0.0%) |
| 6:30 AM to 6:59 AM | 0 (0.0%) | 0 (0.0%) |
| 7:00 AM to 7:29 AM | 0 (0.0%) | 0 (0.0%) |
| 7:30 AM to 7:59 AM | 0 (0.0%) | 0 (0.0%) |
| 8:00 AM to 8:29 AM | 0 (0.0%) | 0 (0.0%) |
| 8:30 AM to 8:59 AM | 0 (0.0%) | 0 (0.0%) |
| 9:00 AM to 9:59 AM | 0 (0.0%) | 0 (0.0%) |
| 10:00 AM to 10:59 AM | 0 (0.0%) | 0 (0.0%) |
| 11:00 AM to 11:59 AM | 0 (0.0%) | 0 (0.0%) |
| 12:00 PM to 3:59 PM | 0 (0.0%) | 19 (100.0%) |
| 4:00 PM to 11:59 PM | 0 (0.0%) | 0 (0.0%) |
| Total | 22 (100.0%) | 19 (100.0%) |
Housing Occupancy in Bolt
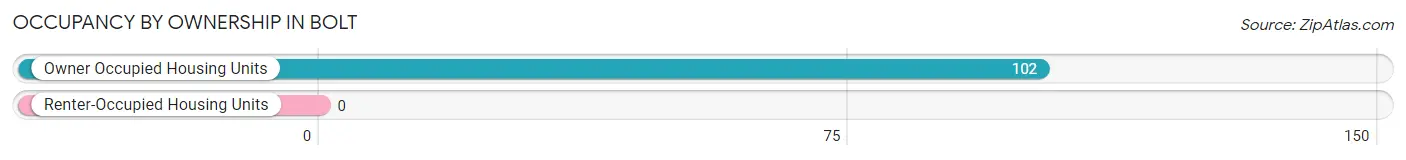
Occupancy by Ownership in Bolt
Of the total 102 dwellings in Bolt, owner-occupied units account for 102 (100.0%), while renter-occupied units make up 0 (0.0%).
| Occupancy | # Housing Units | % Housing Units |
| Owner Occupied Housing Units | 102 | 100.0% |
| Renter-Occupied Housing Units | 0 | 0.0% |
| Total Occupied Housing Units | 102 | 100.0% |
Occupancy by Household Size in Bolt
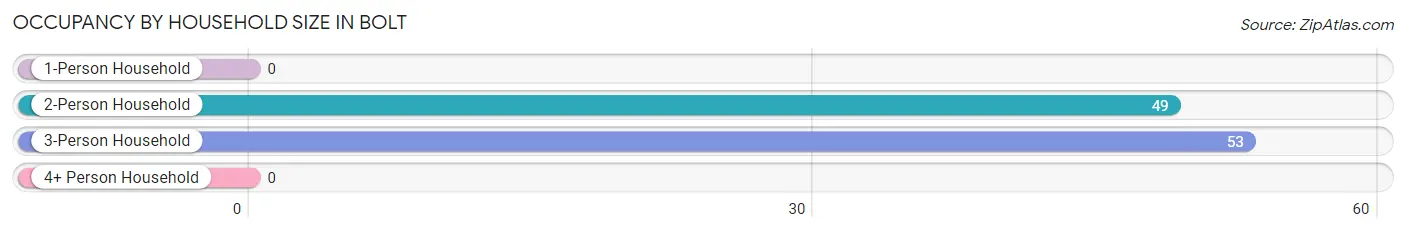
| Household Size | # Housing Units | % Housing Units |
| 1-Person Household | 0 | 0.0% |
| 2-Person Household | 49 | 48.0% |
| 3-Person Household | 53 | 52.0% |
| 4+ Person Household | 0 | 0.0% |
| Total Housing Units | 102 | 100.0% |
Occupancy by Ownership by Household Size in Bolt
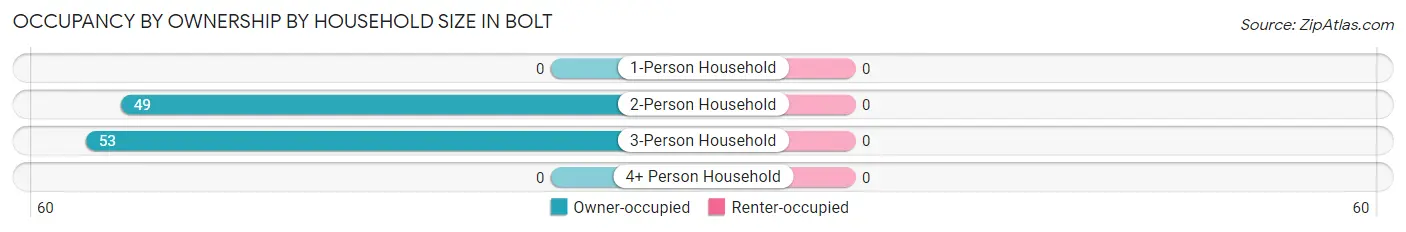
| Household Size | Owner-occupied | Renter-occupied |
| 1-Person Household | 0 (0.0%) | 0 (0.0%) |
| 2-Person Household | 49 (100.0%) | 0 (0.0%) |
| 3-Person Household | 53 (100.0%) | 0 (0.0%) |
| 4+ Person Household | 0 (0.0%) | 0 (0.0%) |
| Total Housing Units | 102 (100.0%) | 0 (0.0%) |
Occupancy by Educational Attainment in Bolt
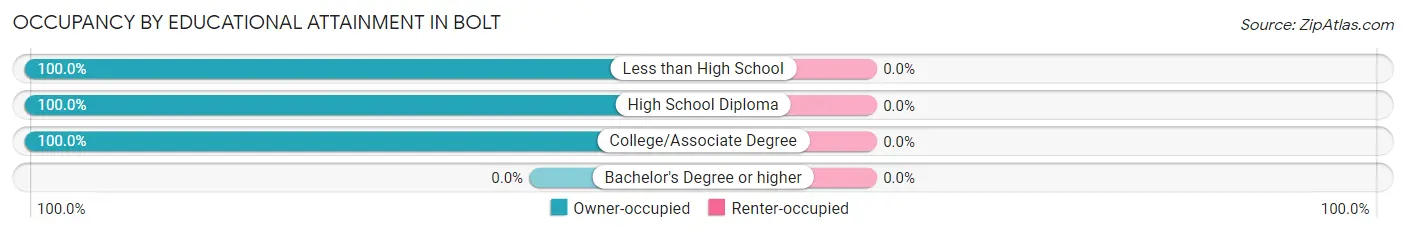
| Household Size | Owner-occupied | Renter-occupied |
| Less than High School | 31 (100.0%) | 0 (0.0%) |
| High School Diploma | 49 (100.0%) | 0 (0.0%) |
| College/Associate Degree | 22 (100.0%) | 0 (0.0%) |
| Bachelor's Degree or higher | 0 (0.0%) | 0 (0.0%) |
Occupancy by Age of Householder in Bolt
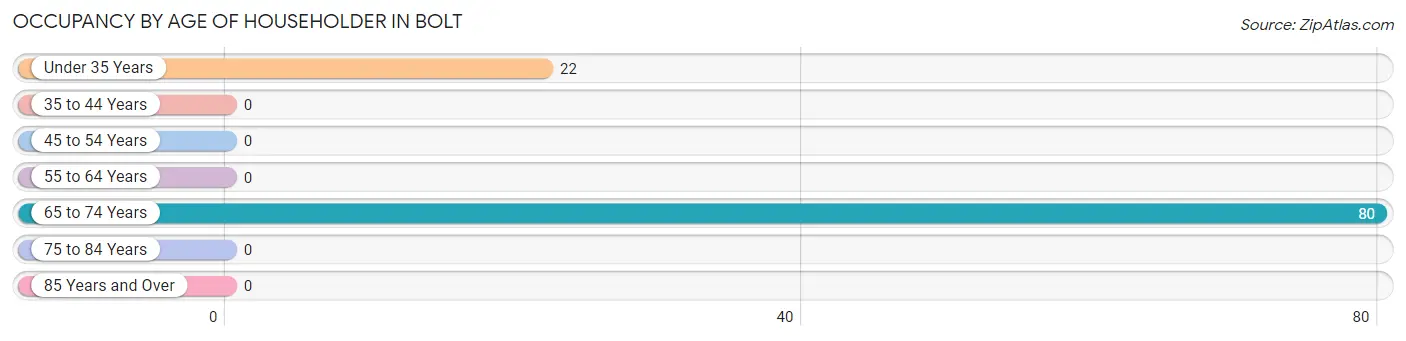
| Age Bracket | # Households | % Households |
| Under 35 Years | 22 | 21.6% |
| 35 to 44 Years | 0 | 0.0% |
| 45 to 54 Years | 0 | 0.0% |
| 55 to 64 Years | 0 | 0.0% |
| 65 to 74 Years | 80 | 78.4% |
| 75 to 84 Years | 0 | 0.0% |
| 85 Years and Over | 0 | 0.0% |
| Total | 102 | 100.0% |
Housing Finances in Bolt
Median Income by Occupancy in Bolt
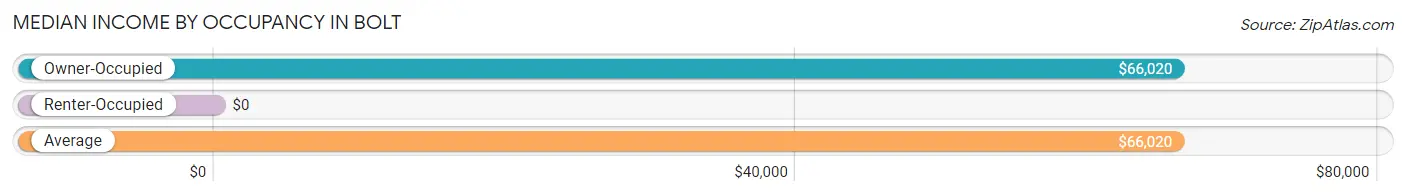
| Occupancy Type | # Households | Median Income |
| Owner-Occupied | 102 (100.0%) | $66,020 |
| Renter-Occupied | 0 (0.0%) | $0 |
| Average | 102 (100.0%) | $66,020 |
Occupancy by Householder Income Bracket in Bolt
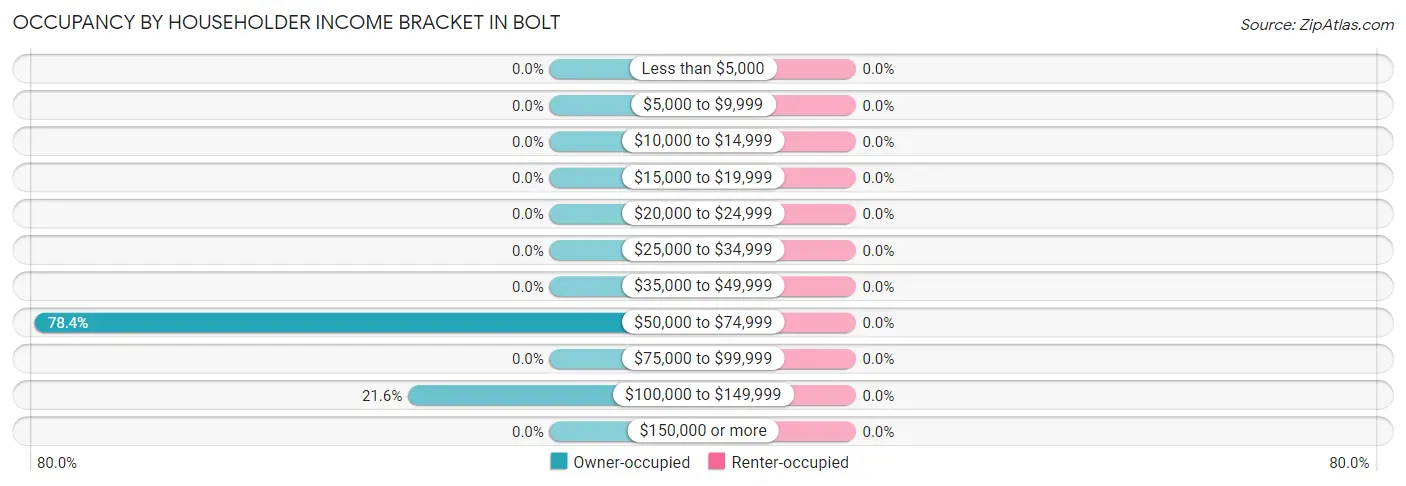
| Income Bracket | Owner-occupied | Renter-occupied |
| Less than $5,000 | 0 (0.0%) | 0 (0.0%) |
| $5,000 to $9,999 | 0 (0.0%) | 0 (0.0%) |
| $10,000 to $14,999 | 0 (0.0%) | 0 (0.0%) |
| $15,000 to $19,999 | 0 (0.0%) | 0 (0.0%) |
| $20,000 to $24,999 | 0 (0.0%) | 0 (0.0%) |
| $25,000 to $34,999 | 0 (0.0%) | 0 (0.0%) |
| $35,000 to $49,999 | 0 (0.0%) | 0 (0.0%) |
| $50,000 to $74,999 | 80 (78.4%) | 0 (0.0%) |
| $75,000 to $99,999 | 0 (0.0%) | 0 (0.0%) |
| $100,000 to $149,999 | 22 (21.6%) | 0 (0.0%) |
| $150,000 or more | 0 (0.0%) | 0 (0.0%) |
| Total | 102 (100.0%) | 0 (0.0%) |
Monthly Housing Cost Tiers in Bolt
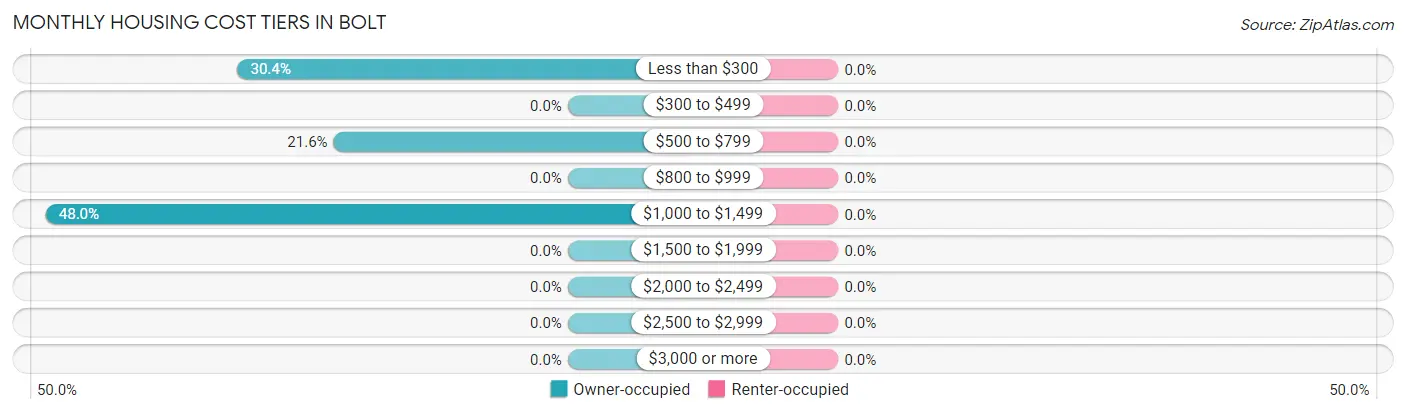
| Monthly Cost | Owner-occupied | Renter-occupied |
| Less than $300 | 31 (30.4%) | 0 (0.0%) |
| $300 to $499 | 0 (0.0%) | 0 (0.0%) |
| $500 to $799 | 22 (21.6%) | 0 (0.0%) |
| $800 to $999 | 0 (0.0%) | 0 (0.0%) |
| $1,000 to $1,499 | 49 (48.0%) | 0 (0.0%) |
| $1,500 to $1,999 | 0 (0.0%) | 0 (0.0%) |
| $2,000 to $2,499 | 0 (0.0%) | 0 (0.0%) |
| $2,500 to $2,999 | 0 (0.0%) | 0 (0.0%) |
| $3,000 or more | 0 (0.0%) | 0 (0.0%) |
| Total | 102 (100.0%) | 0 (0.0%) |
Physical Housing Characteristics in Bolt
Housing Structures in Bolt
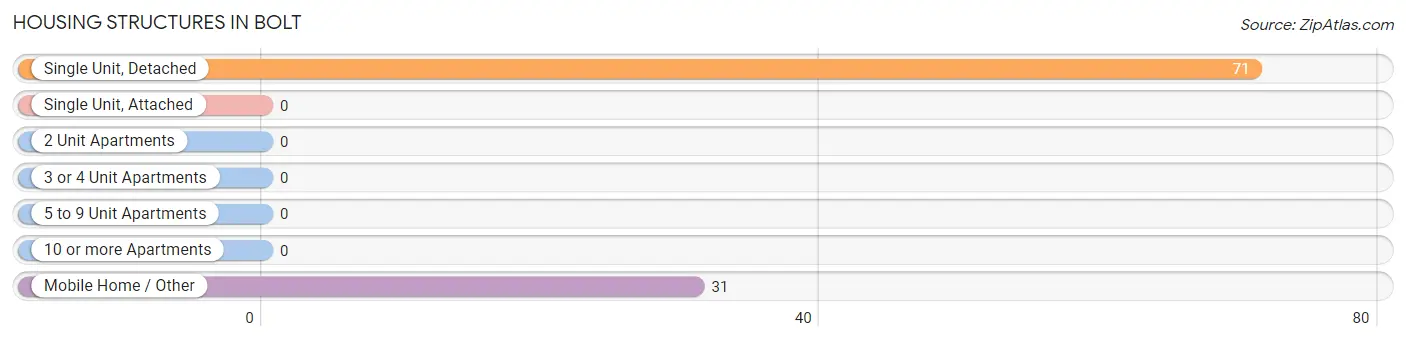
| Structure Type | # Housing Units | % Housing Units |
| Single Unit, Detached | 71 | 69.6% |
| Single Unit, Attached | 0 | 0.0% |
| 2 Unit Apartments | 0 | 0.0% |
| 3 or 4 Unit Apartments | 0 | 0.0% |
| 5 to 9 Unit Apartments | 0 | 0.0% |
| 10 or more Apartments | 0 | 0.0% |
| Mobile Home / Other | 31 | 30.4% |
| Total | 102 | 100.0% |
Housing Structures by Occupancy in Bolt
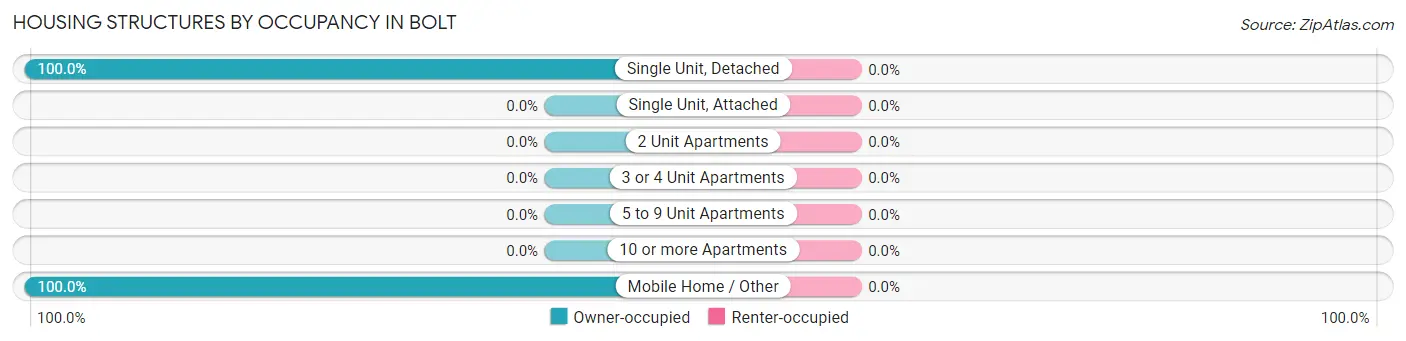
| Structure Type | Owner-occupied | Renter-occupied |
| Single Unit, Detached | 71 (100.0%) | 0 (0.0%) |
| Single Unit, Attached | 0 (0.0%) | 0 (0.0%) |
| 2 Unit Apartments | 0 (0.0%) | 0 (0.0%) |
| 3 or 4 Unit Apartments | 0 (0.0%) | 0 (0.0%) |
| 5 to 9 Unit Apartments | 0 (0.0%) | 0 (0.0%) |
| 10 or more Apartments | 0 (0.0%) | 0 (0.0%) |
| Mobile Home / Other | 31 (100.0%) | 0 (0.0%) |
| Total | 102 (100.0%) | 0 (0.0%) |
Housing Structures by Number of Rooms in Bolt
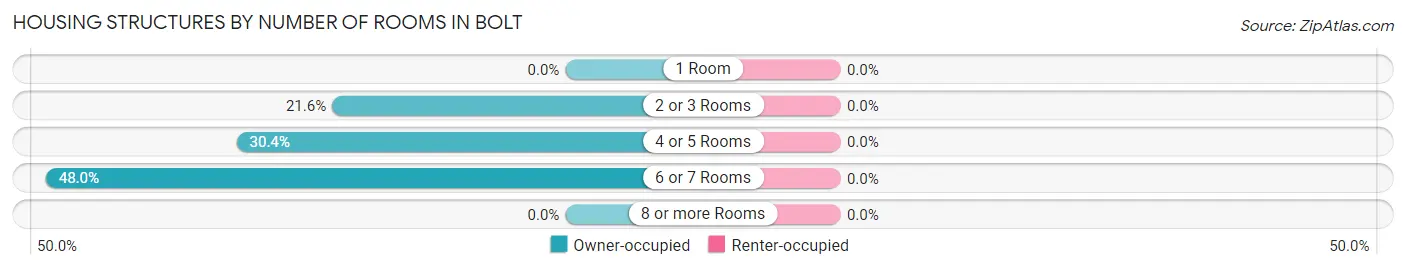
| Number of Rooms | Owner-occupied | Renter-occupied |
| 1 Room | 0 (0.0%) | 0 (0.0%) |
| 2 or 3 Rooms | 22 (21.6%) | 0 (0.0%) |
| 4 or 5 Rooms | 31 (30.4%) | 0 (0.0%) |
| 6 or 7 Rooms | 49 (48.0%) | 0 (0.0%) |
| 8 or more Rooms | 0 (0.0%) | 0 (0.0%) |
| Total | 102 (100.0%) | 0 (0.0%) |
Housing Structure by Heating Type in Bolt
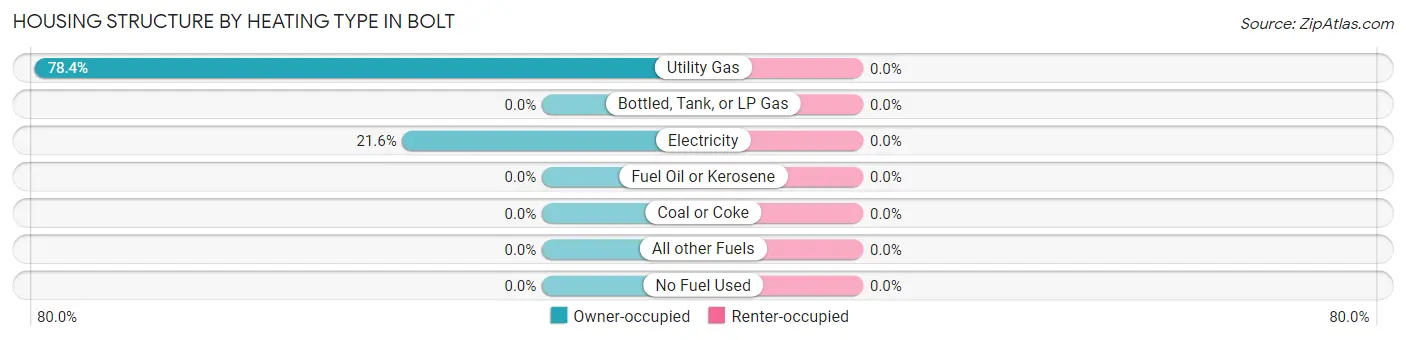
| Heating Type | Owner-occupied | Renter-occupied |
| Utility Gas | 80 (78.4%) | 0 (0.0%) |
| Bottled, Tank, or LP Gas | 0 (0.0%) | 0 (0.0%) |
| Electricity | 22 (21.6%) | 0 (0.0%) |
| Fuel Oil or Kerosene | 0 (0.0%) | 0 (0.0%) |
| Coal or Coke | 0 (0.0%) | 0 (0.0%) |
| All other Fuels | 0 (0.0%) | 0 (0.0%) |
| No Fuel Used | 0 (0.0%) | 0 (0.0%) |
| Total | 102 (100.0%) | 0 (0.0%) |
Household Vehicle Usage in Bolt
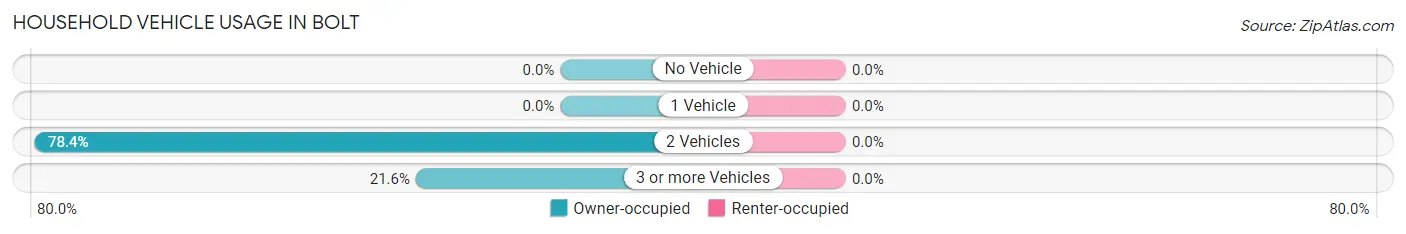
| Vehicles per Household | Owner-occupied | Renter-occupied |
| No Vehicle | 0 (0.0%) | 0 (0.0%) |
| 1 Vehicle | 0 (0.0%) | 0 (0.0%) |
| 2 Vehicles | 80 (78.4%) | 0 (0.0%) |
| 3 or more Vehicles | 22 (21.6%) | 0 (0.0%) |
| Total | 102 (100.0%) | 0 (0.0%) |
Real Estate & Mortgages in Bolt
Real Estate and Mortgage Overview in Bolt
| Characteristic | Without Mortgage | With Mortgage |
| Housing Units | 31 | 71 |
| Median Property Value | - | - |
| Median Household Income | - | - |
| Monthly Housing Costs | - | - |
| Real Estate Taxes | - | - |
Property Value by Mortgage Status in Bolt
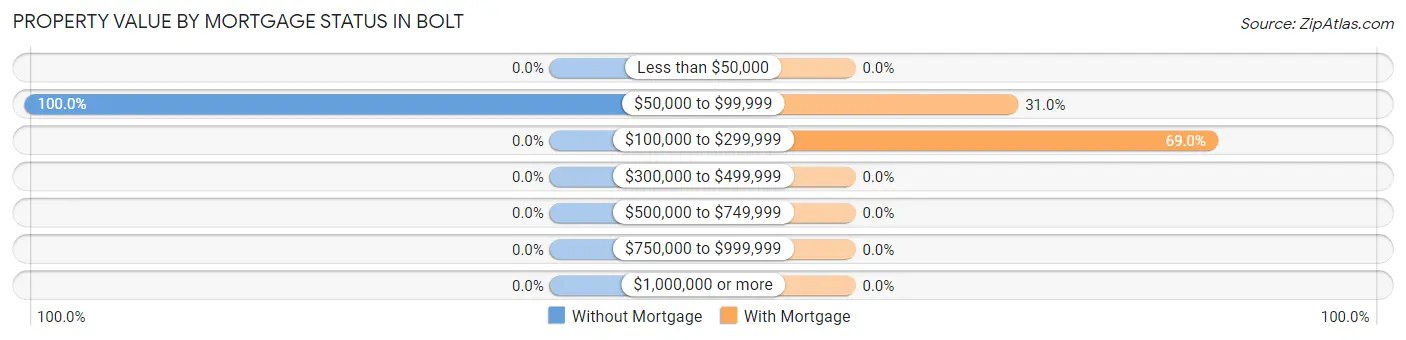
| Property Value | Without Mortgage | With Mortgage |
| Less than $50,000 | 0 (0.0%) | 0 (0.0%) |
| $50,000 to $99,999 | 31 (100.0%) | 22 (31.0%) |
| $100,000 to $299,999 | 0 (0.0%) | 49 (69.0%) |
| $300,000 to $499,999 | 0 (0.0%) | 0 (0.0%) |
| $500,000 to $749,999 | 0 (0.0%) | 0 (0.0%) |
| $750,000 to $999,999 | 0 (0.0%) | 0 (0.0%) |
| $1,000,000 or more | 0 (0.0%) | 0 (0.0%) |
| Total | 31 (100.0%) | 71 (100.0%) |
Household Income by Mortgage Status in Bolt
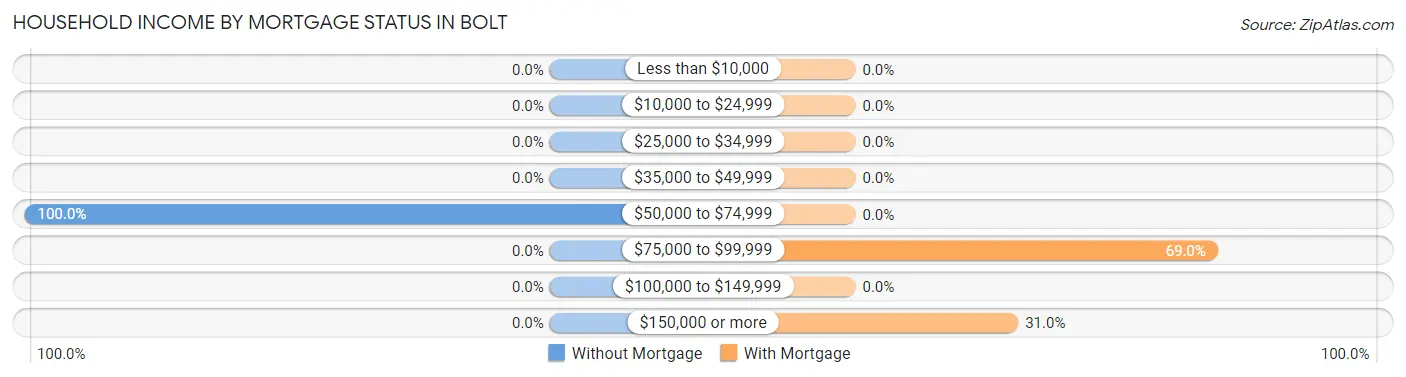
| Household Income | Without Mortgage | With Mortgage |
| Less than $10,000 | 0 (0.0%) | 0 (0.0%) |
| $10,000 to $24,999 | 0 (0.0%) | 0 (0.0%) |
| $25,000 to $34,999 | 0 (0.0%) | 0 (0.0%) |
| $35,000 to $49,999 | 0 (0.0%) | 0 (0.0%) |
| $50,000 to $74,999 | 31 (100.0%) | 0 (0.0%) |
| $75,000 to $99,999 | 0 (0.0%) | 49 (69.0%) |
| $100,000 to $149,999 | 0 (0.0%) | 0 (0.0%) |
| $150,000 or more | 0 (0.0%) | 22 (31.0%) |
| Total | 31 (100.0%) | 71 (100.0%) |
Property Value to Household Income Ratio in Bolt
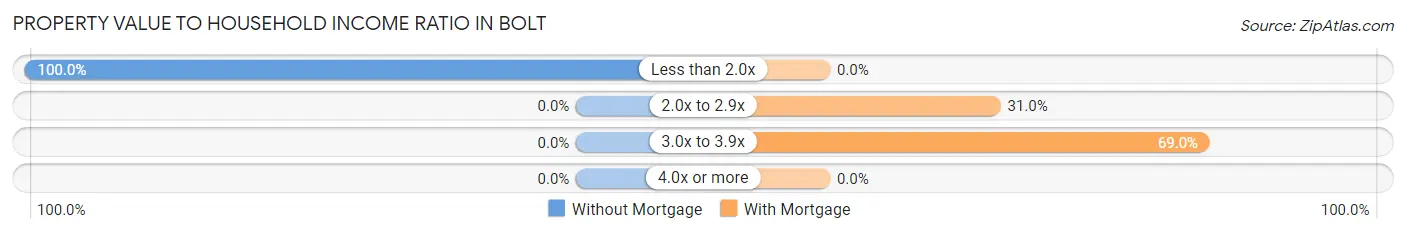
| Value-to-Income Ratio | Without Mortgage | With Mortgage |
| Less than 2.0x | 31 (100.0%) | 0 (0.0%) |
| 2.0x to 2.9x | 0 (0.0%) | 22 (31.0%) |
| 3.0x to 3.9x | 0 (0.0%) | 49 (69.0%) |
| 4.0x or more | 0 (0.0%) | 0 (0.0%) |
| Total | 31 (100.0%) | 71 (100.0%) |
Real Estate Taxes by Mortgage Status in Bolt
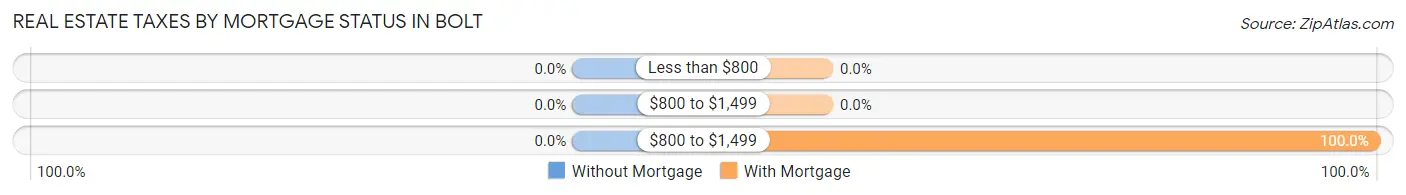
| Property Taxes | Without Mortgage | With Mortgage |
| Less than $800 | 0 (0.0%) | 0 (0.0%) |
| $800 to $1,499 | 0 (0.0%) | 0 (0.0%) |
| $800 to $1,499 | 0 (0.0%) | 71 (100.0%) |
| Total | 31 (100.0%) | 71 (100.0%) |
Health & Disability in Bolt
Health Insurance Coverage by Age in Bolt
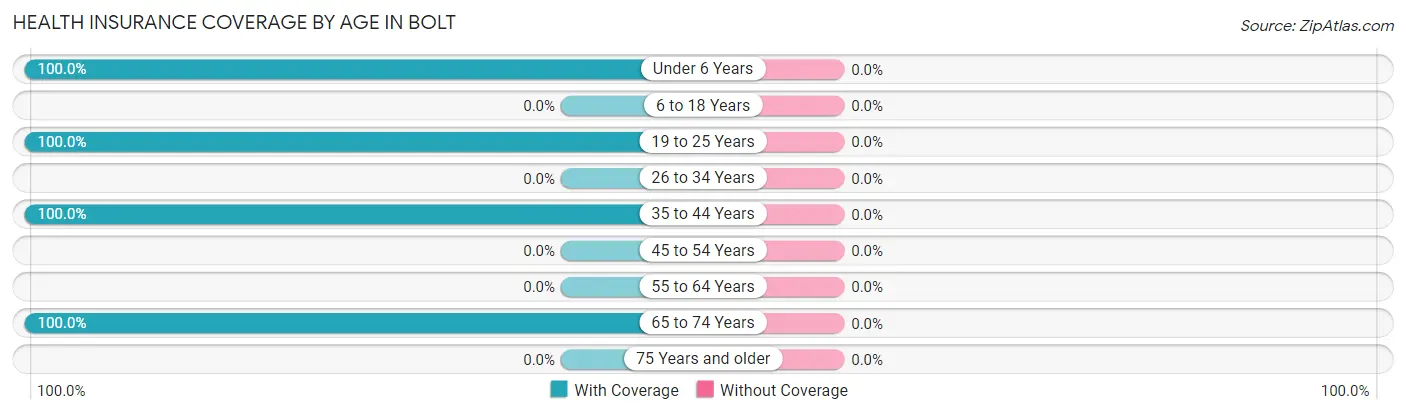
| Age Bracket | With Coverage | Without Coverage |
| Under 6 Years | 27 (100.0%) | 0 (0.0%) |
| 6 to 18 Years | 0 (0.0%) | 0 (0.0%) |
| 19 to 25 Years | 41 (100.0%) | 0 (0.0%) |
| 26 to 34 Years | 0 (0.0%) | 0 (0.0%) |
| 35 to 44 Years | 44 (100.0%) | 0 (0.0%) |
| 45 to 54 Years | 0 (0.0%) | 0 (0.0%) |
| 55 to 64 Years | 0 (0.0%) | 0 (0.0%) |
| 65 to 74 Years | 144 (100.0%) | 0 (0.0%) |
| 75 Years and older | 0 (0.0%) | 0 (0.0%) |
| Total | 256 (100.0%) | 0 (0.0%) |
Health Insurance Coverage by Citizenship Status in Bolt
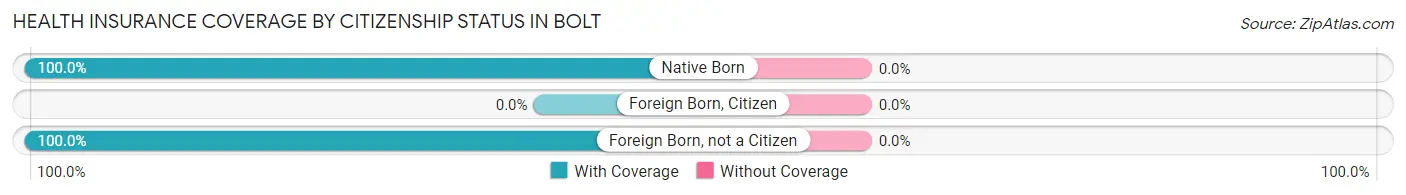
| Citizenship Status | With Coverage | Without Coverage |
| Native Born | 27 (100.0%) | 0 (0.0%) |
| Foreign Born, Citizen | 0 (0.0%) | 0 (0.0%) |
| Foreign Born, not a Citizen | 41 (100.0%) | 0 (0.0%) |
Health Insurance Coverage by Household Income in Bolt
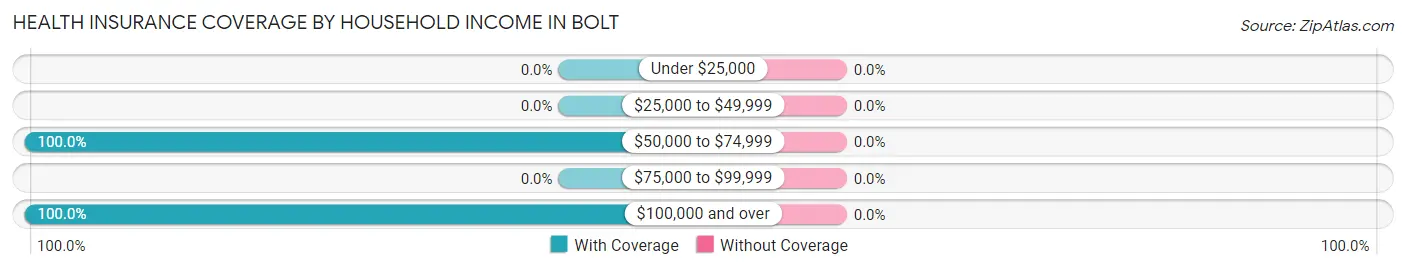
| Household Income | With Coverage | Without Coverage |
| Under $25,000 | 0 (0.0%) | 0 (0.0%) |
| $25,000 to $49,999 | 0 (0.0%) | 0 (0.0%) |
| $50,000 to $74,999 | 188 (100.0%) | 0 (0.0%) |
| $75,000 to $99,999 | 0 (0.0%) | 0 (0.0%) |
| $100,000 and over | 68 (100.0%) | 0 (0.0%) |
Public vs Private Health Insurance Coverage by Age in Bolt
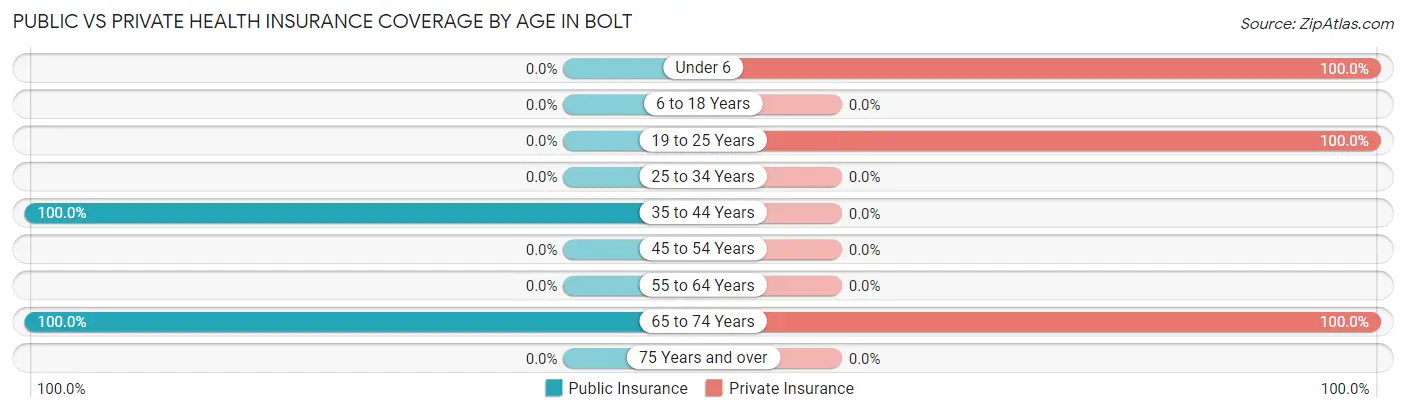
| Age Bracket | Public Insurance | Private Insurance |
| Under 6 | 0 (0.0%) | 27 (100.0%) |
| 6 to 18 Years | 0 (0.0%) | 0 (0.0%) |
| 19 to 25 Years | 0 (0.0%) | 41 (100.0%) |
| 25 to 34 Years | 0 (0.0%) | 0 (0.0%) |
| 35 to 44 Years | 44 (100.0%) | 0 (0.0%) |
| 45 to 54 Years | 0 (0.0%) | 0 (0.0%) |
| 55 to 64 Years | 0 (0.0%) | 0 (0.0%) |
| 65 to 74 Years | 144 (100.0%) | 144 (100.0%) |
| 75 Years and over | 0 (0.0%) | 0 (0.0%) |
| Total | 188 (73.4%) | 212 (82.8%) |
Disability Status by Sex by Age in Bolt
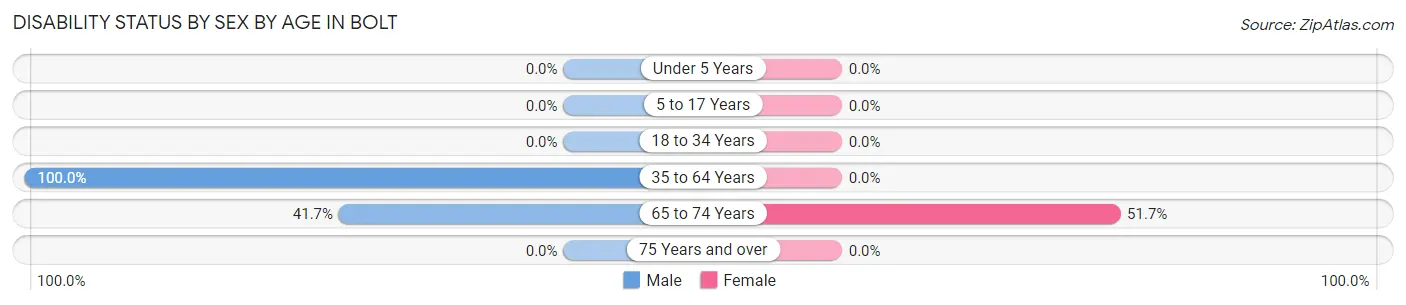
| Age Bracket | Male | Female |
| Under 5 Years | 0 (0.0%) | 0 (0.0%) |
| 5 to 17 Years | 0 (0.0%) | 0 (0.0%) |
| 18 to 34 Years | 0 (0.0%) | 0 (0.0%) |
| 35 to 64 Years | 44 (100.0%) | 0 (0.0%) |
| 65 to 74 Years | 35 (41.7%) | 31 (51.7%) |
| 75 Years and over | 0 (0.0%) | 0 (0.0%) |
Disability Class by Sex by Age in Bolt
Disability Class: Hearing Difficulty
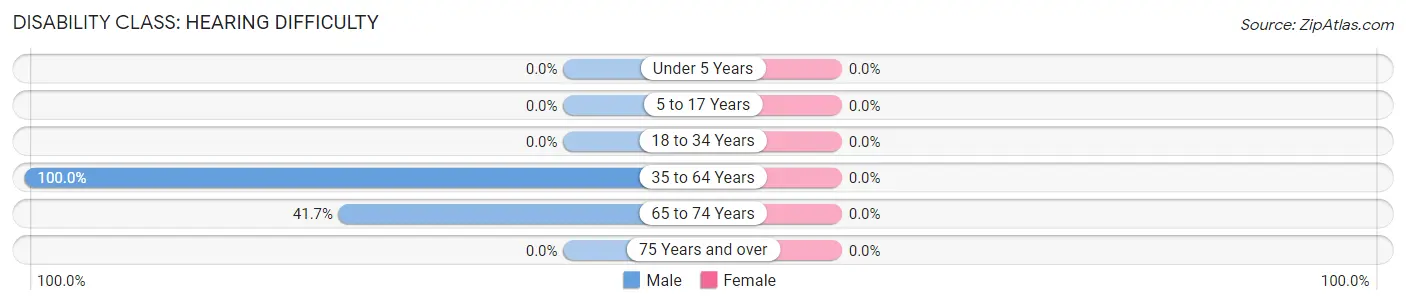
| Age Bracket | Male | Female |
| Under 5 Years | 0 (0.0%) | 0 (0.0%) |
| 5 to 17 Years | 0 (0.0%) | 0 (0.0%) |
| 18 to 34 Years | 0 (0.0%) | 0 (0.0%) |
| 35 to 64 Years | 44 (100.0%) | 0 (0.0%) |
| 65 to 74 Years | 35 (41.7%) | 0 (0.0%) |
| 75 Years and over | 0 (0.0%) | 0 (0.0%) |
Disability Class: Vision Difficulty
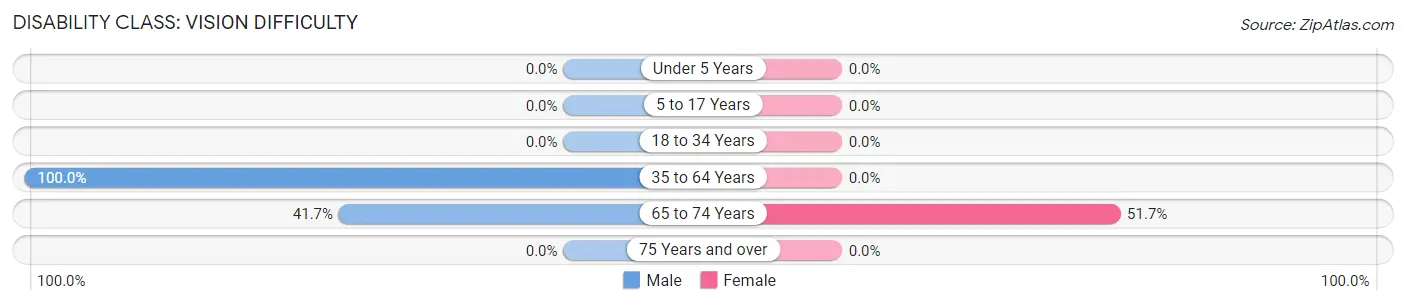
| Age Bracket | Male | Female |
| Under 5 Years | 0 (0.0%) | 0 (0.0%) |
| 5 to 17 Years | 0 (0.0%) | 0 (0.0%) |
| 18 to 34 Years | 0 (0.0%) | 0 (0.0%) |
| 35 to 64 Years | 44 (100.0%) | 0 (0.0%) |
| 65 to 74 Years | 35 (41.7%) | 31 (51.7%) |
| 75 Years and over | 0 (0.0%) | 0 (0.0%) |
Disability Class: Cognitive Difficulty
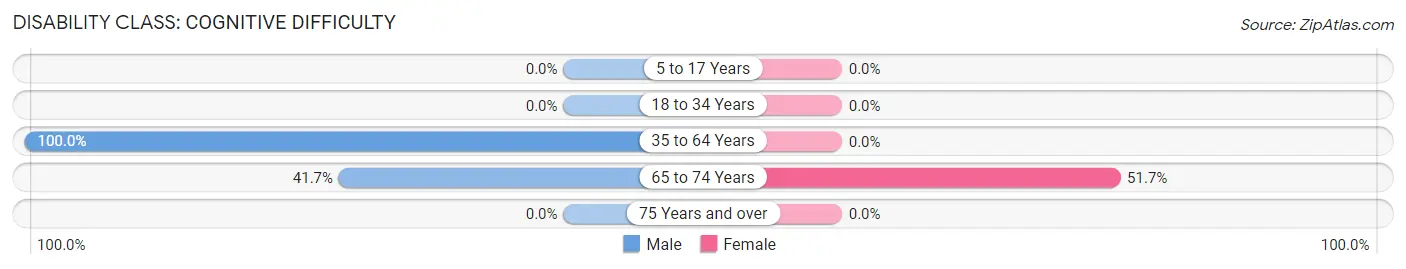
| Age Bracket | Male | Female |
| 5 to 17 Years | 0 (0.0%) | 0 (0.0%) |
| 18 to 34 Years | 0 (0.0%) | 0 (0.0%) |
| 35 to 64 Years | 44 (100.0%) | 0 (0.0%) |
| 65 to 74 Years | 35 (41.7%) | 31 (51.7%) |
| 75 Years and over | 0 (0.0%) | 0 (0.0%) |
Disability Class: Ambulatory Difficulty
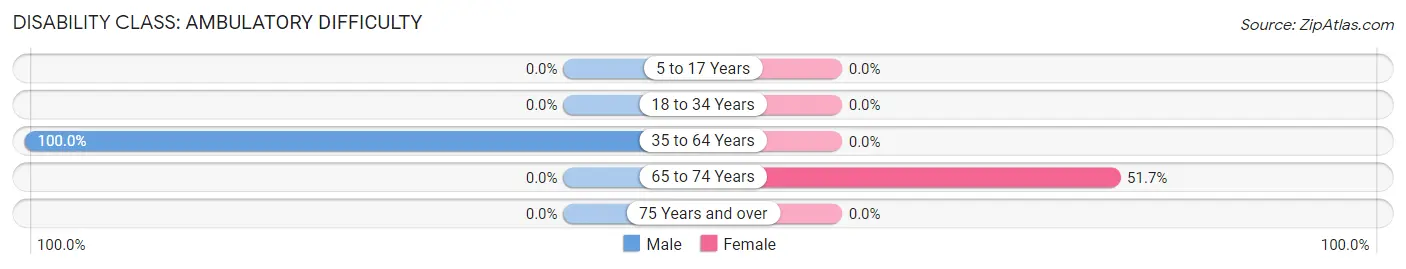
| Age Bracket | Male | Female |
| 5 to 17 Years | 0 (0.0%) | 0 (0.0%) |
| 18 to 34 Years | 0 (0.0%) | 0 (0.0%) |
| 35 to 64 Years | 44 (100.0%) | 0 (0.0%) |
| 65 to 74 Years | 0 (0.0%) | 31 (51.7%) |
| 75 Years and over | 0 (0.0%) | 0 (0.0%) |
Disability Class: Self-Care Difficulty
| Age Bracket | Male | Female |
| 5 to 17 Years | 0 (0.0%) | 0 (0.0%) |
| 18 to 34 Years | 0 (0.0%) | 0 (0.0%) |
| 35 to 64 Years | 0 (0.0%) | 0 (0.0%) |
| 65 to 74 Years | 0 (0.0%) | 0 (0.0%) |
| 75 Years and over | 0 (0.0%) | 0 (0.0%) |
Technology Access in Bolt
Computing Device Access in Bolt
| Device Type | # Households | % Households |
| Desktop or Laptop | 102 | 100.0% |
| Smartphone | 22 | 21.6% |
| Tablet | 53 | 52.0% |
| No Computing Device | 0 | 0.0% |
| Total | 102 | 100.0% |
Internet Access in Bolt
| Internet Type | # Households | % Households |
| Dial-Up Internet | 0 | 0.0% |
| Broadband Home | 49 | 48.0% |
| Cellular Data Only | 0 | 0.0% |
| Satellite Internet | 22 | 21.6% |
| No Internet | 31 | 30.4% |
| Total | 102 | 100.0% |
Bolt Summary
Bolt, West Virginia is a small unincorporated community located in the northern part of the state in Preston County. It is situated in the Appalachian Mountains and is surrounded by the Monongahela National Forest. The population of Bolt was estimated to be around 200 people in 2000.
History
Bolt was first settled in the late 1700s by a group of German immigrants. The town was originally known as “Boltsburg” and was named after the nearby creek. The town was officially incorporated in 1891 and was home to a variety of businesses, including a sawmill, a gristmill, a blacksmith shop, and a general store.
In the early 1900s, the town began to decline as the timber industry moved away from the area. The population decreased and the businesses closed. In the 1950s, the town was revitalized when the nearby coal mines began to open. This brought new jobs and people to the area and the population began to grow again.
Geography
Bolt is located in the northern part of Preston County in the Appalachian Mountains. The town is situated in a valley surrounded by the Monongahela National Forest. The town is located near the headwaters of the Cheat River and is about 25 miles from the Maryland border.
The climate in Bolt is humid continental, with cold winters and hot, humid summers. The average annual temperature is around 50 degrees Fahrenheit. The average annual precipitation is around 40 inches.
Economy
The economy of Bolt is largely based on the coal mining industry. The town is home to several coal mines, including the Bolt Mine, which is the largest in the area. The coal industry provides jobs for many of the town’s residents.
In addition to the coal industry, Bolt is also home to a variety of small businesses, including a general store, a gas station, and a few restaurants. The town also has a post office and a volunteer fire department.
Demographics
The population of Bolt was estimated to be around 200 people in 2000. The town is predominantly white, with a small African American population. The median household income is around $30,000. The town has a high poverty rate, with around 25% of the population living below the poverty line.
Bolt is a small, rural community with a rich history and a strong sense of community. The town is home to a variety of businesses and provides jobs for many of its residents. The town is surrounded by the beauty of the Appalachian Mountains and is a great place to live and work.
Common Questions
What is Per Capita Income in Bolt?
Per Capita income in Bolt is $29,879.
What is the Median Family Income in Bolt?
Median Family Income in Bolt is $66,020.
What is the Median Household income in Bolt?
Median Household Income in Bolt is $66,020.
What is Inequality or Gini Index in Bolt?
Inequality or Gini Index in Bolt is 0.10.
What is the Total Population of Bolt?
Total Population of Bolt is 256.
What is the Total Male Population of Bolt?
Total Male Population of Bolt is 150.
What is the Total Female Population of Bolt?
Total Female Population of Bolt is 106.
What is the Ratio of Males per 100 Females in Bolt?
There are 141.51 Males per 100 Females in Bolt.
What is the Ratio of Females per 100 Males in Bolt?
There are 70.67 Females per 100 Males in Bolt.
What is the Median Population Age in Bolt?
Median Population Age in Bolt is 65.6 Years.
What is the Average Family Size in Bolt
Average Family Size in Bolt is 2.5 People.
What is the Average Household Size in Bolt
Average Household Size in Bolt is 2.5 People.
How Large is the Labor Force in Bolt?
There are 41 People in the Labor Forcein in Bolt.
What is the Percentage of People in the Labor Force in Bolt?
17.9% of People are in the Labor Force in Bolt.