Buckhorn, KY Map & Demographics
Buckhorn Map
Buckhorn Overview
$31,925
PER CAPITA INCOME
$107,321
AVG FAMILY INCOME
$106,071
AVG HOUSEHOLD INCOME
65.4%
WAGE / INCOME GAP [ % ]
34.6¢/ $1
WAGE / INCOME GAP [ $ ]
0.41
INEQUALITY / GINI INDEX
68
TOTAL POPULATION
45
MALE POPULATION
23
FEMALE POPULATION
195.65
MALES / 100 FEMALES
51.11
FEMALES / 100 MALES
47.6
MEDIAN AGE
2.1
AVG FAMILY SIZE
1.8
AVG HOUSEHOLD SIZE
30
LABOR FORCE [ PEOPLE ]
53.6%
PERCENT IN LABOR FORCE
Buckhorn Zip Codes
Buckhorn Area Codes
Income in Buckhorn
Income Overview in Buckhorn
Per Capita Income in Buckhorn is $31,925, while median incomes of families and households are $107,321 and $106,071 respectively.
| Characteristic | Number | Measure |
| Per Capita Income | 68 | $31,925 |
| Median Family Income | 17 | $107,321 |
| Mean Family Income | 17 | $125,624 |
| Median Household Income | 24 | $106,071 |
| Mean Household Income | 24 | $92,129 |
| Income Deficit | 17 | $0 |
| Wage / Income Gap (%) | 68 | 65.38% |
| Wage / Income Gap ($) | 68 | 34.62¢ per $1 |
| Gini / Inequality Index | 68 | 0.41 |
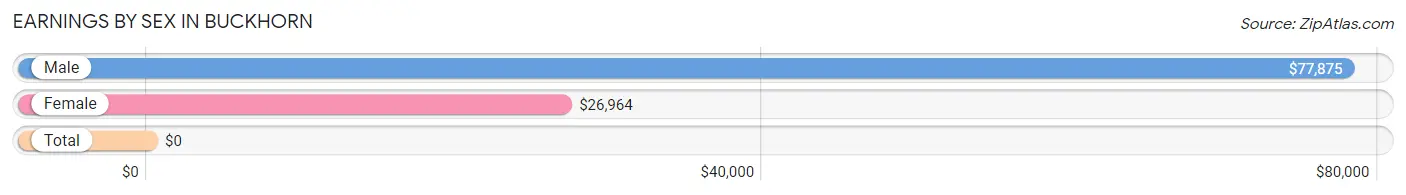
Earnings by Sex in Buckhorn
| Sex | Number | Average Earnings |
| Male | 17 (56.7%) | $77,875 |
| Female | 13 (43.3%) | $26,964 |
| Total | 30 (100.0%) | $0 |
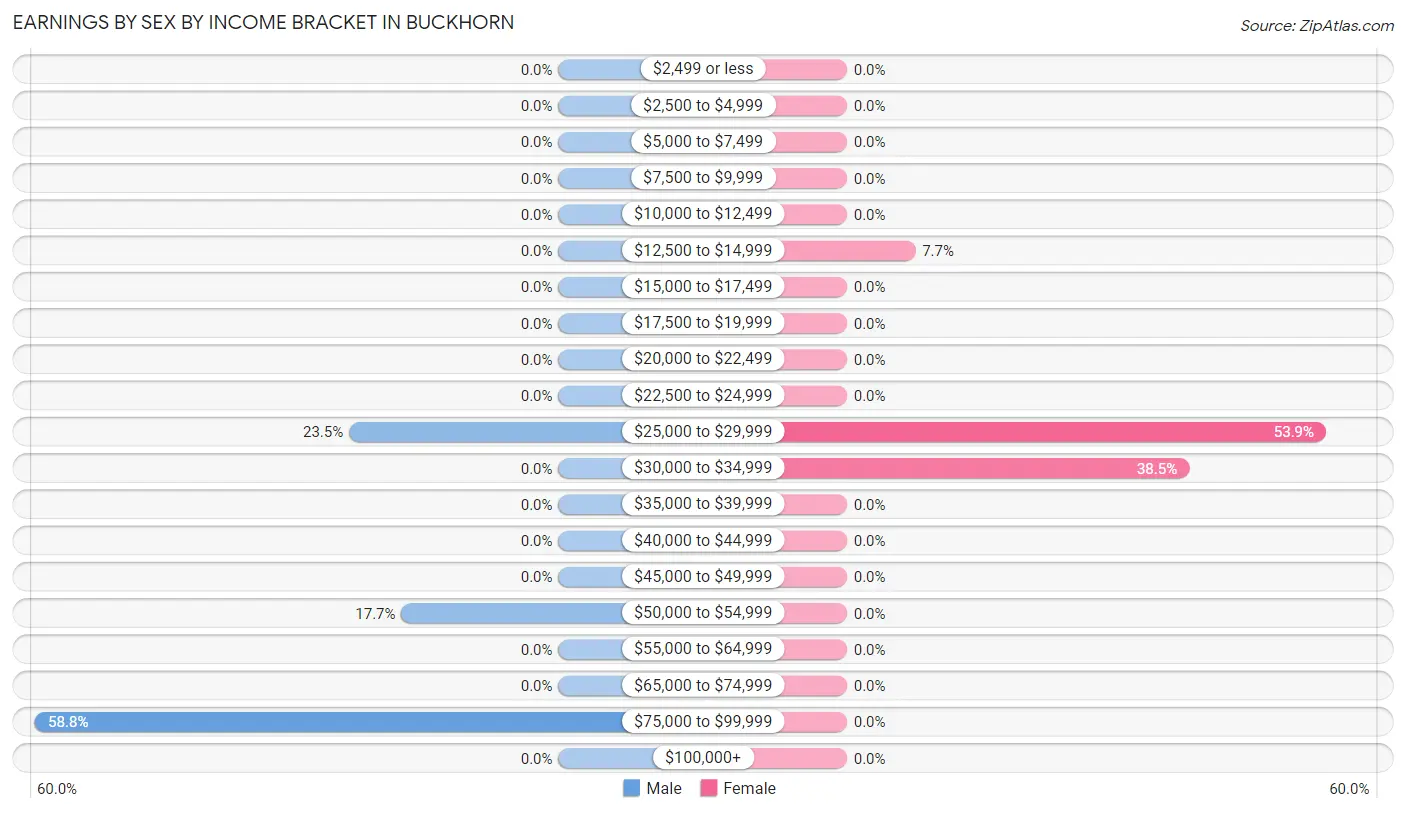
Earnings by Sex by Income Bracket in Buckhorn
The most common earnings brackets in Buckhorn are $75,000 to $99,999 for men (10 | 58.8%) and $25,000 to $29,999 for women (7 | 53.8%).
| Income | Male | Female |
| $2,499 or less | 0 (0.0%) | 0 (0.0%) |
| $2,500 to $4,999 | 0 (0.0%) | 0 (0.0%) |
| $5,000 to $7,499 | 0 (0.0%) | 0 (0.0%) |
| $7,500 to $9,999 | 0 (0.0%) | 0 (0.0%) |
| $10,000 to $12,499 | 0 (0.0%) | 0 (0.0%) |
| $12,500 to $14,999 | 0 (0.0%) | 1 (7.7%) |
| $15,000 to $17,499 | 0 (0.0%) | 0 (0.0%) |
| $17,500 to $19,999 | 0 (0.0%) | 0 (0.0%) |
| $20,000 to $22,499 | 0 (0.0%) | 0 (0.0%) |
| $22,500 to $24,999 | 0 (0.0%) | 0 (0.0%) |
| $25,000 to $29,999 | 4 (23.5%) | 7 (53.8%) |
| $30,000 to $34,999 | 0 (0.0%) | 5 (38.5%) |
| $35,000 to $39,999 | 0 (0.0%) | 0 (0.0%) |
| $40,000 to $44,999 | 0 (0.0%) | 0 (0.0%) |
| $45,000 to $49,999 | 0 (0.0%) | 0 (0.0%) |
| $50,000 to $54,999 | 3 (17.6%) | 0 (0.0%) |
| $55,000 to $64,999 | 0 (0.0%) | 0 (0.0%) |
| $65,000 to $74,999 | 0 (0.0%) | 0 (0.0%) |
| $75,000 to $99,999 | 10 (58.8%) | 0 (0.0%) |
| $100,000+ | 0 (0.0%) | 0 (0.0%) |
| Total | 17 (100.0%) | 13 (100.0%) |
Earnings by Sex by Educational Attainment in Buckhorn
| Educational Attainment | Male Income | Female Income |
| Less than High School | - | - |
| High School Diploma | - | - |
| College or Associate's Degree | - | - |
| Bachelor's Degree | - | - |
| Graduate Degree | - | - |
| Total | $77,875 | $26,964 |
Family Income in Buckhorn
Family Income Brackets in Buckhorn
According to the Buckhorn family income data, there are 12 families falling into the $100,000 to $149,999 income range, which is the most common income bracket and makes up 70.6% of all families.
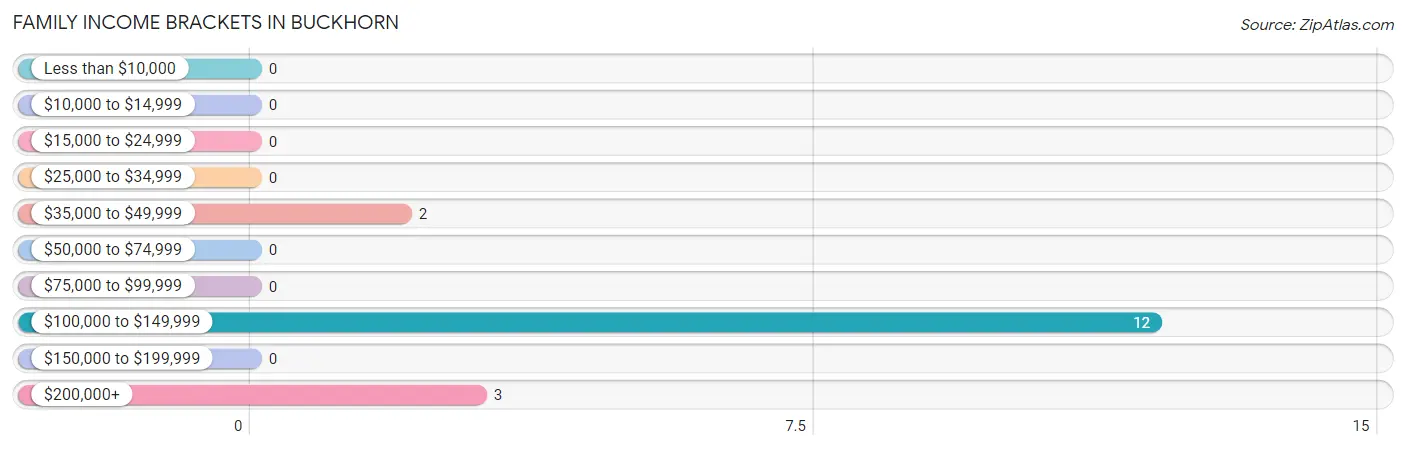
| Income Bracket | # Families | % Families |
| Less than $10,000 | 0 | 0.0% |
| $10,000 to $14,999 | 0 | 0.0% |
| $15,000 to $24,999 | 0 | 0.0% |
| $25,000 to $34,999 | 0 | 0.0% |
| $35,000 to $49,999 | 2 | 11.8% |
| $50,000 to $74,999 | 0 | 0.0% |
| $75,000 to $99,999 | 0 | 0.0% |
| $100,000 to $149,999 | 12 | 70.6% |
| $150,000 to $199,999 | 0 | 0.0% |
| $200,000+ | 3 | 17.6% |
Family Income by Famaliy Size in Buckhorn
2-person families (14 | 82.4%) account for the highest median family income in Buckhorn with $106,786 per family, while 2-person families (14 | 82.4%) have the highest median income of $53,393 per family member.
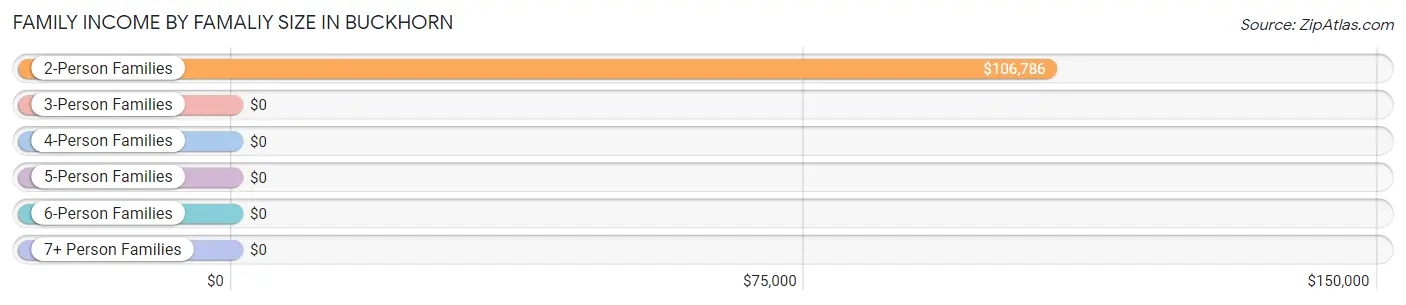
| Income Bracket | # Families | Median Income |
| 2-Person Families | 14 (82.4%) | $106,786 |
| 3-Person Families | 3 (17.6%) | $0 |
| 4-Person Families | 0 (0.0%) | $0 |
| 5-Person Families | 0 (0.0%) | $0 |
| 6-Person Families | 0 (0.0%) | $0 |
| 7+ Person Families | 0 (0.0%) | $0 |
| Total | 17 (100.0%) | $107,321 |
Family Income by Number of Earners in Buckhorn
| Number of Earners | # Families | Median Income |
| No Earners | 0 (0.0%) | $0 |
| 1 Earner | 5 (29.4%) | $0 |
| 2 Earners | 12 (70.6%) | $0 |
| 3+ Earners | 0 (0.0%) | $0 |
| Total | 17 (100.0%) | $107,321 |
Household Income in Buckhorn
Household Income Brackets in Buckhorn
With 12 households falling in the category, the $100,000 to $149,999 income range is the most frequent in Buckhorn, accounting for 50.0% of all households.
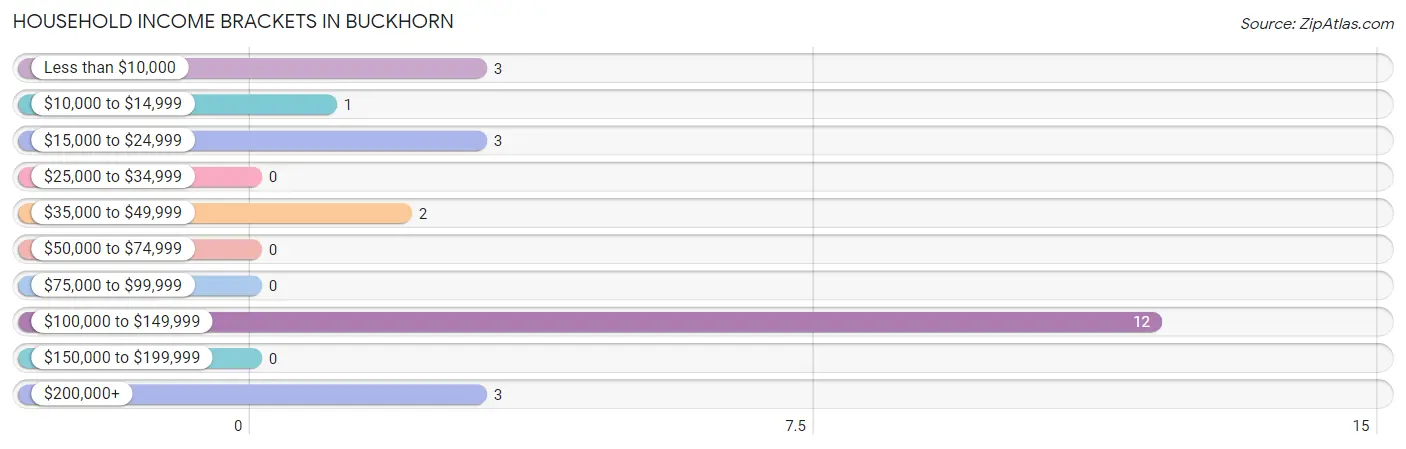
| Income Bracket | # Households | % Households |
| Less than $10,000 | 3 | 12.5% |
| $10,000 to $14,999 | 1 | 4.2% |
| $15,000 to $24,999 | 3 | 12.5% |
| $25,000 to $34,999 | 0 | 0.0% |
| $35,000 to $49,999 | 2 | 8.3% |
| $50,000 to $74,999 | 0 | 0.0% |
| $75,000 to $99,999 | 0 | 0.0% |
| $100,000 to $149,999 | 12 | 50.0% |
| $150,000 to $199,999 | 0 | 0.0% |
| $200,000+ | 3 | 12.5% |
Household Income by Householder Age in Buckhorn
| Income Bracket | # Households | Median Income |
| 15 to 24 Years | 0 (0.0%) | $0 |
| 25 to 44 Years | 3 (12.5%) | $0 |
| 45 to 64 Years | 10 (41.7%) | $0 |
| 65+ Years | 11 (45.8%) | $0 |
| Total | 24 (100.0%) | $106,071 |
Poverty in Buckhorn
Income Below Poverty by Sex and Age in Buckhorn
With 27.6% poverty level for males and 10.0% for females among the residents of Buckhorn, 18 to 24 year old males and 55 to 64 year old females are the most vulnerable to poverty, with 6 males (100.0%) and 1 females (50.0%) in their respective age groups living below the poverty level.
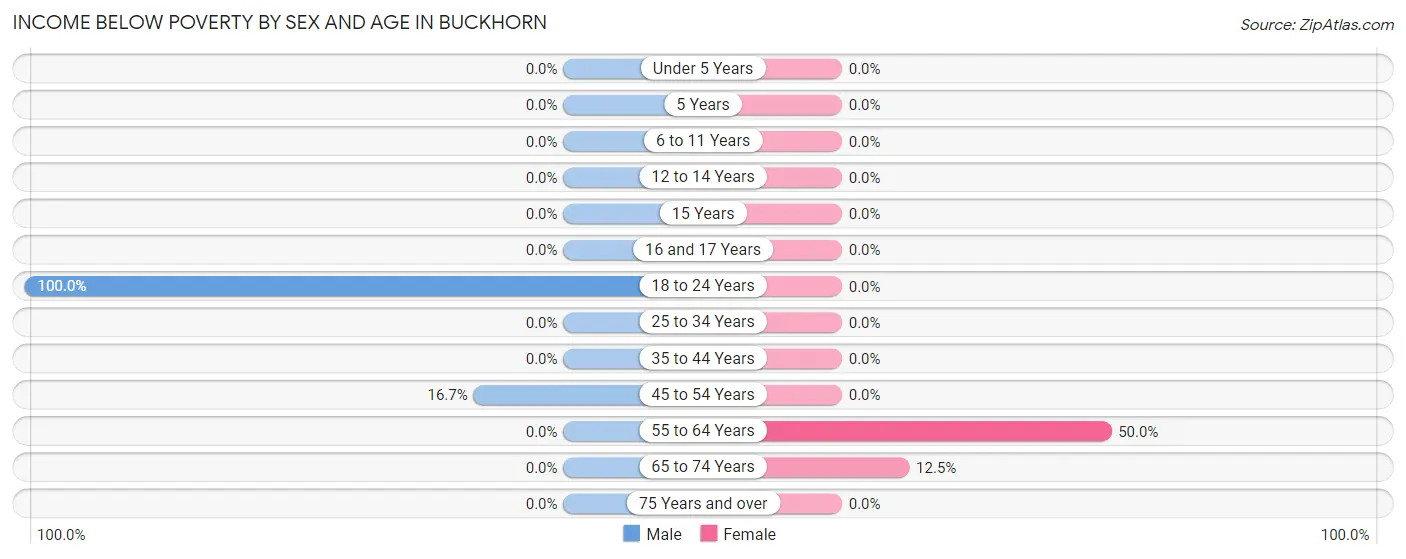
| Age Bracket | Male | Female |
| Under 5 Years | 0 (0.0%) | 0 (0.0%) |
| 5 Years | 0 (0.0%) | 0 (0.0%) |
| 6 to 11 Years | 0 (0.0%) | 0 (0.0%) |
| 12 to 14 Years | 0 (0.0%) | 0 (0.0%) |
| 15 Years | 0 (0.0%) | 0 (0.0%) |
| 16 and 17 Years | 0 (0.0%) | 0 (0.0%) |
| 18 to 24 Years | 6 (100.0%) | 0 (0.0%) |
| 25 to 34 Years | 0 (0.0%) | 0 (0.0%) |
| 35 to 44 Years | 0 (0.0%) | 0 (0.0%) |
| 45 to 54 Years | 2 (16.7%) | 0 (0.0%) |
| 55 to 64 Years | 0 (0.0%) | 1 (50.0%) |
| 65 to 74 Years | 0 (0.0%) | 1 (12.5%) |
| 75 Years and over | 0 (0.0%) | 0 (0.0%) |
| Total | 8 (27.6%) | 2 (10.0%) |
Income Above Poverty by Sex and Age in Buckhorn
According to the poverty statistics in Buckhorn, males aged 35 to 44 years and females aged 45 to 54 years are the age groups that are most secure financially, with 100.0% of males and 100.0% of females in these age groups living above the poverty line.
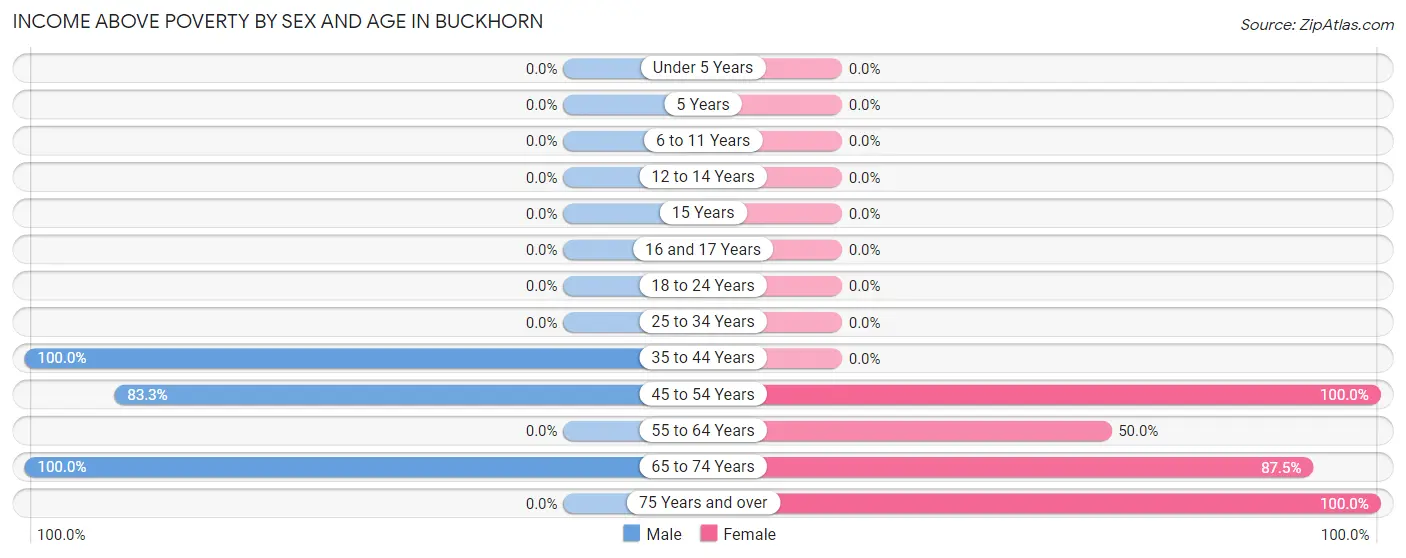
| Age Bracket | Male | Female |
| Under 5 Years | 0 (0.0%) | 0 (0.0%) |
| 5 Years | 0 (0.0%) | 0 (0.0%) |
| 6 to 11 Years | 0 (0.0%) | 0 (0.0%) |
| 12 to 14 Years | 0 (0.0%) | 0 (0.0%) |
| 15 Years | 0 (0.0%) | 0 (0.0%) |
| 16 and 17 Years | 0 (0.0%) | 0 (0.0%) |
| 18 to 24 Years | 0 (0.0%) | 0 (0.0%) |
| 25 to 34 Years | 0 (0.0%) | 0 (0.0%) |
| 35 to 44 Years | 3 (100.0%) | 0 (0.0%) |
| 45 to 54 Years | 10 (83.3%) | 7 (100.0%) |
| 55 to 64 Years | 0 (0.0%) | 1 (50.0%) |
| 65 to 74 Years | 8 (100.0%) | 7 (87.5%) |
| 75 Years and over | 0 (0.0%) | 3 (100.0%) |
| Total | 21 (72.4%) | 18 (90.0%) |
Income Below Poverty Among Married-Couple Families in Buckhorn
| Children | Above Poverty | Below Poverty |
| No Children | 14 (100.0%) | 0 (0.0%) |
| 1 or 2 Children | 0 (0.0%) | 0 (0.0%) |
| 3 or 4 Children | 0 (0.0%) | 0 (0.0%) |
| 5 or more Children | 0 (0.0%) | 0 (0.0%) |
| Total | 14 (100.0%) | 0 (0.0%) |
Income Below Poverty Among Single-Parent Households in Buckhorn
| Children | Single Father | Single Mother |
| No Children | 0 (0.0%) | 0 (0.0%) |
| 1 or 2 Children | 0 (0.0%) | 0 (0.0%) |
| 3 or 4 Children | 0 (0.0%) | 0 (0.0%) |
| 5 or more Children | 0 (0.0%) | 0 (0.0%) |
| Total | 0 (0.0%) | 0 (0.0%) |
Income Below Poverty Among Married-Couple vs Single-Parent Households in Buckhorn
| Children | Married-Couple Families | Single-Parent Households |
| No Children | 0 (0.0%) | 0 (0.0%) |
| 1 or 2 Children | 0 (0.0%) | 0 (0.0%) |
| 3 or 4 Children | 0 (0.0%) | 0 (0.0%) |
| 5 or more Children | 0 (0.0%) | 0 (0.0%) |
| Total | 0 (0.0%) | 0 (0.0%) |
Race in Buckhorn
The most populous races in Buckhorn are White / Caucasian (60 | 88.2%), Black / African American (6 | 8.8%), and Some other Race (2 | 2.9%).
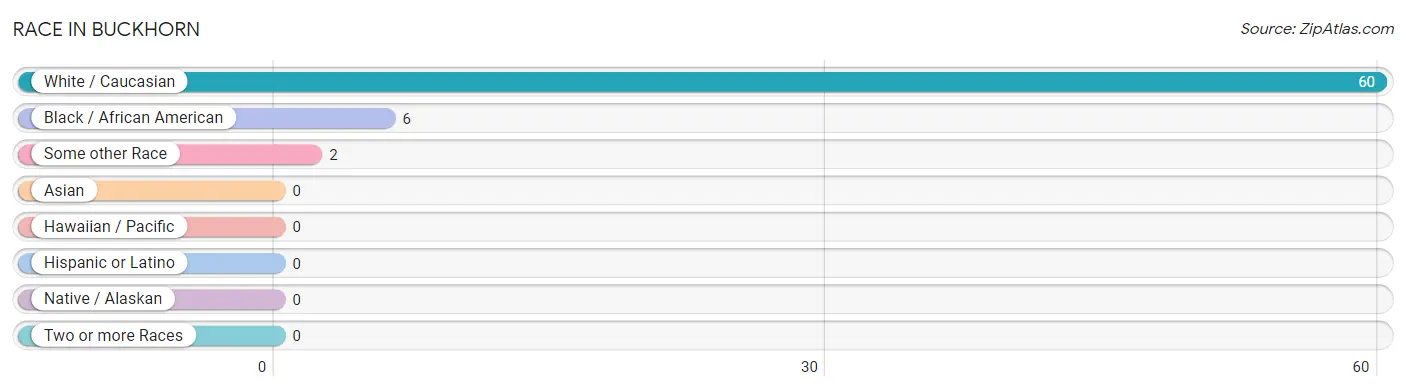
| Race | # Population | % Population |
| Asian | 0 | 0.0% |
| Black / African American | 6 | 8.8% |
| Hawaiian / Pacific | 0 | 0.0% |
| Hispanic or Latino | 0 | 0.0% |
| Native / Alaskan | 0 | 0.0% |
| White / Caucasian | 60 | 88.2% |
| Two or more Races | 0 | 0.0% |
| Some other Race | 2 | 2.9% |
| Total | 68 | 100.0% |
Ancestry in Buckhorn
The most populous ancestries reported in Buckhorn are American (28 | 41.2%), English (5 | 7.3%), German (5 | 7.3%), Scottish (4 | 5.9%), and Irish (3 | 4.4%), together accounting for 66.2% of all Buckhorn residents.
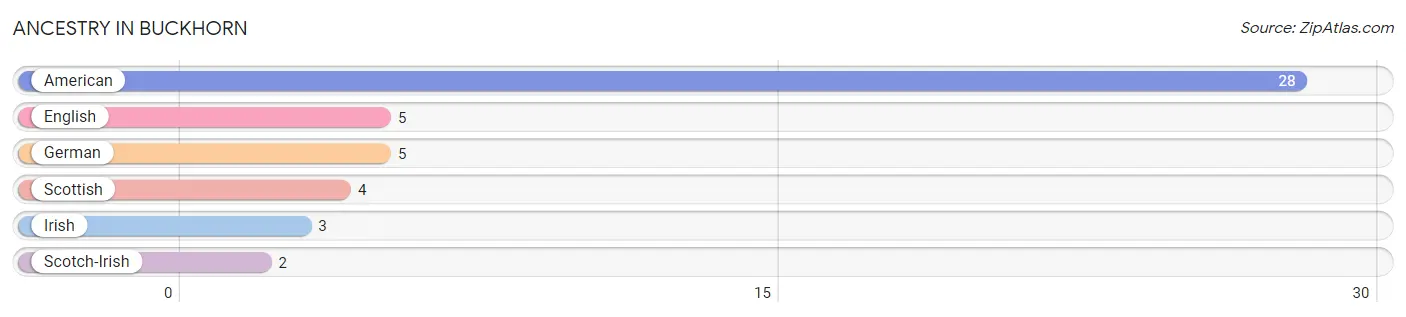
| Ancestry | # Population | % Population |
| American | 28 | 41.2% |
| English | 5 | 7.3% |
| German | 5 | 7.3% |
| Irish | 3 | 4.4% |
| Scotch-Irish | 2 | 2.9% |
| Scottish | 4 | 5.9% | View All 6 Rows |
Immigrants in Buckhorn
The most numerous immigrant groups reported in Buckhorn came from Eastern Europe (6 | 8.8%), Europe (6 | 8.8%), and Ukraine (6 | 8.8%), together accounting for 26.5% of all Buckhorn residents.
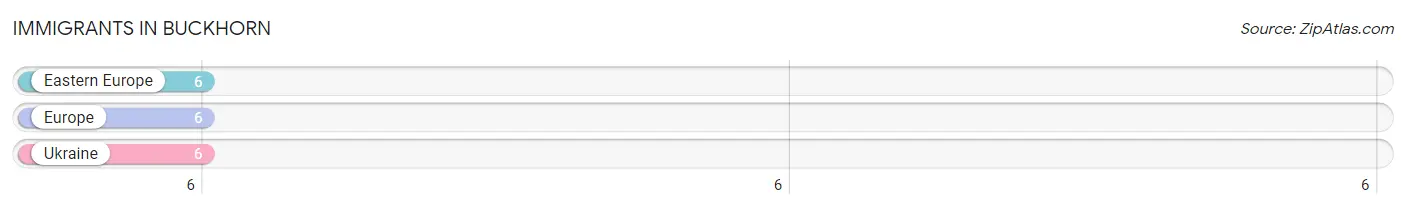
| Immigration Origin | # Population | % Population |
| Eastern Europe | 6 | 8.8% |
| Europe | 6 | 8.8% |
| Ukraine | 6 | 8.8% | View All 3 Rows |
Sex and Age in Buckhorn
Sex and Age in Buckhorn
The most populous age groups in Buckhorn are 15 to 19 Years (22 | 48.9%) for men and 45 to 49 Years (7 | 30.4%) for women.
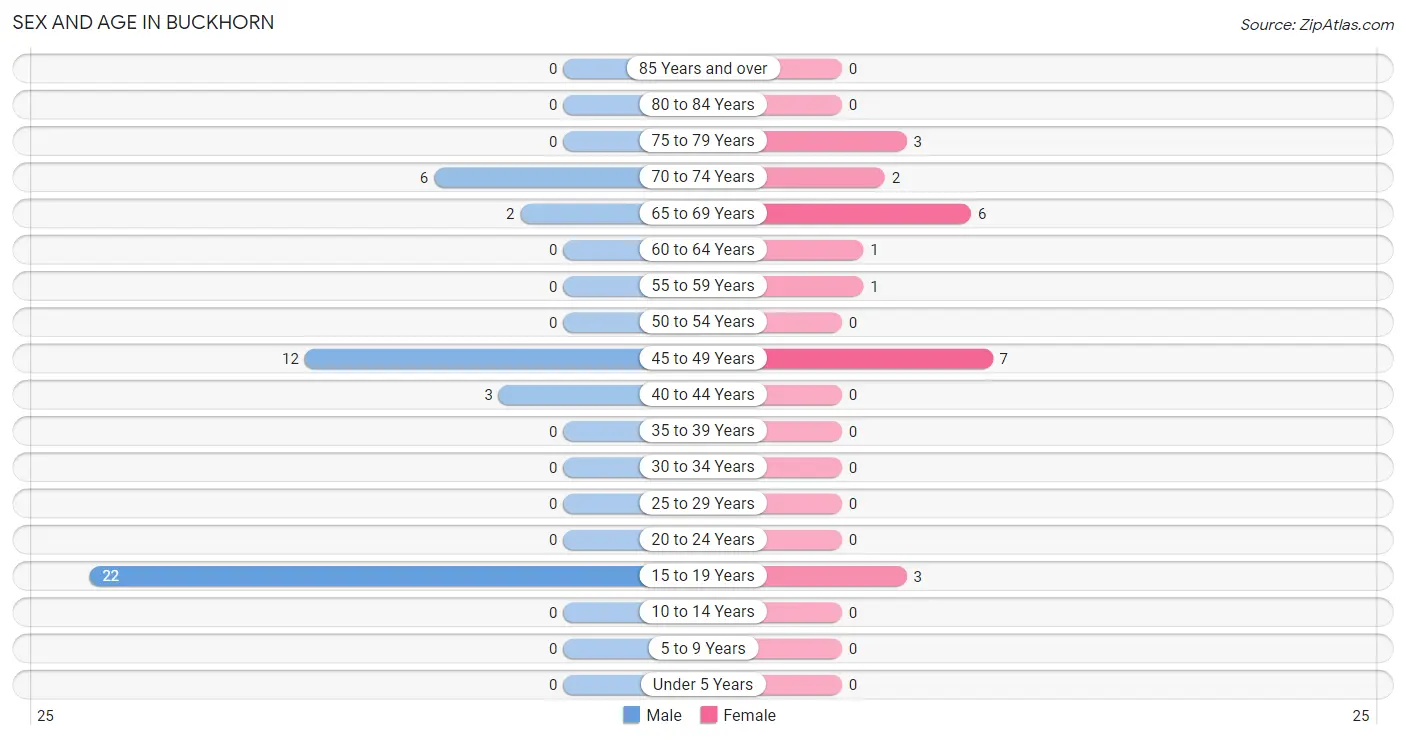
| Age Bracket | Male | Female |
| Under 5 Years | 0 (0.0%) | 0 (0.0%) |
| 5 to 9 Years | 0 (0.0%) | 0 (0.0%) |
| 10 to 14 Years | 0 (0.0%) | 0 (0.0%) |
| 15 to 19 Years | 22 (48.9%) | 3 (13.0%) |
| 20 to 24 Years | 0 (0.0%) | 0 (0.0%) |
| 25 to 29 Years | 0 (0.0%) | 0 (0.0%) |
| 30 to 34 Years | 0 (0.0%) | 0 (0.0%) |
| 35 to 39 Years | 0 (0.0%) | 0 (0.0%) |
| 40 to 44 Years | 3 (6.7%) | 0 (0.0%) |
| 45 to 49 Years | 12 (26.7%) | 7 (30.4%) |
| 50 to 54 Years | 0 (0.0%) | 0 (0.0%) |
| 55 to 59 Years | 0 (0.0%) | 1 (4.3%) |
| 60 to 64 Years | 0 (0.0%) | 1 (4.3%) |
| 65 to 69 Years | 2 (4.4%) | 6 (26.1%) |
| 70 to 74 Years | 6 (13.3%) | 2 (8.7%) |
| 75 to 79 Years | 0 (0.0%) | 3 (13.0%) |
| 80 to 84 Years | 0 (0.0%) | 0 (0.0%) |
| 85 Years and over | 0 (0.0%) | 0 (0.0%) |
| Total | 45 (100.0%) | 23 (100.0%) |
Families and Households in Buckhorn
Median Family Size in Buckhorn
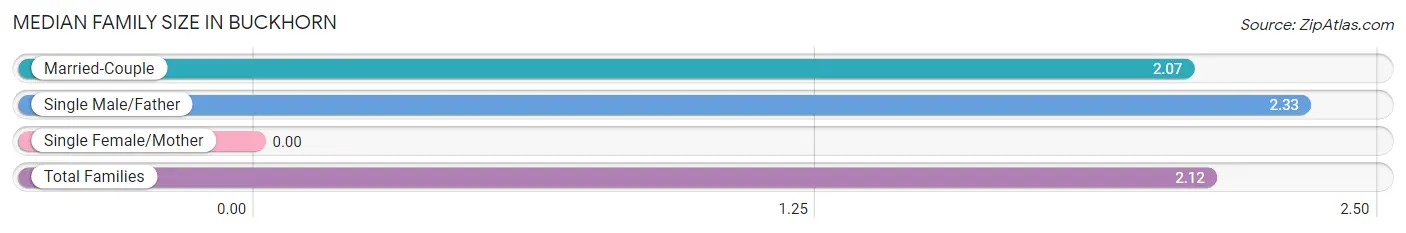
| Family Type | # Families | Family Size |
| Married-Couple | 14 (82.4%) | 2.07 |
| Single Male/Father | 3 (17.6%) | 2.33 |
| Single Female/Mother | 0 (0.0%) | - |
| Total Families | 17 (100.0%) | 2.12 |
Median Household Size in Buckhorn
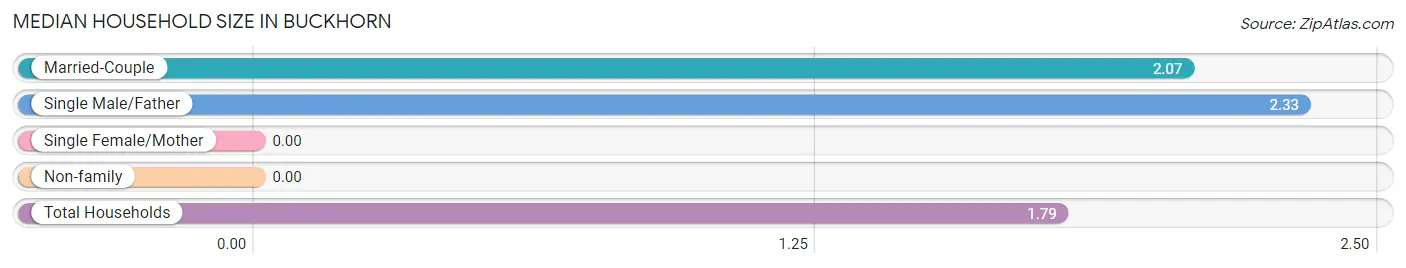
| Household Type | # Households | Household Size |
| Married-Couple | 14 (58.3%) | 2.07 |
| Single Male/Father | 3 (12.5%) | 2.33 |
| Single Female/Mother | 0 (0.0%) | - |
| Non-family | 7 (29.2%) | - |
| Total Households | 24 (100.0%) | 1.79 |
Household Size by Marriage Status in Buckhorn
Out of a total of 24 households in Buckhorn, 17 (70.8%) are family households, while 7 (29.2%) are nonfamily households. The most numerous type of family households are 2-person households, comprising 14, and the most common type of nonfamily households are 1-person households, comprising 7.
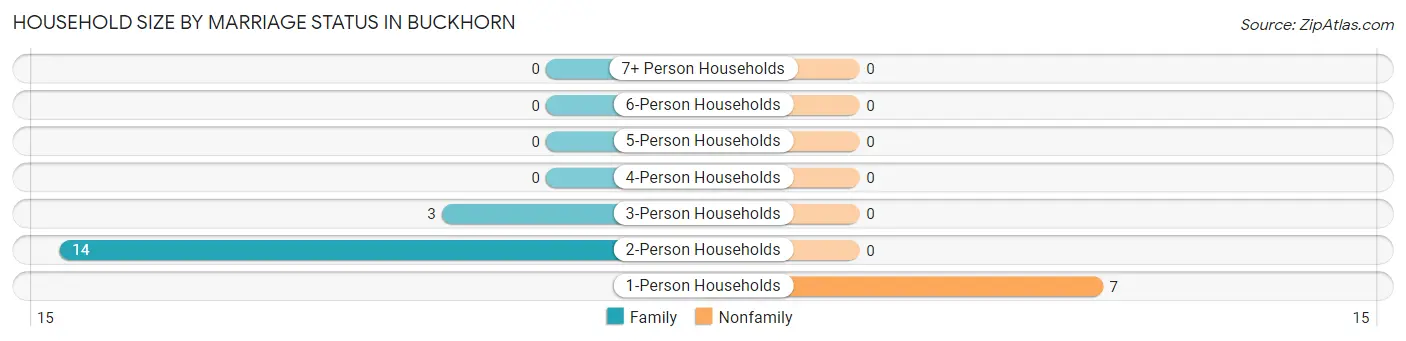
| Household Size | Family Households | Nonfamily Households |
| 1-Person Households | - | 7 (29.2%) |
| 2-Person Households | 14 (58.3%) | 0 (0.0%) |
| 3-Person Households | 3 (12.5%) | 0 (0.0%) |
| 4-Person Households | 0 (0.0%) | 0 (0.0%) |
| 5-Person Households | 0 (0.0%) | 0 (0.0%) |
| 6-Person Households | 0 (0.0%) | 0 (0.0%) |
| 7+ Person Households | 0 (0.0%) | 0 (0.0%) |
| Total | 17 (70.8%) | 7 (29.2%) |
Female Fertility in Buckhorn
Fertility by Age in Buckhorn
| Age Bracket | Women with Births | Births / 1,000 Women |
| 15 to 19 years | 0 (0.0%) | 0.0 |
| 20 to 34 years | 0 (0.0%) | 0.0 |
| 35 to 50 years | 0 (0.0%) | 0.0 |
| Total | 0 (0.0%) | 0.0 |
Fertility by Age by Marriage Status in Buckhorn
| Age Bracket | Married | Unmarried |
| 15 to 19 years | 0 (0.0%) | 0 (0.0%) |
| 20 to 34 years | 0 (0.0%) | 0 (0.0%) |
| 35 to 50 years | 0 (0.0%) | 0 (0.0%) |
| Total | 0 (0.0%) | 0 (0.0%) |
Fertility by Education in Buckhorn
| Educational Attainment | Women with Births | Births / 1,000 Women |
| Less than High School | 0 (0.0%) | 0.0 |
| High School Diploma | 0 (0.0%) | 0.0 |
| College or Associate's Degree | 0 (0.0%) | 0.0 |
| Bachelor's Degree | 0 (0.0%) | 0.0 |
| Graduate Degree | 0 (0.0%) | 0.0 |
| Total | 0 (0.0%) | 0.0 |
Fertility by Education by Marriage Status in Buckhorn
| Educational Attainment | Married | Unmarried |
| Less than High School | 0 (0.0%) | 0 (0.0%) |
| High School Diploma | 0 (0.0%) | 0 (0.0%) |
| College or Associate's Degree | 0 (0.0%) | 0 (0.0%) |
| Bachelor's Degree | 0 (0.0%) | 0 (0.0%) |
| Graduate Degree | 0 (0.0%) | 0 (0.0%) |
| Total | 0 (0.0%) | 0 (0.0%) |
Employment Characteristics in Buckhorn
Employment by Class of Employer in Buckhorn
Among the 30 employed individuals in Buckhorn, private company employees (21 | 70.0%), and not-for-profit organizations (9 | 30.0%) make up the most common classes of employment.
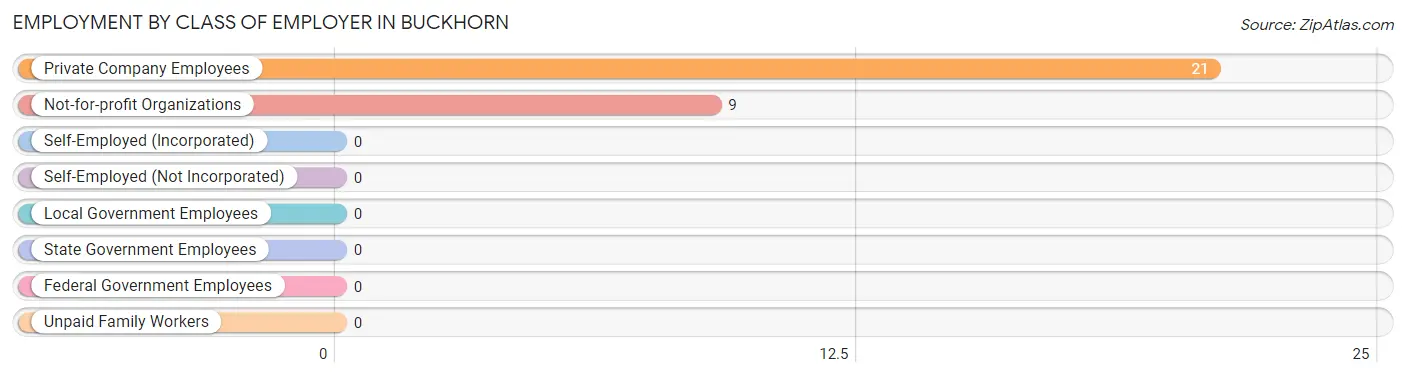
| Employer Class | # Employees | % Employees |
| Private Company Employees | 21 | 70.0% |
| Self-Employed (Incorporated) | 0 | 0.0% |
| Self-Employed (Not Incorporated) | 0 | 0.0% |
| Not-for-profit Organizations | 9 | 30.0% |
| Local Government Employees | 0 | 0.0% |
| State Government Employees | 0 | 0.0% |
| Federal Government Employees | 0 | 0.0% |
| Unpaid Family Workers | 0 | 0.0% |
| Total | 30 | 100.0% |
Employment Status by Age in Buckhorn
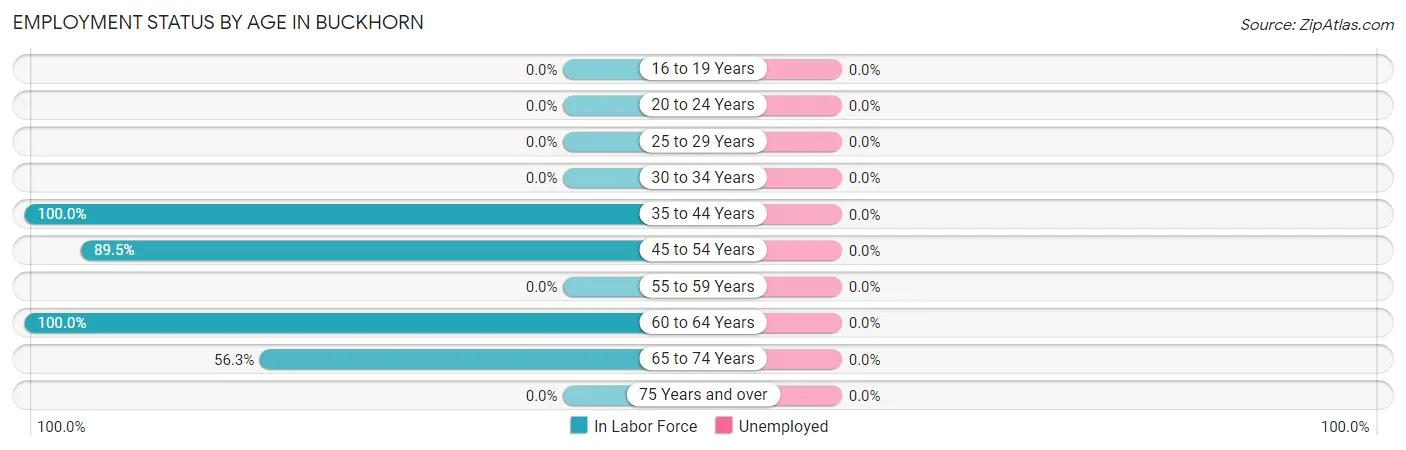
| Age Bracket | In Labor Force | Unemployed |
| 16 to 19 Years | 0 (0.0%) | 0 (0.0%) |
| 20 to 24 Years | 0 (0.0%) | 0 (0.0%) |
| 25 to 29 Years | 0 (0.0%) | 0 (0.0%) |
| 30 to 34 Years | 0 (0.0%) | 0 (0.0%) |
| 35 to 44 Years | 3 (100.0%) | 0 (0.0%) |
| 45 to 54 Years | 17 (89.5%) | 0 (0.0%) |
| 55 to 59 Years | 0 (0.0%) | 0 (0.0%) |
| 60 to 64 Years | 1 (100.0%) | 0 (0.0%) |
| 65 to 74 Years | 9 (56.3%) | 0 (0.0%) |
| 75 Years and over | 0 (0.0%) | 0 (0.0%) |
| Total | 30 (53.6%) | 0 (0.0%) |
Employment Status by Educational Attainment in Buckhorn
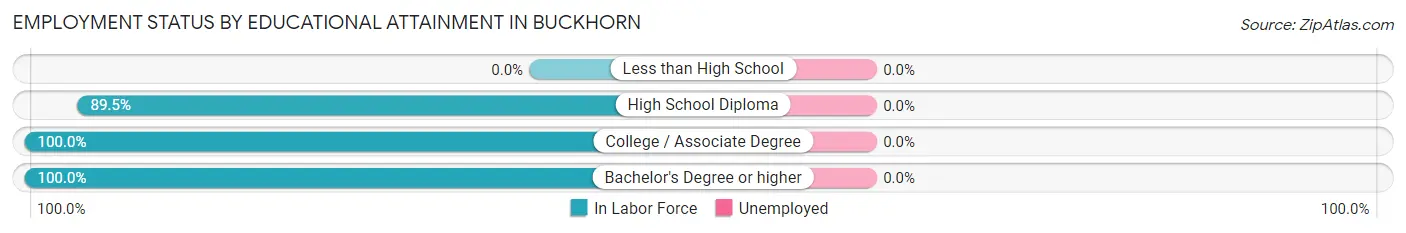
| Educational Attainment | In Labor Force | Unemployed |
| Less than High School | 0 (0.0%) | 0 (0.0%) |
| High School Diploma | 17 (89.5%) | 0 (0.0%) |
| College / Associate Degree | 1 (100.0%) | 0 (0.0%) |
| Bachelor's Degree or higher | 3 (100.0%) | 0 (0.0%) |
| Total | 21 (87.5%) | 0 (0.0%) |
Employment Occupations by Sex in Buckhorn
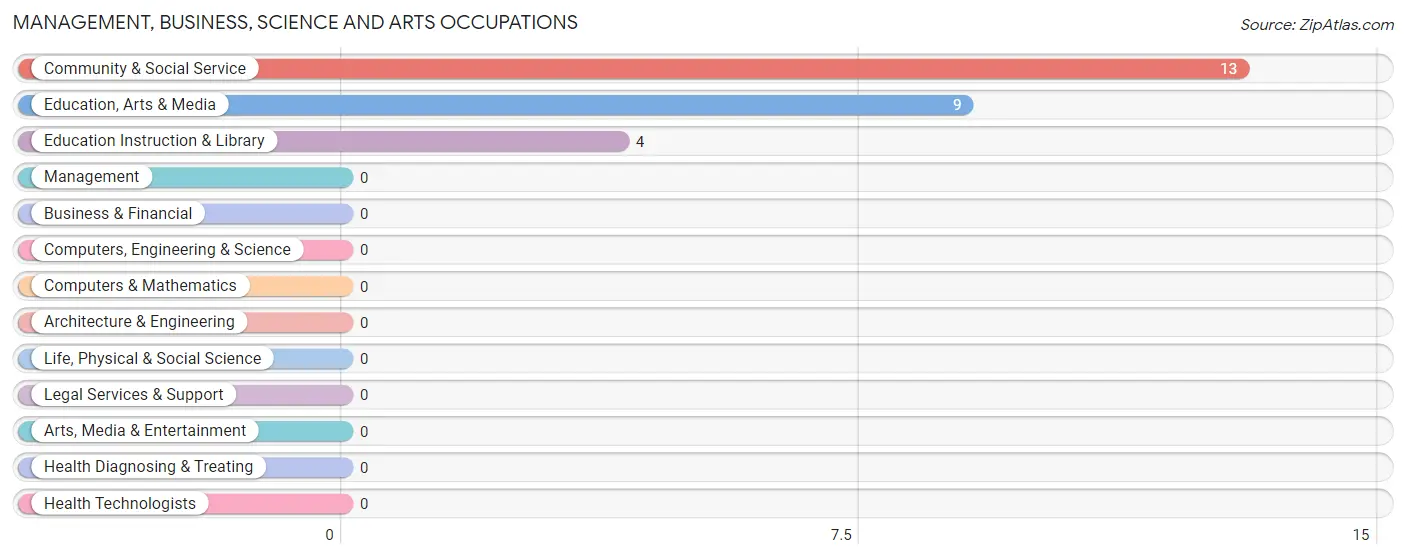
Management, Business, Science and Arts Occupations
The most common Management, Business, Science and Arts occupations in Buckhorn are Community & Social Service (13 | 43.3%), Education, Arts & Media (9 | 30.0%), and Education Instruction & Library (4 | 13.3%).
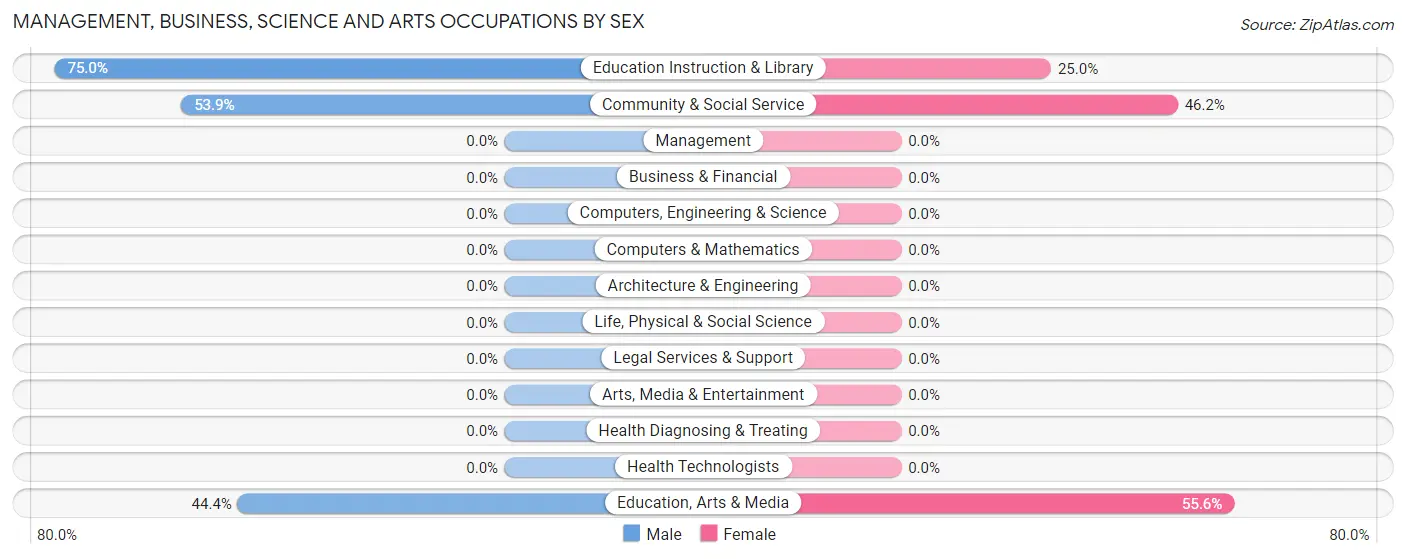
Management, Business, Science and Arts Occupations by Sex
Within the Management, Business, Science and Arts occupations in Buckhorn, the most male-oriented occupations are Education Instruction & Library (75.0%), Community & Social Service (53.8%), and Education, Arts & Media (44.4%), while the most female-oriented occupations are Education, Arts & Media (55.6%), Community & Social Service (46.2%), and Education Instruction & Library (25.0%).
| Occupation | Male | Female |
| Management | 0 (0.0%) | 0 (0.0%) |
| Business & Financial | 0 (0.0%) | 0 (0.0%) |
| Computers, Engineering & Science | 0 (0.0%) | 0 (0.0%) |
| Computers & Mathematics | 0 (0.0%) | 0 (0.0%) |
| Architecture & Engineering | 0 (0.0%) | 0 (0.0%) |
| Life, Physical & Social Science | 0 (0.0%) | 0 (0.0%) |
| Community & Social Service | 7 (53.8%) | 6 (46.2%) |
| Education, Arts & Media | 4 (44.4%) | 5 (55.6%) |
| Legal Services & Support | 0 (0.0%) | 0 (0.0%) |
| Education Instruction & Library | 3 (75.0%) | 1 (25.0%) |
| Arts, Media & Entertainment | 0 (0.0%) | 0 (0.0%) |
| Health Diagnosing & Treating | 0 (0.0%) | 0 (0.0%) |
| Health Technologists | 0 (0.0%) | 0 (0.0%) |
| Total (Category) | 7 (53.8%) | 6 (46.2%) |
| Total (Overall) | 17 (56.7%) | 13 (43.3%) |
Services Occupations
Services Occupations by Sex
| Occupation | Male | Female |
| Healthcare Support | 0 (0.0%) | 0 (0.0%) |
| Security & Protection | 0 (0.0%) | 0 (0.0%) |
| Firefighting & Prevention | 0 (0.0%) | 0 (0.0%) |
| Law Enforcement | 0 (0.0%) | 0 (0.0%) |
| Food Preparation & Serving | 0 (0.0%) | 0 (0.0%) |
| Cleaning & Maintenance | 0 (0.0%) | 0 (0.0%) |
| Personal Care & Service | 0 (0.0%) | 0 (0.0%) |
| Total (Category) | 0 (0.0%) | 0 (0.0%) |
| Total (Overall) | 17 (56.7%) | 13 (43.3%) |
Sales and Office Occupations
The most common Sales and Office occupations in Buckhorn are , and Office & Administration (7 | 23.3%).
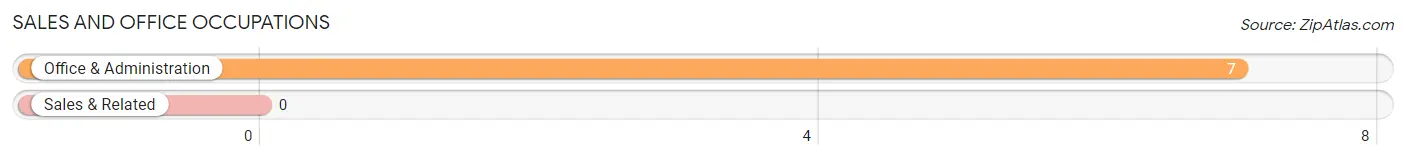
Sales and Office Occupations by Sex
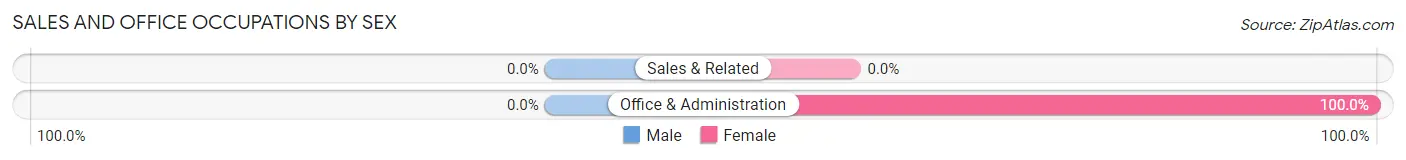
| Occupation | Male | Female |
| Sales & Related | 0 (0.0%) | 0 (0.0%) |
| Office & Administration | 0 (0.0%) | 7 (100.0%) |
| Total (Category) | 0 (0.0%) | 7 (100.0%) |
| Total (Overall) | 17 (56.7%) | 13 (43.3%) |
Natural Resources, Construction and Maintenance Occupations
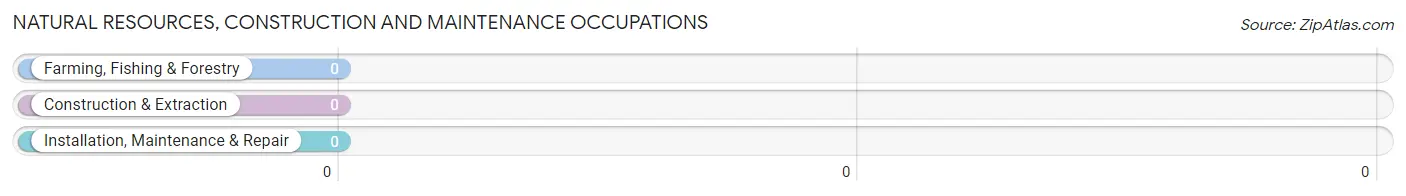
Natural Resources, Construction and Maintenance Occupations by Sex
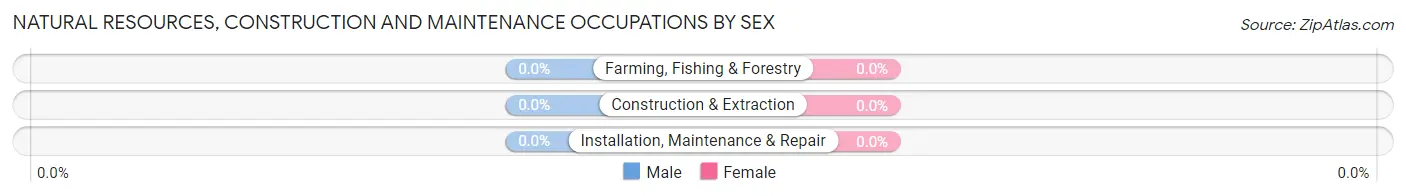
| Occupation | Male | Female |
| Farming, Fishing & Forestry | 0 (0.0%) | 0 (0.0%) |
| Construction & Extraction | 0 (0.0%) | 0 (0.0%) |
| Installation, Maintenance & Repair | 0 (0.0%) | 0 (0.0%) |
| Total (Category) | 0 (0.0%) | 0 (0.0%) |
| Total (Overall) | 17 (56.7%) | 13 (43.3%) |
Production, Transportation and Moving Occupations
The most common Production, Transportation and Moving occupations in Buckhorn are , and Production (10 | 33.3%).
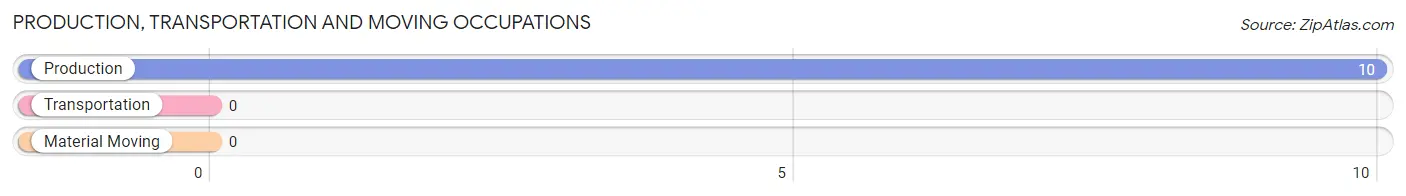
Production, Transportation and Moving Occupations by Sex
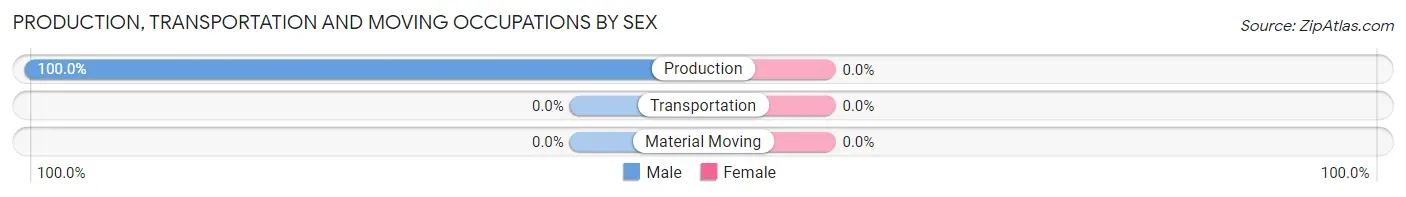
| Occupation | Male | Female |
| Production | 10 (100.0%) | 0 (0.0%) |
| Transportation | 0 (0.0%) | 0 (0.0%) |
| Material Moving | 0 (0.0%) | 0 (0.0%) |
| Total (Category) | 10 (100.0%) | 0 (0.0%) |
| Total (Overall) | 17 (56.7%) | 13 (43.3%) |
Employment Industries by Sex in Buckhorn
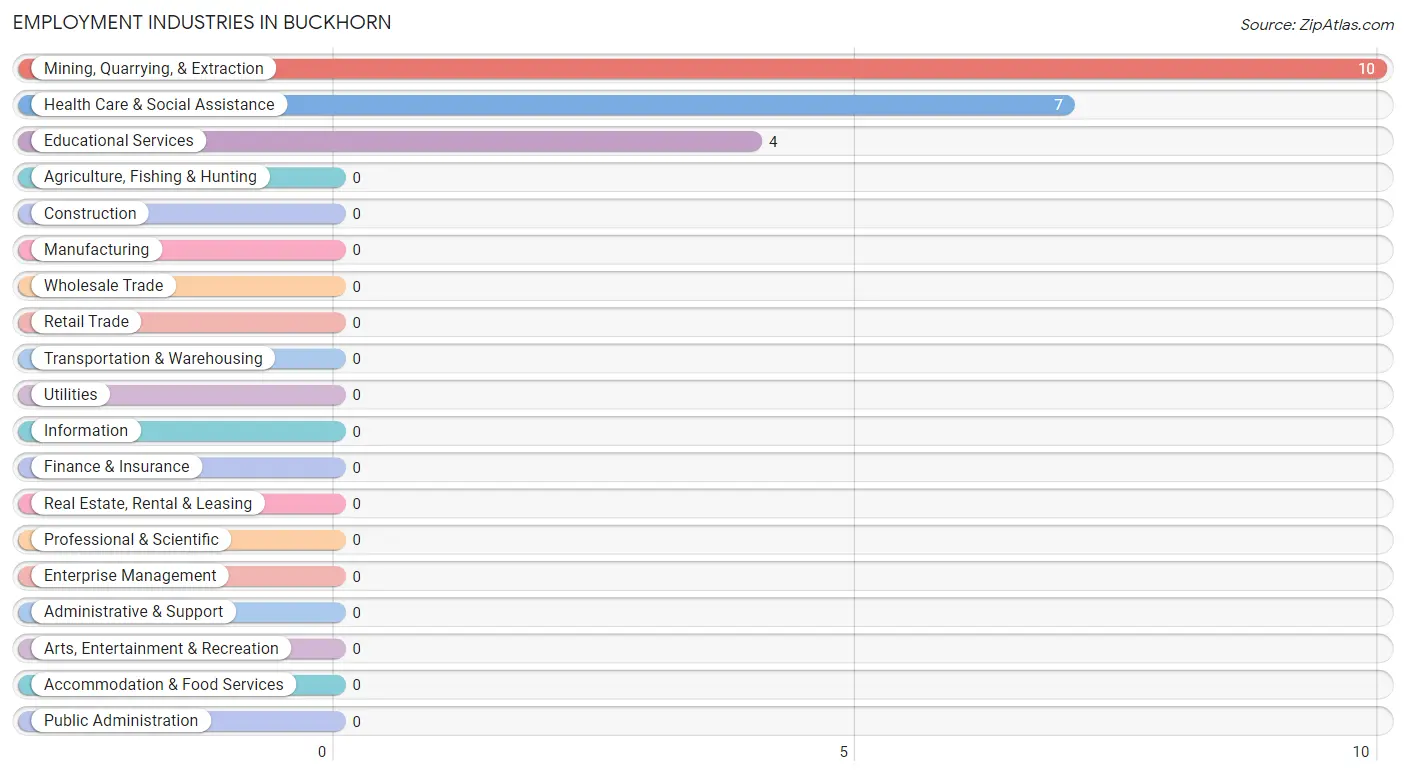
Employment Industries in Buckhorn
The major employment industries in Buckhorn include Mining, Quarrying, & Extraction (10 | 33.3%), Health Care & Social Assistance (7 | 23.3%), and Educational Services (4 | 13.3%).
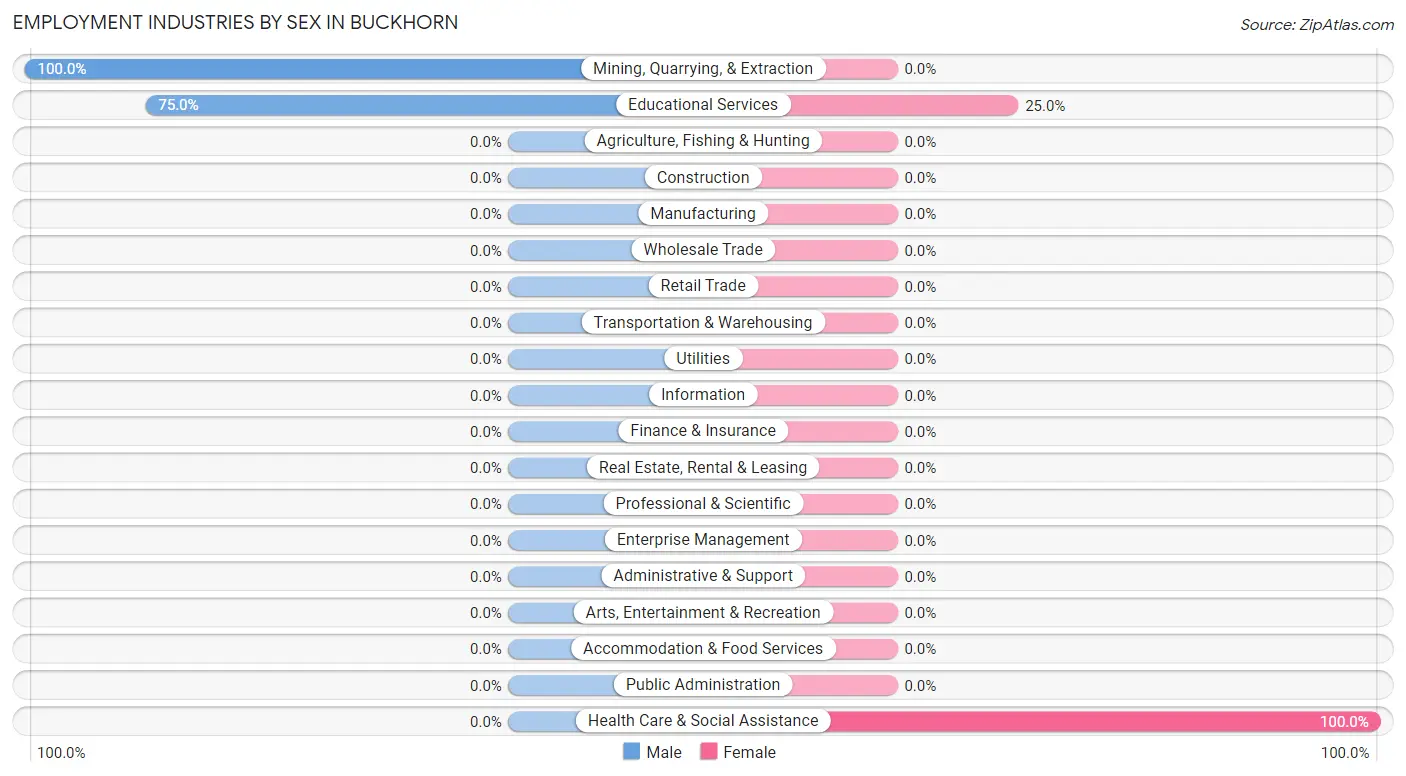
Employment Industries by Sex in Buckhorn
The Buckhorn industries that see more men than women are Mining, Quarrying, & Extraction (100.0%), and Educational Services (75.0%), whereas the industries that tend to have a higher number of women are Health Care & Social Assistance (100.0%), and Educational Services (25.0%).
| Industry | Male | Female |
| Agriculture, Fishing & Hunting | 0 (0.0%) | 0 (0.0%) |
| Mining, Quarrying, & Extraction | 10 (100.0%) | 0 (0.0%) |
| Construction | 0 (0.0%) | 0 (0.0%) |
| Manufacturing | 0 (0.0%) | 0 (0.0%) |
| Wholesale Trade | 0 (0.0%) | 0 (0.0%) |
| Retail Trade | 0 (0.0%) | 0 (0.0%) |
| Transportation & Warehousing | 0 (0.0%) | 0 (0.0%) |
| Utilities | 0 (0.0%) | 0 (0.0%) |
| Information | 0 (0.0%) | 0 (0.0%) |
| Finance & Insurance | 0 (0.0%) | 0 (0.0%) |
| Real Estate, Rental & Leasing | 0 (0.0%) | 0 (0.0%) |
| Professional & Scientific | 0 (0.0%) | 0 (0.0%) |
| Enterprise Management | 0 (0.0%) | 0 (0.0%) |
| Administrative & Support | 0 (0.0%) | 0 (0.0%) |
| Educational Services | 3 (75.0%) | 1 (25.0%) |
| Health Care & Social Assistance | 0 (0.0%) | 7 (100.0%) |
| Arts, Entertainment & Recreation | 0 (0.0%) | 0 (0.0%) |
| Accommodation & Food Services | 0 (0.0%) | 0 (0.0%) |
| Public Administration | 0 (0.0%) | 0 (0.0%) |
| Total | 17 (56.7%) | 13 (43.3%) |
Education in Buckhorn
School Enrollment in Buckhorn
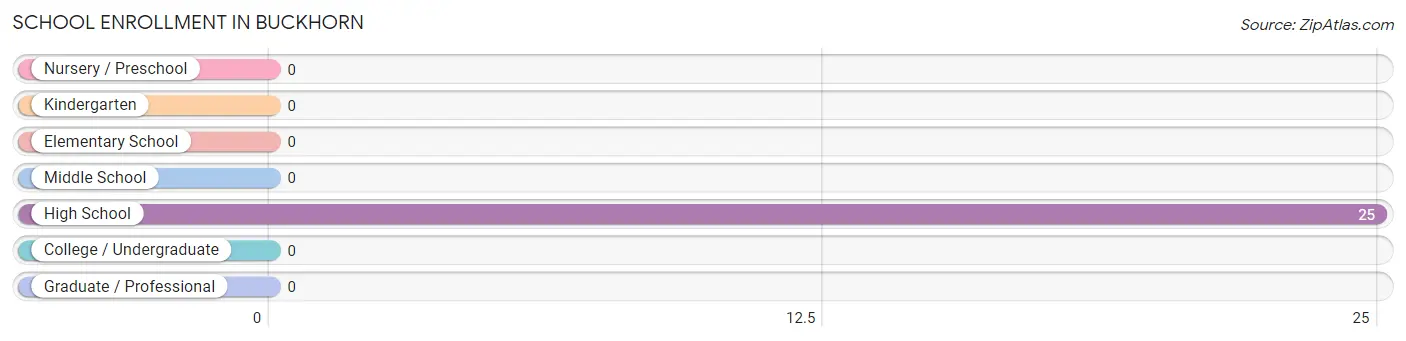
| School Level | # Students | % Students |
| Nursery / Preschool | 0 | 0.0% |
| Kindergarten | 0 | 0.0% |
| Elementary School | 0 | 0.0% |
| Middle School | 0 | 0.0% |
| High School | 25 | 100.0% |
| College / Undergraduate | 0 | 0.0% |
| Graduate / Professional | 0 | 0.0% |
| Total | 25 | 100.0% |
School Enrollment by Age by Funding Source in Buckhorn
Out of a total of 25 students who are enrolled in schools in Buckhorn, 6 (24.0%) attend a private institution, while the remaining 19 (76.0%) are enrolled in public schools. The age group of 18 to 19 year olds has the highest likelihood of being enrolled in private schools, with 6 (100.0% in the age bracket) enrolled. Conversely, the age group of 15 to 17 year olds has the lowest likelihood of being enrolled in a private school, with 19 (100.0% in the age bracket) attending a public institution.
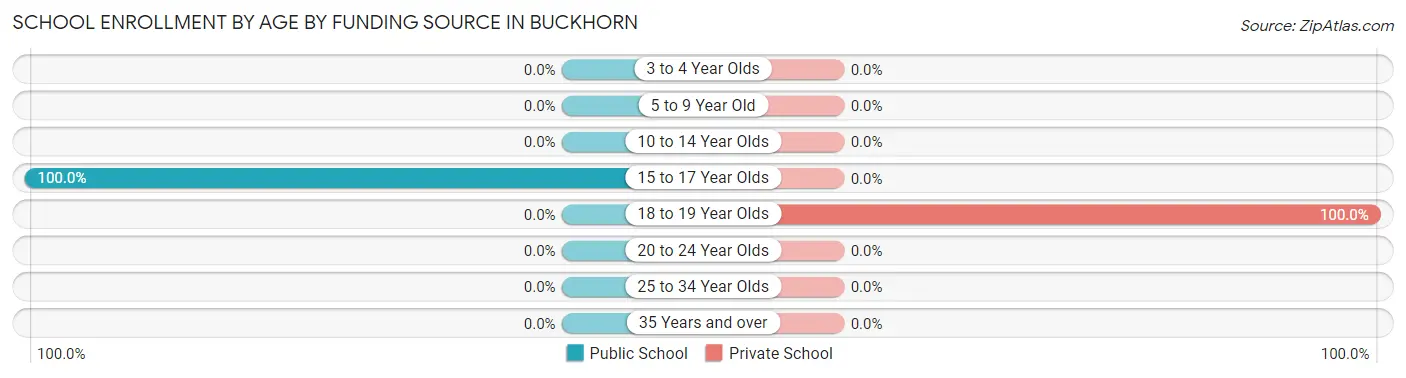
| Age Bracket | Public School | Private School |
| 3 to 4 Year Olds | 0 (0.0%) | 0 (0.0%) |
| 5 to 9 Year Old | 0 (0.0%) | 0 (0.0%) |
| 10 to 14 Year Olds | 0 (0.0%) | 0 (0.0%) |
| 15 to 17 Year Olds | 19 (100.0%) | 0 (0.0%) |
| 18 to 19 Year Olds | 0 (0.0%) | 6 (100.0%) |
| 20 to 24 Year Olds | 0 (0.0%) | 0 (0.0%) |
| 25 to 34 Year Olds | 0 (0.0%) | 0 (0.0%) |
| 35 Years and over | 0 (0.0%) | 0 (0.0%) |
| Total | 19 (76.0%) | 6 (24.0%) |
Educational Attainment by Field of Study in Buckhorn
Education (7 | 77.8%), and psychology (2 | 22.2%) are the most common fields of study among 9 individuals in Buckhorn who have obtained a bachelor's degree or higher.
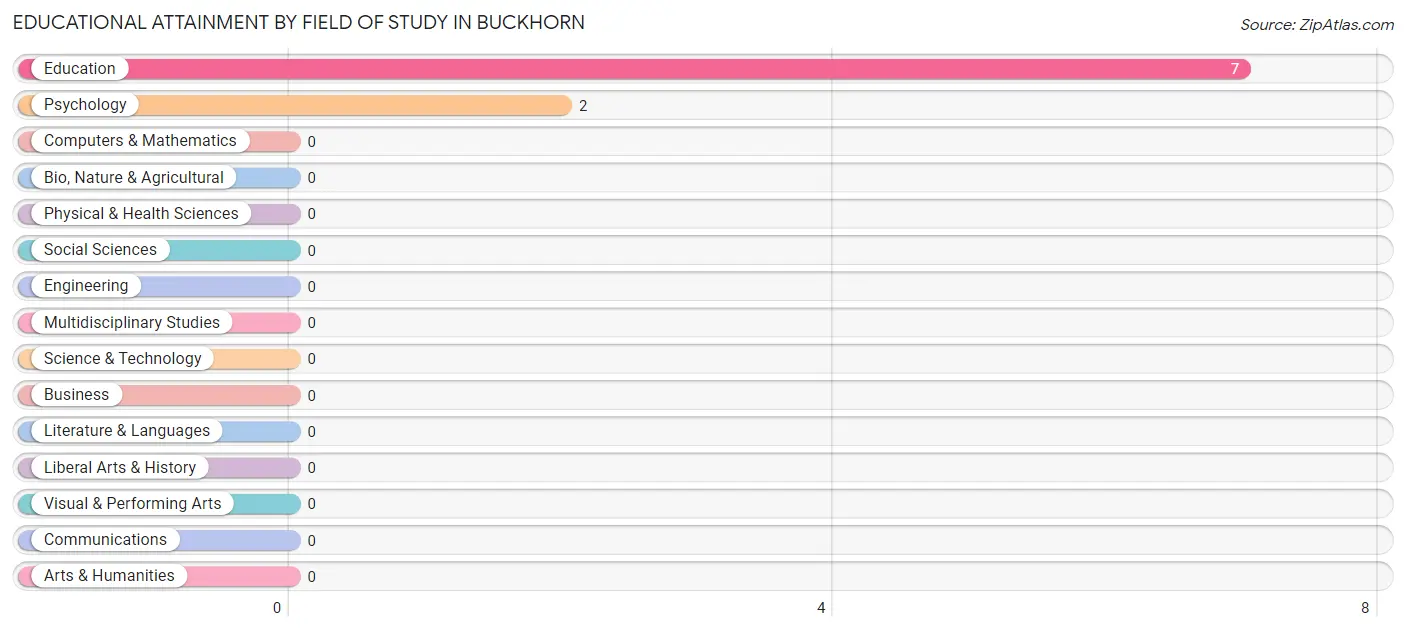
| Field of Study | # Graduates | % Graduates |
| Computers & Mathematics | 0 | 0.0% |
| Bio, Nature & Agricultural | 0 | 0.0% |
| Physical & Health Sciences | 0 | 0.0% |
| Psychology | 2 | 22.2% |
| Social Sciences | 0 | 0.0% |
| Engineering | 0 | 0.0% |
| Multidisciplinary Studies | 0 | 0.0% |
| Science & Technology | 0 | 0.0% |
| Business | 0 | 0.0% |
| Education | 7 | 77.8% |
| Literature & Languages | 0 | 0.0% |
| Liberal Arts & History | 0 | 0.0% |
| Visual & Performing Arts | 0 | 0.0% |
| Communications | 0 | 0.0% |
| Arts & Humanities | 0 | 0.0% |
| Total | 9 | 100.0% |
Transportation & Commute in Buckhorn
Vehicle Availability by Sex in Buckhorn
The most prevalent vehicle ownership categories in Buckhorn are males with 3 vehicles (10, accounting for 58.8%) and females with 3 vehicles (7, making up 76.9%).
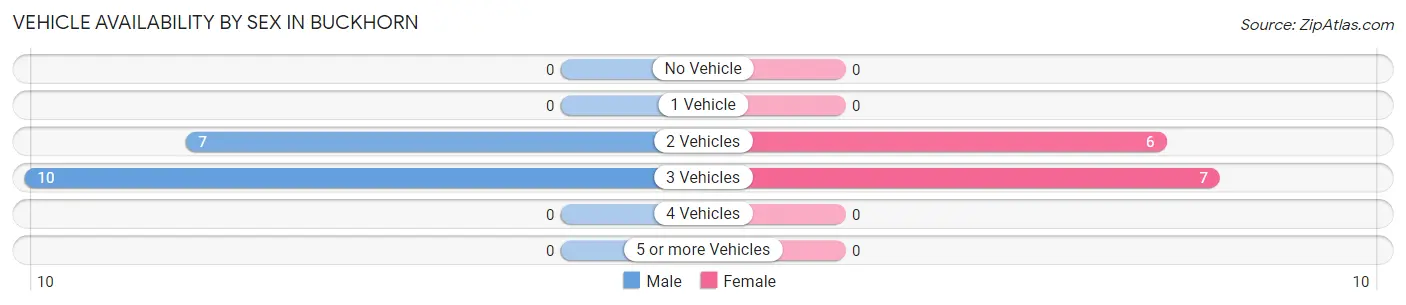
| Vehicles Available | Male | Female |
| No Vehicle | 0 (0.0%) | 0 (0.0%) |
| 1 Vehicle | 0 (0.0%) | 0 (0.0%) |
| 2 Vehicles | 7 (41.2%) | 6 (46.2%) |
| 3 Vehicles | 10 (58.8%) | 7 (53.8%) |
| 4 Vehicles | 0 (0.0%) | 0 (0.0%) |
| 5 or more Vehicles | 0 (0.0%) | 0 (0.0%) |
| Total | 17 (100.0%) | 13 (100.0%) |
Commute Time in Buckhorn
The most frequently occuring commute durations in Buckhorn are 30 to 34 minutes (10 commuters, 33.3%), 40 to 44 minutes (7 commuters, 23.3%), and less than 5 minutes (5 commuters, 16.7%).
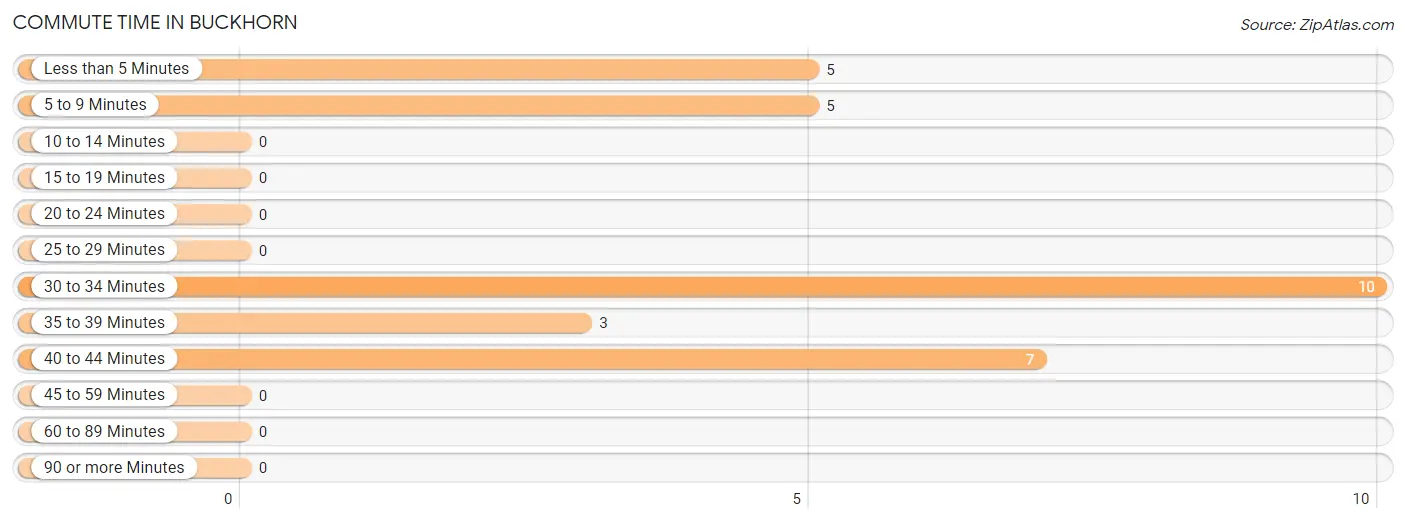
| Commute Time | # Commuters | % Commuters |
| Less than 5 Minutes | 5 | 16.7% |
| 5 to 9 Minutes | 5 | 16.7% |
| 10 to 14 Minutes | 0 | 0.0% |
| 15 to 19 Minutes | 0 | 0.0% |
| 20 to 24 Minutes | 0 | 0.0% |
| 25 to 29 Minutes | 0 | 0.0% |
| 30 to 34 Minutes | 10 | 33.3% |
| 35 to 39 Minutes | 3 | 10.0% |
| 40 to 44 Minutes | 7 | 23.3% |
| 45 to 59 Minutes | 0 | 0.0% |
| 60 to 89 Minutes | 0 | 0.0% |
| 90 or more Minutes | 0 | 0.0% |
Commute Time by Sex in Buckhorn
The most common commute times in Buckhorn are 30 to 34 minutes (10 commuters, 58.8%) for males and 40 to 44 minutes (7 commuters, 53.8%) for females.
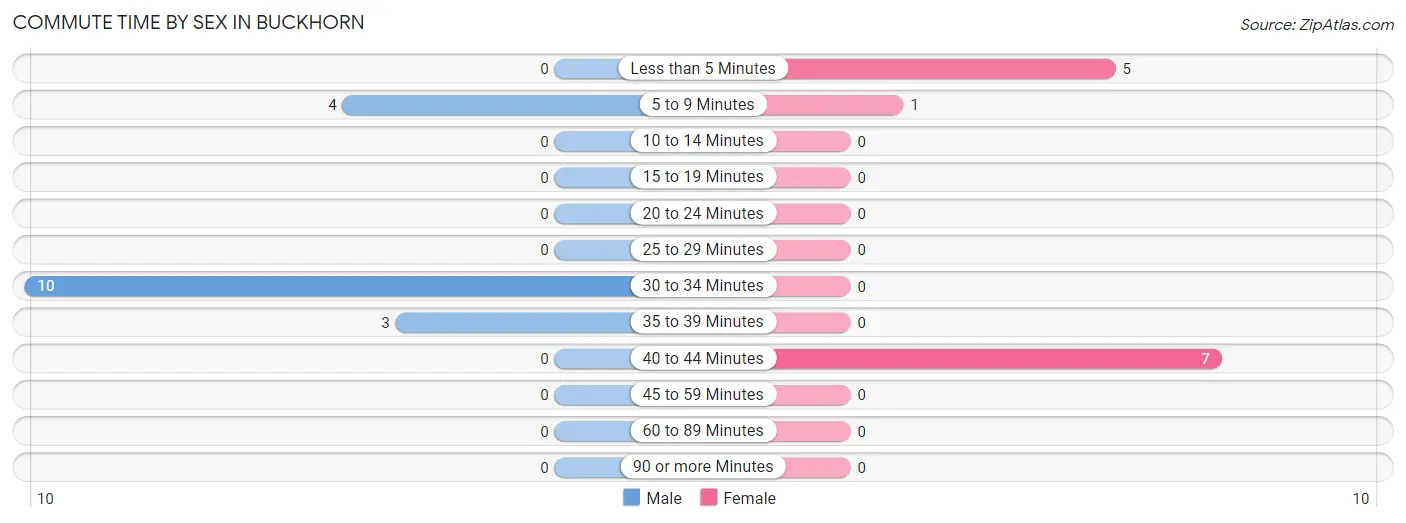
| Commute Time | Male | Female |
| Less than 5 Minutes | 0 (0.0%) | 5 (38.5%) |
| 5 to 9 Minutes | 4 (23.5%) | 1 (7.7%) |
| 10 to 14 Minutes | 0 (0.0%) | 0 (0.0%) |
| 15 to 19 Minutes | 0 (0.0%) | 0 (0.0%) |
| 20 to 24 Minutes | 0 (0.0%) | 0 (0.0%) |
| 25 to 29 Minutes | 0 (0.0%) | 0 (0.0%) |
| 30 to 34 Minutes | 10 (58.8%) | 0 (0.0%) |
| 35 to 39 Minutes | 3 (17.6%) | 0 (0.0%) |
| 40 to 44 Minutes | 0 (0.0%) | 7 (53.8%) |
| 45 to 59 Minutes | 0 (0.0%) | 0 (0.0%) |
| 60 to 89 Minutes | 0 (0.0%) | 0 (0.0%) |
| 90 or more Minutes | 0 (0.0%) | 0 (0.0%) |
Time of Departure to Work by Sex in Buckhorn
The most frequent times of departure to work in Buckhorn are 5:00 AM to 5:29 AM (10, 58.8%) for males and 7:00 AM to 7:29 AM (8, 61.5%) for females.
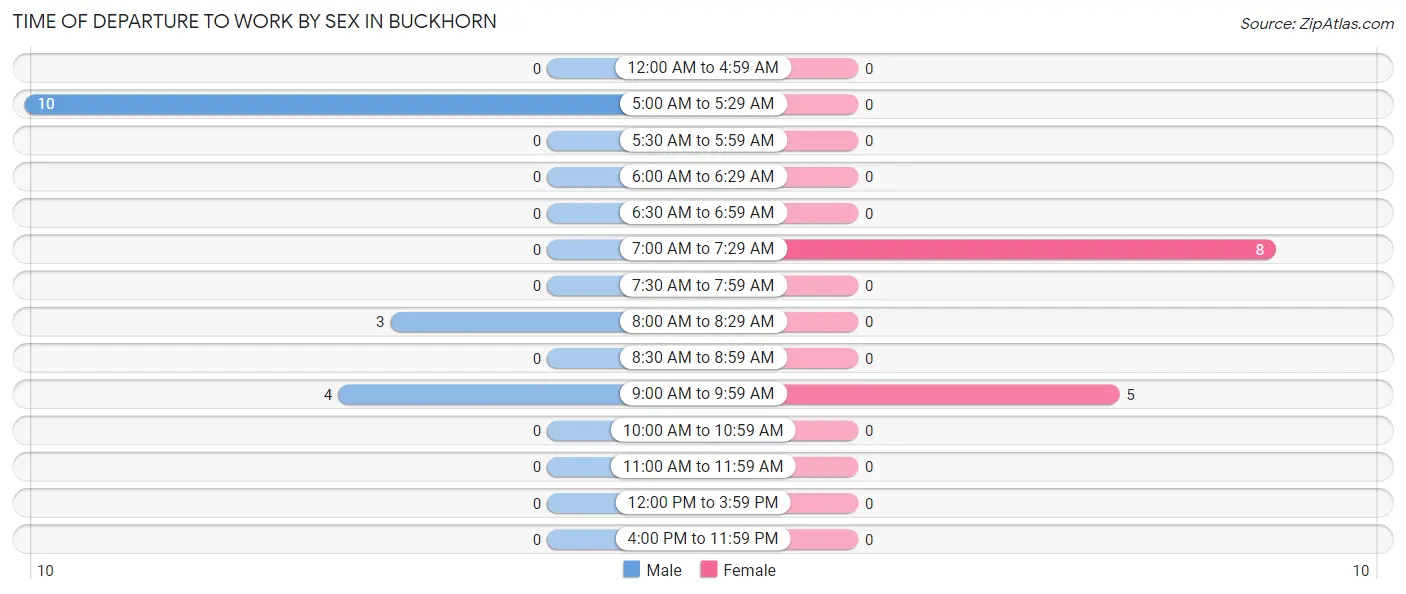
| Time of Departure | Male | Female |
| 12:00 AM to 4:59 AM | 0 (0.0%) | 0 (0.0%) |
| 5:00 AM to 5:29 AM | 10 (58.8%) | 0 (0.0%) |
| 5:30 AM to 5:59 AM | 0 (0.0%) | 0 (0.0%) |
| 6:00 AM to 6:29 AM | 0 (0.0%) | 0 (0.0%) |
| 6:30 AM to 6:59 AM | 0 (0.0%) | 0 (0.0%) |
| 7:00 AM to 7:29 AM | 0 (0.0%) | 8 (61.5%) |
| 7:30 AM to 7:59 AM | 0 (0.0%) | 0 (0.0%) |
| 8:00 AM to 8:29 AM | 3 (17.6%) | 0 (0.0%) |
| 8:30 AM to 8:59 AM | 0 (0.0%) | 0 (0.0%) |
| 9:00 AM to 9:59 AM | 4 (23.5%) | 5 (38.5%) |
| 10:00 AM to 10:59 AM | 0 (0.0%) | 0 (0.0%) |
| 11:00 AM to 11:59 AM | 0 (0.0%) | 0 (0.0%) |
| 12:00 PM to 3:59 PM | 0 (0.0%) | 0 (0.0%) |
| 4:00 PM to 11:59 PM | 0 (0.0%) | 0 (0.0%) |
| Total | 17 (100.0%) | 13 (100.0%) |
Housing Occupancy in Buckhorn
Occupancy by Ownership in Buckhorn
Of the total 24 dwellings in Buckhorn, owner-occupied units account for 19 (79.2%), while renter-occupied units make up 5 (20.8%).
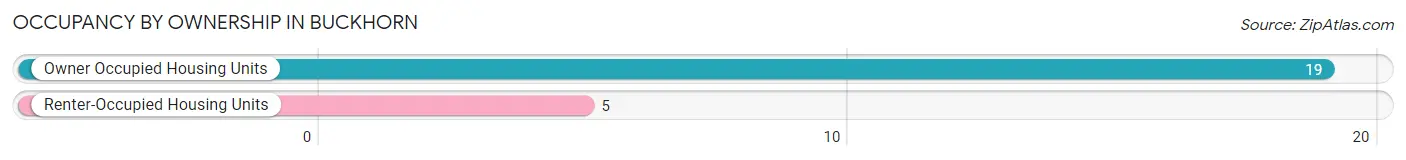
| Occupancy | # Housing Units | % Housing Units |
| Owner Occupied Housing Units | 19 | 79.2% |
| Renter-Occupied Housing Units | 5 | 20.8% |
| Total Occupied Housing Units | 24 | 100.0% |
Occupancy by Household Size in Buckhorn
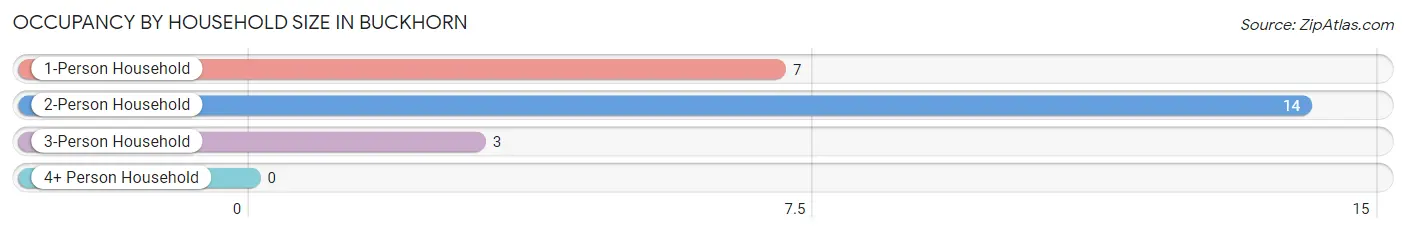
| Household Size | # Housing Units | % Housing Units |
| 1-Person Household | 7 | 29.2% |
| 2-Person Household | 14 | 58.3% |
| 3-Person Household | 3 | 12.5% |
| 4+ Person Household | 0 | 0.0% |
| Total Housing Units | 24 | 100.0% |
Occupancy by Ownership by Household Size in Buckhorn
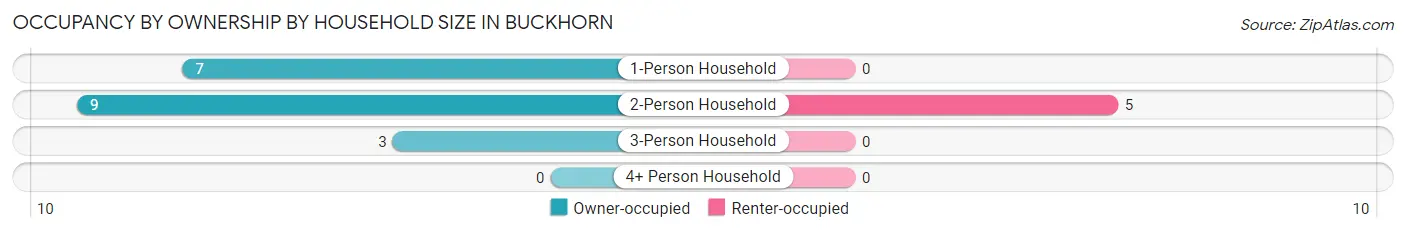
| Household Size | Owner-occupied | Renter-occupied |
| 1-Person Household | 7 (100.0%) | 0 (0.0%) |
| 2-Person Household | 9 (64.3%) | 5 (35.7%) |
| 3-Person Household | 3 (100.0%) | 0 (0.0%) |
| 4+ Person Household | 0 (0.0%) | 0 (0.0%) |
| Total Housing Units | 19 (79.2%) | 5 (20.8%) |
Occupancy by Educational Attainment in Buckhorn
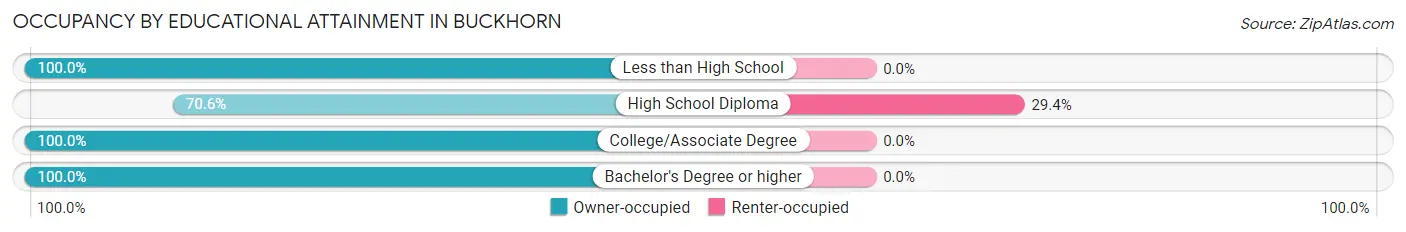
| Household Size | Owner-occupied | Renter-occupied |
| Less than High School | 1 (100.0%) | 0 (0.0%) |
| High School Diploma | 12 (70.6%) | 5 (29.4%) |
| College/Associate Degree | 3 (100.0%) | 0 (0.0%) |
| Bachelor's Degree or higher | 3 (100.0%) | 0 (0.0%) |
Occupancy by Age of Householder in Buckhorn
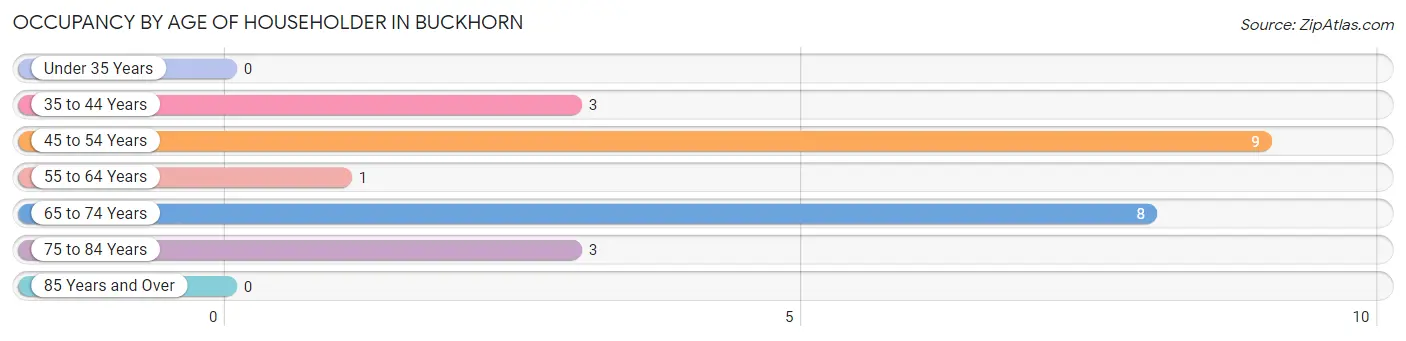
| Age Bracket | # Households | % Households |
| Under 35 Years | 0 | 0.0% |
| 35 to 44 Years | 3 | 12.5% |
| 45 to 54 Years | 9 | 37.5% |
| 55 to 64 Years | 1 | 4.2% |
| 65 to 74 Years | 8 | 33.3% |
| 75 to 84 Years | 3 | 12.5% |
| 85 Years and Over | 0 | 0.0% |
| Total | 24 | 100.0% |
Housing Finances in Buckhorn
Median Income by Occupancy in Buckhorn
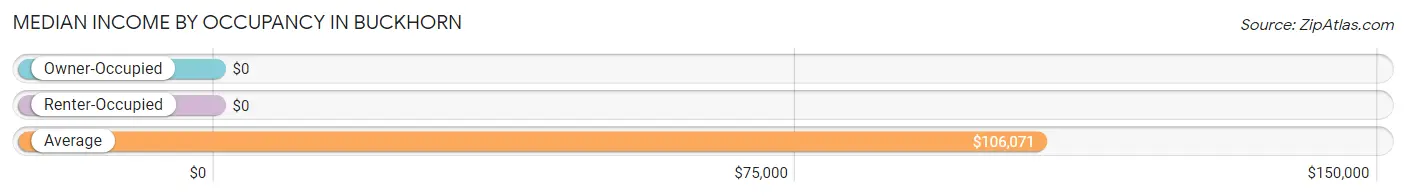
| Occupancy Type | # Households | Median Income |
| Owner-Occupied | 19 (79.2%) | $0 |
| Renter-Occupied | 5 (20.8%) | $0 |
| Average | 24 (100.0%) | $106,071 |
Occupancy by Householder Income Bracket in Buckhorn
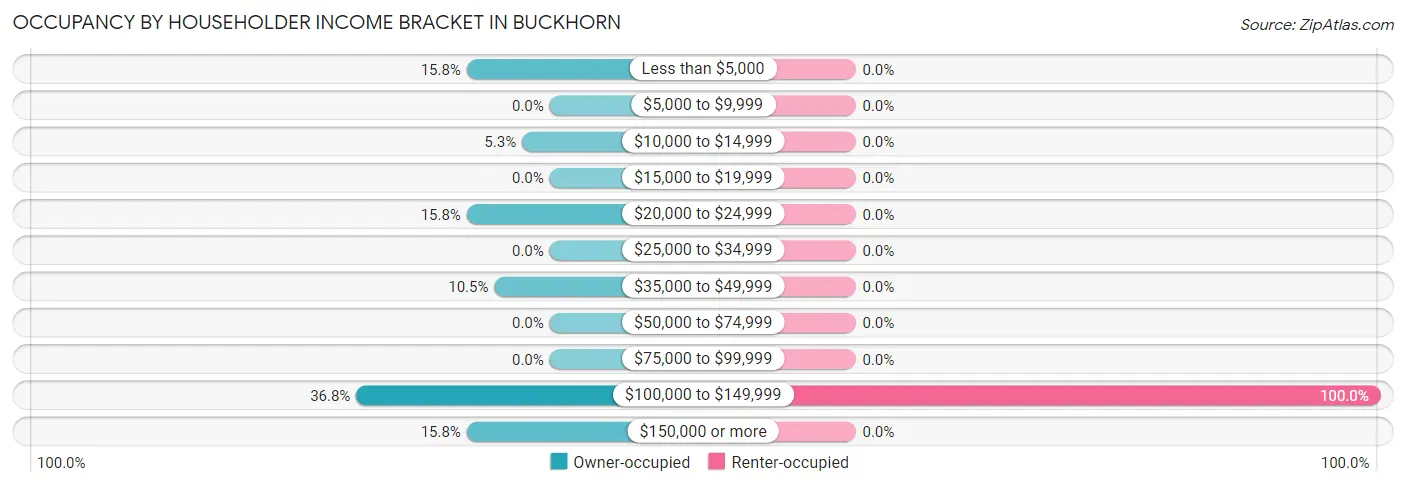
| Income Bracket | Owner-occupied | Renter-occupied |
| Less than $5,000 | 3 (15.8%) | 0 (0.0%) |
| $5,000 to $9,999 | 0 (0.0%) | 0 (0.0%) |
| $10,000 to $14,999 | 1 (5.3%) | 0 (0.0%) |
| $15,000 to $19,999 | 0 (0.0%) | 0 (0.0%) |
| $20,000 to $24,999 | 3 (15.8%) | 0 (0.0%) |
| $25,000 to $34,999 | 0 (0.0%) | 0 (0.0%) |
| $35,000 to $49,999 | 2 (10.5%) | 0 (0.0%) |
| $50,000 to $74,999 | 0 (0.0%) | 0 (0.0%) |
| $75,000 to $99,999 | 0 (0.0%) | 0 (0.0%) |
| $100,000 to $149,999 | 7 (36.8%) | 5 (100.0%) |
| $150,000 or more | 3 (15.8%) | 0 (0.0%) |
| Total | 19 (100.0%) | 5 (100.0%) |
Monthly Housing Cost Tiers in Buckhorn
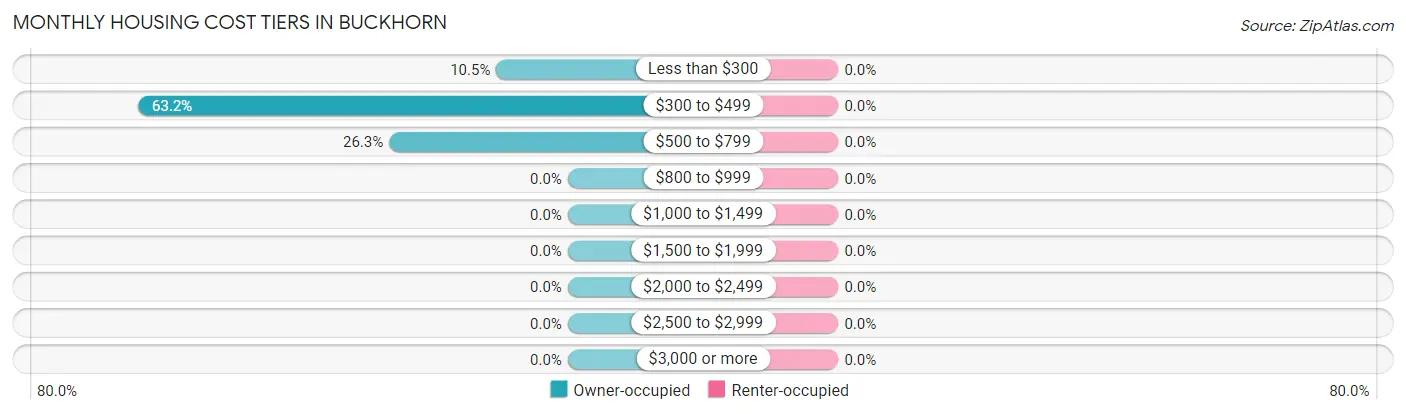
| Monthly Cost | Owner-occupied | Renter-occupied |
| Less than $300 | 2 (10.5%) | 0 (0.0%) |
| $300 to $499 | 12 (63.2%) | 0 (0.0%) |
| $500 to $799 | 5 (26.3%) | 0 (0.0%) |
| $800 to $999 | 0 (0.0%) | 0 (0.0%) |
| $1,000 to $1,499 | 0 (0.0%) | 0 (0.0%) |
| $1,500 to $1,999 | 0 (0.0%) | 0 (0.0%) |
| $2,000 to $2,499 | 0 (0.0%) | 0 (0.0%) |
| $2,500 to $2,999 | 0 (0.0%) | 0 (0.0%) |
| $3,000 or more | 0 (0.0%) | 0 (0.0%) |
| Total | 19 (100.0%) | 5 (100.0%) |
Physical Housing Characteristics in Buckhorn
Housing Structures in Buckhorn
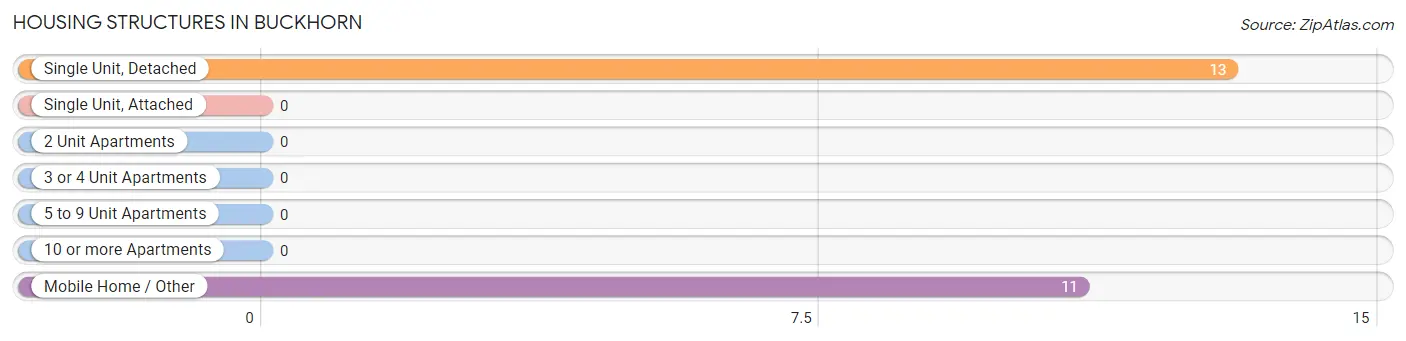
| Structure Type | # Housing Units | % Housing Units |
| Single Unit, Detached | 13 | 54.2% |
| Single Unit, Attached | 0 | 0.0% |
| 2 Unit Apartments | 0 | 0.0% |
| 3 or 4 Unit Apartments | 0 | 0.0% |
| 5 to 9 Unit Apartments | 0 | 0.0% |
| 10 or more Apartments | 0 | 0.0% |
| Mobile Home / Other | 11 | 45.8% |
| Total | 24 | 100.0% |
Housing Structures by Occupancy in Buckhorn
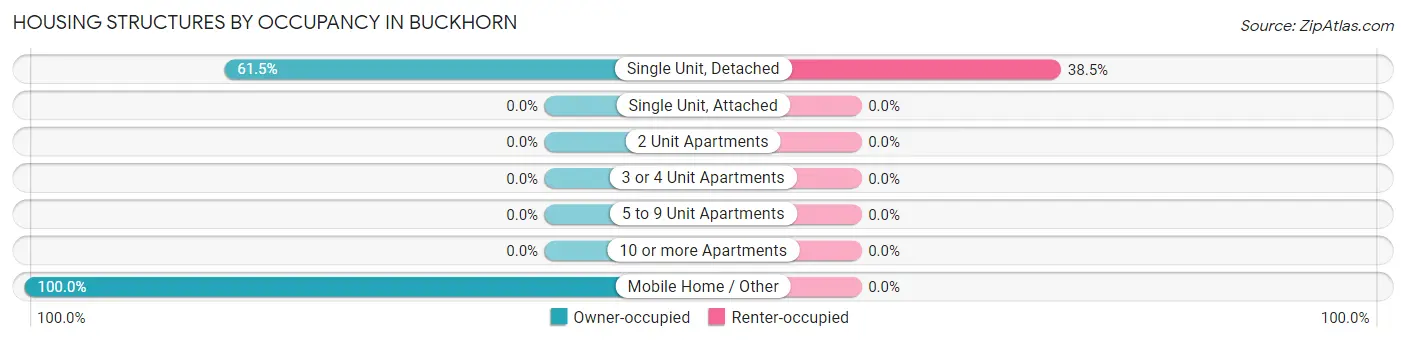
| Structure Type | Owner-occupied | Renter-occupied |
| Single Unit, Detached | 8 (61.5%) | 5 (38.5%) |
| Single Unit, Attached | 0 (0.0%) | 0 (0.0%) |
| 2 Unit Apartments | 0 (0.0%) | 0 (0.0%) |
| 3 or 4 Unit Apartments | 0 (0.0%) | 0 (0.0%) |
| 5 to 9 Unit Apartments | 0 (0.0%) | 0 (0.0%) |
| 10 or more Apartments | 0 (0.0%) | 0 (0.0%) |
| Mobile Home / Other | 11 (100.0%) | 0 (0.0%) |
| Total | 19 (79.2%) | 5 (20.8%) |
Housing Structures by Number of Rooms in Buckhorn
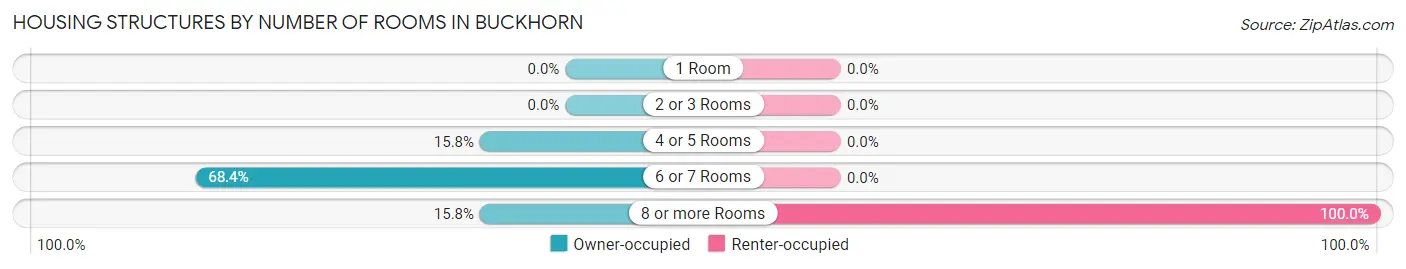
| Number of Rooms | Owner-occupied | Renter-occupied |
| 1 Room | 0 (0.0%) | 0 (0.0%) |
| 2 or 3 Rooms | 0 (0.0%) | 0 (0.0%) |
| 4 or 5 Rooms | 3 (15.8%) | 0 (0.0%) |
| 6 or 7 Rooms | 13 (68.4%) | 0 (0.0%) |
| 8 or more Rooms | 3 (15.8%) | 5 (100.0%) |
| Total | 19 (100.0%) | 5 (100.0%) |
Housing Structure by Heating Type in Buckhorn
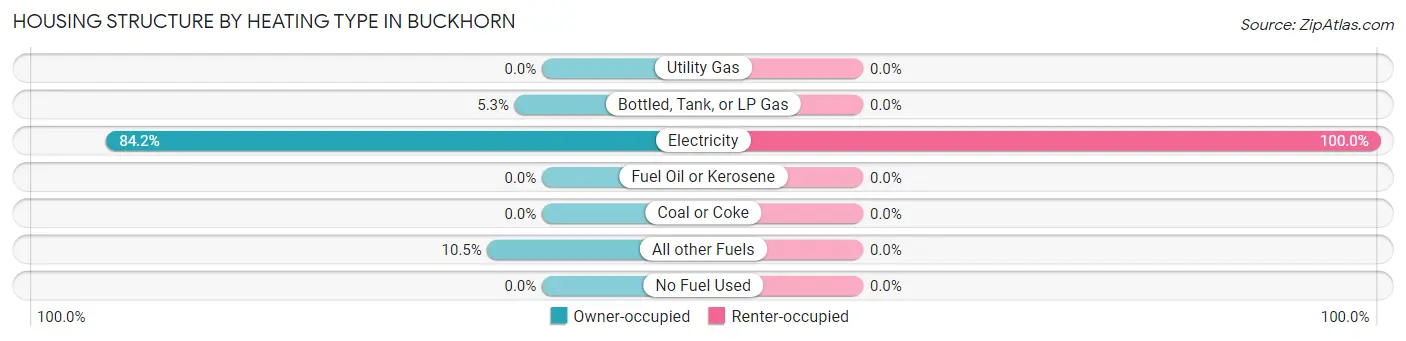
| Heating Type | Owner-occupied | Renter-occupied |
| Utility Gas | 0 (0.0%) | 0 (0.0%) |
| Bottled, Tank, or LP Gas | 1 (5.3%) | 0 (0.0%) |
| Electricity | 16 (84.2%) | 5 (100.0%) |
| Fuel Oil or Kerosene | 0 (0.0%) | 0 (0.0%) |
| Coal or Coke | 0 (0.0%) | 0 (0.0%) |
| All other Fuels | 2 (10.5%) | 0 (0.0%) |
| No Fuel Used | 0 (0.0%) | 0 (0.0%) |
| Total | 19 (100.0%) | 5 (100.0%) |
Household Vehicle Usage in Buckhorn
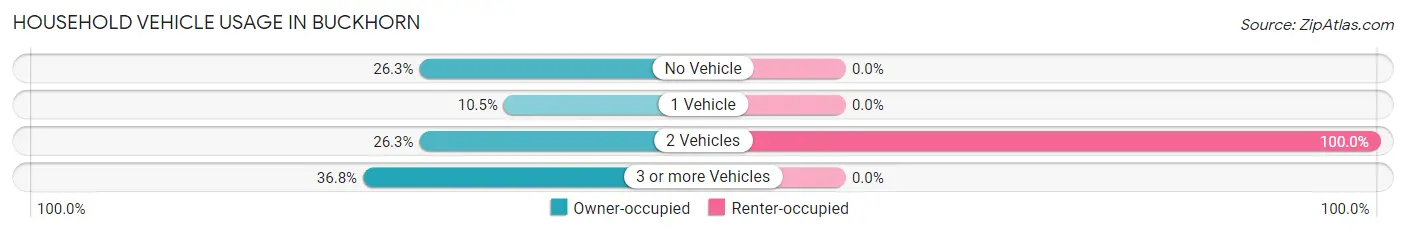
| Vehicles per Household | Owner-occupied | Renter-occupied |
| No Vehicle | 5 (26.3%) | 0 (0.0%) |
| 1 Vehicle | 2 (10.5%) | 0 (0.0%) |
| 2 Vehicles | 5 (26.3%) | 5 (100.0%) |
| 3 or more Vehicles | 7 (36.8%) | 0 (0.0%) |
| Total | 19 (100.0%) | 5 (100.0%) |
Real Estate & Mortgages in Buckhorn
Real Estate and Mortgage Overview in Buckhorn
| Characteristic | Without Mortgage | With Mortgage |
| Housing Units | 15 | 4 |
| Median Property Value | $45,000 | $0 |
| Median Household Income | - | - |
| Monthly Housing Costs | $328 | $0 |
| Real Estate Taxes | $313 | $1 |
Property Value by Mortgage Status in Buckhorn
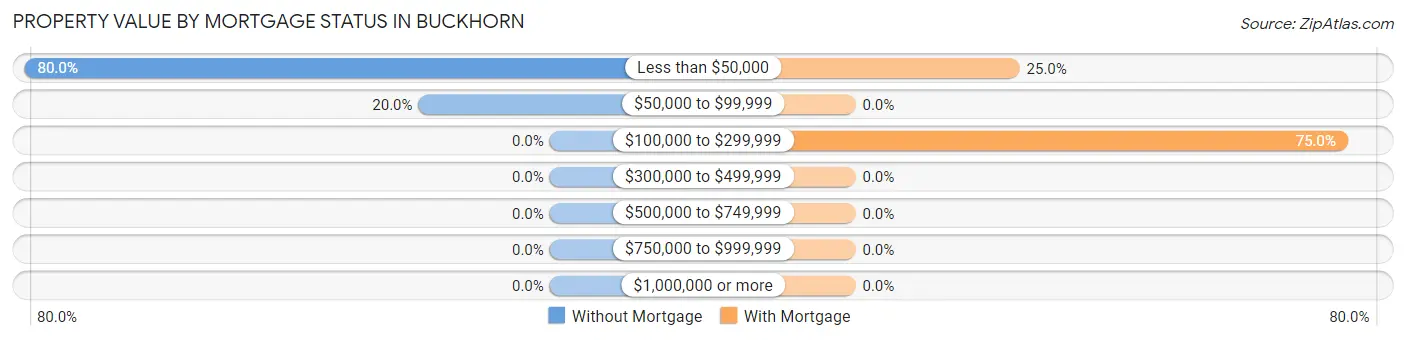
| Property Value | Without Mortgage | With Mortgage |
| Less than $50,000 | 12 (80.0%) | 1 (25.0%) |
| $50,000 to $99,999 | 3 (20.0%) | 0 (0.0%) |
| $100,000 to $299,999 | 0 (0.0%) | 3 (75.0%) |
| $300,000 to $499,999 | 0 (0.0%) | 0 (0.0%) |
| $500,000 to $749,999 | 0 (0.0%) | 0 (0.0%) |
| $750,000 to $999,999 | 0 (0.0%) | 0 (0.0%) |
| $1,000,000 or more | 0 (0.0%) | 0 (0.0%) |
| Total | 15 (100.0%) | 4 (100.0%) |
Household Income by Mortgage Status in Buckhorn
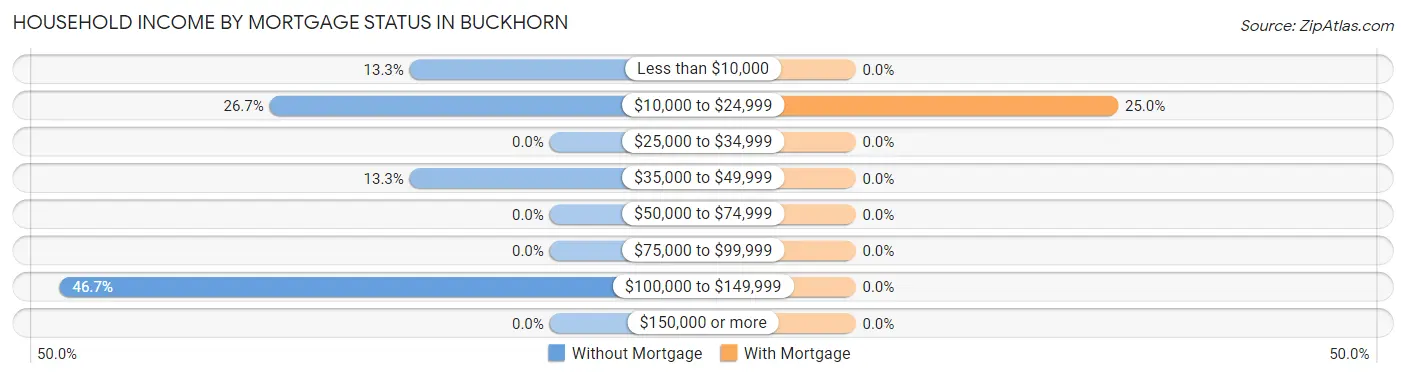
| Household Income | Without Mortgage | With Mortgage |
| Less than $10,000 | 2 (13.3%) | 0 (0.0%) |
| $10,000 to $24,999 | 4 (26.7%) | 1 (25.0%) |
| $25,000 to $34,999 | 0 (0.0%) | 0 (0.0%) |
| $35,000 to $49,999 | 2 (13.3%) | 0 (0.0%) |
| $50,000 to $74,999 | 0 (0.0%) | 0 (0.0%) |
| $75,000 to $99,999 | 0 (0.0%) | 0 (0.0%) |
| $100,000 to $149,999 | 7 (46.7%) | 0 (0.0%) |
| $150,000 or more | 0 (0.0%) | 0 (0.0%) |
| Total | 15 (100.0%) | 4 (100.0%) |
Property Value to Household Income Ratio in Buckhorn
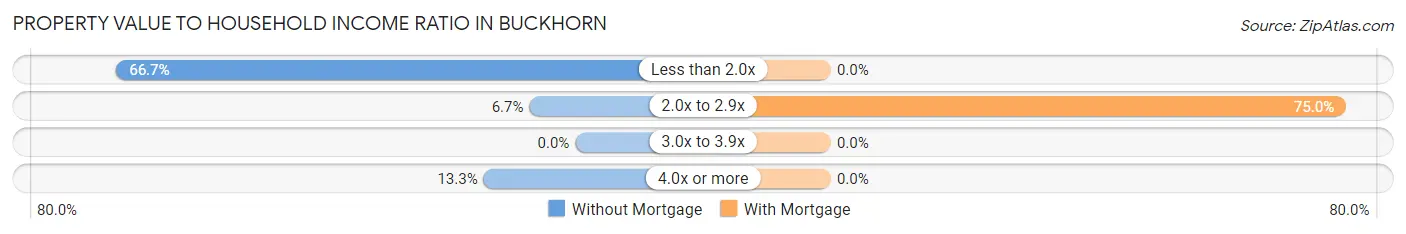
| Value-to-Income Ratio | Without Mortgage | With Mortgage |
| Less than 2.0x | 10 (66.7%) | 0 (0.0%) |
| 2.0x to 2.9x | 1 (6.7%) | 3 (75.0%) |
| 3.0x to 3.9x | 0 (0.0%) | 0 (0.0%) |
| 4.0x or more | 2 (13.3%) | 0 (0.0%) |
| Total | 15 (100.0%) | 4 (100.0%) |
Real Estate Taxes by Mortgage Status in Buckhorn
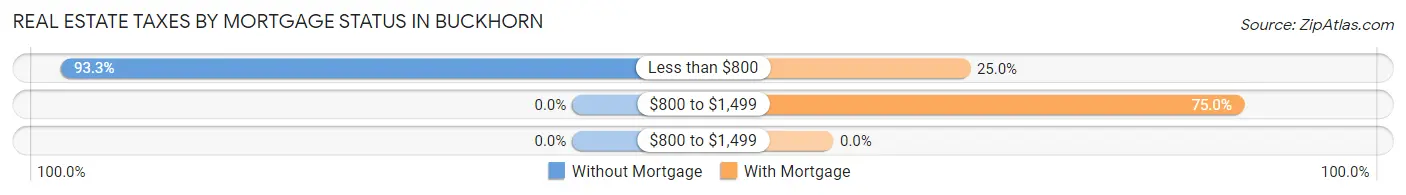
| Property Taxes | Without Mortgage | With Mortgage |
| Less than $800 | 14 (93.3%) | 1 (25.0%) |
| $800 to $1,499 | 0 (0.0%) | 3 (75.0%) |
| $800 to $1,499 | 0 (0.0%) | 0 (0.0%) |
| Total | 15 (100.0%) | 4 (100.0%) |
Health & Disability in Buckhorn
Health Insurance Coverage by Age in Buckhorn
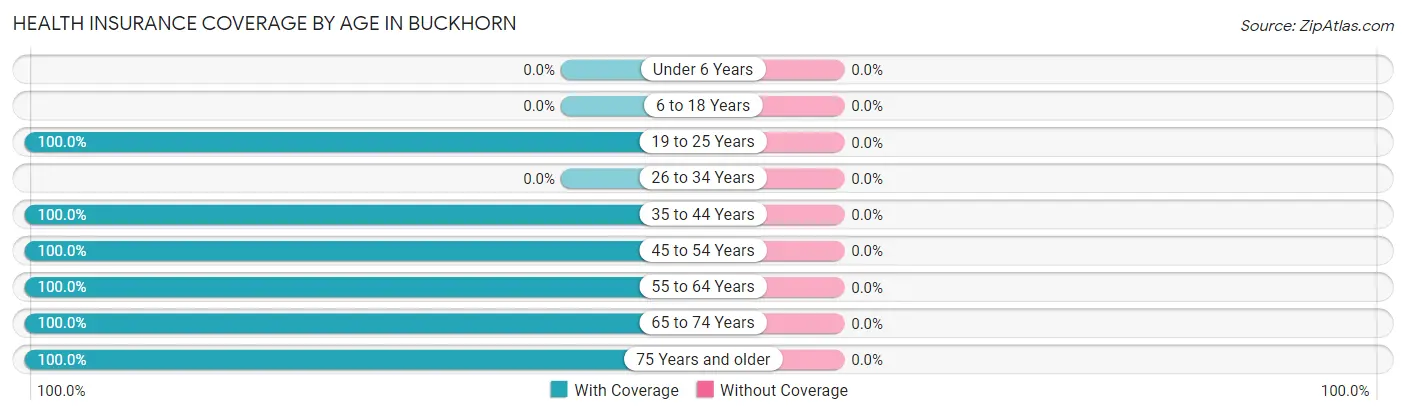
| Age Bracket | With Coverage | Without Coverage |
| Under 6 Years | 0 (0.0%) | 0 (0.0%) |
| 6 to 18 Years | 0 (0.0%) | 0 (0.0%) |
| 19 to 25 Years | 6 (100.0%) | 0 (0.0%) |
| 26 to 34 Years | 0 (0.0%) | 0 (0.0%) |
| 35 to 44 Years | 3 (100.0%) | 0 (0.0%) |
| 45 to 54 Years | 19 (100.0%) | 0 (0.0%) |
| 55 to 64 Years | 2 (100.0%) | 0 (0.0%) |
| 65 to 74 Years | 16 (100.0%) | 0 (0.0%) |
| 75 Years and older | 3 (100.0%) | 0 (0.0%) |
| Total | 49 (100.0%) | 0 (0.0%) |
Health Insurance Coverage by Citizenship Status in Buckhorn
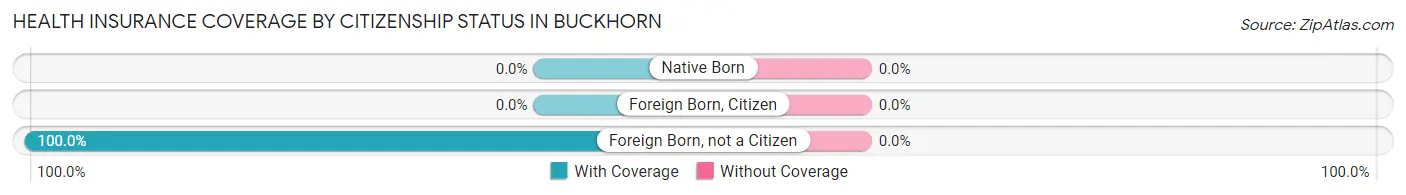
| Citizenship Status | With Coverage | Without Coverage |
| Native Born | 0 (0.0%) | 0 (0.0%) |
| Foreign Born, Citizen | 0 (0.0%) | 0 (0.0%) |
| Foreign Born, not a Citizen | 6 (100.0%) | 0 (0.0%) |
Health Insurance Coverage by Household Income in Buckhorn
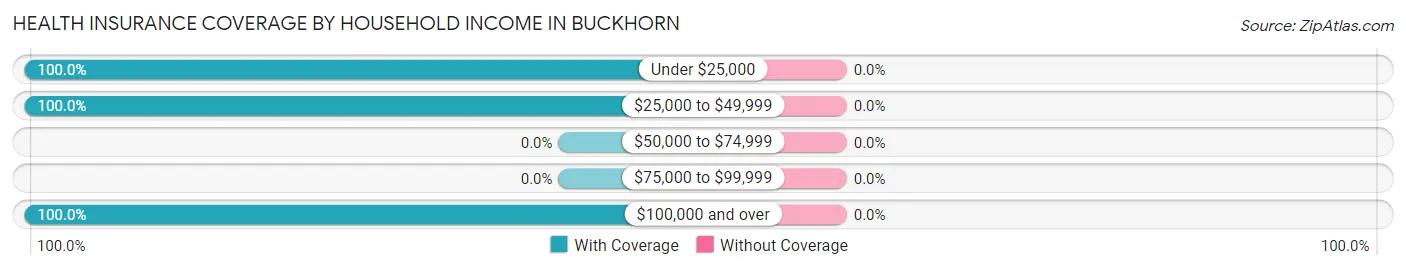
| Household Income | With Coverage | Without Coverage |
| Under $25,000 | 7 (100.0%) | 0 (0.0%) |
| $25,000 to $49,999 | 3 (100.0%) | 0 (0.0%) |
| $50,000 to $74,999 | 0 (0.0%) | 0 (0.0%) |
| $75,000 to $99,999 | 0 (0.0%) | 0 (0.0%) |
| $100,000 and over | 33 (100.0%) | 0 (0.0%) |
Public vs Private Health Insurance Coverage by Age in Buckhorn
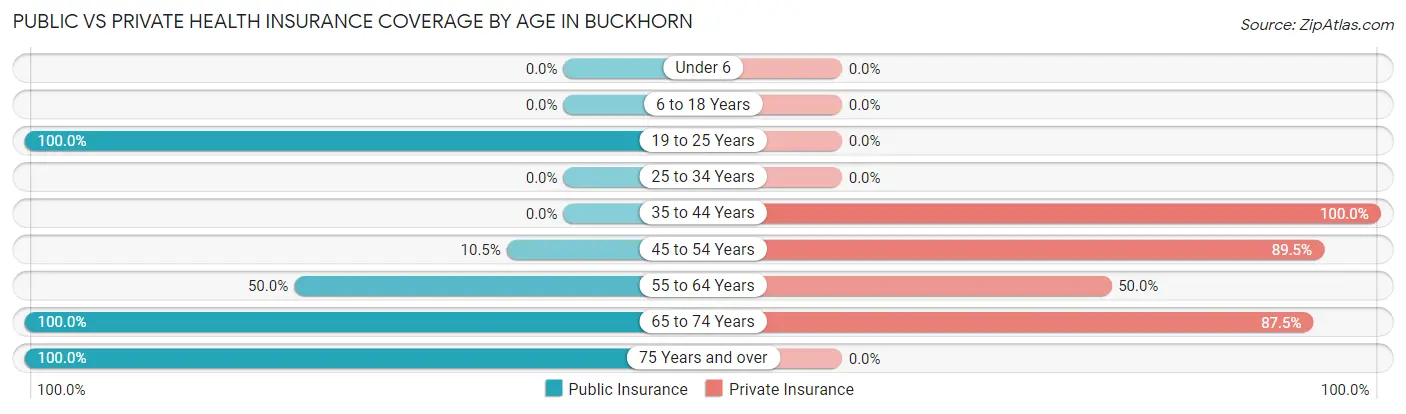
| Age Bracket | Public Insurance | Private Insurance |
| Under 6 | 0 (0.0%) | 0 (0.0%) |
| 6 to 18 Years | 0 (0.0%) | 0 (0.0%) |
| 19 to 25 Years | 6 (100.0%) | 0 (0.0%) |
| 25 to 34 Years | 0 (0.0%) | 0 (0.0%) |
| 35 to 44 Years | 0 (0.0%) | 3 (100.0%) |
| 45 to 54 Years | 2 (10.5%) | 17 (89.5%) |
| 55 to 64 Years | 1 (50.0%) | 1 (50.0%) |
| 65 to 74 Years | 16 (100.0%) | 14 (87.5%) |
| 75 Years and over | 3 (100.0%) | 0 (0.0%) |
| Total | 28 (57.1%) | 35 (71.4%) |
Disability Status by Sex by Age in Buckhorn
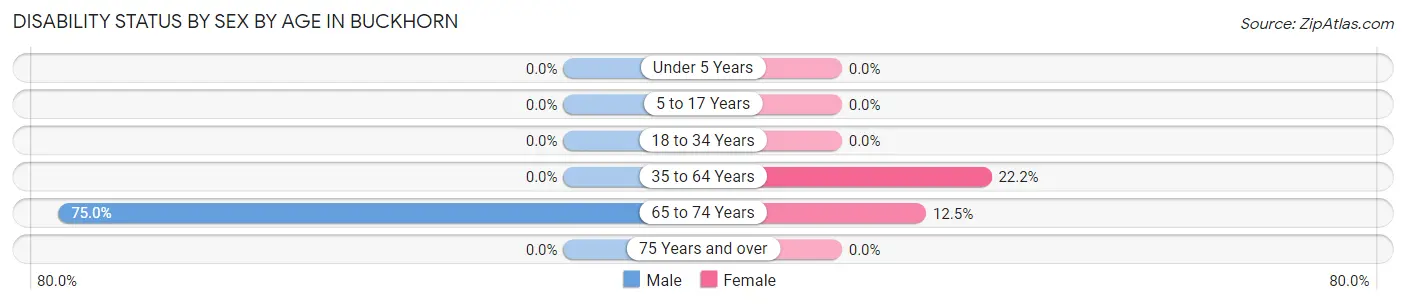
| Age Bracket | Male | Female |
| Under 5 Years | 0 (0.0%) | 0 (0.0%) |
| 5 to 17 Years | 0 (0.0%) | 0 (0.0%) |
| 18 to 34 Years | 0 (0.0%) | 0 (0.0%) |
| 35 to 64 Years | 0 (0.0%) | 2 (22.2%) |
| 65 to 74 Years | 6 (75.0%) | 1 (12.5%) |
| 75 Years and over | 0 (0.0%) | 0 (0.0%) |
Disability Class by Sex by Age in Buckhorn
Disability Class: Hearing Difficulty
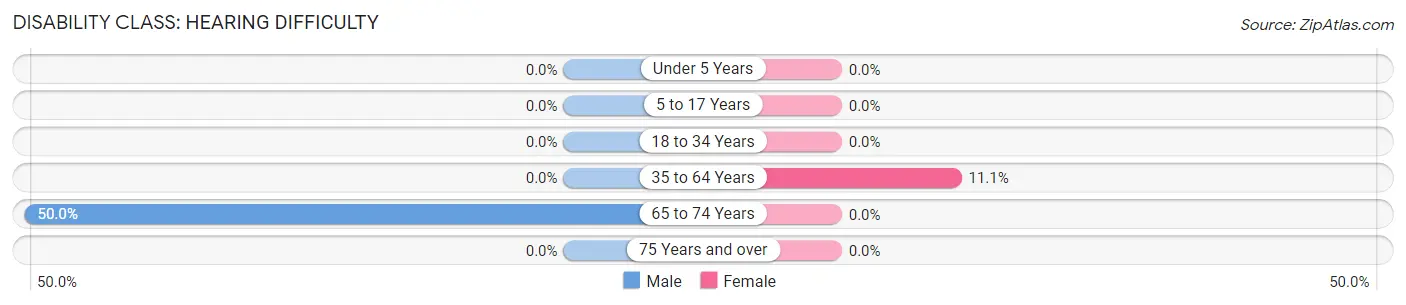
| Age Bracket | Male | Female |
| Under 5 Years | 0 (0.0%) | 0 (0.0%) |
| 5 to 17 Years | 0 (0.0%) | 0 (0.0%) |
| 18 to 34 Years | 0 (0.0%) | 0 (0.0%) |
| 35 to 64 Years | 0 (0.0%) | 1 (11.1%) |
| 65 to 74 Years | 4 (50.0%) | 0 (0.0%) |
| 75 Years and over | 0 (0.0%) | 0 (0.0%) |
Disability Class: Vision Difficulty
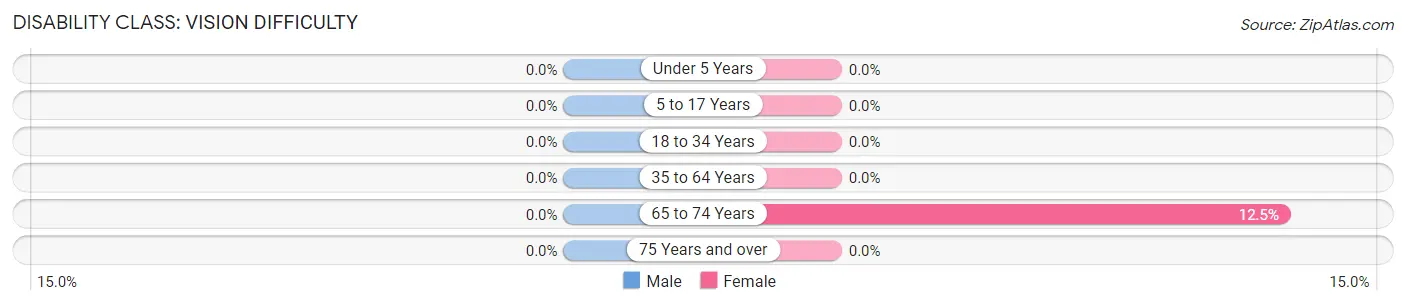
| Age Bracket | Male | Female |
| Under 5 Years | 0 (0.0%) | 0 (0.0%) |
| 5 to 17 Years | 0 (0.0%) | 0 (0.0%) |
| 18 to 34 Years | 0 (0.0%) | 0 (0.0%) |
| 35 to 64 Years | 0 (0.0%) | 0 (0.0%) |
| 65 to 74 Years | 0 (0.0%) | 1 (12.5%) |
| 75 Years and over | 0 (0.0%) | 0 (0.0%) |
Disability Class: Cognitive Difficulty
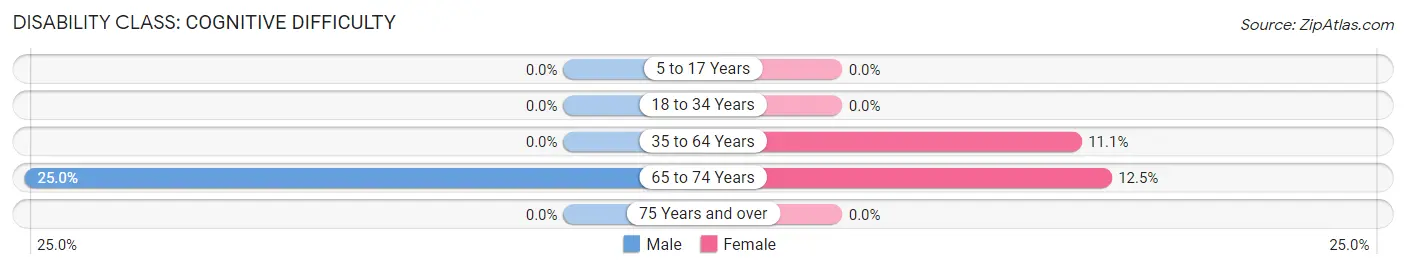
| Age Bracket | Male | Female |
| 5 to 17 Years | 0 (0.0%) | 0 (0.0%) |
| 18 to 34 Years | 0 (0.0%) | 0 (0.0%) |
| 35 to 64 Years | 0 (0.0%) | 1 (11.1%) |
| 65 to 74 Years | 2 (25.0%) | 1 (12.5%) |
| 75 Years and over | 0 (0.0%) | 0 (0.0%) |
Disability Class: Ambulatory Difficulty
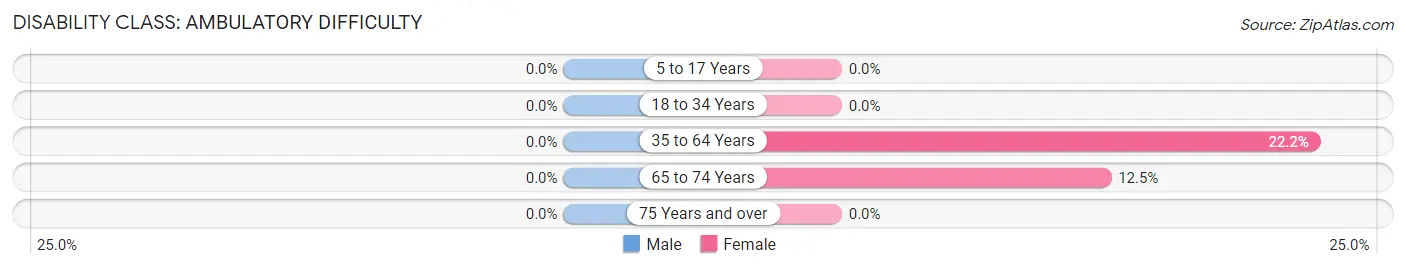
| Age Bracket | Male | Female |
| 5 to 17 Years | 0 (0.0%) | 0 (0.0%) |
| 18 to 34 Years | 0 (0.0%) | 0 (0.0%) |
| 35 to 64 Years | 0 (0.0%) | 2 (22.2%) |
| 65 to 74 Years | 0 (0.0%) | 1 (12.5%) |
| 75 Years and over | 0 (0.0%) | 0 (0.0%) |
Disability Class: Self-Care Difficulty
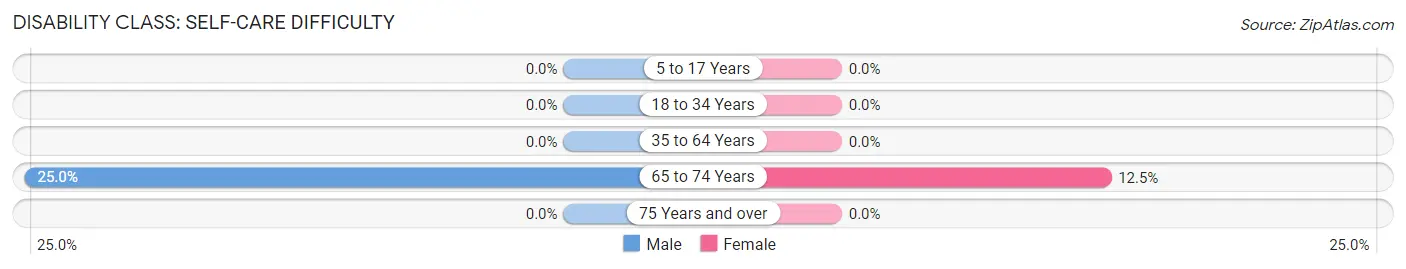
| Age Bracket | Male | Female |
| 5 to 17 Years | 0 (0.0%) | 0 (0.0%) |
| 18 to 34 Years | 0 (0.0%) | 0 (0.0%) |
| 35 to 64 Years | 0 (0.0%) | 0 (0.0%) |
| 65 to 74 Years | 2 (25.0%) | 1 (12.5%) |
| 75 Years and over | 0 (0.0%) | 0 (0.0%) |
Technology Access in Buckhorn
Computing Device Access in Buckhorn
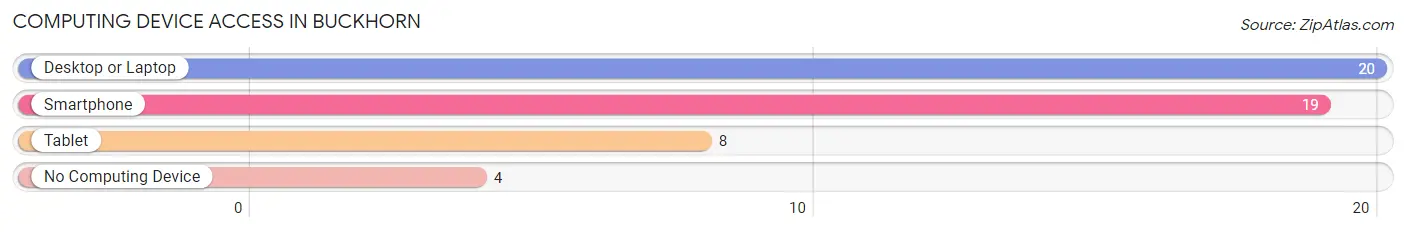
| Device Type | # Households | % Households |
| Desktop or Laptop | 20 | 83.3% |
| Smartphone | 19 | 79.2% |
| Tablet | 8 | 33.3% |
| No Computing Device | 4 | 16.7% |
| Total | 24 | 100.0% |
Internet Access in Buckhorn
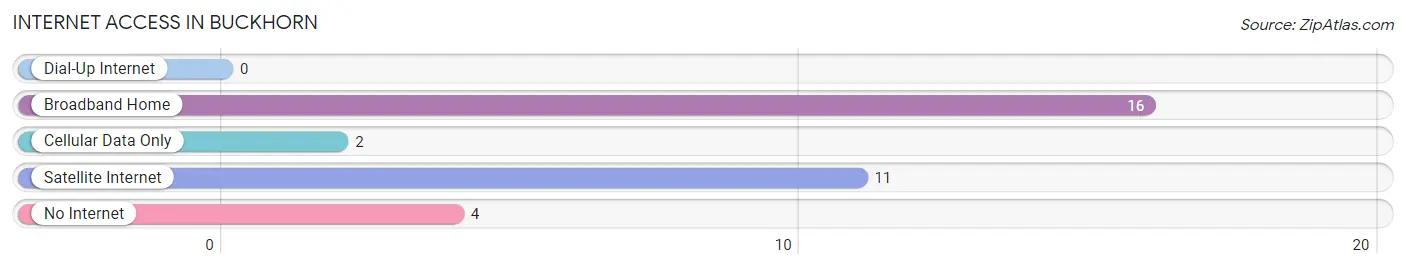
| Internet Type | # Households | % Households |
| Dial-Up Internet | 0 | 0.0% |
| Broadband Home | 16 | 66.7% |
| Cellular Data Only | 2 | 8.3% |
| Satellite Internet | 11 | 45.8% |
| No Internet | 4 | 16.7% |
| Total | 24 | 100.0% |
Buckhorn Summary
Buckhorn is a small unincorporated community located in Perry County, Kentucky, United States. It is situated in the Appalachian Mountains, approximately 20 miles east of Hazard. The population of Buckhorn was estimated to be around 500 in 2000.
History
Buckhorn was first settled in the late 1700s by a group of settlers from North Carolina. The town was named after the nearby Buckhorn Creek, which was named for the abundance of deer in the area. The first post office was established in 1883.
In the early 1900s, Buckhorn was a thriving coal mining town. The coal industry provided jobs for many of the town’s residents and helped to fuel the local economy. The coal industry declined in the mid-1900s, and the town’s population began to decline as well.
Geography
Buckhorn is located in the Appalachian Mountains of eastern Kentucky. The town is situated in the Daniel Boone National Forest, and is surrounded by the Buckhorn Creek and the Redbird River. The town is located at an elevation of 1,400 feet above sea level.
The climate in Buckhorn is humid subtropical, with hot summers and mild winters. The average annual temperature is around 57 degrees Fahrenheit. The average annual precipitation is around 45 inches.
Economy
The economy of Buckhorn is largely based on agriculture and tourism. The town is home to several small farms, which produce a variety of crops, including corn, soybeans, and tobacco. The town is also home to several small businesses, including a general store, a gas station, and a restaurant.
Tourism is an important part of the local economy. The town is home to several attractions, including the Buckhorn Lake State Park, which offers camping, fishing, and boating. The town is also home to the Buckhorn Museum, which features artifacts from the town’s history.
Demographics
As of the 2000 census, the population of Buckhorn was estimated to be around 500. The racial makeup of the town was 97.2% White, 0.8% African American, 0.2% Native American, 0.2% Asian, and 1.6% from other races. The median household income was $20,000, and the median family income was $25,000.
The town is served by the Perry County School District, which includes two elementary schools, one middle school, and one high school. The town is also home to a branch of the Hazard Community and Technical College.
Conclusion
Buckhorn is a small unincorporated community located in Perry County, Kentucky. The town was first settled in the late 1700s and was once a thriving coal mining town. Today, the economy of Buckhorn is largely based on agriculture and tourism. The population of Buckhorn was estimated to be around 500 in 2000, and the town is served by the Perry County School District.
Common Questions
What is Per Capita Income in Buckhorn?
Per Capita income in Buckhorn is $31,925.
What is the Median Family Income in Buckhorn?
Median Family Income in Buckhorn is $107,321.
What is the Median Household income in Buckhorn?
Median Household Income in Buckhorn is $106,071.
What is Income or Wage Gap in Buckhorn?
Income or Wage Gap in Buckhorn is 65.4%.
Women in Buckhorn earn 34.6 cents for every dollar earned by a man.
What is Inequality or Gini Index in Buckhorn?
Inequality or Gini Index in Buckhorn is 0.41.
What is the Total Population of Buckhorn?
Total Population of Buckhorn is 68.
What is the Total Male Population of Buckhorn?
Total Male Population of Buckhorn is 45.
What is the Total Female Population of Buckhorn?
Total Female Population of Buckhorn is 23.
What is the Ratio of Males per 100 Females in Buckhorn?
There are 195.65 Males per 100 Females in Buckhorn.
What is the Ratio of Females per 100 Males in Buckhorn?
There are 51.11 Females per 100 Males in Buckhorn.
What is the Median Population Age in Buckhorn?
Median Population Age in Buckhorn is 47.6 Years.
What is the Average Family Size in Buckhorn
Average Family Size in Buckhorn is 2.1 People.
What is the Average Household Size in Buckhorn
Average Household Size in Buckhorn is 1.8 People.
How Large is the Labor Force in Buckhorn?
There are 30 People in the Labor Forcein in Buckhorn.
What is the Percentage of People in the Labor Force in Buckhorn?
53.6% of People are in the Labor Force in Buckhorn.