Lester, WV Map & Demographics
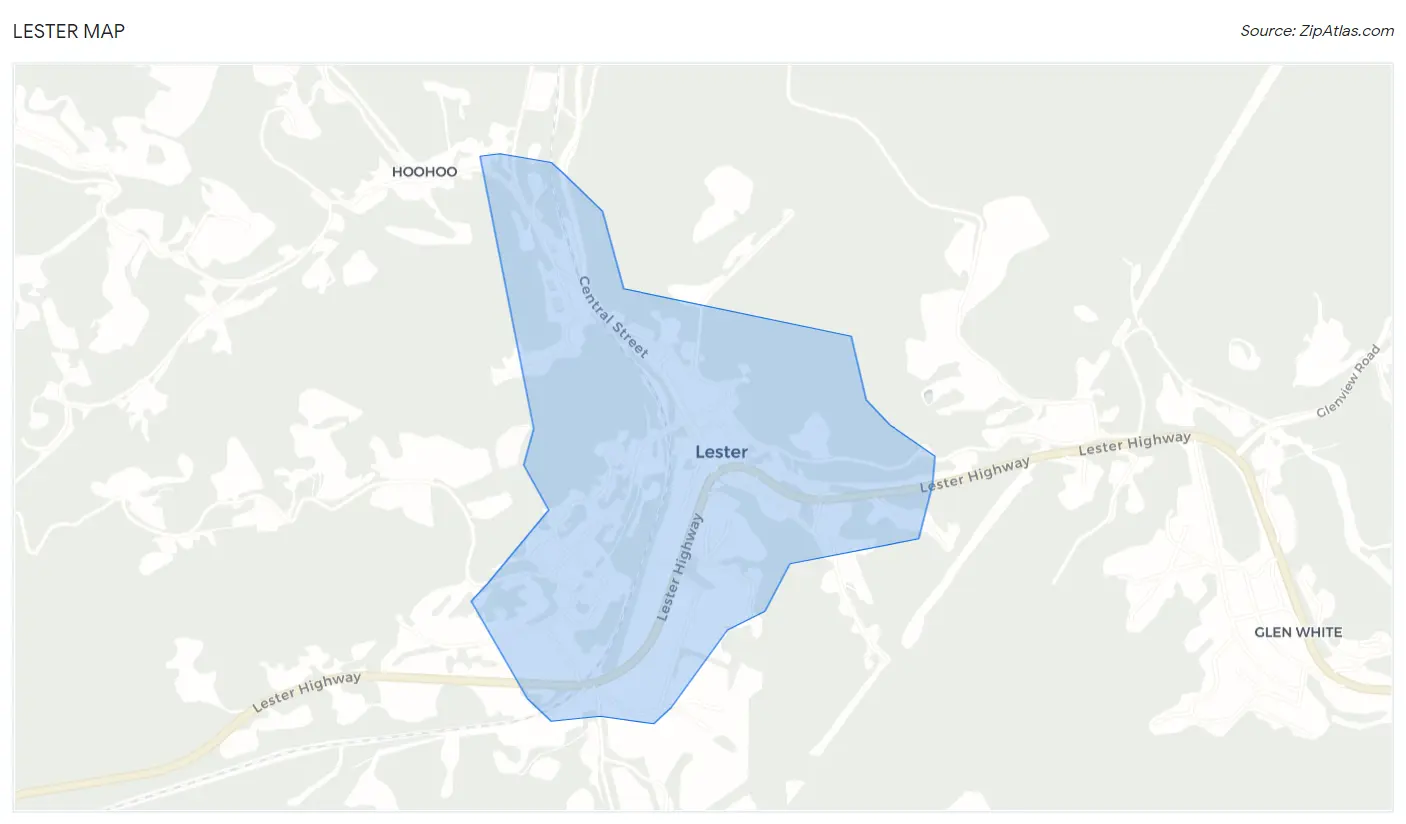
Lester Map
Lester Overview
$18,091
PER CAPITA INCOME
$32,667
AVG FAMILY INCOME
$28,125
AVG HOUSEHOLD INCOME
0.51
INEQUALITY / GINI INDEX
440
TOTAL POPULATION
244
MALE POPULATION
196
FEMALE POPULATION
124.49
MALES / 100 FEMALES
80.33
FEMALES / 100 MALES
50.0
MEDIAN AGE
4.0
AVG FAMILY SIZE
2.7
AVG HOUSEHOLD SIZE
115
LABOR FORCE [ PEOPLE ]
36.6%
PERCENT IN LABOR FORCE
8.7%
UNEMPLOYMENT RATE
Lester Zip Codes
Lester Area Codes
Income in Lester
Income Overview in Lester
Per Capita Income in Lester is $18,091, while median incomes of families and households are $32,667 and $28,125 respectively.
| Characteristic | Number | Measure |
| Per Capita Income | 440 | $18,091 |
| Median Family Income | 94 | $32,667 |
| Mean Family Income | 94 | $40,983 |
| Median Household Income | 162 | $28,125 |
| Mean Household Income | 162 | $32,101 |
| Income Deficit | 94 | $0 |
| Wage / Income Gap (%) | 440 | 0.00% |
| Wage / Income Gap ($) | 440 | 100.00¢ per $1 |
| Gini / Inequality Index | 440 | 0.51 |
Earnings by Sex in Lester
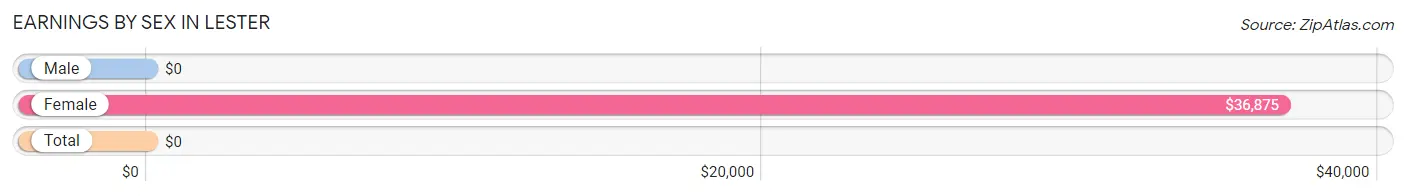
| Sex | Number | Average Earnings |
| Male | 90 (78.3%) | $0 |
| Female | 25 (21.7%) | $36,875 |
| Total | 115 (100.0%) | $0 |
Earnings by Sex by Income Bracket in Lester
The most common earnings brackets in Lester are $65,000 to $74,999 for men (36 | 40.0%) and $35,000 to $39,999 for women (5 | 20.0%).
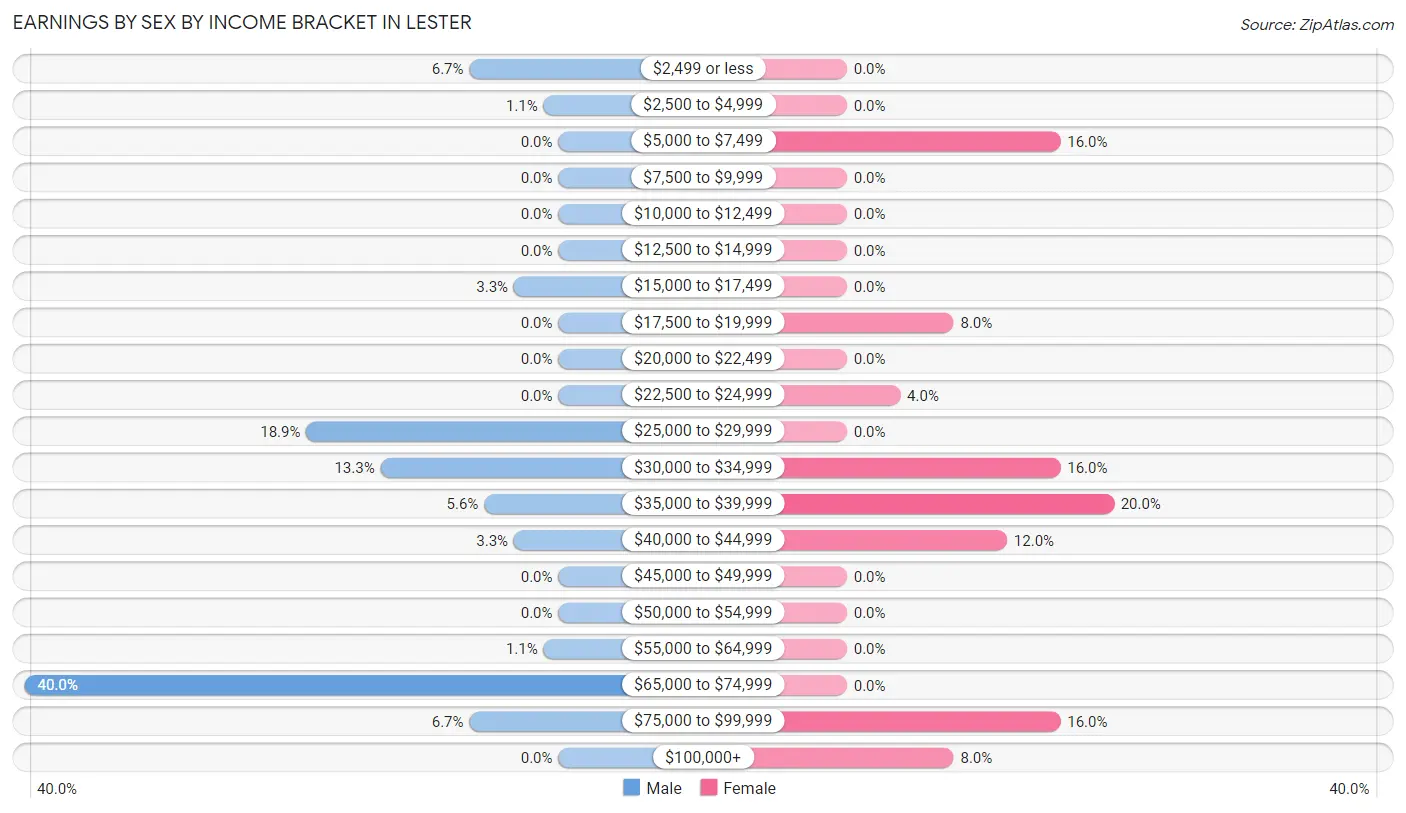
| Income | Male | Female |
| $2,499 or less | 6 (6.7%) | 0 (0.0%) |
| $2,500 to $4,999 | 1 (1.1%) | 0 (0.0%) |
| $5,000 to $7,499 | 0 (0.0%) | 4 (16.0%) |
| $7,500 to $9,999 | 0 (0.0%) | 0 (0.0%) |
| $10,000 to $12,499 | 0 (0.0%) | 0 (0.0%) |
| $12,500 to $14,999 | 0 (0.0%) | 0 (0.0%) |
| $15,000 to $17,499 | 3 (3.3%) | 0 (0.0%) |
| $17,500 to $19,999 | 0 (0.0%) | 2 (8.0%) |
| $20,000 to $22,499 | 0 (0.0%) | 0 (0.0%) |
| $22,500 to $24,999 | 0 (0.0%) | 1 (4.0%) |
| $25,000 to $29,999 | 17 (18.9%) | 0 (0.0%) |
| $30,000 to $34,999 | 12 (13.3%) | 4 (16.0%) |
| $35,000 to $39,999 | 5 (5.6%) | 5 (20.0%) |
| $40,000 to $44,999 | 3 (3.3%) | 3 (12.0%) |
| $45,000 to $49,999 | 0 (0.0%) | 0 (0.0%) |
| $50,000 to $54,999 | 0 (0.0%) | 0 (0.0%) |
| $55,000 to $64,999 | 1 (1.1%) | 0 (0.0%) |
| $65,000 to $74,999 | 36 (40.0%) | 0 (0.0%) |
| $75,000 to $99,999 | 6 (6.7%) | 4 (16.0%) |
| $100,000+ | 0 (0.0%) | 2 (8.0%) |
| Total | 90 (100.0%) | 25 (100.0%) |
Earnings by Sex by Educational Attainment in Lester
Average earnings in Lester are $73,090 for men and $36,875 for women, a difference of 49.5%. Men with an educational attainment of college or associate's degree enjoy the highest average annual earnings of $93,333, while those with bachelor's degree education earn the least with $38,750. Women with an educational attainment of high school diploma earn the most with the average annual earnings of $36,875, while those with high school diploma education have the smallest earnings of $36,875.
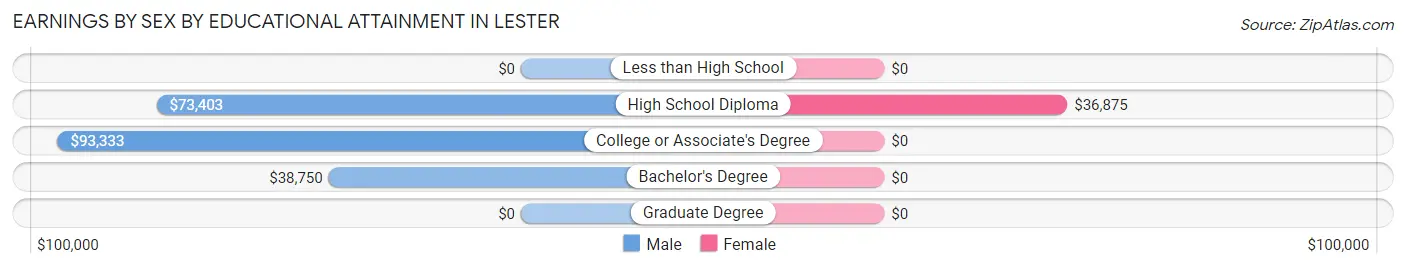
| Educational Attainment | Male Income | Female Income |
| Less than High School | - | - |
| High School Diploma | $73,403 | $36,875 |
| College or Associate's Degree | $93,333 | $0 |
| Bachelor's Degree | $38,750 | $0 |
| Graduate Degree | - | - |
| Total | $73,090 | $36,875 |
Family Income in Lester
Family Income Brackets in Lester
According to the Lester family income data, there are 29 families falling into the $25,000 to $34,999 income range, which is the most common income bracket and makes up 30.8% of all families.
| Income Bracket | # Families | % Families |
| Less than $10,000 | 25 | 26.6% |
| $10,000 to $14,999 | 3 | 3.2% |
| $15,000 to $24,999 | 4 | 4.3% |
| $25,000 to $34,999 | 29 | 30.9% |
| $35,000 to $49,999 | 11 | 11.7% |
| $50,000 to $74,999 | 0 | 0.0% |
| $75,000 to $99,999 | 12 | 12.8% |
| $100,000 to $149,999 | 10 | 10.6% |
| $150,000 to $199,999 | 0 | 0.0% |
| $200,000+ | 0 | 0.0% |
Family Income by Famaliy Size in Lester
5-person families (7 | 7.4%) account for the highest median family income in Lester with $90,625 per family, while 5-person families (7 | 7.4%) have the highest median income of $18,125 per family member.
| Income Bracket | # Families | Median Income |
| 2-Person Families | 37 (39.4%) | $34,583 |
| 3-Person Families | 7 (7.4%) | $0 |
| 4-Person Families | 9 (9.6%) | $0 |
| 5-Person Families | 7 (7.4%) | $90,625 |
| 6-Person Families | 9 (9.6%) | $0 |
| 7+ Person Families | 25 (26.6%) | $0 |
| Total | 94 (100.0%) | $32,667 |
Family Income by Number of Earners in Lester
| Number of Earners | # Families | Median Income |
| No Earners | 54 (57.5%) | $0 |
| 1 Earner | 26 (27.7%) | $0 |
| 2 Earners | 11 (11.7%) | $98,750 |
| 3+ Earners | 3 (3.2%) | $0 |
| Total | 94 (100.0%) | $32,667 |
Household Income in Lester
Household Income Brackets in Lester
With 48 households falling in the category, the less than $10,000 income range is the most frequent in Lester, accounting for 29.6% of all households.
| Income Bracket | # Households | % Households |
| Less than $10,000 | 48 | 29.6% |
| $10,000 to $14,999 | 19 | 11.7% |
| $15,000 to $24,999 | 8 | 4.9% |
| $25,000 to $34,999 | 45 | 27.8% |
| $35,000 to $49,999 | 18 | 11.1% |
| $50,000 to $74,999 | 0 | 0.0% |
| $75,000 to $99,999 | 12 | 7.4% |
| $100,000 to $149,999 | 12 | 7.4% |
| $150,000 to $199,999 | 0 | 0.0% |
| $200,000+ | 0 | 0.0% |
Household Income by Householder Age in Lester
The median household income in Lester is $28,125, with the highest median household income of $33,000 found in the 65+ years age bracket for the primary householder. A total of 62 households (38.3%) fall into this category. Meanwhile, the 15 to 24 years age bracket for the primary householder has the lowest median household income of $0, with 16 households (9.9%) in this group.
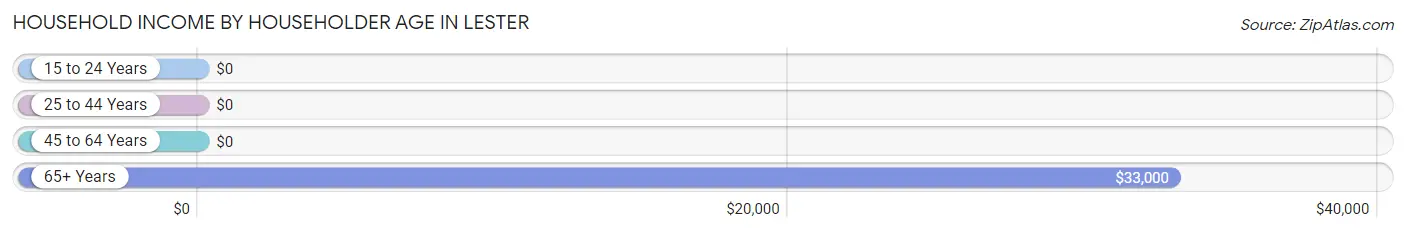
| Income Bracket | # Households | Median Income |
| 15 to 24 Years | 16 (9.9%) | $0 |
| 25 to 44 Years | 22 (13.6%) | $0 |
| 45 to 64 Years | 62 (38.3%) | $0 |
| 65+ Years | 62 (38.3%) | $33,000 |
| Total | 162 (100.0%) | $28,125 |
Poverty in Lester
Income Below Poverty by Sex and Age in Lester
With 38.9% poverty level for males and 52.0% for females among the residents of Lester, 5 year old males and 12 to 14 year old females are the most vulnerable to poverty, with 11 males (100.0%) and 12 females (100.0%) in their respective age groups living below the poverty level.
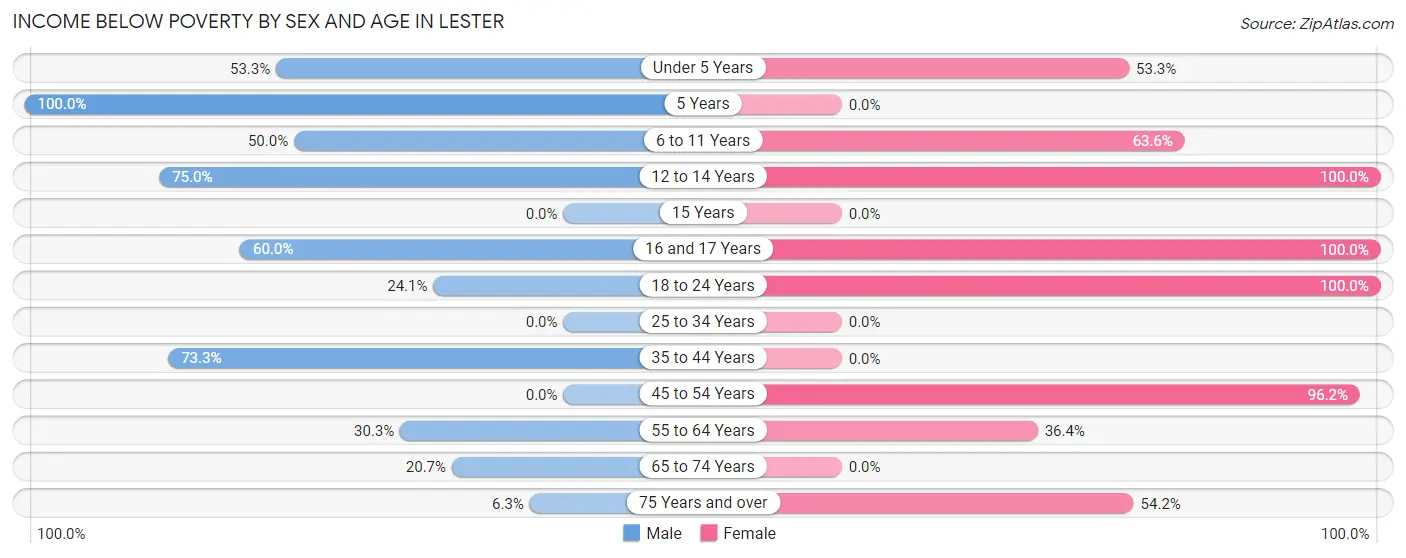
| Age Bracket | Male | Female |
| Under 5 Years | 8 (53.3%) | 8 (53.3%) |
| 5 Years | 11 (100.0%) | 0 (0.0%) |
| 6 to 11 Years | 10 (50.0%) | 21 (63.6%) |
| 12 to 14 Years | 15 (75.0%) | 12 (100.0%) |
| 15 Years | 0 (0.0%) | 0 (0.0%) |
| 16 and 17 Years | 6 (60.0%) | 6 (100.0%) |
| 18 to 24 Years | 7 (24.1%) | 9 (100.0%) |
| 25 to 34 Years | 0 (0.0%) | 0 (0.0%) |
| 35 to 44 Years | 11 (73.3%) | 0 (0.0%) |
| 45 to 54 Years | 0 (0.0%) | 25 (96.2%) |
| 55 to 64 Years | 20 (30.3%) | 8 (36.4%) |
| 65 to 74 Years | 6 (20.7%) | 0 (0.0%) |
| 75 Years and over | 1 (6.2%) | 13 (54.2%) |
| Total | 95 (38.9%) | 102 (52.0%) |
Income Above Poverty by Sex and Age in Lester
According to the poverty statistics in Lester, males aged 25 to 34 years and females aged 25 to 34 years are the age groups that are most secure financially, with 100.0% of males and 100.0% of females in these age groups living above the poverty line.
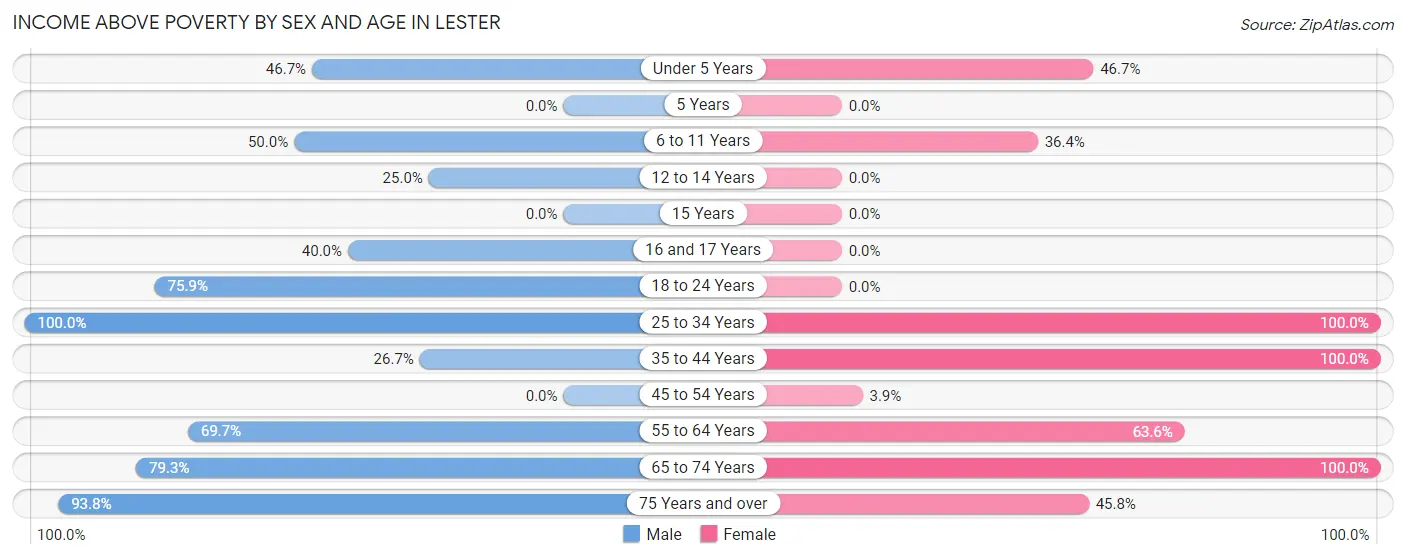
| Age Bracket | Male | Female |
| Under 5 Years | 7 (46.7%) | 7 (46.7%) |
| 5 Years | 0 (0.0%) | 0 (0.0%) |
| 6 to 11 Years | 10 (50.0%) | 12 (36.4%) |
| 12 to 14 Years | 5 (25.0%) | 0 (0.0%) |
| 15 Years | 0 (0.0%) | 0 (0.0%) |
| 16 and 17 Years | 4 (40.0%) | 0 (0.0%) |
| 18 to 24 Years | 22 (75.9%) | 0 (0.0%) |
| 25 to 34 Years | 13 (100.0%) | 7 (100.0%) |
| 35 to 44 Years | 4 (26.7%) | 4 (100.0%) |
| 45 to 54 Years | 0 (0.0%) | 1 (3.8%) |
| 55 to 64 Years | 46 (69.7%) | 14 (63.6%) |
| 65 to 74 Years | 23 (79.3%) | 38 (100.0%) |
| 75 Years and over | 15 (93.8%) | 11 (45.8%) |
| Total | 149 (61.1%) | 94 (48.0%) |
Income Below Poverty Among Married-Couple Families in Lester
The poverty statistics for married-couple families in Lester show that 18.8% or 12 of the total 64 families live below the poverty line. Families with 1 or 2 children have the highest poverty rate of 54.5%, comprising of 6 families. On the other hand, families with no children have the lowest poverty rate of 0.0%, which includes 0 families.
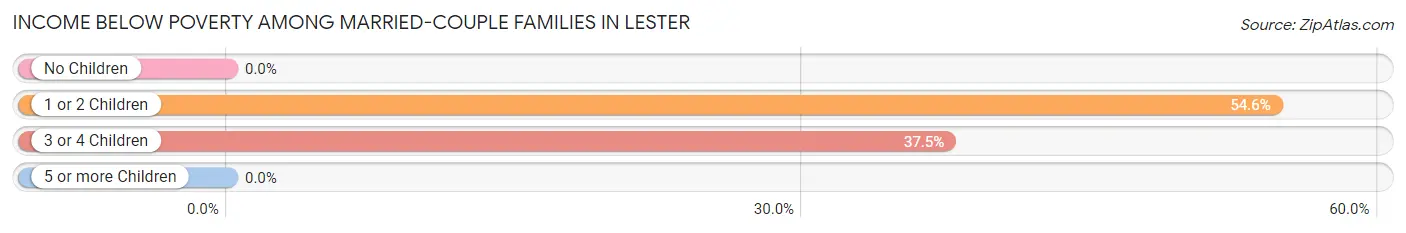
| Children | Above Poverty | Below Poverty |
| No Children | 37 (100.0%) | 0 (0.0%) |
| 1 or 2 Children | 5 (45.5%) | 6 (54.5%) |
| 3 or 4 Children | 10 (62.5%) | 6 (37.5%) |
| 5 or more Children | 0 (0.0%) | 0 (0.0%) |
| Total | 52 (81.2%) | 12 (18.8%) |
Income Below Poverty Among Single-Parent Households in Lester
According to the poverty data in Lester, 100.0% or 1 single-father households and 93.1% or 27 single-mother households are living below the poverty line. Among single-father households, those with no children have the highest poverty rate, with 1 households (100.0%) experiencing poverty. Likewise, among single-mother households, those with 5 or more children have the highest poverty rate, with 25 households (100.0%) falling below the poverty line.
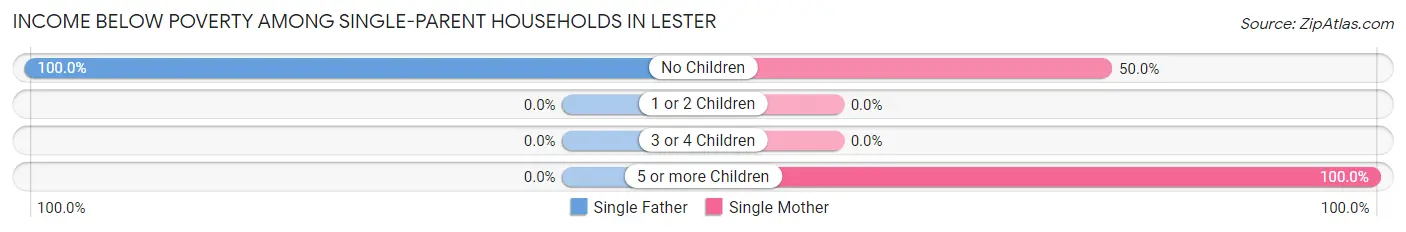
| Children | Single Father | Single Mother |
| No Children | 1 (100.0%) | 2 (50.0%) |
| 1 or 2 Children | 0 (0.0%) | 0 (0.0%) |
| 3 or 4 Children | 0 (0.0%) | 0 (0.0%) |
| 5 or more Children | 0 (0.0%) | 25 (100.0%) |
| Total | 1 (100.0%) | 27 (93.1%) |
Income Below Poverty Among Married-Couple vs Single-Parent Households in Lester
The poverty data for Lester shows that 12 of the married-couple family households (18.8%) and 28 of the single-parent households (93.3%) are living below the poverty level. Within the married-couple family households, those with 1 or 2 children have the highest poverty rate, with 6 households (54.5%) falling below the poverty line. Among the single-parent households, those with 5 or more children have the highest poverty rate, with 25 household (100.0%) living below poverty.
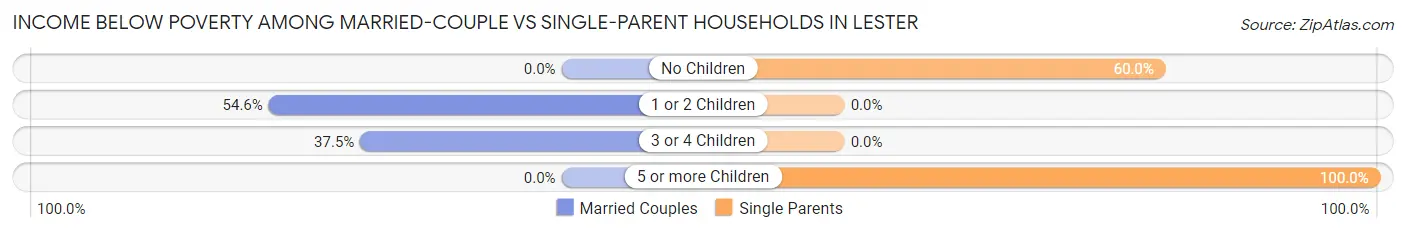
| Children | Married-Couple Families | Single-Parent Households |
| No Children | 0 (0.0%) | 3 (60.0%) |
| 1 or 2 Children | 6 (54.5%) | 0 (0.0%) |
| 3 or 4 Children | 6 (37.5%) | 0 (0.0%) |
| 5 or more Children | 0 (0.0%) | 25 (100.0%) |
| Total | 12 (18.8%) | 28 (93.3%) |
Race in Lester
The most populous races in Lester are White / Caucasian (365 | 83.0%), Two or more Races (51 | 11.6%), and Black / African American (24 | 5.4%).
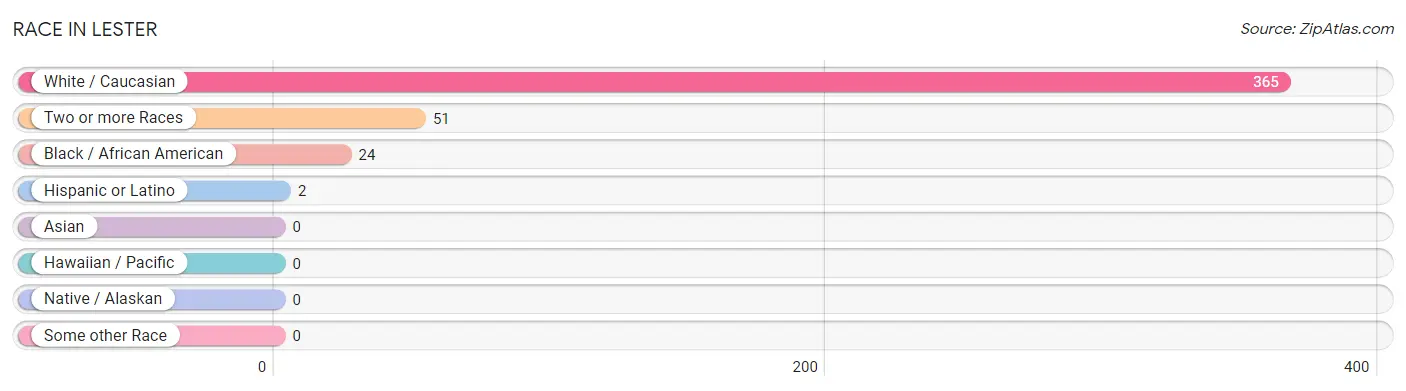
| Race | # Population | % Population |
| Asian | 0 | 0.0% |
| Black / African American | 24 | 5.4% |
| Hawaiian / Pacific | 0 | 0.0% |
| Hispanic or Latino | 2 | 0.4% |
| Native / Alaskan | 0 | 0.0% |
| White / Caucasian | 365 | 83.0% |
| Two or more Races | 51 | 11.6% |
| Some other Race | 0 | 0.0% |
| Total | 440 | 100.0% |
Ancestry in Lester
The most populous ancestries reported in Lester are English (190 | 43.2%), Irish (22 | 5.0%), German (12 | 2.7%), European (6 | 1.4%), and Scottish (6 | 1.4%), together accounting for 53.6% of all Lester residents.
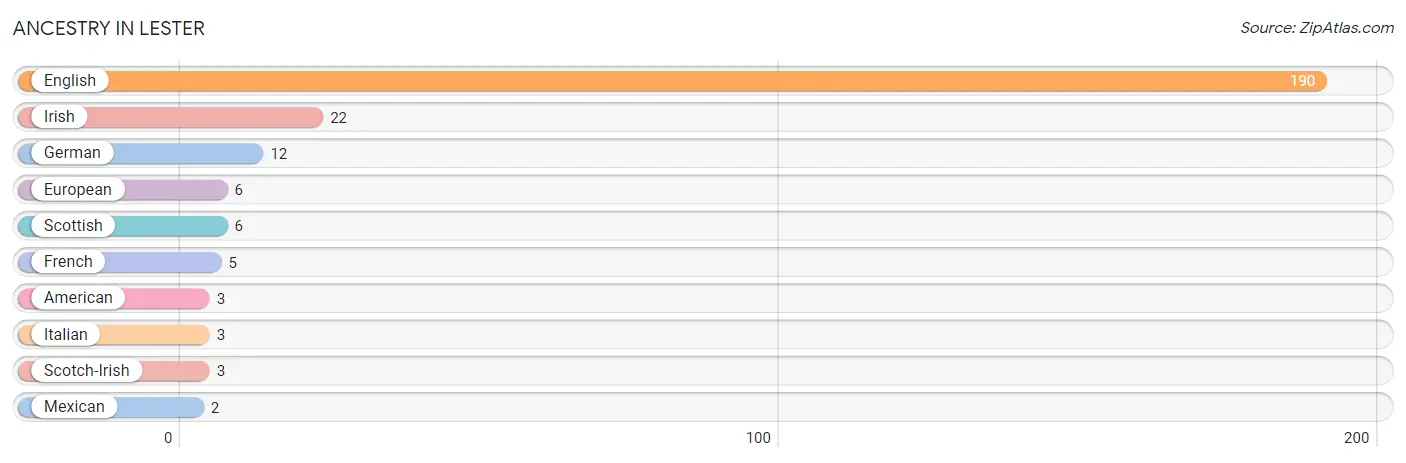
| Ancestry | # Population | % Population |
| American | 3 | 0.7% |
| English | 190 | 43.2% |
| European | 6 | 1.4% |
| French | 5 | 1.1% |
| German | 12 | 2.7% |
| Irish | 22 | 5.0% |
| Italian | 3 | 0.7% |
| Mexican | 2 | 0.4% |
| Scotch-Irish | 3 | 0.7% |
| Scottish | 6 | 1.4% | View All 10 Rows |
Immigrants in Lester

| Immigration Origin | # Population | % Population | View All 0 Rows |
Sex and Age in Lester
Sex and Age in Lester
The most populous age groups in Lester are 55 to 59 Years (38 | 15.6%) for men and 65 to 69 Years (32 | 16.3%) for women.
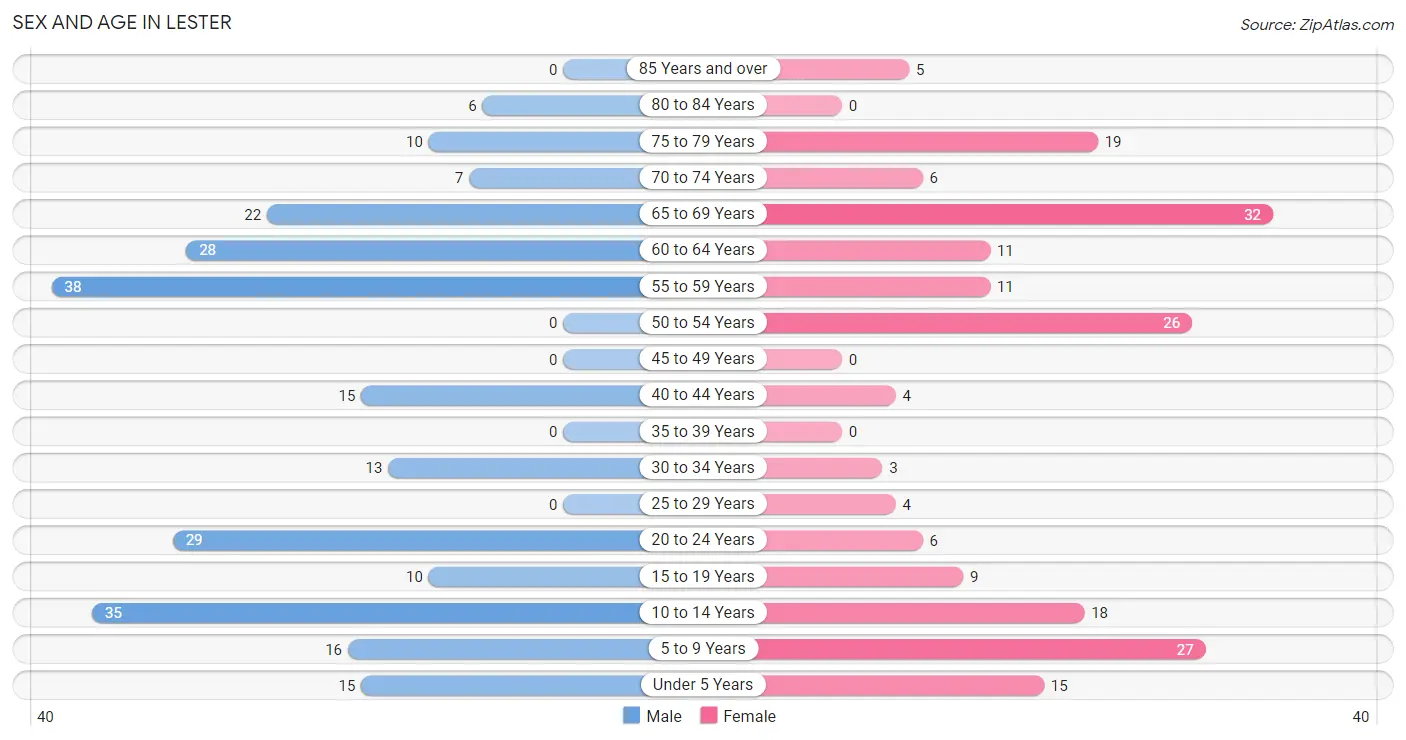
| Age Bracket | Male | Female |
| Under 5 Years | 15 (6.1%) | 15 (7.6%) |
| 5 to 9 Years | 16 (6.6%) | 27 (13.8%) |
| 10 to 14 Years | 35 (14.3%) | 18 (9.2%) |
| 15 to 19 Years | 10 (4.1%) | 9 (4.6%) |
| 20 to 24 Years | 29 (11.9%) | 6 (3.1%) |
| 25 to 29 Years | 0 (0.0%) | 4 (2.0%) |
| 30 to 34 Years | 13 (5.3%) | 3 (1.5%) |
| 35 to 39 Years | 0 (0.0%) | 0 (0.0%) |
| 40 to 44 Years | 15 (6.1%) | 4 (2.0%) |
| 45 to 49 Years | 0 (0.0%) | 0 (0.0%) |
| 50 to 54 Years | 0 (0.0%) | 26 (13.3%) |
| 55 to 59 Years | 38 (15.6%) | 11 (5.6%) |
| 60 to 64 Years | 28 (11.5%) | 11 (5.6%) |
| 65 to 69 Years | 22 (9.0%) | 32 (16.3%) |
| 70 to 74 Years | 7 (2.9%) | 6 (3.1%) |
| 75 to 79 Years | 10 (4.1%) | 19 (9.7%) |
| 80 to 84 Years | 6 (2.5%) | 0 (0.0%) |
| 85 Years and over | 0 (0.0%) | 5 (2.5%) |
| Total | 244 (100.0%) | 196 (100.0%) |
Families and Households in Lester
Median Family Size in Lester
The median family size in Lester is 3.96 persons per family, with married-couple families (64 | 68.1%) accounting for the largest median family size of 4.33 persons per family. On the other hand, single female/mother families (29 | 30.8%) represent the smallest median family size with 3.14 persons per family.
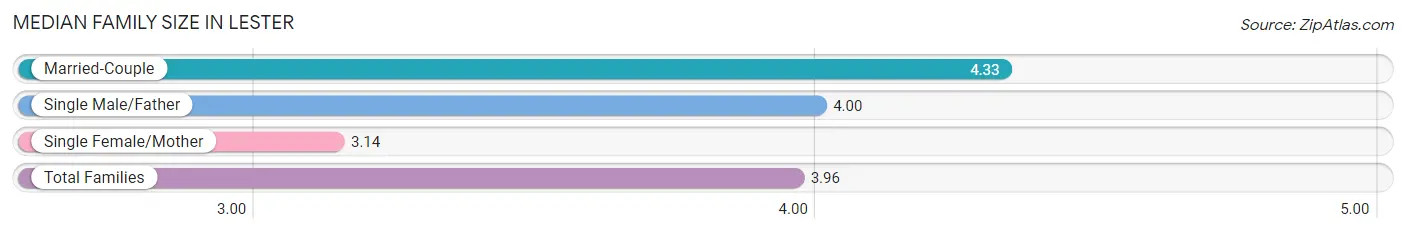
| Family Type | # Families | Family Size |
| Married-Couple | 64 (68.1%) | 4.33 |
| Single Male/Father | 1 (1.1%) | 4.00 |
| Single Female/Mother | 29 (30.8%) | 3.14 |
| Total Families | 94 (100.0%) | 3.96 |
Median Household Size in Lester
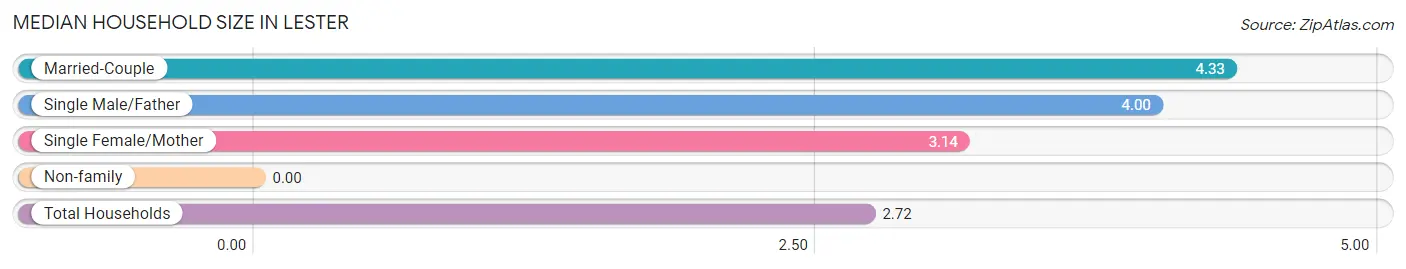
| Household Type | # Households | Household Size |
| Married-Couple | 64 (39.5%) | 4.33 |
| Single Male/Father | 1 (0.6%) | 4.00 |
| Single Female/Mother | 29 (17.9%) | 3.14 |
| Non-family | 68 (42.0%) | - |
| Total Households | 162 (100.0%) | 2.72 |
Household Size by Marriage Status in Lester
Out of a total of 162 households in Lester, 94 (58.0%) are family households, while 68 (42.0%) are nonfamily households. The most numerous type of family households are 2-person households, comprising 37, and the most common type of nonfamily households are 1-person households, comprising 68.
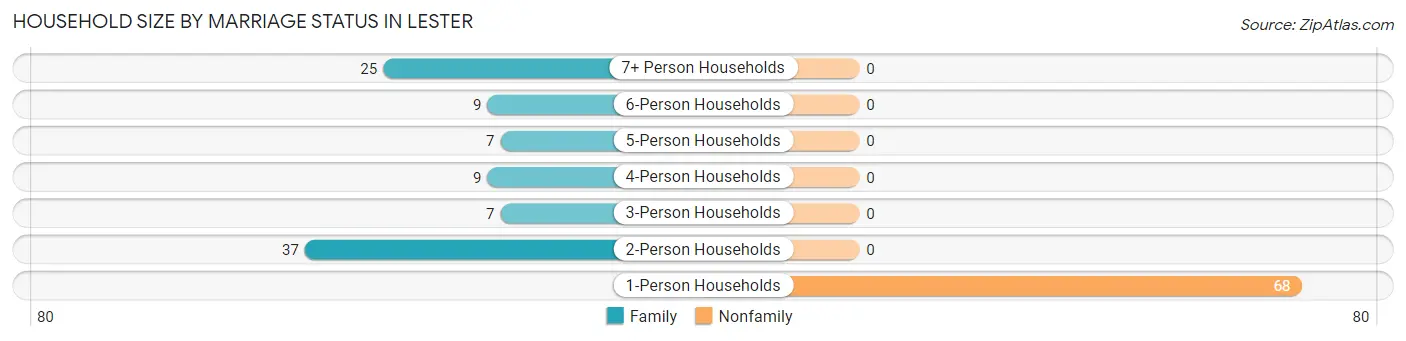
| Household Size | Family Households | Nonfamily Households |
| 1-Person Households | - | 68 (42.0%) |
| 2-Person Households | 37 (22.8%) | 0 (0.0%) |
| 3-Person Households | 7 (4.3%) | 0 (0.0%) |
| 4-Person Households | 9 (5.6%) | 0 (0.0%) |
| 5-Person Households | 7 (4.3%) | 0 (0.0%) |
| 6-Person Households | 9 (5.6%) | 0 (0.0%) |
| 7+ Person Households | 25 (15.4%) | 0 (0.0%) |
| Total | 94 (58.0%) | 68 (42.0%) |
Female Fertility in Lester
Fertility by Age in Lester
Average fertility rate in Lester is 118.0 births per 1,000 women. Women in the age bracket of 20 to 34 years have the highest fertility rate with 462.0 births per 1,000 women. Women in the age bracket of 20 to 34 years acount for 100.0% of all women with births.
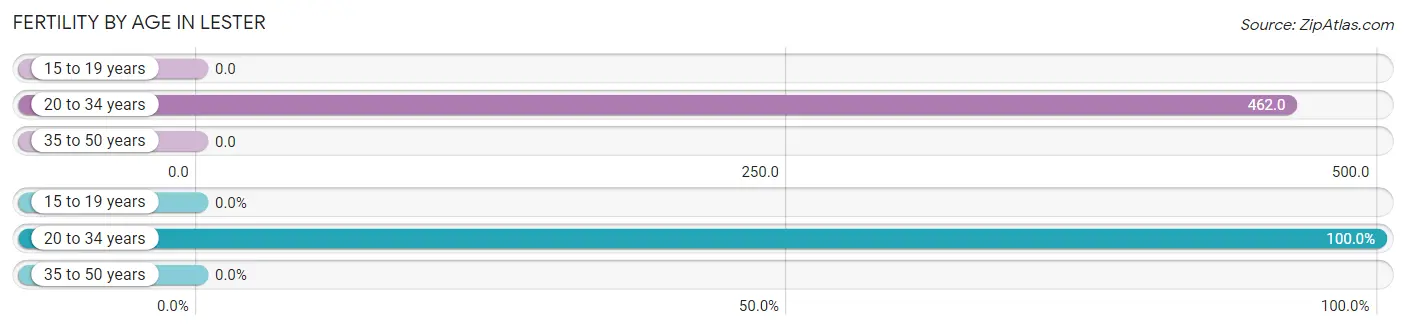
| Age Bracket | Women with Births | Births / 1,000 Women |
| 15 to 19 years | 0 (0.0%) | 0.0 |
| 20 to 34 years | 6 (100.0%) | 462.0 |
| 35 to 50 years | 0 (0.0%) | 0.0 |
| Total | 6 (100.0%) | 118.0 |
Fertility by Age by Marriage Status in Lester
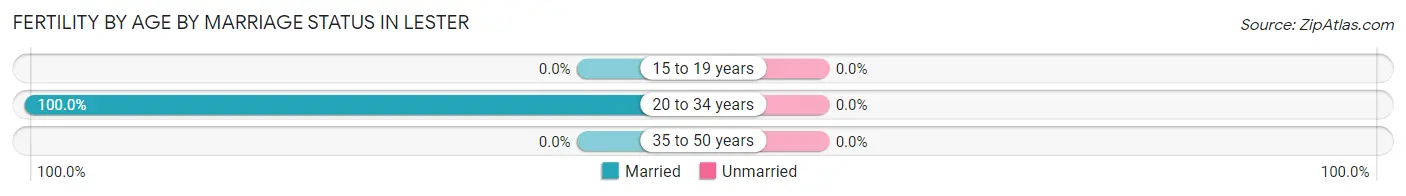
| Age Bracket | Married | Unmarried |
| 15 to 19 years | 0 (0.0%) | 0 (0.0%) |
| 20 to 34 years | 6 (100.0%) | 0 (0.0%) |
| 35 to 50 years | 0 (0.0%) | 0 (0.0%) |
| Total | 6 (100.0%) | 0 (0.0%) |
Fertility by Education in Lester
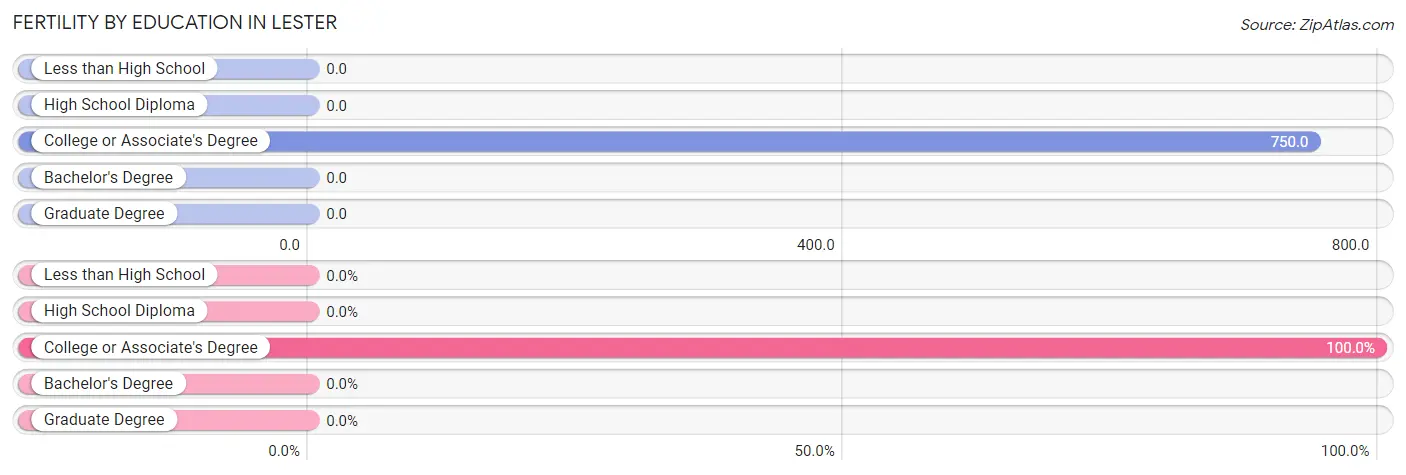
| Educational Attainment | Women with Births | Births / 1,000 Women |
| Less than High School | 0 (0.0%) | 0.0 |
| High School Diploma | 0 (0.0%) | 0.0 |
| College or Associate's Degree | 6 (100.0%) | 750.0 |
| Bachelor's Degree | 0 (0.0%) | 0.0 |
| Graduate Degree | 0 (0.0%) | 0.0 |
| Total | 6 (100.0%) | 118.0 |
Fertility by Education by Marriage Status in Lester
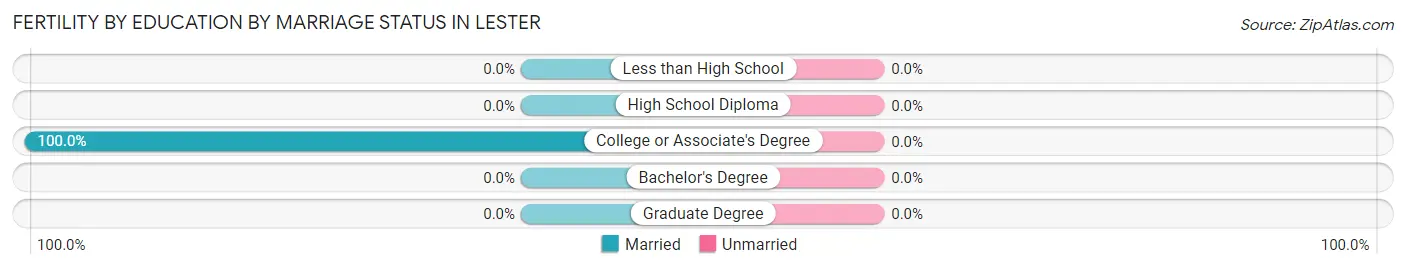
| Educational Attainment | Married | Unmarried |
| Less than High School | 0 (0.0%) | 0 (0.0%) |
| High School Diploma | 0 (0.0%) | 0 (0.0%) |
| College or Associate's Degree | 6 (100.0%) | 0 (0.0%) |
| Bachelor's Degree | 0 (0.0%) | 0 (0.0%) |
| Graduate Degree | 0 (0.0%) | 0 (0.0%) |
| Total | 6 (100.0%) | 0 (0.0%) |
Employment Characteristics in Lester
Employment by Class of Employer in Lester
Among the 105 employed individuals in Lester, private company employees (74 | 70.5%), local government employees (17 | 16.2%), and federal government employees (8 | 7.6%) make up the most common classes of employment.
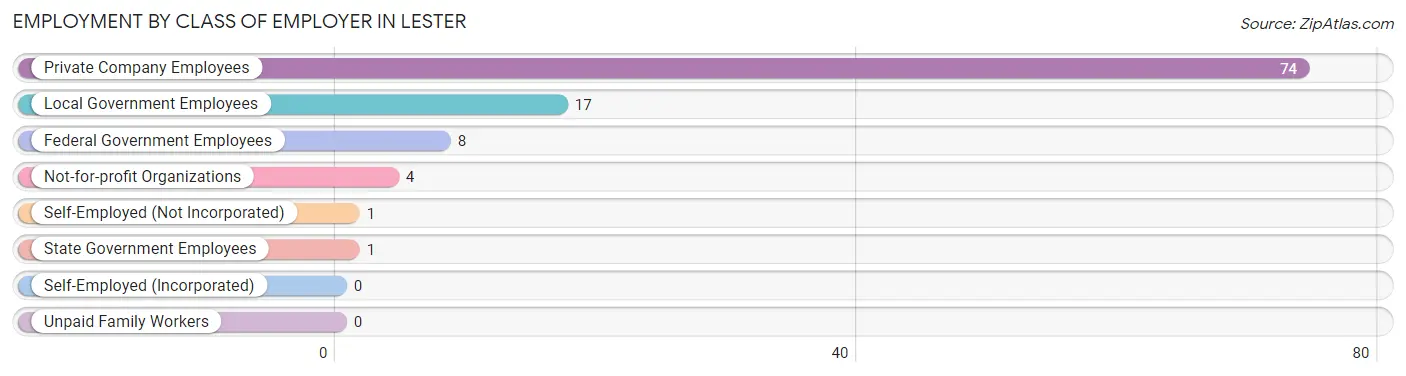
| Employer Class | # Employees | % Employees |
| Private Company Employees | 74 | 70.5% |
| Self-Employed (Incorporated) | 0 | 0.0% |
| Self-Employed (Not Incorporated) | 1 | 0.9% |
| Not-for-profit Organizations | 4 | 3.8% |
| Local Government Employees | 17 | 16.2% |
| State Government Employees | 1 | 0.9% |
| Federal Government Employees | 8 | 7.6% |
| Unpaid Family Workers | 0 | 0.0% |
| Total | 105 | 100.0% |
Employment Status by Age in Lester
According to the labor force statistics for Lester, out of the total population over 16 years of age (314), 36.6% or 115 individuals are in the labor force, with 8.7% or 10 of them unemployed. The age group with the highest labor force participation rate is 25 to 29 years, with 100.0% or 4 individuals in the labor force. Within the labor force, the 35 to 44 years age range has the highest percentage of unemployed individuals, with 44.4% or 4 of them being unemployed.
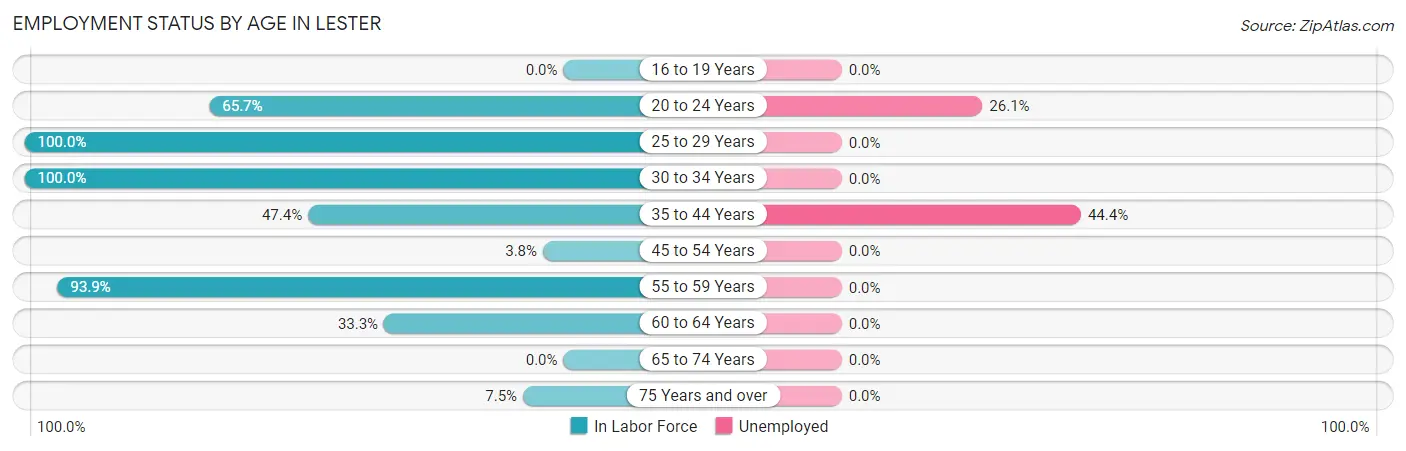
| Age Bracket | In Labor Force | Unemployed |
| 16 to 19 Years | 0 (0.0%) | 0 (0.0%) |
| 20 to 24 Years | 23 (65.7%) | 6 (26.1%) |
| 25 to 29 Years | 4 (100.0%) | 0 (0.0%) |
| 30 to 34 Years | 16 (100.0%) | 0 (0.0%) |
| 35 to 44 Years | 9 (47.4%) | 4 (44.4%) |
| 45 to 54 Years | 1 (3.8%) | 0 (0.0%) |
| 55 to 59 Years | 46 (93.9%) | 0 (0.0%) |
| 60 to 64 Years | 13 (33.3%) | 0 (0.0%) |
| 65 to 74 Years | 0 (0.0%) | 0 (0.0%) |
| 75 Years and over | 3 (7.5%) | 0 (0.0%) |
| Total | 115 (36.6%) | 10 (8.7%) |
Employment Status by Educational Attainment in Lester
According to labor force statistics for Lester, 58.2% of individuals (89) out of the total population between 25 and 64 years of age (153) are in the labor force, with 4.5% or 4 of them being unemployed. The group with the highest labor force participation rate are those with the educational attainment of bachelor's degree or higher, with 78.6% or 11 individuals in the labor force. Within the labor force, individuals with college / associate degree education have the highest percentage of unemployment, with 19.0% or 4 of them being unemployed.
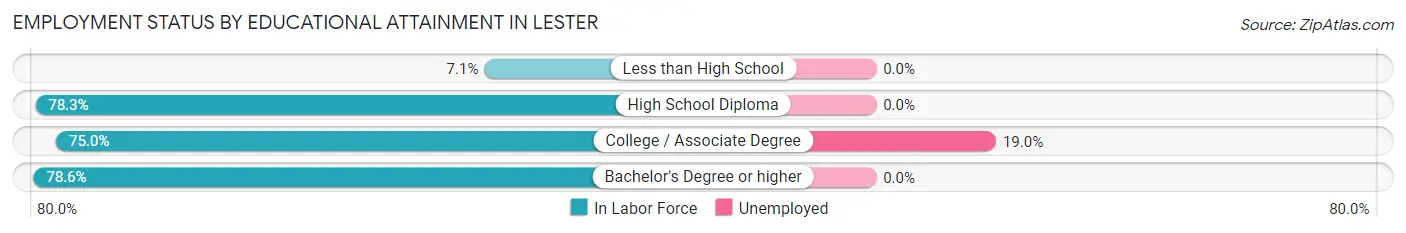
| Educational Attainment | In Labor Force | Unemployed |
| Less than High School | 3 (7.1%) | 0 (0.0%) |
| High School Diploma | 54 (78.3%) | 0 (0.0%) |
| College / Associate Degree | 21 (75.0%) | 5 (19.0%) |
| Bachelor's Degree or higher | 11 (78.6%) | 0 (0.0%) |
| Total | 89 (58.2%) | 7 (4.5%) |
Employment Occupations by Sex in Lester
Management, Business, Science and Arts Occupations
The most common Management, Business, Science and Arts occupations in Lester are Community & Social Service (9 | 8.6%), Education Instruction & Library (9 | 8.6%), Business & Financial (5 | 4.8%), Computers, Engineering & Science (4 | 3.8%), and Computers & Mathematics (4 | 3.8%).
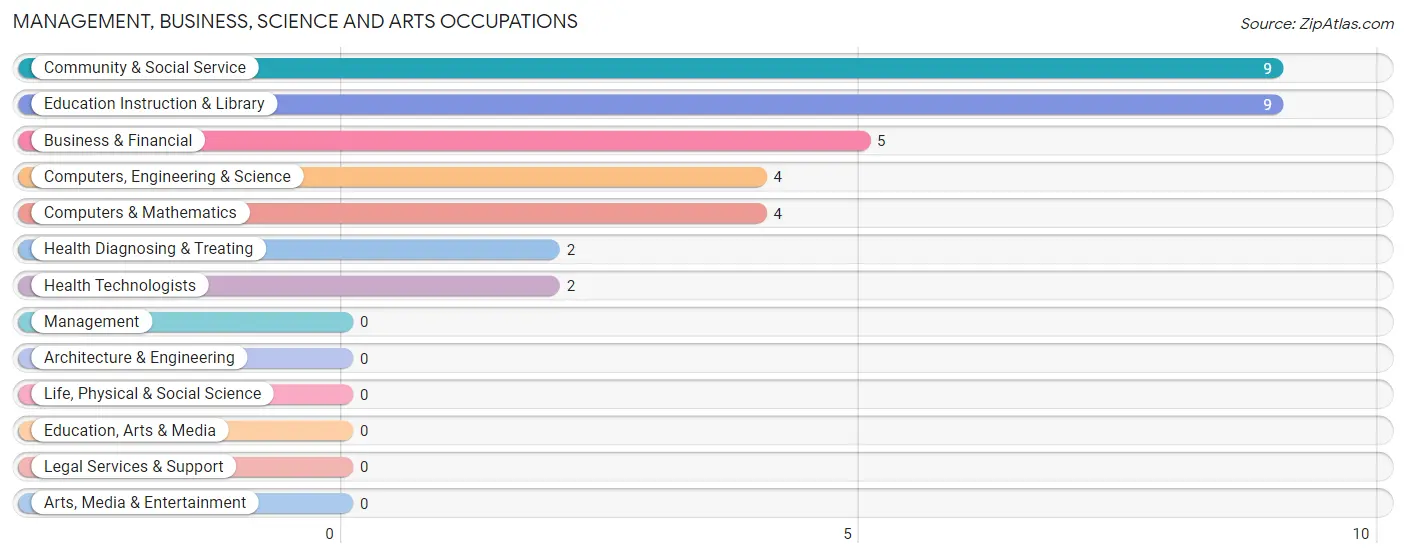
Management, Business, Science and Arts Occupations by Sex
Within the Management, Business, Science and Arts occupations in Lester, the most male-oriented occupations are Business & Financial (60.0%), Community & Social Service (33.3%), and Education Instruction & Library (33.3%), while the most female-oriented occupations are Computers, Engineering & Science (100.0%), Computers & Mathematics (100.0%), and Health Diagnosing & Treating (100.0%).
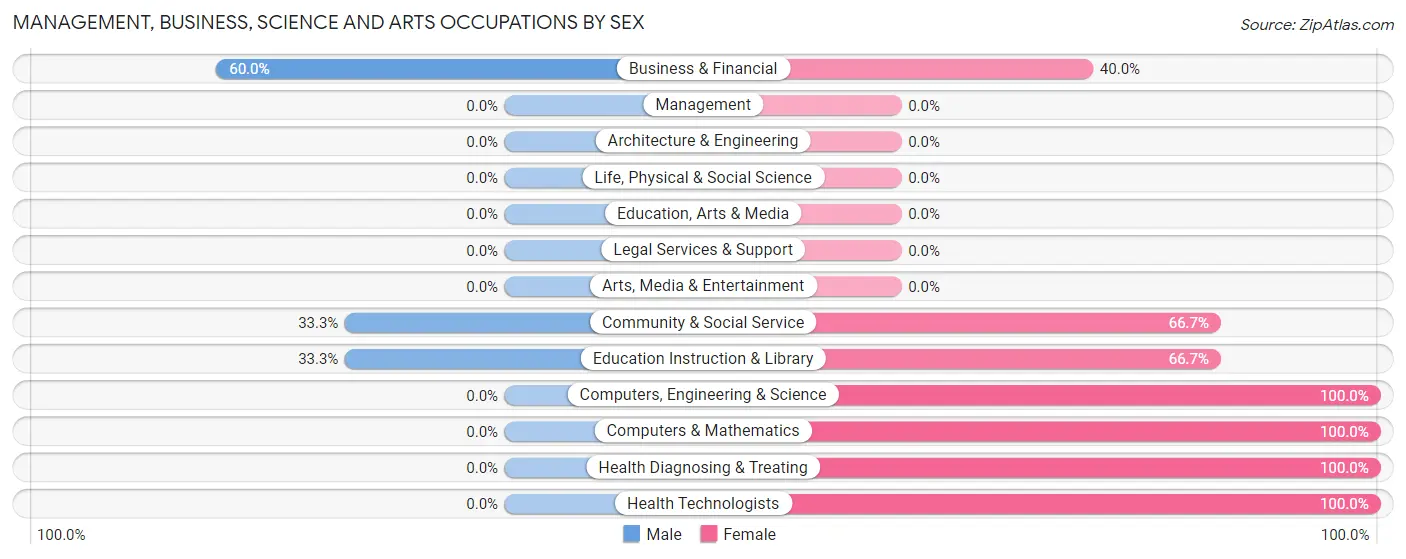
| Occupation | Male | Female |
| Management | 0 (0.0%) | 0 (0.0%) |
| Business & Financial | 3 (60.0%) | 2 (40.0%) |
| Computers, Engineering & Science | 0 (0.0%) | 4 (100.0%) |
| Computers & Mathematics | 0 (0.0%) | 4 (100.0%) |
| Architecture & Engineering | 0 (0.0%) | 0 (0.0%) |
| Life, Physical & Social Science | 0 (0.0%) | 0 (0.0%) |
| Community & Social Service | 3 (33.3%) | 6 (66.7%) |
| Education, Arts & Media | 0 (0.0%) | 0 (0.0%) |
| Legal Services & Support | 0 (0.0%) | 0 (0.0%) |
| Education Instruction & Library | 3 (33.3%) | 6 (66.7%) |
| Arts, Media & Entertainment | 0 (0.0%) | 0 (0.0%) |
| Health Diagnosing & Treating | 0 (0.0%) | 2 (100.0%) |
| Health Technologists | 0 (0.0%) | 2 (100.0%) |
| Total (Category) | 6 (30.0%) | 14 (70.0%) |
| Total (Overall) | 80 (76.2%) | 25 (23.8%) |
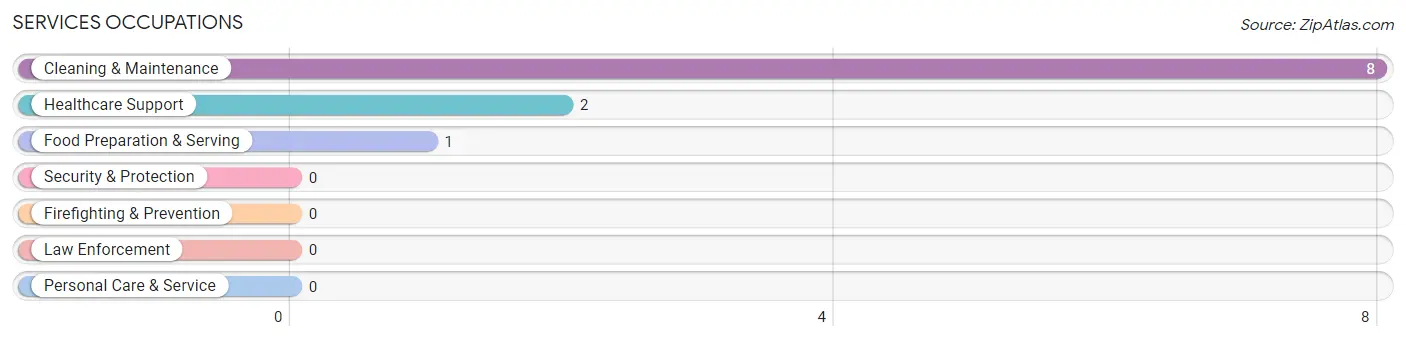
Services Occupations
The most common Services occupations in Lester are Cleaning & Maintenance (8 | 7.6%), Healthcare Support (2 | 1.9%), and Food Preparation & Serving (1 | 0.9%).
Services Occupations by Sex
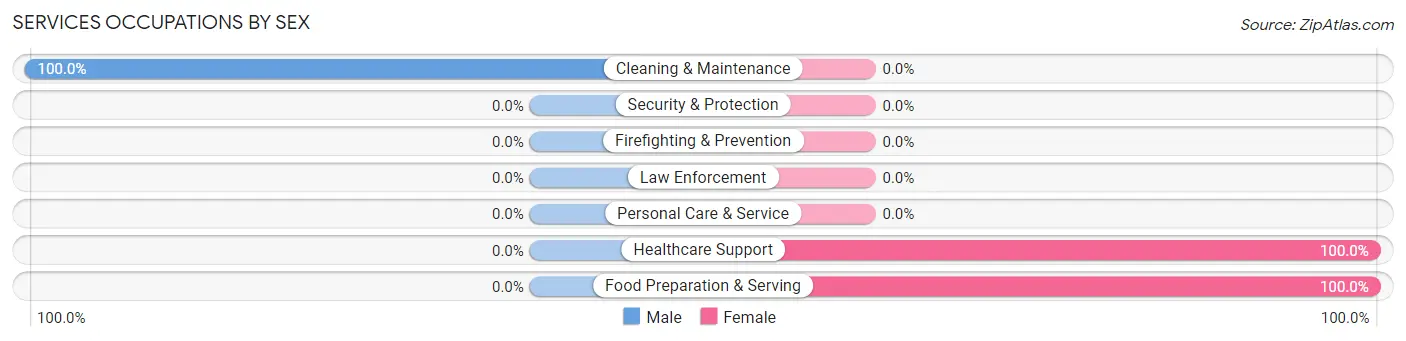
| Occupation | Male | Female |
| Healthcare Support | 0 (0.0%) | 2 (100.0%) |
| Security & Protection | 0 (0.0%) | 0 (0.0%) |
| Firefighting & Prevention | 0 (0.0%) | 0 (0.0%) |
| Law Enforcement | 0 (0.0%) | 0 (0.0%) |
| Food Preparation & Serving | 0 (0.0%) | 1 (100.0%) |
| Cleaning & Maintenance | 8 (100.0%) | 0 (0.0%) |
| Personal Care & Service | 0 (0.0%) | 0 (0.0%) |
| Total (Category) | 8 (72.7%) | 3 (27.3%) |
| Total (Overall) | 80 (76.2%) | 25 (23.8%) |
Sales and Office Occupations
The most common Sales and Office occupations in Lester are , and Office & Administration (11 | 10.5%).
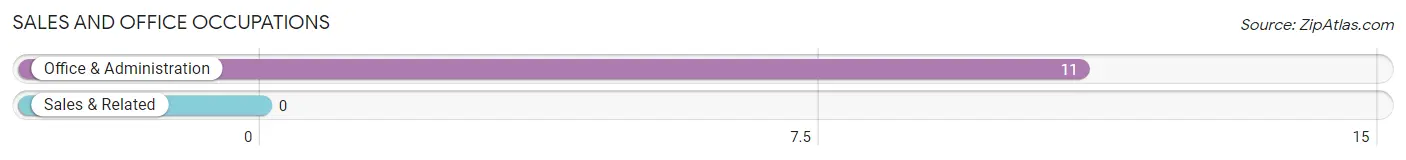
Sales and Office Occupations by Sex
| Occupation | Male | Female |
| Sales & Related | 0 (0.0%) | 0 (0.0%) |
| Office & Administration | 3 (27.3%) | 8 (72.7%) |
| Total (Category) | 3 (27.3%) | 8 (72.7%) |
| Total (Overall) | 80 (76.2%) | 25 (23.8%) |
Natural Resources, Construction and Maintenance Occupations
The most common Natural Resources, Construction and Maintenance occupations in Lester are , and Construction & Extraction (41 | 39.1%).
Natural Resources, Construction and Maintenance Occupations by Sex
| Occupation | Male | Female |
| Farming, Fishing & Forestry | 0 (0.0%) | 0 (0.0%) |
| Construction & Extraction | 41 (100.0%) | 0 (0.0%) |
| Installation, Maintenance & Repair | 0 (0.0%) | 0 (0.0%) |
| Total (Category) | 41 (100.0%) | 0 (0.0%) |
| Total (Overall) | 80 (76.2%) | 25 (23.8%) |
Production, Transportation and Moving Occupations
The most common Production, Transportation and Moving occupations in Lester are Transportation (17 | 16.2%), and Material Moving (5 | 4.8%).
Production, Transportation and Moving Occupations by Sex
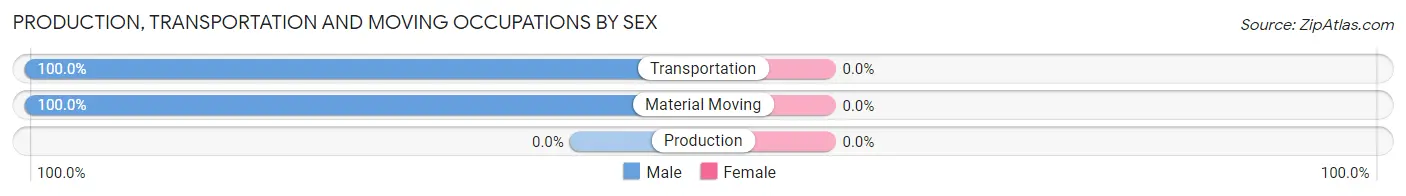
| Occupation | Male | Female |
| Production | 0 (0.0%) | 0 (0.0%) |
| Transportation | 17 (100.0%) | 0 (0.0%) |
| Material Moving | 5 (100.0%) | 0 (0.0%) |
| Total (Category) | 22 (100.0%) | 0 (0.0%) |
| Total (Overall) | 80 (76.2%) | 25 (23.8%) |
Employment Industries by Sex in Lester
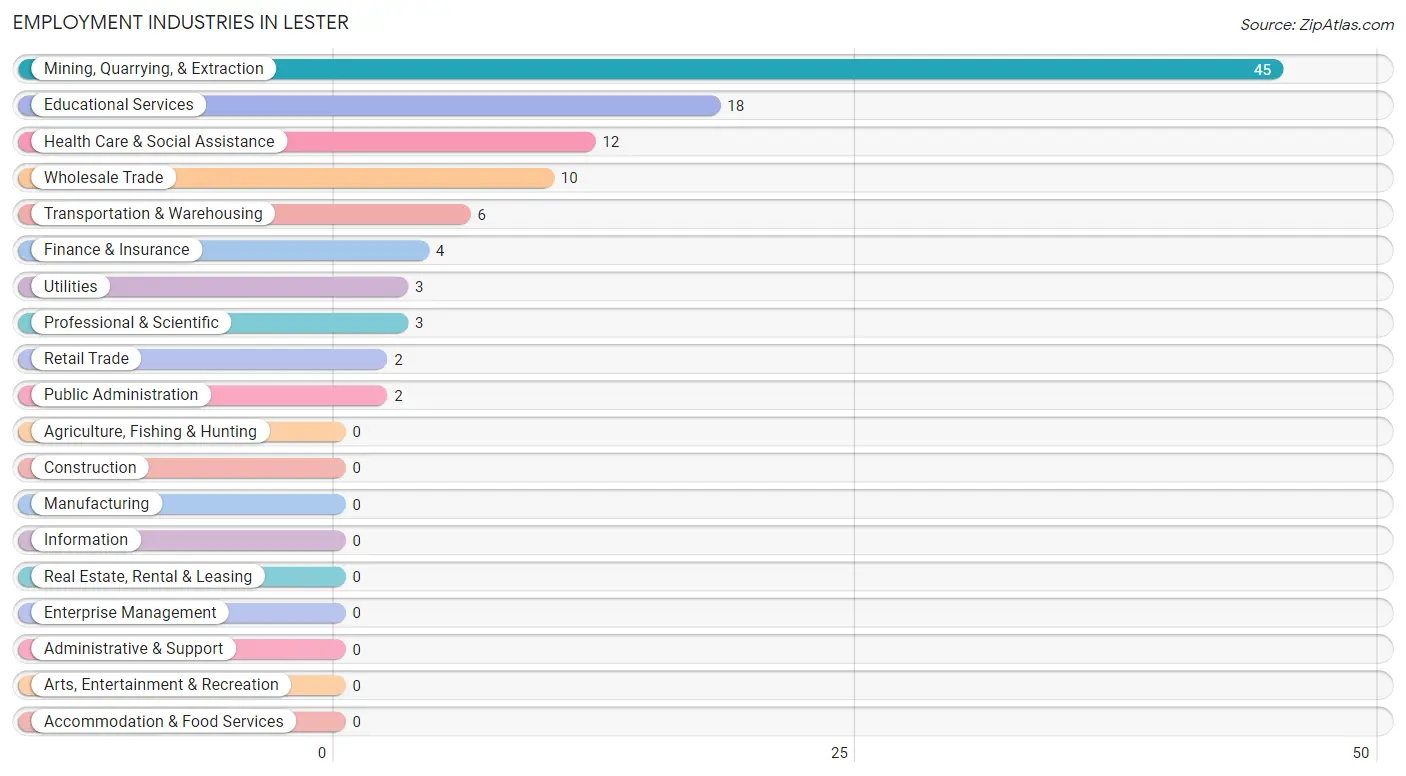
Employment Industries in Lester
The major employment industries in Lester include Mining, Quarrying, & Extraction (45 | 42.9%), Educational Services (18 | 17.1%), Health Care & Social Assistance (12 | 11.4%), Wholesale Trade (10 | 9.5%), and Transportation & Warehousing (6 | 5.7%).
Employment Industries by Sex in Lester
The Lester industries that see more men than women are Mining, Quarrying, & Extraction (100.0%), Wholesale Trade (100.0%), and Retail Trade (100.0%), whereas the industries that tend to have a higher number of women are Health Care & Social Assistance (100.0%), Public Administration (100.0%), and Finance & Insurance (50.0%).
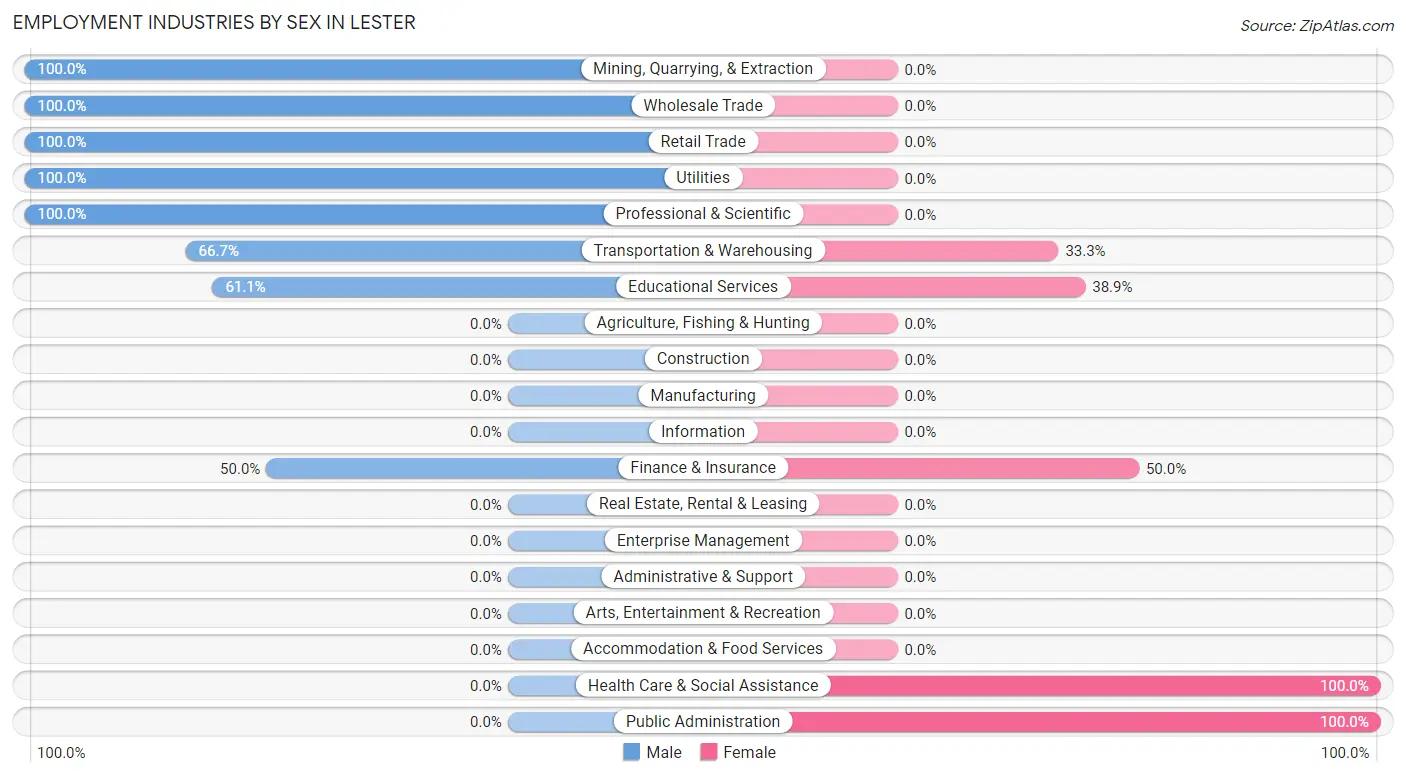
| Industry | Male | Female |
| Agriculture, Fishing & Hunting | 0 (0.0%) | 0 (0.0%) |
| Mining, Quarrying, & Extraction | 45 (100.0%) | 0 (0.0%) |
| Construction | 0 (0.0%) | 0 (0.0%) |
| Manufacturing | 0 (0.0%) | 0 (0.0%) |
| Wholesale Trade | 10 (100.0%) | 0 (0.0%) |
| Retail Trade | 2 (100.0%) | 0 (0.0%) |
| Transportation & Warehousing | 4 (66.7%) | 2 (33.3%) |
| Utilities | 3 (100.0%) | 0 (0.0%) |
| Information | 0 (0.0%) | 0 (0.0%) |
| Finance & Insurance | 2 (50.0%) | 2 (50.0%) |
| Real Estate, Rental & Leasing | 0 (0.0%) | 0 (0.0%) |
| Professional & Scientific | 3 (100.0%) | 0 (0.0%) |
| Enterprise Management | 0 (0.0%) | 0 (0.0%) |
| Administrative & Support | 0 (0.0%) | 0 (0.0%) |
| Educational Services | 11 (61.1%) | 7 (38.9%) |
| Health Care & Social Assistance | 0 (0.0%) | 12 (100.0%) |
| Arts, Entertainment & Recreation | 0 (0.0%) | 0 (0.0%) |
| Accommodation & Food Services | 0 (0.0%) | 0 (0.0%) |
| Public Administration | 0 (0.0%) | 2 (100.0%) |
| Total | 80 (76.2%) | 25 (23.8%) |
Education in Lester
School Enrollment in Lester
The most common levels of schooling among the 125 students in Lester are middle school (38 | 30.4%), high school (28 | 22.4%), and kindergarten (25 | 20.0%).
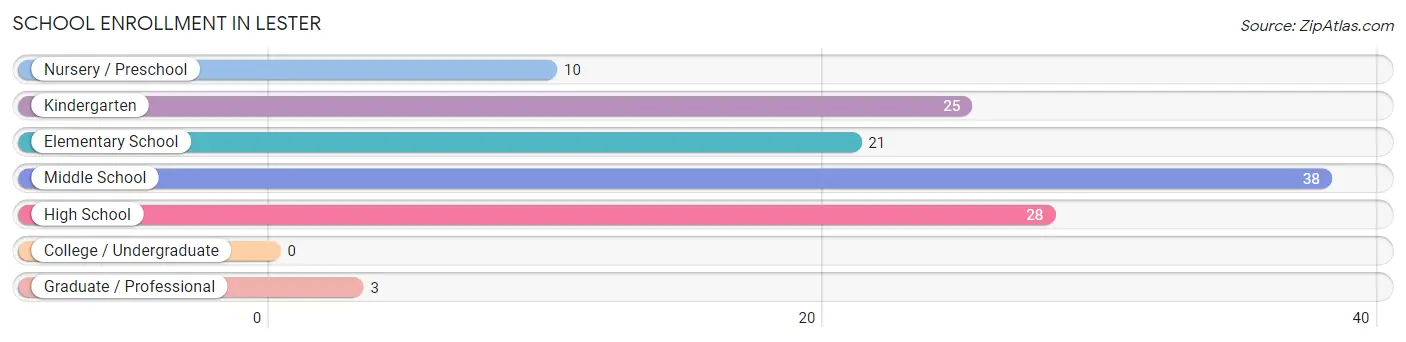
| School Level | # Students | % Students |
| Nursery / Preschool | 10 | 8.0% |
| Kindergarten | 25 | 20.0% |
| Elementary School | 21 | 16.8% |
| Middle School | 38 | 30.4% |
| High School | 28 | 22.4% |
| College / Undergraduate | 0 | 0.0% |
| Graduate / Professional | 3 | 2.4% |
| Total | 125 | 100.0% |
School Enrollment by Age by Funding Source in Lester
Out of a total of 125 students who are enrolled in schools in Lester, 4 (3.2%) attend a private institution, while the remaining 121 (96.8%) are enrolled in public schools. The age group of 25 to 34 year olds has the highest likelihood of being enrolled in private schools, with 3 (100.0% in the age bracket) enrolled. Conversely, the age group of 3 to 4 year olds has the lowest likelihood of being enrolled in a private school, with 10 (100.0% in the age bracket) attending a public institution.
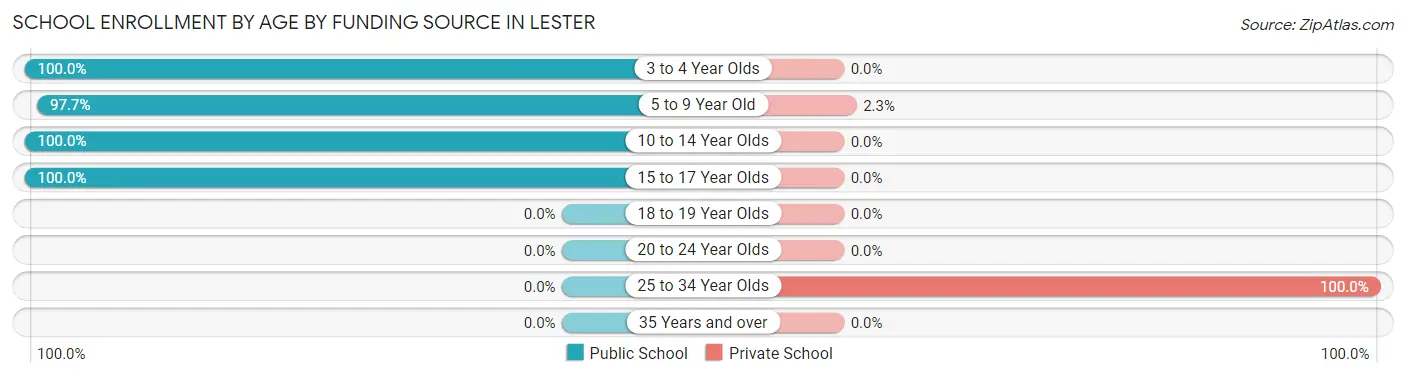
| Age Bracket | Public School | Private School |
| 3 to 4 Year Olds | 10 (100.0%) | 0 (0.0%) |
| 5 to 9 Year Old | 42 (97.7%) | 1 (2.3%) |
| 10 to 14 Year Olds | 53 (100.0%) | 0 (0.0%) |
| 15 to 17 Year Olds | 16 (100.0%) | 0 (0.0%) |
| 18 to 19 Year Olds | 0 (0.0%) | 0 (0.0%) |
| 20 to 24 Year Olds | 0 (0.0%) | 0 (0.0%) |
| 25 to 34 Year Olds | 0 (0.0%) | 3 (100.0%) |
| 35 Years and over | 0 (0.0%) | 0 (0.0%) |
| Total | 121 (96.8%) | 4 (3.2%) |
Educational Attainment by Field of Study in Lester
Arts & humanities (13 | 43.3%), business (6 | 20.0%), education (6 | 20.0%), physical & health sciences (3 | 10.0%), and psychology (2 | 6.7%) are the most common fields of study among 30 individuals in Lester who have obtained a bachelor's degree or higher.
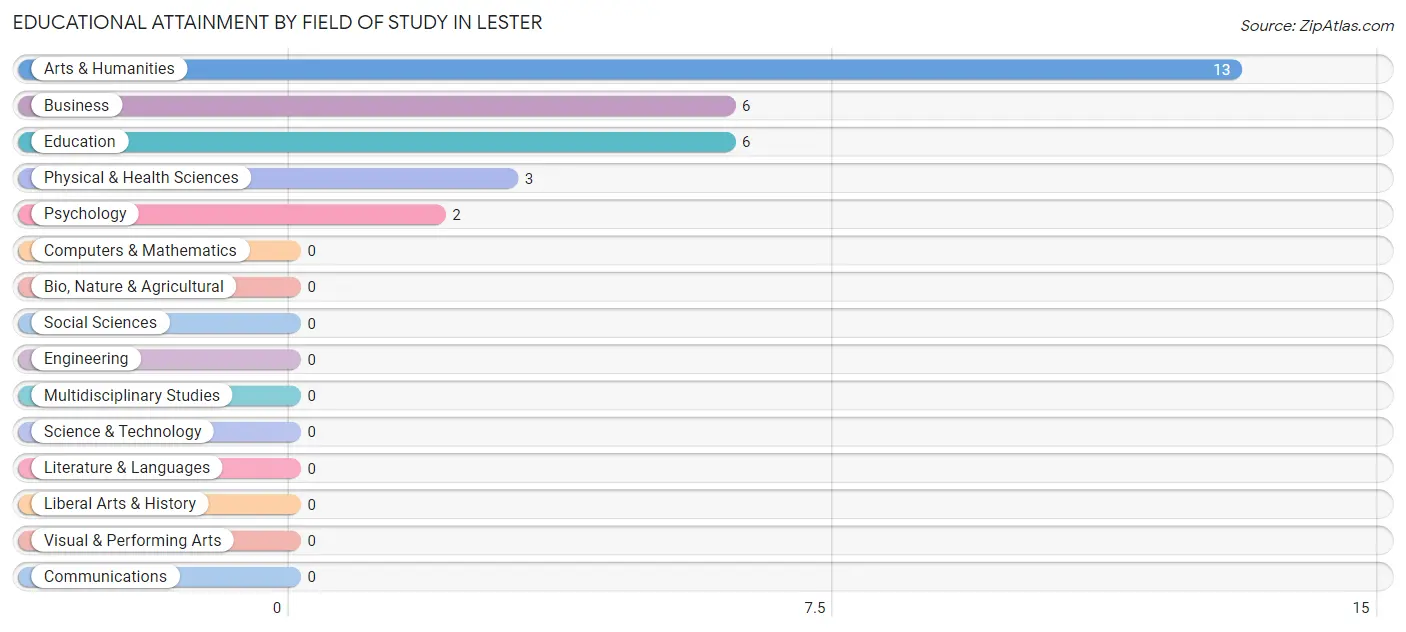
| Field of Study | # Graduates | % Graduates |
| Computers & Mathematics | 0 | 0.0% |
| Bio, Nature & Agricultural | 0 | 0.0% |
| Physical & Health Sciences | 3 | 10.0% |
| Psychology | 2 | 6.7% |
| Social Sciences | 0 | 0.0% |
| Engineering | 0 | 0.0% |
| Multidisciplinary Studies | 0 | 0.0% |
| Science & Technology | 0 | 0.0% |
| Business | 6 | 20.0% |
| Education | 6 | 20.0% |
| Literature & Languages | 0 | 0.0% |
| Liberal Arts & History | 0 | 0.0% |
| Visual & Performing Arts | 0 | 0.0% |
| Communications | 0 | 0.0% |
| Arts & Humanities | 13 | 43.3% |
| Total | 30 | 100.0% |
Transportation & Commute in Lester
Vehicle Availability by Sex in Lester
The most prevalent vehicle ownership categories in Lester are males with 2 vehicles (60, accounting for 75.0%) and females with 2 vehicles (8, making up 240.0%).
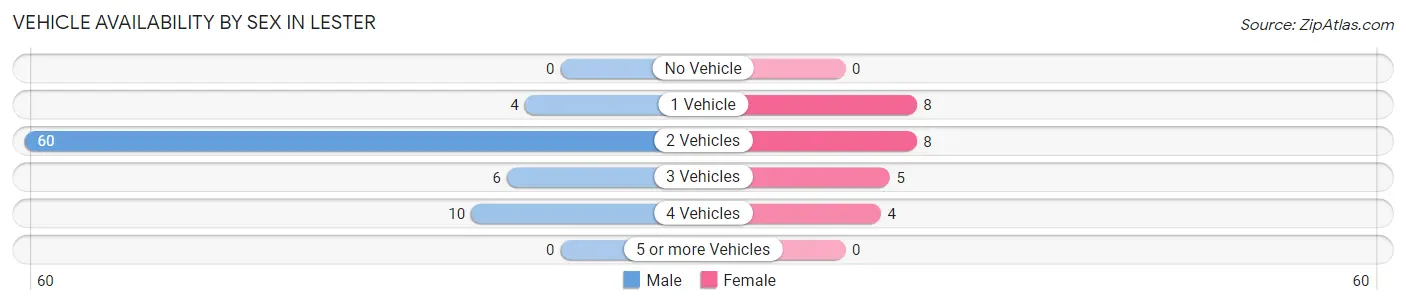
| Vehicles Available | Male | Female |
| No Vehicle | 0 (0.0%) | 0 (0.0%) |
| 1 Vehicle | 4 (5.0%) | 8 (32.0%) |
| 2 Vehicles | 60 (75.0%) | 8 (32.0%) |
| 3 Vehicles | 6 (7.5%) | 5 (20.0%) |
| 4 Vehicles | 10 (12.5%) | 4 (16.0%) |
| 5 or more Vehicles | 0 (0.0%) | 0 (0.0%) |
| Total | 80 (100.0%) | 25 (100.0%) |
Commute Time in Lester
The most frequently occuring commute durations in Lester are 90 or more minutes (36 commuters, 34.9%), 15 to 19 minutes (27 commuters, 26.2%), and 20 to 24 minutes (21 commuters, 20.4%).
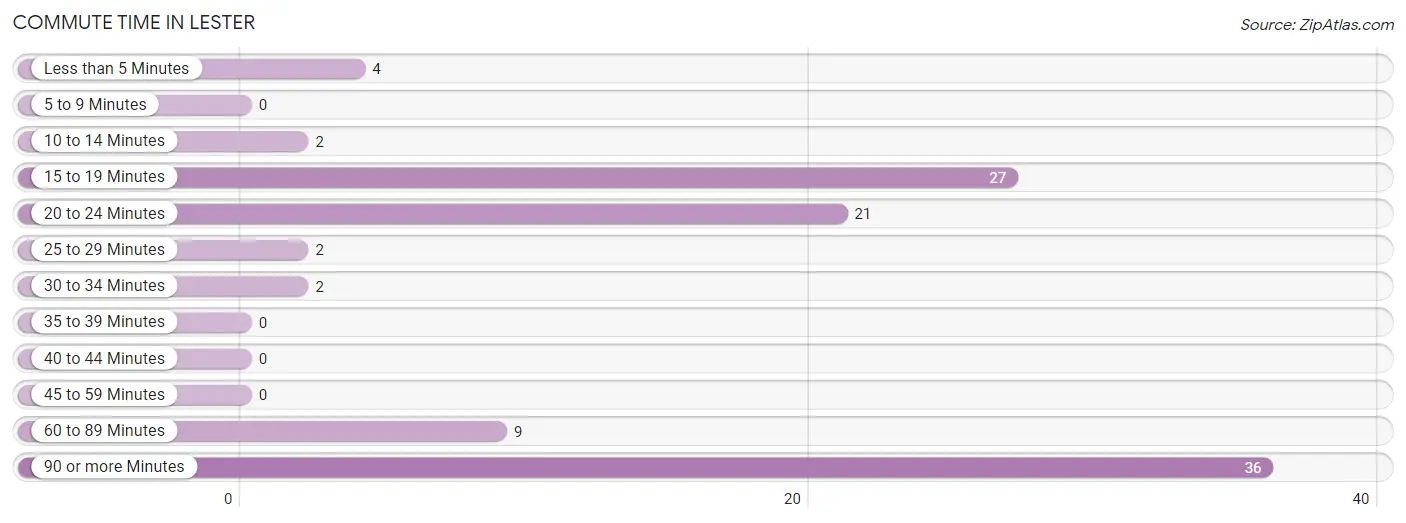
| Commute Time | # Commuters | % Commuters |
| Less than 5 Minutes | 4 | 3.9% |
| 5 to 9 Minutes | 0 | 0.0% |
| 10 to 14 Minutes | 2 | 1.9% |
| 15 to 19 Minutes | 27 | 26.2% |
| 20 to 24 Minutes | 21 | 20.4% |
| 25 to 29 Minutes | 2 | 1.9% |
| 30 to 34 Minutes | 2 | 1.9% |
| 35 to 39 Minutes | 0 | 0.0% |
| 40 to 44 Minutes | 0 | 0.0% |
| 45 to 59 Minutes | 0 | 0.0% |
| 60 to 89 Minutes | 9 | 8.7% |
| 90 or more Minutes | 36 | 34.9% |
Commute Time by Sex in Lester
The most common commute times in Lester are 90 or more minutes (36 commuters, 45.0%) for males and 15 to 19 minutes (10 commuters, 43.5%) for females.
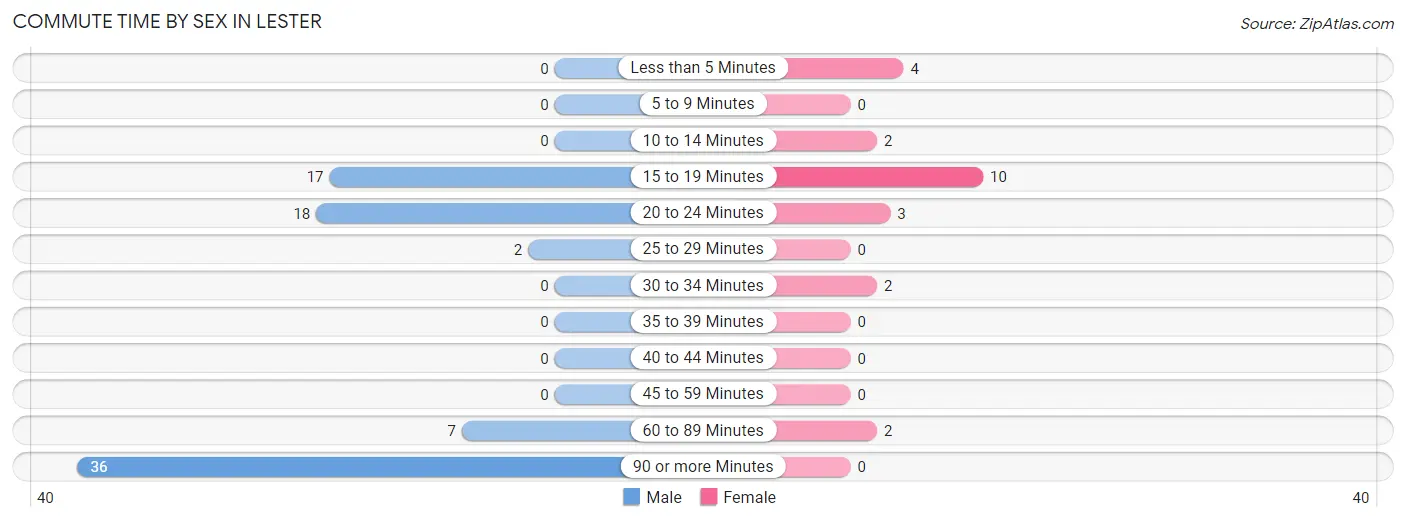
| Commute Time | Male | Female |
| Less than 5 Minutes | 0 (0.0%) | 4 (17.4%) |
| 5 to 9 Minutes | 0 (0.0%) | 0 (0.0%) |
| 10 to 14 Minutes | 0 (0.0%) | 2 (8.7%) |
| 15 to 19 Minutes | 17 (21.2%) | 10 (43.5%) |
| 20 to 24 Minutes | 18 (22.5%) | 3 (13.0%) |
| 25 to 29 Minutes | 2 (2.5%) | 0 (0.0%) |
| 30 to 34 Minutes | 0 (0.0%) | 2 (8.7%) |
| 35 to 39 Minutes | 0 (0.0%) | 0 (0.0%) |
| 40 to 44 Minutes | 0 (0.0%) | 0 (0.0%) |
| 45 to 59 Minutes | 0 (0.0%) | 0 (0.0%) |
| 60 to 89 Minutes | 7 (8.7%) | 2 (8.7%) |
| 90 or more Minutes | 36 (45.0%) | 0 (0.0%) |
Time of Departure to Work by Sex in Lester
The most frequent times of departure to work in Lester are 12:00 AM to 4:59 AM (49, 61.3%) for males and 7:00 AM to 7:29 AM (7, 30.4%) for females.
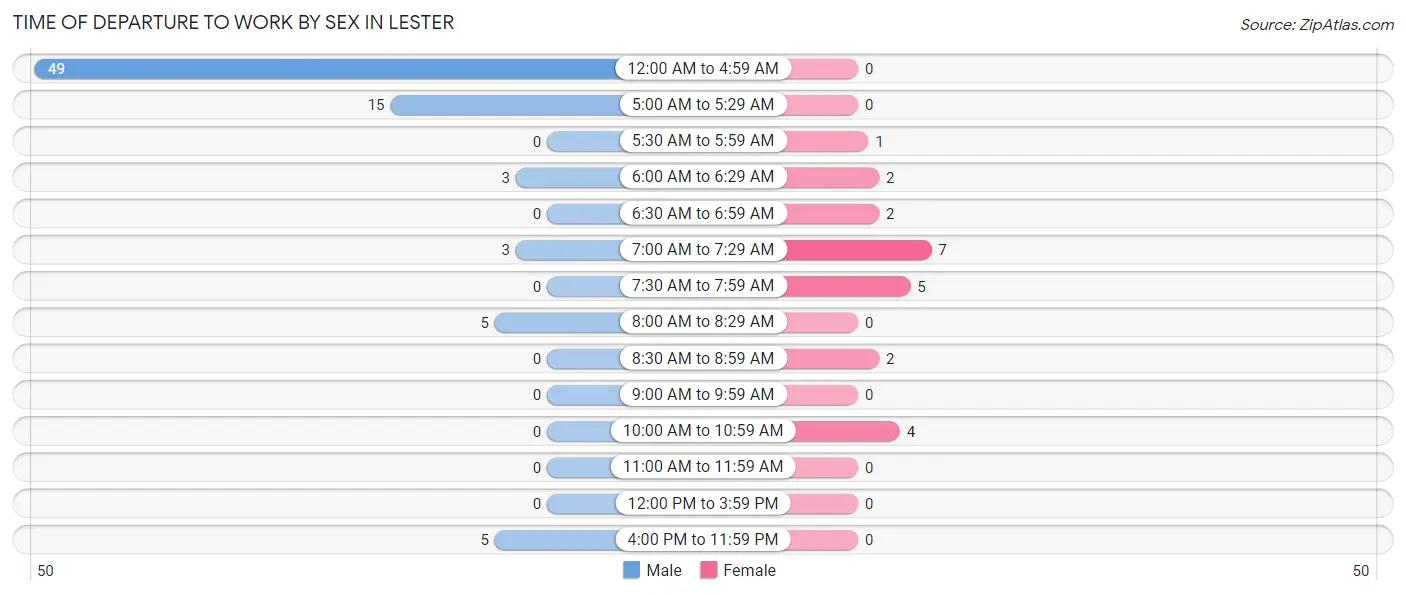
| Time of Departure | Male | Female |
| 12:00 AM to 4:59 AM | 49 (61.3%) | 0 (0.0%) |
| 5:00 AM to 5:29 AM | 15 (18.8%) | 0 (0.0%) |
| 5:30 AM to 5:59 AM | 0 (0.0%) | 1 (4.3%) |
| 6:00 AM to 6:29 AM | 3 (3.7%) | 2 (8.7%) |
| 6:30 AM to 6:59 AM | 0 (0.0%) | 2 (8.7%) |
| 7:00 AM to 7:29 AM | 3 (3.7%) | 7 (30.4%) |
| 7:30 AM to 7:59 AM | 0 (0.0%) | 5 (21.7%) |
| 8:00 AM to 8:29 AM | 5 (6.2%) | 0 (0.0%) |
| 8:30 AM to 8:59 AM | 0 (0.0%) | 2 (8.7%) |
| 9:00 AM to 9:59 AM | 0 (0.0%) | 0 (0.0%) |
| 10:00 AM to 10:59 AM | 0 (0.0%) | 4 (17.4%) |
| 11:00 AM to 11:59 AM | 0 (0.0%) | 0 (0.0%) |
| 12:00 PM to 3:59 PM | 0 (0.0%) | 0 (0.0%) |
| 4:00 PM to 11:59 PM | 5 (6.2%) | 0 (0.0%) |
| Total | 80 (100.0%) | 23 (100.0%) |
Housing Occupancy in Lester
Occupancy by Ownership in Lester
Of the total 162 dwellings in Lester, owner-occupied units account for 120 (74.1%), while renter-occupied units make up 42 (25.9%).
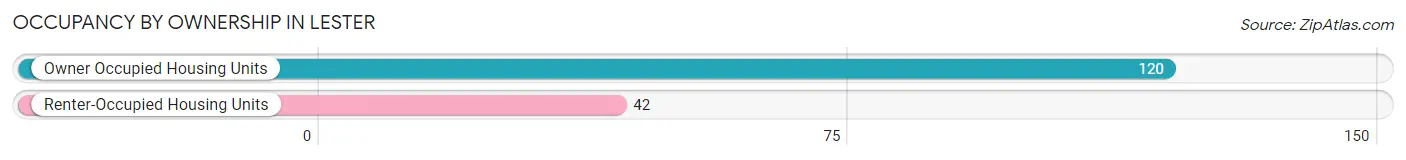
| Occupancy | # Housing Units | % Housing Units |
| Owner Occupied Housing Units | 120 | 74.1% |
| Renter-Occupied Housing Units | 42 | 25.9% |
| Total Occupied Housing Units | 162 | 100.0% |
Occupancy by Household Size in Lester
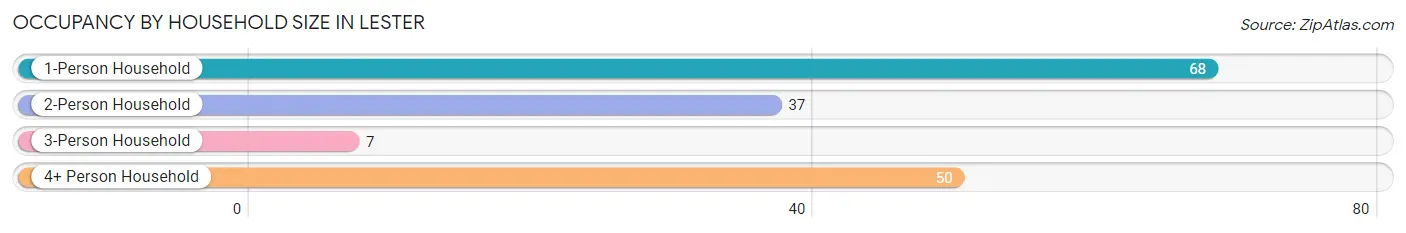
| Household Size | # Housing Units | % Housing Units |
| 1-Person Household | 68 | 42.0% |
| 2-Person Household | 37 | 22.8% |
| 3-Person Household | 7 | 4.3% |
| 4+ Person Household | 50 | 30.9% |
| Total Housing Units | 162 | 100.0% |
Occupancy by Ownership by Household Size in Lester
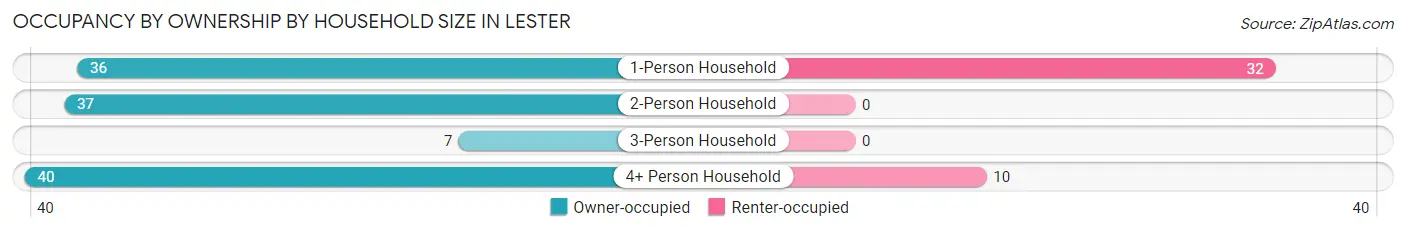
| Household Size | Owner-occupied | Renter-occupied |
| 1-Person Household | 36 (52.9%) | 32 (47.1%) |
| 2-Person Household | 37 (100.0%) | 0 (0.0%) |
| 3-Person Household | 7 (100.0%) | 0 (0.0%) |
| 4+ Person Household | 40 (80.0%) | 10 (20.0%) |
| Total Housing Units | 120 (74.1%) | 42 (25.9%) |
Occupancy by Educational Attainment in Lester
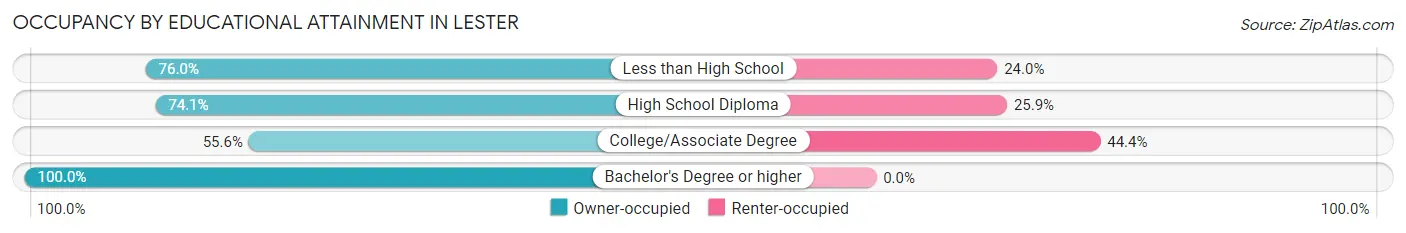
| Household Size | Owner-occupied | Renter-occupied |
| Less than High School | 38 (76.0%) | 12 (24.0%) |
| High School Diploma | 40 (74.1%) | 14 (25.9%) |
| College/Associate Degree | 20 (55.6%) | 16 (44.4%) |
| Bachelor's Degree or higher | 22 (100.0%) | 0 (0.0%) |
Occupancy by Age of Householder in Lester
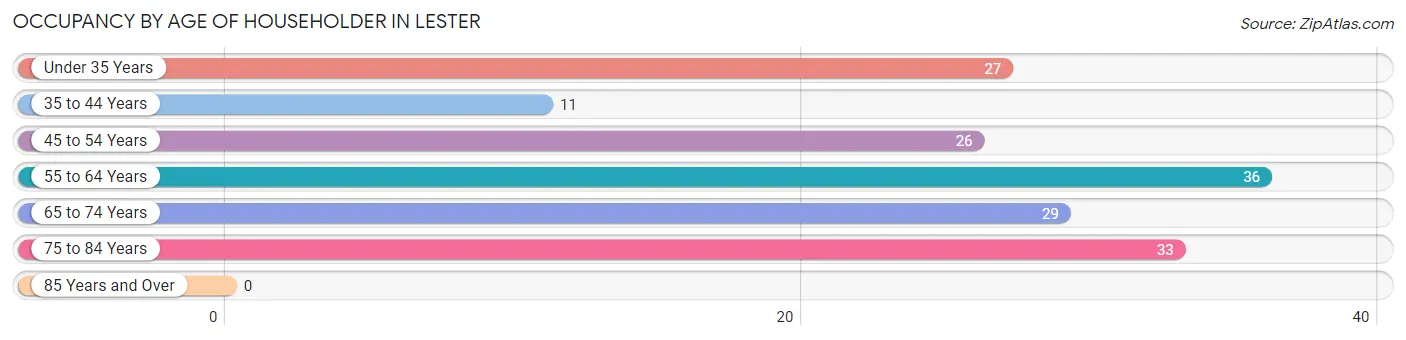
| Age Bracket | # Households | % Households |
| Under 35 Years | 27 | 16.7% |
| 35 to 44 Years | 11 | 6.8% |
| 45 to 54 Years | 26 | 16.1% |
| 55 to 64 Years | 36 | 22.2% |
| 65 to 74 Years | 29 | 17.9% |
| 75 to 84 Years | 33 | 20.4% |
| 85 Years and Over | 0 | 0.0% |
| Total | 162 | 100.0% |
Housing Finances in Lester
Median Income by Occupancy in Lester
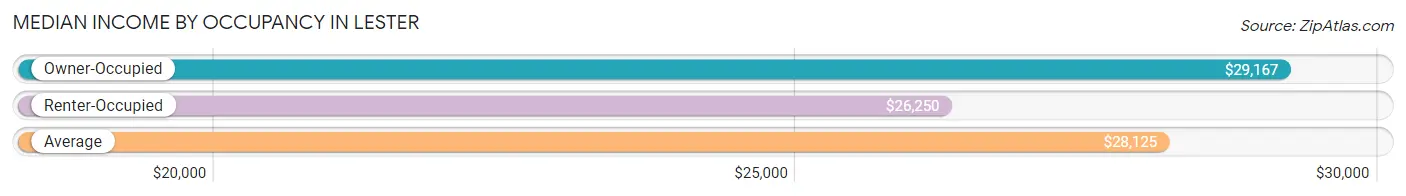
| Occupancy Type | # Households | Median Income |
| Owner-Occupied | 120 (74.1%) | $29,167 |
| Renter-Occupied | 42 (25.9%) | $26,250 |
| Average | 162 (100.0%) | $28,125 |
Occupancy by Householder Income Bracket in Lester
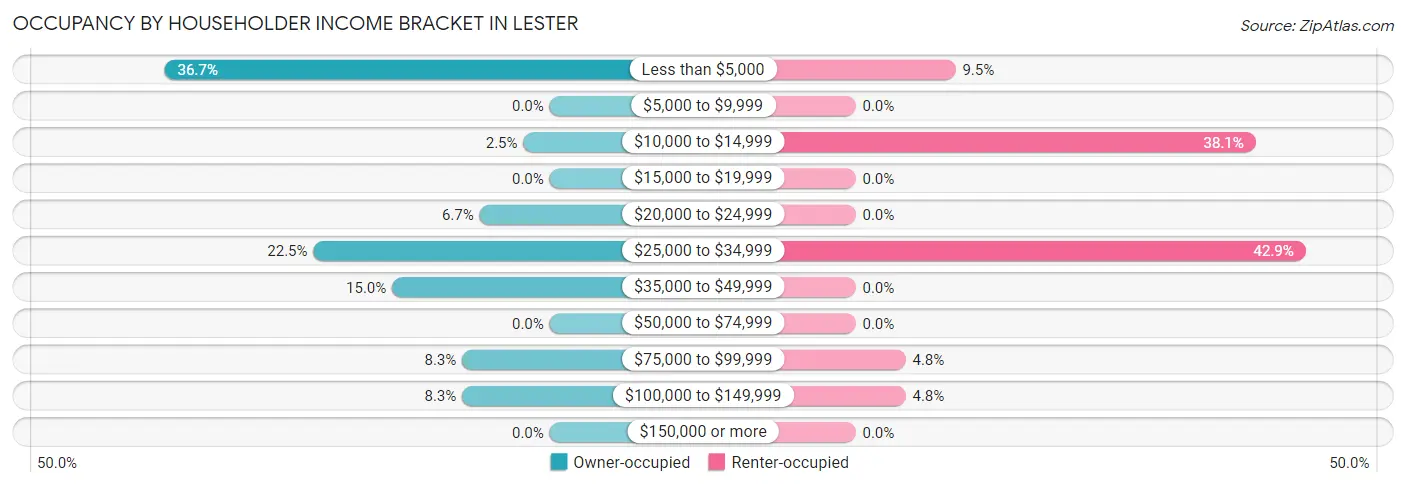
| Income Bracket | Owner-occupied | Renter-occupied |
| Less than $5,000 | 44 (36.7%) | 4 (9.5%) |
| $5,000 to $9,999 | 0 (0.0%) | 0 (0.0%) |
| $10,000 to $14,999 | 3 (2.5%) | 16 (38.1%) |
| $15,000 to $19,999 | 0 (0.0%) | 0 (0.0%) |
| $20,000 to $24,999 | 8 (6.7%) | 0 (0.0%) |
| $25,000 to $34,999 | 27 (22.5%) | 18 (42.9%) |
| $35,000 to $49,999 | 18 (15.0%) | 0 (0.0%) |
| $50,000 to $74,999 | 0 (0.0%) | 0 (0.0%) |
| $75,000 to $99,999 | 10 (8.3%) | 2 (4.8%) |
| $100,000 to $149,999 | 10 (8.3%) | 2 (4.8%) |
| $150,000 or more | 0 (0.0%) | 0 (0.0%) |
| Total | 120 (100.0%) | 42 (100.0%) |
Monthly Housing Cost Tiers in Lester
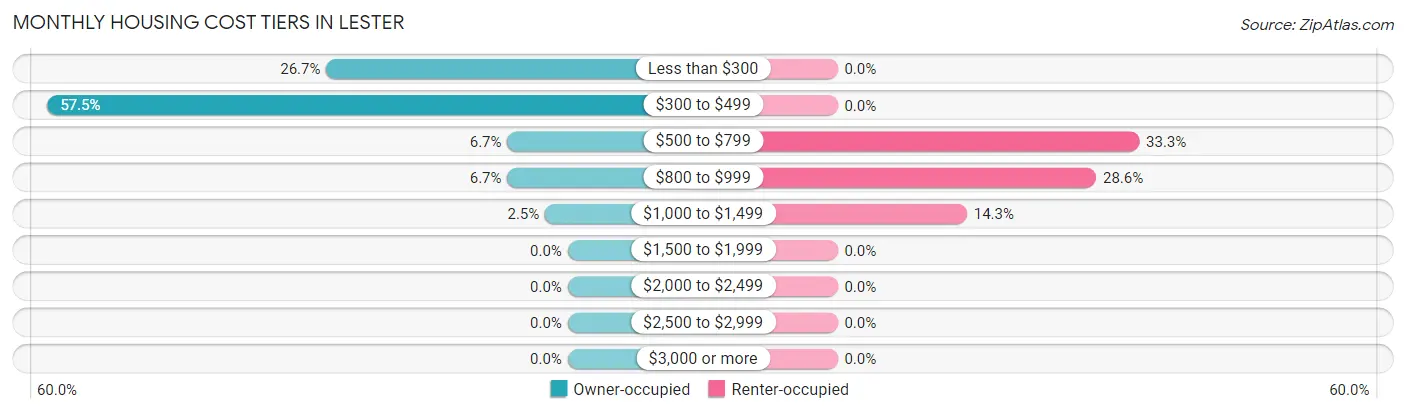
| Monthly Cost | Owner-occupied | Renter-occupied |
| Less than $300 | 32 (26.7%) | 0 (0.0%) |
| $300 to $499 | 69 (57.5%) | 0 (0.0%) |
| $500 to $799 | 8 (6.7%) | 14 (33.3%) |
| $800 to $999 | 8 (6.7%) | 12 (28.6%) |
| $1,000 to $1,499 | 3 (2.5%) | 6 (14.3%) |
| $1,500 to $1,999 | 0 (0.0%) | 0 (0.0%) |
| $2,000 to $2,499 | 0 (0.0%) | 0 (0.0%) |
| $2,500 to $2,999 | 0 (0.0%) | 0 (0.0%) |
| $3,000 or more | 0 (0.0%) | 0 (0.0%) |
| Total | 120 (100.0%) | 42 (100.0%) |
Physical Housing Characteristics in Lester
Housing Structures in Lester
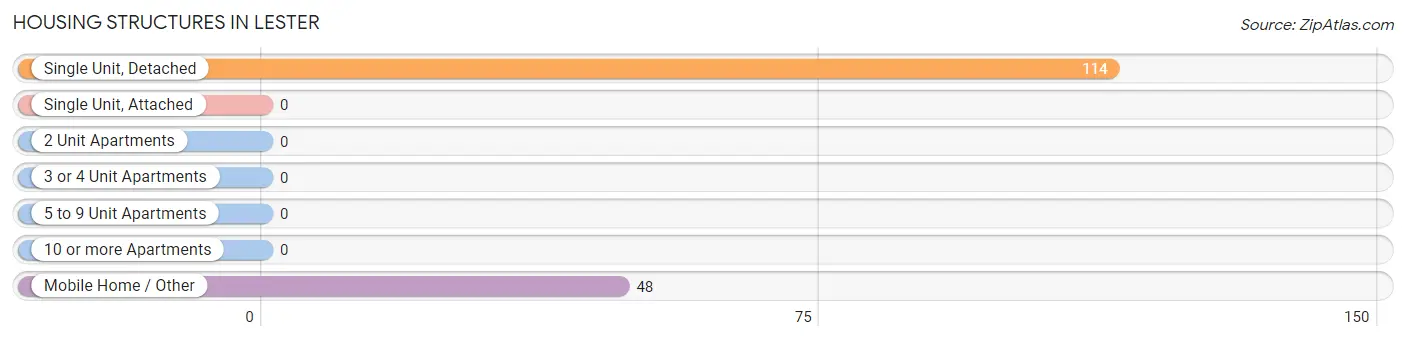
| Structure Type | # Housing Units | % Housing Units |
| Single Unit, Detached | 114 | 70.4% |
| Single Unit, Attached | 0 | 0.0% |
| 2 Unit Apartments | 0 | 0.0% |
| 3 or 4 Unit Apartments | 0 | 0.0% |
| 5 to 9 Unit Apartments | 0 | 0.0% |
| 10 or more Apartments | 0 | 0.0% |
| Mobile Home / Other | 48 | 29.6% |
| Total | 162 | 100.0% |
Housing Structures by Occupancy in Lester
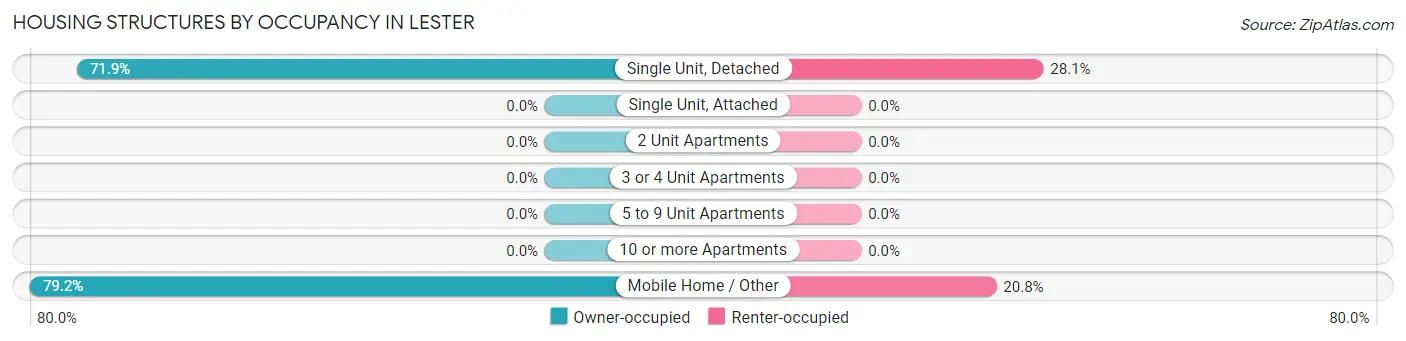
| Structure Type | Owner-occupied | Renter-occupied |
| Single Unit, Detached | 82 (71.9%) | 32 (28.1%) |
| Single Unit, Attached | 0 (0.0%) | 0 (0.0%) |
| 2 Unit Apartments | 0 (0.0%) | 0 (0.0%) |
| 3 or 4 Unit Apartments | 0 (0.0%) | 0 (0.0%) |
| 5 to 9 Unit Apartments | 0 (0.0%) | 0 (0.0%) |
| 10 or more Apartments | 0 (0.0%) | 0 (0.0%) |
| Mobile Home / Other | 38 (79.2%) | 10 (20.8%) |
| Total | 120 (74.1%) | 42 (25.9%) |
Housing Structures by Number of Rooms in Lester
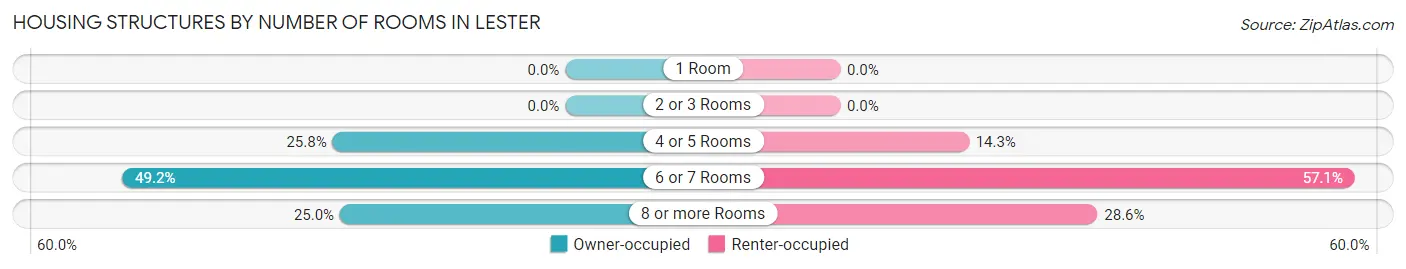
| Number of Rooms | Owner-occupied | Renter-occupied |
| 1 Room | 0 (0.0%) | 0 (0.0%) |
| 2 or 3 Rooms | 0 (0.0%) | 0 (0.0%) |
| 4 or 5 Rooms | 31 (25.8%) | 6 (14.3%) |
| 6 or 7 Rooms | 59 (49.2%) | 24 (57.1%) |
| 8 or more Rooms | 30 (25.0%) | 12 (28.6%) |
| Total | 120 (100.0%) | 42 (100.0%) |
Housing Structure by Heating Type in Lester
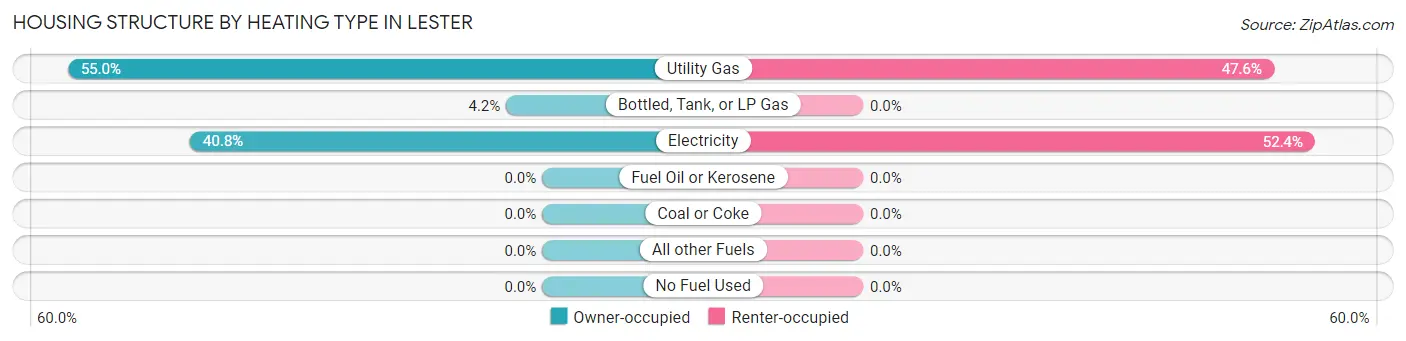
| Heating Type | Owner-occupied | Renter-occupied |
| Utility Gas | 66 (55.0%) | 20 (47.6%) |
| Bottled, Tank, or LP Gas | 5 (4.2%) | 0 (0.0%) |
| Electricity | 49 (40.8%) | 22 (52.4%) |
| Fuel Oil or Kerosene | 0 (0.0%) | 0 (0.0%) |
| Coal or Coke | 0 (0.0%) | 0 (0.0%) |
| All other Fuels | 0 (0.0%) | 0 (0.0%) |
| No Fuel Used | 0 (0.0%) | 0 (0.0%) |
| Total | 120 (100.0%) | 42 (100.0%) |
Household Vehicle Usage in Lester
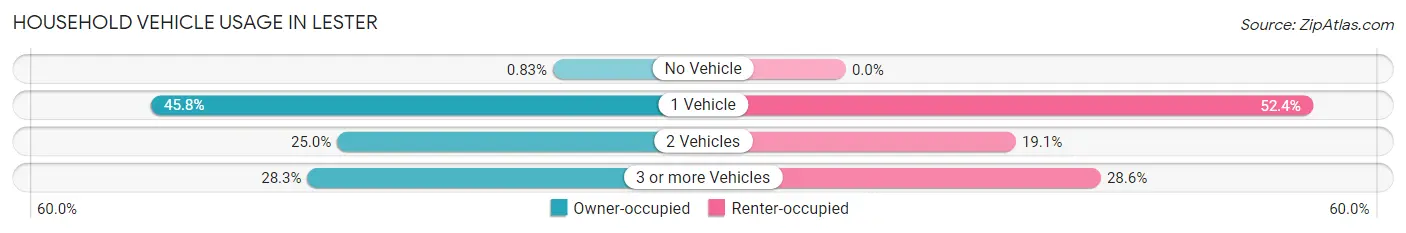
| Vehicles per Household | Owner-occupied | Renter-occupied |
| No Vehicle | 1 (0.8%) | 0 (0.0%) |
| 1 Vehicle | 55 (45.8%) | 22 (52.4%) |
| 2 Vehicles | 30 (25.0%) | 8 (19.1%) |
| 3 or more Vehicles | 34 (28.3%) | 12 (28.6%) |
| Total | 120 (100.0%) | 42 (100.0%) |
Real Estate & Mortgages in Lester
Real Estate and Mortgage Overview in Lester
| Characteristic | Without Mortgage | With Mortgage |
| Housing Units | 106 | 14 |
| Median Property Value | $85,000 | $0 |
| Median Household Income | - | - |
| Monthly Housing Costs | $394 | $0 |
| Real Estate Taxes | - | - |
Property Value by Mortgage Status in Lester
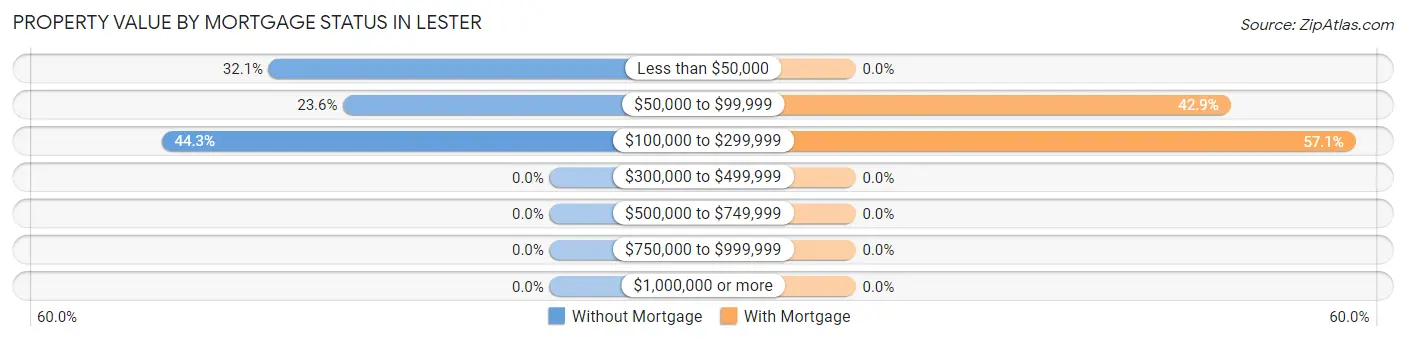
| Property Value | Without Mortgage | With Mortgage |
| Less than $50,000 | 34 (32.1%) | 0 (0.0%) |
| $50,000 to $99,999 | 25 (23.6%) | 6 (42.9%) |
| $100,000 to $299,999 | 47 (44.3%) | 8 (57.1%) |
| $300,000 to $499,999 | 0 (0.0%) | 0 (0.0%) |
| $500,000 to $749,999 | 0 (0.0%) | 0 (0.0%) |
| $750,000 to $999,999 | 0 (0.0%) | 0 (0.0%) |
| $1,000,000 or more | 0 (0.0%) | 0 (0.0%) |
| Total | 106 (100.0%) | 14 (100.0%) |
Household Income by Mortgage Status in Lester
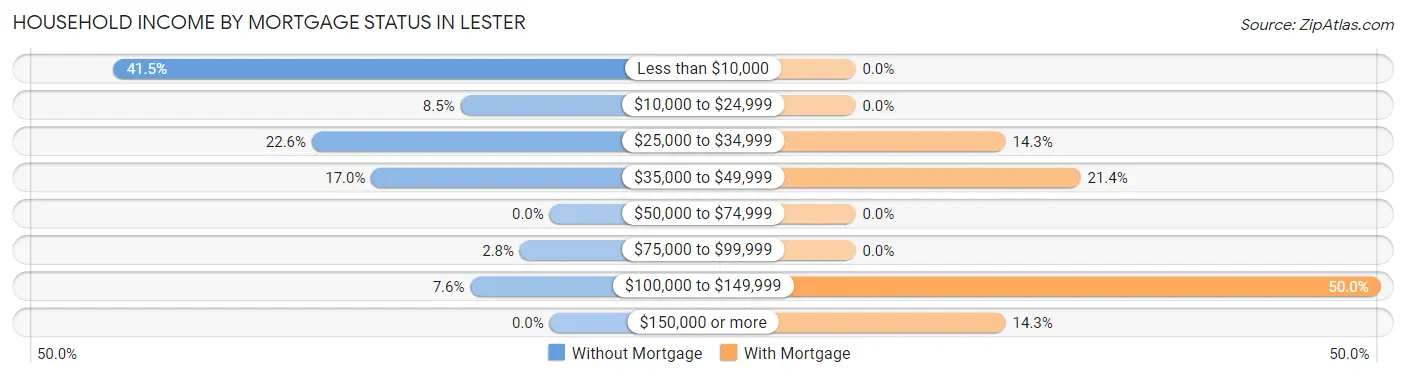
| Household Income | Without Mortgage | With Mortgage |
| Less than $10,000 | 44 (41.5%) | 0 (0.0%) |
| $10,000 to $24,999 | 9 (8.5%) | 0 (0.0%) |
| $25,000 to $34,999 | 24 (22.6%) | 2 (14.3%) |
| $35,000 to $49,999 | 18 (17.0%) | 3 (21.4%) |
| $50,000 to $74,999 | 0 (0.0%) | 0 (0.0%) |
| $75,000 to $99,999 | 3 (2.8%) | 0 (0.0%) |
| $100,000 to $149,999 | 8 (7.5%) | 7 (50.0%) |
| $150,000 or more | 0 (0.0%) | 2 (14.3%) |
| Total | 106 (100.0%) | 14 (100.0%) |
Property Value to Household Income Ratio in Lester
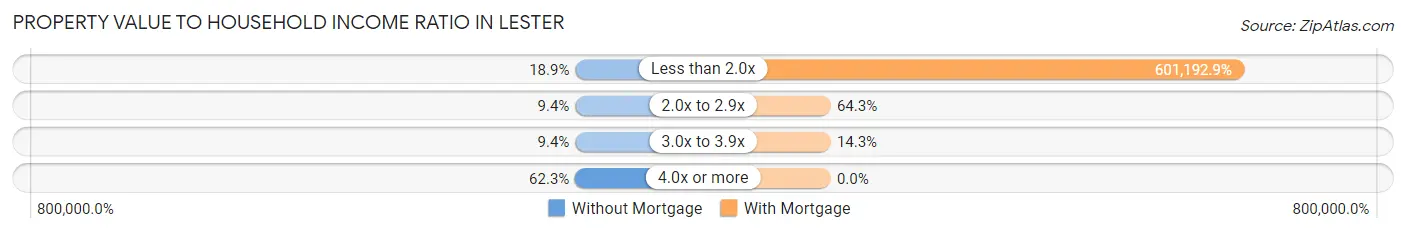
| Value-to-Income Ratio | Without Mortgage | With Mortgage |
| Less than 2.0x | 20 (18.9%) | 84,167 (601,192.9%) |
| 2.0x to 2.9x | 10 (9.4%) | 9 (64.3%) |
| 3.0x to 3.9x | 10 (9.4%) | 2 (14.3%) |
| 4.0x or more | 66 (62.3%) | 0 (0.0%) |
| Total | 106 (100.0%) | 14 (100.0%) |
Real Estate Taxes by Mortgage Status in Lester
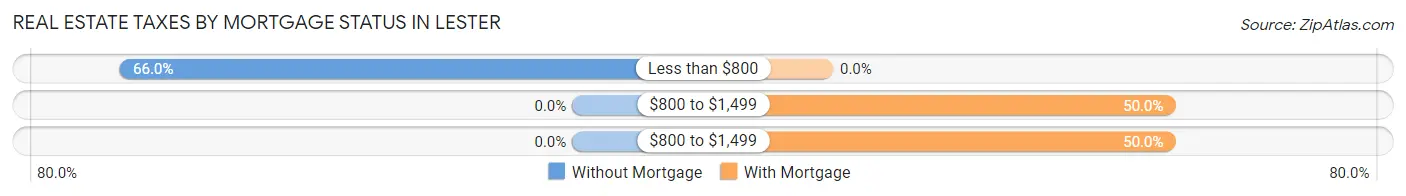
| Property Taxes | Without Mortgage | With Mortgage |
| Less than $800 | 70 (66.0%) | 0 (0.0%) |
| $800 to $1,499 | 0 (0.0%) | 7 (50.0%) |
| $800 to $1,499 | 0 (0.0%) | 7 (50.0%) |
| Total | 106 (100.0%) | 14 (100.0%) |
Health & Disability in Lester
Health Insurance Coverage by Age in Lester
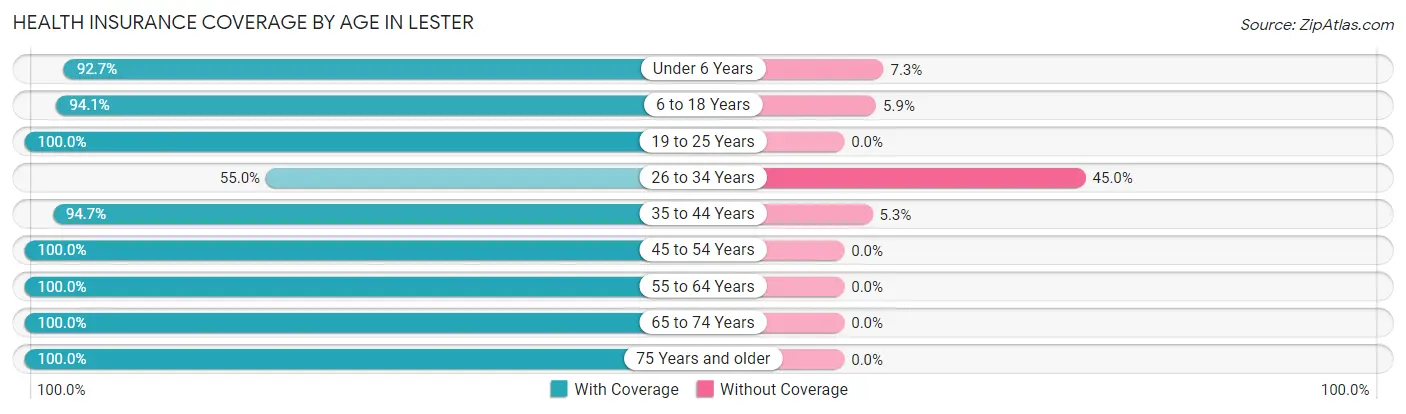
| Age Bracket | With Coverage | Without Coverage |
| Under 6 Years | 38 (92.7%) | 3 (7.3%) |
| 6 to 18 Years | 95 (94.1%) | 6 (5.9%) |
| 19 to 25 Years | 38 (100.0%) | 0 (0.0%) |
| 26 to 34 Years | 11 (55.0%) | 9 (45.0%) |
| 35 to 44 Years | 18 (94.7%) | 1 (5.3%) |
| 45 to 54 Years | 26 (100.0%) | 0 (0.0%) |
| 55 to 64 Years | 88 (100.0%) | 0 (0.0%) |
| 65 to 74 Years | 67 (100.0%) | 0 (0.0%) |
| 75 Years and older | 40 (100.0%) | 0 (0.0%) |
| Total | 421 (95.7%) | 19 (4.3%) |
Health Insurance Coverage by Citizenship Status in Lester
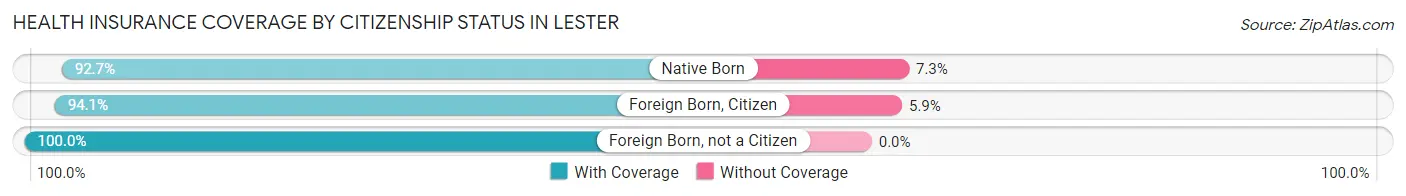
| Citizenship Status | With Coverage | Without Coverage |
| Native Born | 38 (92.7%) | 3 (7.3%) |
| Foreign Born, Citizen | 95 (94.1%) | 6 (5.9%) |
| Foreign Born, not a Citizen | 38 (100.0%) | 0 (0.0%) |
Health Insurance Coverage by Household Income in Lester
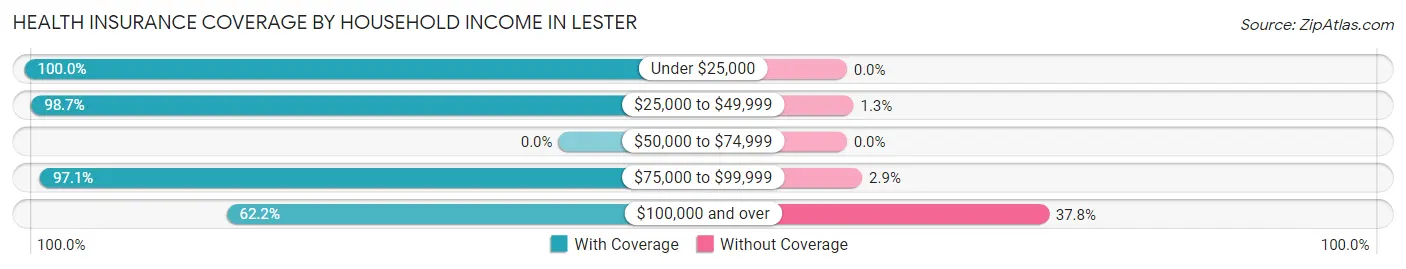
| Household Income | With Coverage | Without Coverage |
| Under $25,000 | 140 (100.0%) | 0 (0.0%) |
| $25,000 to $49,999 | 157 (98.7%) | 2 (1.3%) |
| $50,000 to $74,999 | 0 (0.0%) | 0 (0.0%) |
| $75,000 to $99,999 | 101 (97.1%) | 3 (2.9%) |
| $100,000 and over | 23 (62.2%) | 14 (37.8%) |
Public vs Private Health Insurance Coverage by Age in Lester
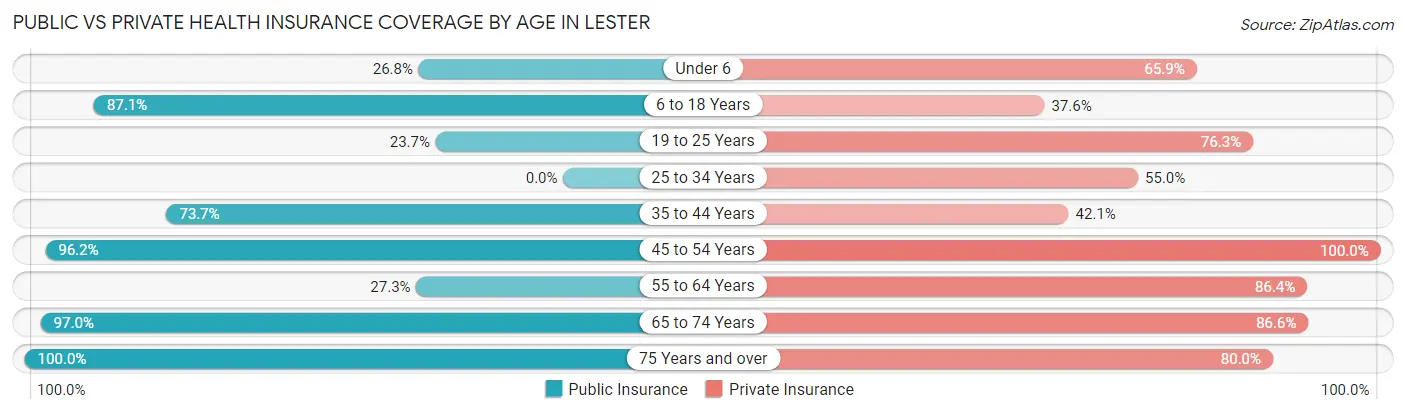
| Age Bracket | Public Insurance | Private Insurance |
| Under 6 | 11 (26.8%) | 27 (65.8%) |
| 6 to 18 Years | 88 (87.1%) | 38 (37.6%) |
| 19 to 25 Years | 9 (23.7%) | 29 (76.3%) |
| 25 to 34 Years | 0 (0.0%) | 11 (55.0%) |
| 35 to 44 Years | 14 (73.7%) | 8 (42.1%) |
| 45 to 54 Years | 25 (96.2%) | 26 (100.0%) |
| 55 to 64 Years | 24 (27.3%) | 76 (86.4%) |
| 65 to 74 Years | 65 (97.0%) | 58 (86.6%) |
| 75 Years and over | 40 (100.0%) | 32 (80.0%) |
| Total | 276 (62.7%) | 305 (69.3%) |
Disability Status by Sex by Age in Lester
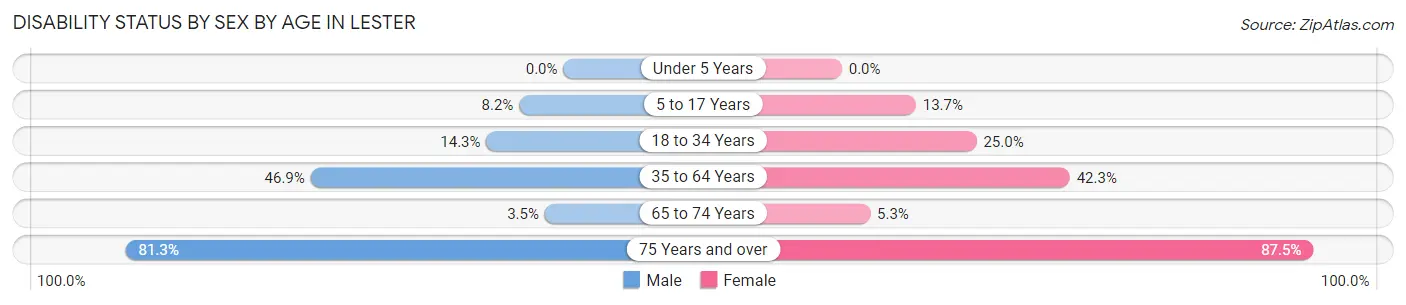
| Age Bracket | Male | Female |
| Under 5 Years | 0 (0.0%) | 0 (0.0%) |
| 5 to 17 Years | 5 (8.2%) | 7 (13.7%) |
| 18 to 34 Years | 6 (14.3%) | 4 (25.0%) |
| 35 to 64 Years | 38 (46.9%) | 22 (42.3%) |
| 65 to 74 Years | 1 (3.5%) | 2 (5.3%) |
| 75 Years and over | 13 (81.2%) | 21 (87.5%) |
Disability Class by Sex by Age in Lester
Disability Class: Hearing Difficulty
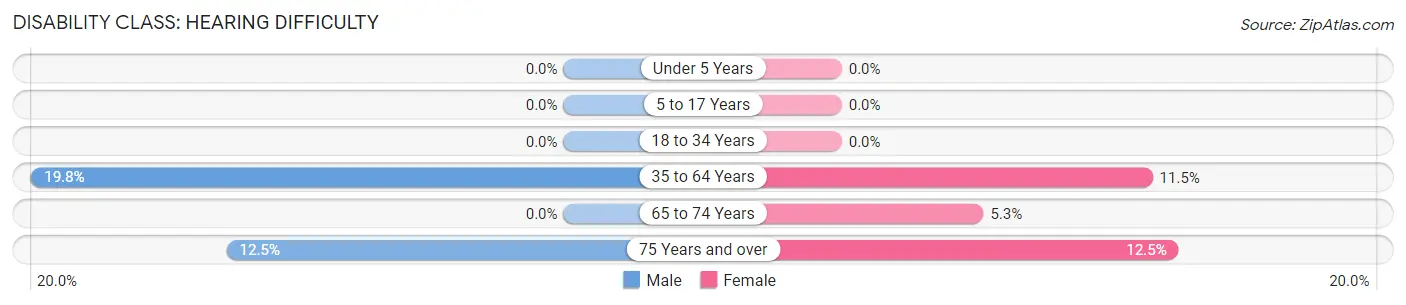
| Age Bracket | Male | Female |
| Under 5 Years | 0 (0.0%) | 0 (0.0%) |
| 5 to 17 Years | 0 (0.0%) | 0 (0.0%) |
| 18 to 34 Years | 0 (0.0%) | 0 (0.0%) |
| 35 to 64 Years | 16 (19.8%) | 6 (11.5%) |
| 65 to 74 Years | 0 (0.0%) | 2 (5.3%) |
| 75 Years and over | 2 (12.5%) | 3 (12.5%) |
Disability Class: Vision Difficulty
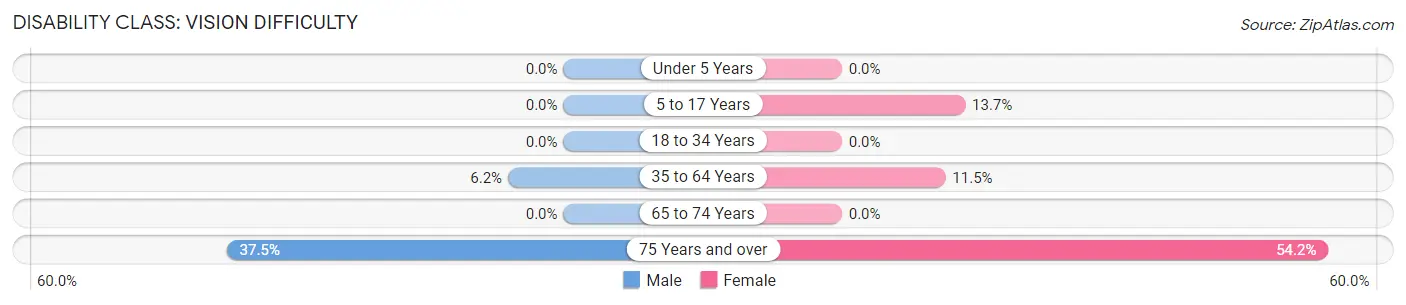
| Age Bracket | Male | Female |
| Under 5 Years | 0 (0.0%) | 0 (0.0%) |
| 5 to 17 Years | 0 (0.0%) | 7 (13.7%) |
| 18 to 34 Years | 0 (0.0%) | 0 (0.0%) |
| 35 to 64 Years | 5 (6.2%) | 6 (11.5%) |
| 65 to 74 Years | 0 (0.0%) | 0 (0.0%) |
| 75 Years and over | 6 (37.5%) | 13 (54.2%) |
Disability Class: Cognitive Difficulty
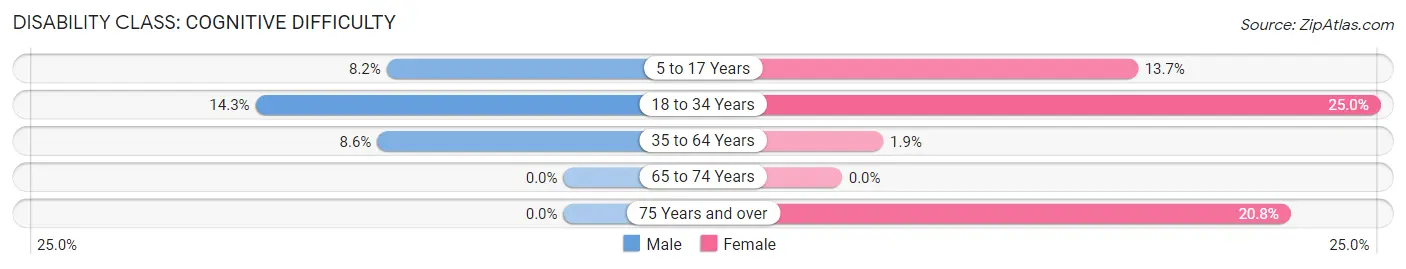
| Age Bracket | Male | Female |
| 5 to 17 Years | 5 (8.2%) | 7 (13.7%) |
| 18 to 34 Years | 6 (14.3%) | 4 (25.0%) |
| 35 to 64 Years | 7 (8.6%) | 1 (1.9%) |
| 65 to 74 Years | 0 (0.0%) | 0 (0.0%) |
| 75 Years and over | 0 (0.0%) | 5 (20.8%) |
Disability Class: Ambulatory Difficulty
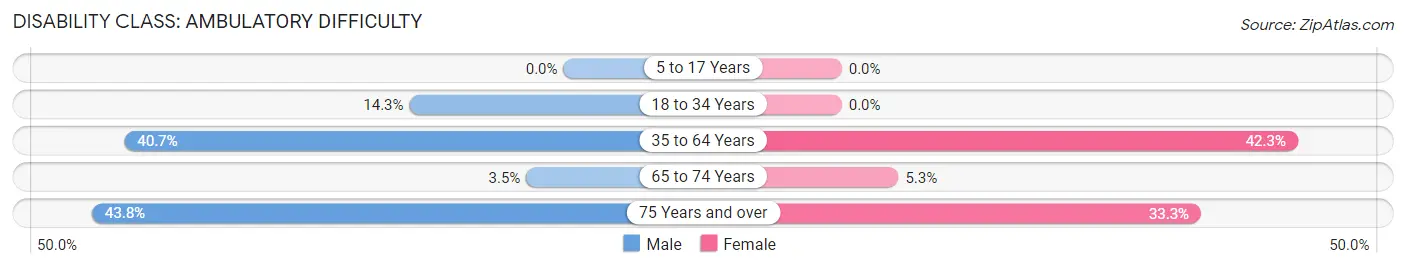
| Age Bracket | Male | Female |
| 5 to 17 Years | 0 (0.0%) | 0 (0.0%) |
| 18 to 34 Years | 6 (14.3%) | 0 (0.0%) |
| 35 to 64 Years | 33 (40.7%) | 22 (42.3%) |
| 65 to 74 Years | 1 (3.5%) | 2 (5.3%) |
| 75 Years and over | 7 (43.8%) | 8 (33.3%) |
Disability Class: Self-Care Difficulty
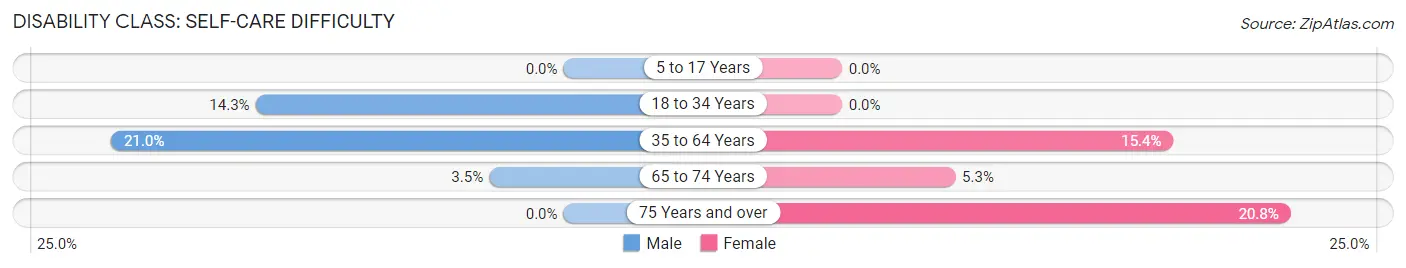
| Age Bracket | Male | Female |
| 5 to 17 Years | 0 (0.0%) | 0 (0.0%) |
| 18 to 34 Years | 6 (14.3%) | 0 (0.0%) |
| 35 to 64 Years | 17 (21.0%) | 8 (15.4%) |
| 65 to 74 Years | 1 (3.5%) | 2 (5.3%) |
| 75 Years and over | 0 (0.0%) | 5 (20.8%) |
Technology Access in Lester
Computing Device Access in Lester
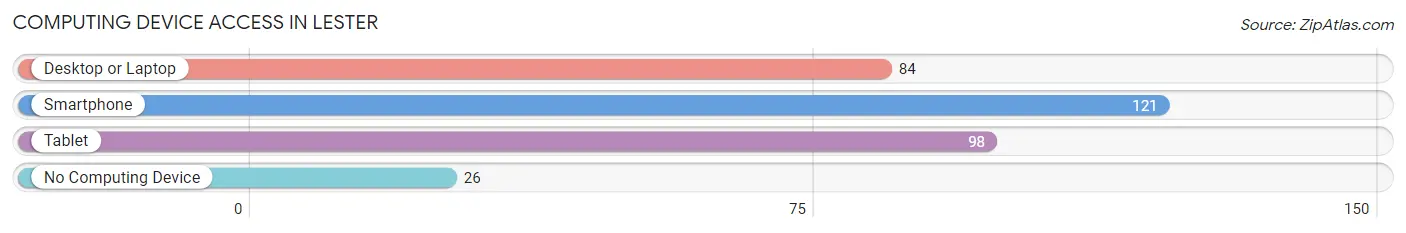
| Device Type | # Households | % Households |
| Desktop or Laptop | 84 | 51.8% |
| Smartphone | 121 | 74.7% |
| Tablet | 98 | 60.5% |
| No Computing Device | 26 | 16.1% |
| Total | 162 | 100.0% |
Internet Access in Lester
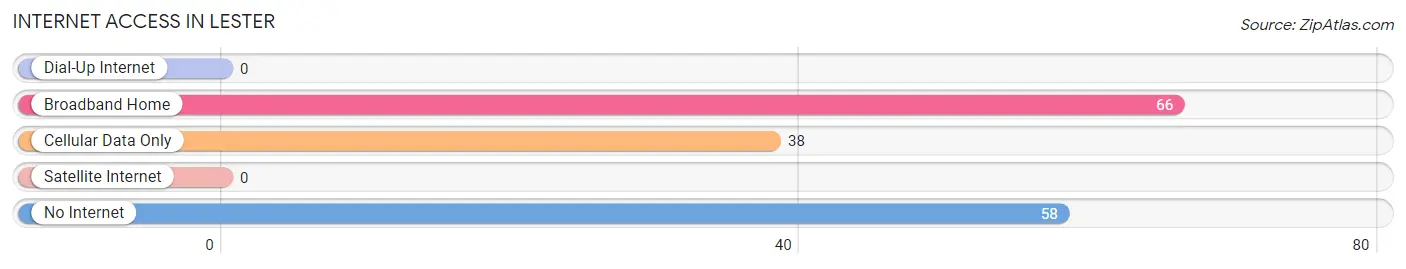
| Internet Type | # Households | % Households |
| Dial-Up Internet | 0 | 0.0% |
| Broadband Home | 66 | 40.7% |
| Cellular Data Only | 38 | 23.5% |
| Satellite Internet | 0 | 0.0% |
| No Internet | 58 | 35.8% |
| Total | 162 | 100.0% |
Lester Summary
Lester, West Virginia is a small unincorporated community located in McDowell County, West Virginia. It is situated in the Appalachian Mountains, and is part of the Appalachian Regional Commission. The population of Lester was estimated to be around 200 people in 2020.
History
Lester was founded in the late 19th century by coal miners who were looking for work in the area. The town was named after a local coal miner, John Lester, who was the first to settle in the area. The town was originally known as "Lester's Station" and was a stop on the Norfolk and Western Railway.
The town grew rapidly in the early 20th century, as the coal industry in the area flourished. The town was home to several coal mines, including the Lester Coal Company, which was founded in 1902. The town also had a post office, a school, and several stores.
In the 1950s, the coal industry in the area began to decline, and the town's population began to decline as well. By the 1970s, the town had become a ghost town, with only a few residents remaining.
Geography
Lester is located in the Appalachian Mountains, in the southeastern part of McDowell County. The town is situated at an elevation of 1,890 feet above sea level. The town is surrounded by mountains, and is located near the headwaters of the Tug Fork River.
The climate in Lester is humid subtropical, with hot summers and cold winters. The average annual temperature is around 54°F, and the average annual precipitation is around 44 inches.
Economy
The economy of Lester is largely based on coal mining. The town was once home to several coal mines, but these have since closed. The town is now home to a few small businesses, including a gas station, a convenience store, and a few restaurants.
Demographics
As of the 2010 census, the population of Lester was estimated to be around 200 people. The racial makeup of the town was 97.5% White, 0.5% African American, 0.5% Native American, and 1.5% from other races. The median household income in the town was $25,000, and the median family income was $30,000. The per capita income in the town was $14,000.
Conclusion
Lester, West Virginia is a small unincorporated community located in McDowell County, West Virginia. It is situated in the Appalachian Mountains, and is part of the Appalachian Regional Commission. The town was founded in the late 19th century by coal miners, and was once home to several coal mines. The town's economy is now largely based on small businesses, and the population of Lester was estimated to be around 200 people in 2020.
Common Questions
What is Per Capita Income in Lester?
Per Capita income in Lester is $18,091.
What is the Median Family Income in Lester?
Median Family Income in Lester is $32,667.
What is the Median Household income in Lester?
Median Household Income in Lester is $28,125.
What is Inequality or Gini Index in Lester?
Inequality or Gini Index in Lester is 0.51.
What is the Total Population of Lester?
Total Population of Lester is 440.
What is the Total Male Population of Lester?
Total Male Population of Lester is 244.
What is the Total Female Population of Lester?
Total Female Population of Lester is 196.
What is the Ratio of Males per 100 Females in Lester?
There are 124.49 Males per 100 Females in Lester.
What is the Ratio of Females per 100 Males in Lester?
There are 80.33 Females per 100 Males in Lester.
What is the Median Population Age in Lester?
Median Population Age in Lester is 50.0 Years.
What is the Average Family Size in Lester
Average Family Size in Lester is 4.0 People.
What is the Average Household Size in Lester
Average Household Size in Lester is 2.7 People.
How Large is the Labor Force in Lester?
There are 115 People in the Labor Forcein in Lester.
What is the Percentage of People in the Labor Force in Lester?
36.6% of People are in the Labor Force in Lester.
What is the Unemployment Rate in Lester?
Unemployment Rate in Lester is 8.7%.