Sleepy Hollow, WY Map & Demographics
Sleepy Hollow Map
Sleepy Hollow Overview
$47,749
PER CAPITA INCOME
$111,500
AVG FAMILY INCOME
$113,608
AVG HOUSEHOLD INCOME
0.20
INEQUALITY / GINI INDEX
1,390
TOTAL POPULATION
711
MALE POPULATION
679
FEMALE POPULATION
104.71
MALES / 100 FEMALES
95.50
FEMALES / 100 MALES
34.8
MEDIAN AGE
2.5
AVG FAMILY SIZE
2.6
AVG HOUSEHOLD SIZE
921
LABOR FORCE [ PEOPLE ]
83.4%
PERCENT IN LABOR FORCE
0.4%
UNEMPLOYMENT RATE
Income in Sleepy Hollow
Income Overview in Sleepy Hollow
Per Capita Income in Sleepy Hollow is $47,749, while median incomes of families and households are $111,500 and $113,608 respectively.
| Characteristic | Number | Measure |
| Per Capita Income | 1,390 | $47,749 |
| Median Family Income | 478 | $111,500 |
| Mean Family Income | 478 | $111,317 |
| Median Household Income | 540 | $113,608 |
| Mean Household Income | 540 | $122,791 |
| Income Deficit | 478 | $0 |
| Wage / Income Gap (%) | 1,390 | 0.00% |
| Wage / Income Gap ($) | 1,390 | 100.00¢ per $1 |
| Gini / Inequality Index | 1,390 | 0.20 |
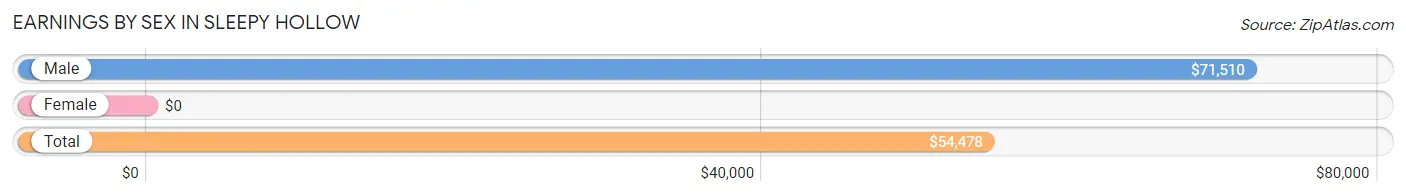
Earnings by Sex in Sleepy Hollow
| Sex | Number | Average Earnings |
| Male | 585 (62.0%) | $71,510 |
| Female | 358 (38.0%) | $0 |
| Total | 943 (100.0%) | $54,478 |
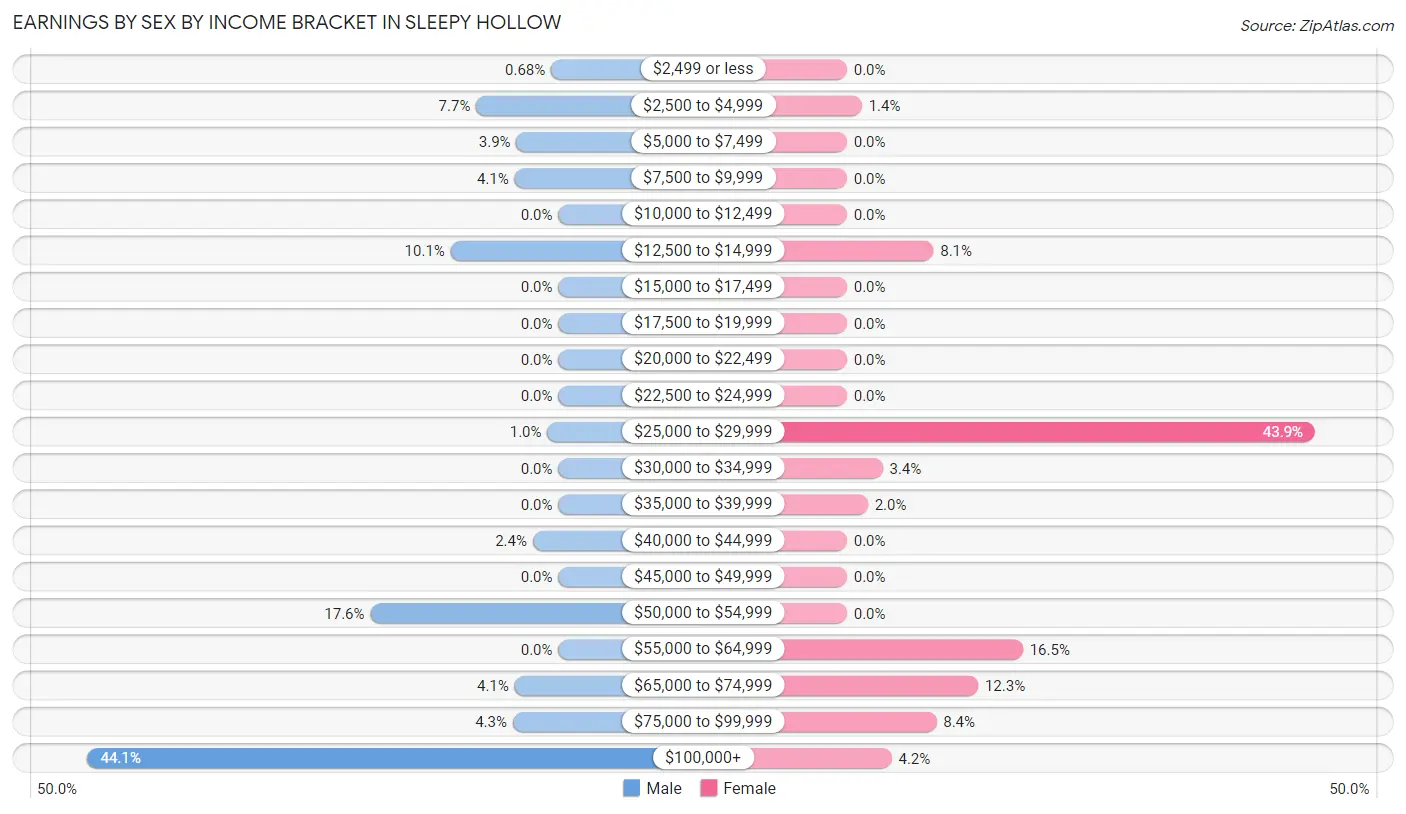
Earnings by Sex by Income Bracket in Sleepy Hollow
The most common earnings brackets in Sleepy Hollow are $100,000+ for men (258 | 44.1%) and $25,000 to $29,999 for women (157 | 43.9%).
| Income | Male | Female |
| $2,499 or less | 4 (0.7%) | 0 (0.0%) |
| $2,500 to $4,999 | 45 (7.7%) | 5 (1.4%) |
| $5,000 to $7,499 | 23 (3.9%) | 0 (0.0%) |
| $7,500 to $9,999 | 24 (4.1%) | 0 (0.0%) |
| $10,000 to $12,499 | 0 (0.0%) | 0 (0.0%) |
| $12,500 to $14,999 | 59 (10.1%) | 29 (8.1%) |
| $15,000 to $17,499 | 0 (0.0%) | 0 (0.0%) |
| $17,500 to $19,999 | 0 (0.0%) | 0 (0.0%) |
| $20,000 to $22,499 | 0 (0.0%) | 0 (0.0%) |
| $22,500 to $24,999 | 0 (0.0%) | 0 (0.0%) |
| $25,000 to $29,999 | 6 (1.0%) | 157 (43.9%) |
| $30,000 to $34,999 | 0 (0.0%) | 12 (3.4%) |
| $35,000 to $39,999 | 0 (0.0%) | 7 (2.0%) |
| $40,000 to $44,999 | 14 (2.4%) | 0 (0.0%) |
| $45,000 to $49,999 | 0 (0.0%) | 0 (0.0%) |
| $50,000 to $54,999 | 103 (17.6%) | 0 (0.0%) |
| $55,000 to $64,999 | 0 (0.0%) | 59 (16.5%) |
| $65,000 to $74,999 | 24 (4.1%) | 44 (12.3%) |
| $75,000 to $99,999 | 25 (4.3%) | 30 (8.4%) |
| $100,000+ | 258 (44.1%) | 15 (4.2%) |
| Total | 585 (100.0%) | 358 (100.0%) |
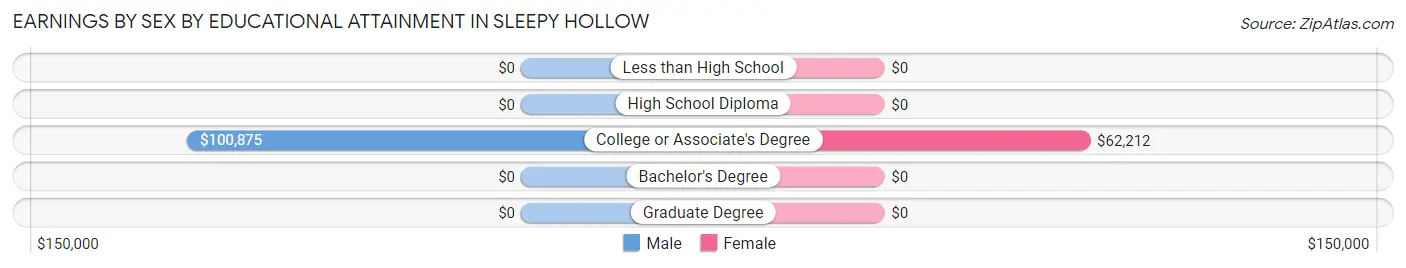
Earnings by Sex by Educational Attainment in Sleepy Hollow
| Educational Attainment | Male Income | Female Income |
| Less than High School | - | - |
| High School Diploma | - | - |
| College or Associate's Degree | $100,875 | $62,212 |
| Bachelor's Degree | - | - |
| Graduate Degree | - | - |
| Total | - | - |
Family Income in Sleepy Hollow
Family Income Brackets in Sleepy Hollow
According to the Sleepy Hollow family income data, there are 161 families falling into the $100,000 to $149,999 income range, which is the most common income bracket and makes up 33.7% of all families.
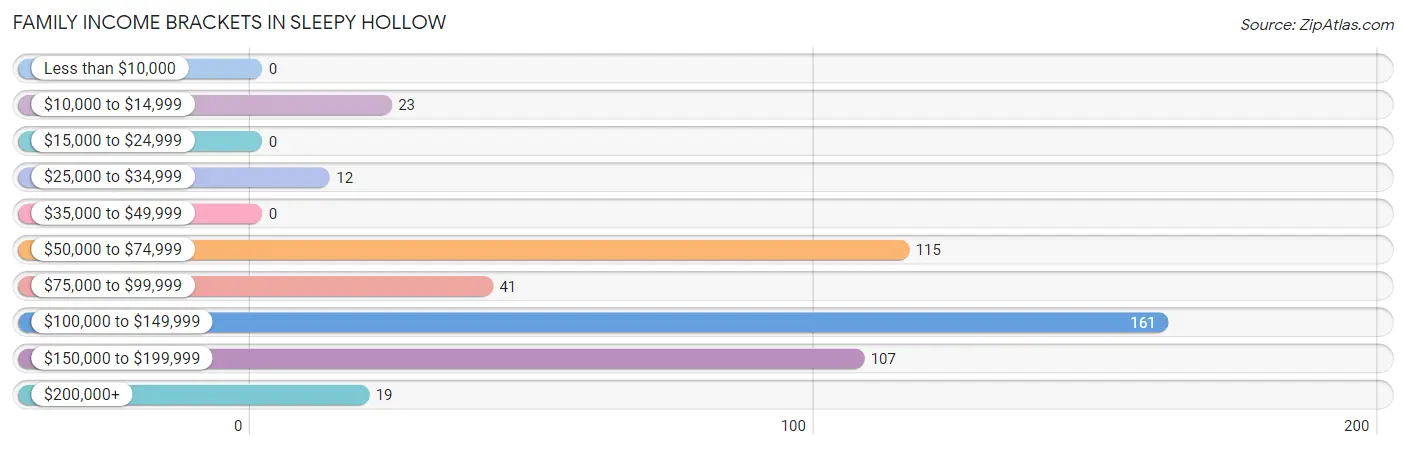
| Income Bracket | # Families | % Families |
| Less than $10,000 | 0 | 0.0% |
| $10,000 to $14,999 | 23 | 4.8% |
| $15,000 to $24,999 | 0 | 0.0% |
| $25,000 to $34,999 | 12 | 2.5% |
| $35,000 to $49,999 | 0 | 0.0% |
| $50,000 to $74,999 | 115 | 24.1% |
| $75,000 to $99,999 | 41 | 8.6% |
| $100,000 to $149,999 | 161 | 33.7% |
| $150,000 to $199,999 | 107 | 22.4% |
| $200,000+ | 19 | 4.0% |
Family Income by Famaliy Size in Sleepy Hollow
2-person families (333 | 69.7%) account for the highest median family income in Sleepy Hollow with $112,064 per family, while 2-person families (333 | 69.7%) have the highest median income of $56,032 per family member.
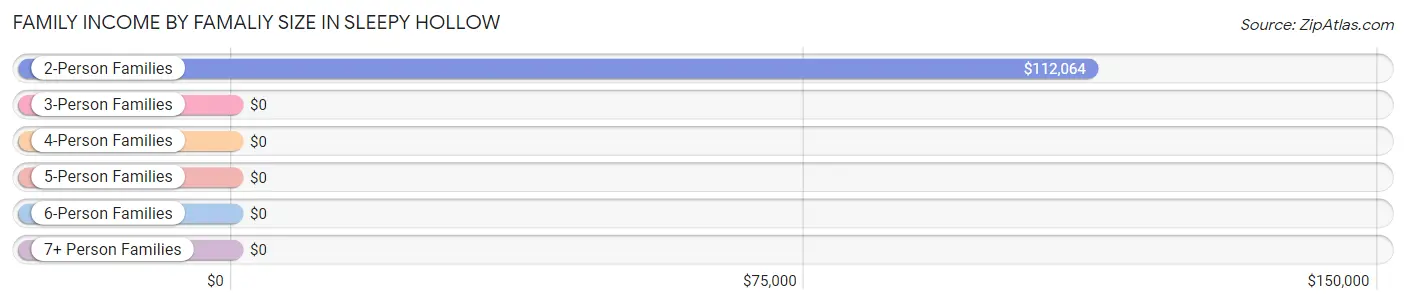
| Income Bracket | # Families | Median Income |
| 2-Person Families | 333 (69.7%) | $112,064 |
| 3-Person Families | 112 (23.4%) | $0 |
| 4-Person Families | 29 (6.1%) | $0 |
| 5-Person Families | 0 (0.0%) | $0 |
| 6-Person Families | 0 (0.0%) | $0 |
| 7+ Person Families | 4 (0.8%) | $0 |
| Total | 478 (100.0%) | $111,500 |
Family Income by Number of Earners in Sleepy Hollow
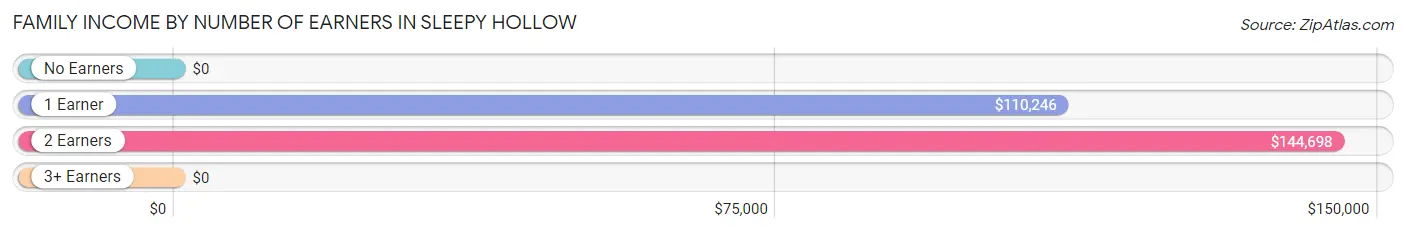
| Number of Earners | # Families | Median Income |
| No Earners | 19 (4.0%) | $0 |
| 1 Earner | 253 (52.9%) | $110,246 |
| 2 Earners | 183 (38.3%) | $144,698 |
| 3+ Earners | 23 (4.8%) | $0 |
| Total | 478 (100.0%) | $111,500 |
Household Income in Sleepy Hollow
Household Income Brackets in Sleepy Hollow
With 270 households falling in the category, the $100,000 to $149,999 income range is the most frequent in Sleepy Hollow, accounting for 50.0% of all households.
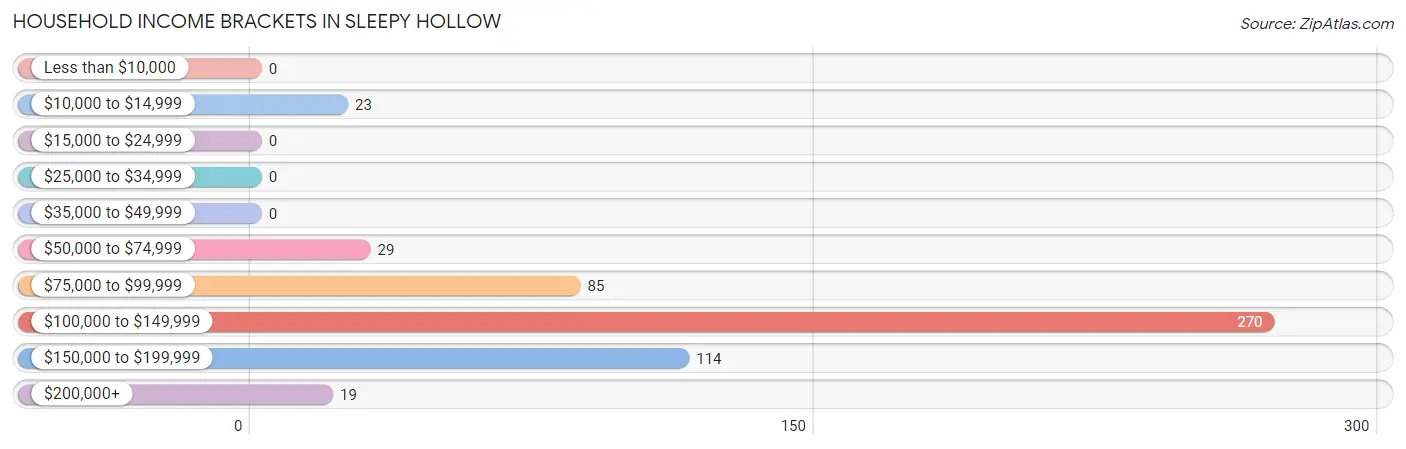
| Income Bracket | # Households | % Households |
| Less than $10,000 | 0 | 0.0% |
| $10,000 to $14,999 | 23 | 4.3% |
| $15,000 to $24,999 | 0 | 0.0% |
| $25,000 to $34,999 | 0 | 0.0% |
| $35,000 to $49,999 | 0 | 0.0% |
| $50,000 to $74,999 | 29 | 5.4% |
| $75,000 to $99,999 | 85 | 15.7% |
| $100,000 to $149,999 | 270 | 50.0% |
| $150,000 to $199,999 | 114 | 21.1% |
| $200,000+ | 19 | 3.5% |
Household Income by Householder Age in Sleepy Hollow
The median household income in Sleepy Hollow is $113,608, with the highest median household income of $130,978 found in the 45 to 64 years age bracket for the primary householder. A total of 280 households (51.8%) fall into this category. Meanwhile, the 15 to 24 years age bracket for the primary householder has the lowest median household income of $0, with 47 households (8.7%) in this group.
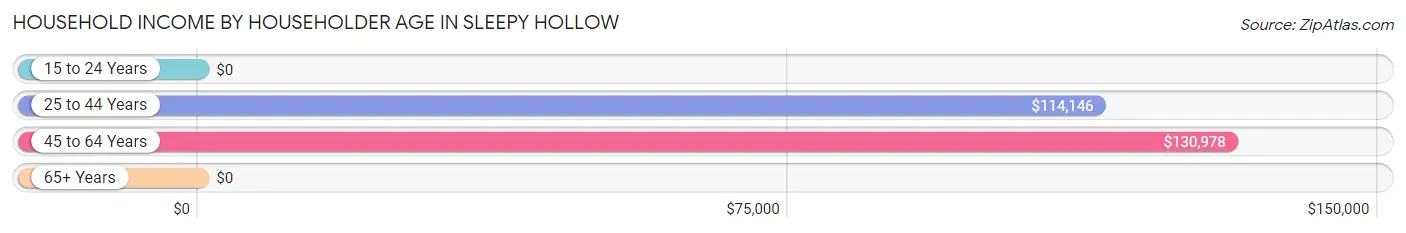
| Income Bracket | # Households | Median Income |
| 15 to 24 Years | 47 (8.7%) | $0 |
| 25 to 44 Years | 150 (27.8%) | $114,146 |
| 45 to 64 Years | 280 (51.8%) | $130,978 |
| 65+ Years | 63 (11.7%) | $0 |
| Total | 540 (100.0%) | $113,608 |
Poverty in Sleepy Hollow
Income Below Poverty by Sex and Age in Sleepy Hollow
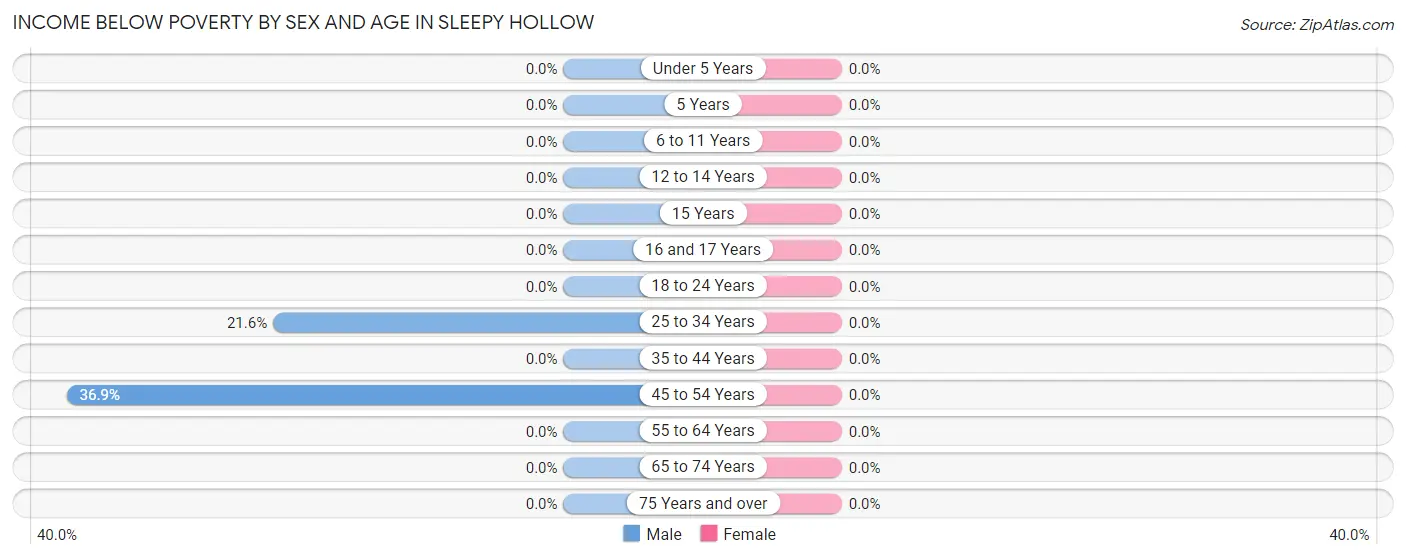
| Age Bracket | Male | Female |
| Under 5 Years | 0 (0.0%) | 0 (0.0%) |
| 5 Years | 0 (0.0%) | 0 (0.0%) |
| 6 to 11 Years | 0 (0.0%) | 0 (0.0%) |
| 12 to 14 Years | 0 (0.0%) | 0 (0.0%) |
| 15 Years | 0 (0.0%) | 0 (0.0%) |
| 16 and 17 Years | 0 (0.0%) | 0 (0.0%) |
| 18 to 24 Years | 0 (0.0%) | 0 (0.0%) |
| 25 to 34 Years | 47 (21.6%) | 0 (0.0%) |
| 35 to 44 Years | 0 (0.0%) | 0 (0.0%) |
| 45 to 54 Years | 59 (36.9%) | 0 (0.0%) |
| 55 to 64 Years | 0 (0.0%) | 0 (0.0%) |
| 65 to 74 Years | 0 (0.0%) | 0 (0.0%) |
| 75 Years and over | 0 (0.0%) | 0 (0.0%) |
| Total | 106 (14.9%) | 0 (0.0%) |
Income Above Poverty by Sex and Age in Sleepy Hollow
According to the poverty statistics in Sleepy Hollow, males aged under 5 years and females aged under 5 years are the age groups that are most secure financially, with 100.0% of males and 100.0% of females in these age groups living above the poverty line.
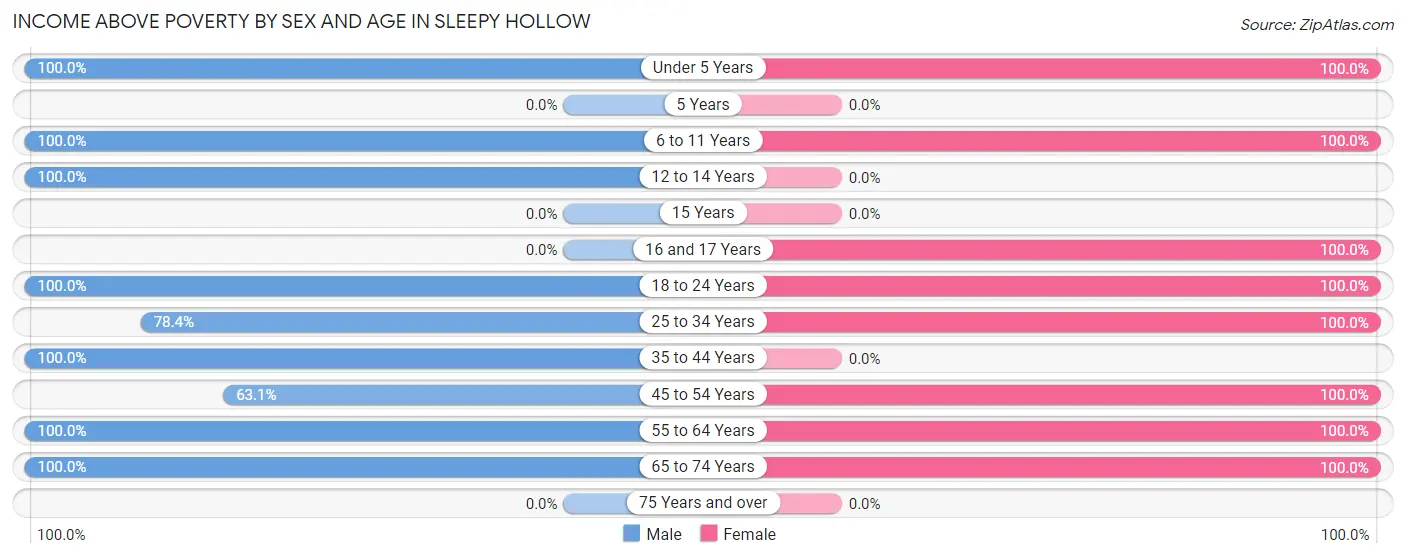
| Age Bracket | Male | Female |
| Under 5 Years | 50 (100.0%) | 59 (100.0%) |
| 5 Years | 0 (0.0%) | 0 (0.0%) |
| 6 to 11 Years | 29 (100.0%) | 142 (100.0%) |
| 12 to 14 Years | 6 (100.0%) | 0 (0.0%) |
| 15 Years | 0 (0.0%) | 0 (0.0%) |
| 16 and 17 Years | 0 (0.0%) | 7 (100.0%) |
| 18 to 24 Years | 39 (100.0%) | 47 (100.0%) |
| 25 to 34 Years | 171 (78.4%) | 110 (100.0%) |
| 35 to 44 Years | 7 (100.0%) | 0 (0.0%) |
| 45 to 54 Years | 101 (63.1%) | 112 (100.0%) |
| 55 to 64 Years | 183 (100.0%) | 140 (100.0%) |
| 65 to 74 Years | 19 (100.0%) | 62 (100.0%) |
| 75 Years and over | 0 (0.0%) | 0 (0.0%) |
| Total | 605 (85.1%) | 679 (100.0%) |
Income Below Poverty Among Married-Couple Families in Sleepy Hollow
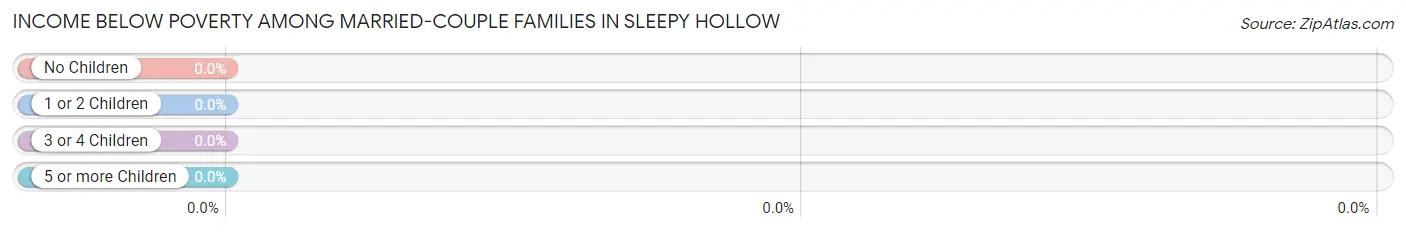
| Children | Above Poverty | Below Poverty |
| No Children | 324 (100.0%) | 0 (0.0%) |
| 1 or 2 Children | 29 (100.0%) | 0 (0.0%) |
| 3 or 4 Children | 4 (100.0%) | 0 (0.0%) |
| 5 or more Children | 0 (0.0%) | 0 (0.0%) |
| Total | 357 (100.0%) | 0 (0.0%) |
Income Below Poverty Among Single-Parent Households in Sleepy Hollow
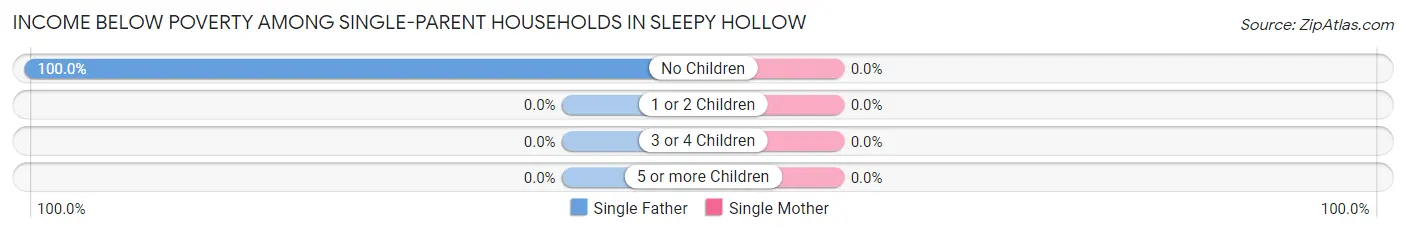
| Children | Single Father | Single Mother |
| No Children | 23 (100.0%) | 0 (0.0%) |
| 1 or 2 Children | 0 (0.0%) | 0 (0.0%) |
| 3 or 4 Children | 0 (0.0%) | 0 (0.0%) |
| 5 or more Children | 0 (0.0%) | 0 (0.0%) |
| Total | 23 (22.6%) | 0 (0.0%) |
Income Below Poverty Among Married-Couple vs Single-Parent Households in Sleepy Hollow
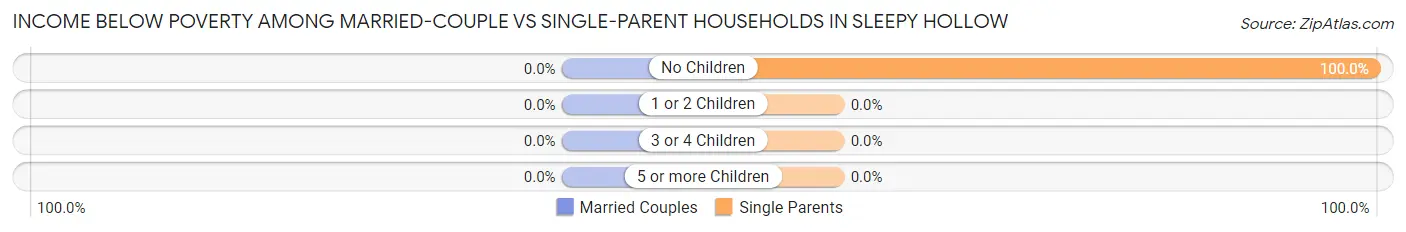
| Children | Married-Couple Families | Single-Parent Households |
| No Children | 0 (0.0%) | 23 (100.0%) |
| 1 or 2 Children | 0 (0.0%) | 0 (0.0%) |
| 3 or 4 Children | 0 (0.0%) | 0 (0.0%) |
| 5 or more Children | 0 (0.0%) | 0 (0.0%) |
| Total | 0 (0.0%) | 23 (19.0%) |
Race in Sleepy Hollow
The most populous races in Sleepy Hollow are White / Caucasian (1,222 | 87.9%), Two or more Races (168 | 12.1%), and Hispanic or Latino (146 | 10.5%).
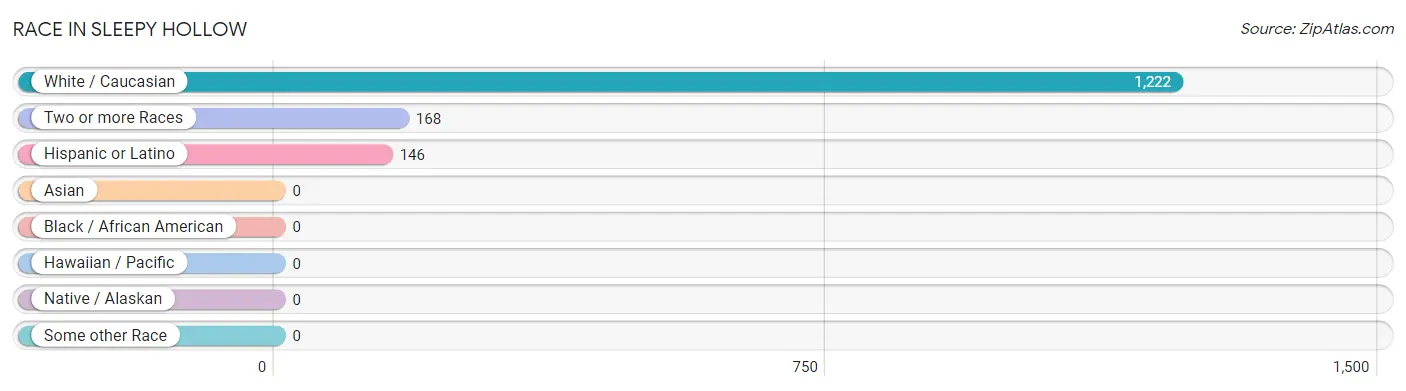
| Race | # Population | % Population |
| Asian | 0 | 0.0% |
| Black / African American | 0 | 0.0% |
| Hawaiian / Pacific | 0 | 0.0% |
| Hispanic or Latino | 146 | 10.5% |
| Native / Alaskan | 0 | 0.0% |
| White / Caucasian | 1,222 | 87.9% |
| Two or more Races | 168 | 12.1% |
| Some other Race | 0 | 0.0% |
| Total | 1,390 | 100.0% |
Ancestry in Sleepy Hollow
The most populous ancestries reported in Sleepy Hollow are German (418 | 30.1%), Italian (213 | 15.3%), Irish (97 | 7.0%), Mexican (82 | 5.9%), and French (65 | 4.7%), together accounting for 62.9% of all Sleepy Hollow residents.
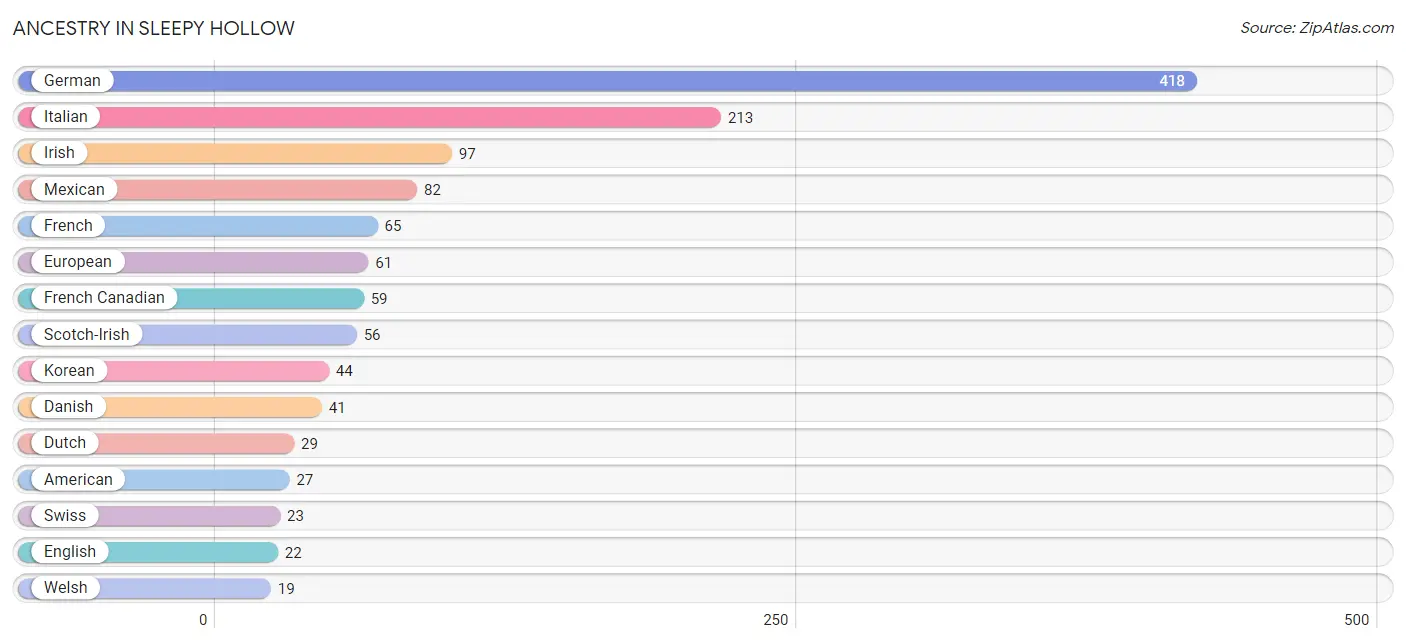
| Ancestry | # Population | % Population |
| American | 27 | 1.9% |
| Colombian | 14 | 1.0% |
| Danish | 41 | 2.9% |
| Dutch | 29 | 2.1% |
| English | 22 | 1.6% |
| European | 61 | 4.4% |
| French | 65 | 4.7% |
| French Canadian | 59 | 4.2% |
| German | 418 | 30.1% |
| Irish | 97 | 7.0% |
| Italian | 213 | 15.3% |
| Korean | 44 | 3.2% |
| Mexican | 82 | 5.9% |
| Norwegian | 11 | 0.8% |
| Scotch-Irish | 56 | 4.0% |
| Scottish | 5 | 0.4% |
| South American | 14 | 1.0% |
| Spaniard | 6 | 0.4% |
| Swedish | 13 | 0.9% |
| Swiss | 23 | 1.7% |
| Welsh | 19 | 1.4% | View All 21 Rows |
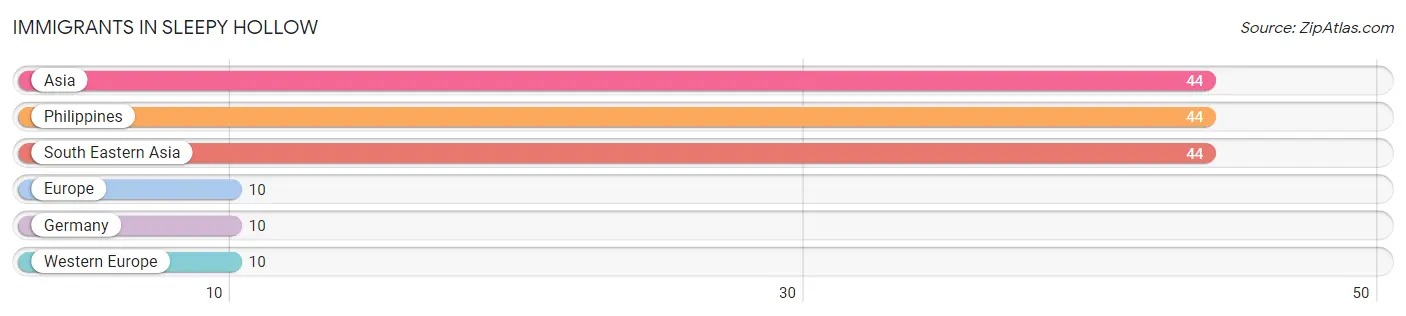
Immigrants in Sleepy Hollow
The most numerous immigrant groups reported in Sleepy Hollow came from Asia (44 | 3.2%), Philippines (44 | 3.2%), South Eastern Asia (44 | 3.2%), Europe (10 | 0.7%), and Germany (10 | 0.7%), together accounting for 10.9% of all Sleepy Hollow residents.
| Immigration Origin | # Population | % Population |
| Asia | 44 | 3.2% |
| Europe | 10 | 0.7% |
| Germany | 10 | 0.7% |
| Philippines | 44 | 3.2% |
| South Eastern Asia | 44 | 3.2% |
| Western Europe | 10 | 0.7% | View All 6 Rows |
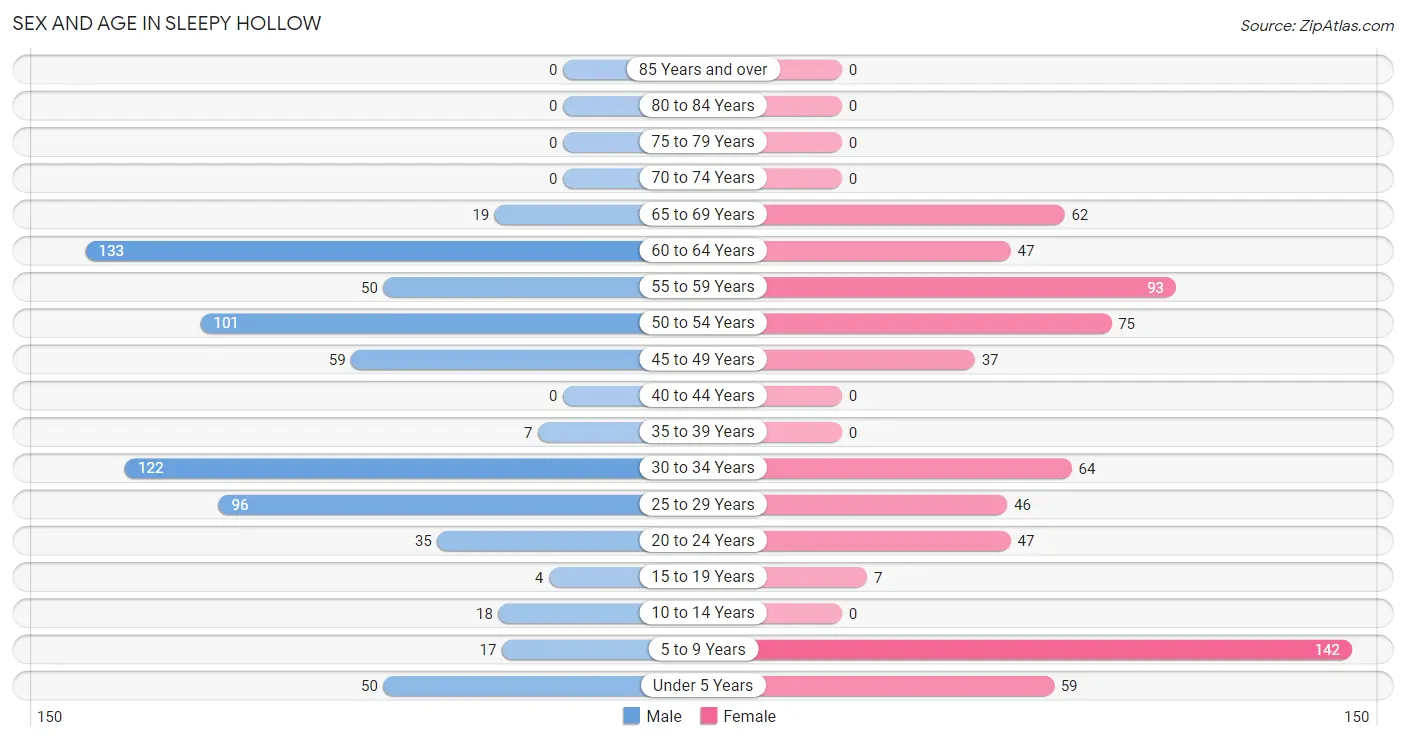
Sex and Age in Sleepy Hollow
Sex and Age in Sleepy Hollow
The most populous age groups in Sleepy Hollow are 60 to 64 Years (133 | 18.7%) for men and 5 to 9 Years (142 | 20.9%) for women.
| Age Bracket | Male | Female |
| Under 5 Years | 50 (7.0%) | 59 (8.7%) |
| 5 to 9 Years | 17 (2.4%) | 142 (20.9%) |
| 10 to 14 Years | 18 (2.5%) | 0 (0.0%) |
| 15 to 19 Years | 4 (0.6%) | 7 (1.0%) |
| 20 to 24 Years | 35 (4.9%) | 47 (6.9%) |
| 25 to 29 Years | 96 (13.5%) | 46 (6.8%) |
| 30 to 34 Years | 122 (17.2%) | 64 (9.4%) |
| 35 to 39 Years | 7 (1.0%) | 0 (0.0%) |
| 40 to 44 Years | 0 (0.0%) | 0 (0.0%) |
| 45 to 49 Years | 59 (8.3%) | 37 (5.4%) |
| 50 to 54 Years | 101 (14.2%) | 75 (11.1%) |
| 55 to 59 Years | 50 (7.0%) | 93 (13.7%) |
| 60 to 64 Years | 133 (18.7%) | 47 (6.9%) |
| 65 to 69 Years | 19 (2.7%) | 62 (9.1%) |
| 70 to 74 Years | 0 (0.0%) | 0 (0.0%) |
| 75 to 79 Years | 0 (0.0%) | 0 (0.0%) |
| 80 to 84 Years | 0 (0.0%) | 0 (0.0%) |
| 85 Years and over | 0 (0.0%) | 0 (0.0%) |
| Total | 711 (100.0%) | 679 (100.0%) |
Families and Households in Sleepy Hollow
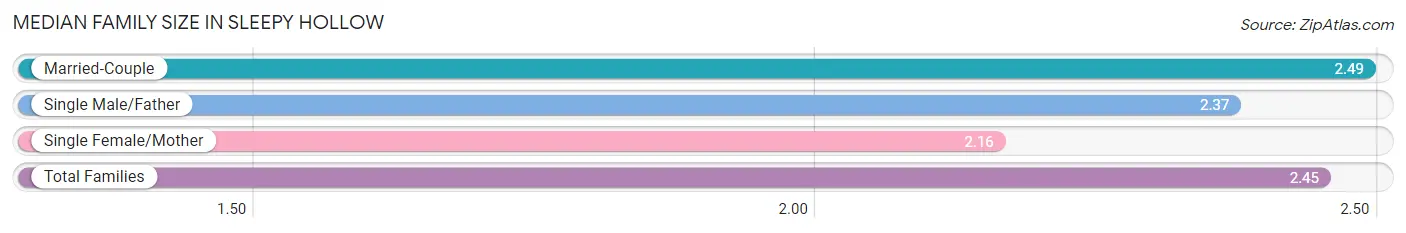
Median Family Size in Sleepy Hollow
The median family size in Sleepy Hollow is 2.45 persons per family, with married-couple families (357 | 74.7%) accounting for the largest median family size of 2.49 persons per family. On the other hand, single female/mother families (19 | 4.0%) represent the smallest median family size with 2.16 persons per family.
| Family Type | # Families | Family Size |
| Married-Couple | 357 (74.7%) | 2.49 |
| Single Male/Father | 102 (21.3%) | 2.37 |
| Single Female/Mother | 19 (4.0%) | 2.16 |
| Total Families | 478 (100.0%) | 2.45 |
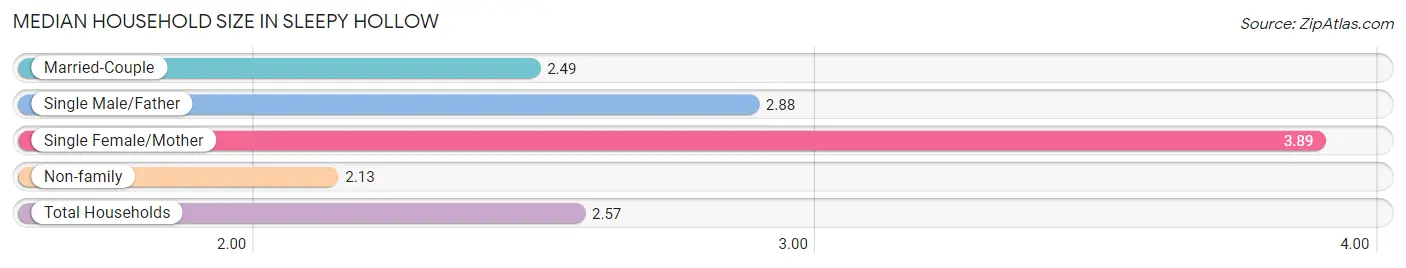
Median Household Size in Sleepy Hollow
The median household size in Sleepy Hollow is 2.57 persons per household, with single female/mother households (19 | 3.5%) accounting for the largest median household size of 3.89 persons per household. non-family households (62 | 11.5%) represent the smallest median household size with 2.13 persons per household.
| Household Type | # Households | Household Size |
| Married-Couple | 357 (66.1%) | 2.49 |
| Single Male/Father | 102 (18.9%) | 2.88 |
| Single Female/Mother | 19 (3.5%) | 3.89 |
| Non-family | 62 (11.5%) | 2.13 |
| Total Households | 540 (100.0%) | 2.57 |
Household Size by Marriage Status in Sleepy Hollow
Out of a total of 540 households in Sleepy Hollow, 478 (88.5%) are family households, while 62 (11.5%) are nonfamily households. The most numerous type of family households are 2-person households, comprising 314, and the most common type of nonfamily households are 2-person households, comprising 62.
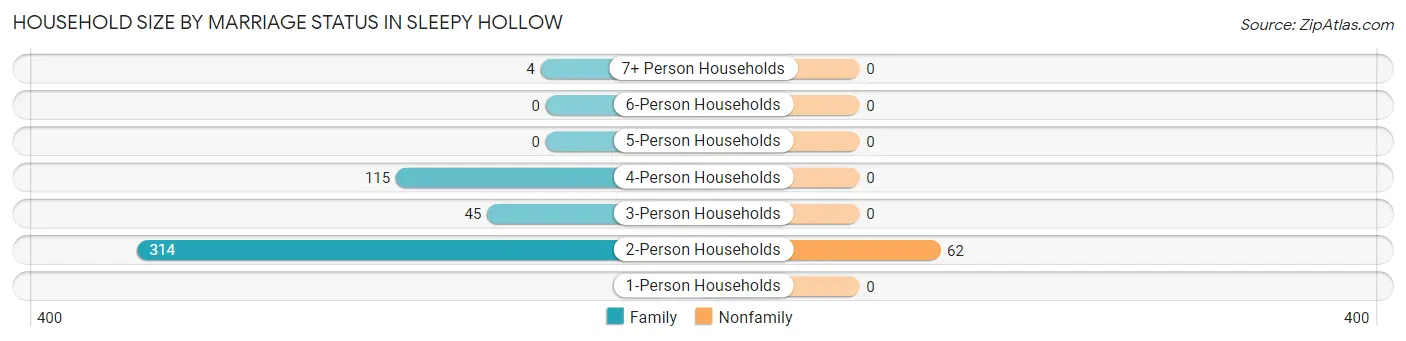
| Household Size | Family Households | Nonfamily Households |
| 1-Person Households | - | 0 (0.0%) |
| 2-Person Households | 314 (58.2%) | 62 (11.5%) |
| 3-Person Households | 45 (8.3%) | 0 (0.0%) |
| 4-Person Households | 115 (21.3%) | 0 (0.0%) |
| 5-Person Households | 0 (0.0%) | 0 (0.0%) |
| 6-Person Households | 0 (0.0%) | 0 (0.0%) |
| 7+ Person Households | 4 (0.7%) | 0 (0.0%) |
| Total | 478 (88.5%) | 62 (11.5%) |
Female Fertility in Sleepy Hollow
Fertility by Age in Sleepy Hollow
Average fertility rate in Sleepy Hollow is 25.0 births per 1,000 women. Women in the age bracket of 20 to 34 years have the highest fertility rate with 45.0 births per 1,000 women. Women in the age bracket of 20 to 34 years acount for 100.0% of all women with births.
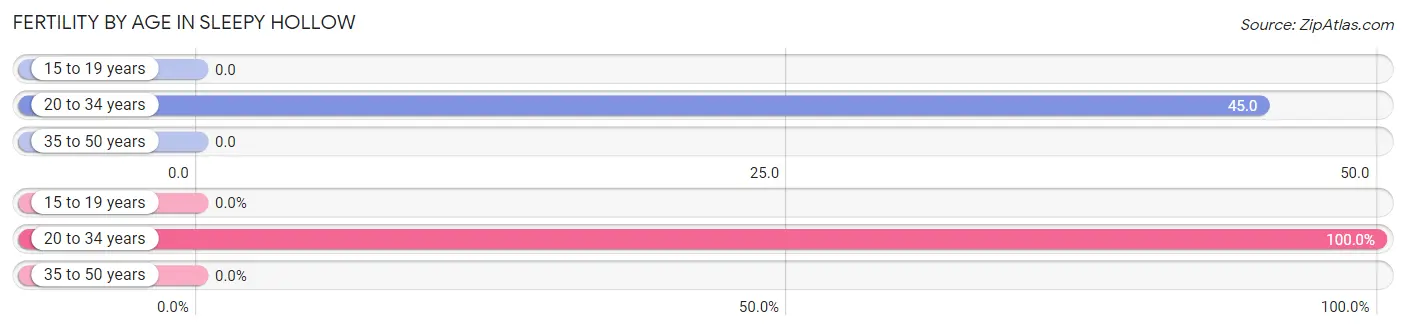
| Age Bracket | Women with Births | Births / 1,000 Women |
| 15 to 19 years | 0 (0.0%) | 0.0 |
| 20 to 34 years | 7 (100.0%) | 45.0 |
| 35 to 50 years | 0 (0.0%) | 0.0 |
| Total | 7 (100.0%) | 25.0 |
Fertility by Age by Marriage Status in Sleepy Hollow
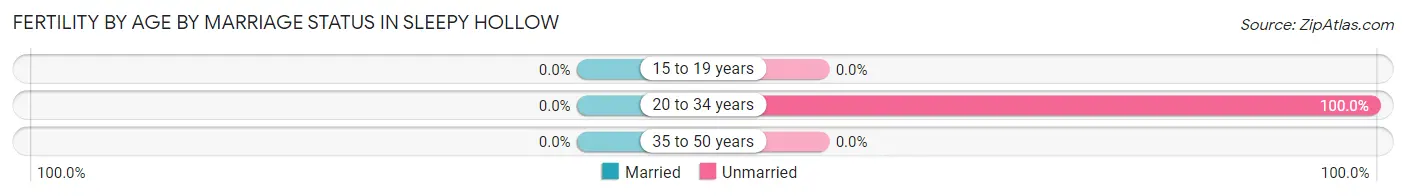
| Age Bracket | Married | Unmarried |
| 15 to 19 years | 0 (0.0%) | 0 (0.0%) |
| 20 to 34 years | 0 (0.0%) | 7 (100.0%) |
| 35 to 50 years | 0 (0.0%) | 0 (0.0%) |
| Total | 0 (0.0%) | 7 (100.0%) |
Fertility by Education in Sleepy Hollow
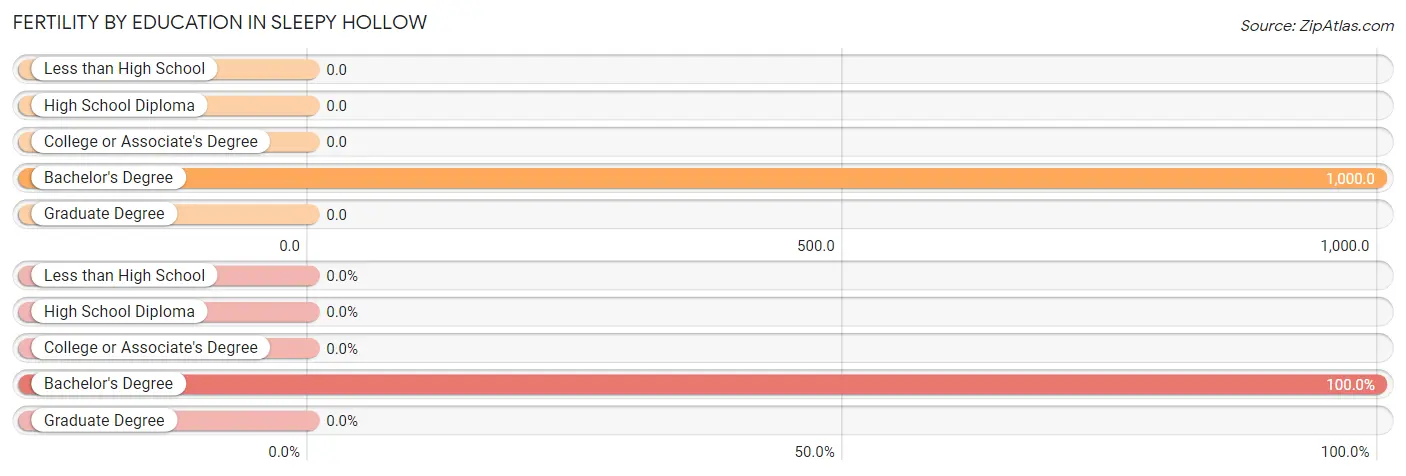
| Educational Attainment | Women with Births | Births / 1,000 Women |
| Less than High School | 0 (0.0%) | 0.0 |
| High School Diploma | 0 (0.0%) | 0.0 |
| College or Associate's Degree | 0 (0.0%) | 0.0 |
| Bachelor's Degree | 7 (100.0%) | 1,000.0 |
| Graduate Degree | 0 (0.0%) | 0.0 |
| Total | 7 (100.0%) | 25.0 |
Fertility by Education by Marriage Status in Sleepy Hollow
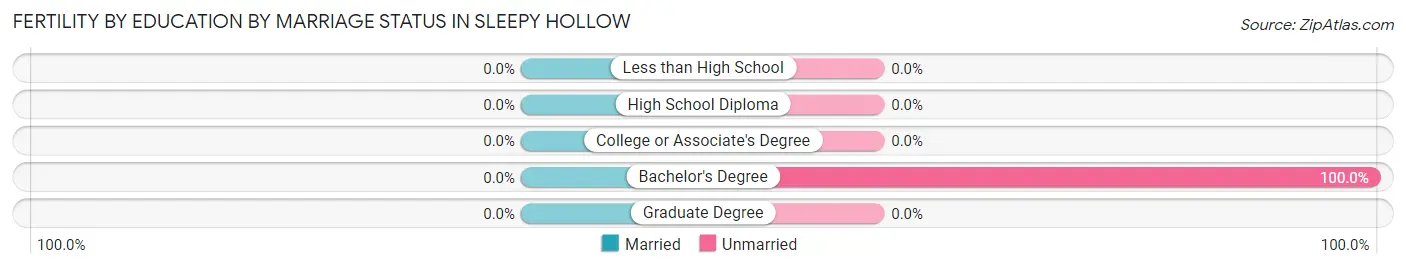
| Educational Attainment | Married | Unmarried |
| Less than High School | 0 (0.0%) | 0 (0.0%) |
| High School Diploma | 0 (0.0%) | 0 (0.0%) |
| College or Associate's Degree | 0 (0.0%) | 0 (0.0%) |
| Bachelor's Degree | 0 (0.0%) | 7 (100.0%) |
| Graduate Degree | 0 (0.0%) | 0 (0.0%) |
| Total | 0 (0.0%) | 7 (100.0%) |
Employment Characteristics in Sleepy Hollow
Employment by Class of Employer in Sleepy Hollow
Among the 917 employed individuals in Sleepy Hollow, private company employees (687 | 74.9%), local government employees (90 | 9.8%), and state government employees (75 | 8.2%) make up the most common classes of employment.
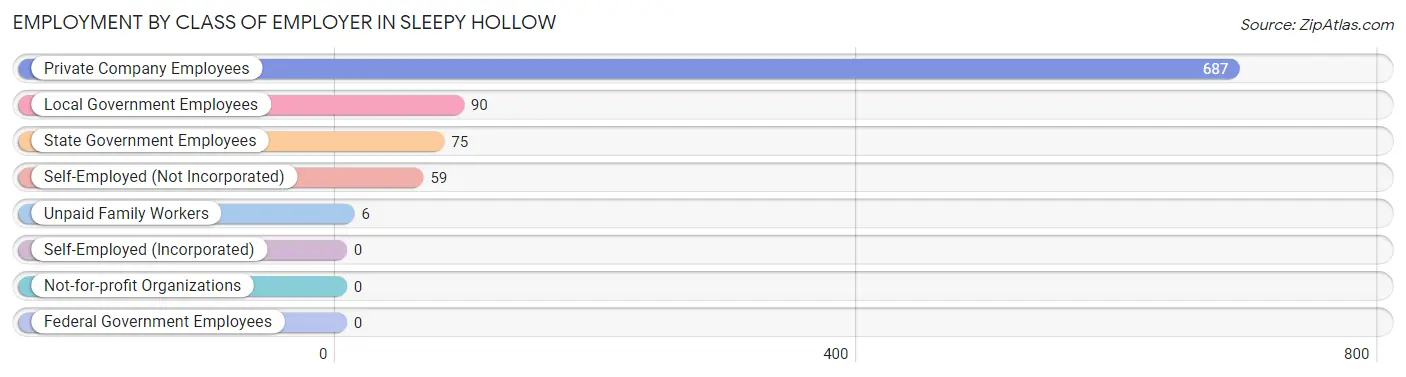
| Employer Class | # Employees | % Employees |
| Private Company Employees | 687 | 74.9% |
| Self-Employed (Incorporated) | 0 | 0.0% |
| Self-Employed (Not Incorporated) | 59 | 6.4% |
| Not-for-profit Organizations | 0 | 0.0% |
| Local Government Employees | 90 | 9.8% |
| State Government Employees | 75 | 8.2% |
| Federal Government Employees | 0 | 0.0% |
| Unpaid Family Workers | 6 | 0.6% |
| Total | 917 | 100.0% |
Employment Status by Age in Sleepy Hollow
According to the labor force statistics for Sleepy Hollow, out of the total population over 16 years of age (1,104), 83.4% or 921 individuals are in the labor force, with 0.4% or 4 of them unemployed. The age group with the highest labor force participation rate is 20 to 24 years, with 100.0% or 82 individuals in the labor force. Within the labor force, the 16 to 19 years age range has the highest percentage of unemployed individuals, with 100.0% or 4 of them being unemployed.
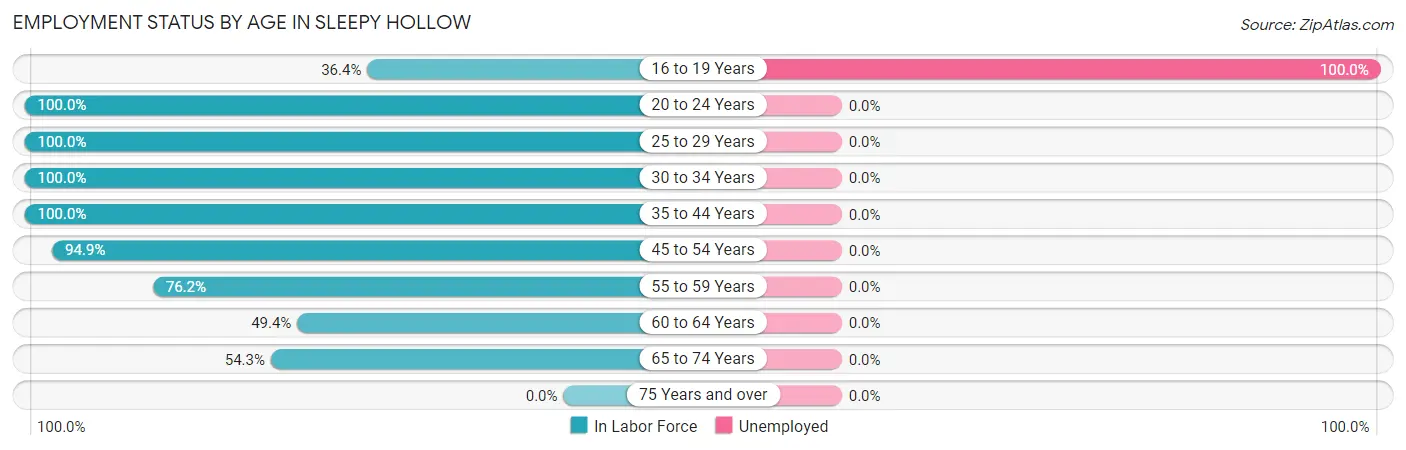
| Age Bracket | In Labor Force | Unemployed |
| 16 to 19 Years | 4 (36.4%) | 4 (100.0%) |
| 20 to 24 Years | 82 (100.0%) | 0 (0.0%) |
| 25 to 29 Years | 142 (100.0%) | 0 (0.0%) |
| 30 to 34 Years | 186 (100.0%) | 0 (0.0%) |
| 35 to 44 Years | 7 (100.0%) | 0 (0.0%) |
| 45 to 54 Years | 258 (94.9%) | 0 (0.0%) |
| 55 to 59 Years | 109 (76.2%) | 0 (0.0%) |
| 60 to 64 Years | 89 (49.4%) | 0 (0.0%) |
| 65 to 74 Years | 44 (54.3%) | 0 (0.0%) |
| 75 Years and over | 0 (0.0%) | 0 (0.0%) |
| Total | 921 (83.4%) | 4 (0.4%) |
Employment Status by Educational Attainment in Sleepy Hollow
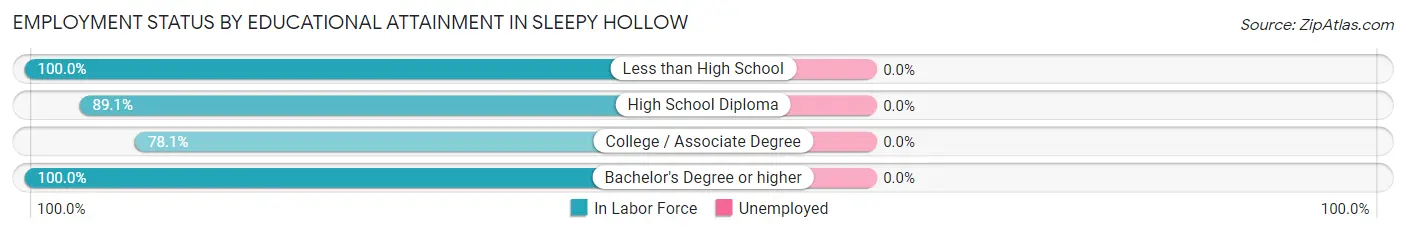
| Educational Attainment | In Labor Force | Unemployed |
| Less than High School | 35 (100.0%) | 0 (0.0%) |
| High School Diploma | 386 (89.1%) | 0 (0.0%) |
| College / Associate Degree | 328 (78.1%) | 0 (0.0%) |
| Bachelor's Degree or higher | 42 (100.0%) | 0 (0.0%) |
| Total | 791 (85.1%) | 0 (0.0%) |
Employment Occupations by Sex in Sleepy Hollow
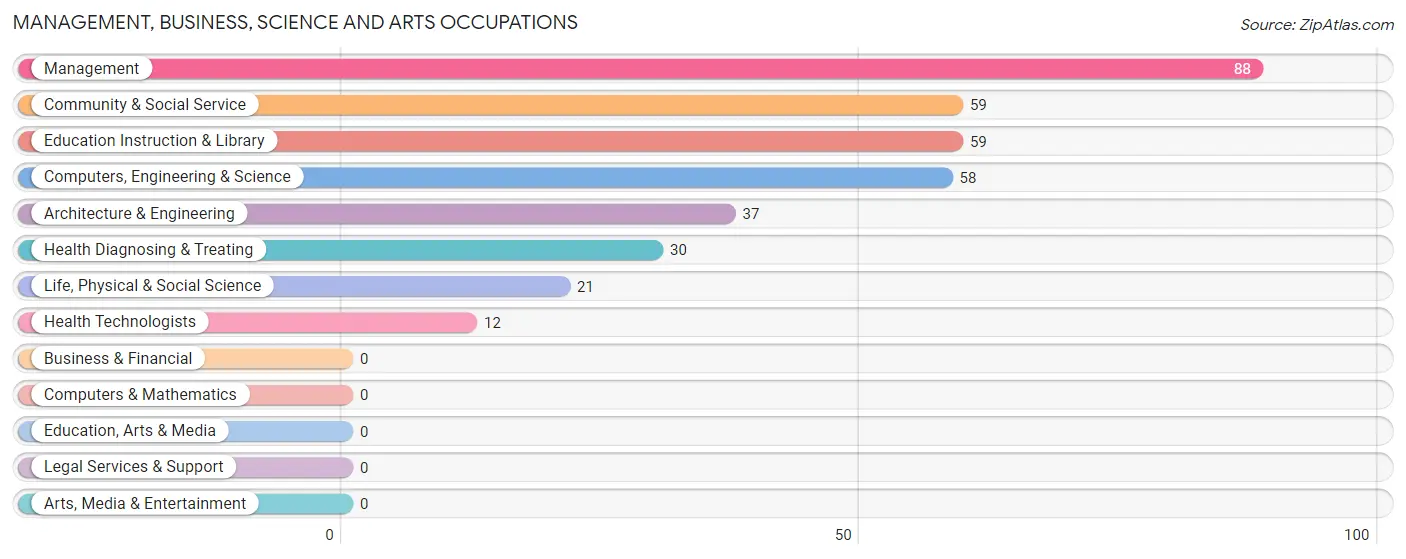
Management, Business, Science and Arts Occupations
The most common Management, Business, Science and Arts occupations in Sleepy Hollow are Management (88 | 9.6%), Community & Social Service (59 | 6.4%), Education Instruction & Library (59 | 6.4%), Computers, Engineering & Science (58 | 6.3%), and Architecture & Engineering (37 | 4.0%).
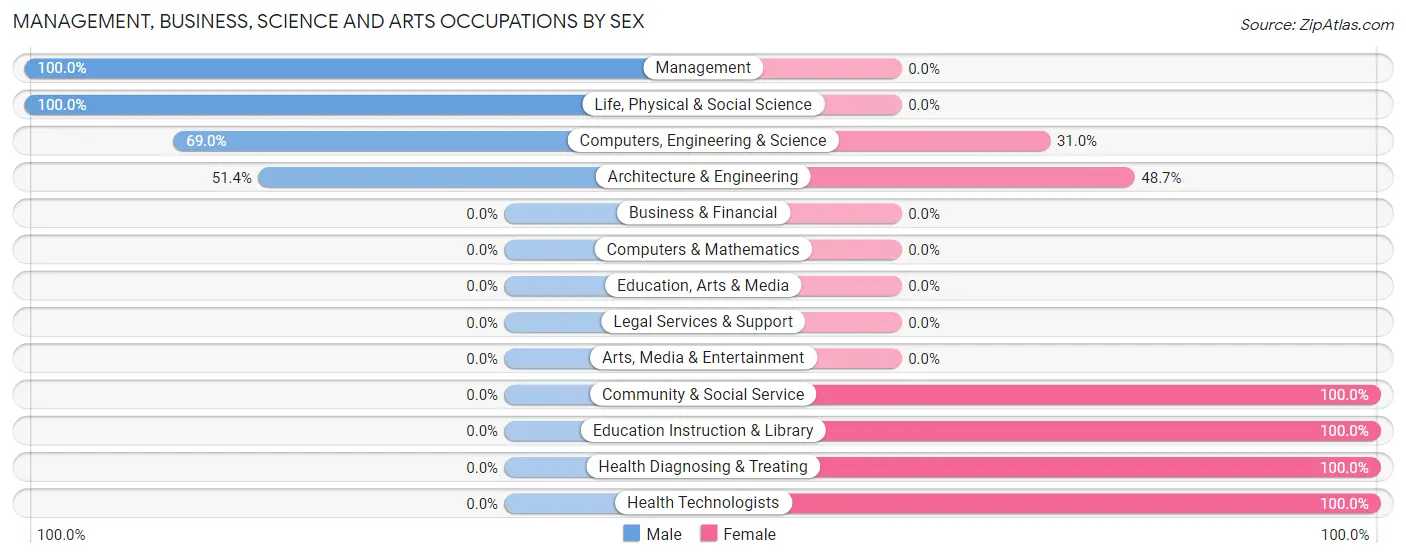
Management, Business, Science and Arts Occupations by Sex
Within the Management, Business, Science and Arts occupations in Sleepy Hollow, the most male-oriented occupations are Management (100.0%), Life, Physical & Social Science (100.0%), and Computers, Engineering & Science (69.0%), while the most female-oriented occupations are Community & Social Service (100.0%), Education Instruction & Library (100.0%), and Health Diagnosing & Treating (100.0%).
| Occupation | Male | Female |
| Management | 88 (100.0%) | 0 (0.0%) |
| Business & Financial | 0 (0.0%) | 0 (0.0%) |
| Computers, Engineering & Science | 40 (69.0%) | 18 (31.0%) |
| Computers & Mathematics | 0 (0.0%) | 0 (0.0%) |
| Architecture & Engineering | 19 (51.3%) | 18 (48.6%) |
| Life, Physical & Social Science | 21 (100.0%) | 0 (0.0%) |
| Community & Social Service | 0 (0.0%) | 59 (100.0%) |
| Education, Arts & Media | 0 (0.0%) | 0 (0.0%) |
| Legal Services & Support | 0 (0.0%) | 0 (0.0%) |
| Education Instruction & Library | 0 (0.0%) | 59 (100.0%) |
| Arts, Media & Entertainment | 0 (0.0%) | 0 (0.0%) |
| Health Diagnosing & Treating | 0 (0.0%) | 30 (100.0%) |
| Health Technologists | 0 (0.0%) | 12 (100.0%) |
| Total (Category) | 128 (54.5%) | 107 (45.5%) |
| Total (Overall) | 559 (61.0%) | 358 (39.0%) |
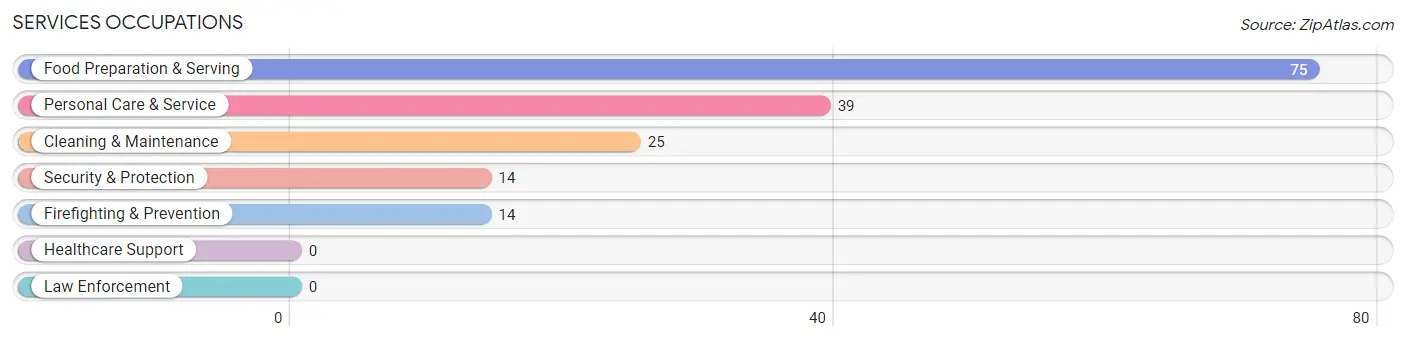
Services Occupations
The most common Services occupations in Sleepy Hollow are Food Preparation & Serving (75 | 8.2%), Personal Care & Service (39 | 4.3%), Cleaning & Maintenance (25 | 2.7%), Security & Protection (14 | 1.5%), and Firefighting & Prevention (14 | 1.5%).
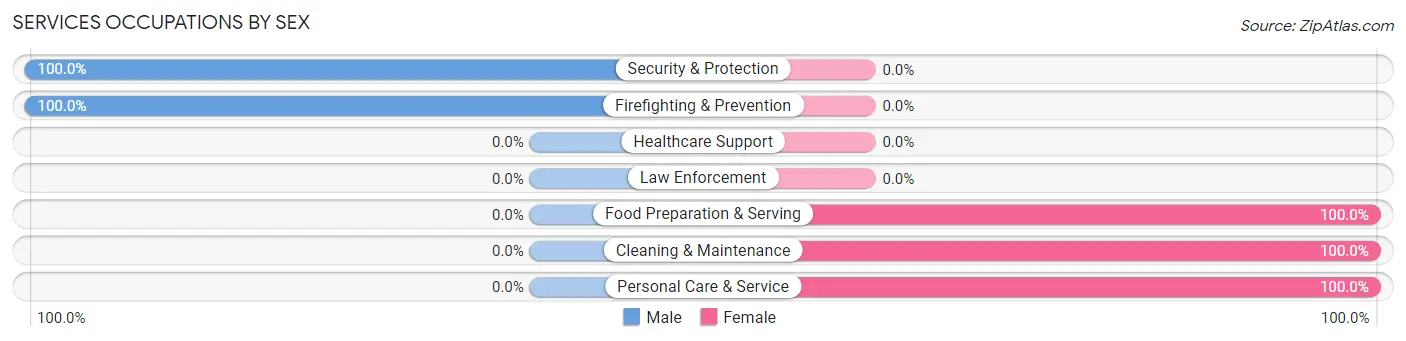
Services Occupations by Sex
Within the Services occupations in Sleepy Hollow, the most male-oriented occupations are Security & Protection (100.0%), and Firefighting & Prevention (100.0%), while the most female-oriented occupations are Food Preparation & Serving (100.0%), Cleaning & Maintenance (100.0%), and Personal Care & Service (100.0%).
| Occupation | Male | Female |
| Healthcare Support | 0 (0.0%) | 0 (0.0%) |
| Security & Protection | 14 (100.0%) | 0 (0.0%) |
| Firefighting & Prevention | 14 (100.0%) | 0 (0.0%) |
| Law Enforcement | 0 (0.0%) | 0 (0.0%) |
| Food Preparation & Serving | 0 (0.0%) | 75 (100.0%) |
| Cleaning & Maintenance | 0 (0.0%) | 25 (100.0%) |
| Personal Care & Service | 0 (0.0%) | 39 (100.0%) |
| Total (Category) | 14 (9.1%) | 139 (90.8%) |
| Total (Overall) | 559 (61.0%) | 358 (39.0%) |
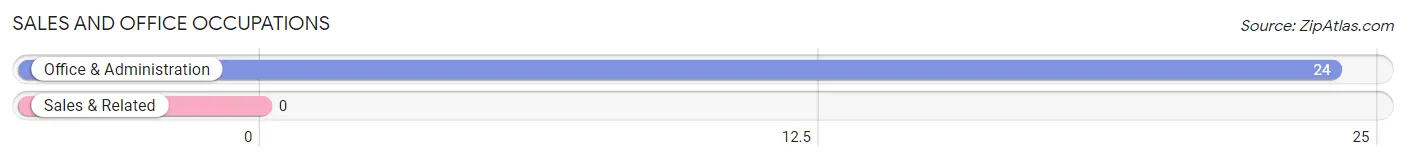
Sales and Office Occupations
The most common Sales and Office occupations in Sleepy Hollow are , and Office & Administration (24 | 2.6%).
Sales and Office Occupations by Sex
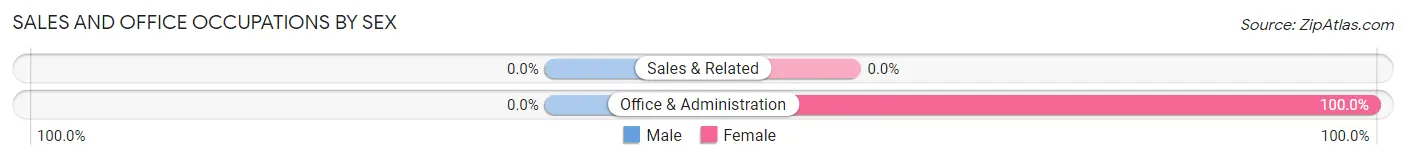
| Occupation | Male | Female |
| Sales & Related | 0 (0.0%) | 0 (0.0%) |
| Office & Administration | 0 (0.0%) | 24 (100.0%) |
| Total (Category) | 0 (0.0%) | 24 (100.0%) |
| Total (Overall) | 559 (61.0%) | 358 (39.0%) |
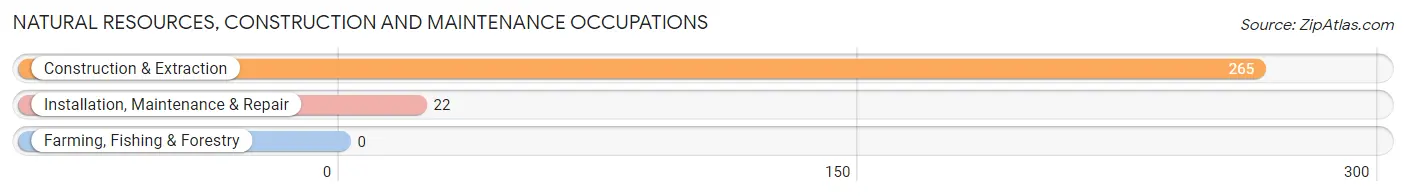
Natural Resources, Construction and Maintenance Occupations
The most common Natural Resources, Construction and Maintenance occupations in Sleepy Hollow are Construction & Extraction (265 | 28.9%), and Installation, Maintenance & Repair (22 | 2.4%).
Natural Resources, Construction and Maintenance Occupations by Sex
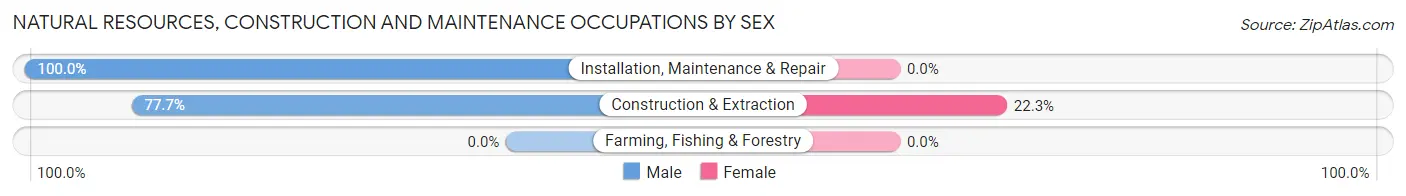
| Occupation | Male | Female |
| Farming, Fishing & Forestry | 0 (0.0%) | 0 (0.0%) |
| Construction & Extraction | 206 (77.7%) | 59 (22.3%) |
| Installation, Maintenance & Repair | 22 (100.0%) | 0 (0.0%) |
| Total (Category) | 228 (79.4%) | 59 (20.6%) |
| Total (Overall) | 559 (61.0%) | 358 (39.0%) |
Production, Transportation and Moving Occupations
The most common Production, Transportation and Moving occupations in Sleepy Hollow are Material Moving (207 | 22.6%), and Transportation (11 | 1.2%).
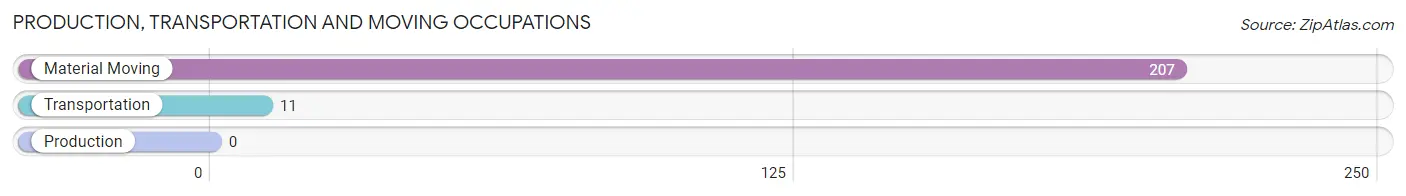
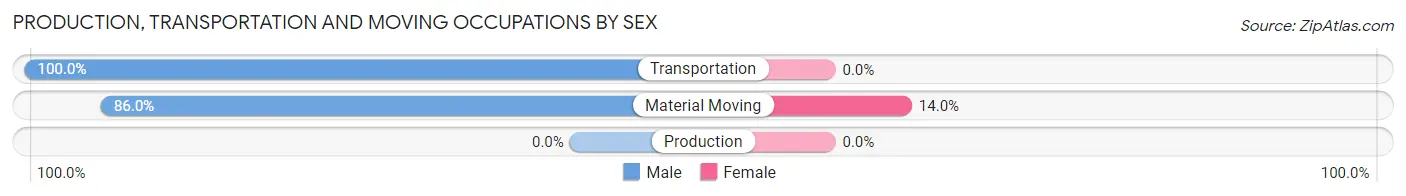
Production, Transportation and Moving Occupations by Sex
| Occupation | Male | Female |
| Production | 0 (0.0%) | 0 (0.0%) |
| Transportation | 11 (100.0%) | 0 (0.0%) |
| Material Moving | 178 (86.0%) | 29 (14.0%) |
| Total (Category) | 189 (86.7%) | 29 (13.3%) |
| Total (Overall) | 559 (61.0%) | 358 (39.0%) |
Employment Industries by Sex in Sleepy Hollow
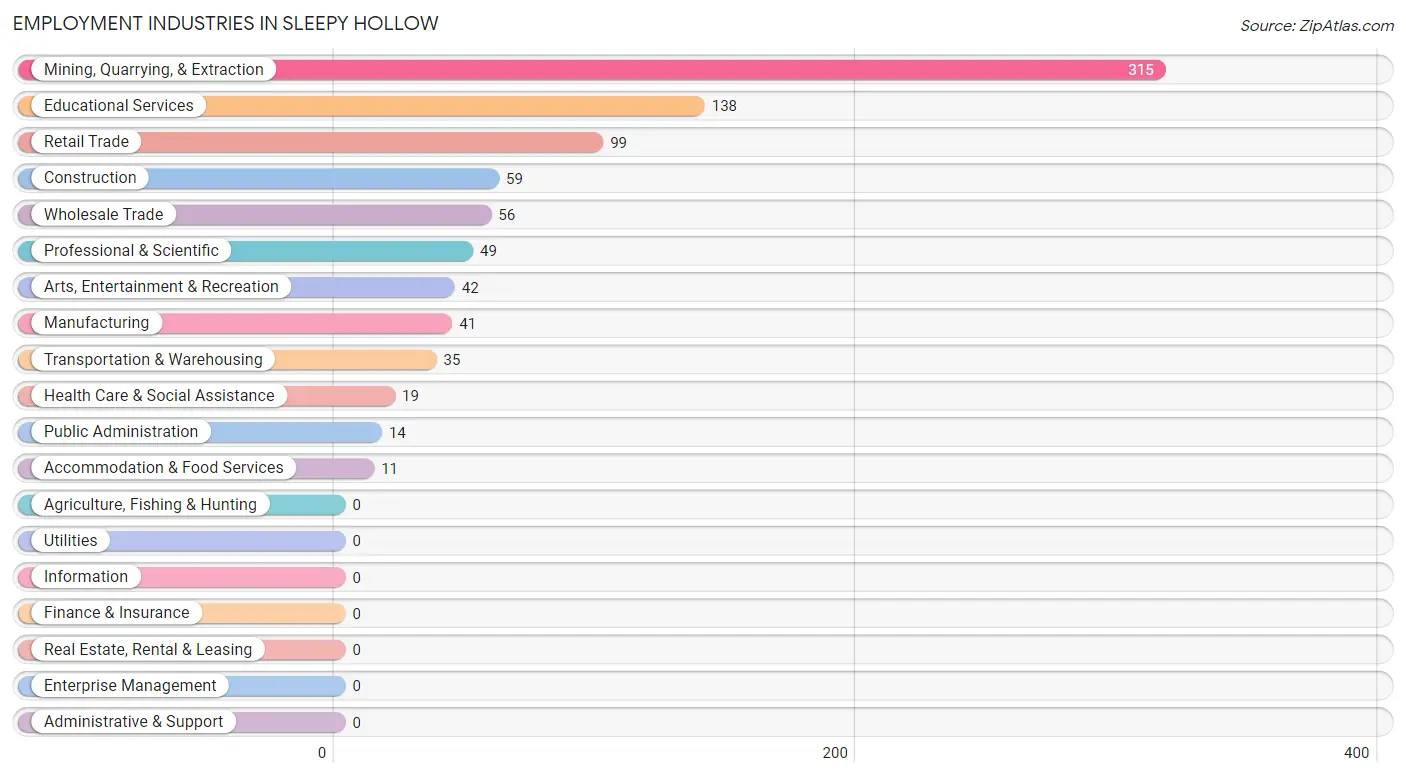
Employment Industries in Sleepy Hollow
The major employment industries in Sleepy Hollow include Mining, Quarrying, & Extraction (315 | 34.4%), Educational Services (138 | 15.0%), Retail Trade (99 | 10.8%), Construction (59 | 6.4%), and Wholesale Trade (56 | 6.1%).
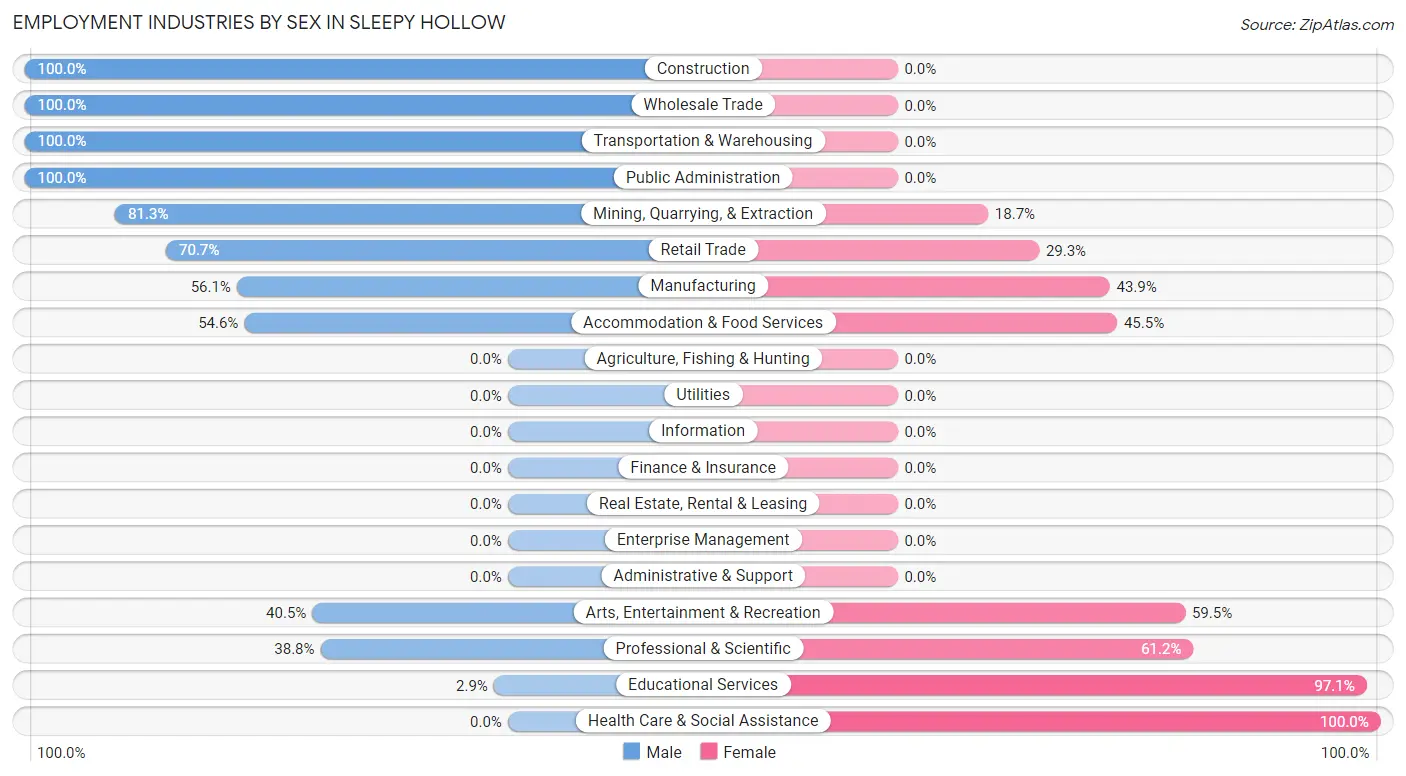
Employment Industries by Sex in Sleepy Hollow
The Sleepy Hollow industries that see more men than women are Construction (100.0%), Wholesale Trade (100.0%), and Transportation & Warehousing (100.0%), whereas the industries that tend to have a higher number of women are Health Care & Social Assistance (100.0%), Educational Services (97.1%), and Professional & Scientific (61.2%).
| Industry | Male | Female |
| Agriculture, Fishing & Hunting | 0 (0.0%) | 0 (0.0%) |
| Mining, Quarrying, & Extraction | 256 (81.3%) | 59 (18.7%) |
| Construction | 59 (100.0%) | 0 (0.0%) |
| Manufacturing | 23 (56.1%) | 18 (43.9%) |
| Wholesale Trade | 56 (100.0%) | 0 (0.0%) |
| Retail Trade | 70 (70.7%) | 29 (29.3%) |
| Transportation & Warehousing | 35 (100.0%) | 0 (0.0%) |
| Utilities | 0 (0.0%) | 0 (0.0%) |
| Information | 0 (0.0%) | 0 (0.0%) |
| Finance & Insurance | 0 (0.0%) | 0 (0.0%) |
| Real Estate, Rental & Leasing | 0 (0.0%) | 0 (0.0%) |
| Professional & Scientific | 19 (38.8%) | 30 (61.2%) |
| Enterprise Management | 0 (0.0%) | 0 (0.0%) |
| Administrative & Support | 0 (0.0%) | 0 (0.0%) |
| Educational Services | 4 (2.9%) | 134 (97.1%) |
| Health Care & Social Assistance | 0 (0.0%) | 19 (100.0%) |
| Arts, Entertainment & Recreation | 17 (40.5%) | 25 (59.5%) |
| Accommodation & Food Services | 6 (54.5%) | 5 (45.5%) |
| Public Administration | 14 (100.0%) | 0 (0.0%) |
| Total | 559 (61.0%) | 358 (39.0%) |
Education in Sleepy Hollow
School Enrollment in Sleepy Hollow
The most common levels of schooling among the 345 students in Sleepy Hollow are elementary school (159 | 46.1%), nursery / preschool (104 | 30.1%), and college / undergraduate (53 | 15.4%).
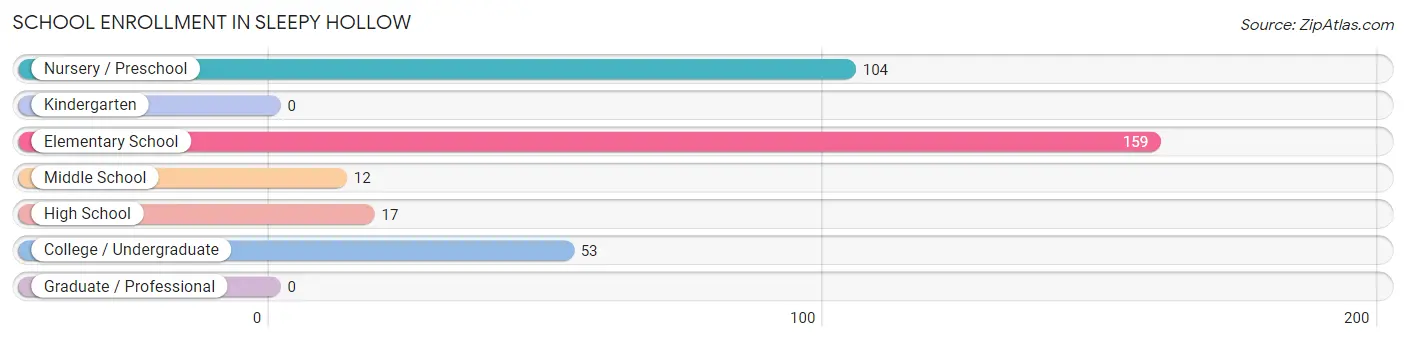
| School Level | # Students | % Students |
| Nursery / Preschool | 104 | 30.1% |
| Kindergarten | 0 | 0.0% |
| Elementary School | 159 | 46.1% |
| Middle School | 12 | 3.5% |
| High School | 17 | 4.9% |
| College / Undergraduate | 53 | 15.4% |
| Graduate / Professional | 0 | 0.0% |
| Total | 345 | 100.0% |
School Enrollment by Age by Funding Source in Sleepy Hollow
Out of a total of 345 students who are enrolled in schools in Sleepy Hollow, 24 (7.0%) attend a private institution, while the remaining 321 (93.0%) are enrolled in public schools. The age group of 20 to 24 year olds has the highest likelihood of being enrolled in private schools, with 24 (45.3% in the age bracket) enrolled. Conversely, the age group of 3 to 4 year olds has the lowest likelihood of being enrolled in a private school, with 104 (100.0% in the age bracket) attending a public institution.
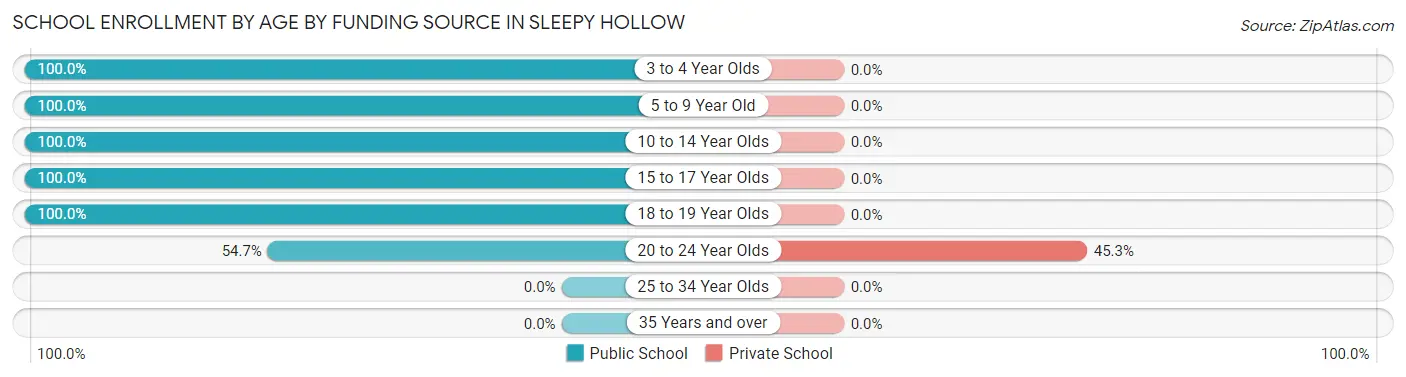
| Age Bracket | Public School | Private School |
| 3 to 4 Year Olds | 104 (100.0%) | 0 (0.0%) |
| 5 to 9 Year Old | 159 (100.0%) | 0 (0.0%) |
| 10 to 14 Year Olds | 18 (100.0%) | 0 (0.0%) |
| 15 to 17 Year Olds | 7 (100.0%) | 0 (0.0%) |
| 18 to 19 Year Olds | 4 (100.0%) | 0 (0.0%) |
| 20 to 24 Year Olds | 29 (54.7%) | 24 (45.3%) |
| 25 to 34 Year Olds | 0 (0.0%) | 0 (0.0%) |
| 35 Years and over | 0 (0.0%) | 0 (0.0%) |
| Total | 321 (93.0%) | 24 (7.0%) |
Educational Attainment by Field of Study in Sleepy Hollow
Engineering (19 | 24.0%), business (19 | 24.0%), education (18 | 22.8%), science & technology (12 | 15.2%), and bio, nature & agricultural (7 | 8.9%) are the most common fields of study among 79 individuals in Sleepy Hollow who have obtained a bachelor's degree or higher.
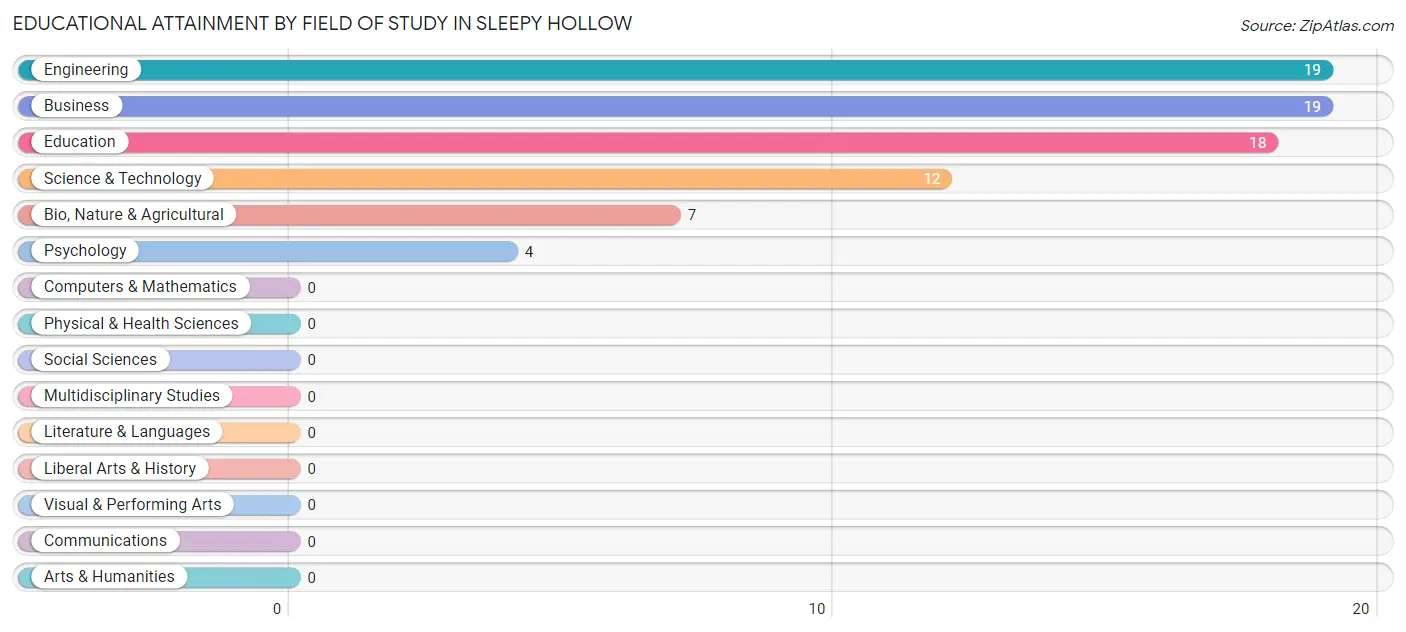
| Field of Study | # Graduates | % Graduates |
| Computers & Mathematics | 0 | 0.0% |
| Bio, Nature & Agricultural | 7 | 8.9% |
| Physical & Health Sciences | 0 | 0.0% |
| Psychology | 4 | 5.1% |
| Social Sciences | 0 | 0.0% |
| Engineering | 19 | 24.0% |
| Multidisciplinary Studies | 0 | 0.0% |
| Science & Technology | 12 | 15.2% |
| Business | 19 | 24.0% |
| Education | 18 | 22.8% |
| Literature & Languages | 0 | 0.0% |
| Liberal Arts & History | 0 | 0.0% |
| Visual & Performing Arts | 0 | 0.0% |
| Communications | 0 | 0.0% |
| Arts & Humanities | 0 | 0.0% |
| Total | 79 | 100.0% |
Transportation & Commute in Sleepy Hollow
Vehicle Availability by Sex in Sleepy Hollow
The most prevalent vehicle ownership categories in Sleepy Hollow are males with 2 vehicles (288, accounting for 51.5%) and females with 2 vehicles (202, making up 80.4%).
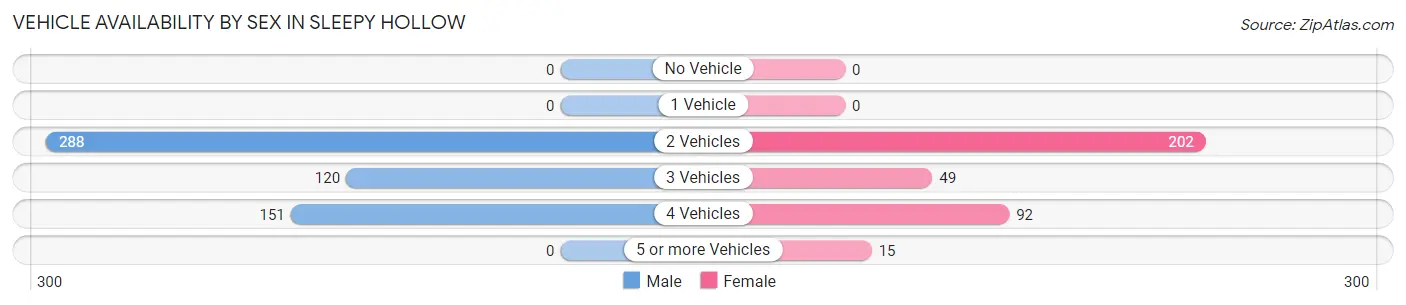
| Vehicles Available | Male | Female |
| No Vehicle | 0 (0.0%) | 0 (0.0%) |
| 1 Vehicle | 0 (0.0%) | 0 (0.0%) |
| 2 Vehicles | 288 (51.5%) | 202 (56.4%) |
| 3 Vehicles | 120 (21.5%) | 49 (13.7%) |
| 4 Vehicles | 151 (27.0%) | 92 (25.7%) |
| 5 or more Vehicles | 0 (0.0%) | 15 (4.2%) |
| Total | 559 (100.0%) | 358 (100.0%) |
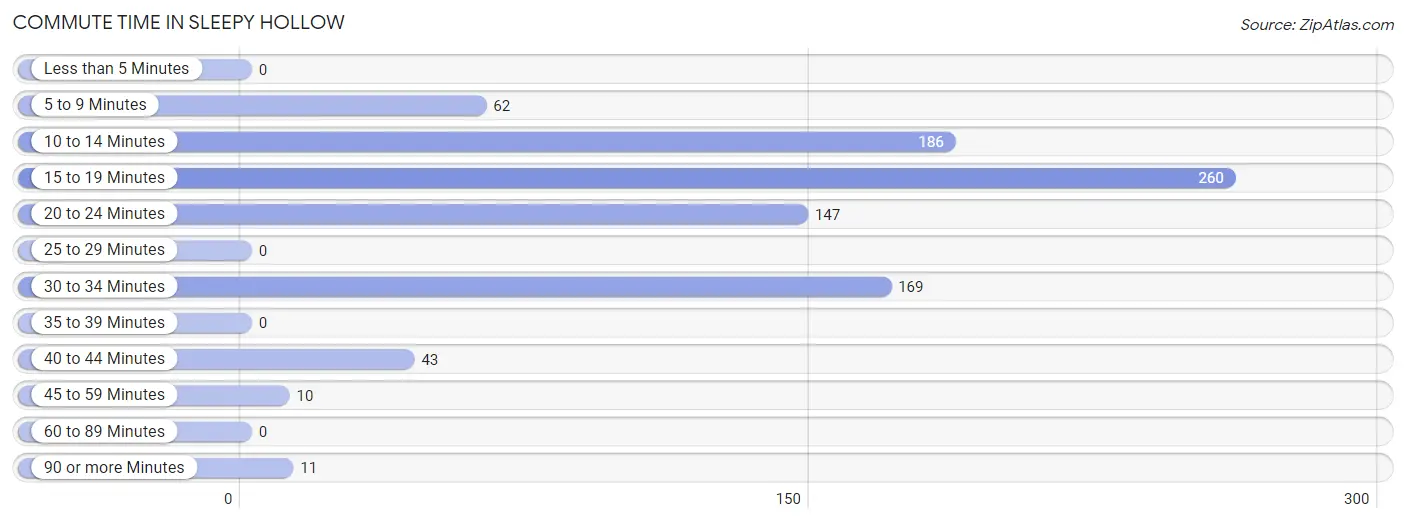
Commute Time in Sleepy Hollow
The most frequently occuring commute durations in Sleepy Hollow are 15 to 19 minutes (260 commuters, 29.3%), 10 to 14 minutes (186 commuters, 20.9%), and 30 to 34 minutes (169 commuters, 19.0%).
| Commute Time | # Commuters | % Commuters |
| Less than 5 Minutes | 0 | 0.0% |
| 5 to 9 Minutes | 62 | 7.0% |
| 10 to 14 Minutes | 186 | 20.9% |
| 15 to 19 Minutes | 260 | 29.3% |
| 20 to 24 Minutes | 147 | 16.6% |
| 25 to 29 Minutes | 0 | 0.0% |
| 30 to 34 Minutes | 169 | 19.0% |
| 35 to 39 Minutes | 0 | 0.0% |
| 40 to 44 Minutes | 43 | 4.8% |
| 45 to 59 Minutes | 10 | 1.1% |
| 60 to 89 Minutes | 0 | 0.0% |
| 90 or more Minutes | 11 | 1.2% |
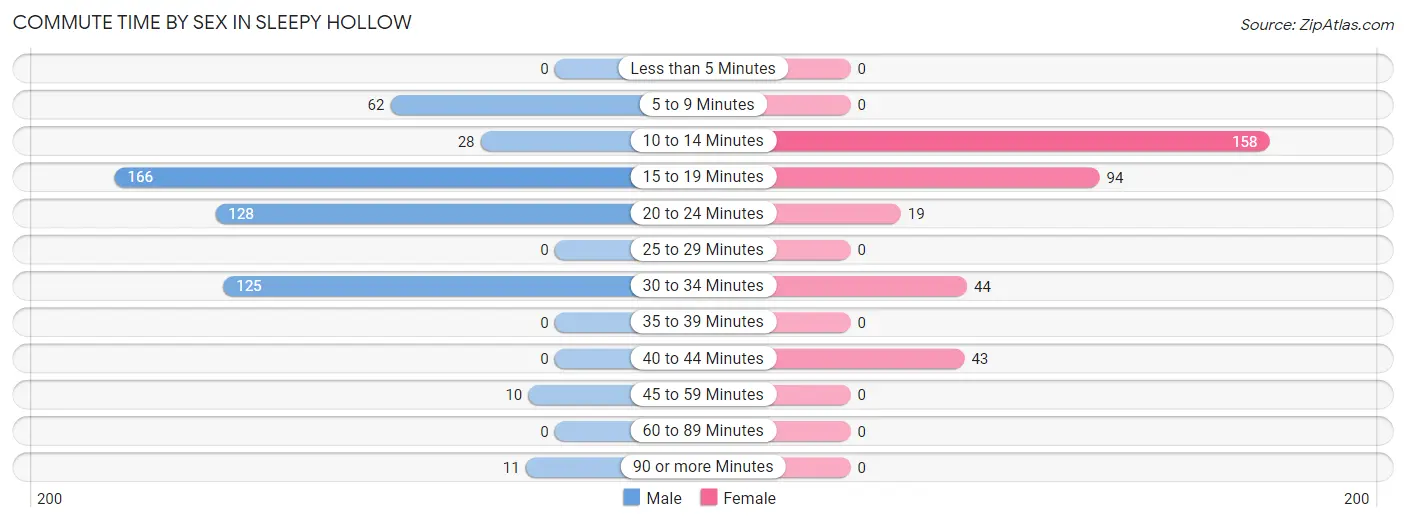
Commute Time by Sex in Sleepy Hollow
The most common commute times in Sleepy Hollow are 15 to 19 minutes (166 commuters, 31.3%) for males and 10 to 14 minutes (158 commuters, 44.1%) for females.
| Commute Time | Male | Female |
| Less than 5 Minutes | 0 (0.0%) | 0 (0.0%) |
| 5 to 9 Minutes | 62 (11.7%) | 0 (0.0%) |
| 10 to 14 Minutes | 28 (5.3%) | 158 (44.1%) |
| 15 to 19 Minutes | 166 (31.3%) | 94 (26.3%) |
| 20 to 24 Minutes | 128 (24.1%) | 19 (5.3%) |
| 25 to 29 Minutes | 0 (0.0%) | 0 (0.0%) |
| 30 to 34 Minutes | 125 (23.6%) | 44 (12.3%) |
| 35 to 39 Minutes | 0 (0.0%) | 0 (0.0%) |
| 40 to 44 Minutes | 0 (0.0%) | 43 (12.0%) |
| 45 to 59 Minutes | 10 (1.9%) | 0 (0.0%) |
| 60 to 89 Minutes | 0 (0.0%) | 0 (0.0%) |
| 90 or more Minutes | 11 (2.1%) | 0 (0.0%) |
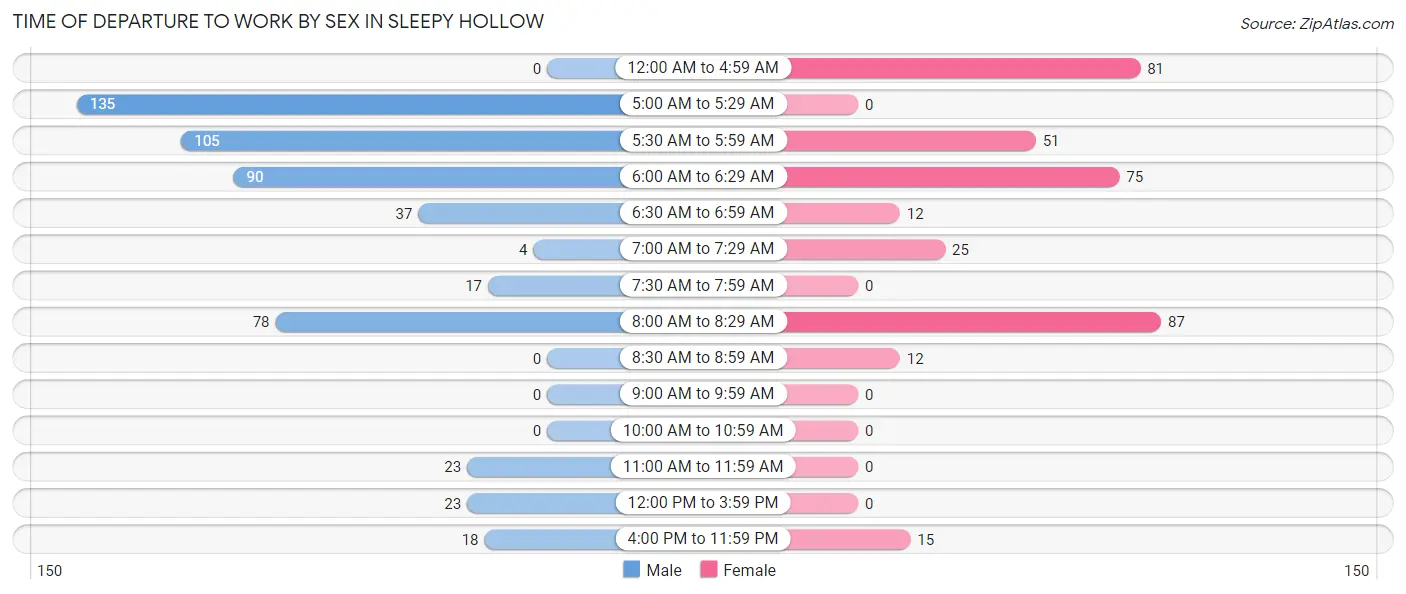
Time of Departure to Work by Sex in Sleepy Hollow
The most frequent times of departure to work in Sleepy Hollow are 5:00 AM to 5:29 AM (135, 25.5%) for males and 8:00 AM to 8:29 AM (87, 24.3%) for females.
| Time of Departure | Male | Female |
| 12:00 AM to 4:59 AM | 0 (0.0%) | 81 (22.6%) |
| 5:00 AM to 5:29 AM | 135 (25.5%) | 0 (0.0%) |
| 5:30 AM to 5:59 AM | 105 (19.8%) | 51 (14.2%) |
| 6:00 AM to 6:29 AM | 90 (17.0%) | 75 (20.9%) |
| 6:30 AM to 6:59 AM | 37 (7.0%) | 12 (3.4%) |
| 7:00 AM to 7:29 AM | 4 (0.7%) | 25 (7.0%) |
| 7:30 AM to 7:59 AM | 17 (3.2%) | 0 (0.0%) |
| 8:00 AM to 8:29 AM | 78 (14.7%) | 87 (24.3%) |
| 8:30 AM to 8:59 AM | 0 (0.0%) | 12 (3.4%) |
| 9:00 AM to 9:59 AM | 0 (0.0%) | 0 (0.0%) |
| 10:00 AM to 10:59 AM | 0 (0.0%) | 0 (0.0%) |
| 11:00 AM to 11:59 AM | 23 (4.3%) | 0 (0.0%) |
| 12:00 PM to 3:59 PM | 23 (4.3%) | 0 (0.0%) |
| 4:00 PM to 11:59 PM | 18 (3.4%) | 15 (4.2%) |
| Total | 530 (100.0%) | 358 (100.0%) |
Housing Occupancy in Sleepy Hollow
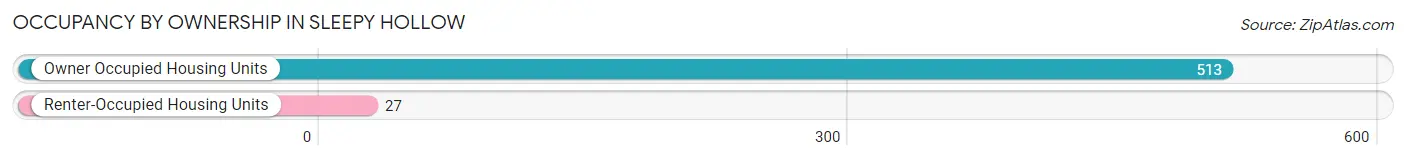
Occupancy by Ownership in Sleepy Hollow
Of the total 540 dwellings in Sleepy Hollow, owner-occupied units account for 513 (95.0%), while renter-occupied units make up 27 (5.0%).
| Occupancy | # Housing Units | % Housing Units |
| Owner Occupied Housing Units | 513 | 95.0% |
| Renter-Occupied Housing Units | 27 | 5.0% |
| Total Occupied Housing Units | 540 | 100.0% |
Occupancy by Household Size in Sleepy Hollow
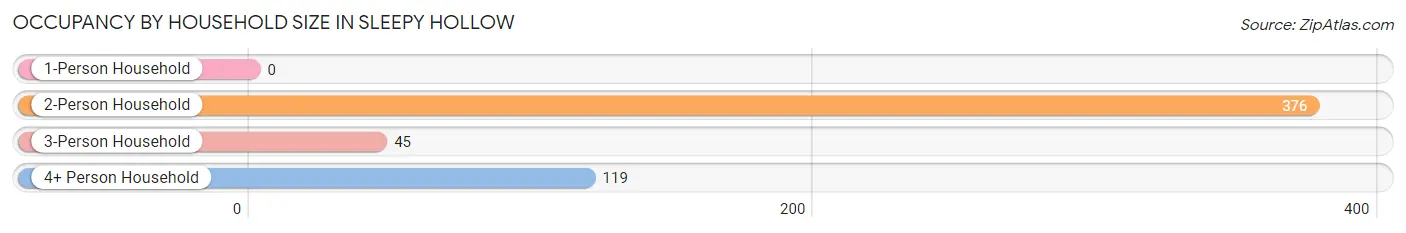
| Household Size | # Housing Units | % Housing Units |
| 1-Person Household | 0 | 0.0% |
| 2-Person Household | 376 | 69.6% |
| 3-Person Household | 45 | 8.3% |
| 4+ Person Household | 119 | 22.0% |
| Total Housing Units | 540 | 100.0% |
Occupancy by Ownership by Household Size in Sleepy Hollow
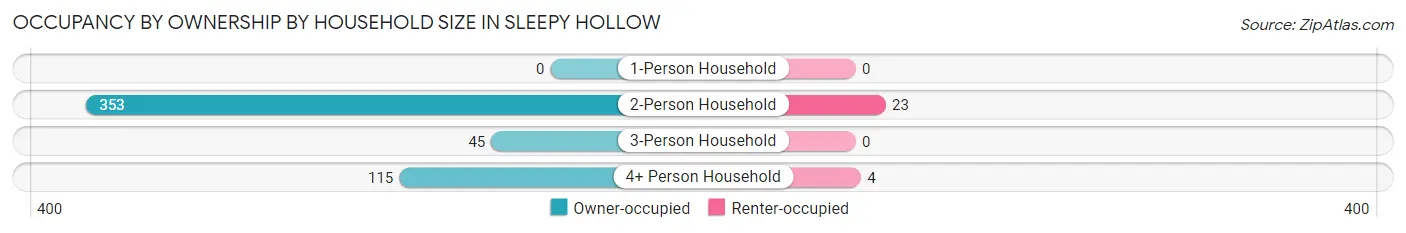
| Household Size | Owner-occupied | Renter-occupied |
| 1-Person Household | 0 (0.0%) | 0 (0.0%) |
| 2-Person Household | 353 (93.9%) | 23 (6.1%) |
| 3-Person Household | 45 (100.0%) | 0 (0.0%) |
| 4+ Person Household | 115 (96.6%) | 4 (3.4%) |
| Total Housing Units | 513 (95.0%) | 27 (5.0%) |
Occupancy by Educational Attainment in Sleepy Hollow
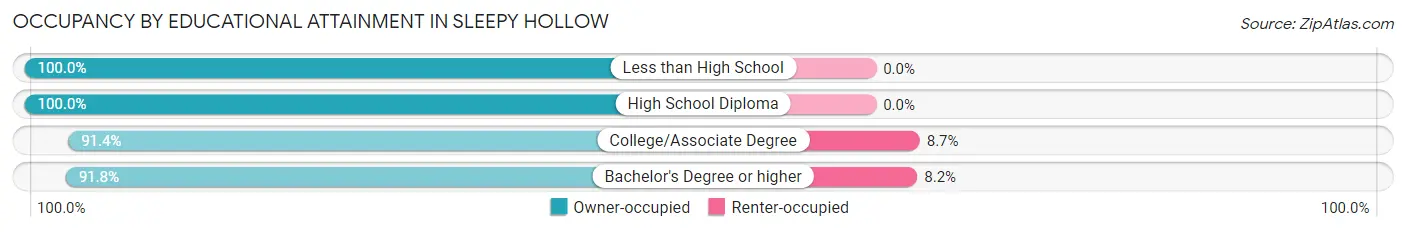
| Household Size | Owner-occupied | Renter-occupied |
| Less than High School | 12 (100.0%) | 0 (0.0%) |
| High School Diploma | 213 (100.0%) | 0 (0.0%) |
| College/Associate Degree | 243 (91.3%) | 23 (8.6%) |
| Bachelor's Degree or higher | 45 (91.8%) | 4 (8.2%) |
Occupancy by Age of Householder in Sleepy Hollow
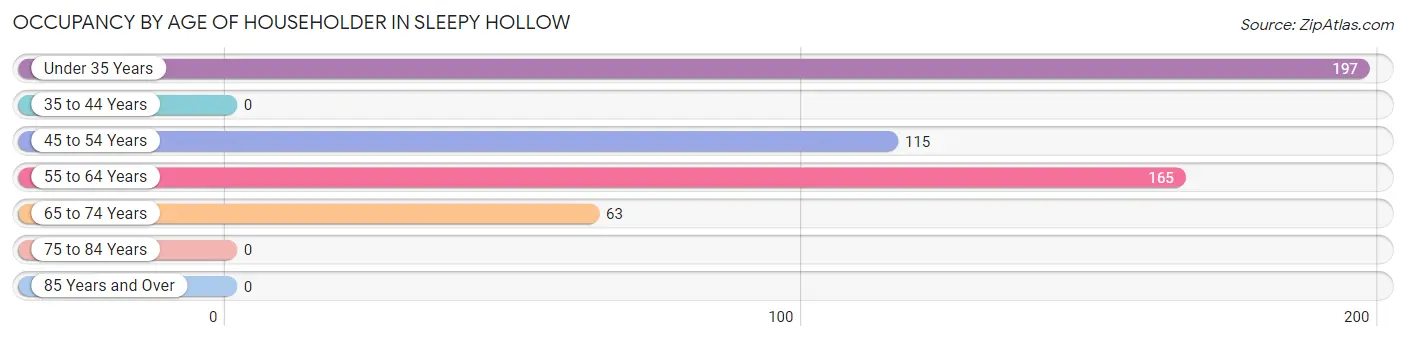
| Age Bracket | # Households | % Households |
| Under 35 Years | 197 | 36.5% |
| 35 to 44 Years | 0 | 0.0% |
| 45 to 54 Years | 115 | 21.3% |
| 55 to 64 Years | 165 | 30.6% |
| 65 to 74 Years | 63 | 11.7% |
| 75 to 84 Years | 0 | 0.0% |
| 85 Years and Over | 0 | 0.0% |
| Total | 540 | 100.0% |
Housing Finances in Sleepy Hollow
Median Income by Occupancy in Sleepy Hollow
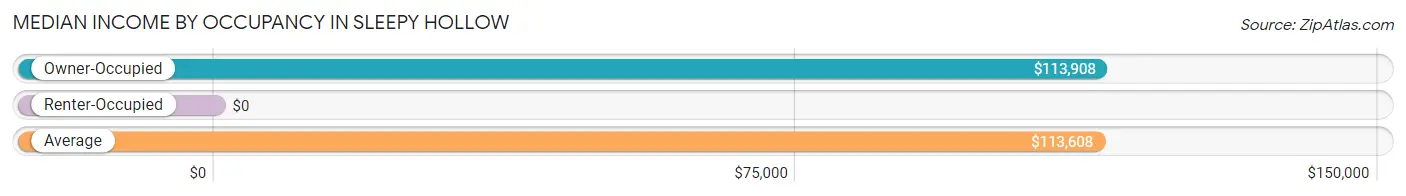
| Occupancy Type | # Households | Median Income |
| Owner-Occupied | 513 (95.0%) | $113,908 |
| Renter-Occupied | 27 (5.0%) | $0 |
| Average | 540 (100.0%) | $113,608 |
Occupancy by Householder Income Bracket in Sleepy Hollow
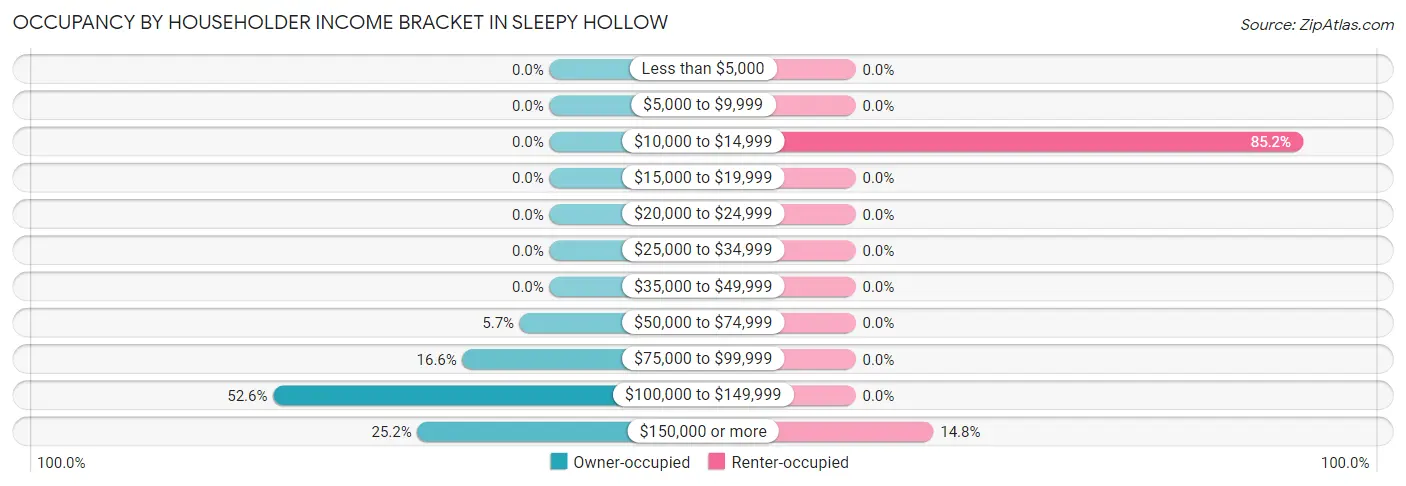
| Income Bracket | Owner-occupied | Renter-occupied |
| Less than $5,000 | 0 (0.0%) | 0 (0.0%) |
| $5,000 to $9,999 | 0 (0.0%) | 0 (0.0%) |
| $10,000 to $14,999 | 0 (0.0%) | 23 (85.2%) |
| $15,000 to $19,999 | 0 (0.0%) | 0 (0.0%) |
| $20,000 to $24,999 | 0 (0.0%) | 0 (0.0%) |
| $25,000 to $34,999 | 0 (0.0%) | 0 (0.0%) |
| $35,000 to $49,999 | 0 (0.0%) | 0 (0.0%) |
| $50,000 to $74,999 | 29 (5.7%) | 0 (0.0%) |
| $75,000 to $99,999 | 85 (16.6%) | 0 (0.0%) |
| $100,000 to $149,999 | 270 (52.6%) | 0 (0.0%) |
| $150,000 or more | 129 (25.2%) | 4 (14.8%) |
| Total | 513 (100.0%) | 27 (100.0%) |
Monthly Housing Cost Tiers in Sleepy Hollow
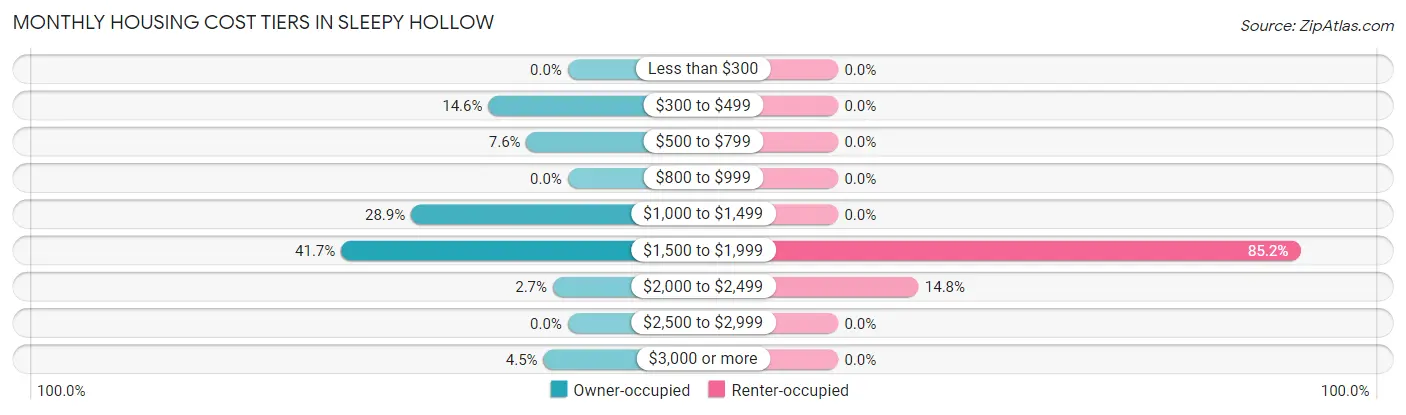
| Monthly Cost | Owner-occupied | Renter-occupied |
| Less than $300 | 0 (0.0%) | 0 (0.0%) |
| $300 to $499 | 75 (14.6%) | 0 (0.0%) |
| $500 to $799 | 39 (7.6%) | 0 (0.0%) |
| $800 to $999 | 0 (0.0%) | 0 (0.0%) |
| $1,000 to $1,499 | 148 (28.8%) | 0 (0.0%) |
| $1,500 to $1,999 | 214 (41.7%) | 23 (85.2%) |
| $2,000 to $2,499 | 14 (2.7%) | 4 (14.8%) |
| $2,500 to $2,999 | 0 (0.0%) | 0 (0.0%) |
| $3,000 or more | 23 (4.5%) | 0 (0.0%) |
| Total | 513 (100.0%) | 27 (100.0%) |
Physical Housing Characteristics in Sleepy Hollow
Housing Structures in Sleepy Hollow
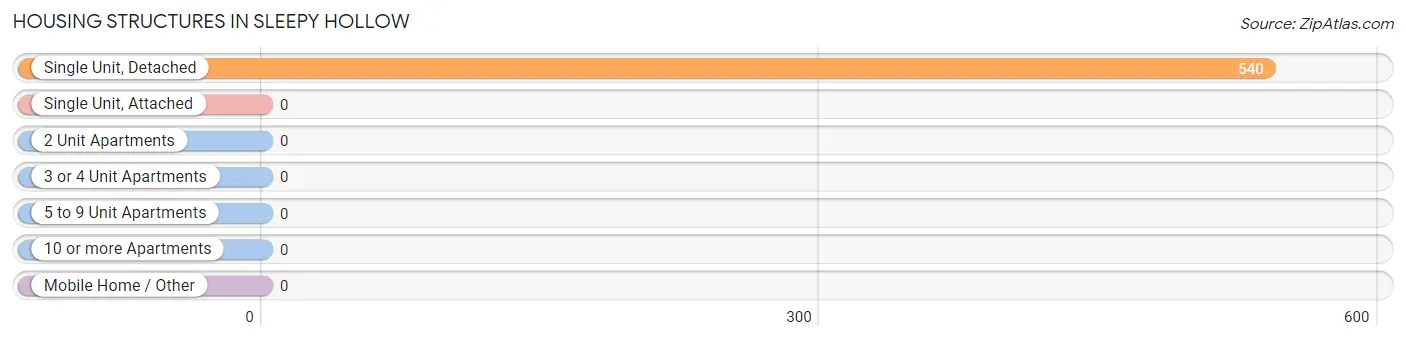
| Structure Type | # Housing Units | % Housing Units |
| Single Unit, Detached | 540 | 100.0% |
| Single Unit, Attached | 0 | 0.0% |
| 2 Unit Apartments | 0 | 0.0% |
| 3 or 4 Unit Apartments | 0 | 0.0% |
| 5 to 9 Unit Apartments | 0 | 0.0% |
| 10 or more Apartments | 0 | 0.0% |
| Mobile Home / Other | 0 | 0.0% |
| Total | 540 | 100.0% |
Housing Structures by Occupancy in Sleepy Hollow
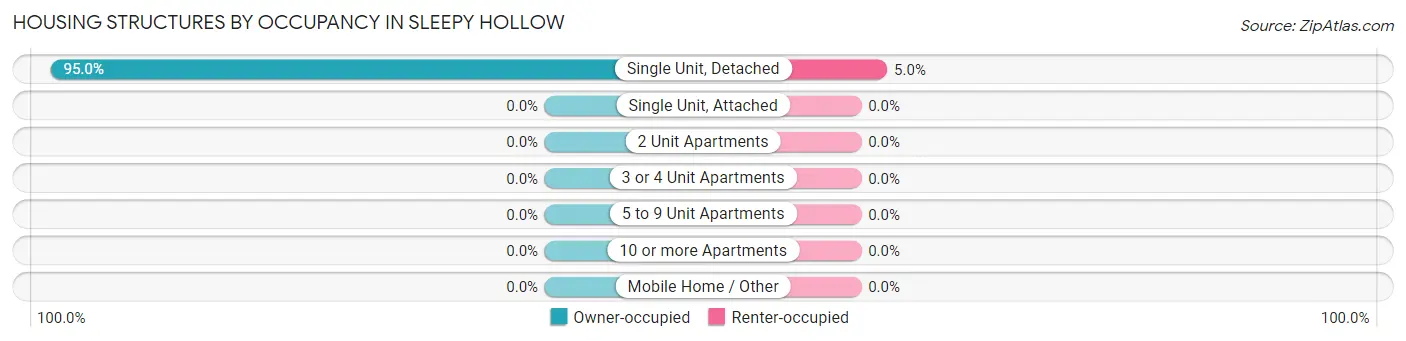
| Structure Type | Owner-occupied | Renter-occupied |
| Single Unit, Detached | 513 (95.0%) | 27 (5.0%) |
| Single Unit, Attached | 0 (0.0%) | 0 (0.0%) |
| 2 Unit Apartments | 0 (0.0%) | 0 (0.0%) |
| 3 or 4 Unit Apartments | 0 (0.0%) | 0 (0.0%) |
| 5 to 9 Unit Apartments | 0 (0.0%) | 0 (0.0%) |
| 10 or more Apartments | 0 (0.0%) | 0 (0.0%) |
| Mobile Home / Other | 0 (0.0%) | 0 (0.0%) |
| Total | 513 (95.0%) | 27 (5.0%) |
Housing Structures by Number of Rooms in Sleepy Hollow
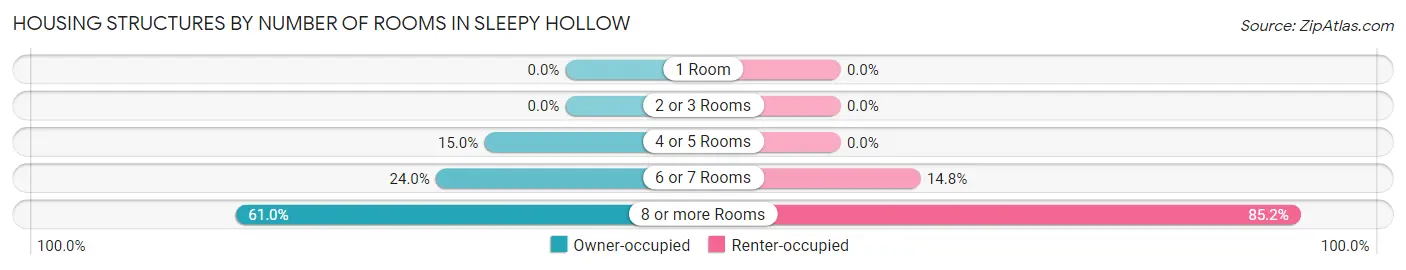
| Number of Rooms | Owner-occupied | Renter-occupied |
| 1 Room | 0 (0.0%) | 0 (0.0%) |
| 2 or 3 Rooms | 0 (0.0%) | 0 (0.0%) |
| 4 or 5 Rooms | 77 (15.0%) | 0 (0.0%) |
| 6 or 7 Rooms | 123 (24.0%) | 4 (14.8%) |
| 8 or more Rooms | 313 (61.0%) | 23 (85.2%) |
| Total | 513 (100.0%) | 27 (100.0%) |
Housing Structure by Heating Type in Sleepy Hollow
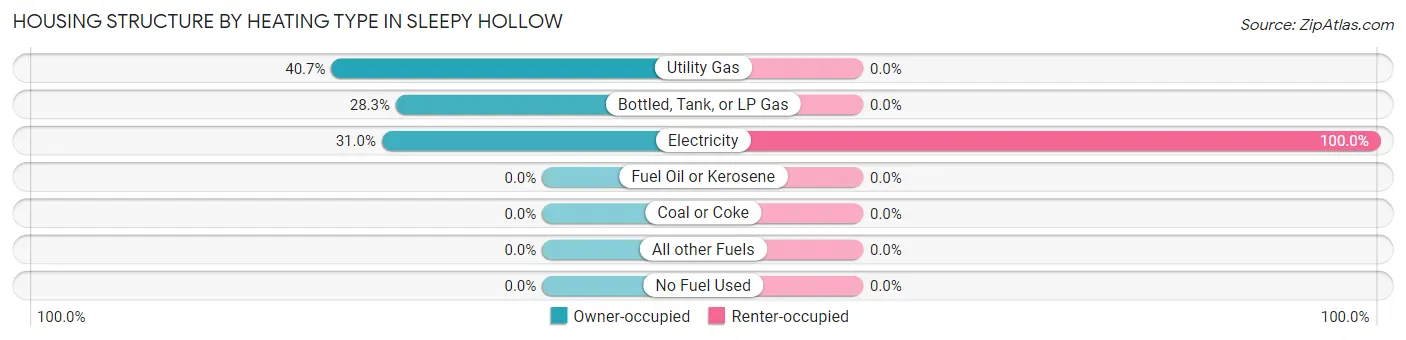
| Heating Type | Owner-occupied | Renter-occupied |
| Utility Gas | 209 (40.7%) | 0 (0.0%) |
| Bottled, Tank, or LP Gas | 145 (28.3%) | 0 (0.0%) |
| Electricity | 159 (31.0%) | 27 (100.0%) |
| Fuel Oil or Kerosene | 0 (0.0%) | 0 (0.0%) |
| Coal or Coke | 0 (0.0%) | 0 (0.0%) |
| All other Fuels | 0 (0.0%) | 0 (0.0%) |
| No Fuel Used | 0 (0.0%) | 0 (0.0%) |
| Total | 513 (100.0%) | 27 (100.0%) |
Household Vehicle Usage in Sleepy Hollow
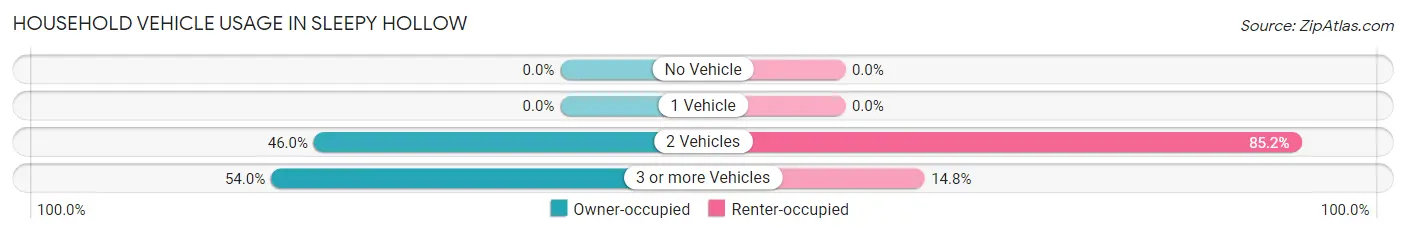
| Vehicles per Household | Owner-occupied | Renter-occupied |
| No Vehicle | 0 (0.0%) | 0 (0.0%) |
| 1 Vehicle | 0 (0.0%) | 0 (0.0%) |
| 2 Vehicles | 236 (46.0%) | 23 (85.2%) |
| 3 or more Vehicles | 277 (54.0%) | 4 (14.8%) |
| Total | 513 (100.0%) | 27 (100.0%) |
Real Estate & Mortgages in Sleepy Hollow
Real Estate and Mortgage Overview in Sleepy Hollow
| Characteristic | Without Mortgage | With Mortgage |
| Housing Units | 114 | 399 |
| Median Property Value | $325,400 | $248,800 |
| Median Household Income | $166,023 | $63 |
| Monthly Housing Costs | $447 | $23 |
| Real Estate Taxes | $1,677 | $0 |
Property Value by Mortgage Status in Sleepy Hollow
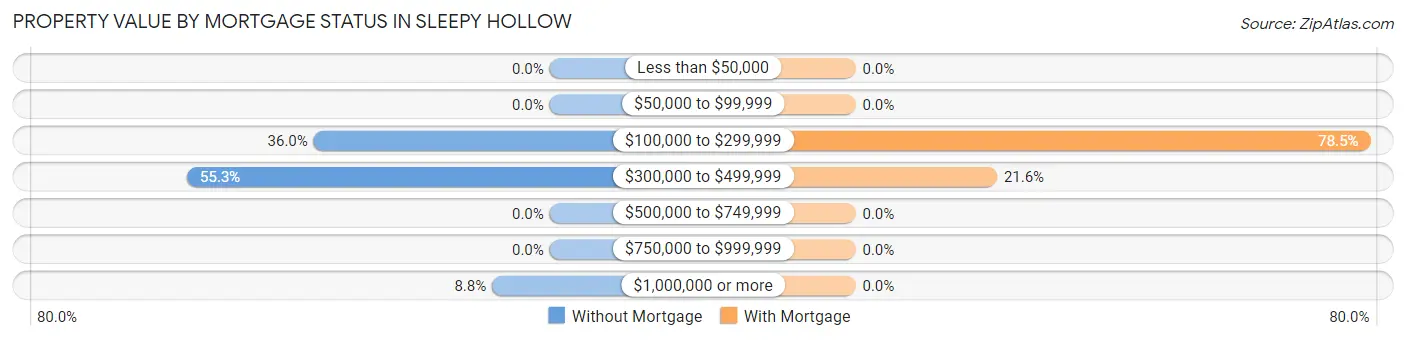
| Property Value | Without Mortgage | With Mortgage |
| Less than $50,000 | 0 (0.0%) | 0 (0.0%) |
| $50,000 to $99,999 | 0 (0.0%) | 0 (0.0%) |
| $100,000 to $299,999 | 41 (36.0%) | 313 (78.4%) |
| $300,000 to $499,999 | 63 (55.3%) | 86 (21.5%) |
| $500,000 to $749,999 | 0 (0.0%) | 0 (0.0%) |
| $750,000 to $999,999 | 0 (0.0%) | 0 (0.0%) |
| $1,000,000 or more | 10 (8.8%) | 0 (0.0%) |
| Total | 114 (100.0%) | 399 (100.0%) |
Household Income by Mortgage Status in Sleepy Hollow
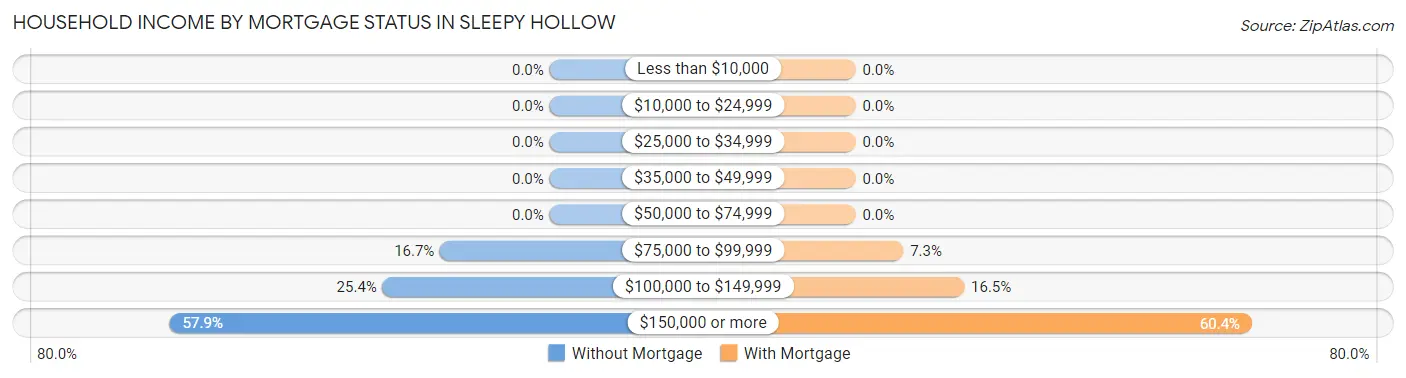
| Household Income | Without Mortgage | With Mortgage |
| Less than $10,000 | 0 (0.0%) | 0 (0.0%) |
| $10,000 to $24,999 | 0 (0.0%) | 0 (0.0%) |
| $25,000 to $34,999 | 0 (0.0%) | 0 (0.0%) |
| $35,000 to $49,999 | 0 (0.0%) | 0 (0.0%) |
| $50,000 to $74,999 | 0 (0.0%) | 0 (0.0%) |
| $75,000 to $99,999 | 19 (16.7%) | 29 (7.3%) |
| $100,000 to $149,999 | 29 (25.4%) | 66 (16.5%) |
| $150,000 or more | 66 (57.9%) | 241 (60.4%) |
| Total | 114 (100.0%) | 399 (100.0%) |
Property Value to Household Income Ratio in Sleepy Hollow
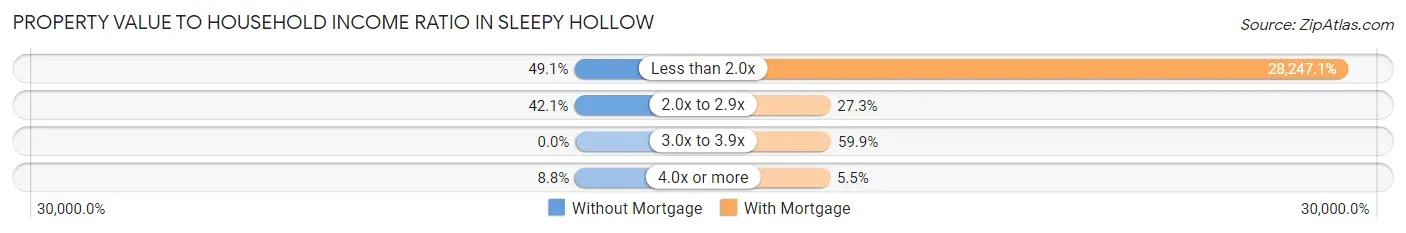
| Value-to-Income Ratio | Without Mortgage | With Mortgage |
| Less than 2.0x | 56 (49.1%) | 112,706 (28,247.1%) |
| 2.0x to 2.9x | 48 (42.1%) | 109 (27.3%) |
| 3.0x to 3.9x | 0 (0.0%) | 239 (59.9%) |
| 4.0x or more | 10 (8.8%) | 22 (5.5%) |
| Total | 114 (100.0%) | 399 (100.0%) |
Real Estate Taxes by Mortgage Status in Sleepy Hollow
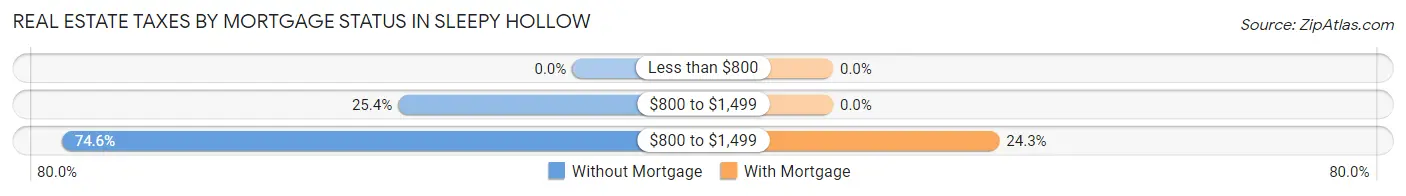
| Property Taxes | Without Mortgage | With Mortgage |
| Less than $800 | 0 (0.0%) | 0 (0.0%) |
| $800 to $1,499 | 29 (25.4%) | 0 (0.0%) |
| $800 to $1,499 | 85 (74.6%) | 97 (24.3%) |
| Total | 114 (100.0%) | 399 (100.0%) |
Health & Disability in Sleepy Hollow
Health Insurance Coverage by Age in Sleepy Hollow
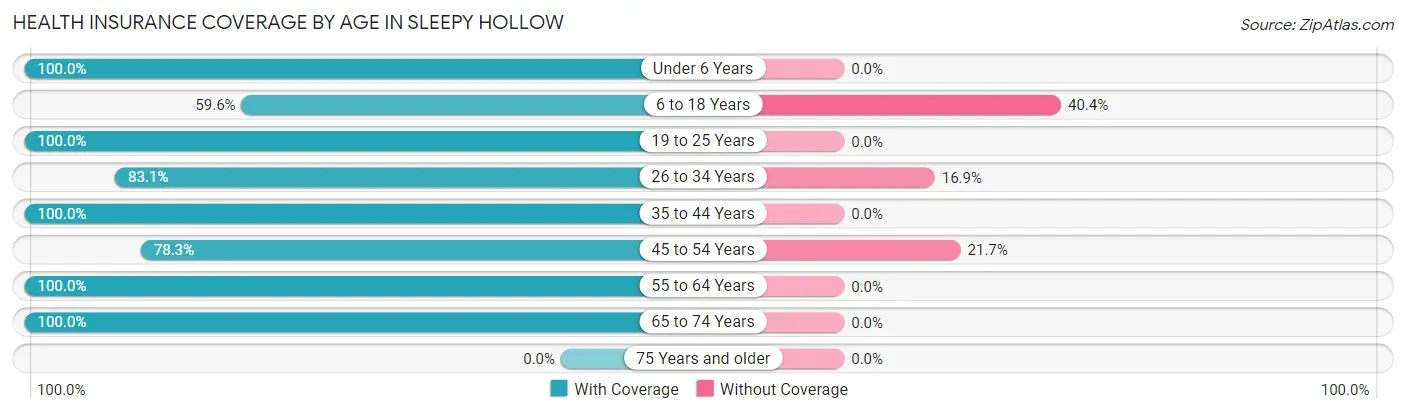
| Age Bracket | With Coverage | Without Coverage |
| Under 6 Years | 109 (100.0%) | 0 (0.0%) |
| 6 to 18 Years | 112 (59.6%) | 76 (40.4%) |
| 19 to 25 Years | 96 (100.0%) | 0 (0.0%) |
| 26 to 34 Years | 261 (83.1%) | 53 (16.9%) |
| 35 to 44 Years | 7 (100.0%) | 0 (0.0%) |
| 45 to 54 Years | 213 (78.3%) | 59 (21.7%) |
| 55 to 64 Years | 323 (100.0%) | 0 (0.0%) |
| 65 to 74 Years | 81 (100.0%) | 0 (0.0%) |
| 75 Years and older | 0 (0.0%) | 0 (0.0%) |
| Total | 1,202 (86.5%) | 188 (13.5%) |
Health Insurance Coverage by Citizenship Status in Sleepy Hollow
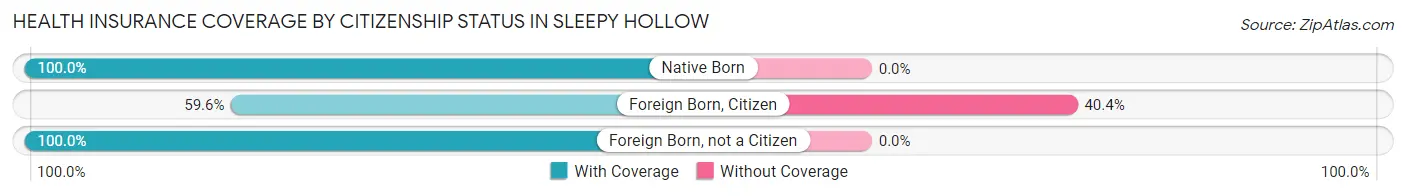
| Citizenship Status | With Coverage | Without Coverage |
| Native Born | 109 (100.0%) | 0 (0.0%) |
| Foreign Born, Citizen | 112 (59.6%) | 76 (40.4%) |
| Foreign Born, not a Citizen | 96 (100.0%) | 0 (0.0%) |
Health Insurance Coverage by Household Income in Sleepy Hollow
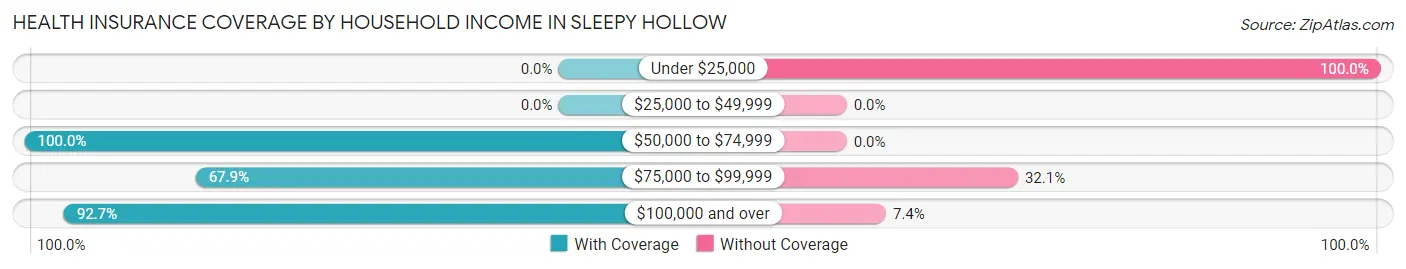
| Household Income | With Coverage | Without Coverage |
| Under $25,000 | 0 (0.0%) | 47 (100.0%) |
| $25,000 to $49,999 | 0 (0.0%) | 0 (0.0%) |
| $50,000 to $74,999 | 43 (100.0%) | 0 (0.0%) |
| $75,000 to $99,999 | 125 (67.9%) | 59 (32.1%) |
| $100,000 and over | 1,034 (92.6%) | 82 (7.3%) |
Public vs Private Health Insurance Coverage by Age in Sleepy Hollow
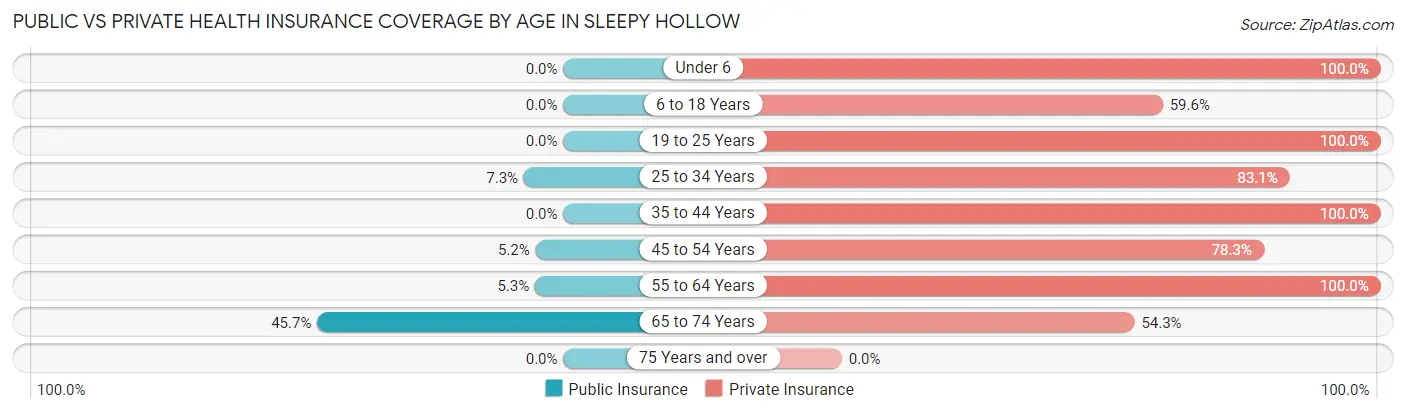
| Age Bracket | Public Insurance | Private Insurance |
| Under 6 | 0 (0.0%) | 109 (100.0%) |
| 6 to 18 Years | 0 (0.0%) | 112 (59.6%) |
| 19 to 25 Years | 0 (0.0%) | 96 (100.0%) |
| 25 to 34 Years | 23 (7.3%) | 261 (83.1%) |
| 35 to 44 Years | 0 (0.0%) | 7 (100.0%) |
| 45 to 54 Years | 14 (5.1%) | 213 (78.3%) |
| 55 to 64 Years | 17 (5.3%) | 323 (100.0%) |
| 65 to 74 Years | 37 (45.7%) | 44 (54.3%) |
| 75 Years and over | 0 (0.0%) | 0 (0.0%) |
| Total | 91 (6.6%) | 1,165 (83.8%) |
Disability Status by Sex by Age in Sleepy Hollow
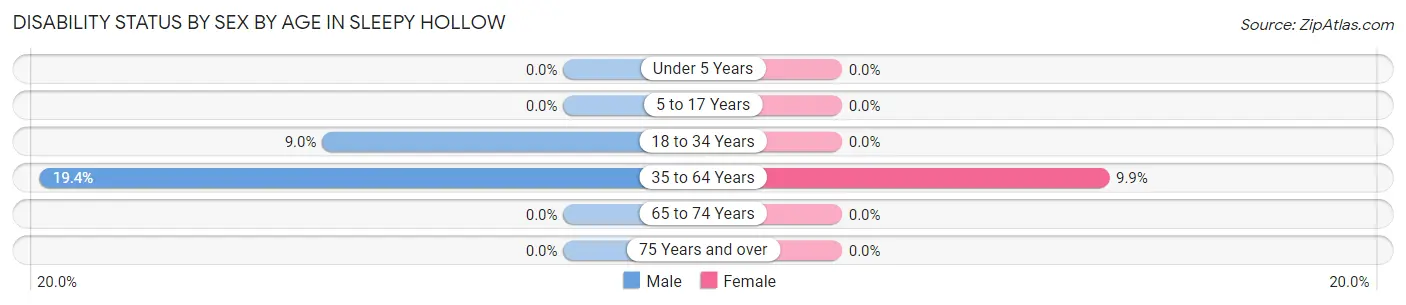
| Age Bracket | Male | Female |
| Under 5 Years | 0 (0.0%) | 0 (0.0%) |
| 5 to 17 Years | 0 (0.0%) | 0 (0.0%) |
| 18 to 34 Years | 23 (8.9%) | 0 (0.0%) |
| 35 to 64 Years | 68 (19.4%) | 25 (9.9%) |
| 65 to 74 Years | 0 (0.0%) | 0 (0.0%) |
| 75 Years and over | 0 (0.0%) | 0 (0.0%) |
Disability Class by Sex by Age in Sleepy Hollow
Disability Class: Hearing Difficulty
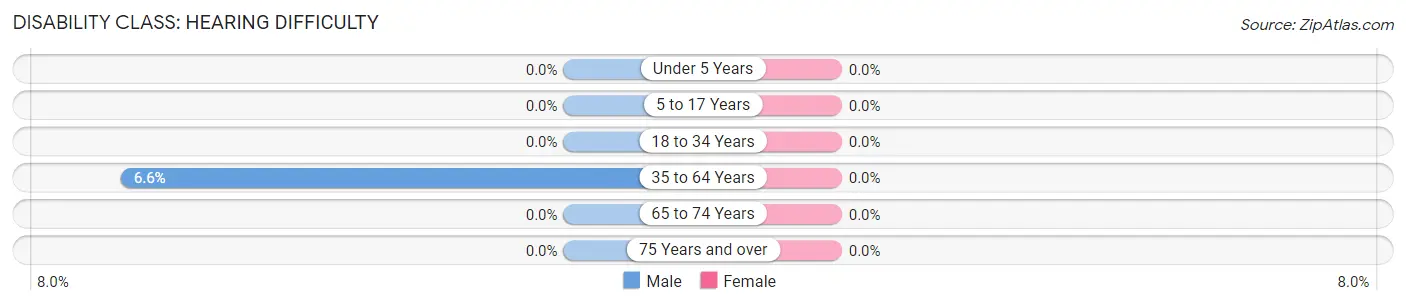
| Age Bracket | Male | Female |
| Under 5 Years | 0 (0.0%) | 0 (0.0%) |
| 5 to 17 Years | 0 (0.0%) | 0 (0.0%) |
| 18 to 34 Years | 0 (0.0%) | 0 (0.0%) |
| 35 to 64 Years | 23 (6.6%) | 0 (0.0%) |
| 65 to 74 Years | 0 (0.0%) | 0 (0.0%) |
| 75 Years and over | 0 (0.0%) | 0 (0.0%) |
Disability Class: Vision Difficulty
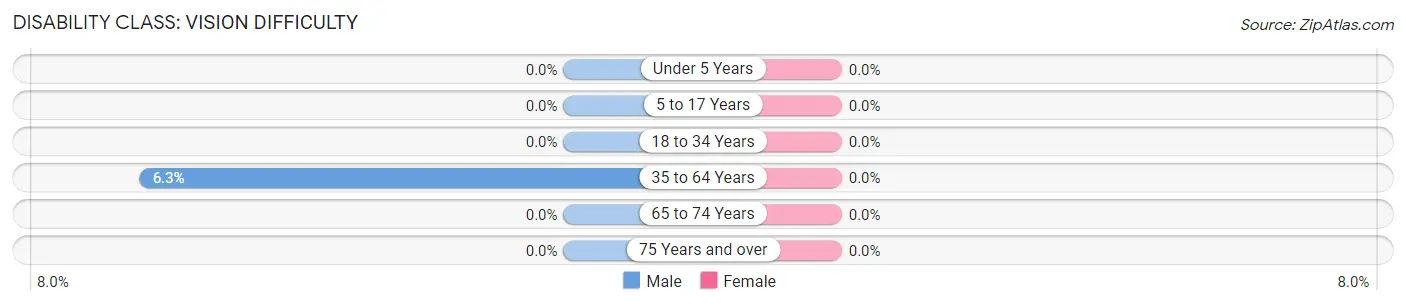
| Age Bracket | Male | Female |
| Under 5 Years | 0 (0.0%) | 0 (0.0%) |
| 5 to 17 Years | 0 (0.0%) | 0 (0.0%) |
| 18 to 34 Years | 0 (0.0%) | 0 (0.0%) |
| 35 to 64 Years | 22 (6.3%) | 0 (0.0%) |
| 65 to 74 Years | 0 (0.0%) | 0 (0.0%) |
| 75 Years and over | 0 (0.0%) | 0 (0.0%) |
Disability Class: Cognitive Difficulty
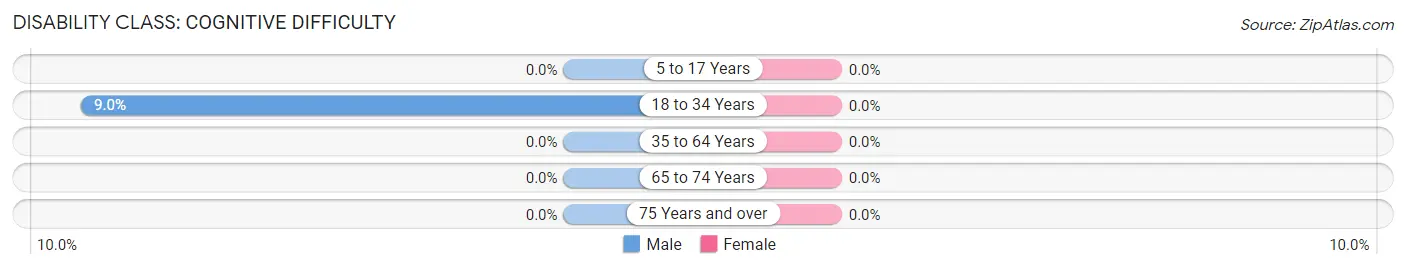
| Age Bracket | Male | Female |
| 5 to 17 Years | 0 (0.0%) | 0 (0.0%) |
| 18 to 34 Years | 23 (8.9%) | 0 (0.0%) |
| 35 to 64 Years | 0 (0.0%) | 0 (0.0%) |
| 65 to 74 Years | 0 (0.0%) | 0 (0.0%) |
| 75 Years and over | 0 (0.0%) | 0 (0.0%) |
Disability Class: Ambulatory Difficulty
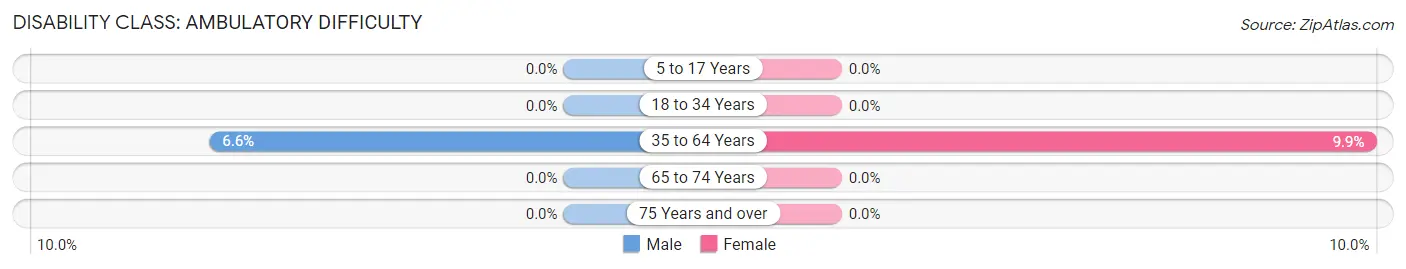
| Age Bracket | Male | Female |
| 5 to 17 Years | 0 (0.0%) | 0 (0.0%) |
| 18 to 34 Years | 0 (0.0%) | 0 (0.0%) |
| 35 to 64 Years | 23 (6.6%) | 25 (9.9%) |
| 65 to 74 Years | 0 (0.0%) | 0 (0.0%) |
| 75 Years and over | 0 (0.0%) | 0 (0.0%) |
Disability Class: Self-Care Difficulty
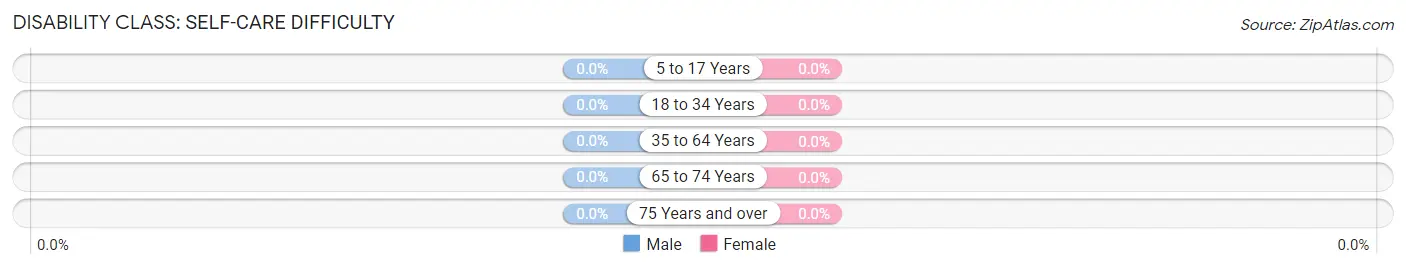
| Age Bracket | Male | Female |
| 5 to 17 Years | 0 (0.0%) | 0 (0.0%) |
| 18 to 34 Years | 0 (0.0%) | 0 (0.0%) |
| 35 to 64 Years | 0 (0.0%) | 0 (0.0%) |
| 65 to 74 Years | 0 (0.0%) | 0 (0.0%) |
| 75 Years and over | 0 (0.0%) | 0 (0.0%) |
Technology Access in Sleepy Hollow
Computing Device Access in Sleepy Hollow
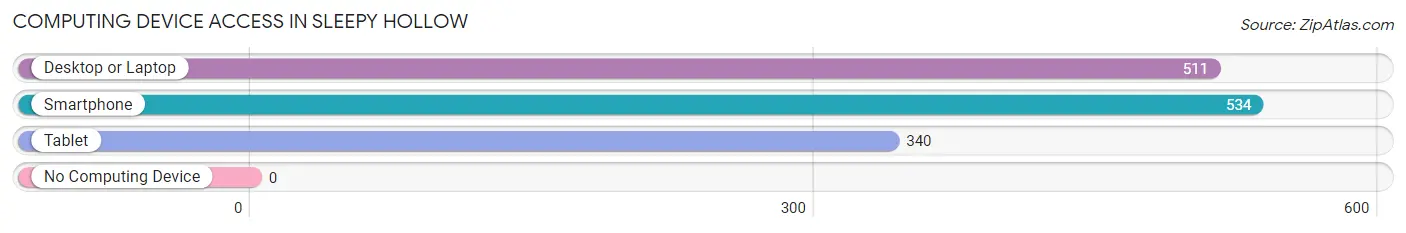
| Device Type | # Households | % Households |
| Desktop or Laptop | 511 | 94.6% |
| Smartphone | 534 | 98.9% |
| Tablet | 340 | 63.0% |
| No Computing Device | 0 | 0.0% |
| Total | 540 | 100.0% |
Internet Access in Sleepy Hollow
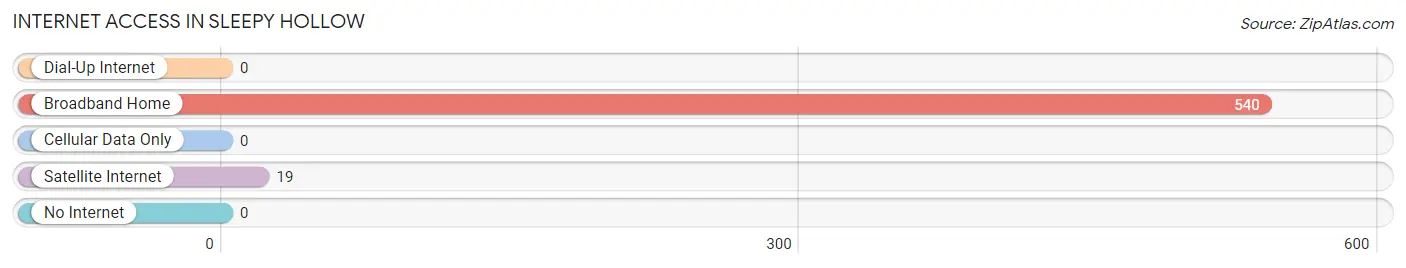
| Internet Type | # Households | % Households |
| Dial-Up Internet | 0 | 0.0% |
| Broadband Home | 540 | 100.0% |
| Cellular Data Only | 0 | 0.0% |
| Satellite Internet | 19 | 3.5% |
| No Internet | 0 | 0.0% |
| Total | 540 | 100.0% |
Sleepy Hollow Summary
Sleepy Hollow, Wyoming is a small town located in the southeastern corner of the state. It is situated in the foothills of the Big Horn Mountains, and is surrounded by rolling hills and grasslands. The town was founded in 1882 by a group of settlers who were looking for a place to settle and raise their families. The town has a population of just over 500 people, and is home to a variety of businesses, including a grocery store, a hardware store, a post office, and a few restaurants.
Geography
Sleepy Hollow is located in the southeastern corner of Wyoming, in the foothills of the Big Horn Mountains. The town is situated at an elevation of 4,500 feet, and is surrounded by rolling hills and grasslands. The town is located near the Big Horn River, which provides a source of water for the town. The town is also located near the Medicine Bow National Forest, which provides a variety of recreational activities for residents and visitors.
Economy
Sleepy Hollow is a small, rural town, and its economy is largely based on agriculture and ranching. The town is home to a variety of businesses, including a grocery store, a hardware store, a post office, and a few restaurants. The town also has a small manufacturing sector, which produces a variety of products, including furniture, clothing, and leather goods.
Demographics
As of the 2010 census, the population of Sleepy Hollow was 514. The town is predominantly white, with a small minority population of Native Americans, Hispanics, and African Americans. The median household income in the town is $37,500, and the median age is 44. The town has a high rate of poverty, with nearly 25% of the population living below the poverty line.
History
Sleepy Hollow was founded in 1882 by a group of settlers who were looking for a place to settle and raise their families. The town was named after the fictional town of Sleepy Hollow, which was featured in the classic novel by Washington Irving. The town quickly grew, and by the early 1900s, it had become a thriving community. The town was home to a variety of businesses, including a grocery store, a hardware store, a post office, and a few restaurants.
In the late 1950s, the town began to decline, as many of its residents moved away in search of better economic opportunities. The town was hit hard by the Great Recession of 2008, and many of its businesses closed. However, the town has since seen a resurgence, and is now home to a variety of businesses, including a grocery store, a hardware store, a post office, and a few restaurants.
Conclusion
Sleepy Hollow, Wyoming is a small town located in the southeastern corner of the state. It is situated in the foothills of the Big Horn Mountains, and is surrounded by rolling hills and grasslands. The town was founded in 1882 by a group of settlers who were looking for a place to settle and raise their families. The town has a population of just over 500 people, and is home to a variety of businesses, including a grocery store, a hardware store, a post office, and a few restaurants. The town is predominantly white, with a small minority population of Native Americans, Hispanics, and African Americans. The town has a high rate of poverty, with nearly 25% of the population living below the poverty line. The town has seen a resurgence in recent years, and is now home to a variety of businesses, including a grocery store, a hardware store, a post office, and a few restaurants.
Common Questions
What is Per Capita Income in Sleepy Hollow?
Per Capita income in Sleepy Hollow is $47,749.
What is the Median Family Income in Sleepy Hollow?
Median Family Income in Sleepy Hollow is $111,500.
What is the Median Household income in Sleepy Hollow?
Median Household Income in Sleepy Hollow is $113,608.
What is Inequality or Gini Index in Sleepy Hollow?
Inequality or Gini Index in Sleepy Hollow is 0.20.
What is the Total Population of Sleepy Hollow?
Total Population of Sleepy Hollow is 1,390.
What is the Total Male Population of Sleepy Hollow?
Total Male Population of Sleepy Hollow is 711.
What is the Total Female Population of Sleepy Hollow?
Total Female Population of Sleepy Hollow is 679.
What is the Ratio of Males per 100 Females in Sleepy Hollow?
There are 104.71 Males per 100 Females in Sleepy Hollow.
What is the Ratio of Females per 100 Males in Sleepy Hollow?
There are 95.50 Females per 100 Males in Sleepy Hollow.
What is the Median Population Age in Sleepy Hollow?
Median Population Age in Sleepy Hollow is 34.8 Years.
What is the Average Family Size in Sleepy Hollow
Average Family Size in Sleepy Hollow is 2.5 People.
What is the Average Household Size in Sleepy Hollow
Average Household Size in Sleepy Hollow is 2.6 People.
How Large is the Labor Force in Sleepy Hollow?
There are 921 People in the Labor Forcein in Sleepy Hollow.
What is the Percentage of People in the Labor Force in Sleepy Hollow?
83.4% of People are in the Labor Force in Sleepy Hollow.
What is the Unemployment Rate in Sleepy Hollow?
Unemployment Rate in Sleepy Hollow is 0.4%.