Lebanon, OK Map & Demographics
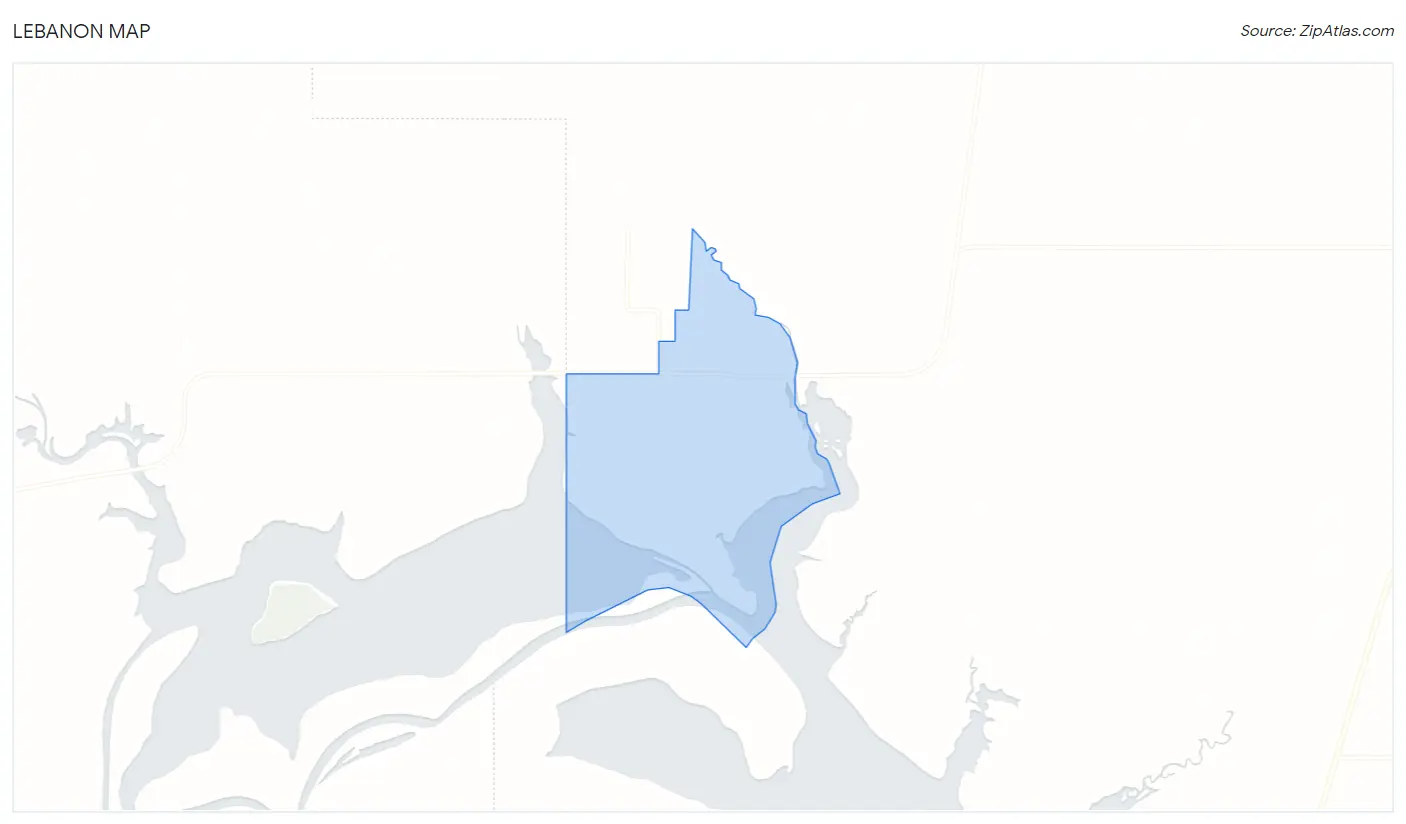
Lebanon Map
Lebanon Overview
$28,705
PER CAPITA INCOME
$56,111
AVG HOUSEHOLD INCOME
0.41
INEQUALITY / GINI INDEX
212
TOTAL POPULATION
109
MALE POPULATION
103
FEMALE POPULATION
105.83
MALES / 100 FEMALES
94.50
FEMALES / 100 MALES
48.5
MEDIAN AGE
3.9
AVG FAMILY SIZE
2.9
AVG HOUSEHOLD SIZE
103
LABOR FORCE [ PEOPLE ]
62.8%
PERCENT IN LABOR FORCE
3.9%
UNEMPLOYMENT RATE
Lebanon Zip Codes
Lebanon Area Codes
Income in Lebanon
Income Overview in Lebanon
| Characteristic | Number | Measure |
| Per Capita Income | 212 | $28,705 |
| Median Family Income | 45 | $0 |
| Mean Family Income | 45 | $91,191 |
| Median Household Income | 74 | $56,111 |
| Mean Household Income | 74 | $72,714 |
| Income Deficit | 45 | $0 |
| Wage / Income Gap (%) | 212 | 0.00% |
| Wage / Income Gap ($) | 212 | 100.00¢ per $1 |
| Gini / Inequality Index | 212 | 0.41 |
Earnings by Sex in Lebanon
| Sex | Number | Average Earnings |
| Male | 44 (37.3%) | $0 |
| Female | 74 (62.7%) | $0 |
| Total | 118 (100.0%) | $0 |
Earnings by Sex by Income Bracket in Lebanon
The most common earnings brackets in Lebanon are $12,500 to $14,999 for men (24 | 54.5%) and $7,500 to $9,999 for women (15 | 20.3%).
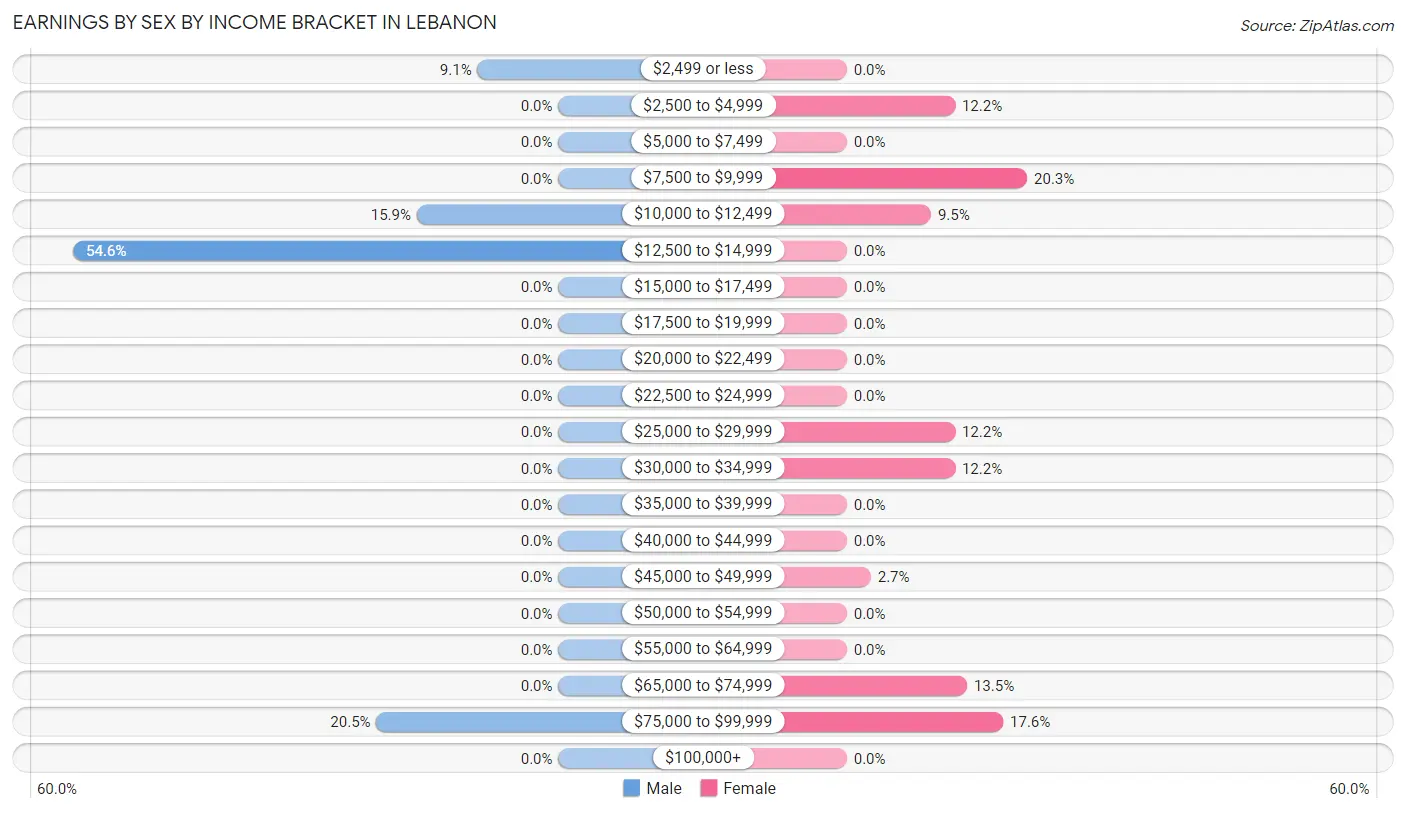
| Income | Male | Female |
| $2,499 or less | 4 (9.1%) | 0 (0.0%) |
| $2,500 to $4,999 | 0 (0.0%) | 9 (12.2%) |
| $5,000 to $7,499 | 0 (0.0%) | 0 (0.0%) |
| $7,500 to $9,999 | 0 (0.0%) | 15 (20.3%) |
| $10,000 to $12,499 | 7 (15.9%) | 7 (9.5%) |
| $12,500 to $14,999 | 24 (54.5%) | 0 (0.0%) |
| $15,000 to $17,499 | 0 (0.0%) | 0 (0.0%) |
| $17,500 to $19,999 | 0 (0.0%) | 0 (0.0%) |
| $20,000 to $22,499 | 0 (0.0%) | 0 (0.0%) |
| $22,500 to $24,999 | 0 (0.0%) | 0 (0.0%) |
| $25,000 to $29,999 | 0 (0.0%) | 9 (12.2%) |
| $30,000 to $34,999 | 0 (0.0%) | 9 (12.2%) |
| $35,000 to $39,999 | 0 (0.0%) | 0 (0.0%) |
| $40,000 to $44,999 | 0 (0.0%) | 0 (0.0%) |
| $45,000 to $49,999 | 0 (0.0%) | 2 (2.7%) |
| $50,000 to $54,999 | 0 (0.0%) | 0 (0.0%) |
| $55,000 to $64,999 | 0 (0.0%) | 0 (0.0%) |
| $65,000 to $74,999 | 0 (0.0%) | 10 (13.5%) |
| $75,000 to $99,999 | 9 (20.4%) | 13 (17.6%) |
| $100,000+ | 0 (0.0%) | 0 (0.0%) |
| Total | 44 (100.0%) | 74 (100.0%) |
Earnings by Sex by Educational Attainment in Lebanon
| Educational Attainment | Male Income | Female Income |
| Less than High School | - | - |
| High School Diploma | - | - |
| College or Associate's Degree | - | - |
| Bachelor's Degree | - | - |
| Graduate Degree | - | - |
| Total | - | - |
Family Income in Lebanon
Family Income Brackets in Lebanon
According to the Lebanon family income data, there are 13 families falling into the $100,000 to $149,999 income range, which is the most common income bracket and makes up 28.9% of all families.
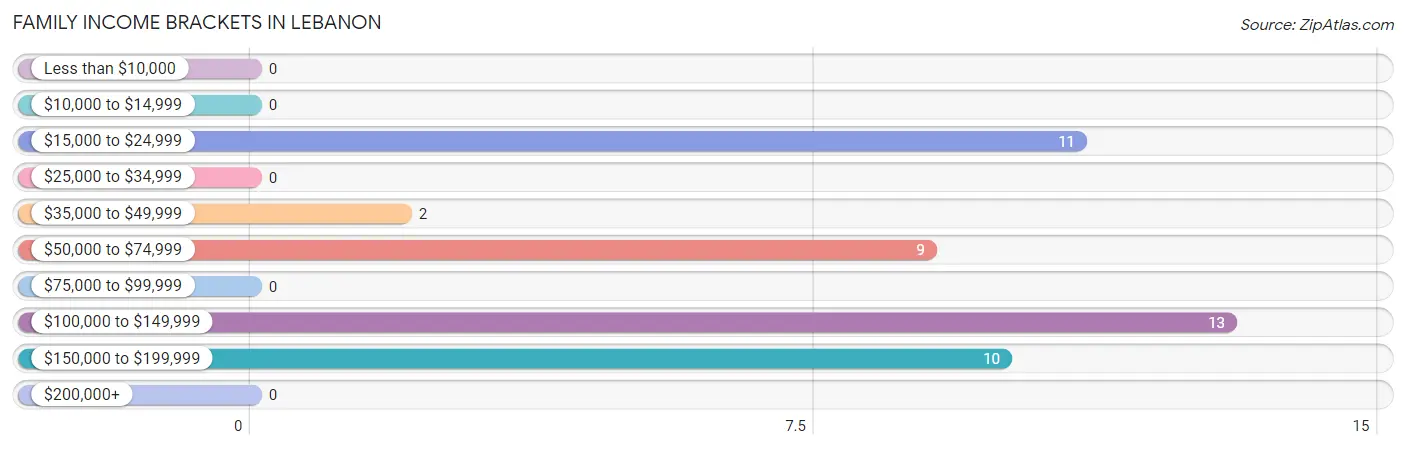
| Income Bracket | # Families | % Families |
| Less than $10,000 | 0 | 0.0% |
| $10,000 to $14,999 | 0 | 0.0% |
| $15,000 to $24,999 | 11 | 24.4% |
| $25,000 to $34,999 | 0 | 0.0% |
| $35,000 to $49,999 | 2 | 4.4% |
| $50,000 to $74,999 | 9 | 20.0% |
| $75,000 to $99,999 | 0 | 0.0% |
| $100,000 to $149,999 | 13 | 28.9% |
| $150,000 to $199,999 | 10 | 22.2% |
| $200,000+ | 0 | 0.0% |
Family Income by Famaliy Size in Lebanon
2-person families (27 | 60.0%) account for the highest median family income in Lebanon with $119,327 per family, while 2-person families (27 | 60.0%) have the highest median income of $59,664 per family member.
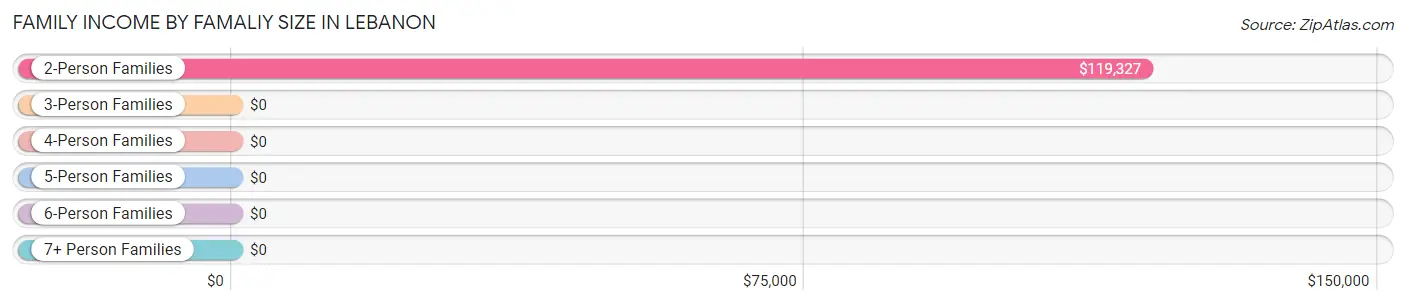
| Income Bracket | # Families | Median Income |
| 2-Person Families | 27 (60.0%) | $119,327 |
| 3-Person Families | 9 (20.0%) | $0 |
| 4-Person Families | 2 (4.4%) | $0 |
| 5-Person Families | 7 (15.6%) | $0 |
| 6-Person Families | 0 (0.0%) | $0 |
| 7+ Person Families | 0 (0.0%) | $0 |
| Total | 45 (100.0%) | $0 |
Family Income by Number of Earners in Lebanon
| Number of Earners | # Families | Median Income |
| No Earners | 0 (0.0%) | $0 |
| 1 Earner | 12 (26.7%) | $0 |
| 2 Earners | 33 (73.3%) | $0 |
| 3+ Earners | 0 (0.0%) | $0 |
| Total | 45 (100.0%) | $0 |
Household Income in Lebanon
Household Income Brackets in Lebanon
With 17 households falling in the category, the $15,000 to $24,999 income range is the most frequent in Lebanon, accounting for 23.0% of all households.
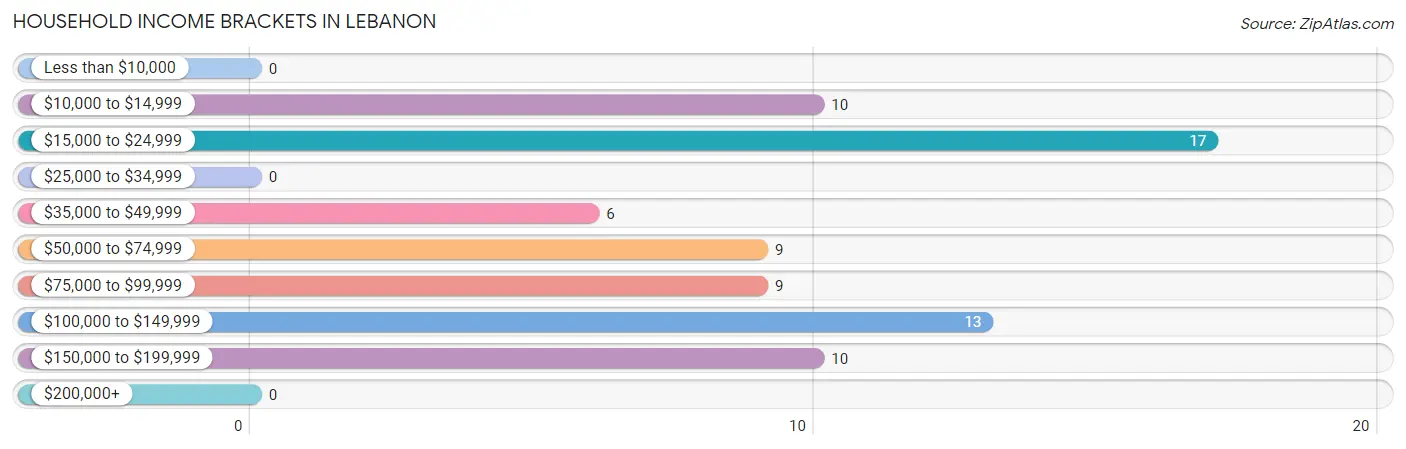
| Income Bracket | # Households | % Households |
| Less than $10,000 | 0 | 0.0% |
| $10,000 to $14,999 | 10 | 13.5% |
| $15,000 to $24,999 | 17 | 23.0% |
| $25,000 to $34,999 | 0 | 0.0% |
| $35,000 to $49,999 | 6 | 8.1% |
| $50,000 to $74,999 | 9 | 12.2% |
| $75,000 to $99,999 | 9 | 12.2% |
| $100,000 to $149,999 | 13 | 17.6% |
| $150,000 to $199,999 | 10 | 13.5% |
| $200,000+ | 0 | 0.0% |
Household Income by Householder Age in Lebanon
The median household income in Lebanon is $56,111, with the highest median household income of $103,750 found in the 45 to 64 years age bracket for the primary householder. A total of 26 households (35.1%) fall into this category.
| Income Bracket | # Households | Median Income |
| 15 to 24 Years | 0 (0.0%) | $0 |
| 25 to 44 Years | 9 (12.2%) | $0 |
| 45 to 64 Years | 26 (35.1%) | $103,750 |
| 65+ Years | 39 (52.7%) | $0 |
| Total | 74 (100.0%) | $56,111 |
Poverty in Lebanon
Income Below Poverty by Sex and Age in Lebanon
With 32.1% poverty level for males and 35.9% for females among the residents of Lebanon, 75 year old and over males and 6 to 11 year old females are the most vulnerable to poverty, with 10 males (100.0%) and 8 females (100.0%) in their respective age groups living below the poverty level.
| Age Bracket | Male | Female |
| Under 5 Years | 14 (66.7%) | 7 (63.6%) |
| 5 Years | 0 (0.0%) | 0 (0.0%) |
| 6 to 11 Years | 0 (0.0%) | 8 (100.0%) |
| 12 to 14 Years | 0 (0.0%) | 0 (0.0%) |
| 15 Years | 0 (0.0%) | 0 (0.0%) |
| 16 and 17 Years | 0 (0.0%) | 0 (0.0%) |
| 18 to 24 Years | 0 (0.0%) | 0 (0.0%) |
| 25 to 34 Years | 7 (22.6%) | 7 (77.8%) |
| 35 to 44 Years | 0 (0.0%) | 0 (0.0%) |
| 45 to 54 Years | 4 (30.8%) | 0 (0.0%) |
| 55 to 64 Years | 0 (0.0%) | 0 (0.0%) |
| 65 to 74 Years | 0 (0.0%) | 15 (44.1%) |
| 75 Years and over | 10 (100.0%) | 0 (0.0%) |
| Total | 35 (32.1%) | 37 (35.9%) |
Income Above Poverty by Sex and Age in Lebanon
According to the poverty statistics in Lebanon, males aged 6 to 11 years and females aged 18 to 24 years are the age groups that are most secure financially, with 100.0% of males and 100.0% of females in these age groups living above the poverty line.
| Age Bracket | Male | Female |
| Under 5 Years | 7 (33.3%) | 4 (36.4%) |
| 5 Years | 0 (0.0%) | 0 (0.0%) |
| 6 to 11 Years | 8 (100.0%) | 0 (0.0%) |
| 12 to 14 Years | 0 (0.0%) | 0 (0.0%) |
| 15 Years | 0 (0.0%) | 0 (0.0%) |
| 16 and 17 Years | 0 (0.0%) | 0 (0.0%) |
| 18 to 24 Years | 0 (0.0%) | 9 (100.0%) |
| 25 to 34 Years | 24 (77.4%) | 2 (22.2%) |
| 35 to 44 Years | 0 (0.0%) | 0 (0.0%) |
| 45 to 54 Years | 9 (69.2%) | 9 (100.0%) |
| 55 to 64 Years | 0 (0.0%) | 13 (100.0%) |
| 65 to 74 Years | 26 (100.0%) | 19 (55.9%) |
| 75 Years and over | 0 (0.0%) | 10 (100.0%) |
| Total | 74 (67.9%) | 66 (64.1%) |
Income Below Poverty Among Married-Couple Families in Lebanon
The poverty statistics for married-couple families in Lebanon show that 26.9% or 7 of the total 26 families live below the poverty line. Families with 3 or 4 children have the highest poverty rate of 100.0%, comprising of 7 families. On the other hand, families with no children have the lowest poverty rate of 0.0%, which includes 0 families.
| Children | Above Poverty | Below Poverty |
| No Children | 19 (100.0%) | 0 (0.0%) |
| 1 or 2 Children | 0 (0.0%) | 0 (0.0%) |
| 3 or 4 Children | 0 (0.0%) | 7 (100.0%) |
| 5 or more Children | 0 (0.0%) | 0 (0.0%) |
| Total | 19 (73.1%) | 7 (26.9%) |
Income Below Poverty Among Single-Parent Households in Lebanon
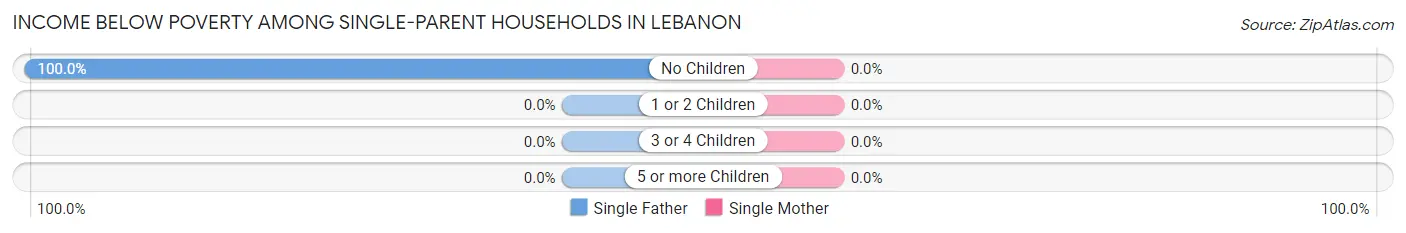
| Children | Single Father | Single Mother |
| No Children | 4 (100.0%) | 0 (0.0%) |
| 1 or 2 Children | 0 (0.0%) | 0 (0.0%) |
| 3 or 4 Children | 0 (0.0%) | 0 (0.0%) |
| 5 or more Children | 0 (0.0%) | 0 (0.0%) |
| Total | 4 (100.0%) | 0 (0.0%) |
Income Below Poverty Among Married-Couple vs Single-Parent Households in Lebanon
The poverty data for Lebanon shows that 7 of the married-couple family households (26.9%) and 4 of the single-parent households (21.0%) are living below the poverty level. Within the married-couple family households, those with 3 or 4 children have the highest poverty rate, with 7 households (100.0%) falling below the poverty line. Among the single-parent households, those with no children have the highest poverty rate, with 4 household (23.5%) living below poverty.
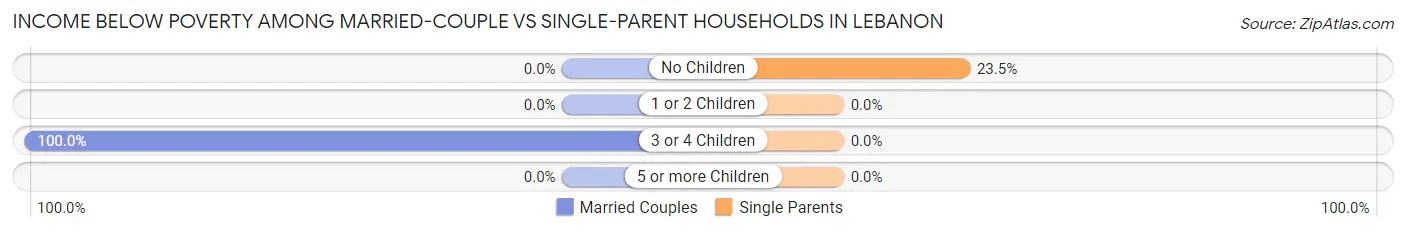
| Children | Married-Couple Families | Single-Parent Households |
| No Children | 0 (0.0%) | 4 (23.5%) |
| 1 or 2 Children | 0 (0.0%) | 0 (0.0%) |
| 3 or 4 Children | 7 (100.0%) | 0 (0.0%) |
| 5 or more Children | 0 (0.0%) | 0 (0.0%) |
| Total | 7 (26.9%) | 4 (21.0%) |
Race in Lebanon
The most populous races in Lebanon are White / Caucasian (98 | 46.2%), Two or more Races (74 | 34.9%), and Hispanic or Latino (64 | 30.2%).
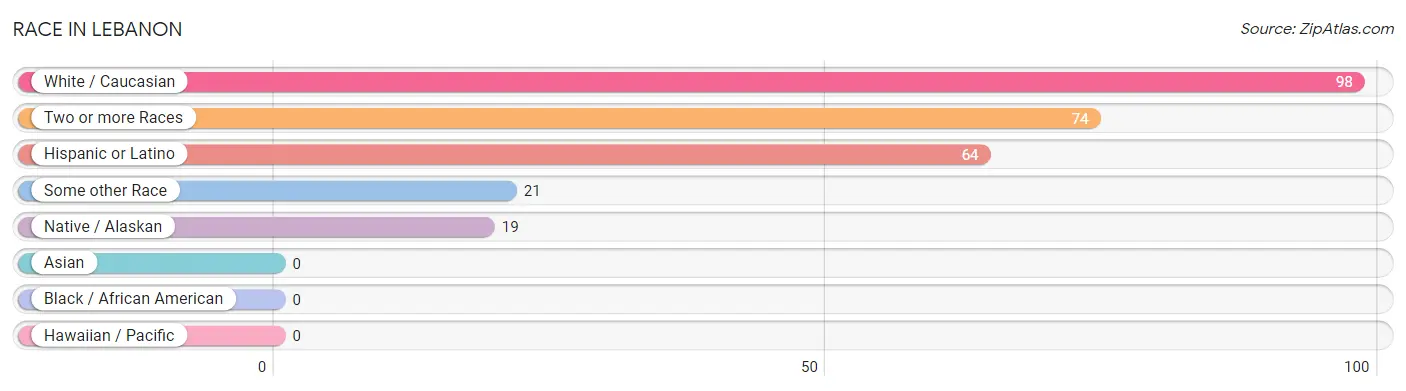
| Race | # Population | % Population |
| Asian | 0 | 0.0% |
| Black / African American | 0 | 0.0% |
| Hawaiian / Pacific | 0 | 0.0% |
| Hispanic or Latino | 64 | 30.2% |
| Native / Alaskan | 19 | 9.0% |
| White / Caucasian | 98 | 46.2% |
| Two or more Races | 74 | 34.9% |
| Some other Race | 21 | 9.9% |
| Total | 212 | 100.0% |
Ancestry in Lebanon
The most populous ancestries reported in Lebanon are Mexican (64 | 30.2%), Choctaw (28 | 13.2%), Chickasaw (19 | 9.0%), Cherokee (13 | 6.1%), and Czech (13 | 6.1%), together accounting for 64.6% of all Lebanon residents.
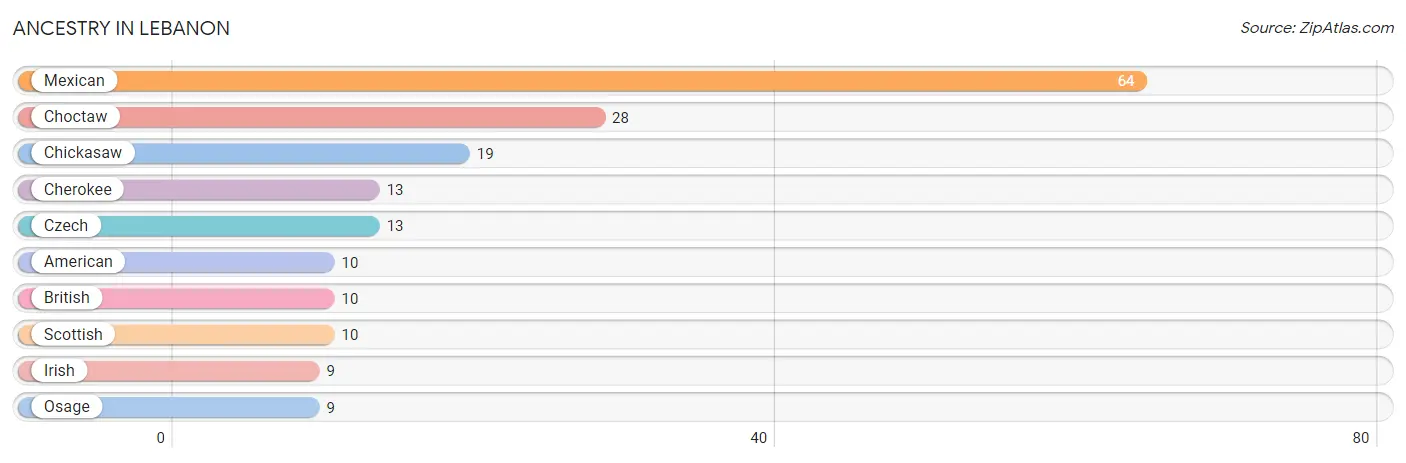
| Ancestry | # Population | % Population |
| American | 10 | 4.7% |
| British | 10 | 4.7% |
| Cherokee | 13 | 6.1% |
| Chickasaw | 19 | 9.0% |
| Choctaw | 28 | 13.2% |
| Czech | 13 | 6.1% |
| Irish | 9 | 4.3% |
| Mexican | 64 | 30.2% |
| Osage | 9 | 4.3% |
| Scottish | 10 | 4.7% | View All 10 Rows |
Immigrants in Lebanon
The most numerous immigrant groups reported in Lebanon came from Central America (17 | 8.0%), Latin America (17 | 8.0%), and Mexico (17 | 8.0%), together accounting for 24.1% of all Lebanon residents.
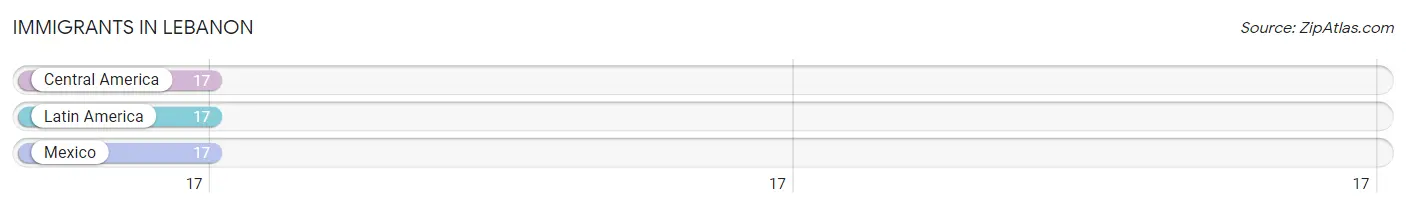
| Immigration Origin | # Population | % Population |
| Central America | 17 | 8.0% |
| Latin America | 17 | 8.0% |
| Mexico | 17 | 8.0% | View All 3 Rows |
Sex and Age in Lebanon
Sex and Age in Lebanon
The most populous age groups in Lebanon are 25 to 29 Years (31 | 28.4%) for men and 65 to 69 Years (24 | 23.3%) for women.
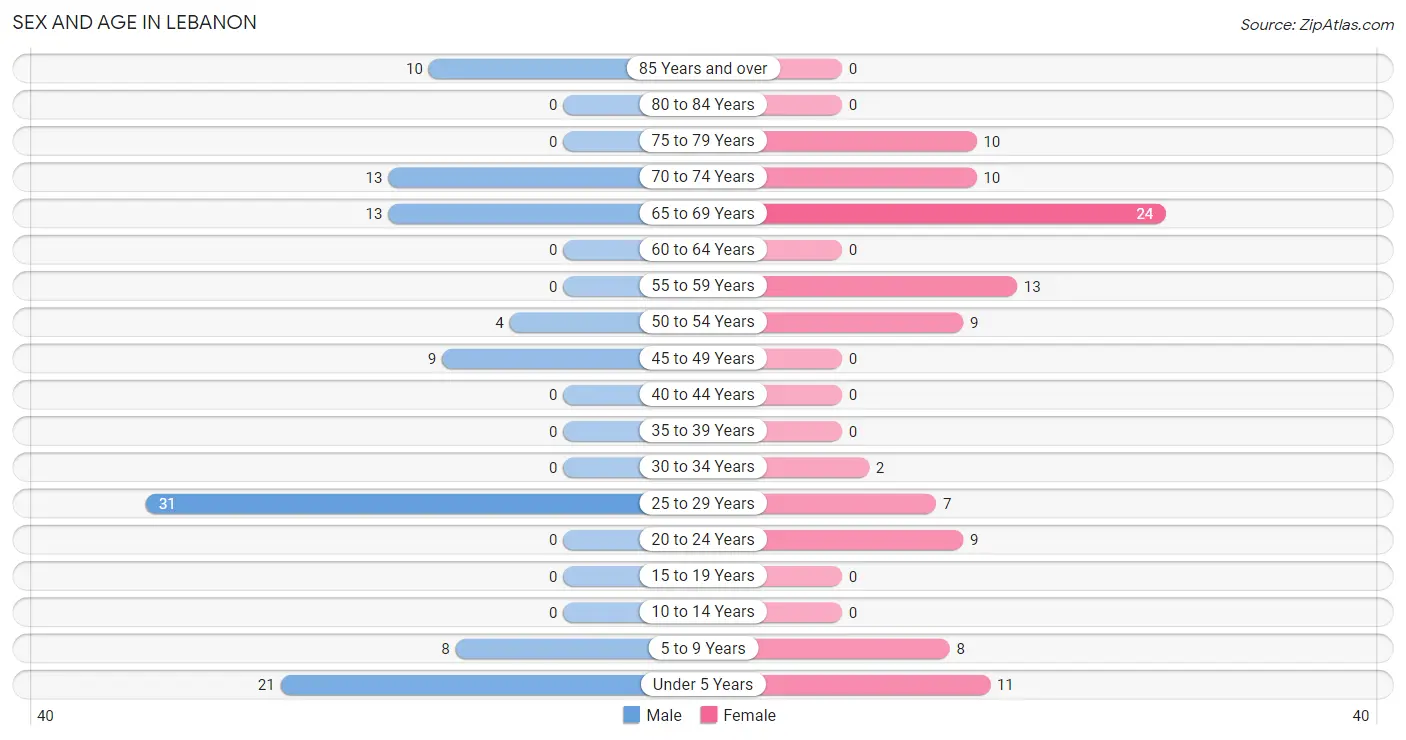
| Age Bracket | Male | Female |
| Under 5 Years | 21 (19.3%) | 11 (10.7%) |
| 5 to 9 Years | 8 (7.3%) | 8 (7.8%) |
| 10 to 14 Years | 0 (0.0%) | 0 (0.0%) |
| 15 to 19 Years | 0 (0.0%) | 0 (0.0%) |
| 20 to 24 Years | 0 (0.0%) | 9 (8.7%) |
| 25 to 29 Years | 31 (28.4%) | 7 (6.8%) |
| 30 to 34 Years | 0 (0.0%) | 2 (1.9%) |
| 35 to 39 Years | 0 (0.0%) | 0 (0.0%) |
| 40 to 44 Years | 0 (0.0%) | 0 (0.0%) |
| 45 to 49 Years | 9 (8.3%) | 0 (0.0%) |
| 50 to 54 Years | 4 (3.7%) | 9 (8.7%) |
| 55 to 59 Years | 0 (0.0%) | 13 (12.6%) |
| 60 to 64 Years | 0 (0.0%) | 0 (0.0%) |
| 65 to 69 Years | 13 (11.9%) | 24 (23.3%) |
| 70 to 74 Years | 13 (11.9%) | 10 (9.7%) |
| 75 to 79 Years | 0 (0.0%) | 10 (9.7%) |
| 80 to 84 Years | 0 (0.0%) | 0 (0.0%) |
| 85 Years and over | 10 (9.2%) | 0 (0.0%) |
| Total | 109 (100.0%) | 103 (100.0%) |
Families and Households in Lebanon
Median Family Size in Lebanon
The median family size in Lebanon is 3.87 persons per family, with single male/father families (4 | 8.9%) accounting for the largest median family size of 4.75 persons per family. On the other hand, single female/mother families (15 | 33.3%) represent the smallest median family size with 2.87 persons per family.
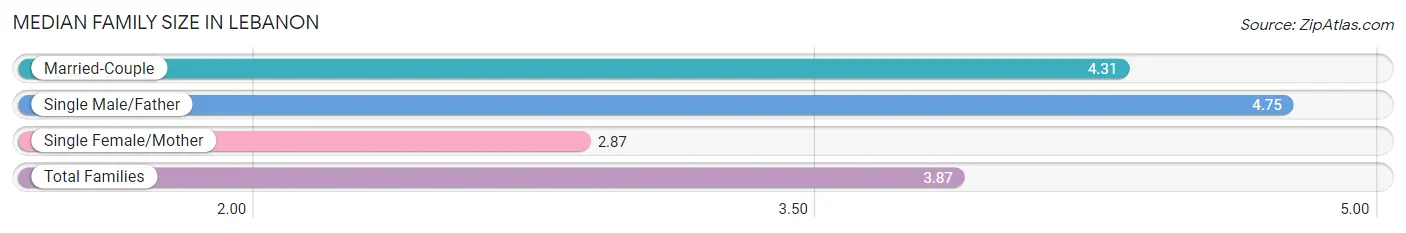
| Family Type | # Families | Family Size |
| Married-Couple | 26 (57.8%) | 4.31 |
| Single Male/Father | 4 (8.9%) | 4.75 |
| Single Female/Mother | 15 (33.3%) | 2.87 |
| Total Families | 45 (100.0%) | 3.87 |
Median Household Size in Lebanon
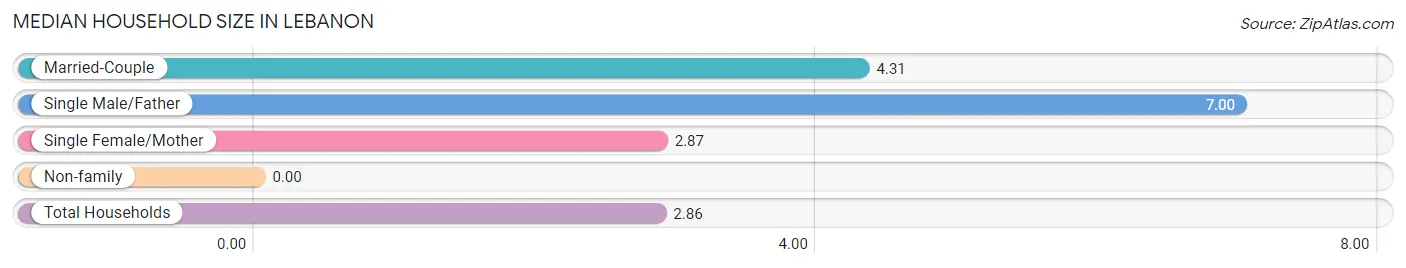
| Household Type | # Households | Household Size |
| Married-Couple | 26 (35.1%) | 4.31 |
| Single Male/Father | 4 (5.4%) | 7.00 |
| Single Female/Mother | 15 (20.3%) | 2.87 |
| Non-family | 29 (39.2%) | - |
| Total Households | 74 (100.0%) | 2.86 |
Household Size by Marriage Status in Lebanon
Out of a total of 74 households in Lebanon, 45 (60.8%) are family households, while 29 (39.2%) are nonfamily households. The most numerous type of family households are 2-person households, comprising 23, and the most common type of nonfamily households are 1-person households, comprising 29.
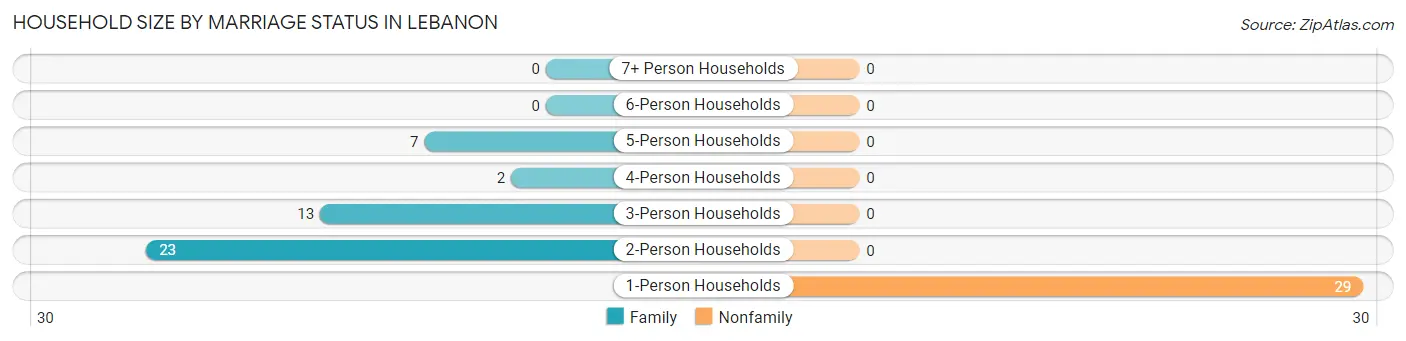
| Household Size | Family Households | Nonfamily Households |
| 1-Person Households | - | 29 (39.2%) |
| 2-Person Households | 23 (31.1%) | 0 (0.0%) |
| 3-Person Households | 13 (17.6%) | 0 (0.0%) |
| 4-Person Households | 2 (2.7%) | 0 (0.0%) |
| 5-Person Households | 7 (9.5%) | 0 (0.0%) |
| 6-Person Households | 0 (0.0%) | 0 (0.0%) |
| 7+ Person Households | 0 (0.0%) | 0 (0.0%) |
| Total | 45 (60.8%) | 29 (39.2%) |
Female Fertility in Lebanon
Fertility by Age in Lebanon
Average fertility rate in Lebanon is 389.0 births per 1,000 women. Women in the age bracket of 20 to 34 years have the highest fertility rate with 389.0 births per 1,000 women. Women in the age bracket of 20 to 34 years acount for 100.0% of all women with births.
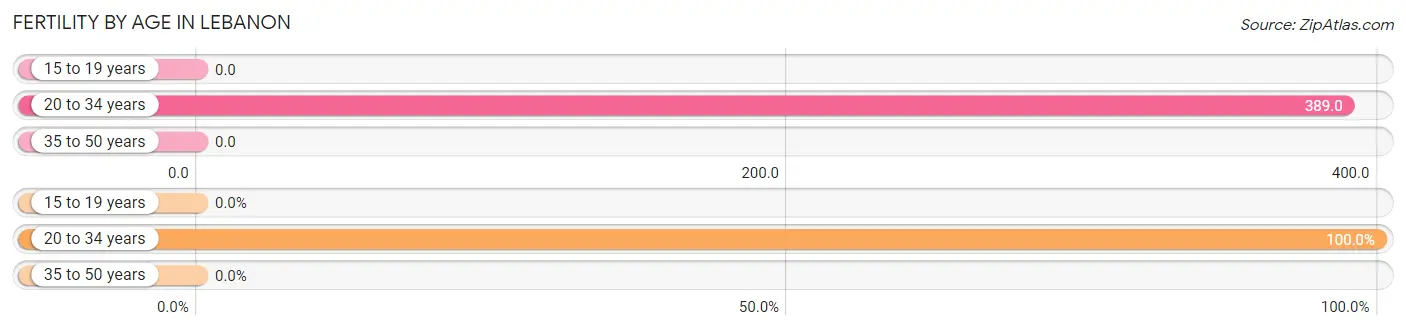
| Age Bracket | Women with Births | Births / 1,000 Women |
| 15 to 19 years | 0 (0.0%) | 0.0 |
| 20 to 34 years | 7 (100.0%) | 389.0 |
| 35 to 50 years | 0 (0.0%) | 0.0 |
| Total | 7 (100.0%) | 389.0 |
Fertility by Age by Marriage Status in Lebanon
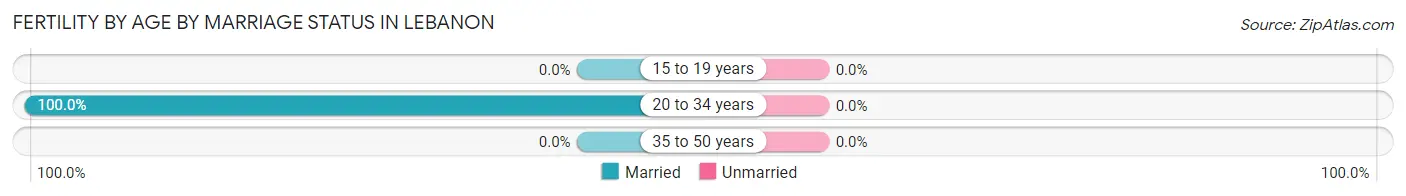
| Age Bracket | Married | Unmarried |
| 15 to 19 years | 0 (0.0%) | 0 (0.0%) |
| 20 to 34 years | 7 (100.0%) | 0 (0.0%) |
| 35 to 50 years | 0 (0.0%) | 0 (0.0%) |
| Total | 7 (100.0%) | 0 (0.0%) |
Fertility by Education in Lebanon
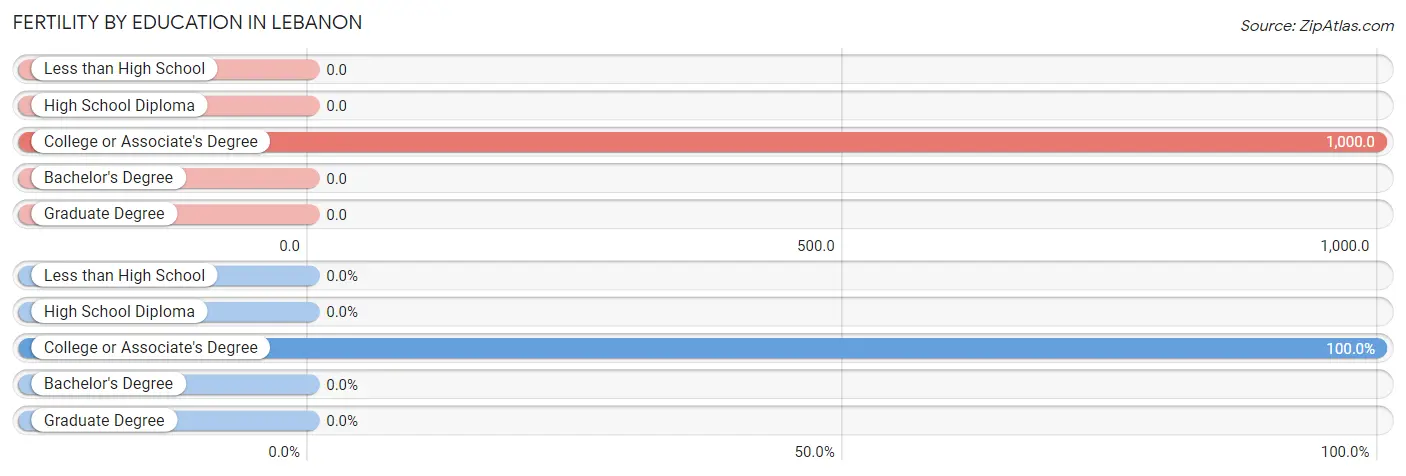
| Educational Attainment | Women with Births | Births / 1,000 Women |
| Less than High School | 0 (0.0%) | 0.0 |
| High School Diploma | 0 (0.0%) | 0.0 |
| College or Associate's Degree | 7 (100.0%) | 1,000.0 |
| Bachelor's Degree | 0 (0.0%) | 0.0 |
| Graduate Degree | 0 (0.0%) | 0.0 |
| Total | 7 (100.0%) | 389.0 |
Fertility by Education by Marriage Status in Lebanon
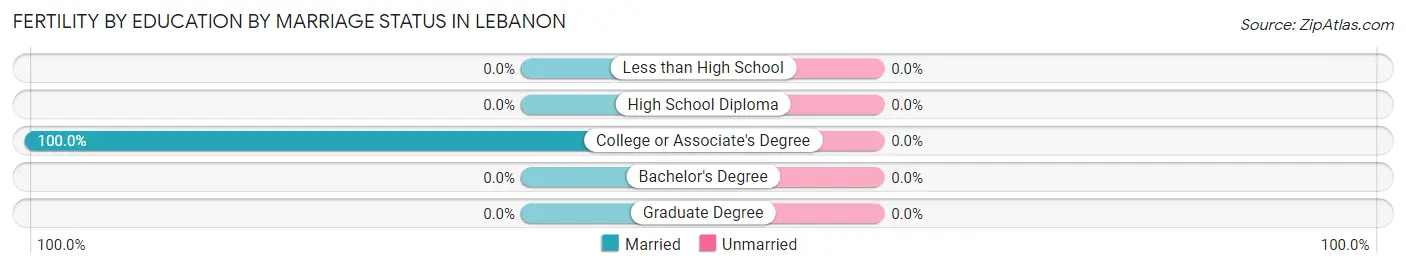
| Educational Attainment | Married | Unmarried |
| Less than High School | 0 (0.0%) | 0 (0.0%) |
| High School Diploma | 0 (0.0%) | 0 (0.0%) |
| College or Associate's Degree | 7 (100.0%) | 0 (0.0%) |
| Bachelor's Degree | 0 (0.0%) | 0 (0.0%) |
| Graduate Degree | 0 (0.0%) | 0 (0.0%) |
| Total | 7 (100.0%) | 0 (0.0%) |
Employment Characteristics in Lebanon
Employment by Class of Employer in Lebanon
Among the 92 employed individuals in Lebanon, private company employees (63 | 68.5%), self-employed (incorporated) (9 | 9.8%), and self-employed (not incorporated) (9 | 9.8%) make up the most common classes of employment.
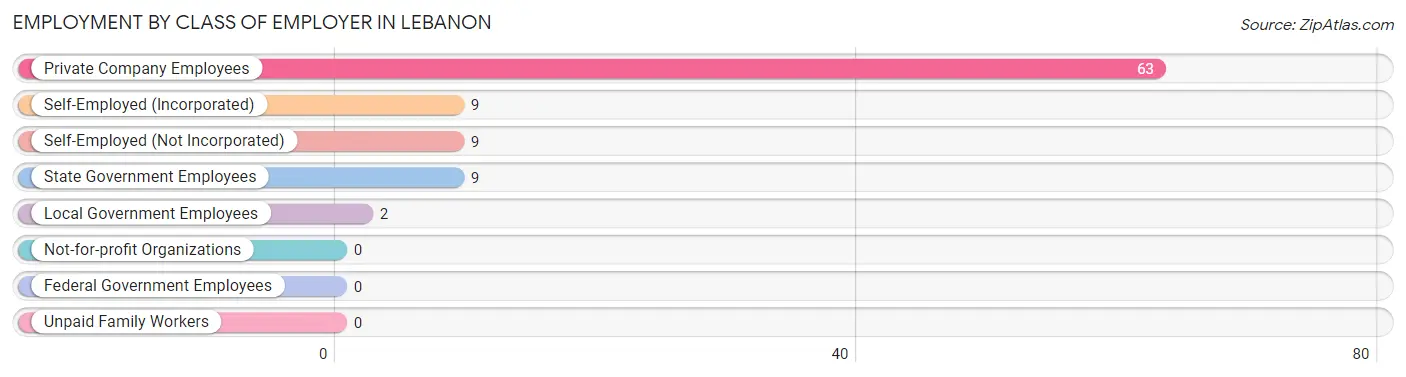
| Employer Class | # Employees | % Employees |
| Private Company Employees | 63 | 68.5% |
| Self-Employed (Incorporated) | 9 | 9.8% |
| Self-Employed (Not Incorporated) | 9 | 9.8% |
| Not-for-profit Organizations | 0 | 0.0% |
| Local Government Employees | 2 | 2.2% |
| State Government Employees | 9 | 9.8% |
| Federal Government Employees | 0 | 0.0% |
| Unpaid Family Workers | 0 | 0.0% |
| Total | 92 | 100.0% |
Employment Status by Age in Lebanon
According to the labor force statistics for Lebanon, out of the total population over 16 years of age (164), 62.8% or 103 individuals are in the labor force, with 3.9% or 4 of them unemployed. The age group with the highest labor force participation rate is 20 to 24 years, with 100.0% or 9 individuals in the labor force. Within the labor force, the 45 to 54 years age range has the highest percentage of unemployed individuals, with 18.2% or 4 of them being unemployed.
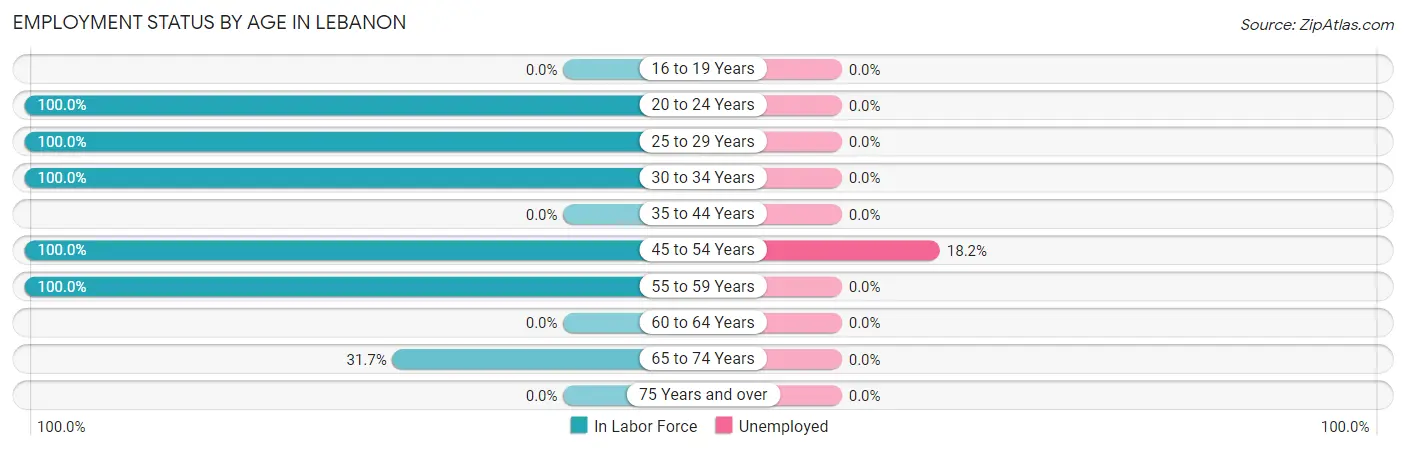
| Age Bracket | In Labor Force | Unemployed |
| 16 to 19 Years | 0 (0.0%) | 0 (0.0%) |
| 20 to 24 Years | 9 (100.0%) | 0 (0.0%) |
| 25 to 29 Years | 38 (100.0%) | 0 (0.0%) |
| 30 to 34 Years | 2 (100.0%) | 0 (0.0%) |
| 35 to 44 Years | 0 (0.0%) | 0 (0.0%) |
| 45 to 54 Years | 22 (100.0%) | 4 (18.2%) |
| 55 to 59 Years | 13 (100.0%) | 0 (0.0%) |
| 60 to 64 Years | 0 (0.0%) | 0 (0.0%) |
| 65 to 74 Years | 19 (31.7%) | 0 (0.0%) |
| 75 Years and over | 0 (0.0%) | 0 (0.0%) |
| Total | 103 (62.8%) | 4 (3.9%) |
Employment Status by Educational Attainment in Lebanon
According to labor force statistics for Lebanon, 100.0% of individuals (75) out of the total population between 25 and 64 years of age (75) are in the labor force, with 5.3% or 4 of them being unemployed. The group with the highest labor force participation rate are those with the educational attainment of less than high school, with 100.0% or 13 individuals in the labor force. Within the labor force, individuals with less than high school education have the highest percentage of unemployment, with 30.8% or 4 of them being unemployed.
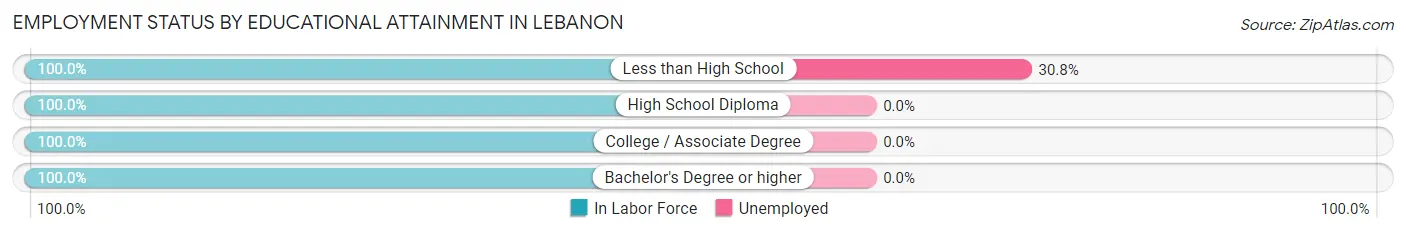
| Educational Attainment | In Labor Force | Unemployed |
| Less than High School | 13 (100.0%) | 4 (30.8%) |
| High School Diploma | 40 (100.0%) | 0 (0.0%) |
| College / Associate Degree | 7 (100.0%) | 0 (0.0%) |
| Bachelor's Degree or higher | 15 (100.0%) | 0 (0.0%) |
| Total | 75 (100.0%) | 4 (5.3%) |
Employment Occupations by Sex in Lebanon
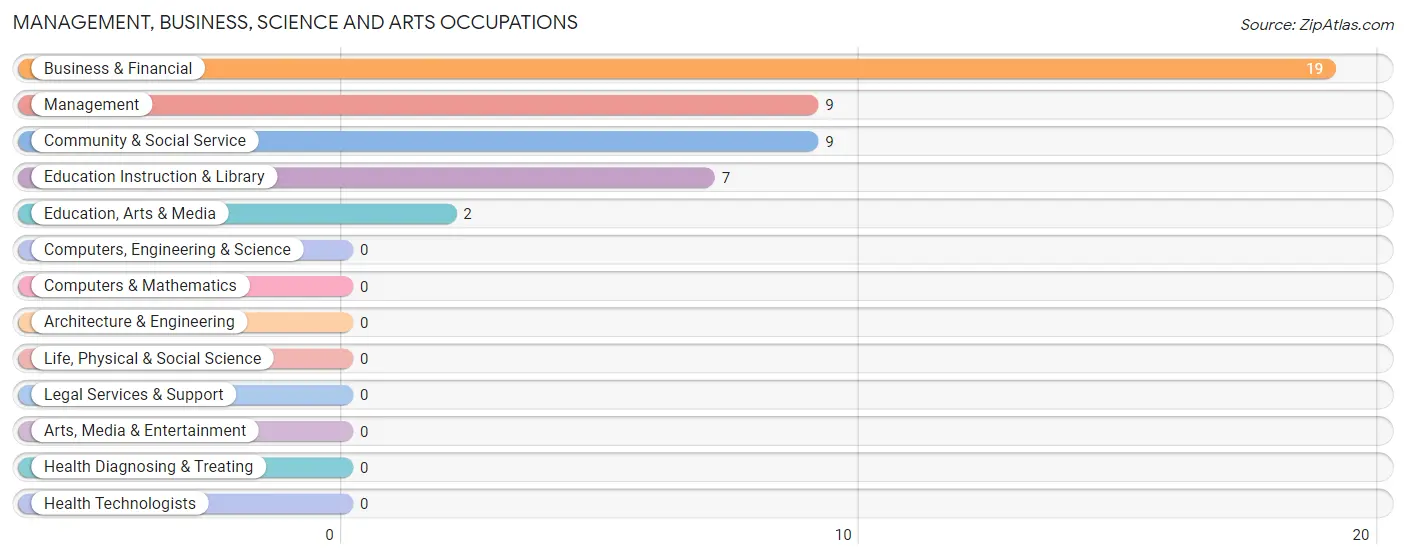
Management, Business, Science and Arts Occupations
The most common Management, Business, Science and Arts occupations in Lebanon are Business & Financial (19 | 19.2%), Management (9 | 9.1%), Community & Social Service (9 | 9.1%), Education Instruction & Library (7 | 7.1%), and Education, Arts & Media (2 | 2.0%).
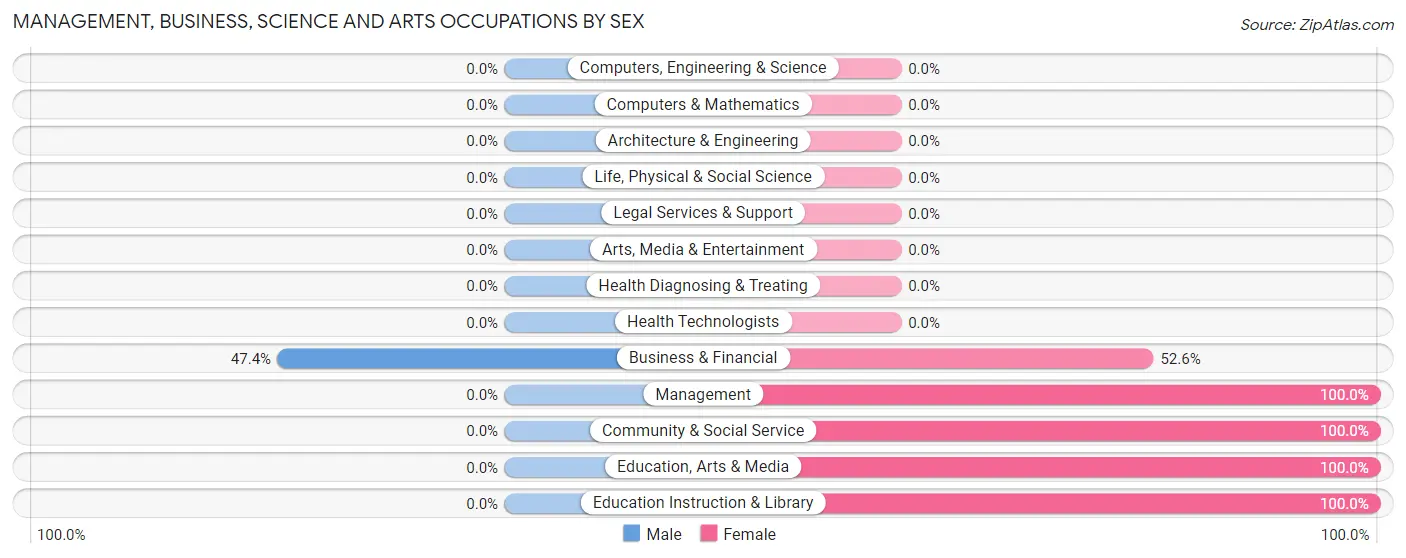
Management, Business, Science and Arts Occupations by Sex
| Occupation | Male | Female |
| Management | 0 (0.0%) | 9 (100.0%) |
| Business & Financial | 9 (47.4%) | 10 (52.6%) |
| Computers, Engineering & Science | 0 (0.0%) | 0 (0.0%) |
| Computers & Mathematics | 0 (0.0%) | 0 (0.0%) |
| Architecture & Engineering | 0 (0.0%) | 0 (0.0%) |
| Life, Physical & Social Science | 0 (0.0%) | 0 (0.0%) |
| Community & Social Service | 0 (0.0%) | 9 (100.0%) |
| Education, Arts & Media | 0 (0.0%) | 2 (100.0%) |
| Legal Services & Support | 0 (0.0%) | 0 (0.0%) |
| Education Instruction & Library | 0 (0.0%) | 7 (100.0%) |
| Arts, Media & Entertainment | 0 (0.0%) | 0 (0.0%) |
| Health Diagnosing & Treating | 0 (0.0%) | 0 (0.0%) |
| Health Technologists | 0 (0.0%) | 0 (0.0%) |
| Total (Category) | 9 (24.3%) | 28 (75.7%) |
| Total (Overall) | 40 (40.4%) | 59 (59.6%) |
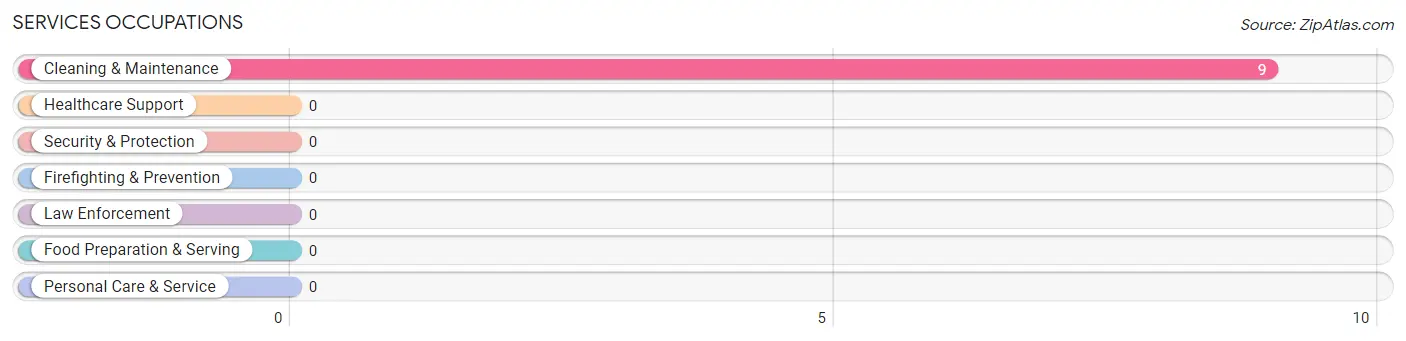
Services Occupations
The most common Services occupations in Lebanon are , and Cleaning & Maintenance (9 | 9.1%).
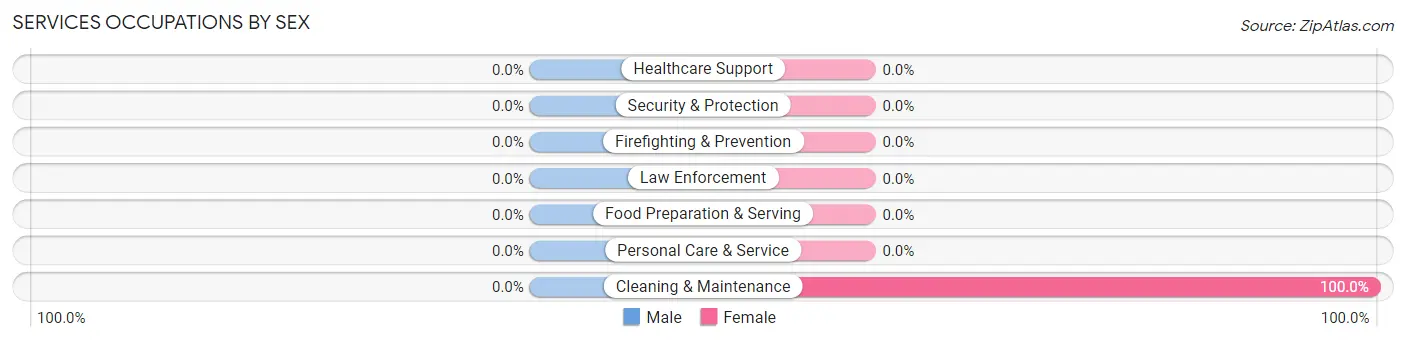
Services Occupations by Sex
| Occupation | Male | Female |
| Healthcare Support | 0 (0.0%) | 0 (0.0%) |
| Security & Protection | 0 (0.0%) | 0 (0.0%) |
| Firefighting & Prevention | 0 (0.0%) | 0 (0.0%) |
| Law Enforcement | 0 (0.0%) | 0 (0.0%) |
| Food Preparation & Serving | 0 (0.0%) | 0 (0.0%) |
| Cleaning & Maintenance | 0 (0.0%) | 9 (100.0%) |
| Personal Care & Service | 0 (0.0%) | 0 (0.0%) |
| Total (Category) | 0 (0.0%) | 9 (100.0%) |
| Total (Overall) | 40 (40.4%) | 59 (59.6%) |
Sales and Office Occupations
Sales and Office Occupations by Sex
| Occupation | Male | Female |
| Sales & Related | 0 (0.0%) | 0 (0.0%) |
| Office & Administration | 0 (0.0%) | 0 (0.0%) |
| Total (Category) | 0 (0.0%) | 0 (0.0%) |
| Total (Overall) | 40 (40.4%) | 59 (59.6%) |
Natural Resources, Construction and Maintenance Occupations
Natural Resources, Construction and Maintenance Occupations by Sex
| Occupation | Male | Female |
| Farming, Fishing & Forestry | 0 (0.0%) | 0 (0.0%) |
| Construction & Extraction | 0 (0.0%) | 0 (0.0%) |
| Installation, Maintenance & Repair | 0 (0.0%) | 0 (0.0%) |
| Total (Category) | 0 (0.0%) | 0 (0.0%) |
| Total (Overall) | 40 (40.4%) | 59 (59.6%) |
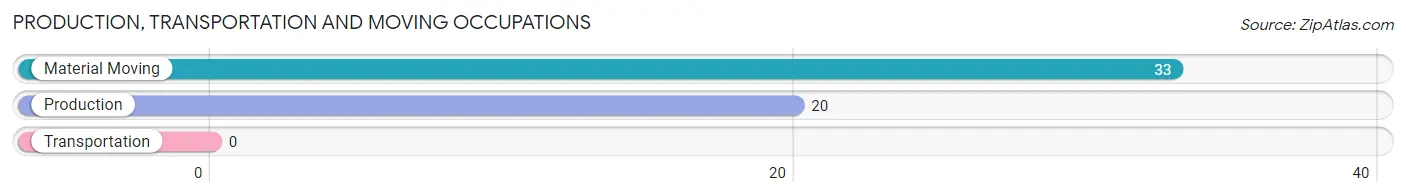
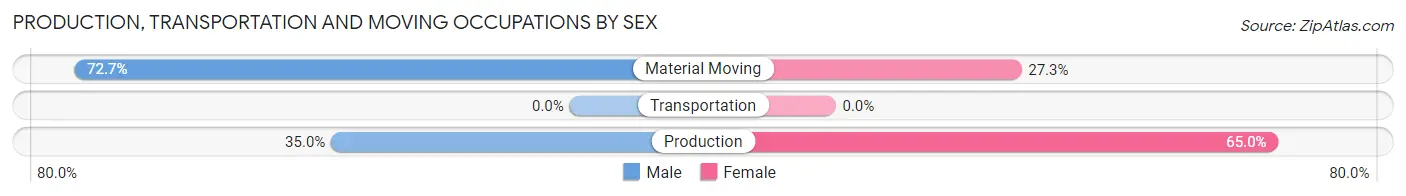
Production, Transportation and Moving Occupations
The most common Production, Transportation and Moving occupations in Lebanon are Material Moving (33 | 33.3%), and Production (20 | 20.2%).
Production, Transportation and Moving Occupations by Sex
| Occupation | Male | Female |
| Production | 7 (35.0%) | 13 (65.0%) |
| Transportation | 0 (0.0%) | 0 (0.0%) |
| Material Moving | 24 (72.7%) | 9 (27.3%) |
| Total (Category) | 31 (58.5%) | 22 (41.5%) |
| Total (Overall) | 40 (40.4%) | 59 (59.6%) |
Employment Industries by Sex in Lebanon
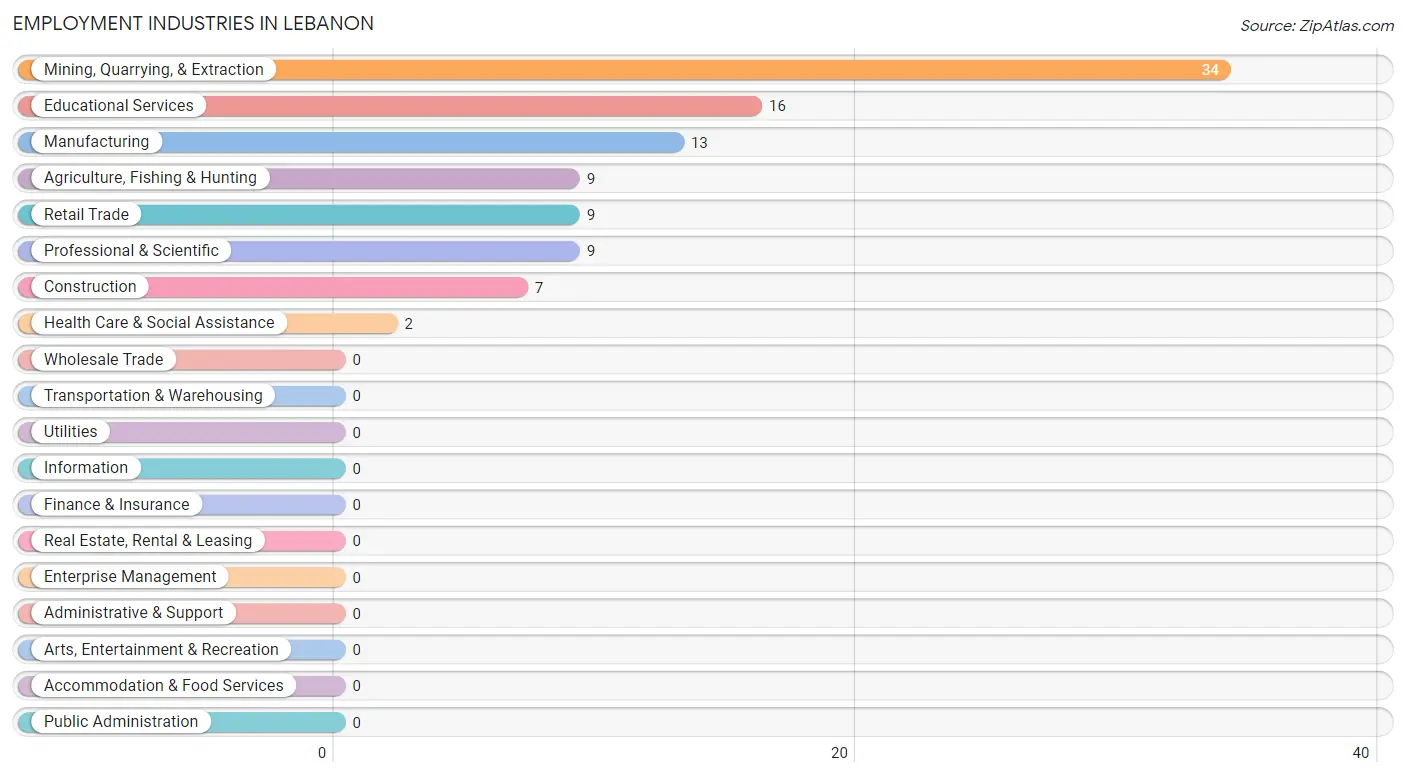
Employment Industries in Lebanon
The major employment industries in Lebanon include Mining, Quarrying, & Extraction (34 | 34.3%), Educational Services (16 | 16.2%), Manufacturing (13 | 13.1%), Agriculture, Fishing & Hunting (9 | 9.1%), and Retail Trade (9 | 9.1%).
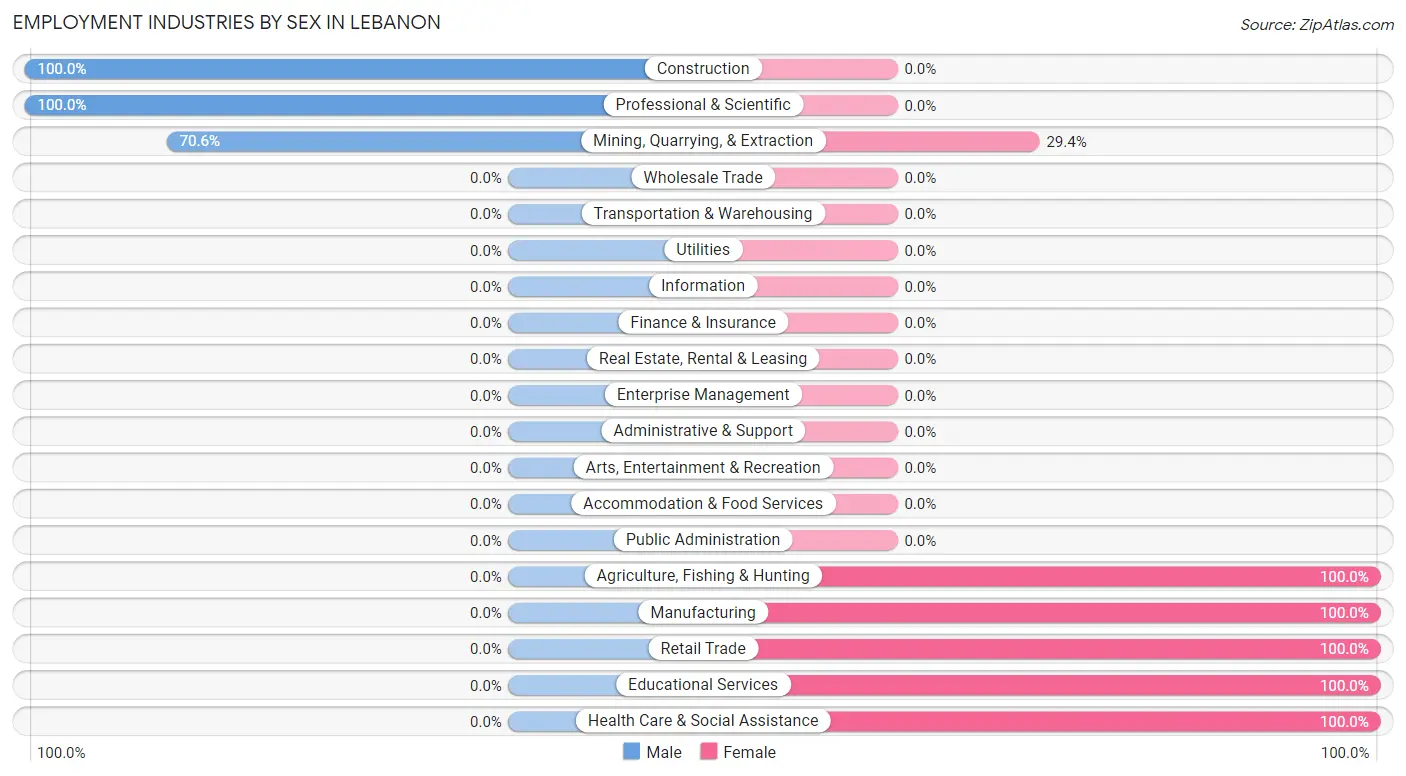
Employment Industries by Sex in Lebanon
The Lebanon industries that see more men than women are Construction (100.0%), Professional & Scientific (100.0%), and Mining, Quarrying, & Extraction (70.6%), whereas the industries that tend to have a higher number of women are Agriculture, Fishing & Hunting (100.0%), Manufacturing (100.0%), and Retail Trade (100.0%).
| Industry | Male | Female |
| Agriculture, Fishing & Hunting | 0 (0.0%) | 9 (100.0%) |
| Mining, Quarrying, & Extraction | 24 (70.6%) | 10 (29.4%) |
| Construction | 7 (100.0%) | 0 (0.0%) |
| Manufacturing | 0 (0.0%) | 13 (100.0%) |
| Wholesale Trade | 0 (0.0%) | 0 (0.0%) |
| Retail Trade | 0 (0.0%) | 9 (100.0%) |
| Transportation & Warehousing | 0 (0.0%) | 0 (0.0%) |
| Utilities | 0 (0.0%) | 0 (0.0%) |
| Information | 0 (0.0%) | 0 (0.0%) |
| Finance & Insurance | 0 (0.0%) | 0 (0.0%) |
| Real Estate, Rental & Leasing | 0 (0.0%) | 0 (0.0%) |
| Professional & Scientific | 9 (100.0%) | 0 (0.0%) |
| Enterprise Management | 0 (0.0%) | 0 (0.0%) |
| Administrative & Support | 0 (0.0%) | 0 (0.0%) |
| Educational Services | 0 (0.0%) | 16 (100.0%) |
| Health Care & Social Assistance | 0 (0.0%) | 2 (100.0%) |
| Arts, Entertainment & Recreation | 0 (0.0%) | 0 (0.0%) |
| Accommodation & Food Services | 0 (0.0%) | 0 (0.0%) |
| Public Administration | 0 (0.0%) | 0 (0.0%) |
| Total | 40 (40.4%) | 59 (59.6%) |
Education in Lebanon
School Enrollment in Lebanon
The most common levels of schooling among the 30 students in Lebanon are elementary school (16 | 53.3%), and nursery / preschool (14 | 46.7%).
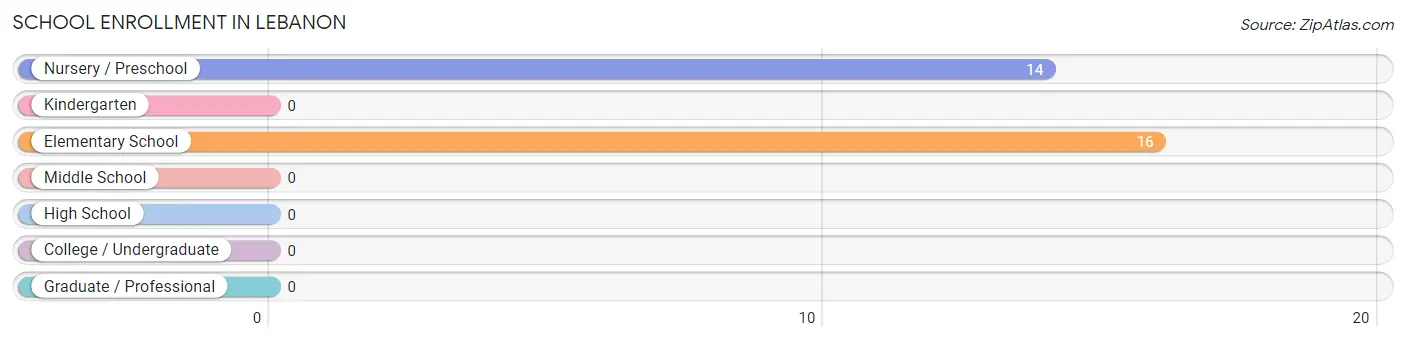
| School Level | # Students | % Students |
| Nursery / Preschool | 14 | 46.7% |
| Kindergarten | 0 | 0.0% |
| Elementary School | 16 | 53.3% |
| Middle School | 0 | 0.0% |
| High School | 0 | 0.0% |
| College / Undergraduate | 0 | 0.0% |
| Graduate / Professional | 0 | 0.0% |
| Total | 30 | 100.0% |
School Enrollment by Age by Funding Source in Lebanon
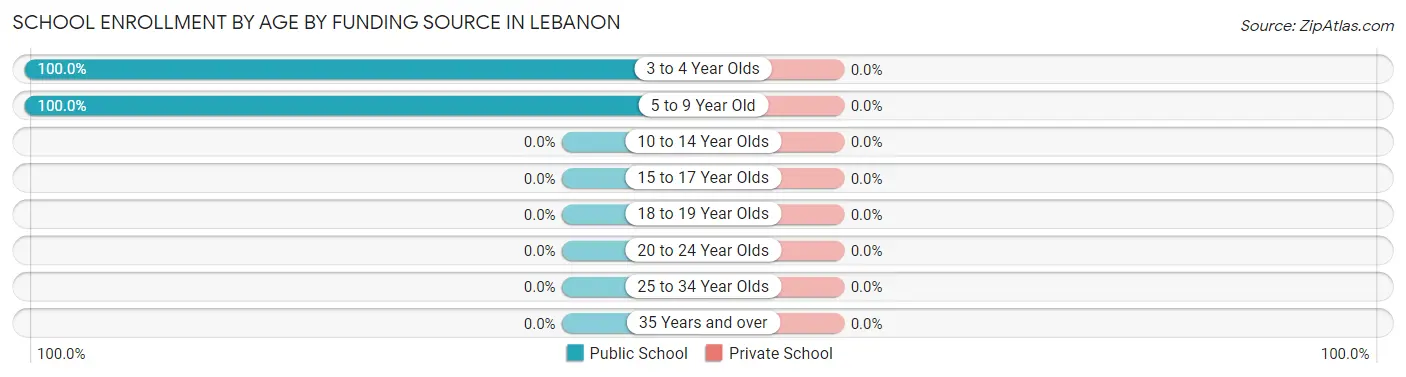
| Age Bracket | Public School | Private School |
| 3 to 4 Year Olds | 14 (100.0%) | 0 (0.0%) |
| 5 to 9 Year Old | 16 (100.0%) | 0 (0.0%) |
| 10 to 14 Year Olds | 0 (0.0%) | 0 (0.0%) |
| 15 to 17 Year Olds | 0 (0.0%) | 0 (0.0%) |
| 18 to 19 Year Olds | 0 (0.0%) | 0 (0.0%) |
| 20 to 24 Year Olds | 0 (0.0%) | 0 (0.0%) |
| 25 to 34 Year Olds | 0 (0.0%) | 0 (0.0%) |
| 35 Years and over | 0 (0.0%) | 0 (0.0%) |
| Total | 30 (100.0%) | 0 (0.0%) |
Educational Attainment by Field of Study in Lebanon
Business (23 | 60.5%), education (13 | 34.2%), and psychology (2 | 5.3%) are the most common fields of study among 38 individuals in Lebanon who have obtained a bachelor's degree or higher.
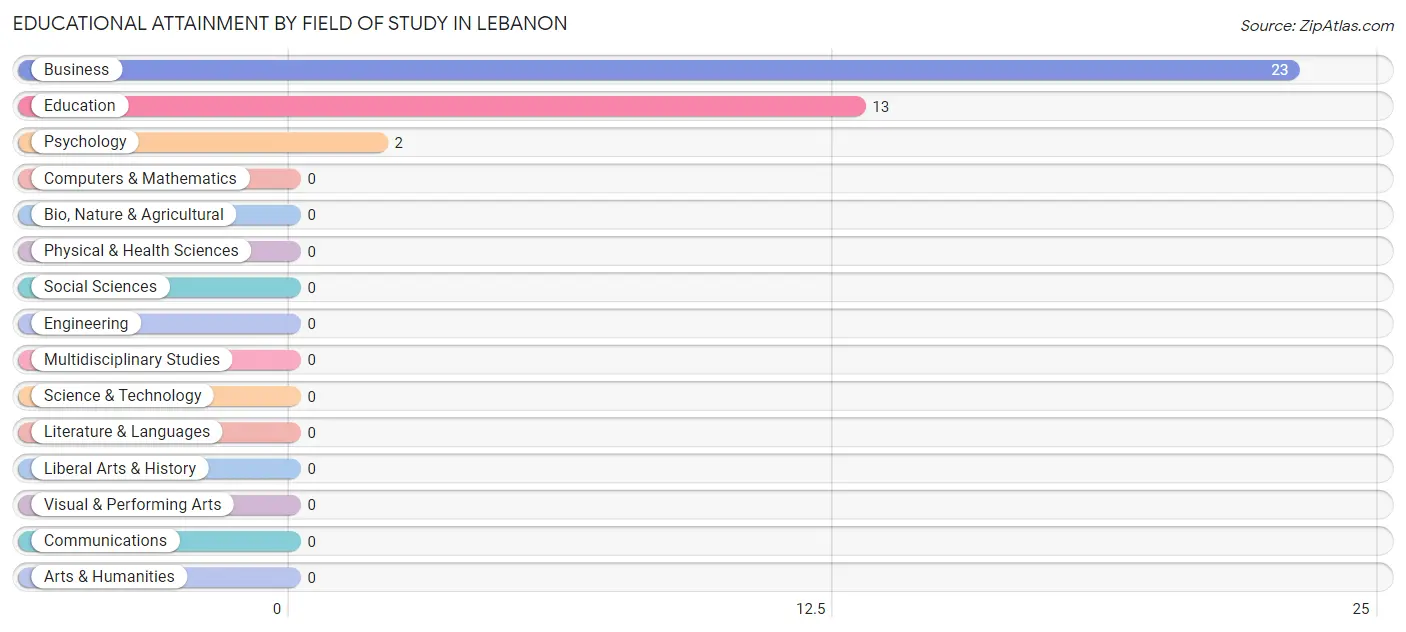
| Field of Study | # Graduates | % Graduates |
| Computers & Mathematics | 0 | 0.0% |
| Bio, Nature & Agricultural | 0 | 0.0% |
| Physical & Health Sciences | 0 | 0.0% |
| Psychology | 2 | 5.3% |
| Social Sciences | 0 | 0.0% |
| Engineering | 0 | 0.0% |
| Multidisciplinary Studies | 0 | 0.0% |
| Science & Technology | 0 | 0.0% |
| Business | 23 | 60.5% |
| Education | 13 | 34.2% |
| Literature & Languages | 0 | 0.0% |
| Liberal Arts & History | 0 | 0.0% |
| Visual & Performing Arts | 0 | 0.0% |
| Communications | 0 | 0.0% |
| Arts & Humanities | 0 | 0.0% |
| Total | 38 | 100.0% |
Transportation & Commute in Lebanon
Vehicle Availability by Sex in Lebanon
The most prevalent vehicle ownership categories in Lebanon are males with 4 vehicles (24, accounting for 60.0%) and females with 4 vehicles (9, making up 46.2%).
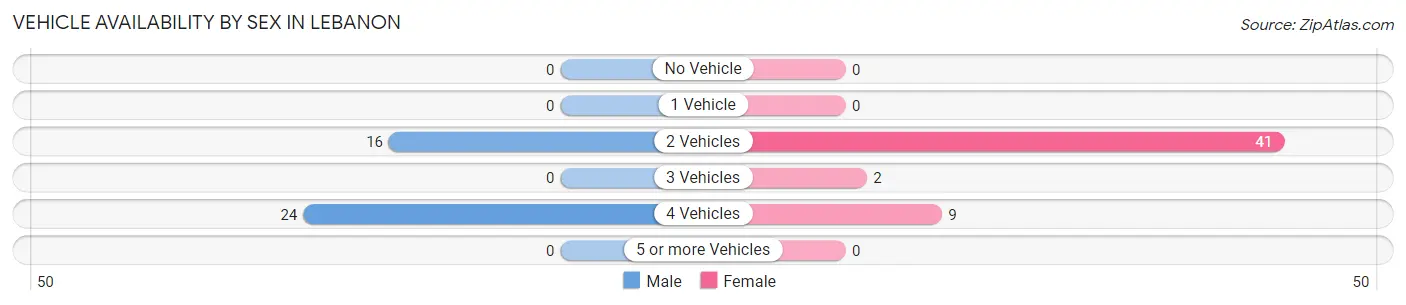
| Vehicles Available | Male | Female |
| No Vehicle | 0 (0.0%) | 0 (0.0%) |
| 1 Vehicle | 0 (0.0%) | 0 (0.0%) |
| 2 Vehicles | 16 (40.0%) | 41 (78.8%) |
| 3 Vehicles | 0 (0.0%) | 2 (3.8%) |
| 4 Vehicles | 24 (60.0%) | 9 (17.3%) |
| 5 or more Vehicles | 0 (0.0%) | 0 (0.0%) |
| Total | 40 (100.0%) | 52 (100.0%) |
Commute Time in Lebanon
The most frequently occuring commute durations in Lebanon are 30 to 34 minutes (31 commuters, 37.3%), 5 to 9 minutes (24 commuters, 28.9%), and 25 to 29 minutes (10 commuters, 12.0%).
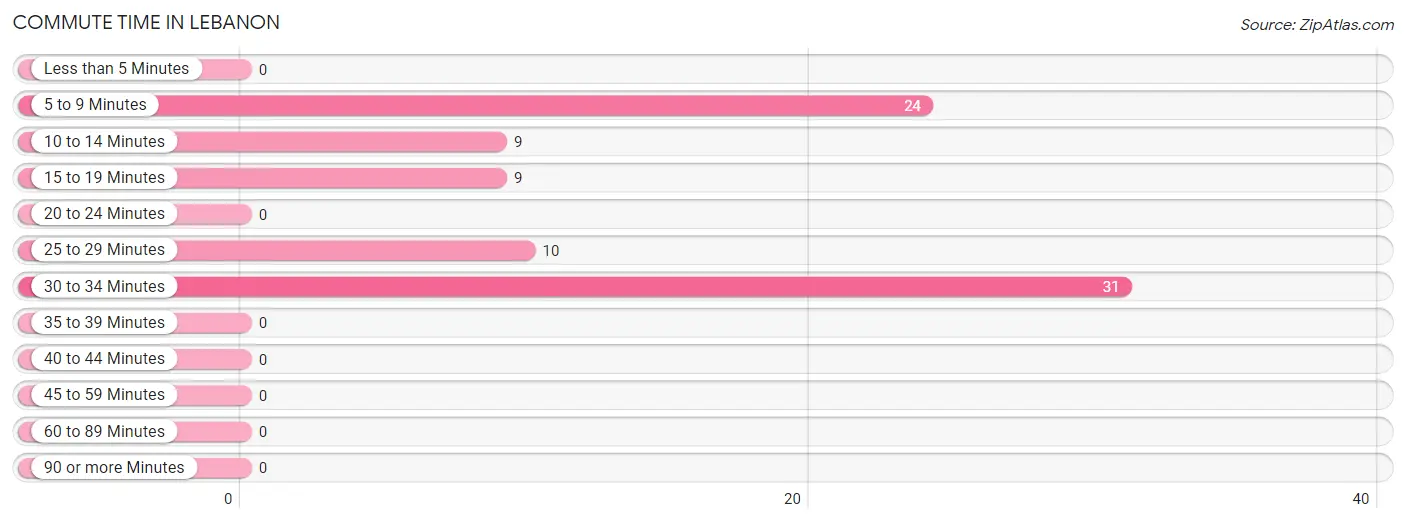
| Commute Time | # Commuters | % Commuters |
| Less than 5 Minutes | 0 | 0.0% |
| 5 to 9 Minutes | 24 | 28.9% |
| 10 to 14 Minutes | 9 | 10.8% |
| 15 to 19 Minutes | 9 | 10.8% |
| 20 to 24 Minutes | 0 | 0.0% |
| 25 to 29 Minutes | 10 | 12.0% |
| 30 to 34 Minutes | 31 | 37.3% |
| 35 to 39 Minutes | 0 | 0.0% |
| 40 to 44 Minutes | 0 | 0.0% |
| 45 to 59 Minutes | 0 | 0.0% |
| 60 to 89 Minutes | 0 | 0.0% |
| 90 or more Minutes | 0 | 0.0% |
Commute Time by Sex in Lebanon
The most common commute times in Lebanon are 5 to 9 minutes (24 commuters, 60.0%) for males and 30 to 34 minutes (31 commuters, 72.1%) for females.
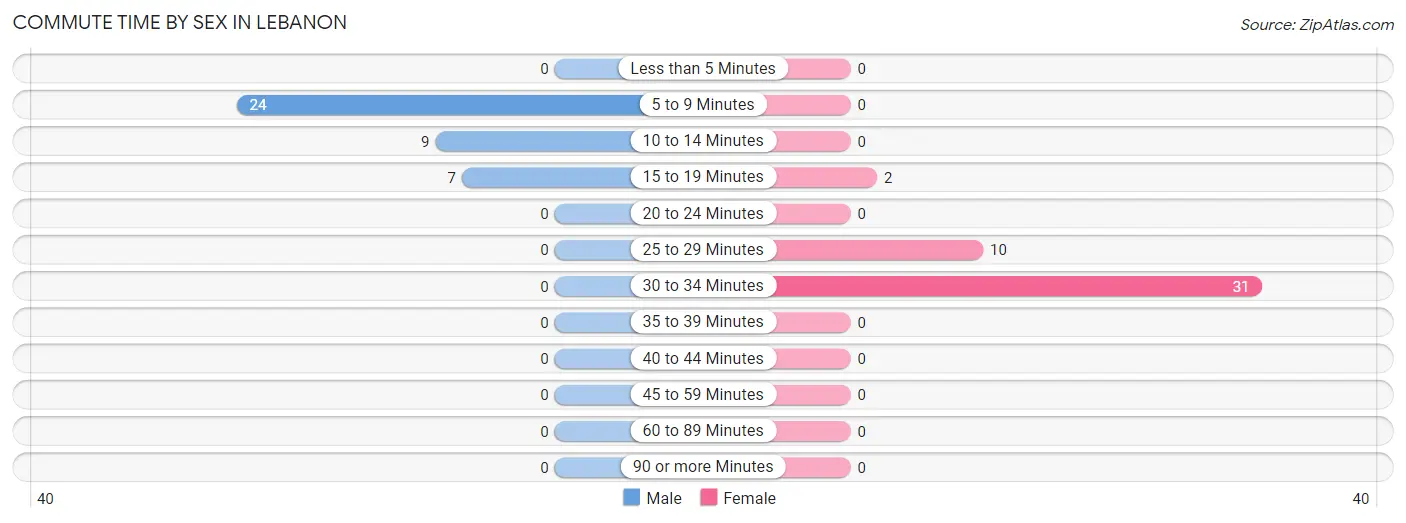
| Commute Time | Male | Female |
| Less than 5 Minutes | 0 (0.0%) | 0 (0.0%) |
| 5 to 9 Minutes | 24 (60.0%) | 0 (0.0%) |
| 10 to 14 Minutes | 9 (22.5%) | 0 (0.0%) |
| 15 to 19 Minutes | 7 (17.5%) | 2 (4.6%) |
| 20 to 24 Minutes | 0 (0.0%) | 0 (0.0%) |
| 25 to 29 Minutes | 0 (0.0%) | 10 (23.3%) |
| 30 to 34 Minutes | 0 (0.0%) | 31 (72.1%) |
| 35 to 39 Minutes | 0 (0.0%) | 0 (0.0%) |
| 40 to 44 Minutes | 0 (0.0%) | 0 (0.0%) |
| 45 to 59 Minutes | 0 (0.0%) | 0 (0.0%) |
| 60 to 89 Minutes | 0 (0.0%) | 0 (0.0%) |
| 90 or more Minutes | 0 (0.0%) | 0 (0.0%) |
Time of Departure to Work by Sex in Lebanon
The most frequent times of departure to work in Lebanon are 8:00 AM to 8:29 AM (24, 60.0%) for males and 7:00 AM to 7:29 AM (13, 30.2%) for females.
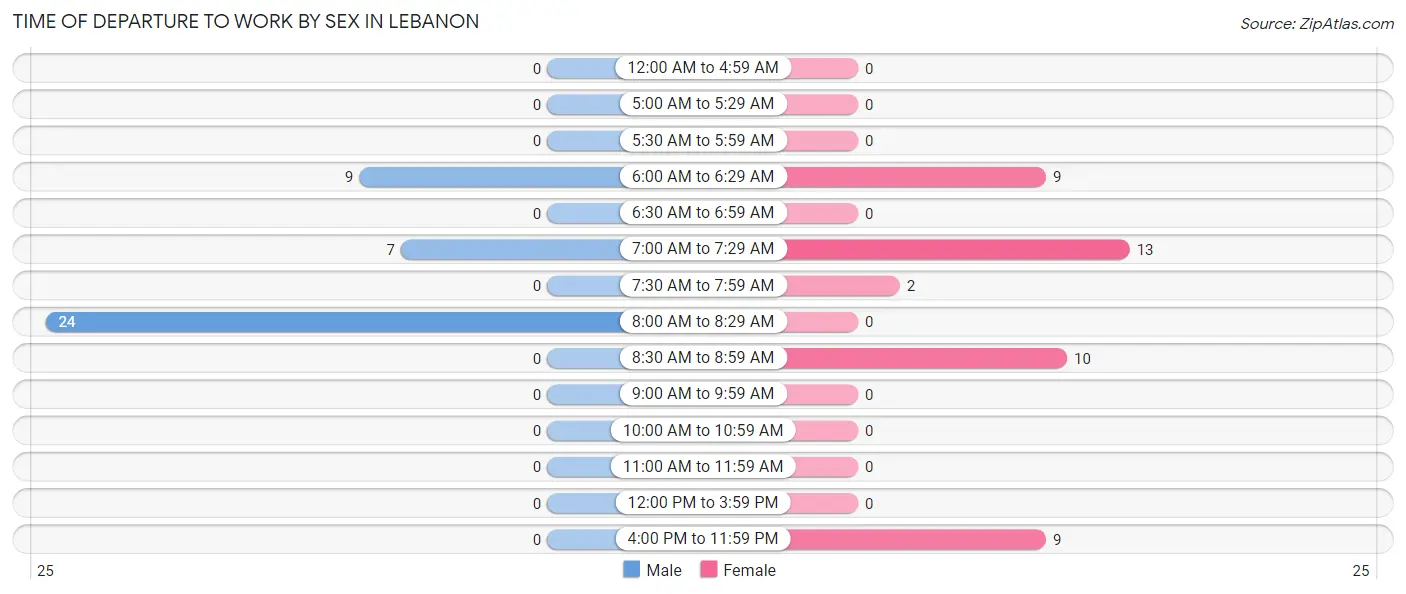
| Time of Departure | Male | Female |
| 12:00 AM to 4:59 AM | 0 (0.0%) | 0 (0.0%) |
| 5:00 AM to 5:29 AM | 0 (0.0%) | 0 (0.0%) |
| 5:30 AM to 5:59 AM | 0 (0.0%) | 0 (0.0%) |
| 6:00 AM to 6:29 AM | 9 (22.5%) | 9 (20.9%) |
| 6:30 AM to 6:59 AM | 0 (0.0%) | 0 (0.0%) |
| 7:00 AM to 7:29 AM | 7 (17.5%) | 13 (30.2%) |
| 7:30 AM to 7:59 AM | 0 (0.0%) | 2 (4.6%) |
| 8:00 AM to 8:29 AM | 24 (60.0%) | 0 (0.0%) |
| 8:30 AM to 8:59 AM | 0 (0.0%) | 10 (23.3%) |
| 9:00 AM to 9:59 AM | 0 (0.0%) | 0 (0.0%) |
| 10:00 AM to 10:59 AM | 0 (0.0%) | 0 (0.0%) |
| 11:00 AM to 11:59 AM | 0 (0.0%) | 0 (0.0%) |
| 12:00 PM to 3:59 PM | 0 (0.0%) | 0 (0.0%) |
| 4:00 PM to 11:59 PM | 0 (0.0%) | 9 (20.9%) |
| Total | 40 (100.0%) | 43 (100.0%) |
Housing Occupancy in Lebanon
Occupancy by Ownership in Lebanon
Of the total 74 dwellings in Lebanon, owner-occupied units account for 70 (94.6%), while renter-occupied units make up 4 (5.4%).
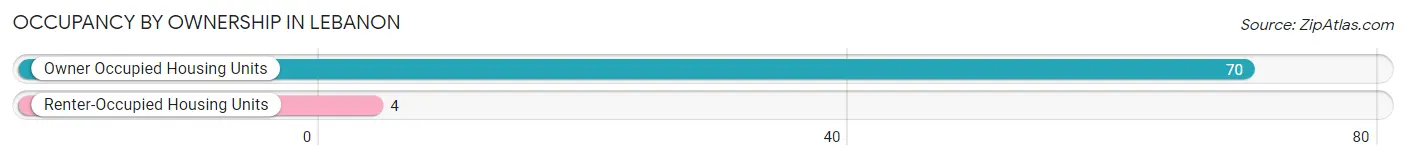
| Occupancy | # Housing Units | % Housing Units |
| Owner Occupied Housing Units | 70 | 94.6% |
| Renter-Occupied Housing Units | 4 | 5.4% |
| Total Occupied Housing Units | 74 | 100.0% |
Occupancy by Household Size in Lebanon
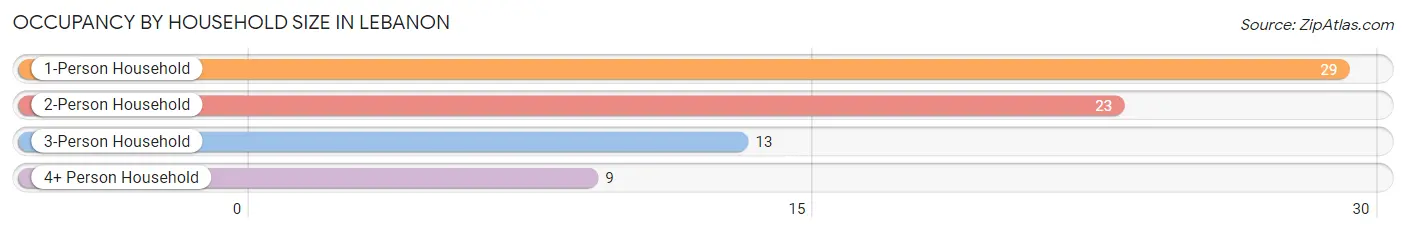
| Household Size | # Housing Units | % Housing Units |
| 1-Person Household | 29 | 39.2% |
| 2-Person Household | 23 | 31.1% |
| 3-Person Household | 13 | 17.6% |
| 4+ Person Household | 9 | 12.2% |
| Total Housing Units | 74 | 100.0% |
Occupancy by Ownership by Household Size in Lebanon
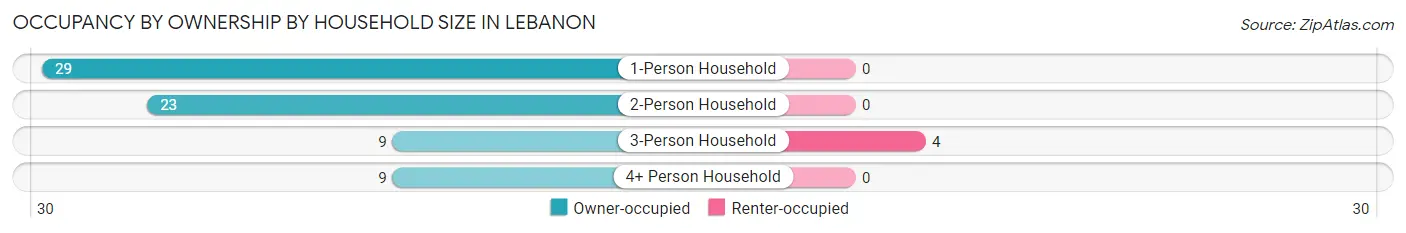
| Household Size | Owner-occupied | Renter-occupied |
| 1-Person Household | 29 (100.0%) | 0 (0.0%) |
| 2-Person Household | 23 (100.0%) | 0 (0.0%) |
| 3-Person Household | 9 (69.2%) | 4 (30.8%) |
| 4+ Person Household | 9 (100.0%) | 0 (0.0%) |
| Total Housing Units | 70 (94.6%) | 4 (5.4%) |
Occupancy by Educational Attainment in Lebanon
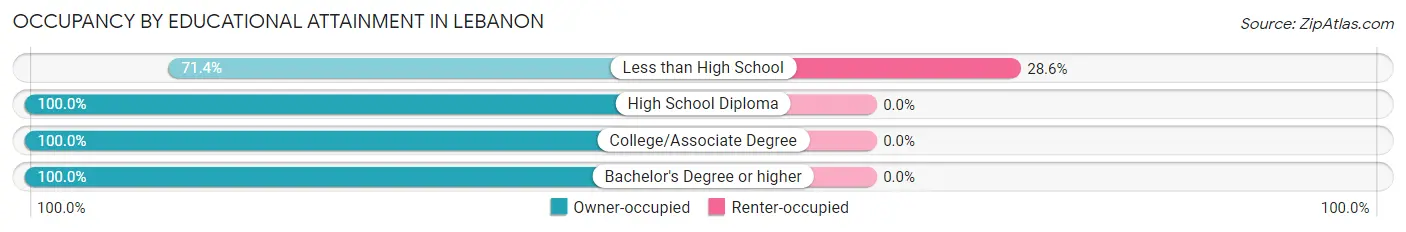
| Household Size | Owner-occupied | Renter-occupied |
| Less than High School | 10 (71.4%) | 4 (28.6%) |
| High School Diploma | 9 (100.0%) | 0 (0.0%) |
| College/Associate Degree | 26 (100.0%) | 0 (0.0%) |
| Bachelor's Degree or higher | 25 (100.0%) | 0 (0.0%) |
Occupancy by Age of Householder in Lebanon
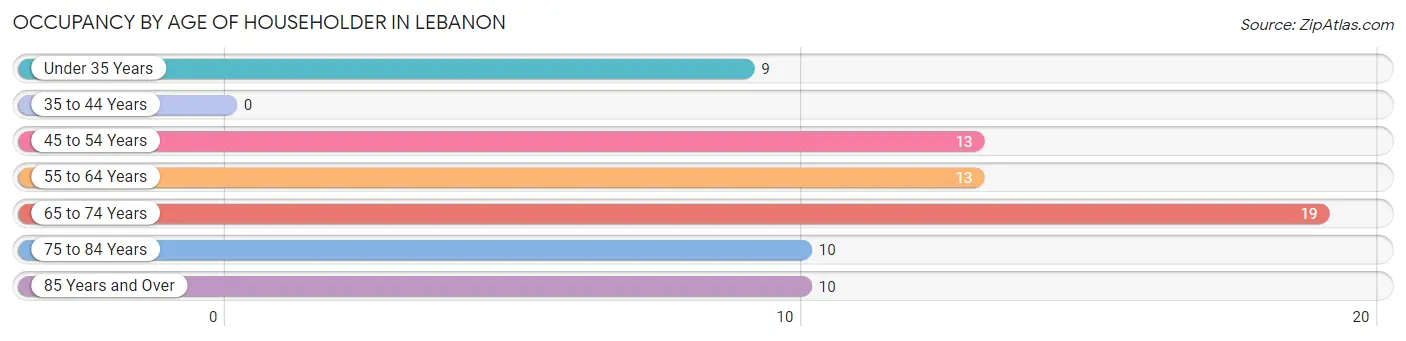
| Age Bracket | # Households | % Households |
| Under 35 Years | 9 | 12.2% |
| 35 to 44 Years | 0 | 0.0% |
| 45 to 54 Years | 13 | 17.6% |
| 55 to 64 Years | 13 | 17.6% |
| 65 to 74 Years | 19 | 25.7% |
| 75 to 84 Years | 10 | 13.5% |
| 85 Years and Over | 10 | 13.5% |
| Total | 74 | 100.0% |
Housing Finances in Lebanon
Median Income by Occupancy in Lebanon
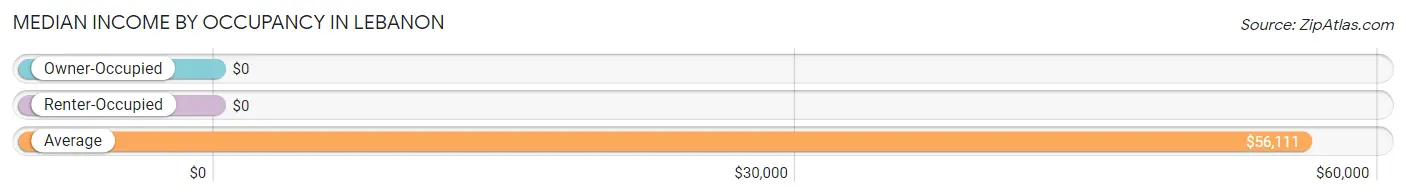
| Occupancy Type | # Households | Median Income |
| Owner-Occupied | 70 (94.6%) | $0 |
| Renter-Occupied | 4 (5.4%) | $0 |
| Average | 74 (100.0%) | $56,111 |
Occupancy by Householder Income Bracket in Lebanon
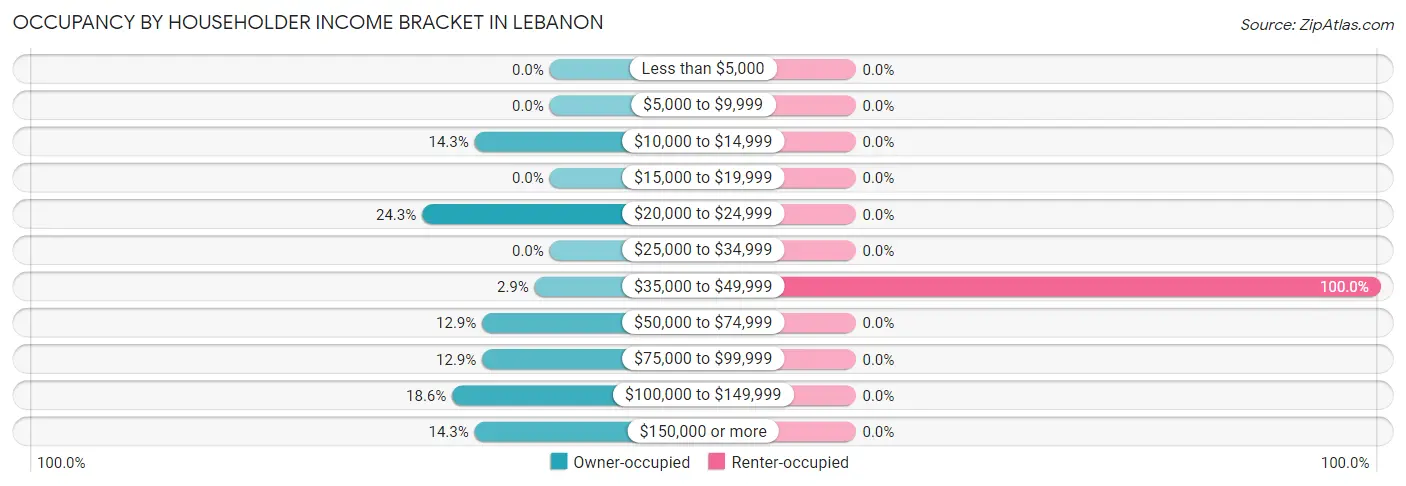
| Income Bracket | Owner-occupied | Renter-occupied |
| Less than $5,000 | 0 (0.0%) | 0 (0.0%) |
| $5,000 to $9,999 | 0 (0.0%) | 0 (0.0%) |
| $10,000 to $14,999 | 10 (14.3%) | 0 (0.0%) |
| $15,000 to $19,999 | 0 (0.0%) | 0 (0.0%) |
| $20,000 to $24,999 | 17 (24.3%) | 0 (0.0%) |
| $25,000 to $34,999 | 0 (0.0%) | 0 (0.0%) |
| $35,000 to $49,999 | 2 (2.9%) | 4 (100.0%) |
| $50,000 to $74,999 | 9 (12.9%) | 0 (0.0%) |
| $75,000 to $99,999 | 9 (12.9%) | 0 (0.0%) |
| $100,000 to $149,999 | 13 (18.6%) | 0 (0.0%) |
| $150,000 or more | 10 (14.3%) | 0 (0.0%) |
| Total | 70 (100.0%) | 4 (100.0%) |
Monthly Housing Cost Tiers in Lebanon
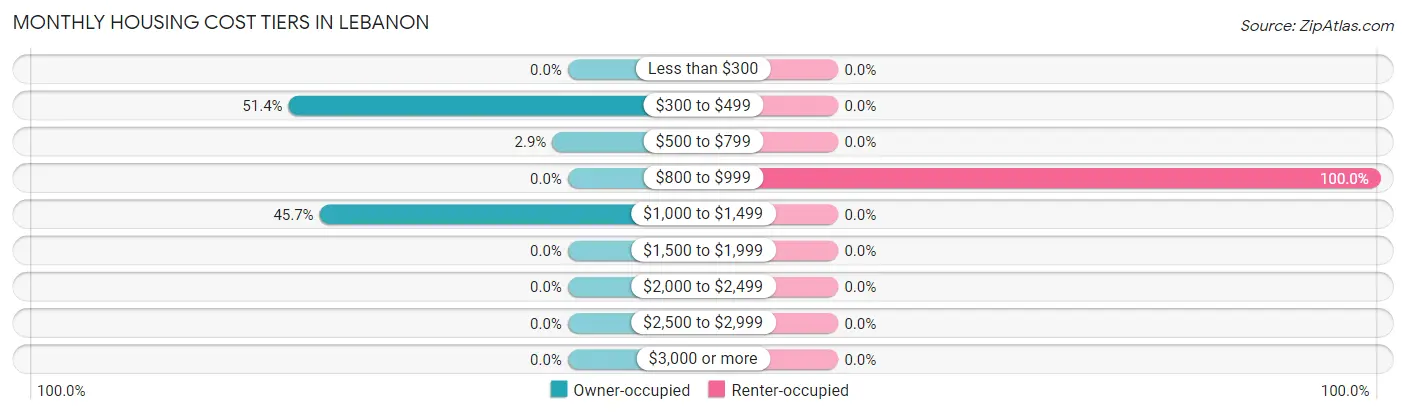
| Monthly Cost | Owner-occupied | Renter-occupied |
| Less than $300 | 0 (0.0%) | 0 (0.0%) |
| $300 to $499 | 36 (51.4%) | 0 (0.0%) |
| $500 to $799 | 2 (2.9%) | 0 (0.0%) |
| $800 to $999 | 0 (0.0%) | 4 (100.0%) |
| $1,000 to $1,499 | 32 (45.7%) | 0 (0.0%) |
| $1,500 to $1,999 | 0 (0.0%) | 0 (0.0%) |
| $2,000 to $2,499 | 0 (0.0%) | 0 (0.0%) |
| $2,500 to $2,999 | 0 (0.0%) | 0 (0.0%) |
| $3,000 or more | 0 (0.0%) | 0 (0.0%) |
| Total | 70 (100.0%) | 4 (100.0%) |
Physical Housing Characteristics in Lebanon
Housing Structures in Lebanon
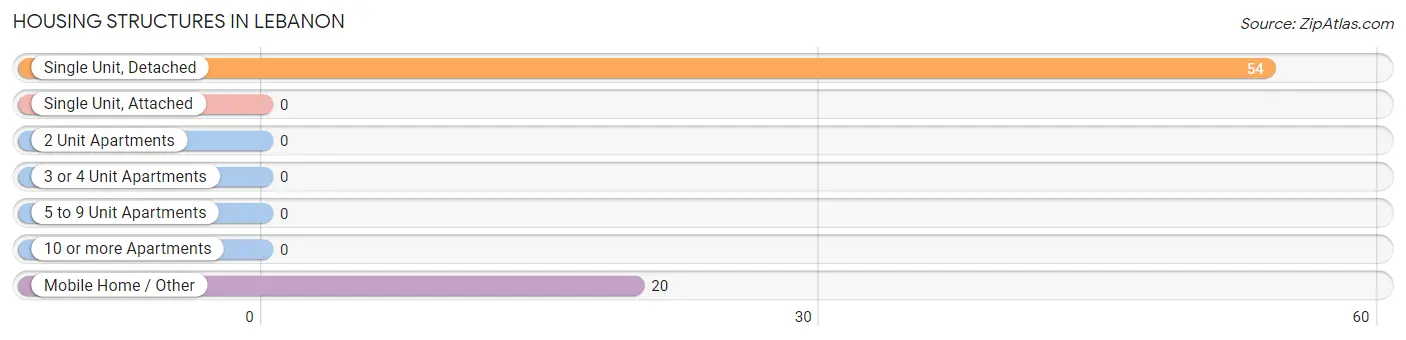
| Structure Type | # Housing Units | % Housing Units |
| Single Unit, Detached | 54 | 73.0% |
| Single Unit, Attached | 0 | 0.0% |
| 2 Unit Apartments | 0 | 0.0% |
| 3 or 4 Unit Apartments | 0 | 0.0% |
| 5 to 9 Unit Apartments | 0 | 0.0% |
| 10 or more Apartments | 0 | 0.0% |
| Mobile Home / Other | 20 | 27.0% |
| Total | 74 | 100.0% |
Housing Structures by Occupancy in Lebanon
| Structure Type | Owner-occupied | Renter-occupied |
| Single Unit, Detached | 50 (92.6%) | 4 (7.4%) |
| Single Unit, Attached | 0 (0.0%) | 0 (0.0%) |
| 2 Unit Apartments | 0 (0.0%) | 0 (0.0%) |
| 3 or 4 Unit Apartments | 0 (0.0%) | 0 (0.0%) |
| 5 to 9 Unit Apartments | 0 (0.0%) | 0 (0.0%) |
| 10 or more Apartments | 0 (0.0%) | 0 (0.0%) |
| Mobile Home / Other | 20 (100.0%) | 0 (0.0%) |
| Total | 70 (94.6%) | 4 (5.4%) |
Housing Structures by Number of Rooms in Lebanon
| Number of Rooms | Owner-occupied | Renter-occupied |
| 1 Room | 0 (0.0%) | 0 (0.0%) |
| 2 or 3 Rooms | 0 (0.0%) | 0 (0.0%) |
| 4 or 5 Rooms | 28 (40.0%) | 4 (100.0%) |
| 6 or 7 Rooms | 42 (60.0%) | 0 (0.0%) |
| 8 or more Rooms | 0 (0.0%) | 0 (0.0%) |
| Total | 70 (100.0%) | 4 (100.0%) |
Housing Structure by Heating Type in Lebanon
| Heating Type | Owner-occupied | Renter-occupied |
| Utility Gas | 0 (0.0%) | 0 (0.0%) |
| Bottled, Tank, or LP Gas | 0 (0.0%) | 0 (0.0%) |
| Electricity | 70 (100.0%) | 4 (100.0%) |
| Fuel Oil or Kerosene | 0 (0.0%) | 0 (0.0%) |
| Coal or Coke | 0 (0.0%) | 0 (0.0%) |
| All other Fuels | 0 (0.0%) | 0 (0.0%) |
| No Fuel Used | 0 (0.0%) | 0 (0.0%) |
| Total | 70 (100.0%) | 4 (100.0%) |
Household Vehicle Usage in Lebanon
| Vehicles per Household | Owner-occupied | Renter-occupied |
| No Vehicle | 0 (0.0%) | 0 (0.0%) |
| 1 Vehicle | 20 (28.6%) | 0 (0.0%) |
| 2 Vehicles | 39 (55.7%) | 4 (100.0%) |
| 3 or more Vehicles | 11 (15.7%) | 0 (0.0%) |
| Total | 70 (100.0%) | 4 (100.0%) |
Real Estate & Mortgages in Lebanon
Real Estate and Mortgage Overview in Lebanon
| Characteristic | Without Mortgage | With Mortgage |
| Housing Units | 37 | 33 |
| Median Property Value | - | - |
| Median Household Income | - | - |
| Monthly Housing Costs | $349 | $0 |
| Real Estate Taxes | $633 | $0 |
Property Value by Mortgage Status in Lebanon
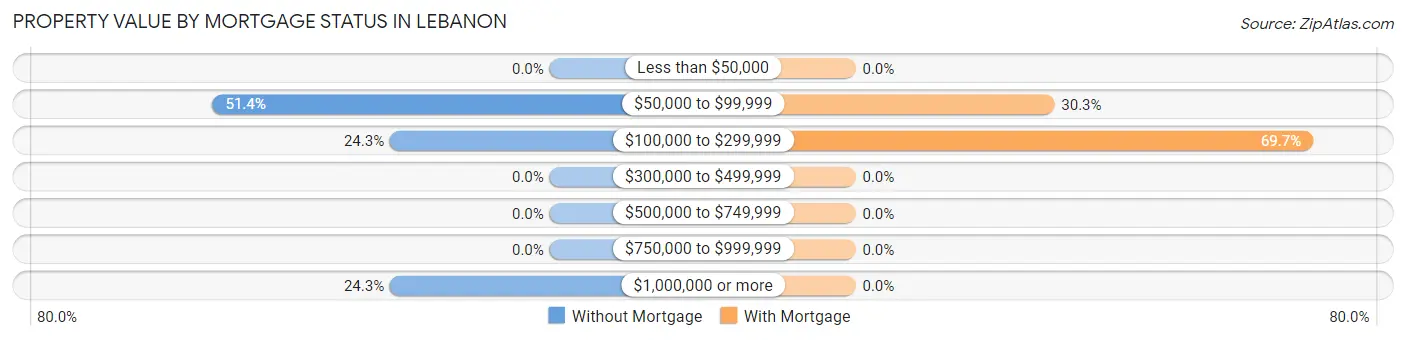
| Property Value | Without Mortgage | With Mortgage |
| Less than $50,000 | 0 (0.0%) | 0 (0.0%) |
| $50,000 to $99,999 | 19 (51.3%) | 10 (30.3%) |
| $100,000 to $299,999 | 9 (24.3%) | 23 (69.7%) |
| $300,000 to $499,999 | 0 (0.0%) | 0 (0.0%) |
| $500,000 to $749,999 | 0 (0.0%) | 0 (0.0%) |
| $750,000 to $999,999 | 0 (0.0%) | 0 (0.0%) |
| $1,000,000 or more | 9 (24.3%) | 0 (0.0%) |
| Total | 37 (100.0%) | 33 (100.0%) |
Household Income by Mortgage Status in Lebanon
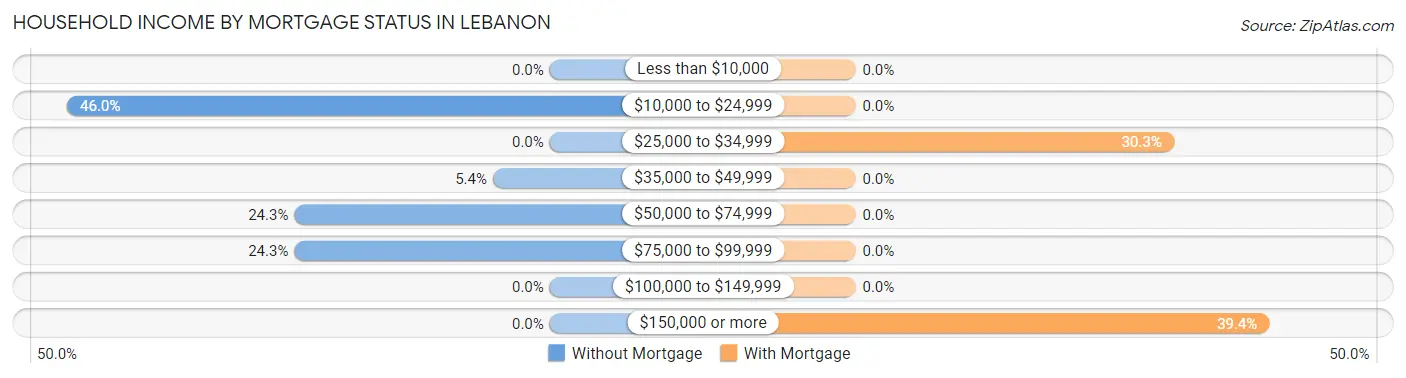
| Household Income | Without Mortgage | With Mortgage |
| Less than $10,000 | 0 (0.0%) | 0 (0.0%) |
| $10,000 to $24,999 | 17 (46.0%) | 0 (0.0%) |
| $25,000 to $34,999 | 0 (0.0%) | 10 (30.3%) |
| $35,000 to $49,999 | 2 (5.4%) | 0 (0.0%) |
| $50,000 to $74,999 | 9 (24.3%) | 0 (0.0%) |
| $75,000 to $99,999 | 9 (24.3%) | 0 (0.0%) |
| $100,000 to $149,999 | 0 (0.0%) | 0 (0.0%) |
| $150,000 or more | 0 (0.0%) | 13 (39.4%) |
| Total | 37 (100.0%) | 33 (100.0%) |
Property Value to Household Income Ratio in Lebanon
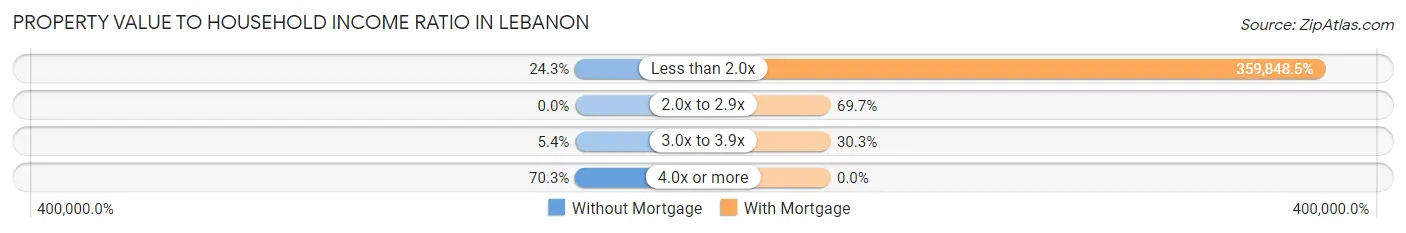
| Value-to-Income Ratio | Without Mortgage | With Mortgage |
| Less than 2.0x | 9 (24.3%) | 118,750 (359,848.5%) |
| 2.0x to 2.9x | 0 (0.0%) | 23 (69.7%) |
| 3.0x to 3.9x | 2 (5.4%) | 10 (30.3%) |
| 4.0x or more | 26 (70.3%) | 0 (0.0%) |
| Total | 37 (100.0%) | 33 (100.0%) |
Real Estate Taxes by Mortgage Status in Lebanon
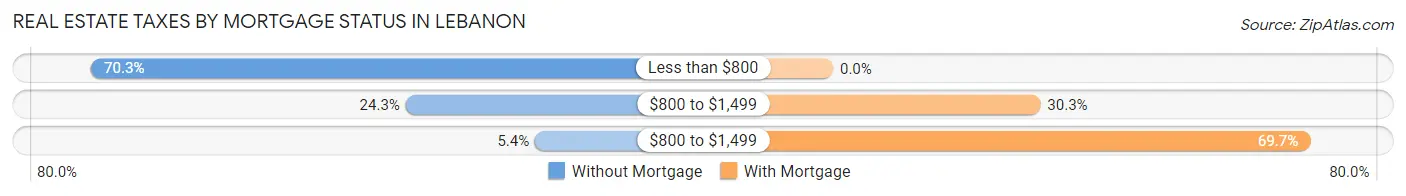
| Property Taxes | Without Mortgage | With Mortgage |
| Less than $800 | 26 (70.3%) | 0 (0.0%) |
| $800 to $1,499 | 9 (24.3%) | 10 (30.3%) |
| $800 to $1,499 | 2 (5.4%) | 23 (69.7%) |
| Total | 37 (100.0%) | 33 (100.0%) |
Health & Disability in Lebanon
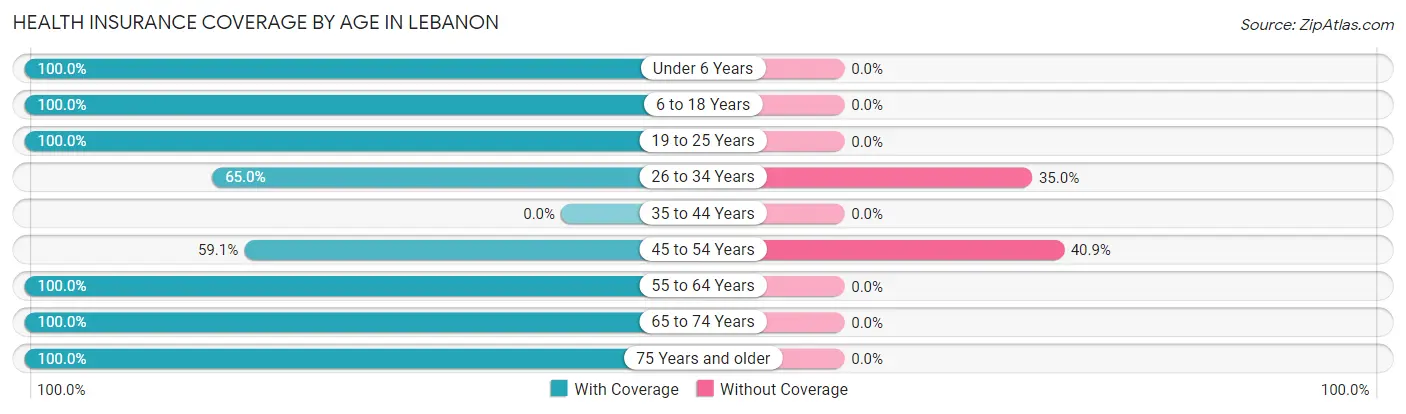
Health Insurance Coverage by Age in Lebanon
| Age Bracket | With Coverage | Without Coverage |
| Under 6 Years | 32 (100.0%) | 0 (0.0%) |
| 6 to 18 Years | 16 (100.0%) | 0 (0.0%) |
| 19 to 25 Years | 9 (100.0%) | 0 (0.0%) |
| 26 to 34 Years | 26 (65.0%) | 14 (35.0%) |
| 35 to 44 Years | 0 (0.0%) | 0 (0.0%) |
| 45 to 54 Years | 13 (59.1%) | 9 (40.9%) |
| 55 to 64 Years | 13 (100.0%) | 0 (0.0%) |
| 65 to 74 Years | 60 (100.0%) | 0 (0.0%) |
| 75 Years and older | 20 (100.0%) | 0 (0.0%) |
| Total | 189 (89.1%) | 23 (10.8%) |
Health Insurance Coverage by Citizenship Status in Lebanon
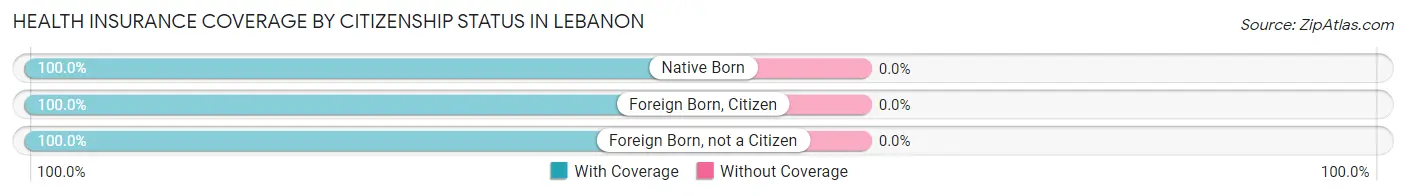
| Citizenship Status | With Coverage | Without Coverage |
| Native Born | 32 (100.0%) | 0 (0.0%) |
| Foreign Born, Citizen | 16 (100.0%) | 0 (0.0%) |
| Foreign Born, not a Citizen | 9 (100.0%) | 0 (0.0%) |
Health Insurance Coverage by Household Income in Lebanon
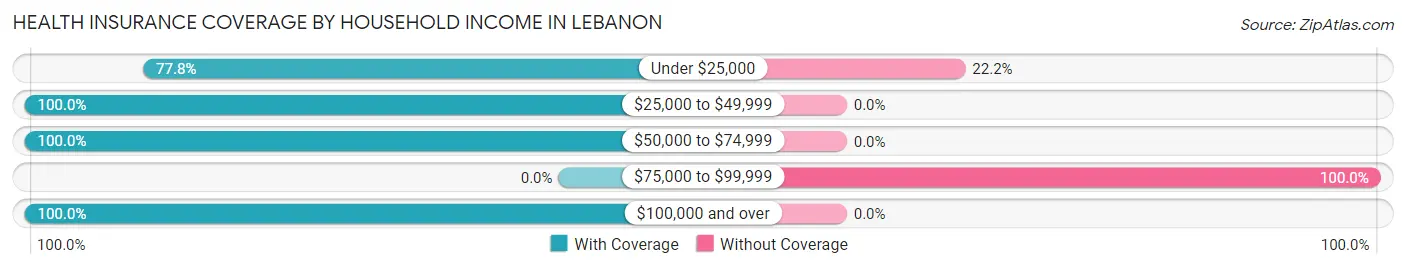
| Household Income | With Coverage | Without Coverage |
| Under $25,000 | 49 (77.8%) | 14 (22.2%) |
| $25,000 to $49,999 | 49 (100.0%) | 0 (0.0%) |
| $50,000 to $74,999 | 46 (100.0%) | 0 (0.0%) |
| $75,000 to $99,999 | 0 (0.0%) | 9 (100.0%) |
| $100,000 and over | 45 (100.0%) | 0 (0.0%) |
Public vs Private Health Insurance Coverage by Age in Lebanon
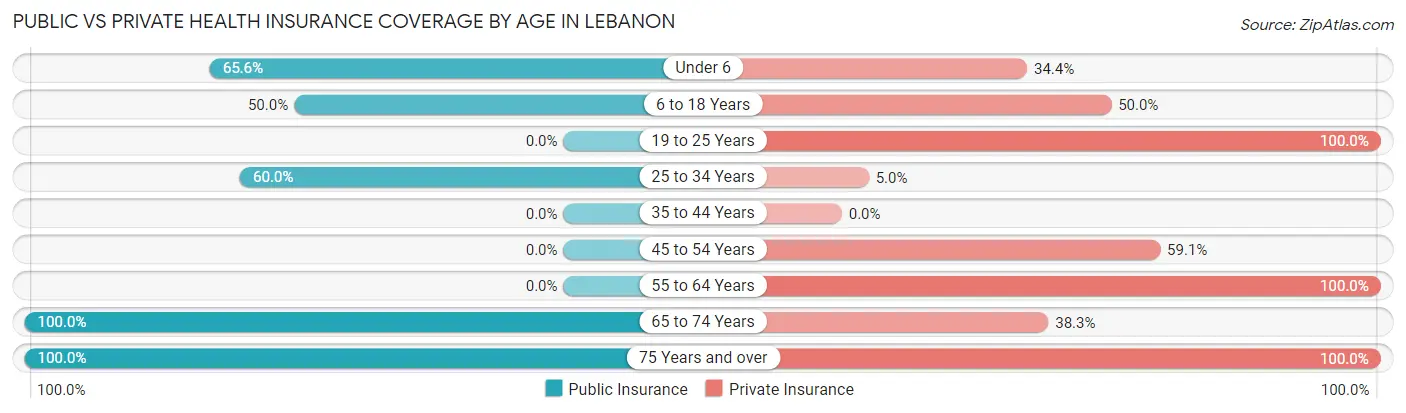
| Age Bracket | Public Insurance | Private Insurance |
| Under 6 | 21 (65.6%) | 11 (34.4%) |
| 6 to 18 Years | 8 (50.0%) | 8 (50.0%) |
| 19 to 25 Years | 0 (0.0%) | 9 (100.0%) |
| 25 to 34 Years | 24 (60.0%) | 2 (5.0%) |
| 35 to 44 Years | 0 (0.0%) | 0 (0.0%) |
| 45 to 54 Years | 0 (0.0%) | 13 (59.1%) |
| 55 to 64 Years | 0 (0.0%) | 13 (100.0%) |
| 65 to 74 Years | 60 (100.0%) | 23 (38.3%) |
| 75 Years and over | 20 (100.0%) | 20 (100.0%) |
| Total | 133 (62.7%) | 99 (46.7%) |
Disability Status by Sex by Age in Lebanon
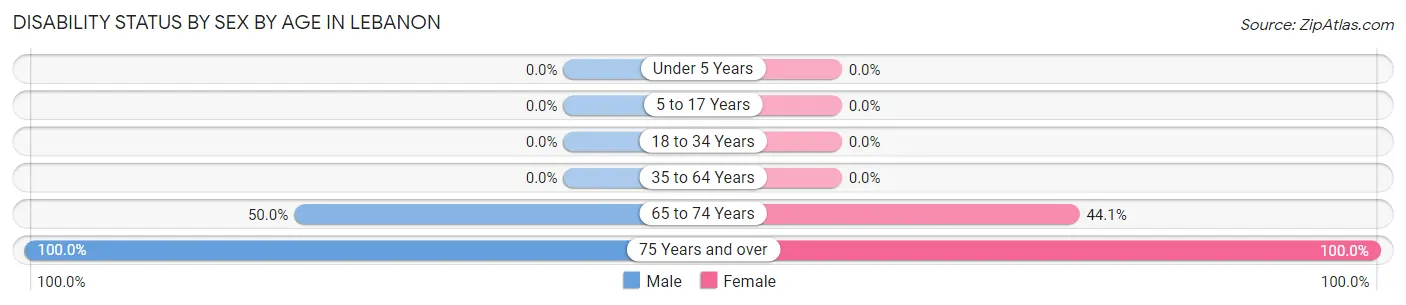
| Age Bracket | Male | Female |
| Under 5 Years | 0 (0.0%) | 0 (0.0%) |
| 5 to 17 Years | 0 (0.0%) | 0 (0.0%) |
| 18 to 34 Years | 0 (0.0%) | 0 (0.0%) |
| 35 to 64 Years | 0 (0.0%) | 0 (0.0%) |
| 65 to 74 Years | 13 (50.0%) | 15 (44.1%) |
| 75 Years and over | 10 (100.0%) | 10 (100.0%) |
Disability Class by Sex by Age in Lebanon
Disability Class: Hearing Difficulty
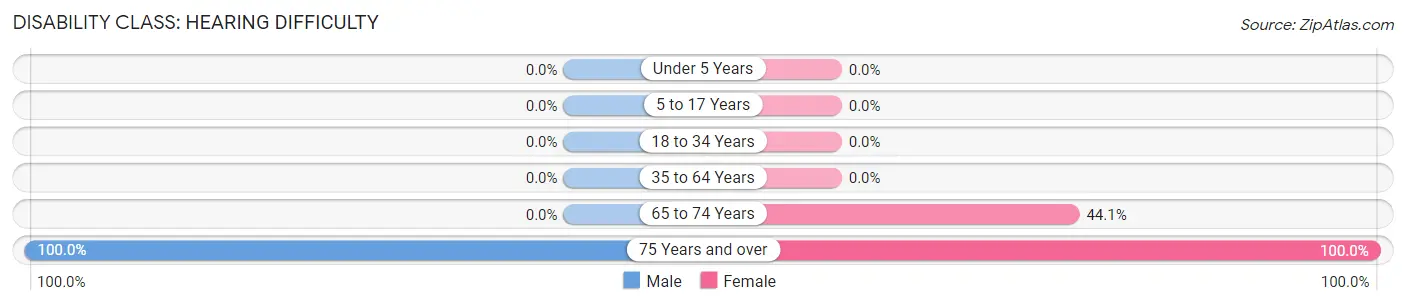
| Age Bracket | Male | Female |
| Under 5 Years | 0 (0.0%) | 0 (0.0%) |
| 5 to 17 Years | 0 (0.0%) | 0 (0.0%) |
| 18 to 34 Years | 0 (0.0%) | 0 (0.0%) |
| 35 to 64 Years | 0 (0.0%) | 0 (0.0%) |
| 65 to 74 Years | 0 (0.0%) | 15 (44.1%) |
| 75 Years and over | 10 (100.0%) | 10 (100.0%) |
Disability Class: Vision Difficulty
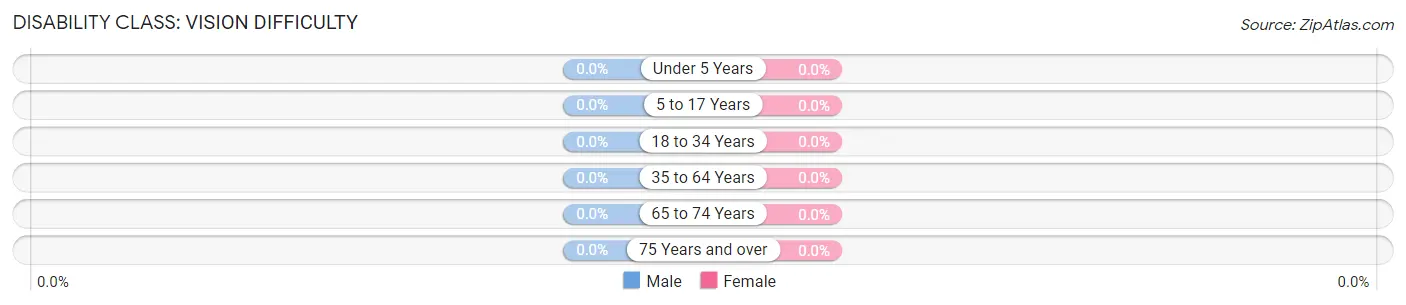
| Age Bracket | Male | Female |
| Under 5 Years | 0 (0.0%) | 0 (0.0%) |
| 5 to 17 Years | 0 (0.0%) | 0 (0.0%) |
| 18 to 34 Years | 0 (0.0%) | 0 (0.0%) |
| 35 to 64 Years | 0 (0.0%) | 0 (0.0%) |
| 65 to 74 Years | 0 (0.0%) | 0 (0.0%) |
| 75 Years and over | 0 (0.0%) | 0 (0.0%) |
Disability Class: Cognitive Difficulty

| Age Bracket | Male | Female |
| 5 to 17 Years | 0 (0.0%) | 0 (0.0%) |
| 18 to 34 Years | 0 (0.0%) | 0 (0.0%) |
| 35 to 64 Years | 0 (0.0%) | 0 (0.0%) |
| 65 to 74 Years | 0 (0.0%) | 0 (0.0%) |
| 75 Years and over | 0 (0.0%) | 0 (0.0%) |
Disability Class: Ambulatory Difficulty
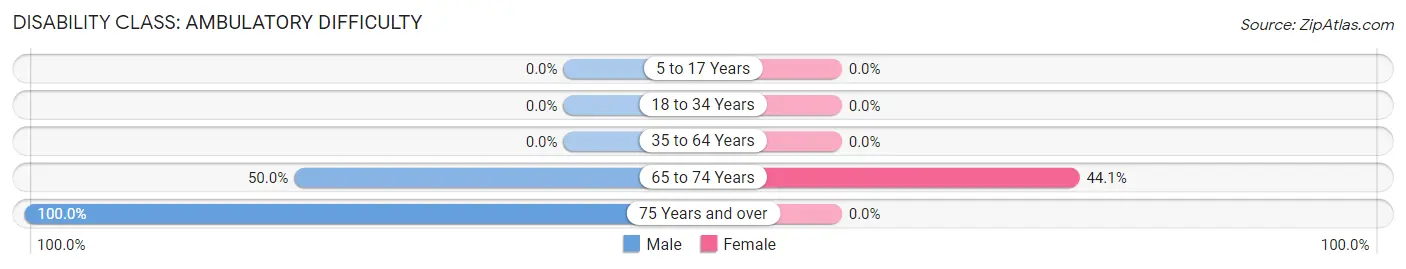
| Age Bracket | Male | Female |
| 5 to 17 Years | 0 (0.0%) | 0 (0.0%) |
| 18 to 34 Years | 0 (0.0%) | 0 (0.0%) |
| 35 to 64 Years | 0 (0.0%) | 0 (0.0%) |
| 65 to 74 Years | 13 (50.0%) | 15 (44.1%) |
| 75 Years and over | 10 (100.0%) | 0 (0.0%) |
Disability Class: Self-Care Difficulty
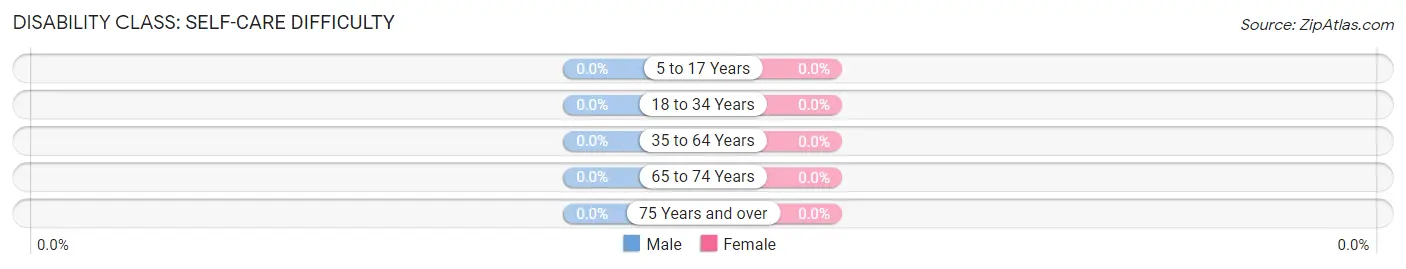
| Age Bracket | Male | Female |
| 5 to 17 Years | 0 (0.0%) | 0 (0.0%) |
| 18 to 34 Years | 0 (0.0%) | 0 (0.0%) |
| 35 to 64 Years | 0 (0.0%) | 0 (0.0%) |
| 65 to 74 Years | 0 (0.0%) | 0 (0.0%) |
| 75 Years and over | 0 (0.0%) | 0 (0.0%) |
Technology Access in Lebanon
Computing Device Access in Lebanon
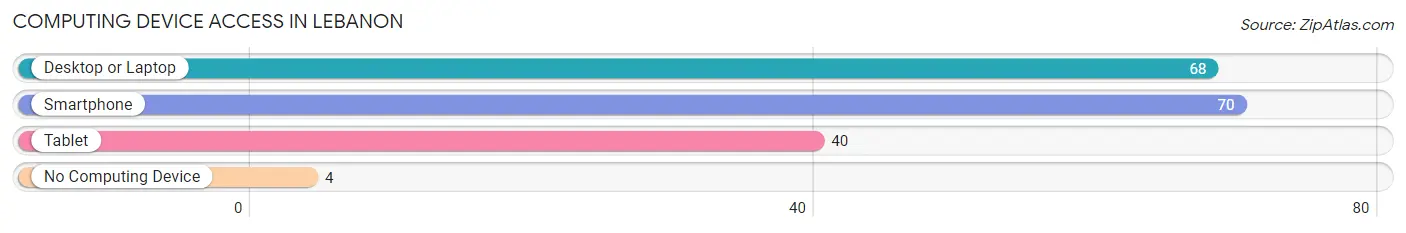
| Device Type | # Households | % Households |
| Desktop or Laptop | 68 | 91.9% |
| Smartphone | 70 | 94.6% |
| Tablet | 40 | 54.0% |
| No Computing Device | 4 | 5.4% |
| Total | 74 | 100.0% |
Internet Access in Lebanon
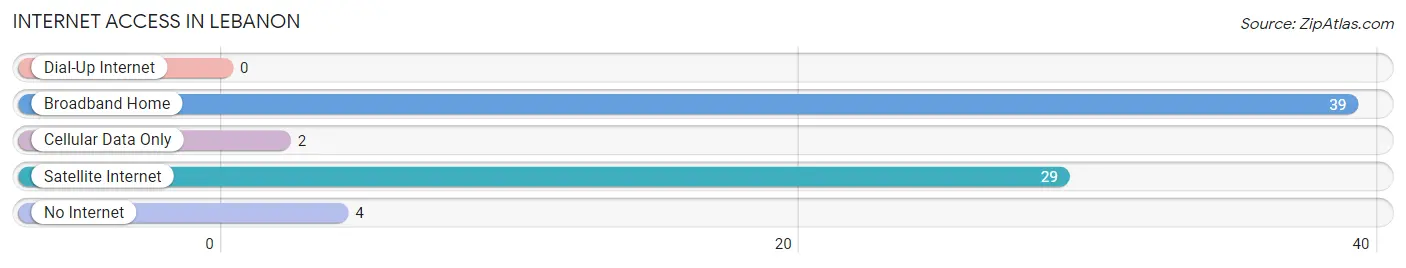
| Internet Type | # Households | % Households |
| Dial-Up Internet | 0 | 0.0% |
| Broadband Home | 39 | 52.7% |
| Cellular Data Only | 2 | 2.7% |
| Satellite Internet | 29 | 39.2% |
| No Internet | 4 | 5.4% |
| Total | 74 | 100.0% |
Lebanon Summary
Lebanon is a small town located in the southwestern corner of Oklahoma, in the foothills of the Ouachita Mountains. It is situated in the county of Latimer, and is the county seat. The town was founded in 1891 and was named after the biblical city of Lebanon. The population of Lebanon in 2000 was 1,845.
Geography
Lebanon is located in the foothills of the Ouachita Mountains, in the southwestern corner of Oklahoma. It is situated in Latimer County, and is the county seat. The town is located at the intersection of US Highway 271 and State Highway 2. The town is surrounded by rolling hills and wooded areas, and is located near the Kiamichi River. The climate in Lebanon is mild, with hot summers and mild winters.
Economy
Lebanon’s economy is largely based on agriculture and timber. The town is home to several small businesses, including a lumber mill, a feed store, and a hardware store. The town also has a small manufacturing sector, with several small factories producing furniture, clothing, and other goods. The town is also home to a number of small restaurants and shops.
Demographics
In 2000, the population of Lebanon was 1,845. The population is predominantly white, with a small African American population. The median household income in 2000 was $25,972, and the median family income was $31,972. The town has a high rate of poverty, with 24.3% of the population living below the poverty line.
Education
Lebanon is served by the Latimer County School District. The district operates two elementary schools, one middle school, and one high school. The town also has a private school, the Lebanon Christian Academy. The town is also home to a branch of Eastern Oklahoma State College.
Conclusion
Lebanon is a small town located in the southwestern corner of Oklahoma, in the foothills of the Ouachita Mountains. It is situated in Latimer County, and is the county seat. The town was founded in 1891 and was named after the biblical city of Lebanon. The population of Lebanon in 2000 was 1,845. The town’s economy is largely based on agriculture and timber, and it is home to several small businesses. The town is served by the Latimer County School District, and is also home to a branch of Eastern Oklahoma State College.
Common Questions
What is Per Capita Income in Lebanon?
Per Capita income in Lebanon is $28,705.
What is the Median Household income in Lebanon?
Median Household Income in Lebanon is $56,111.
What is Inequality or Gini Index in Lebanon?
Inequality or Gini Index in Lebanon is 0.41.
What is the Total Population of Lebanon?
Total Population of Lebanon is 212.
What is the Total Male Population of Lebanon?
Total Male Population of Lebanon is 109.
What is the Total Female Population of Lebanon?
Total Female Population of Lebanon is 103.
What is the Ratio of Males per 100 Females in Lebanon?
There are 105.83 Males per 100 Females in Lebanon.
What is the Ratio of Females per 100 Males in Lebanon?
There are 94.50 Females per 100 Males in Lebanon.
What is the Median Population Age in Lebanon?
Median Population Age in Lebanon is 48.5 Years.
What is the Average Family Size in Lebanon
Average Family Size in Lebanon is 3.9 People.
What is the Average Household Size in Lebanon
Average Household Size in Lebanon is 2.9 People.
How Large is the Labor Force in Lebanon?
There are 103 People in the Labor Forcein in Lebanon.
What is the Percentage of People in the Labor Force in Lebanon?
62.8% of People are in the Labor Force in Lebanon.
What is the Unemployment Rate in Lebanon?
Unemployment Rate in Lebanon is 3.9%.