Chevak, AK Map & Demographics
Chevak Map
Chevak Overview
$75,144
PER CAPITA INCOME
0.56
INEQUALITY / GINI INDEX
432
TOTAL POPULATION
320
MALE POPULATION
112
FEMALE POPULATION
285.71
MALES / 100 FEMALES
35.00
FEMALES / 100 MALES
35.9
MEDIAN AGE
5.4
AVG FAMILY SIZE
4.8
AVG HOUSEHOLD SIZE
245
LABOR FORCE [ PEOPLE ]
81.4%
PERCENT IN LABOR FORCE
13.5%
UNEMPLOYMENT RATE
Chevak Zip Codes
Chevak Area Codes
Income in Chevak
Income Overview in Chevak
| Characteristic | Number | Measure |
| Per Capita Income | 432 | $75,144 |
| Median Family Income | 49 | $0 |
| Mean Family Income | 49 | $95,537 |
| Median Household Income | 60 | $0 |
| Mean Household Income | 60 | $78,278 |
| Income Deficit | 49 | $0 |
| Wage / Income Gap (%) | 432 | 0.00% |
| Wage / Income Gap ($) | 432 | 100.00¢ per $1 |
| Gini / Inequality Index | 432 | 0.56 |
Earnings by Sex in Chevak
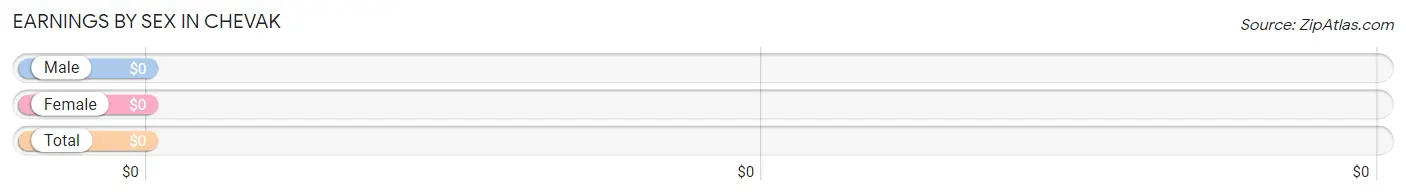
| Sex | Number | Average Earnings |
| Male | 190 (81.2%) | $0 |
| Female | 44 (18.8%) | $0 |
| Total | 234 (100.0%) | $0 |
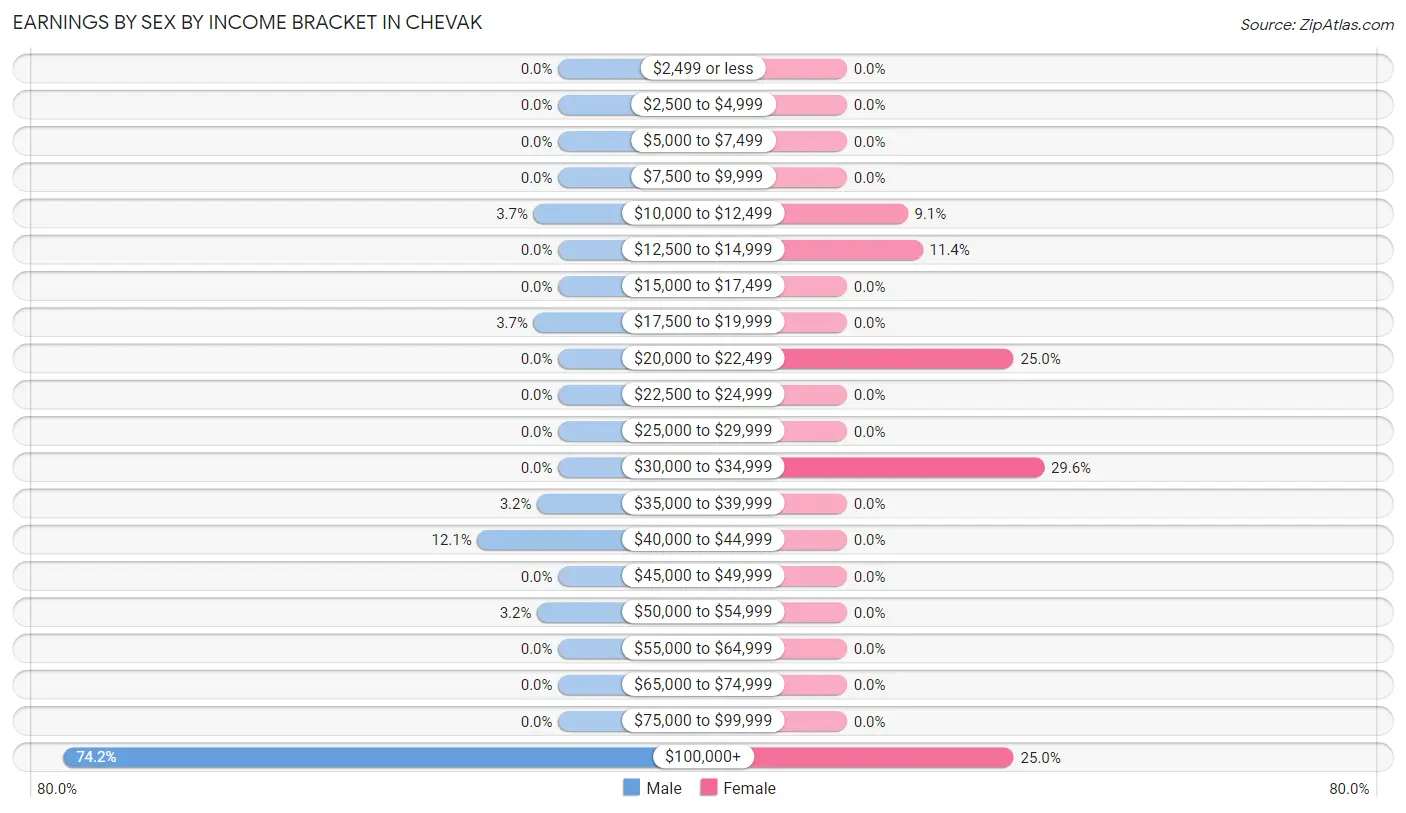
Earnings by Sex by Income Bracket in Chevak
The most common earnings brackets in Chevak are $100,000+ for men (141 | 74.2%) and $30,000 to $34,999 for women (13 | 29.5%).
| Income | Male | Female |
| $2,499 or less | 0 (0.0%) | 0 (0.0%) |
| $2,500 to $4,999 | 0 (0.0%) | 0 (0.0%) |
| $5,000 to $7,499 | 0 (0.0%) | 0 (0.0%) |
| $7,500 to $9,999 | 0 (0.0%) | 0 (0.0%) |
| $10,000 to $12,499 | 7 (3.7%) | 4 (9.1%) |
| $12,500 to $14,999 | 0 (0.0%) | 5 (11.4%) |
| $15,000 to $17,499 | 0 (0.0%) | 0 (0.0%) |
| $17,500 to $19,999 | 7 (3.7%) | 0 (0.0%) |
| $20,000 to $22,499 | 0 (0.0%) | 11 (25.0%) |
| $22,500 to $24,999 | 0 (0.0%) | 0 (0.0%) |
| $25,000 to $29,999 | 0 (0.0%) | 0 (0.0%) |
| $30,000 to $34,999 | 0 (0.0%) | 13 (29.5%) |
| $35,000 to $39,999 | 6 (3.2%) | 0 (0.0%) |
| $40,000 to $44,999 | 23 (12.1%) | 0 (0.0%) |
| $45,000 to $49,999 | 0 (0.0%) | 0 (0.0%) |
| $50,000 to $54,999 | 6 (3.2%) | 0 (0.0%) |
| $55,000 to $64,999 | 0 (0.0%) | 0 (0.0%) |
| $65,000 to $74,999 | 0 (0.0%) | 0 (0.0%) |
| $75,000 to $99,999 | 0 (0.0%) | 0 (0.0%) |
| $100,000+ | 141 (74.2%) | 11 (25.0%) |
| Total | 190 (100.0%) | 44 (100.0%) |
Earnings by Sex by Educational Attainment in Chevak
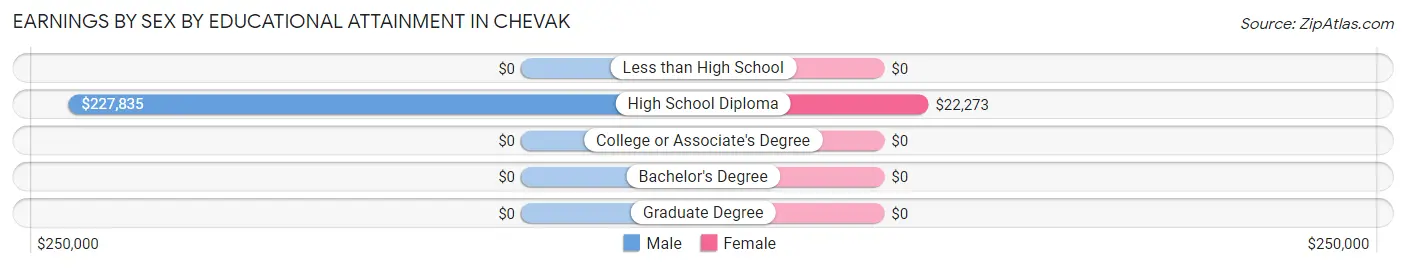
| Educational Attainment | Male Income | Female Income |
| Less than High School | - | - |
| High School Diploma | $227,835 | $22,273 |
| College or Associate's Degree | - | - |
| Bachelor's Degree | - | - |
| Graduate Degree | - | - |
| Total | - | - |
Family Income in Chevak
Family Income Brackets in Chevak
According to the Chevak family income data, there are 14 families falling into the $25,000 to $34,999 income range, which is the most common income bracket and makes up 28.6% of all families.
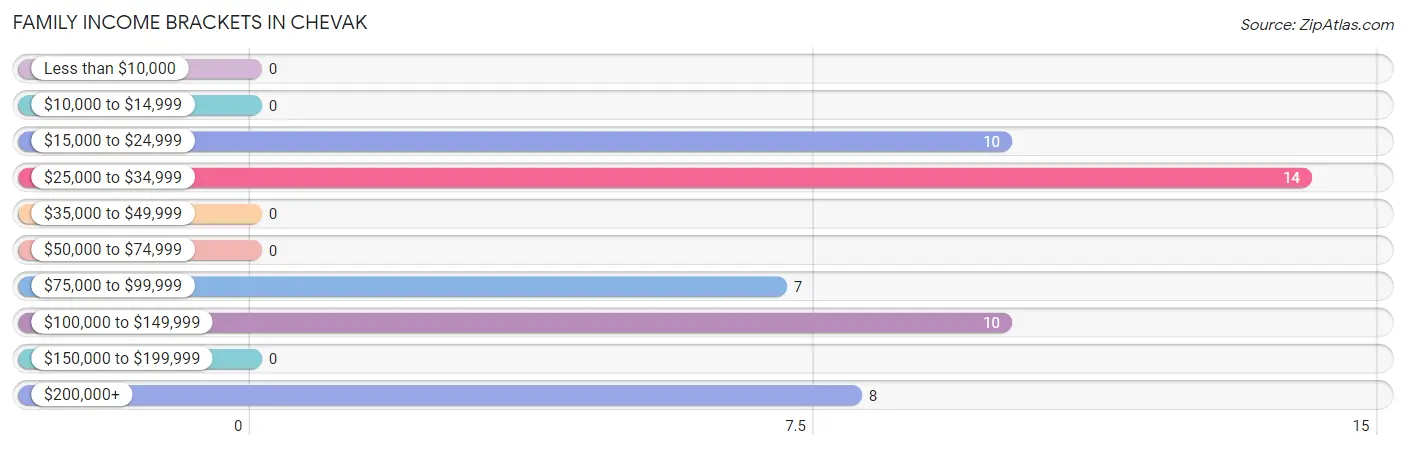
| Income Bracket | # Families | % Families |
| Less than $10,000 | 0 | 0.0% |
| $10,000 to $14,999 | 0 | 0.0% |
| $15,000 to $24,999 | 10 | 20.4% |
| $25,000 to $34,999 | 14 | 28.6% |
| $35,000 to $49,999 | 0 | 0.0% |
| $50,000 to $74,999 | 0 | 0.0% |
| $75,000 to $99,999 | 7 | 14.3% |
| $100,000 to $149,999 | 10 | 20.4% |
| $150,000 to $199,999 | 0 | 0.0% |
| $200,000+ | 8 | 16.3% |
Family Income by Famaliy Size in Chevak
| Income Bracket | # Families | Median Income |
| 2-Person Families | 0 (0.0%) | $0 |
| 3-Person Families | 13 (26.5%) | $0 |
| 4-Person Families | 0 (0.0%) | $0 |
| 5-Person Families | 14 (28.6%) | $0 |
| 6-Person Families | 9 (18.4%) | $0 |
| 7+ Person Families | 13 (26.5%) | $0 |
| Total | 49 (100.0%) | $0 |
Family Income by Number of Earners in Chevak
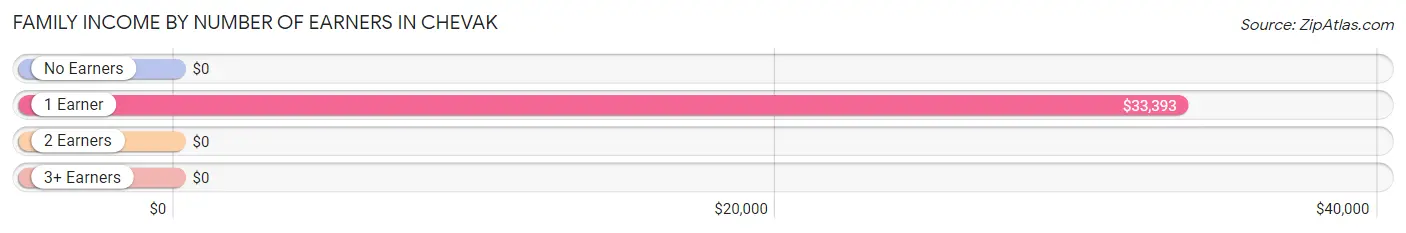
| Number of Earners | # Families | Median Income |
| No Earners | 6 (12.2%) | $0 |
| 1 Earner | 18 (36.7%) | $33,393 |
| 2 Earners | 7 (14.3%) | $0 |
| 3+ Earners | 18 (36.7%) | $0 |
| Total | 49 (100.0%) | $0 |
Household Income in Chevak
Household Income Brackets in Chevak
With 14 households falling in the category, the $25,000 to $34,999 income range is the most frequent in Chevak, accounting for 23.3% of all households.
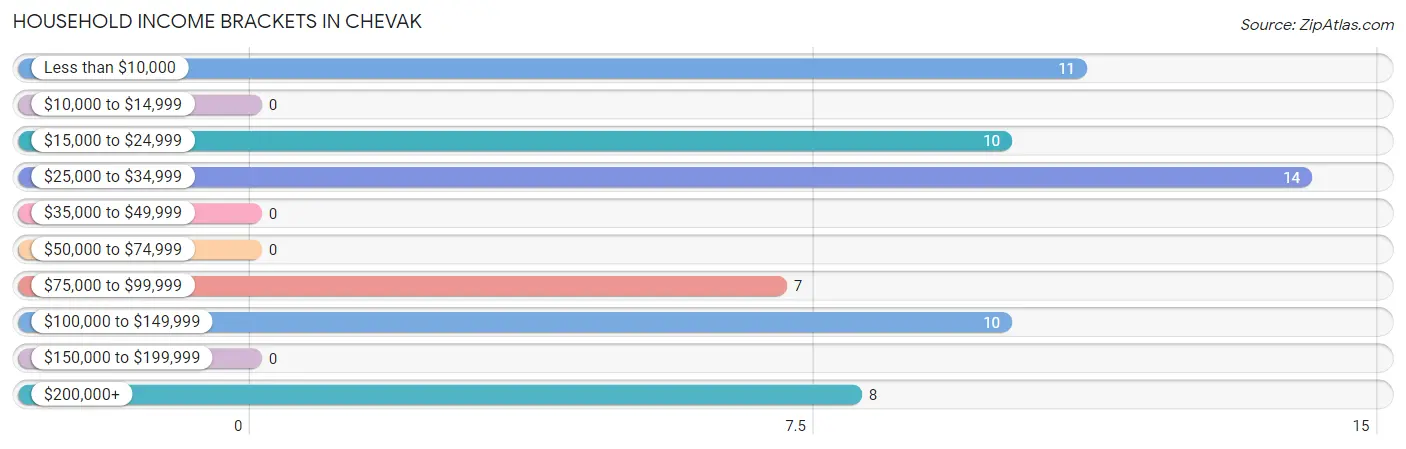
| Income Bracket | # Households | % Households |
| Less than $10,000 | 11 | 18.3% |
| $10,000 to $14,999 | 0 | 0.0% |
| $15,000 to $24,999 | 10 | 16.7% |
| $25,000 to $34,999 | 14 | 23.3% |
| $35,000 to $49,999 | 0 | 0.0% |
| $50,000 to $74,999 | 0 | 0.0% |
| $75,000 to $99,999 | 7 | 11.7% |
| $100,000 to $149,999 | 10 | 16.7% |
| $150,000 to $199,999 | 0 | 0.0% |
| $200,000+ | 8 | 13.3% |
Household Income by Householder Age in Chevak
| Income Bracket | # Households | Median Income |
| 15 to 24 Years | 0 (0.0%) | $0 |
| 25 to 44 Years | 20 (33.3%) | $0 |
| 45 to 64 Years | 28 (46.7%) | $0 |
| 65+ Years | 12 (20.0%) | $0 |
| Total | 60 (100.0%) | $0 |
Poverty in Chevak
Income Below Poverty by Sex and Age in Chevak
With 17.5% poverty level for males and 58.9% for females among the residents of Chevak, 15 year old males and under 5 year old females are the most vulnerable to poverty, with 6 males (100.0%) and 8 females (100.0%) in their respective age groups living below the poverty level.
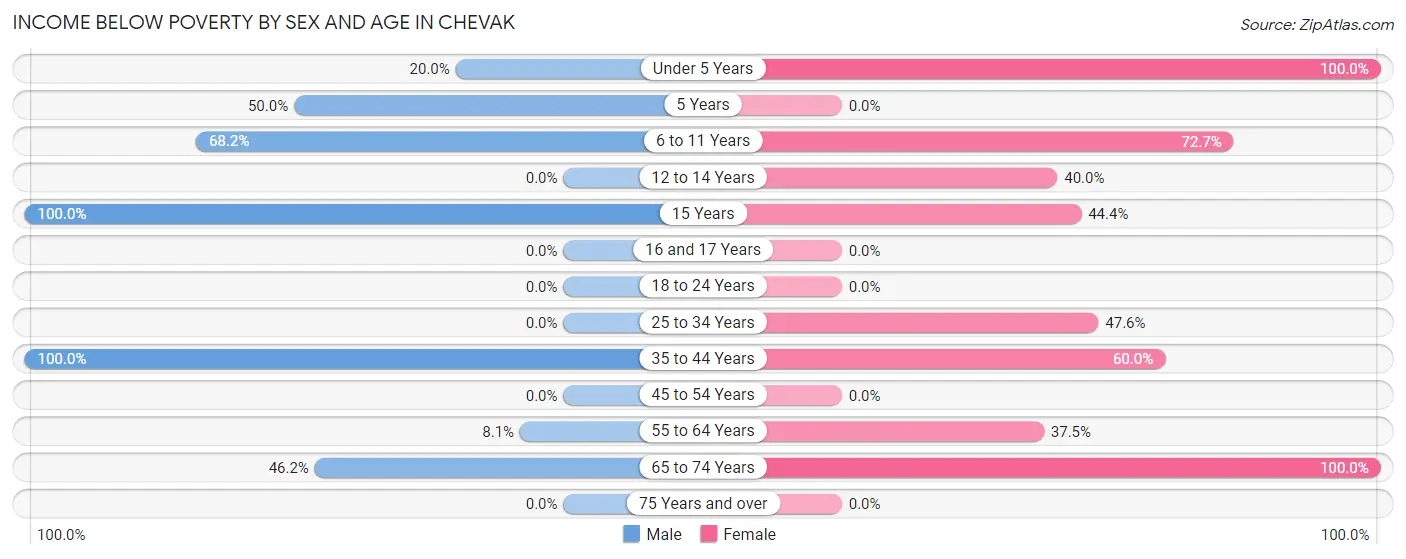
| Age Bracket | Male | Female |
| Under 5 Years | 3 (20.0%) | 8 (100.0%) |
| 5 Years | 7 (50.0%) | 0 (0.0%) |
| 6 to 11 Years | 15 (68.2%) | 16 (72.7%) |
| 12 to 14 Years | 0 (0.0%) | 4 (40.0%) |
| 15 Years | 6 (100.0%) | 4 (44.4%) |
| 16 and 17 Years | 0 (0.0%) | 0 (0.0%) |
| 18 to 24 Years | 0 (0.0%) | 0 (0.0%) |
| 25 to 34 Years | 0 (0.0%) | 10 (47.6%) |
| 35 to 44 Years | 13 (100.0%) | 12 (60.0%) |
| 45 to 54 Years | 0 (0.0%) | 0 (0.0%) |
| 55 to 64 Years | 5 (8.1%) | 6 (37.5%) |
| 65 to 74 Years | 6 (46.2%) | 6 (100.0%) |
| 75 Years and over | 0 (0.0%) | 0 (0.0%) |
| Total | 55 (17.5%) | 66 (58.9%) |
Income Above Poverty by Sex and Age in Chevak
According to the poverty statistics in Chevak, males aged 12 to 14 years and females aged 55 to 64 years are the age groups that are most secure financially, with 100.0% of males and 62.5% of females in these age groups living above the poverty line.
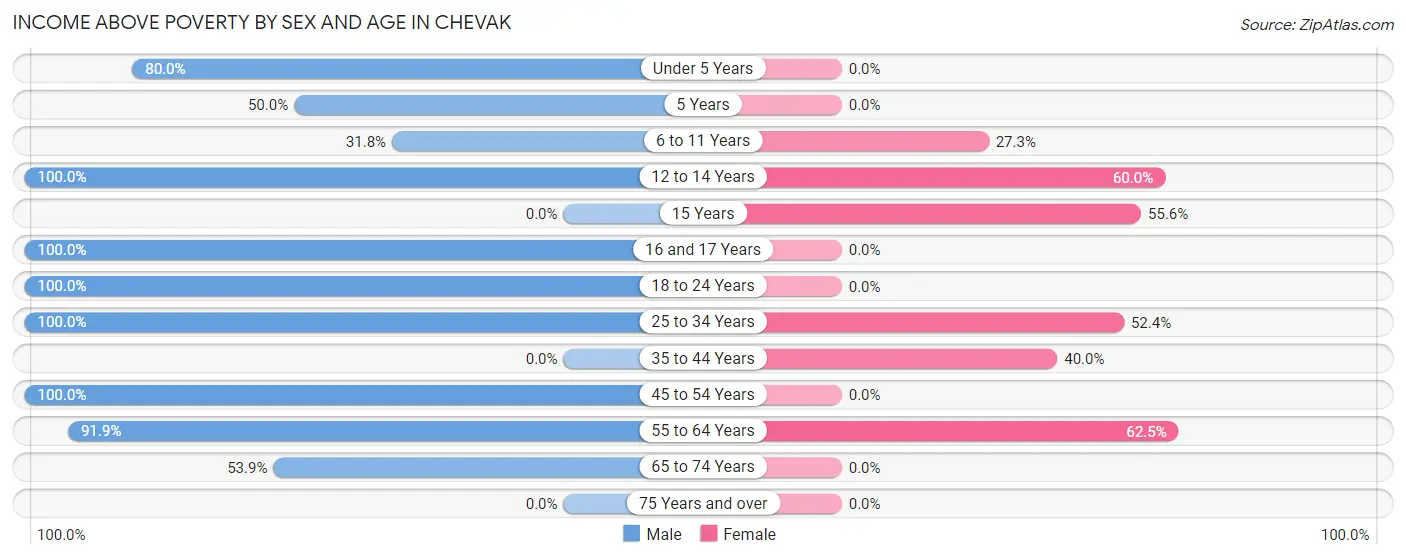
| Age Bracket | Male | Female |
| Under 5 Years | 12 (80.0%) | 0 (0.0%) |
| 5 Years | 7 (50.0%) | 0 (0.0%) |
| 6 to 11 Years | 7 (31.8%) | 6 (27.3%) |
| 12 to 14 Years | 19 (100.0%) | 6 (60.0%) |
| 15 Years | 0 (0.0%) | 5 (55.6%) |
| 16 and 17 Years | 5 (100.0%) | 0 (0.0%) |
| 18 to 24 Years | 14 (100.0%) | 0 (0.0%) |
| 25 to 34 Years | 38 (100.0%) | 11 (52.4%) |
| 35 to 44 Years | 0 (0.0%) | 8 (40.0%) |
| 45 to 54 Years | 93 (100.0%) | 0 (0.0%) |
| 55 to 64 Years | 57 (91.9%) | 10 (62.5%) |
| 65 to 74 Years | 7 (53.8%) | 0 (0.0%) |
| 75 Years and over | 0 (0.0%) | 0 (0.0%) |
| Total | 259 (82.5%) | 46 (41.1%) |
Income Below Poverty Among Married-Couple Families in Chevak
The poverty statistics for married-couple families in Chevak show that 40.0% or 12 of the total 30 families live below the poverty line. Families with 3 or 4 children have the highest poverty rate of 70.6%, comprising of 12 families. On the other hand, families with 1 or 2 children have the lowest poverty rate of 0.0%, which includes 0 families.
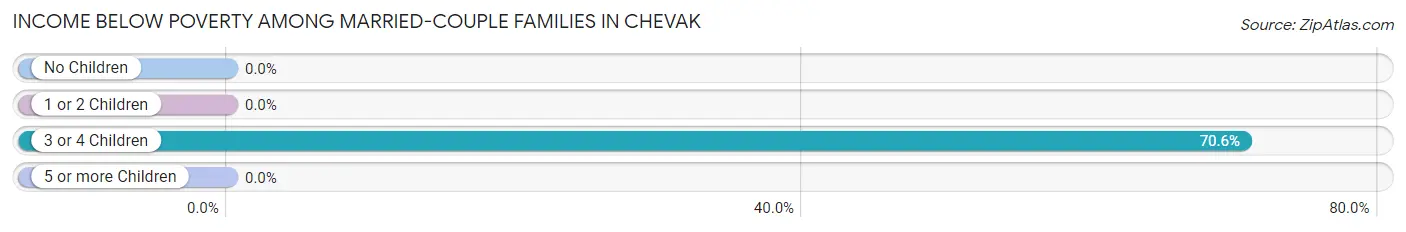
| Children | Above Poverty | Below Poverty |
| No Children | 0 (0.0%) | 0 (0.0%) |
| 1 or 2 Children | 5 (100.0%) | 0 (0.0%) |
| 3 or 4 Children | 5 (29.4%) | 12 (70.6%) |
| 5 or more Children | 8 (100.0%) | 0 (0.0%) |
| Total | 18 (60.0%) | 12 (40.0%) |
Income Below Poverty Among Single-Parent Households in Chevak
According to the poverty data in Chevak, 46.2% or 6 single-father households and 100.0% or 6 single-mother households are living below the poverty line. Among single-father households, those with 3 or 4 children have the highest poverty rate, with 6 households (100.0%) experiencing poverty. Likewise, among single-mother households, those with 1 or 2 children have the highest poverty rate, with 6 households (100.0%) falling below the poverty line.
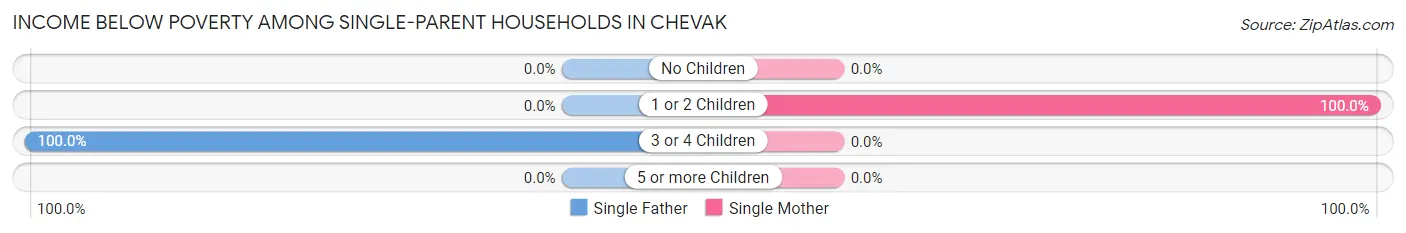
| Children | Single Father | Single Mother |
| No Children | 0 (0.0%) | 0 (0.0%) |
| 1 or 2 Children | 0 (0.0%) | 6 (100.0%) |
| 3 or 4 Children | 6 (100.0%) | 0 (0.0%) |
| 5 or more Children | 0 (0.0%) | 0 (0.0%) |
| Total | 6 (46.2%) | 6 (100.0%) |
Income Below Poverty Among Married-Couple vs Single-Parent Households in Chevak
The poverty data for Chevak shows that 12 of the married-couple family households (40.0%) and 12 of the single-parent households (63.2%) are living below the poverty level. Within the married-couple family households, those with 3 or 4 children have the highest poverty rate, with 12 households (70.6%) falling below the poverty line. Among the single-parent households, those with 3 or 4 children have the highest poverty rate, with 6 household (100.0%) living below poverty.
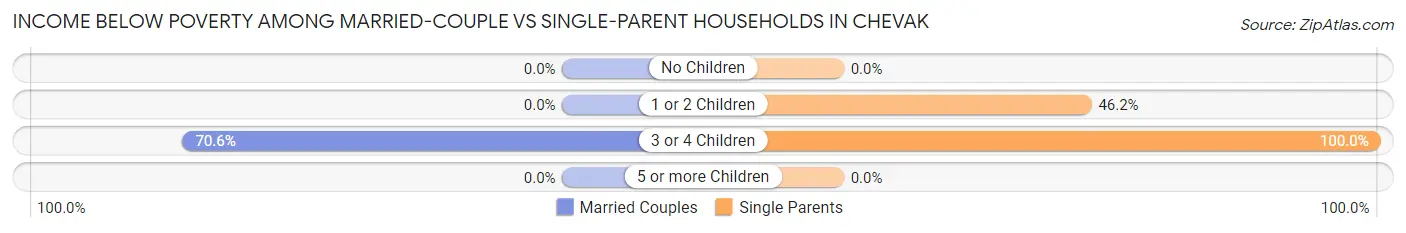
| Children | Married-Couple Families | Single-Parent Households |
| No Children | 0 (0.0%) | 0 (0.0%) |
| 1 or 2 Children | 0 (0.0%) | 6 (46.2%) |
| 3 or 4 Children | 12 (70.6%) | 6 (100.0%) |
| 5 or more Children | 0 (0.0%) | 0 (0.0%) |
| Total | 12 (40.0%) | 12 (63.2%) |
Race in Chevak
The most populous races in Chevak are Native / Alaskan (298 | 69.0%), White / Caucasian (123 | 28.5%), and Two or more Races (11 | 2.5%).
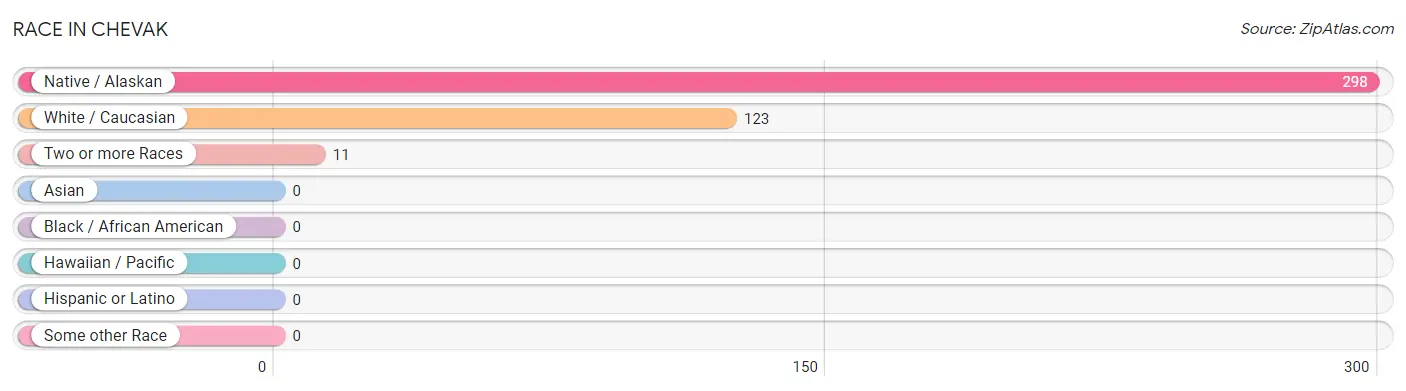
| Race | # Population | % Population |
| Asian | 0 | 0.0% |
| Black / African American | 0 | 0.0% |
| Hawaiian / Pacific | 0 | 0.0% |
| Hispanic or Latino | 0 | 0.0% |
| Native / Alaskan | 298 | 69.0% |
| White / Caucasian | 123 | 28.5% |
| Two or more Races | 11 | 2.5% |
| Some other Race | 0 | 0.0% |
| Total | 432 | 100.0% |
Ancestry in Chevak
The most populous ancestries reported in Chevak are Yup'ik (216 | 50.0%), Alaska Native (60 | 13.9%), Inupiat (22 | 5.1%), Irish (13 | 3.0%), and Subsaharan African (11 | 2.5%), together accounting for 74.5% of all Chevak residents.
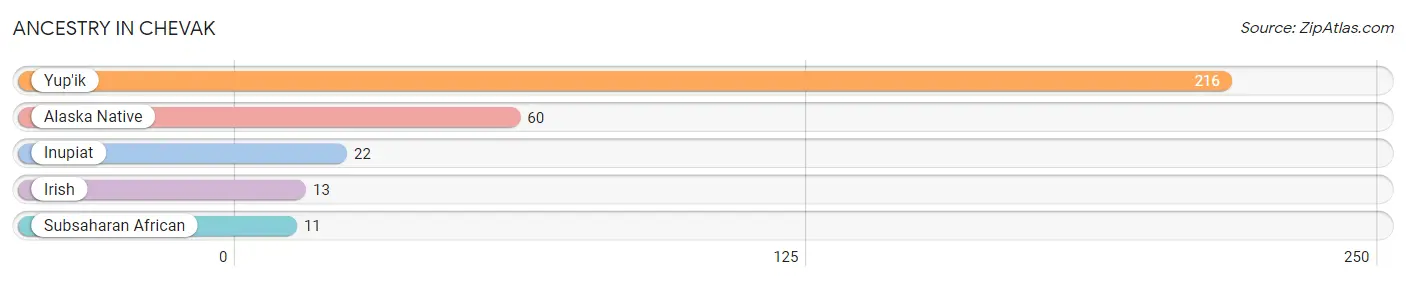
| Ancestry | # Population | % Population |
| Alaska Native | 60 | 13.9% |
| Inupiat | 22 | 5.1% |
| Irish | 13 | 3.0% |
| Subsaharan African | 11 | 2.5% |
| Yup'ik | 216 | 50.0% | View All 5 Rows |
Immigrants in Chevak
The most numerous immigrant groups reported in Chevak came from , and Africa (11 | 2.5%), together accounting for 2.5% of all Chevak residents.

| Immigration Origin | # Population | % Population |
| Africa | 11 | 2.5% | View All 1 Rows |
Sex and Age in Chevak
Sex and Age in Chevak
The most populous age groups in Chevak are 50 to 54 Years (93 | 29.1%) for men and 10 to 14 Years (20 | 17.9%) for women.
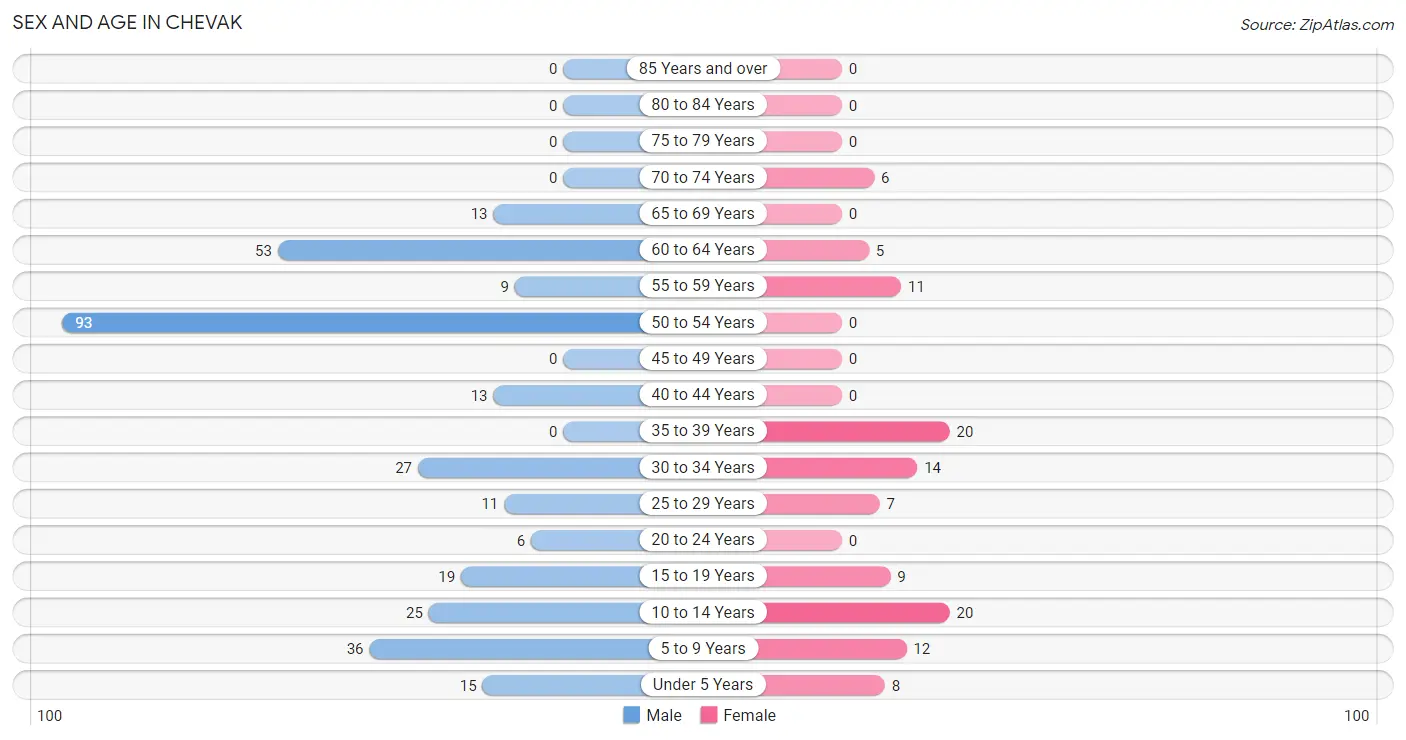
| Age Bracket | Male | Female |
| Under 5 Years | 15 (4.7%) | 8 (7.1%) |
| 5 to 9 Years | 36 (11.3%) | 12 (10.7%) |
| 10 to 14 Years | 25 (7.8%) | 20 (17.9%) |
| 15 to 19 Years | 19 (5.9%) | 9 (8.0%) |
| 20 to 24 Years | 6 (1.9%) | 0 (0.0%) |
| 25 to 29 Years | 11 (3.4%) | 7 (6.2%) |
| 30 to 34 Years | 27 (8.4%) | 14 (12.5%) |
| 35 to 39 Years | 0 (0.0%) | 20 (17.9%) |
| 40 to 44 Years | 13 (4.1%) | 0 (0.0%) |
| 45 to 49 Years | 0 (0.0%) | 0 (0.0%) |
| 50 to 54 Years | 93 (29.1%) | 0 (0.0%) |
| 55 to 59 Years | 9 (2.8%) | 11 (9.8%) |
| 60 to 64 Years | 53 (16.6%) | 5 (4.5%) |
| 65 to 69 Years | 13 (4.1%) | 0 (0.0%) |
| 70 to 74 Years | 0 (0.0%) | 6 (5.4%) |
| 75 to 79 Years | 0 (0.0%) | 0 (0.0%) |
| 80 to 84 Years | 0 (0.0%) | 0 (0.0%) |
| 85 Years and over | 0 (0.0%) | 0 (0.0%) |
| Total | 320 (100.0%) | 112 (100.0%) |
Families and Households in Chevak
Median Family Size in Chevak
The median family size in Chevak is 5.37 persons per family, with married-couple families (30 | 61.2%) accounting for the largest median family size of 6.7 persons per family. On the other hand, single female/mother families (6 | 12.2%) represent the smallest median family size with 3.17 persons per family.
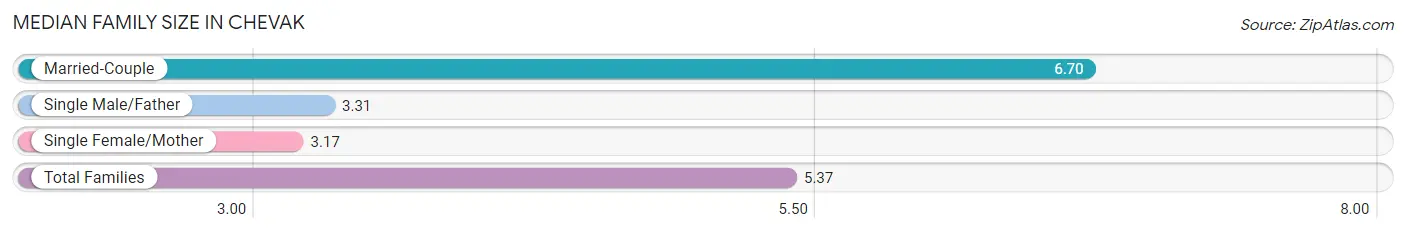
| Family Type | # Families | Family Size |
| Married-Couple | 30 (61.2%) | 6.70 |
| Single Male/Father | 13 (26.5%) | 3.31 |
| Single Female/Mother | 6 (12.2%) | 3.17 |
| Total Families | 49 (100.0%) | 5.37 |
Median Household Size in Chevak
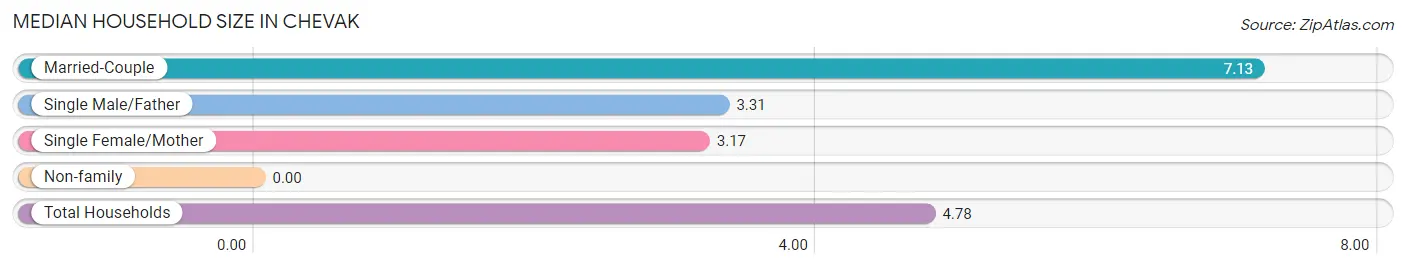
| Household Type | # Households | Household Size |
| Married-Couple | 30 (50.0%) | 7.13 |
| Single Male/Father | 13 (21.7%) | 3.31 |
| Single Female/Mother | 6 (10.0%) | 3.17 |
| Non-family | 11 (18.3%) | - |
| Total Households | 60 (100.0%) | 4.78 |
Household Size by Marriage Status in Chevak
Out of a total of 60 households in Chevak, 49 (81.7%) are family households, while 11 (18.3%) are nonfamily households. The most numerous type of family households are 7+ person households, comprising 18, and the most common type of nonfamily households are 1-person households, comprising 11.
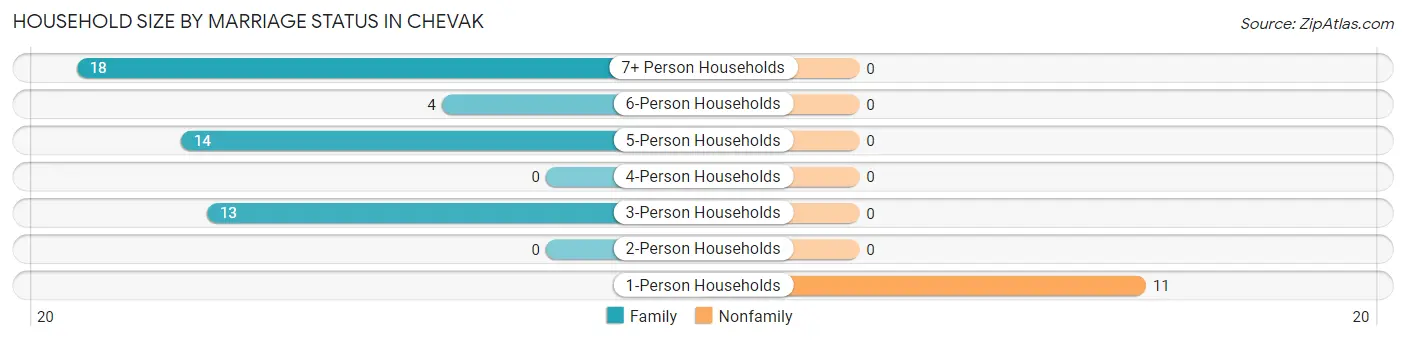
| Household Size | Family Households | Nonfamily Households |
| 1-Person Households | - | 11 (18.3%) |
| 2-Person Households | 0 (0.0%) | 0 (0.0%) |
| 3-Person Households | 13 (21.7%) | 0 (0.0%) |
| 4-Person Households | 0 (0.0%) | 0 (0.0%) |
| 5-Person Households | 14 (23.3%) | 0 (0.0%) |
| 6-Person Households | 4 (6.7%) | 0 (0.0%) |
| 7+ Person Households | 18 (30.0%) | 0 (0.0%) |
| Total | 49 (81.7%) | 11 (18.3%) |
Female Fertility in Chevak
Fertility by Age in Chevak
Average fertility rate in Chevak is 60.0 births per 1,000 women. Women in the age bracket of 20 to 34 years have the highest fertility rate with 143.0 births per 1,000 women. Women in the age bracket of 20 to 34 years acount for 100.0% of all women with births.
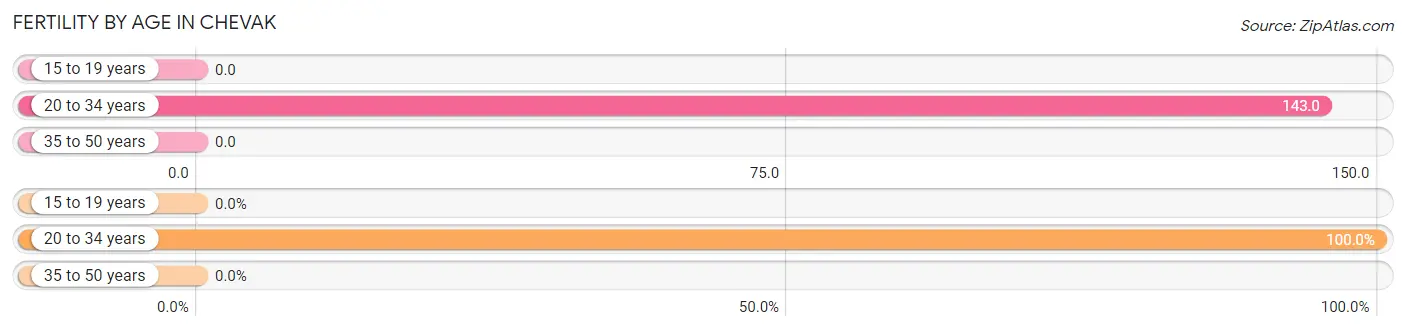
| Age Bracket | Women with Births | Births / 1,000 Women |
| 15 to 19 years | 0 (0.0%) | 0.0 |
| 20 to 34 years | 3 (100.0%) | 143.0 |
| 35 to 50 years | 0 (0.0%) | 0.0 |
| Total | 3 (100.0%) | 60.0 |
Fertility by Age by Marriage Status in Chevak
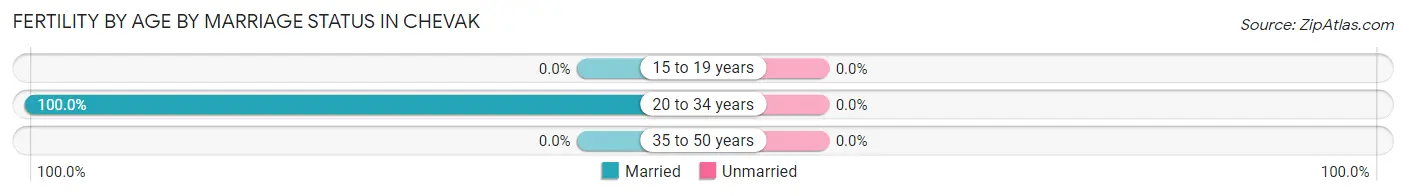
| Age Bracket | Married | Unmarried |
| 15 to 19 years | 0 (0.0%) | 0 (0.0%) |
| 20 to 34 years | 3 (100.0%) | 0 (0.0%) |
| 35 to 50 years | 0 (0.0%) | 0 (0.0%) |
| Total | 3 (100.0%) | 0 (0.0%) |
Fertility by Education in Chevak
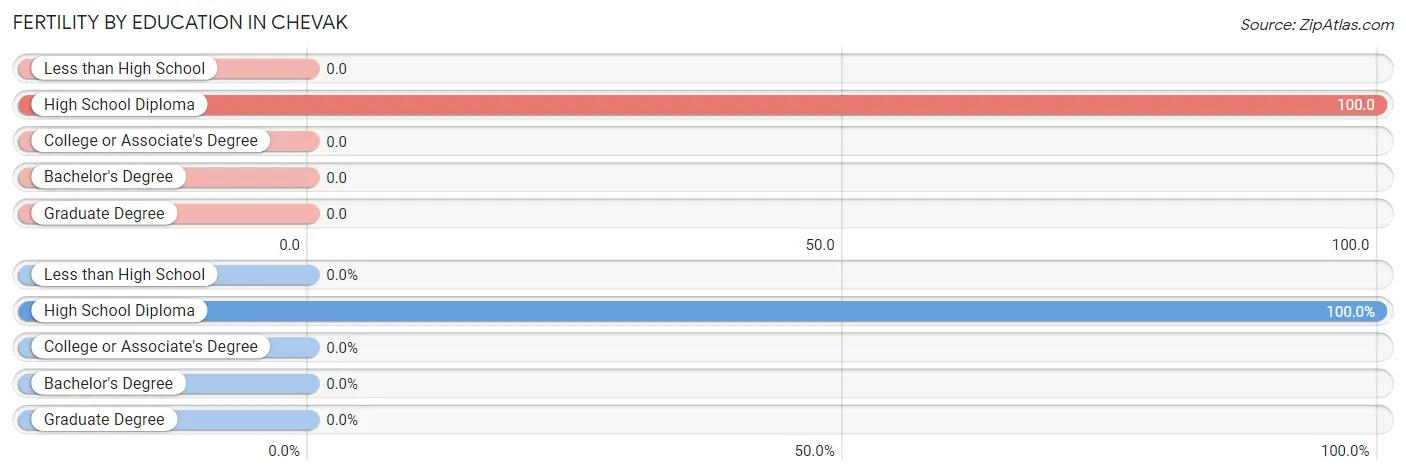
| Educational Attainment | Women with Births | Births / 1,000 Women |
| Less than High School | 0 (0.0%) | 0.0 |
| High School Diploma | 3 (100.0%) | 100.0 |
| College or Associate's Degree | 0 (0.0%) | 0.0 |
| Bachelor's Degree | 0 (0.0%) | 0.0 |
| Graduate Degree | 0 (0.0%) | 0.0 |
| Total | 3 (100.0%) | 60.0 |
Fertility by Education by Marriage Status in Chevak
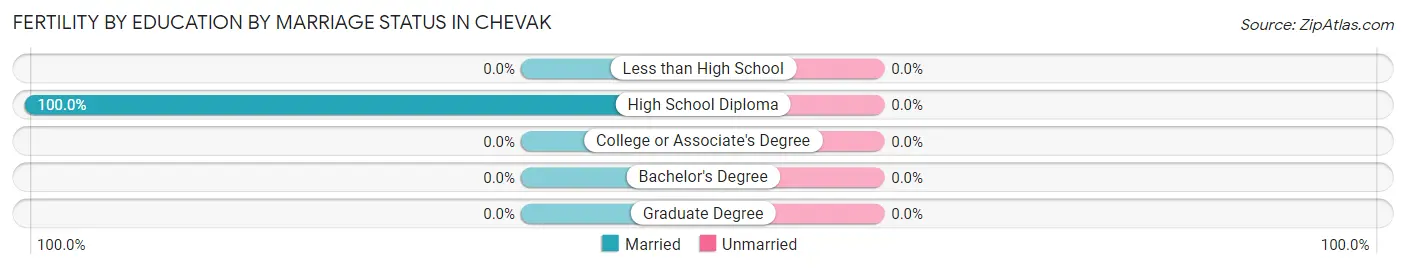
| Educational Attainment | Married | Unmarried |
| Less than High School | 0 (0.0%) | 0 (0.0%) |
| High School Diploma | 3 (100.0%) | 0 (0.0%) |
| College or Associate's Degree | 0 (0.0%) | 0 (0.0%) |
| Bachelor's Degree | 0 (0.0%) | 0 (0.0%) |
| Graduate Degree | 0 (0.0%) | 0 (0.0%) |
| Total | 3 (100.0%) | 0 (0.0%) |
Employment Characteristics in Chevak
Employment by Class of Employer in Chevak
Among the 212 employed individuals in Chevak, private company employees (134 | 63.2%), not-for-profit organizations (39 | 18.4%), and local government employees (29 | 13.7%) make up the most common classes of employment.
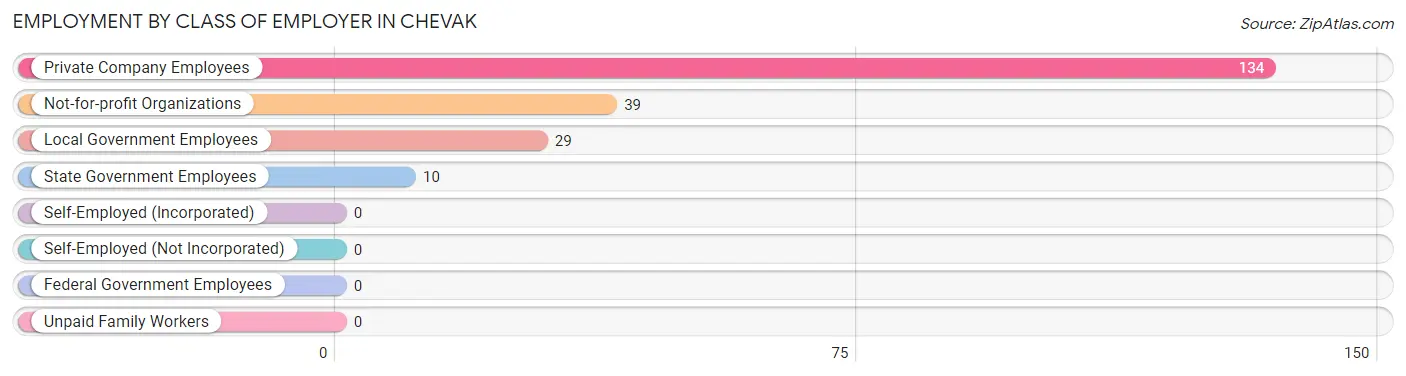
| Employer Class | # Employees | % Employees |
| Private Company Employees | 134 | 63.2% |
| Self-Employed (Incorporated) | 0 | 0.0% |
| Self-Employed (Not Incorporated) | 0 | 0.0% |
| Not-for-profit Organizations | 39 | 18.4% |
| Local Government Employees | 29 | 13.7% |
| State Government Employees | 10 | 4.7% |
| Federal Government Employees | 0 | 0.0% |
| Unpaid Family Workers | 0 | 0.0% |
| Total | 212 | 100.0% |
Employment Status by Age in Chevak
According to the labor force statistics for Chevak, out of the total population over 16 years of age (301), 81.4% or 245 individuals are in the labor force, with 13.5% or 33 of them unemployed. The age group with the highest labor force participation rate is 20 to 24 years, with 100.0% or 6 individuals in the labor force. Within the labor force, the 16 to 19 years age range has the highest percentage of unemployed individuals, with 100.0% or 8 of them being unemployed.
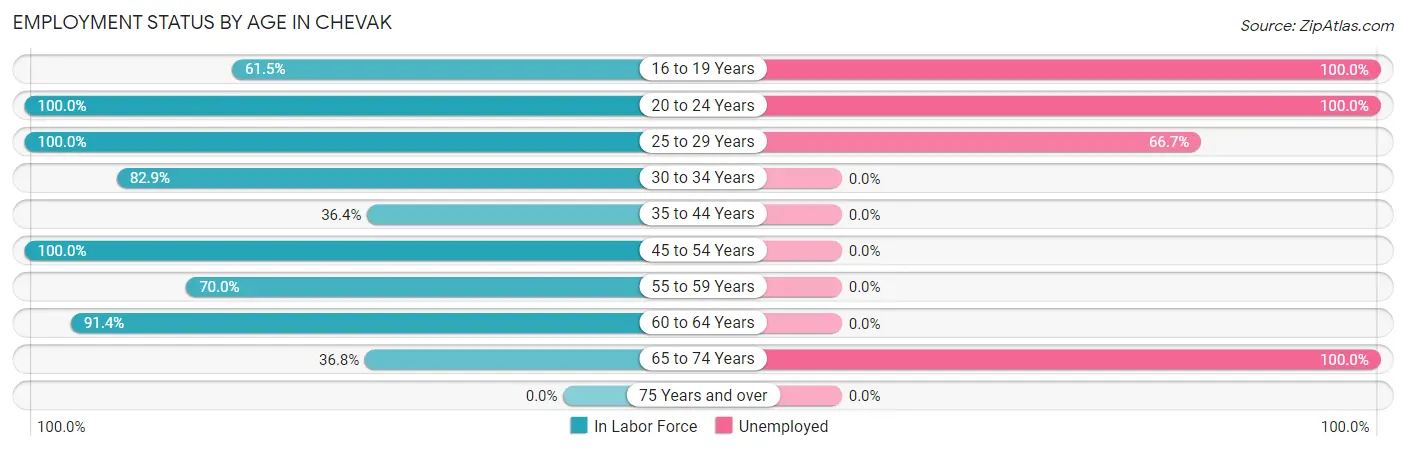
| Age Bracket | In Labor Force | Unemployed |
| 16 to 19 Years | 8 (61.5%) | 8 (100.0%) |
| 20 to 24 Years | 6 (100.0%) | 6 (100.0%) |
| 25 to 29 Years | 18 (100.0%) | 12 (66.7%) |
| 30 to 34 Years | 34 (82.9%) | 0 (0.0%) |
| 35 to 44 Years | 12 (36.4%) | 0 (0.0%) |
| 45 to 54 Years | 93 (100.0%) | 0 (0.0%) |
| 55 to 59 Years | 14 (70.0%) | 0 (0.0%) |
| 60 to 64 Years | 53 (91.4%) | 0 (0.0%) |
| 65 to 74 Years | 7 (36.8%) | 7 (100.0%) |
| 75 Years and over | 0 (0.0%) | 0 (0.0%) |
| Total | 245 (81.4%) | 33 (13.5%) |
Employment Status by Educational Attainment in Chevak
According to labor force statistics for Chevak, 85.2% of individuals (224) out of the total population between 25 and 64 years of age (263) are in the labor force, with 5.4% or 12 of them being unemployed. The group with the highest labor force participation rate are those with the educational attainment of college / associate degree, with 100.0% or 27 individuals in the labor force. Within the labor force, individuals with high school diploma education have the highest percentage of unemployment, with 6.5% or 12 of them being unemployed.
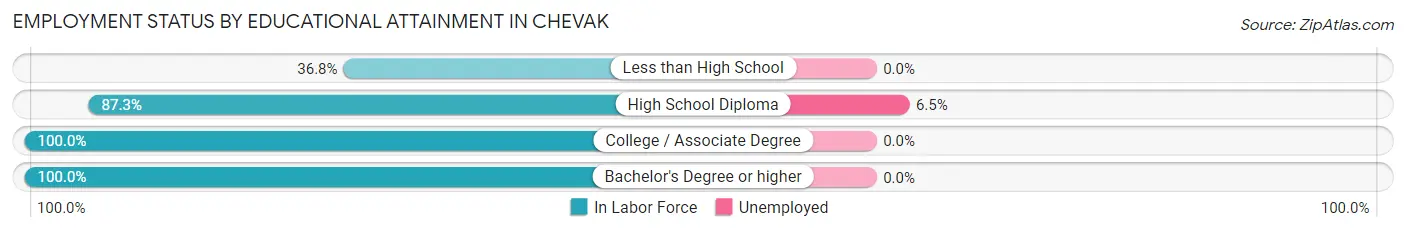
| Educational Attainment | In Labor Force | Unemployed |
| Less than High School | 7 (36.8%) | 0 (0.0%) |
| High School Diploma | 185 (87.3%) | 14 (6.5%) |
| College / Associate Degree | 27 (100.0%) | 0 (0.0%) |
| Bachelor's Degree or higher | 5 (100.0%) | 0 (0.0%) |
| Total | 224 (85.2%) | 14 (5.4%) |
Employment Occupations by Sex in Chevak
Management, Business, Science and Arts Occupations
The most common Management, Business, Science and Arts occupations in Chevak are Business & Financial (11 | 5.2%), Community & Social Service (5 | 2.4%), and Education Instruction & Library (5 | 2.4%).
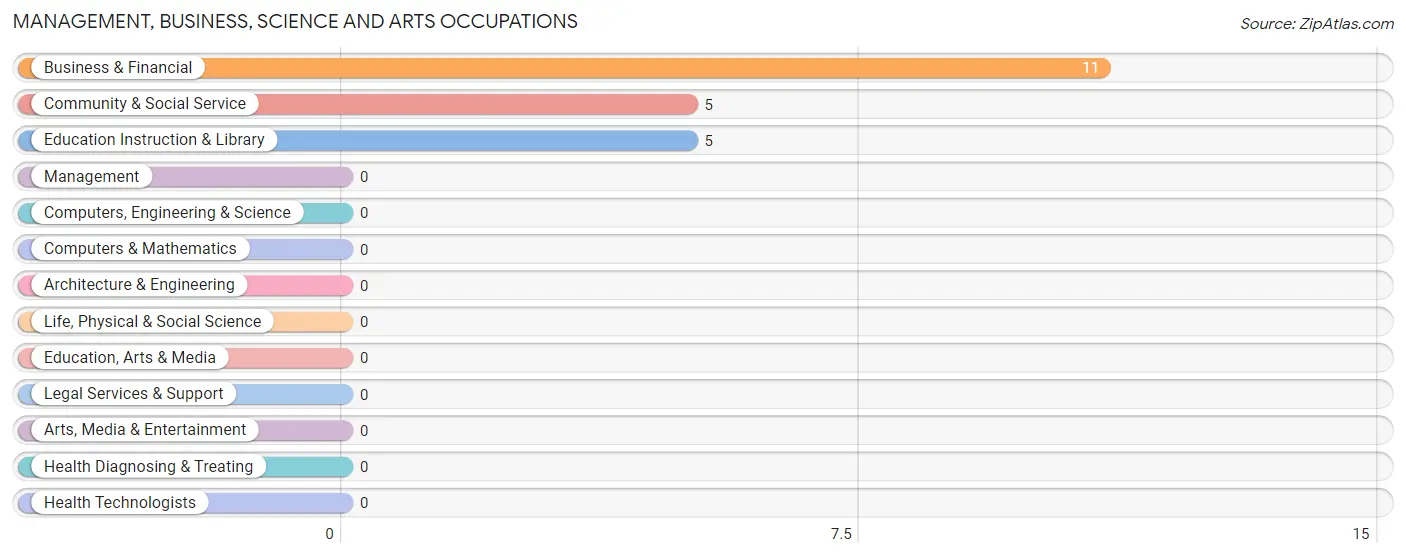
Management, Business, Science and Arts Occupations by Sex
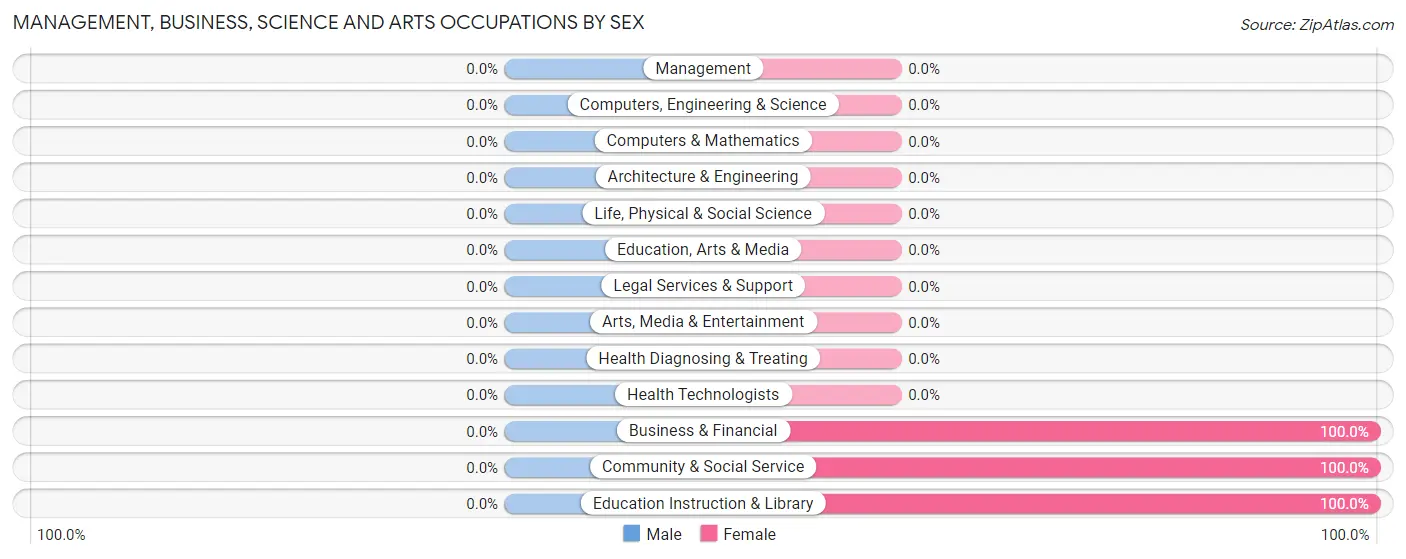
| Occupation | Male | Female |
| Management | 0 (0.0%) | 0 (0.0%) |
| Business & Financial | 0 (0.0%) | 11 (100.0%) |
| Computers, Engineering & Science | 0 (0.0%) | 0 (0.0%) |
| Computers & Mathematics | 0 (0.0%) | 0 (0.0%) |
| Architecture & Engineering | 0 (0.0%) | 0 (0.0%) |
| Life, Physical & Social Science | 0 (0.0%) | 0 (0.0%) |
| Community & Social Service | 0 (0.0%) | 5 (100.0%) |
| Education, Arts & Media | 0 (0.0%) | 0 (0.0%) |
| Legal Services & Support | 0 (0.0%) | 0 (0.0%) |
| Education Instruction & Library | 0 (0.0%) | 5 (100.0%) |
| Arts, Media & Entertainment | 0 (0.0%) | 0 (0.0%) |
| Health Diagnosing & Treating | 0 (0.0%) | 0 (0.0%) |
| Health Technologists | 0 (0.0%) | 0 (0.0%) |
| Total (Category) | 0 (0.0%) | 16 (100.0%) |
| Total (Overall) | 176 (83.0%) | 36 (17.0%) |
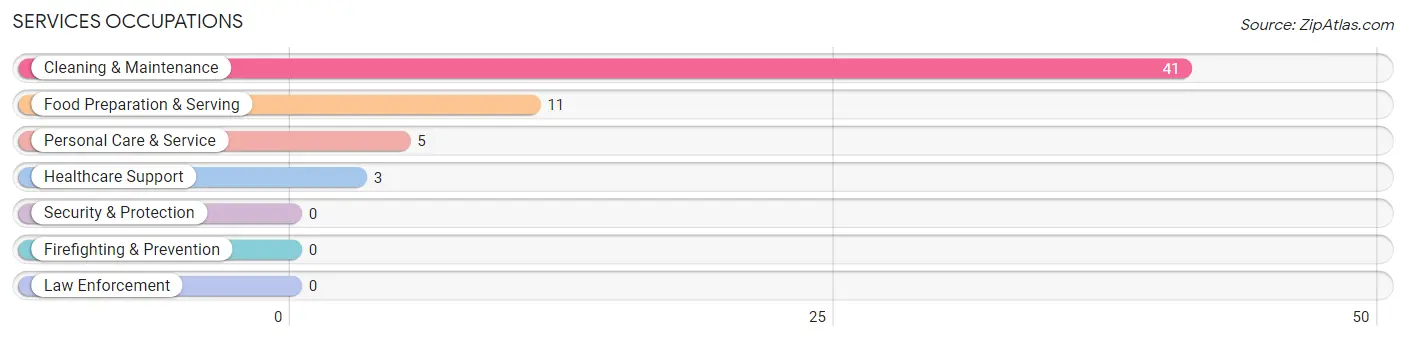
Services Occupations
The most common Services occupations in Chevak are Cleaning & Maintenance (41 | 19.3%), Food Preparation & Serving (11 | 5.2%), Personal Care & Service (5 | 2.4%), and Healthcare Support (3 | 1.4%).
Services Occupations by Sex
Within the Services occupations in Chevak, the most male-oriented occupations are Food Preparation & Serving (100.0%), and Cleaning & Maintenance (100.0%), while the most female-oriented occupations are Healthcare Support (100.0%), and Personal Care & Service (100.0%).
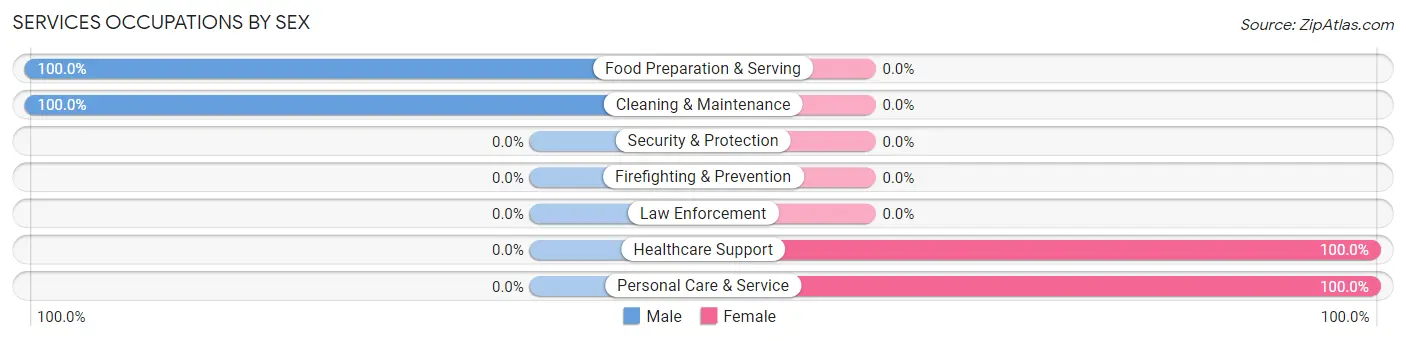
| Occupation | Male | Female |
| Healthcare Support | 0 (0.0%) | 3 (100.0%) |
| Security & Protection | 0 (0.0%) | 0 (0.0%) |
| Firefighting & Prevention | 0 (0.0%) | 0 (0.0%) |
| Law Enforcement | 0 (0.0%) | 0 (0.0%) |
| Food Preparation & Serving | 11 (100.0%) | 0 (0.0%) |
| Cleaning & Maintenance | 41 (100.0%) | 0 (0.0%) |
| Personal Care & Service | 0 (0.0%) | 5 (100.0%) |
| Total (Category) | 52 (86.7%) | 8 (13.3%) |
| Total (Overall) | 176 (83.0%) | 36 (17.0%) |
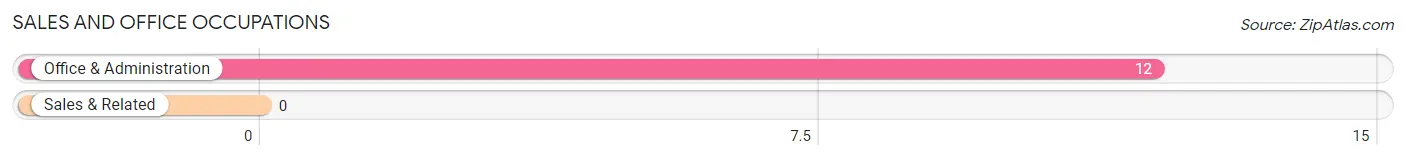
Sales and Office Occupations
The most common Sales and Office occupations in Chevak are , and Office & Administration (12 | 5.7%).
Sales and Office Occupations by Sex
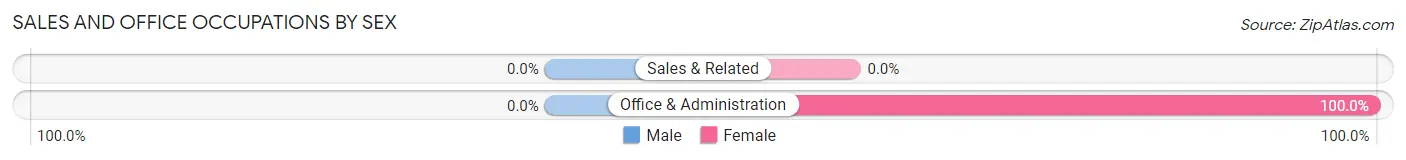
| Occupation | Male | Female |
| Sales & Related | 0 (0.0%) | 0 (0.0%) |
| Office & Administration | 0 (0.0%) | 12 (100.0%) |
| Total (Category) | 0 (0.0%) | 12 (100.0%) |
| Total (Overall) | 176 (83.0%) | 36 (17.0%) |
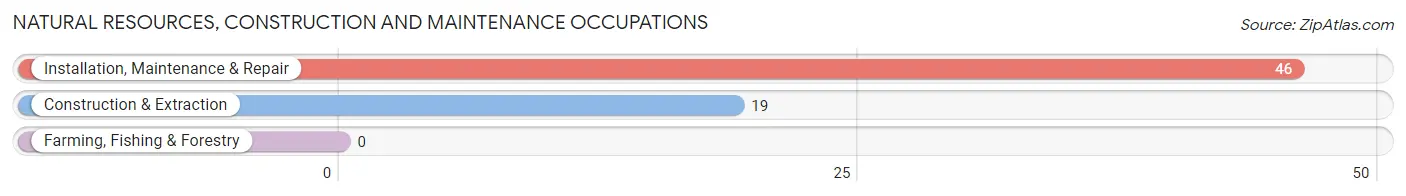
Natural Resources, Construction and Maintenance Occupations
The most common Natural Resources, Construction and Maintenance occupations in Chevak are Installation, Maintenance & Repair (46 | 21.7%), and Construction & Extraction (19 | 9.0%).
Natural Resources, Construction and Maintenance Occupations by Sex
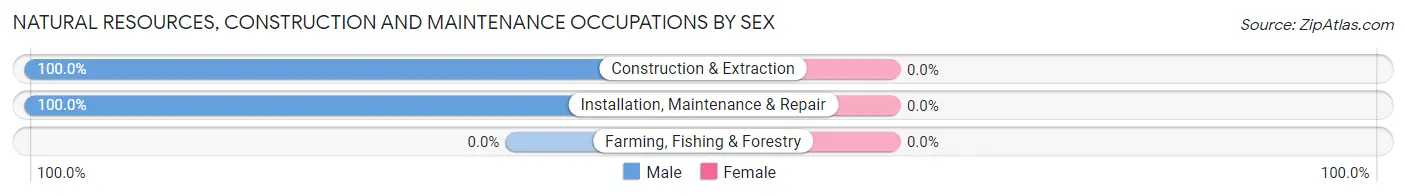
| Occupation | Male | Female |
| Farming, Fishing & Forestry | 0 (0.0%) | 0 (0.0%) |
| Construction & Extraction | 19 (100.0%) | 0 (0.0%) |
| Installation, Maintenance & Repair | 46 (100.0%) | 0 (0.0%) |
| Total (Category) | 65 (100.0%) | 0 (0.0%) |
| Total (Overall) | 176 (83.0%) | 36 (17.0%) |
Production, Transportation and Moving Occupations
The most common Production, Transportation and Moving occupations in Chevak are Transportation (41 | 19.3%), and Material Moving (18 | 8.5%).
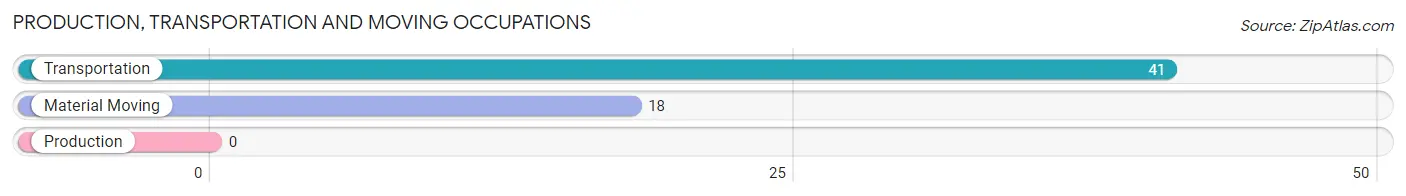
Production, Transportation and Moving Occupations by Sex
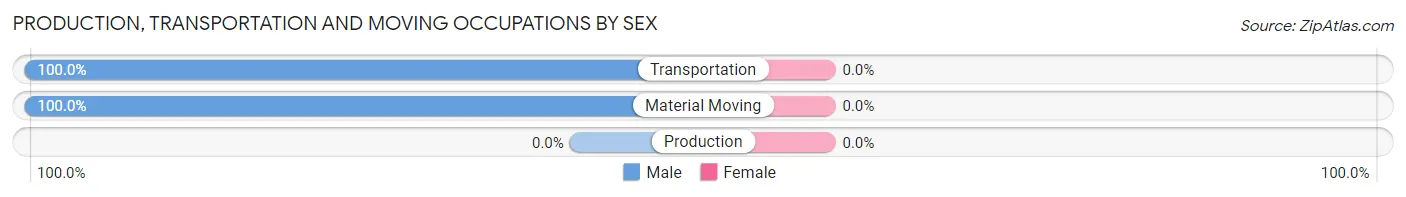
| Occupation | Male | Female |
| Production | 0 (0.0%) | 0 (0.0%) |
| Transportation | 41 (100.0%) | 0 (0.0%) |
| Material Moving | 18 (100.0%) | 0 (0.0%) |
| Total (Category) | 59 (100.0%) | 0 (0.0%) |
| Total (Overall) | 176 (83.0%) | 36 (17.0%) |
Employment Industries by Sex in Chevak
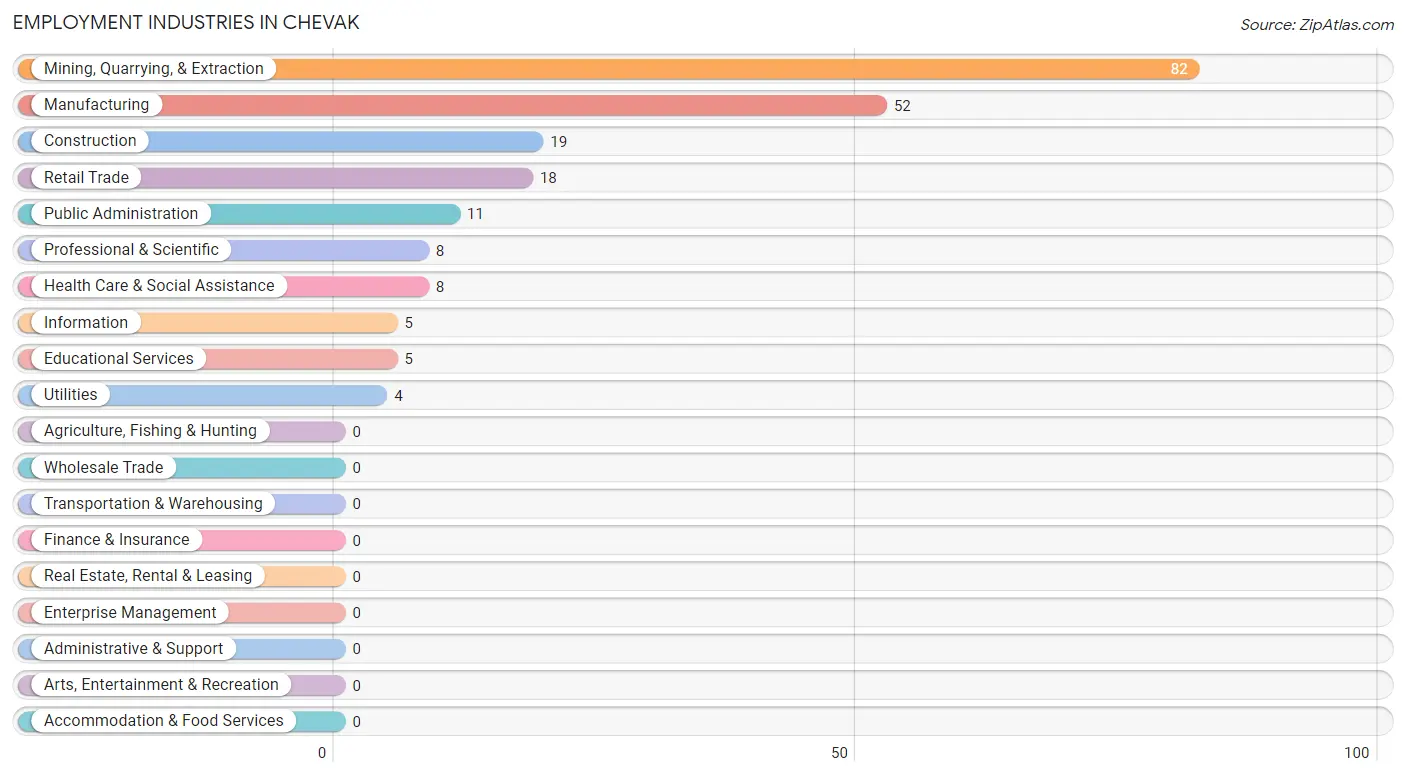
Employment Industries in Chevak
The major employment industries in Chevak include Mining, Quarrying, & Extraction (82 | 38.7%), Manufacturing (52 | 24.5%), Construction (19 | 9.0%), Retail Trade (18 | 8.5%), and Public Administration (11 | 5.2%).
Employment Industries by Sex in Chevak
The Chevak industries that see more men than women are Mining, Quarrying, & Extraction (100.0%), Construction (100.0%), and Manufacturing (100.0%), whereas the industries that tend to have a higher number of women are Utilities (100.0%), Professional & Scientific (100.0%), and Educational Services (100.0%).
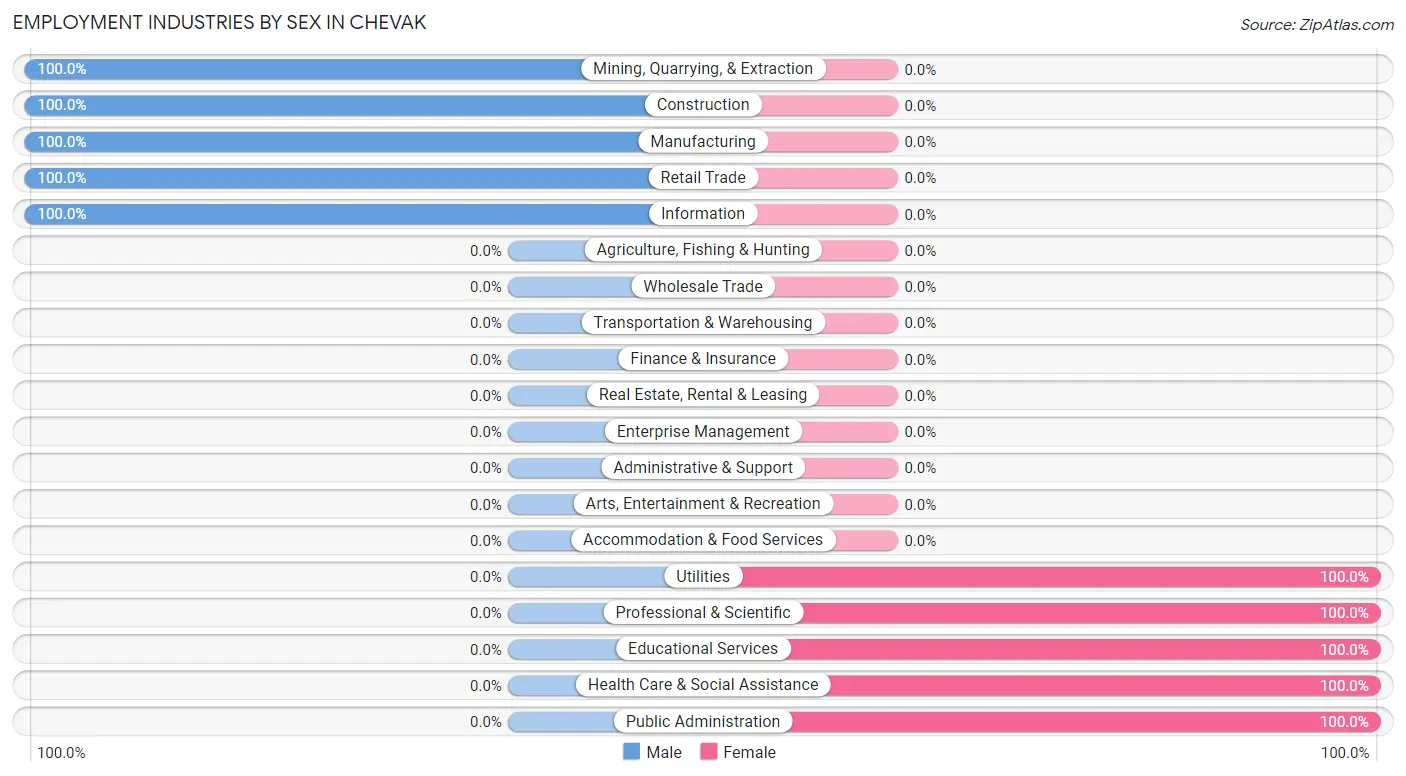
| Industry | Male | Female |
| Agriculture, Fishing & Hunting | 0 (0.0%) | 0 (0.0%) |
| Mining, Quarrying, & Extraction | 82 (100.0%) | 0 (0.0%) |
| Construction | 19 (100.0%) | 0 (0.0%) |
| Manufacturing | 52 (100.0%) | 0 (0.0%) |
| Wholesale Trade | 0 (0.0%) | 0 (0.0%) |
| Retail Trade | 18 (100.0%) | 0 (0.0%) |
| Transportation & Warehousing | 0 (0.0%) | 0 (0.0%) |
| Utilities | 0 (0.0%) | 4 (100.0%) |
| Information | 5 (100.0%) | 0 (0.0%) |
| Finance & Insurance | 0 (0.0%) | 0 (0.0%) |
| Real Estate, Rental & Leasing | 0 (0.0%) | 0 (0.0%) |
| Professional & Scientific | 0 (0.0%) | 8 (100.0%) |
| Enterprise Management | 0 (0.0%) | 0 (0.0%) |
| Administrative & Support | 0 (0.0%) | 0 (0.0%) |
| Educational Services | 0 (0.0%) | 5 (100.0%) |
| Health Care & Social Assistance | 0 (0.0%) | 8 (100.0%) |
| Arts, Entertainment & Recreation | 0 (0.0%) | 0 (0.0%) |
| Accommodation & Food Services | 0 (0.0%) | 0 (0.0%) |
| Public Administration | 0 (0.0%) | 11 (100.0%) |
| Total | 176 (83.0%) | 36 (17.0%) |
Education in Chevak
School Enrollment in Chevak
The most common levels of schooling among the 119 students in Chevak are middle school (46 | 38.7%), elementary school (37 | 31.1%), and high school (16 | 13.5%).
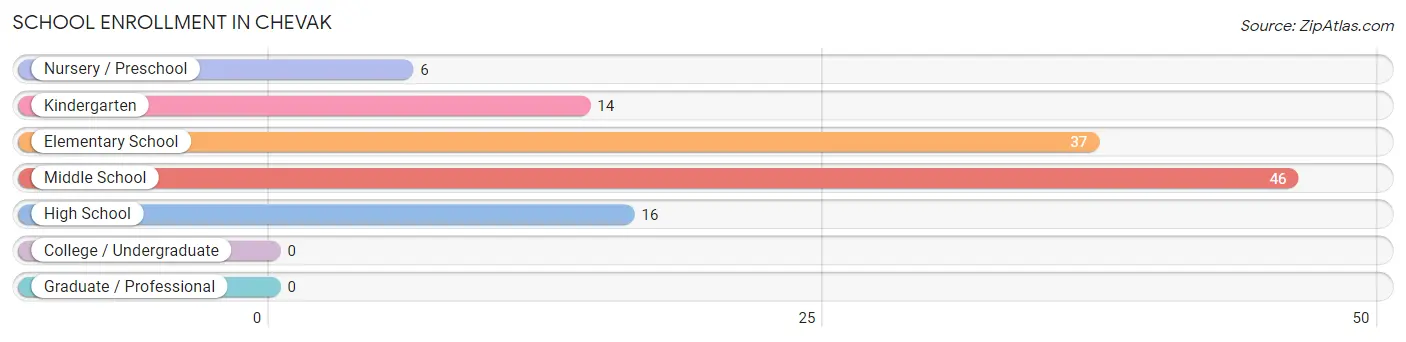
| School Level | # Students | % Students |
| Nursery / Preschool | 6 | 5.0% |
| Kindergarten | 14 | 11.8% |
| Elementary School | 37 | 31.1% |
| Middle School | 46 | 38.7% |
| High School | 16 | 13.5% |
| College / Undergraduate | 0 | 0.0% |
| Graduate / Professional | 0 | 0.0% |
| Total | 119 | 100.0% |
School Enrollment by Age by Funding Source in Chevak
Out of a total of 119 students who are enrolled in schools in Chevak, 10 (8.4%) attend a private institution, while the remaining 109 (91.6%) are enrolled in public schools. The age group of 10 to 14 year olds has the highest likelihood of being enrolled in private schools, with 7 (15.6% in the age bracket) enrolled. Conversely, the age group of 3 to 4 year olds has the lowest likelihood of being enrolled in a private school, with 6 (100.0% in the age bracket) attending a public institution.
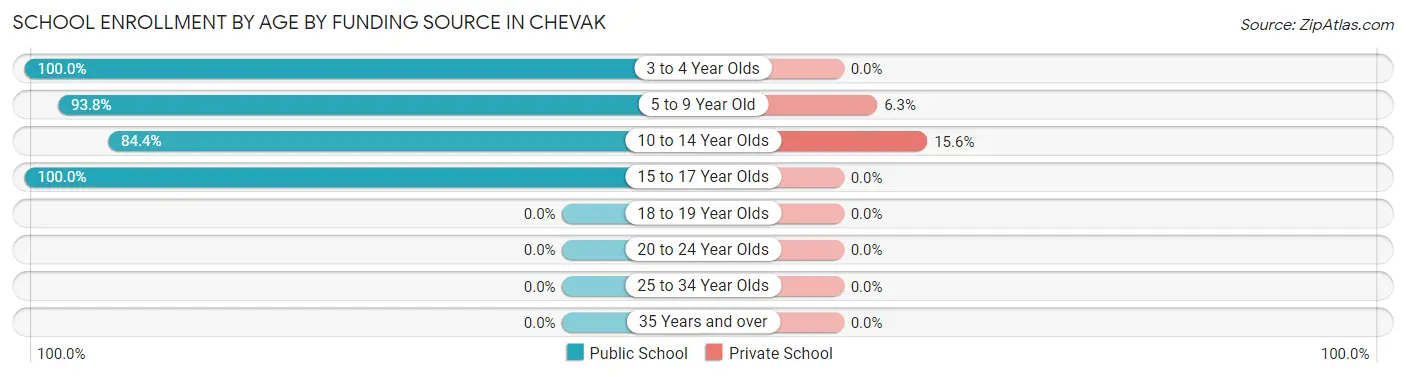
| Age Bracket | Public School | Private School |
| 3 to 4 Year Olds | 6 (100.0%) | 0 (0.0%) |
| 5 to 9 Year Old | 45 (93.8%) | 3 (6.2%) |
| 10 to 14 Year Olds | 38 (84.4%) | 7 (15.6%) |
| 15 to 17 Year Olds | 20 (100.0%) | 0 (0.0%) |
| 18 to 19 Year Olds | 0 (0.0%) | 0 (0.0%) |
| 20 to 24 Year Olds | 0 (0.0%) | 0 (0.0%) |
| 25 to 34 Year Olds | 0 (0.0%) | 0 (0.0%) |
| 35 Years and over | 0 (0.0%) | 0 (0.0%) |
| Total | 109 (91.6%) | 10 (8.4%) |
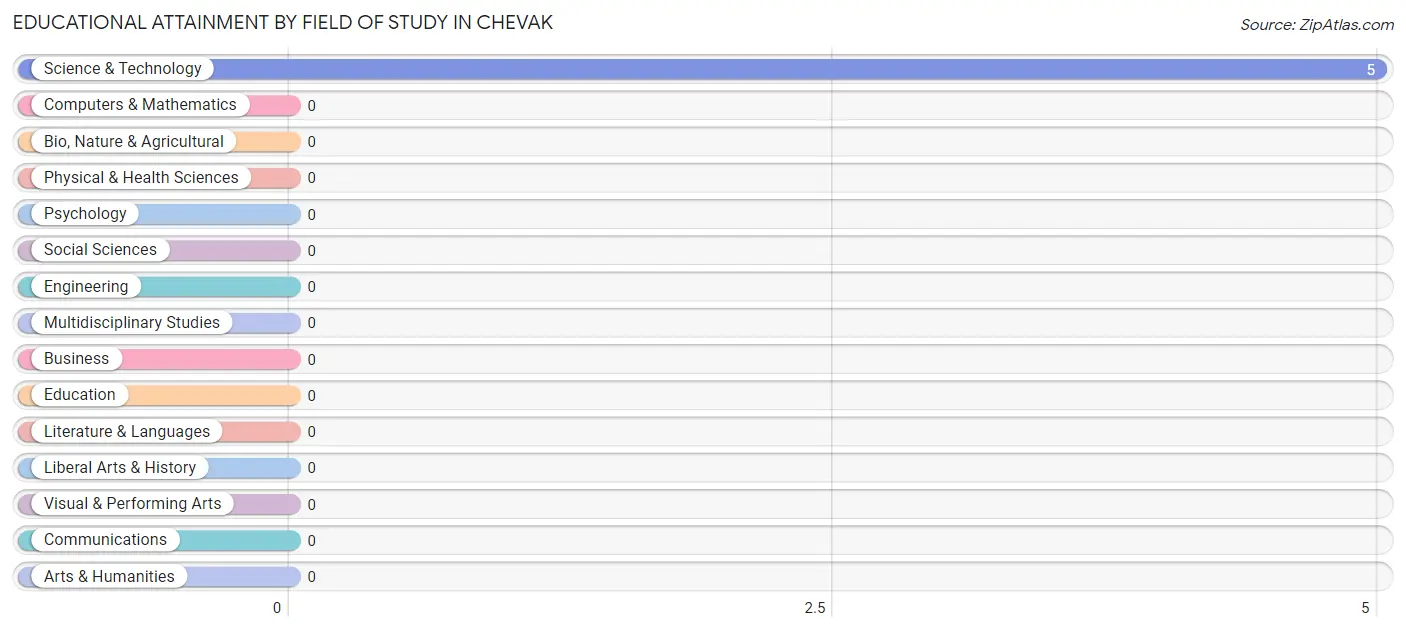
Educational Attainment by Field of Study in Chevak
, and science & technology (5 | 100.0%) are the most common fields of study among 5 individuals in Chevak who have obtained a bachelor's degree or higher.
| Field of Study | # Graduates | % Graduates |
| Computers & Mathematics | 0 | 0.0% |
| Bio, Nature & Agricultural | 0 | 0.0% |
| Physical & Health Sciences | 0 | 0.0% |
| Psychology | 0 | 0.0% |
| Social Sciences | 0 | 0.0% |
| Engineering | 0 | 0.0% |
| Multidisciplinary Studies | 0 | 0.0% |
| Science & Technology | 5 | 100.0% |
| Business | 0 | 0.0% |
| Education | 0 | 0.0% |
| Literature & Languages | 0 | 0.0% |
| Liberal Arts & History | 0 | 0.0% |
| Visual & Performing Arts | 0 | 0.0% |
| Communications | 0 | 0.0% |
| Arts & Humanities | 0 | 0.0% |
| Total | 5 | 100.0% |
Transportation & Commute in Chevak
Vehicle Availability by Sex in Chevak
The most prevalent vehicle ownership categories in Chevak are males with no vehicle (42, accounting for 100.0%) and females with no vehicle (25, making up 168.0%).
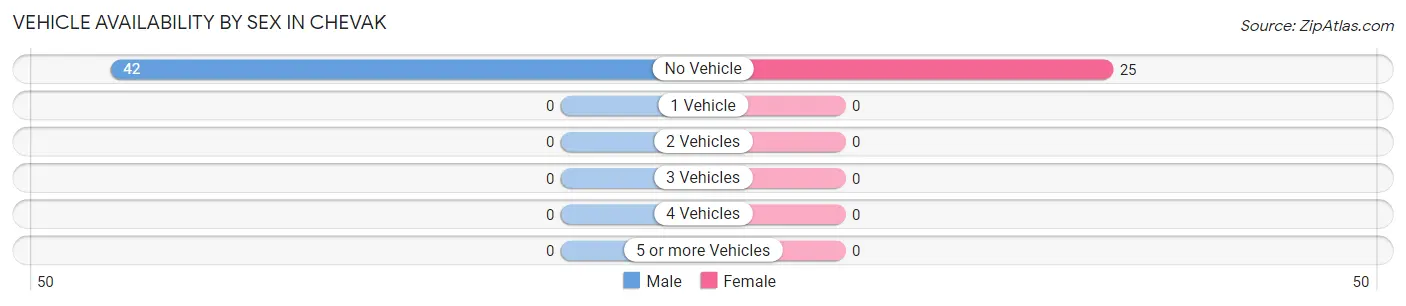
| Vehicles Available | Male | Female |
| No Vehicle | 42 (100.0%) | 25 (100.0%) |
| 1 Vehicle | 0 (0.0%) | 0 (0.0%) |
| 2 Vehicles | 0 (0.0%) | 0 (0.0%) |
| 3 Vehicles | 0 (0.0%) | 0 (0.0%) |
| 4 Vehicles | 0 (0.0%) | 0 (0.0%) |
| 5 or more Vehicles | 0 (0.0%) | 0 (0.0%) |
| Total | 42 (100.0%) | 25 (100.0%) |
Commute Time in Chevak
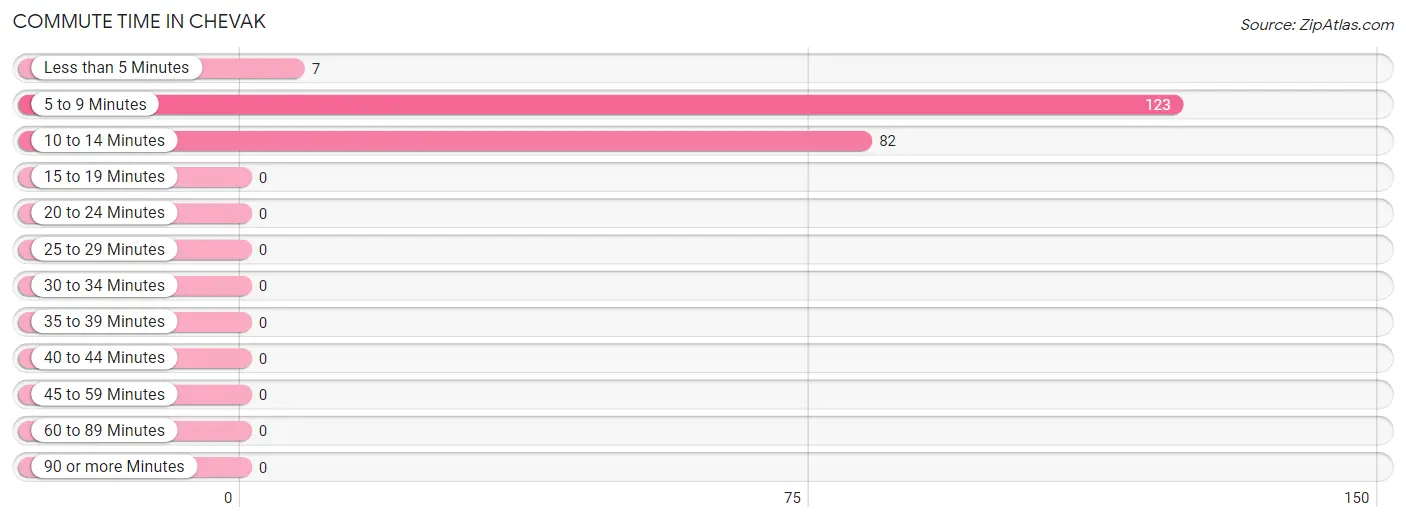
The most frequently occuring commute durations in Chevak are 5 to 9 minutes (123 commuters, 58.0%), 10 to 14 minutes (82 commuters, 38.7%), and less than 5 minutes (7 commuters, 3.3%).
| Commute Time | # Commuters | % Commuters |
| Less than 5 Minutes | 7 | 3.3% |
| 5 to 9 Minutes | 123 | 58.0% |
| 10 to 14 Minutes | 82 | 38.7% |
| 15 to 19 Minutes | 0 | 0.0% |
| 20 to 24 Minutes | 0 | 0.0% |
| 25 to 29 Minutes | 0 | 0.0% |
| 30 to 34 Minutes | 0 | 0.0% |
| 35 to 39 Minutes | 0 | 0.0% |
| 40 to 44 Minutes | 0 | 0.0% |
| 45 to 59 Minutes | 0 | 0.0% |
| 60 to 89 Minutes | 0 | 0.0% |
| 90 or more Minutes | 0 | 0.0% |
Commute Time by Sex in Chevak
The most common commute times in Chevak are 5 to 9 minutes (87 commuters, 49.4%) for males and 5 to 9 minutes (36 commuters, 100.0%) for females.
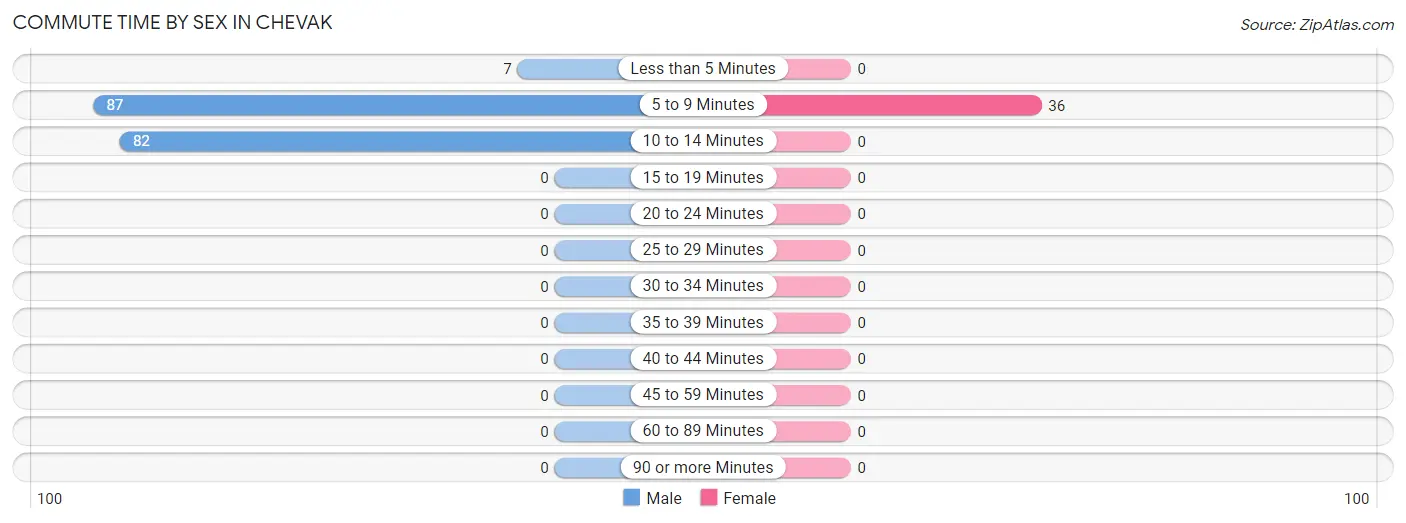
| Commute Time | Male | Female |
| Less than 5 Minutes | 7 (4.0%) | 0 (0.0%) |
| 5 to 9 Minutes | 87 (49.4%) | 36 (100.0%) |
| 10 to 14 Minutes | 82 (46.6%) | 0 (0.0%) |
| 15 to 19 Minutes | 0 (0.0%) | 0 (0.0%) |
| 20 to 24 Minutes | 0 (0.0%) | 0 (0.0%) |
| 25 to 29 Minutes | 0 (0.0%) | 0 (0.0%) |
| 30 to 34 Minutes | 0 (0.0%) | 0 (0.0%) |
| 35 to 39 Minutes | 0 (0.0%) | 0 (0.0%) |
| 40 to 44 Minutes | 0 (0.0%) | 0 (0.0%) |
| 45 to 59 Minutes | 0 (0.0%) | 0 (0.0%) |
| 60 to 89 Minutes | 0 (0.0%) | 0 (0.0%) |
| 90 or more Minutes | 0 (0.0%) | 0 (0.0%) |
Time of Departure to Work by Sex in Chevak
The most frequent times of departure to work in Chevak are 5:00 AM to 5:29 AM (82, 46.6%) for males and 10:00 AM to 10:59 AM (12, 33.3%) for females.
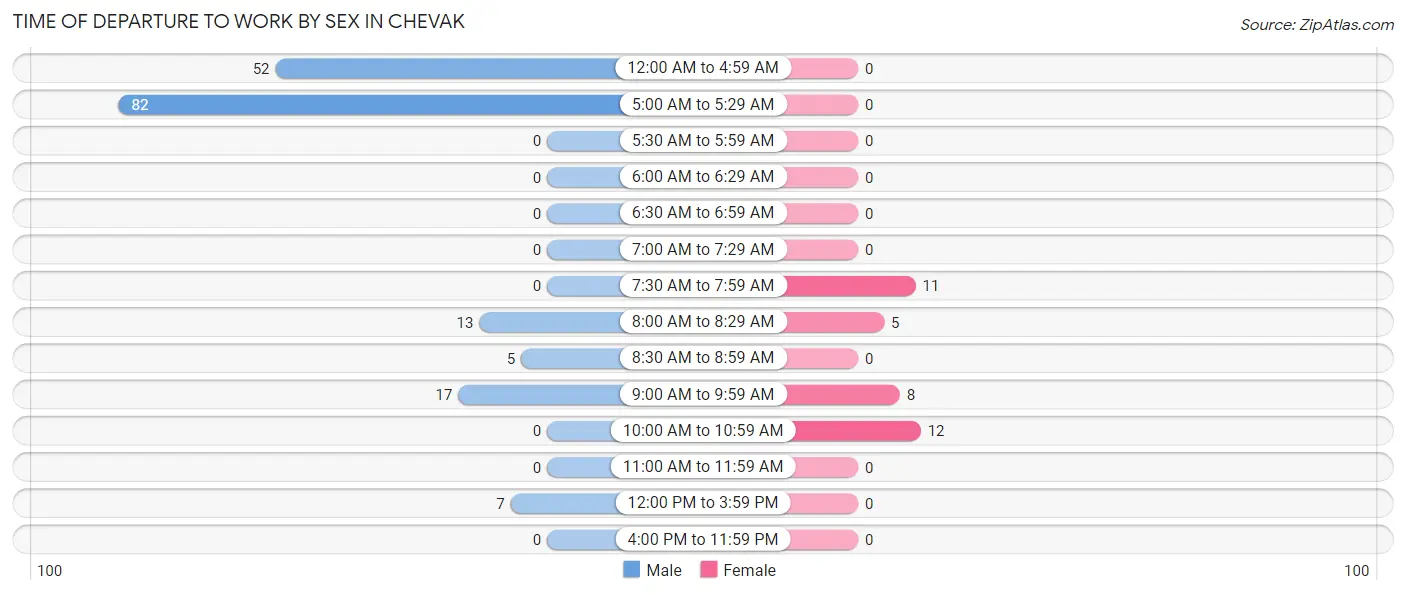
| Time of Departure | Male | Female |
| 12:00 AM to 4:59 AM | 52 (29.5%) | 0 (0.0%) |
| 5:00 AM to 5:29 AM | 82 (46.6%) | 0 (0.0%) |
| 5:30 AM to 5:59 AM | 0 (0.0%) | 0 (0.0%) |
| 6:00 AM to 6:29 AM | 0 (0.0%) | 0 (0.0%) |
| 6:30 AM to 6:59 AM | 0 (0.0%) | 0 (0.0%) |
| 7:00 AM to 7:29 AM | 0 (0.0%) | 0 (0.0%) |
| 7:30 AM to 7:59 AM | 0 (0.0%) | 11 (30.6%) |
| 8:00 AM to 8:29 AM | 13 (7.4%) | 5 (13.9%) |
| 8:30 AM to 8:59 AM | 5 (2.8%) | 0 (0.0%) |
| 9:00 AM to 9:59 AM | 17 (9.7%) | 8 (22.2%) |
| 10:00 AM to 10:59 AM | 0 (0.0%) | 12 (33.3%) |
| 11:00 AM to 11:59 AM | 0 (0.0%) | 0 (0.0%) |
| 12:00 PM to 3:59 PM | 7 (4.0%) | 0 (0.0%) |
| 4:00 PM to 11:59 PM | 0 (0.0%) | 0 (0.0%) |
| Total | 176 (100.0%) | 36 (100.0%) |
Housing Occupancy in Chevak
Occupancy by Ownership in Chevak
Of the total 60 dwellings in Chevak, owner-occupied units account for 47 (78.3%), while renter-occupied units make up 13 (21.7%).
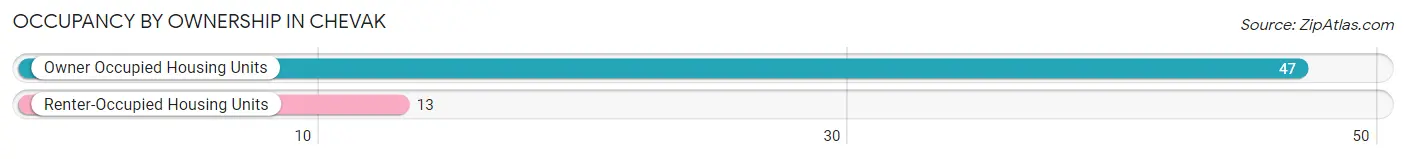
| Occupancy | # Housing Units | % Housing Units |
| Owner Occupied Housing Units | 47 | 78.3% |
| Renter-Occupied Housing Units | 13 | 21.7% |
| Total Occupied Housing Units | 60 | 100.0% |
Occupancy by Household Size in Chevak
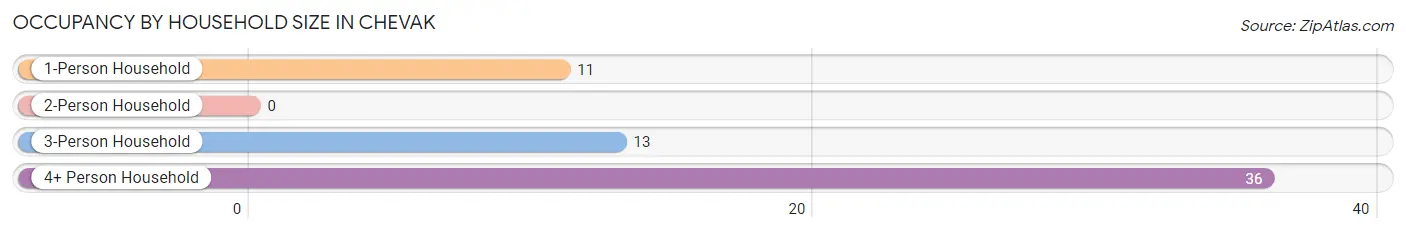
| Household Size | # Housing Units | % Housing Units |
| 1-Person Household | 11 | 18.3% |
| 2-Person Household | 0 | 0.0% |
| 3-Person Household | 13 | 21.7% |
| 4+ Person Household | 36 | 60.0% |
| Total Housing Units | 60 | 100.0% |
Occupancy by Ownership by Household Size in Chevak
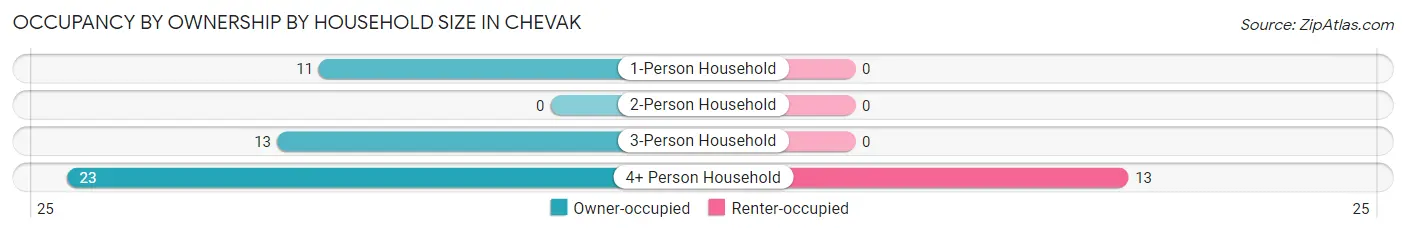
| Household Size | Owner-occupied | Renter-occupied |
| 1-Person Household | 11 (100.0%) | 0 (0.0%) |
| 2-Person Household | 0 (0.0%) | 0 (0.0%) |
| 3-Person Household | 13 (100.0%) | 0 (0.0%) |
| 4+ Person Household | 23 (63.9%) | 13 (36.1%) |
| Total Housing Units | 47 (78.3%) | 13 (21.7%) |
Occupancy by Educational Attainment in Chevak
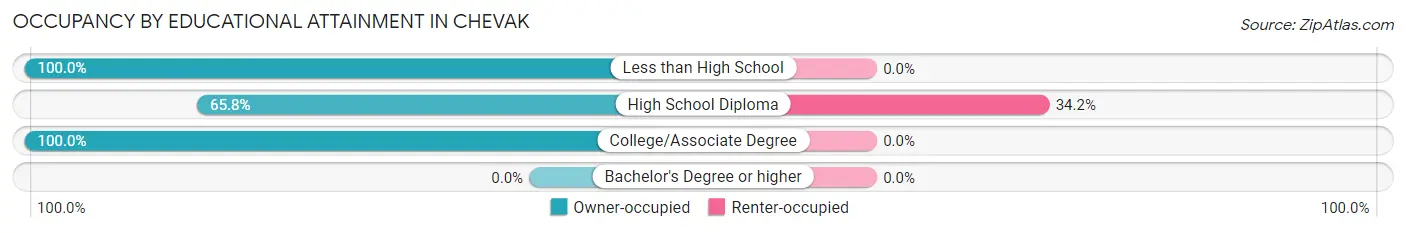
| Household Size | Owner-occupied | Renter-occupied |
| Less than High School | 5 (100.0%) | 0 (0.0%) |
| High School Diploma | 25 (65.8%) | 13 (34.2%) |
| College/Associate Degree | 17 (100.0%) | 0 (0.0%) |
| Bachelor's Degree or higher | 0 (0.0%) | 0 (0.0%) |
Occupancy by Age of Householder in Chevak
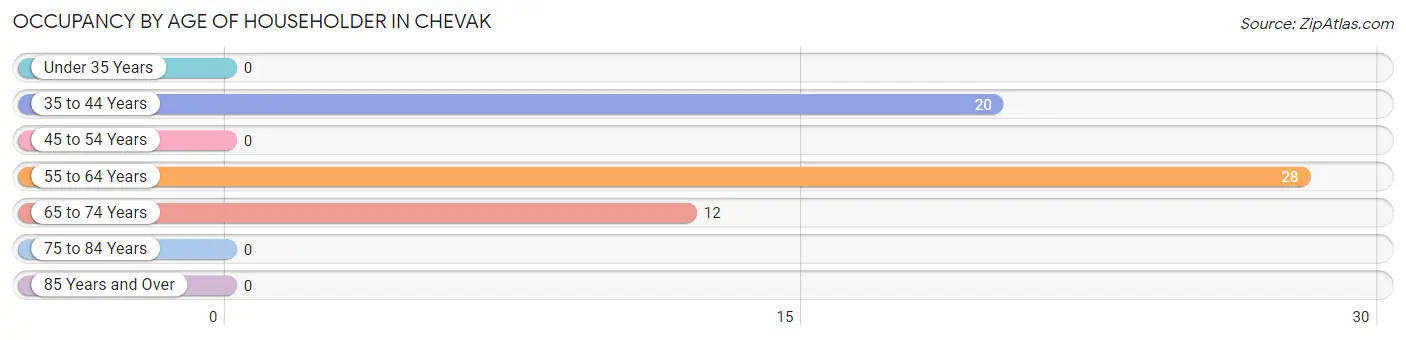
| Age Bracket | # Households | % Households |
| Under 35 Years | 0 | 0.0% |
| 35 to 44 Years | 20 | 33.3% |
| 45 to 54 Years | 0 | 0.0% |
| 55 to 64 Years | 28 | 46.7% |
| 65 to 74 Years | 12 | 20.0% |
| 75 to 84 Years | 0 | 0.0% |
| 85 Years and Over | 0 | 0.0% |
| Total | 60 | 100.0% |
Housing Finances in Chevak
Median Income by Occupancy in Chevak
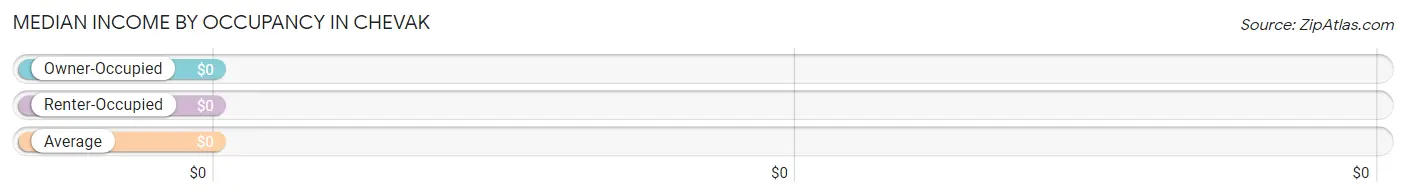
| Occupancy Type | # Households | Median Income |
| Owner-Occupied | 47 (78.3%) | $0 |
| Renter-Occupied | 13 (21.7%) | $0 |
| Average | 60 (100.0%) | $0 |
Occupancy by Householder Income Bracket in Chevak
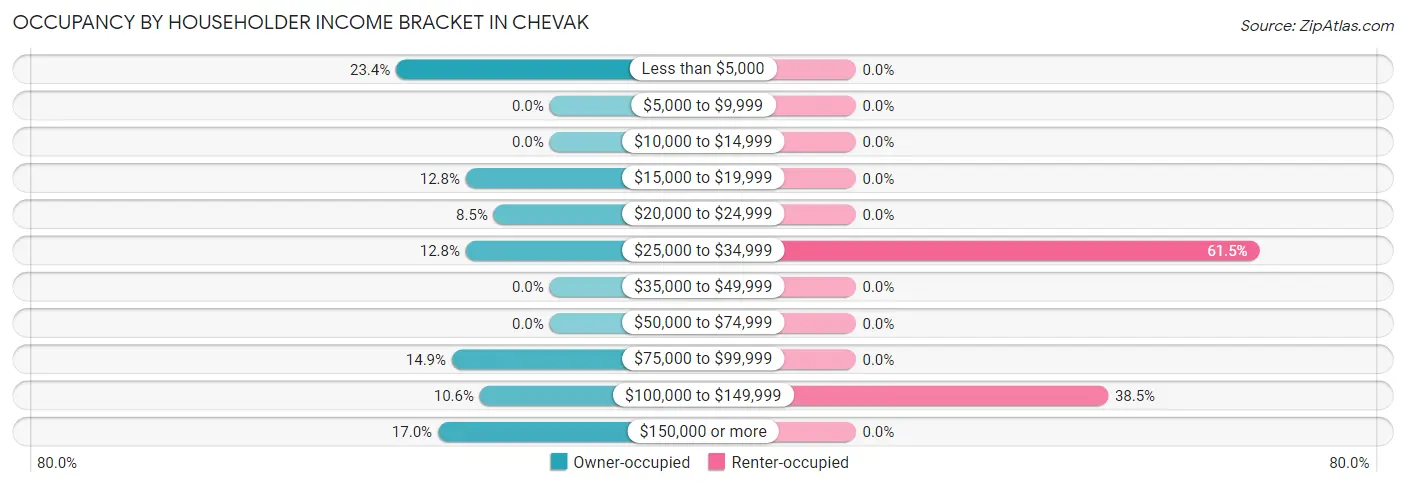
| Income Bracket | Owner-occupied | Renter-occupied |
| Less than $5,000 | 11 (23.4%) | 0 (0.0%) |
| $5,000 to $9,999 | 0 (0.0%) | 0 (0.0%) |
| $10,000 to $14,999 | 0 (0.0%) | 0 (0.0%) |
| $15,000 to $19,999 | 6 (12.8%) | 0 (0.0%) |
| $20,000 to $24,999 | 4 (8.5%) | 0 (0.0%) |
| $25,000 to $34,999 | 6 (12.8%) | 8 (61.5%) |
| $35,000 to $49,999 | 0 (0.0%) | 0 (0.0%) |
| $50,000 to $74,999 | 0 (0.0%) | 0 (0.0%) |
| $75,000 to $99,999 | 7 (14.9%) | 0 (0.0%) |
| $100,000 to $149,999 | 5 (10.6%) | 5 (38.5%) |
| $150,000 or more | 8 (17.0%) | 0 (0.0%) |
| Total | 47 (100.0%) | 13 (100.0%) |
Monthly Housing Cost Tiers in Chevak
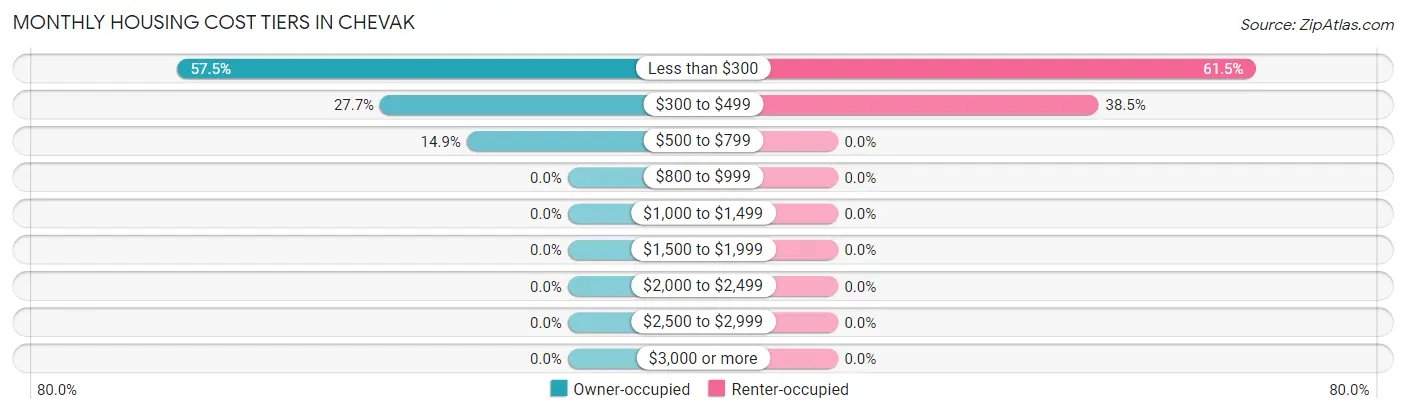
| Monthly Cost | Owner-occupied | Renter-occupied |
| Less than $300 | 27 (57.5%) | 8 (61.5%) |
| $300 to $499 | 13 (27.7%) | 5 (38.5%) |
| $500 to $799 | 7 (14.9%) | 0 (0.0%) |
| $800 to $999 | 0 (0.0%) | 0 (0.0%) |
| $1,000 to $1,499 | 0 (0.0%) | 0 (0.0%) |
| $1,500 to $1,999 | 0 (0.0%) | 0 (0.0%) |
| $2,000 to $2,499 | 0 (0.0%) | 0 (0.0%) |
| $2,500 to $2,999 | 0 (0.0%) | 0 (0.0%) |
| $3,000 or more | 0 (0.0%) | 0 (0.0%) |
| Total | 47 (100.0%) | 13 (100.0%) |
Physical Housing Characteristics in Chevak
Housing Structures in Chevak
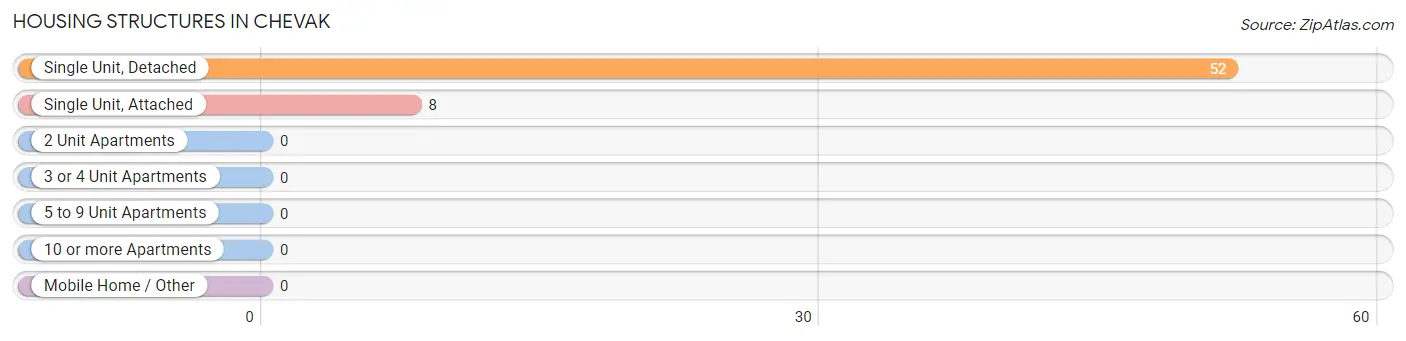
| Structure Type | # Housing Units | % Housing Units |
| Single Unit, Detached | 52 | 86.7% |
| Single Unit, Attached | 8 | 13.3% |
| 2 Unit Apartments | 0 | 0.0% |
| 3 or 4 Unit Apartments | 0 | 0.0% |
| 5 to 9 Unit Apartments | 0 | 0.0% |
| 10 or more Apartments | 0 | 0.0% |
| Mobile Home / Other | 0 | 0.0% |
| Total | 60 | 100.0% |
Housing Structures by Occupancy in Chevak
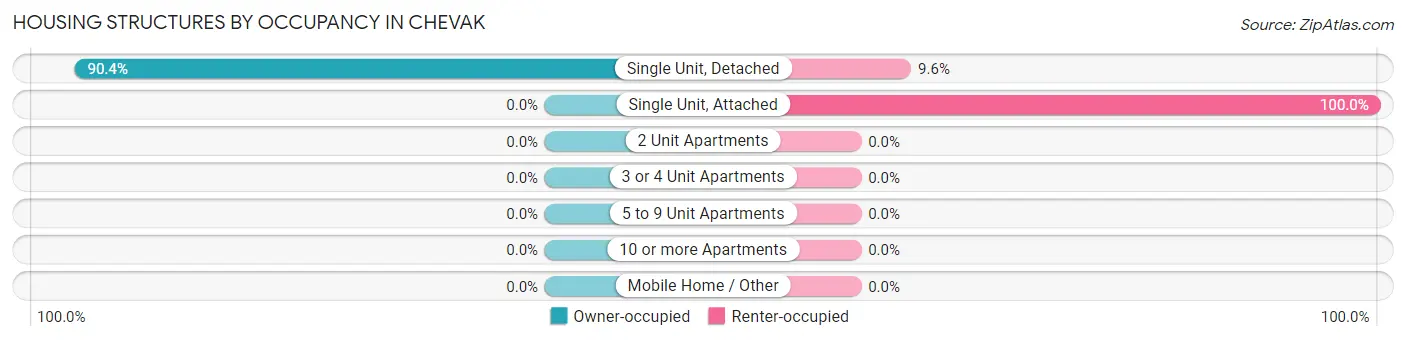
| Structure Type | Owner-occupied | Renter-occupied |
| Single Unit, Detached | 47 (90.4%) | 5 (9.6%) |
| Single Unit, Attached | 0 (0.0%) | 8 (100.0%) |
| 2 Unit Apartments | 0 (0.0%) | 0 (0.0%) |
| 3 or 4 Unit Apartments | 0 (0.0%) | 0 (0.0%) |
| 5 to 9 Unit Apartments | 0 (0.0%) | 0 (0.0%) |
| 10 or more Apartments | 0 (0.0%) | 0 (0.0%) |
| Mobile Home / Other | 0 (0.0%) | 0 (0.0%) |
| Total | 47 (78.3%) | 13 (21.7%) |
Housing Structures by Number of Rooms in Chevak
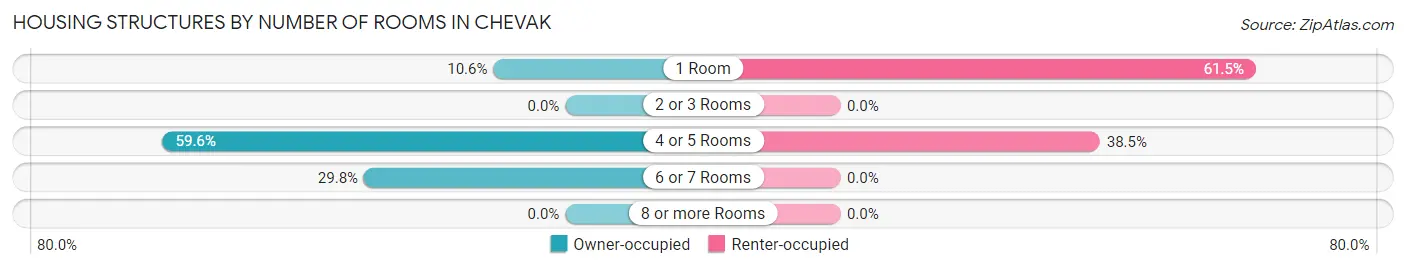
| Number of Rooms | Owner-occupied | Renter-occupied |
| 1 Room | 5 (10.6%) | 8 (61.5%) |
| 2 or 3 Rooms | 0 (0.0%) | 0 (0.0%) |
| 4 or 5 Rooms | 28 (59.6%) | 5 (38.5%) |
| 6 or 7 Rooms | 14 (29.8%) | 0 (0.0%) |
| 8 or more Rooms | 0 (0.0%) | 0 (0.0%) |
| Total | 47 (100.0%) | 13 (100.0%) |
Housing Structure by Heating Type in Chevak
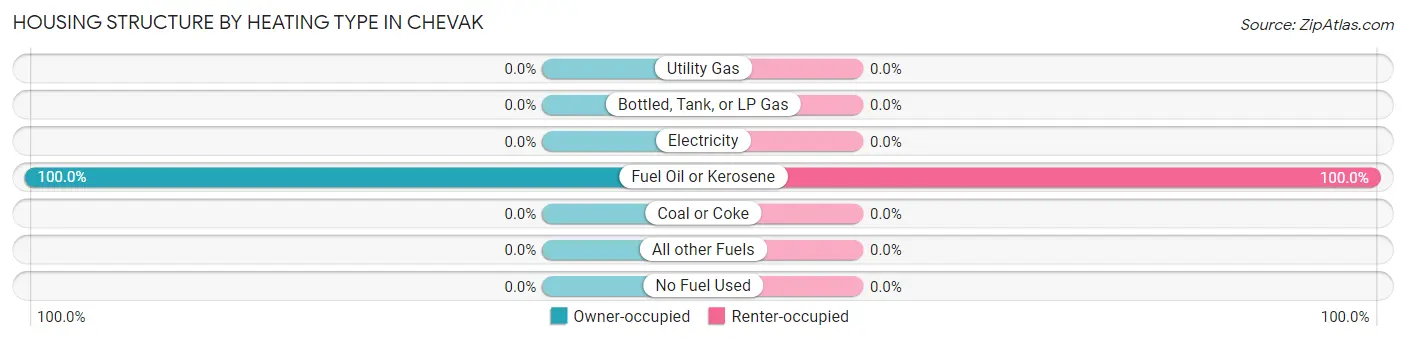
| Heating Type | Owner-occupied | Renter-occupied |
| Utility Gas | 0 (0.0%) | 0 (0.0%) |
| Bottled, Tank, or LP Gas | 0 (0.0%) | 0 (0.0%) |
| Electricity | 0 (0.0%) | 0 (0.0%) |
| Fuel Oil or Kerosene | 47 (100.0%) | 13 (100.0%) |
| Coal or Coke | 0 (0.0%) | 0 (0.0%) |
| All other Fuels | 0 (0.0%) | 0 (0.0%) |
| No Fuel Used | 0 (0.0%) | 0 (0.0%) |
| Total | 47 (100.0%) | 13 (100.0%) |
Household Vehicle Usage in Chevak
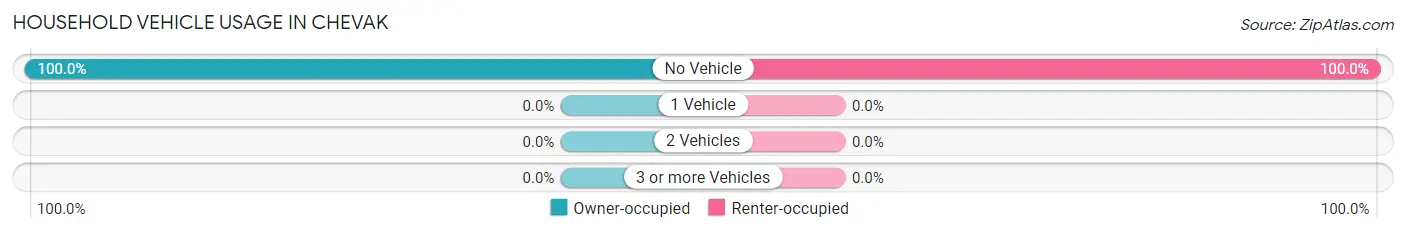
| Vehicles per Household | Owner-occupied | Renter-occupied |
| No Vehicle | 47 (100.0%) | 13 (100.0%) |
| 1 Vehicle | 0 (0.0%) | 0 (0.0%) |
| 2 Vehicles | 0 (0.0%) | 0 (0.0%) |
| 3 or more Vehicles | 0 (0.0%) | 0 (0.0%) |
| Total | 47 (100.0%) | 13 (100.0%) |
Real Estate & Mortgages in Chevak
Real Estate and Mortgage Overview in Chevak
| Characteristic | Without Mortgage | With Mortgage |
| Housing Units | 41 | 6 |
| Median Property Value | $77,000 | $0 |
| Median Household Income | - | - |
| Monthly Housing Costs | $246 | $0 |
| Real Estate Taxes | - | - |
Property Value by Mortgage Status in Chevak
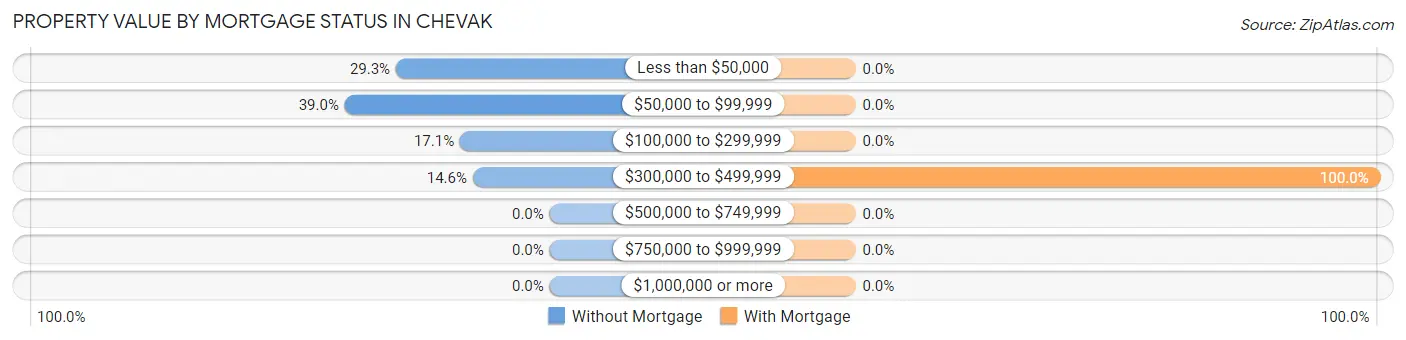
| Property Value | Without Mortgage | With Mortgage |
| Less than $50,000 | 12 (29.3%) | 0 (0.0%) |
| $50,000 to $99,999 | 16 (39.0%) | 0 (0.0%) |
| $100,000 to $299,999 | 7 (17.1%) | 0 (0.0%) |
| $300,000 to $499,999 | 6 (14.6%) | 6 (100.0%) |
| $500,000 to $749,999 | 0 (0.0%) | 0 (0.0%) |
| $750,000 to $999,999 | 0 (0.0%) | 0 (0.0%) |
| $1,000,000 or more | 0 (0.0%) | 0 (0.0%) |
| Total | 41 (100.0%) | 6 (100.0%) |
Household Income by Mortgage Status in Chevak
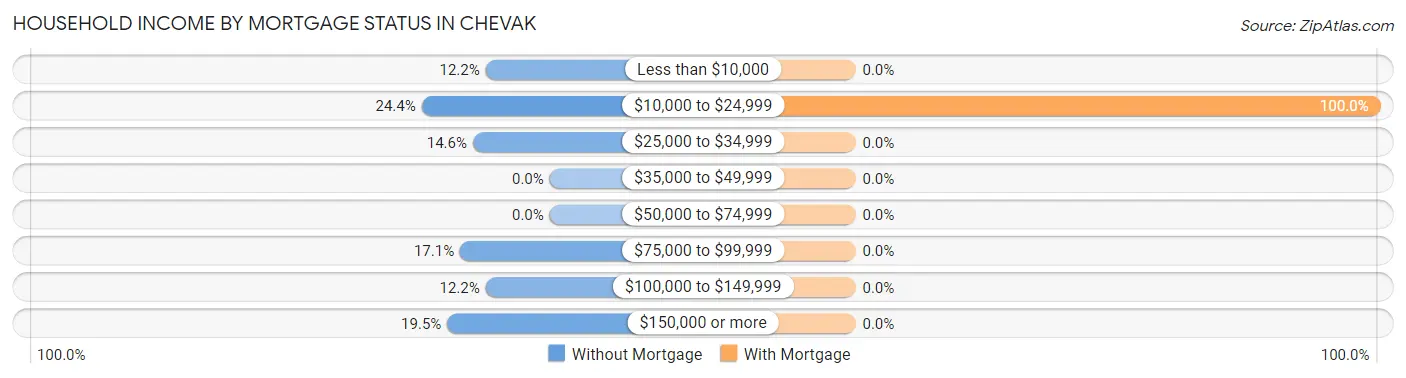
| Household Income | Without Mortgage | With Mortgage |
| Less than $10,000 | 5 (12.2%) | 0 (0.0%) |
| $10,000 to $24,999 | 10 (24.4%) | 6 (100.0%) |
| $25,000 to $34,999 | 6 (14.6%) | 0 (0.0%) |
| $35,000 to $49,999 | 0 (0.0%) | 0 (0.0%) |
| $50,000 to $74,999 | 0 (0.0%) | 0 (0.0%) |
| $75,000 to $99,999 | 7 (17.1%) | 0 (0.0%) |
| $100,000 to $149,999 | 5 (12.2%) | 0 (0.0%) |
| $150,000 or more | 8 (19.5%) | 0 (0.0%) |
| Total | 41 (100.0%) | 6 (100.0%) |
Property Value to Household Income Ratio in Chevak
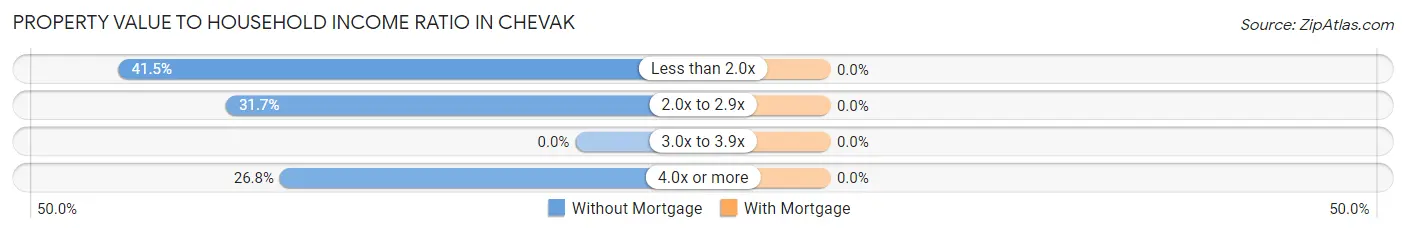
| Value-to-Income Ratio | Without Mortgage | With Mortgage |
| Less than 2.0x | 17 (41.5%) | 0 (0.0%) |
| 2.0x to 2.9x | 13 (31.7%) | 0 (0.0%) |
| 3.0x to 3.9x | 0 (0.0%) | 0 (0.0%) |
| 4.0x or more | 11 (26.8%) | 0 (0.0%) |
| Total | 41 (100.0%) | 6 (100.0%) |
Real Estate Taxes by Mortgage Status in Chevak
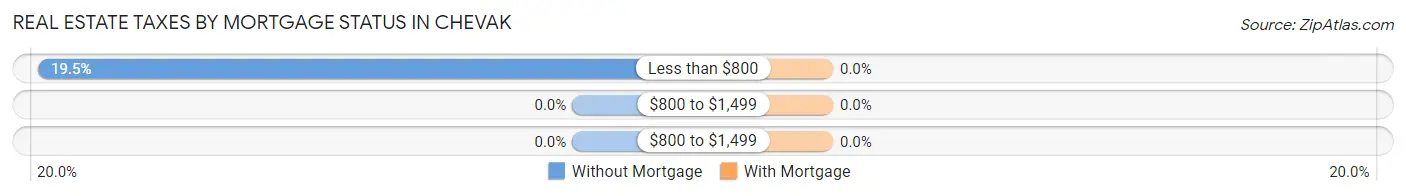
| Property Taxes | Without Mortgage | With Mortgage |
| Less than $800 | 8 (19.5%) | 0 (0.0%) |
| $800 to $1,499 | 0 (0.0%) | 0 (0.0%) |
| $800 to $1,499 | 0 (0.0%) | 0 (0.0%) |
| Total | 41 (100.0%) | 6 (100.0%) |
Health & Disability in Chevak
Health Insurance Coverage by Age in Chevak
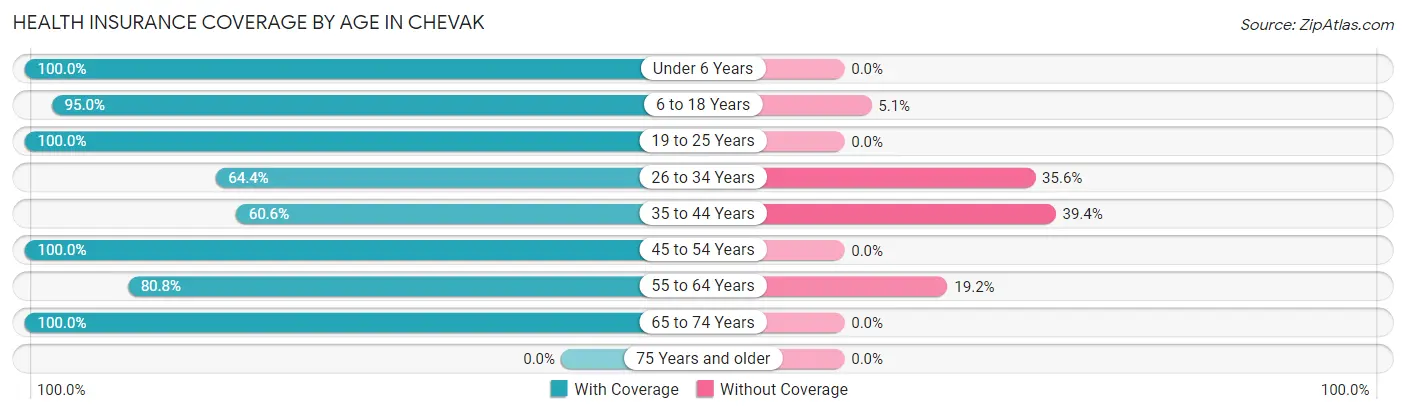
| Age Bracket | With Coverage | Without Coverage |
| Under 6 Years | 37 (100.0%) | 0 (0.0%) |
| 6 to 18 Years | 94 (95.0%) | 5 (5.1%) |
| 19 to 25 Years | 14 (100.0%) | 0 (0.0%) |
| 26 to 34 Years | 38 (64.4%) | 21 (35.6%) |
| 35 to 44 Years | 20 (60.6%) | 13 (39.4%) |
| 45 to 54 Years | 93 (100.0%) | 0 (0.0%) |
| 55 to 64 Years | 63 (80.8%) | 15 (19.2%) |
| 65 to 74 Years | 19 (100.0%) | 0 (0.0%) |
| 75 Years and older | 0 (0.0%) | 0 (0.0%) |
| Total | 378 (87.5%) | 54 (12.5%) |
Health Insurance Coverage by Citizenship Status in Chevak
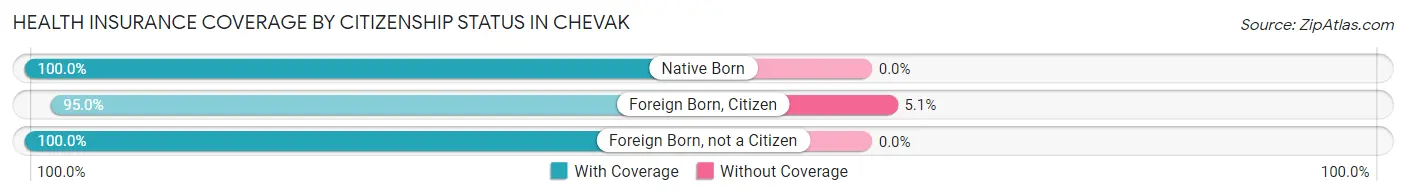
| Citizenship Status | With Coverage | Without Coverage |
| Native Born | 37 (100.0%) | 0 (0.0%) |
| Foreign Born, Citizen | 94 (95.0%) | 5 (5.1%) |
| Foreign Born, not a Citizen | 14 (100.0%) | 0 (0.0%) |
Health Insurance Coverage by Household Income in Chevak
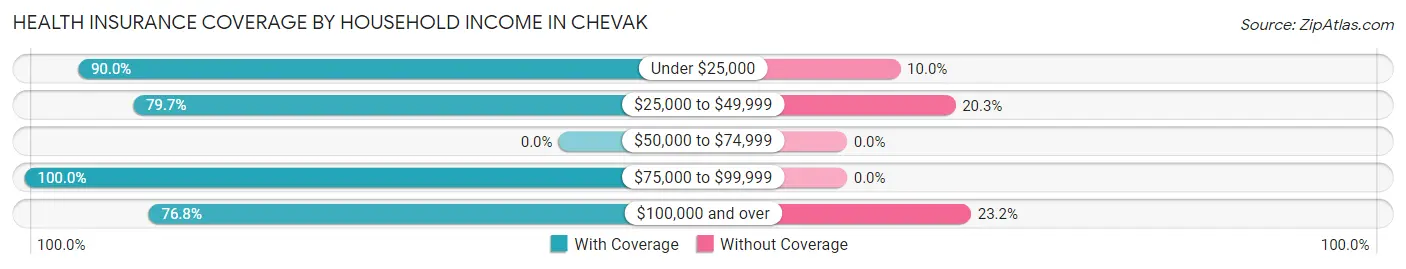
| Household Income | With Coverage | Without Coverage |
| Under $25,000 | 45 (90.0%) | 5 (10.0%) |
| $25,000 to $49,999 | 51 (79.7%) | 13 (20.3%) |
| $50,000 to $74,999 | 0 (0.0%) | 0 (0.0%) |
| $75,000 to $99,999 | 18 (100.0%) | 0 (0.0%) |
| $100,000 and over | 119 (76.8%) | 36 (23.2%) |
Public vs Private Health Insurance Coverage by Age in Chevak
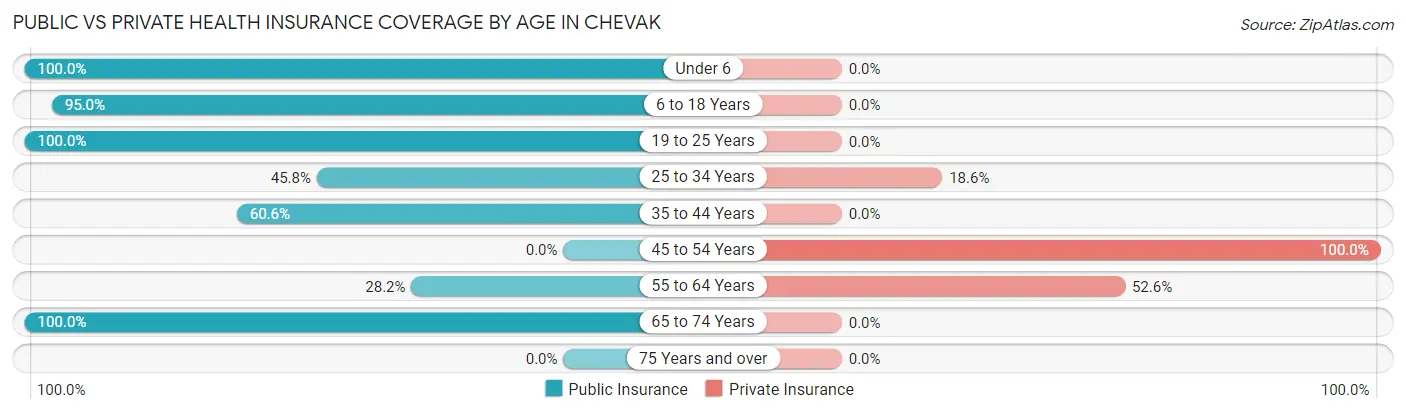
| Age Bracket | Public Insurance | Private Insurance |
| Under 6 | 37 (100.0%) | 0 (0.0%) |
| 6 to 18 Years | 94 (95.0%) | 0 (0.0%) |
| 19 to 25 Years | 14 (100.0%) | 0 (0.0%) |
| 25 to 34 Years | 27 (45.8%) | 11 (18.6%) |
| 35 to 44 Years | 20 (60.6%) | 0 (0.0%) |
| 45 to 54 Years | 0 (0.0%) | 93 (100.0%) |
| 55 to 64 Years | 22 (28.2%) | 41 (52.6%) |
| 65 to 74 Years | 19 (100.0%) | 0 (0.0%) |
| 75 Years and over | 0 (0.0%) | 0 (0.0%) |
| Total | 233 (53.9%) | 145 (33.6%) |
Disability Status by Sex by Age in Chevak
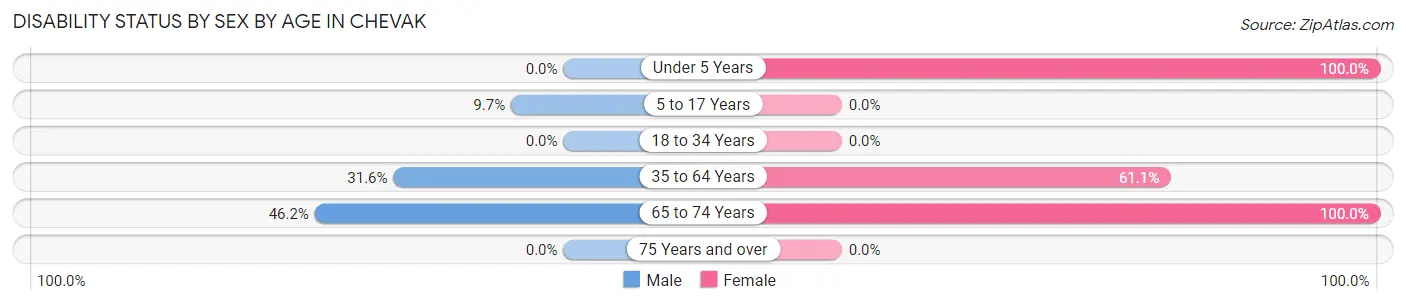
| Age Bracket | Male | Female |
| Under 5 Years | 0 (0.0%) | 8 (100.0%) |
| 5 to 17 Years | 7 (9.7%) | 0 (0.0%) |
| 18 to 34 Years | 0 (0.0%) | 0 (0.0%) |
| 35 to 64 Years | 53 (31.6%) | 22 (61.1%) |
| 65 to 74 Years | 6 (46.2%) | 6 (100.0%) |
| 75 Years and over | 0 (0.0%) | 0 (0.0%) |
Disability Class by Sex by Age in Chevak
Disability Class: Hearing Difficulty
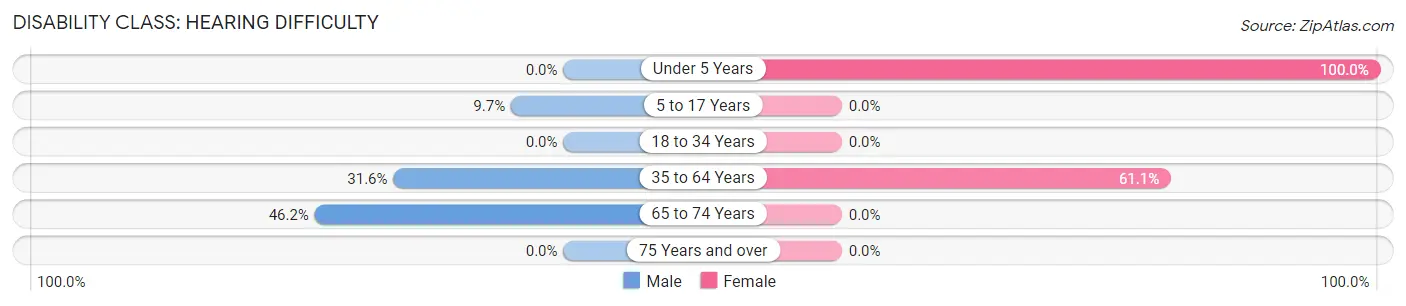
| Age Bracket | Male | Female |
| Under 5 Years | 0 (0.0%) | 8 (100.0%) |
| 5 to 17 Years | 7 (9.7%) | 0 (0.0%) |
| 18 to 34 Years | 0 (0.0%) | 0 (0.0%) |
| 35 to 64 Years | 53 (31.6%) | 22 (61.1%) |
| 65 to 74 Years | 6 (46.2%) | 0 (0.0%) |
| 75 Years and over | 0 (0.0%) | 0 (0.0%) |
Disability Class: Vision Difficulty
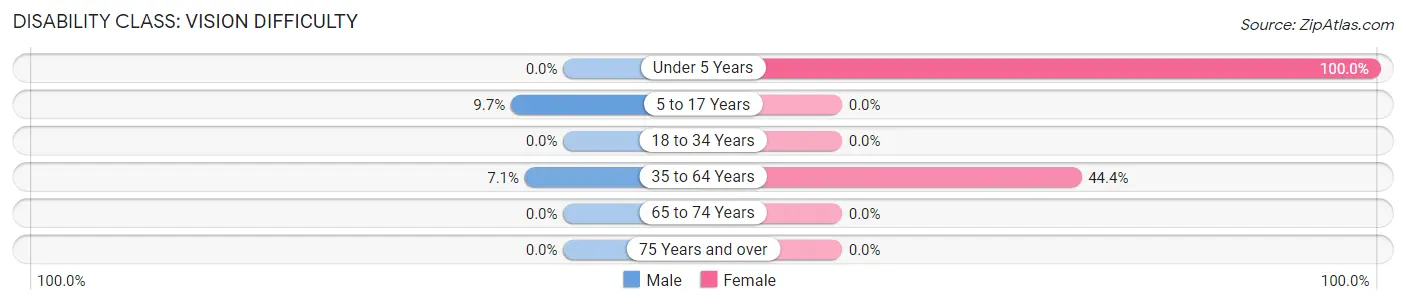
| Age Bracket | Male | Female |
| Under 5 Years | 0 (0.0%) | 8 (100.0%) |
| 5 to 17 Years | 7 (9.7%) | 0 (0.0%) |
| 18 to 34 Years | 0 (0.0%) | 0 (0.0%) |
| 35 to 64 Years | 12 (7.1%) | 16 (44.4%) |
| 65 to 74 Years | 0 (0.0%) | 0 (0.0%) |
| 75 Years and over | 0 (0.0%) | 0 (0.0%) |
Disability Class: Cognitive Difficulty
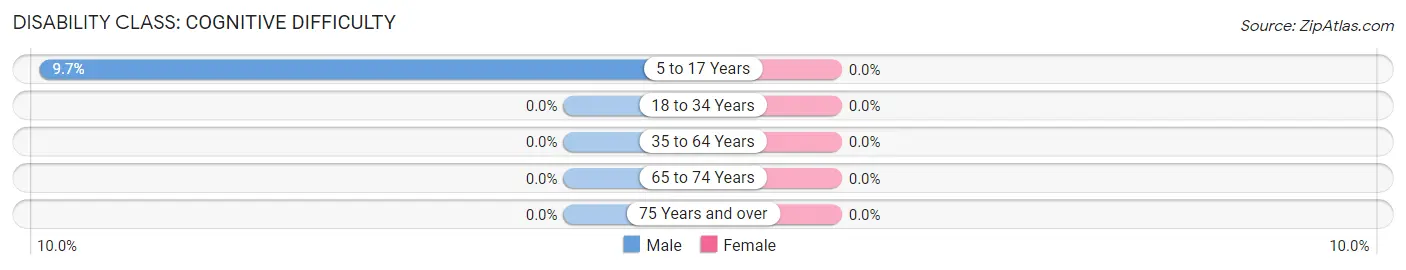
| Age Bracket | Male | Female |
| 5 to 17 Years | 7 (9.7%) | 0 (0.0%) |
| 18 to 34 Years | 0 (0.0%) | 0 (0.0%) |
| 35 to 64 Years | 0 (0.0%) | 0 (0.0%) |
| 65 to 74 Years | 0 (0.0%) | 0 (0.0%) |
| 75 Years and over | 0 (0.0%) | 0 (0.0%) |
Disability Class: Ambulatory Difficulty
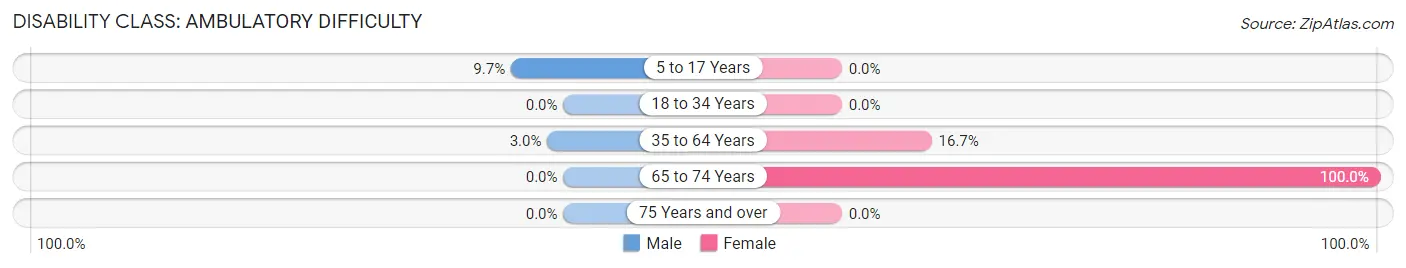
| Age Bracket | Male | Female |
| 5 to 17 Years | 7 (9.7%) | 0 (0.0%) |
| 18 to 34 Years | 0 (0.0%) | 0 (0.0%) |
| 35 to 64 Years | 5 (3.0%) | 6 (16.7%) |
| 65 to 74 Years | 0 (0.0%) | 6 (100.0%) |
| 75 Years and over | 0 (0.0%) | 0 (0.0%) |
Disability Class: Self-Care Difficulty
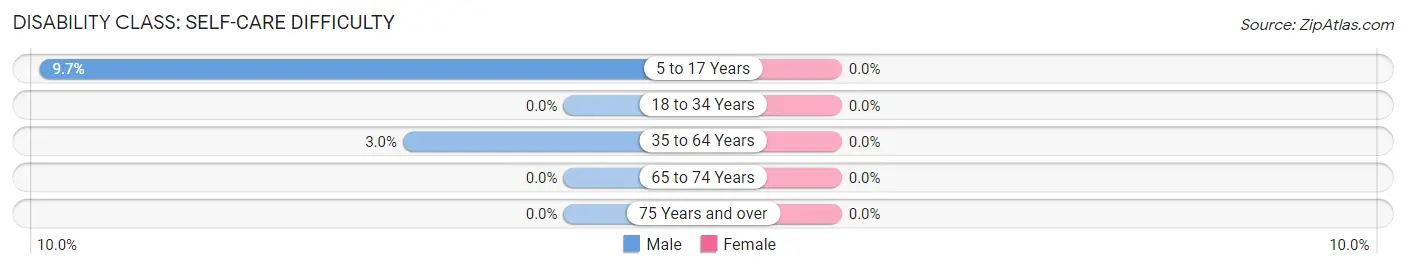
| Age Bracket | Male | Female |
| 5 to 17 Years | 7 (9.7%) | 0 (0.0%) |
| 18 to 34 Years | 0 (0.0%) | 0 (0.0%) |
| 35 to 64 Years | 5 (3.0%) | 0 (0.0%) |
| 65 to 74 Years | 0 (0.0%) | 0 (0.0%) |
| 75 Years and over | 0 (0.0%) | 0 (0.0%) |
Technology Access in Chevak
Computing Device Access in Chevak
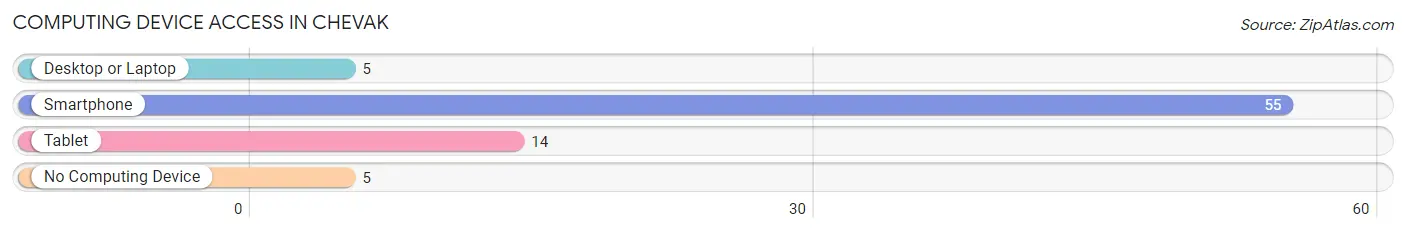
| Device Type | # Households | % Households |
| Desktop or Laptop | 5 | 8.3% |
| Smartphone | 55 | 91.7% |
| Tablet | 14 | 23.3% |
| No Computing Device | 5 | 8.3% |
| Total | 60 | 100.0% |
Internet Access in Chevak
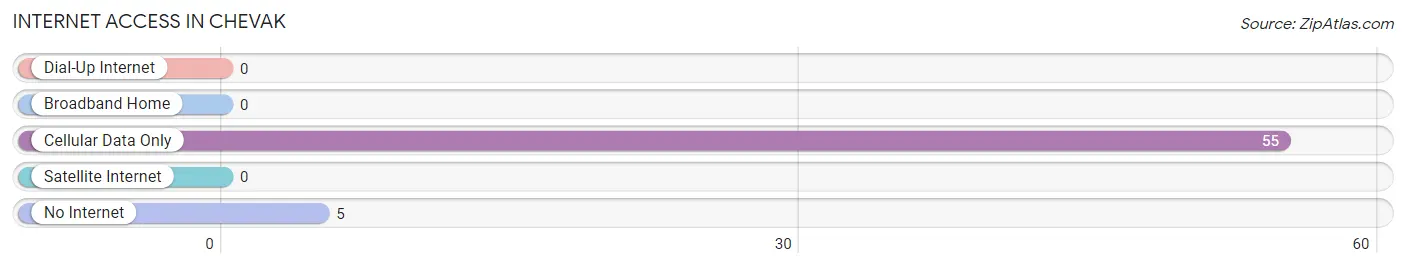
| Internet Type | # Households | % Households |
| Dial-Up Internet | 0 | 0.0% |
| Broadband Home | 0 | 0.0% |
| Cellular Data Only | 55 | 91.7% |
| Satellite Internet | 0 | 0.0% |
| No Internet | 5 | 8.3% |
| Total | 60 | 100.0% |
Chevak Summary
Chevak is a small city located in the western part of Alaska, United States. It is situated on the banks of the Kuskokwim River, about 40 miles south of Bethel. The city is part of the Bethel Census Area and has a population of about 1,000 people.
History
Chevak was originally inhabited by the Yup'ik people, who have lived in the area for thousands of years. The first European settlers arrived in the area in the late 19th century, and the town was officially established in 1901. The town was named after a Yup'ik chief, Chevak, who was a leader in the area.
The town grew slowly over the years, and in the 1950s, the Alaska Native Claims Settlement Act (ANCSA) was passed, which allowed the Yup'ik people to claim land in the area. This led to the establishment of the Chevak Native Corporation, which is still in operation today.
Geography
Chevak is located in the western part of Alaska, about 40 miles south of Bethel. The city is situated on the banks of the Kuskokwim River, and is surrounded by the Yukon Delta National Wildlife Refuge. The city has a total area of 4.2 square miles, all of which is land.
The climate in Chevak is subarctic, with cold winters and mild summers. The average temperature in the summer is around 50°F, and in the winter it is around 10°F. The average annual precipitation is around 10 inches.
Economy
The economy of Chevak is largely based on subsistence fishing and hunting. The city is home to the Chevak Native Corporation, which is involved in various businesses, including fishing, hunting, and tourism. The city also has a small commercial fishing industry, and there are several small businesses in the area.
The city is also home to the Chevak School District, which serves the educational needs of the community. The school district is funded by the state of Alaska and the federal government.
Demographics
As of the 2010 census, the population of Chevak was 1,004, with a population density of 239.3 people per square mile. The racial makeup of the city was 95.3% Native American, 2.7% White, 0.2% Asian, 0.1% Pacific Islander, and 1.7% from other races.
The median income for a household in Chevak was $30,000, and the median income for a family was $35,000. The per capita income for the city was $14,000. About 24.3% of the population was below the poverty line.
Chevak is a small city with a rich history and culture. The city is home to the Yup'ik people, who have lived in the area for thousands of years. The economy of the city is largely based on subsistence fishing and hunting, and the city is also home to the Chevak Native Corporation. The population of the city is around 1,000 people, and the median income for a household is around $30,000.
Common Questions
What is Per Capita Income in Chevak?
Per Capita income in Chevak is $75,144.
What is Inequality or Gini Index in Chevak?
Inequality or Gini Index in Chevak is 0.56.
What is the Total Population of Chevak?
Total Population of Chevak is 432.
What is the Total Male Population of Chevak?
Total Male Population of Chevak is 320.
What is the Total Female Population of Chevak?
Total Female Population of Chevak is 112.
What is the Ratio of Males per 100 Females in Chevak?
There are 285.71 Males per 100 Females in Chevak.
What is the Ratio of Females per 100 Males in Chevak?
There are 35.00 Females per 100 Males in Chevak.
What is the Median Population Age in Chevak?
Median Population Age in Chevak is 35.9 Years.
What is the Average Family Size in Chevak
Average Family Size in Chevak is 5.4 People.
What is the Average Household Size in Chevak
Average Household Size in Chevak is 4.8 People.
How Large is the Labor Force in Chevak?
There are 245 People in the Labor Forcein in Chevak.
What is the Percentage of People in the Labor Force in Chevak?
81.4% of People are in the Labor Force in Chevak.
What is the Unemployment Rate in Chevak?
Unemployment Rate in Chevak is 13.5%.