Midwest, WY Map & Demographics
Midwest Map
Midwest Overview
$40,970
PER CAPITA INCOME
$83,021
AVG FAMILY INCOME
$72,826
AVG HOUSEHOLD INCOME
48.8%
WAGE / INCOME GAP [ % ]
51.2¢/ $1
WAGE / INCOME GAP [ $ ]
0.32
INEQUALITY / GINI INDEX
205
TOTAL POPULATION
117
MALE POPULATION
88
FEMALE POPULATION
132.95
MALES / 100 FEMALES
75.21
FEMALES / 100 MALES
51.8
MEDIAN AGE
2.4
AVG FAMILY SIZE
1.6
AVG HOUSEHOLD SIZE
118
LABOR FORCE [ PEOPLE ]
61.5%
PERCENT IN LABOR FORCE
1.7%
UNEMPLOYMENT RATE
Midwest Zip Codes
Midwest Area Codes
Income in Midwest
Income Overview in Midwest
Per Capita Income in Midwest is $40,970, while median incomes of families and households are $83,021 and $72,826 respectively.
| Characteristic | Number | Measure |
| Per Capita Income | 205 | $40,970 |
| Median Family Income | 57 | $83,021 |
| Mean Family Income | 57 | $84,853 |
| Median Household Income | 124 | $72,826 |
| Mean Household Income | 124 | $65,871 |
| Income Deficit | 57 | $0 |
| Wage / Income Gap (%) | 205 | 48.82% |
| Wage / Income Gap ($) | 205 | 51.18¢ per $1 |
| Gini / Inequality Index | 205 | 0.32 |
Earnings by Sex in Midwest
Average Earnings in Midwest are $39,375, $55,417 for men and $28,365 for women, a difference of 48.8%.
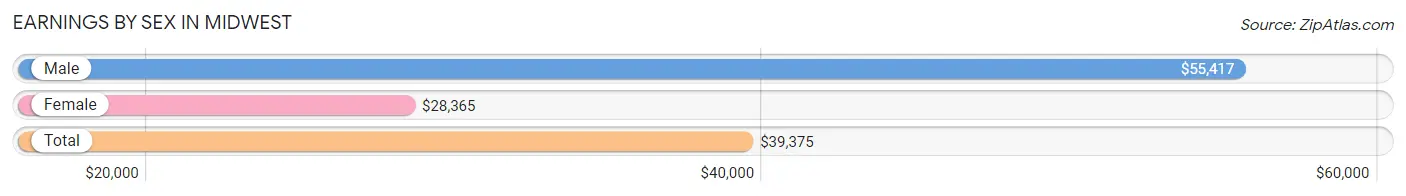
| Sex | Number | Average Earnings |
| Male | 80 (62.0%) | $55,417 |
| Female | 49 (38.0%) | $28,365 |
| Total | 129 (100.0%) | $39,375 |
Earnings by Sex by Income Bracket in Midwest
The most common earnings brackets in Midwest are $55,000 to $64,999 for men (25 | 31.2%) and $25,000 to $29,999 for women (14 | 28.6%).
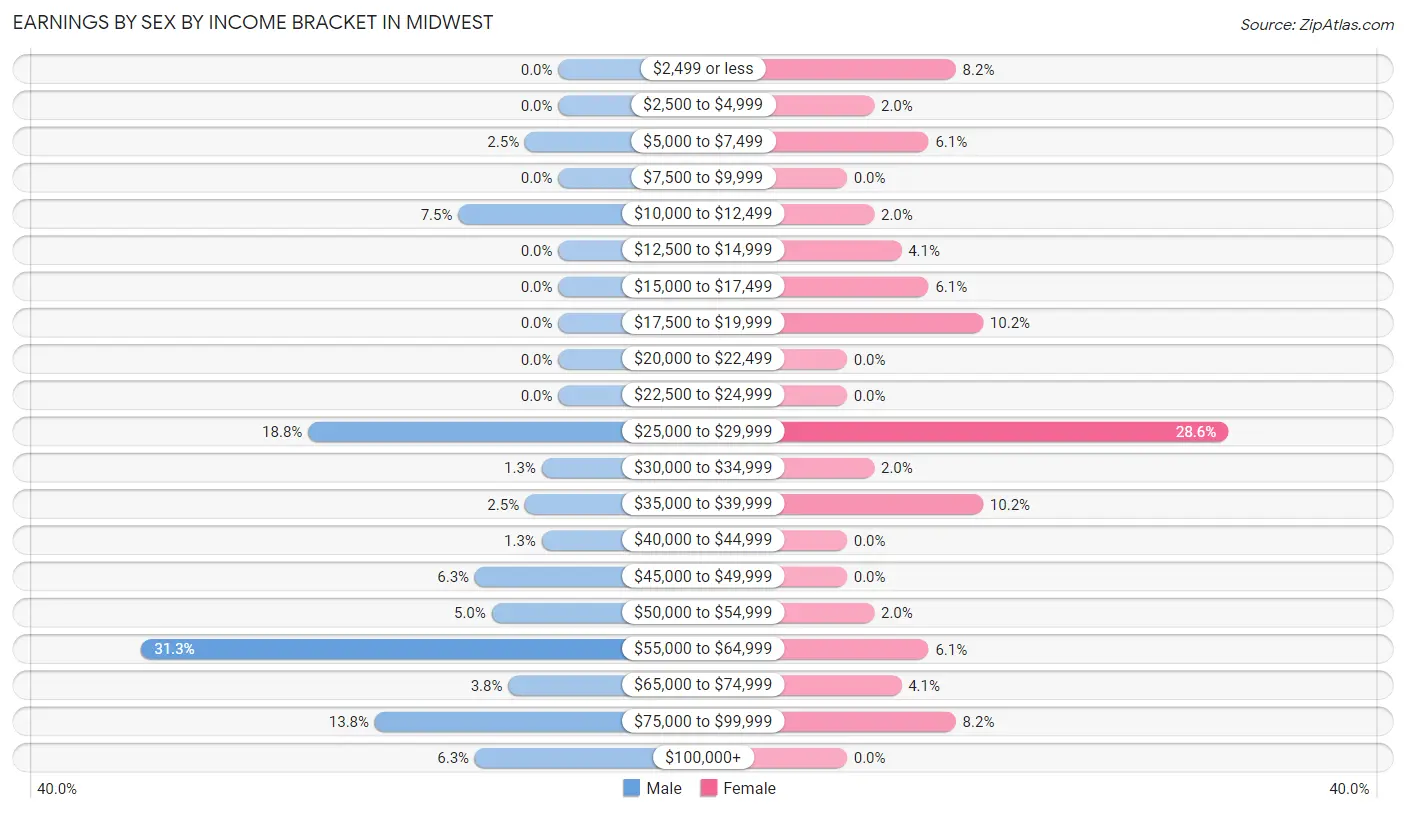
| Income | Male | Female |
| $2,499 or less | 0 (0.0%) | 4 (8.2%) |
| $2,500 to $4,999 | 0 (0.0%) | 1 (2.0%) |
| $5,000 to $7,499 | 2 (2.5%) | 3 (6.1%) |
| $7,500 to $9,999 | 0 (0.0%) | 0 (0.0%) |
| $10,000 to $12,499 | 6 (7.5%) | 1 (2.0%) |
| $12,500 to $14,999 | 0 (0.0%) | 2 (4.1%) |
| $15,000 to $17,499 | 0 (0.0%) | 3 (6.1%) |
| $17,500 to $19,999 | 0 (0.0%) | 5 (10.2%) |
| $20,000 to $22,499 | 0 (0.0%) | 0 (0.0%) |
| $22,500 to $24,999 | 0 (0.0%) | 0 (0.0%) |
| $25,000 to $29,999 | 15 (18.8%) | 14 (28.6%) |
| $30,000 to $34,999 | 1 (1.3%) | 1 (2.0%) |
| $35,000 to $39,999 | 2 (2.5%) | 5 (10.2%) |
| $40,000 to $44,999 | 1 (1.3%) | 0 (0.0%) |
| $45,000 to $49,999 | 5 (6.2%) | 0 (0.0%) |
| $50,000 to $54,999 | 4 (5.0%) | 1 (2.0%) |
| $55,000 to $64,999 | 25 (31.2%) | 3 (6.1%) |
| $65,000 to $74,999 | 3 (3.7%) | 2 (4.1%) |
| $75,000 to $99,999 | 11 (13.8%) | 4 (8.2%) |
| $100,000+ | 5 (6.2%) | 0 (0.0%) |
| Total | 80 (100.0%) | 49 (100.0%) |
Earnings by Sex by Educational Attainment in Midwest
Average earnings in Midwest are $55,469 for men and $28,846 for women, a difference of 48.0%. Men with an educational attainment of college or associate's degree enjoy the highest average annual earnings of $56,304, while those with less than high school education earn the least with $43,750. Women with an educational attainment of college or associate's degree earn the most with the average annual earnings of $31,250, while those with high school diploma education have the smallest earnings of $28,036.
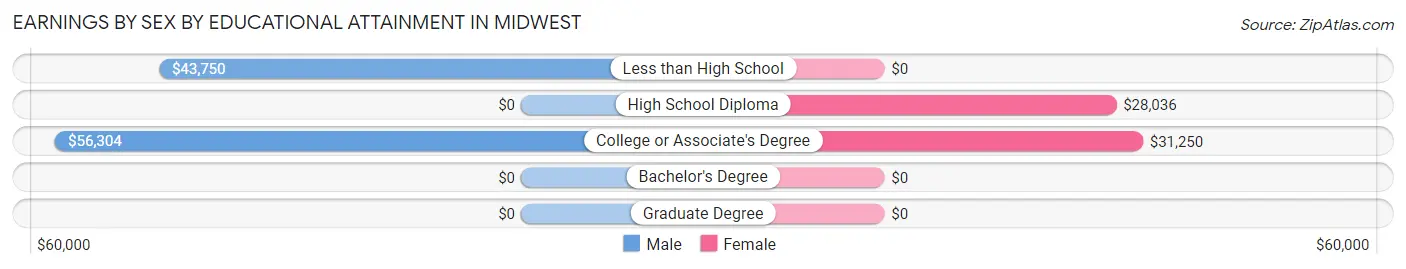
| Educational Attainment | Male Income | Female Income |
| Less than High School | $43,750 | $0 |
| High School Diploma | - | - |
| College or Associate's Degree | $56,304 | $31,250 |
| Bachelor's Degree | - | - |
| Graduate Degree | - | - |
| Total | $55,469 | $28,846 |
Family Income in Midwest
Family Income Brackets in Midwest
According to the Midwest family income data, there are 16 families falling into the $75,000 to $99,999 income range, which is the most common income bracket and makes up 28.1% of all families.
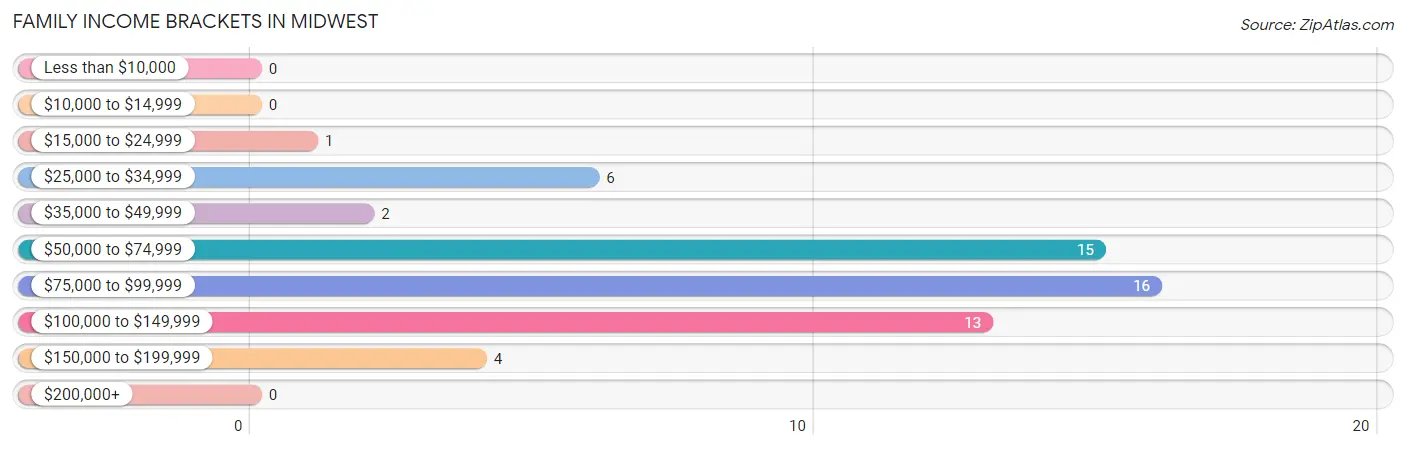
| Income Bracket | # Families | % Families |
| Less than $10,000 | 0 | 0.0% |
| $10,000 to $14,999 | 0 | 0.0% |
| $15,000 to $24,999 | 1 | 1.8% |
| $25,000 to $34,999 | 6 | 10.5% |
| $35,000 to $49,999 | 2 | 3.5% |
| $50,000 to $74,999 | 15 | 26.3% |
| $75,000 to $99,999 | 16 | 28.1% |
| $100,000 to $149,999 | 13 | 22.8% |
| $150,000 to $199,999 | 4 | 7.0% |
| $200,000+ | 0 | 0.0% |
Family Income by Famaliy Size in Midwest
3-person families (23 | 40.4%) account for the highest median family income in Midwest with $84,375 per family, while 2-person families (33 | 57.9%) have the highest median income of $31,771 per family member.
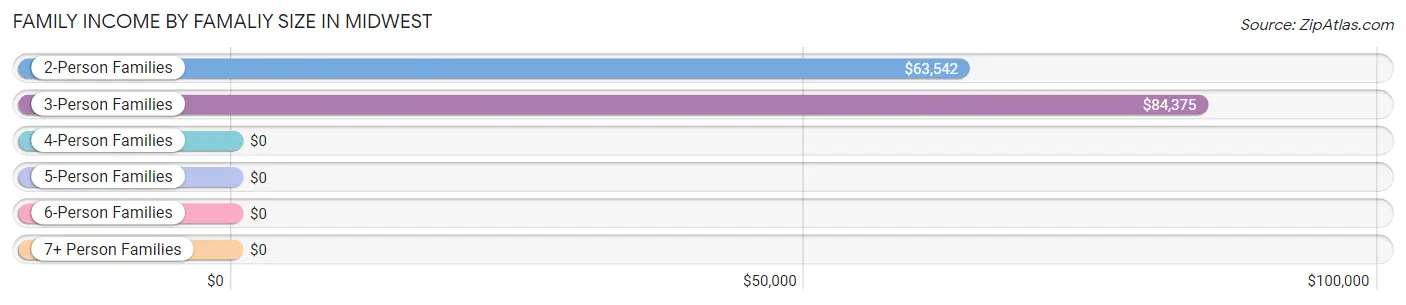
| Income Bracket | # Families | Median Income |
| 2-Person Families | 33 (57.9%) | $63,542 |
| 3-Person Families | 23 (40.4%) | $84,375 |
| 4-Person Families | 1 (1.8%) | $0 |
| 5-Person Families | 0 (0.0%) | $0 |
| 6-Person Families | 0 (0.0%) | $0 |
| 7+ Person Families | 0 (0.0%) | $0 |
| Total | 57 (100.0%) | $83,021 |
Family Income by Number of Earners in Midwest
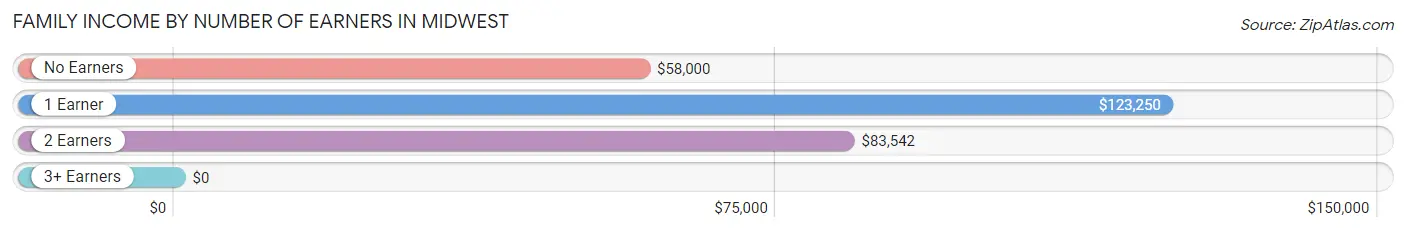
| Number of Earners | # Families | Median Income |
| No Earners | 10 (17.5%) | $58,000 |
| 1 Earner | 15 (26.3%) | $123,250 |
| 2 Earners | 32 (56.1%) | $83,542 |
| 3+ Earners | 0 (0.0%) | $0 |
| Total | 57 (100.0%) | $83,021 |
Household Income in Midwest
Household Income Brackets in Midwest
With 44 households falling in the category, the $50,000 to $74,999 income range is the most frequent in Midwest, accounting for 35.5% of all households.
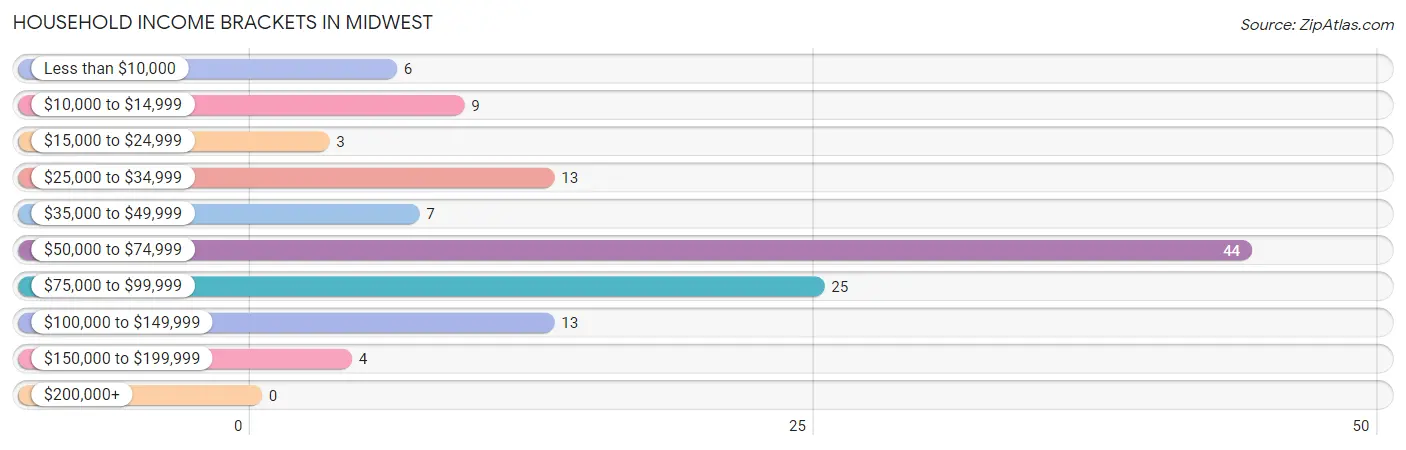
| Income Bracket | # Households | % Households |
| Less than $10,000 | 6 | 4.8% |
| $10,000 to $14,999 | 9 | 7.3% |
| $15,000 to $24,999 | 3 | 2.4% |
| $25,000 to $34,999 | 13 | 10.5% |
| $35,000 to $49,999 | 7 | 5.6% |
| $50,000 to $74,999 | 44 | 35.5% |
| $75,000 to $99,999 | 25 | 20.2% |
| $100,000 to $149,999 | 13 | 10.5% |
| $150,000 to $199,999 | 4 | 3.2% |
| $200,000+ | 0 | 0.0% |
Household Income by Householder Age in Midwest
The median household income in Midwest is $72,826, with the highest median household income of $83,875 found in the 25 to 44 years age bracket for the primary householder. A total of 17 households (13.7%) fall into this category. Meanwhile, the 15 to 24 years age bracket for the primary householder has the lowest median household income of $0, with 4 households (3.2%) in this group.
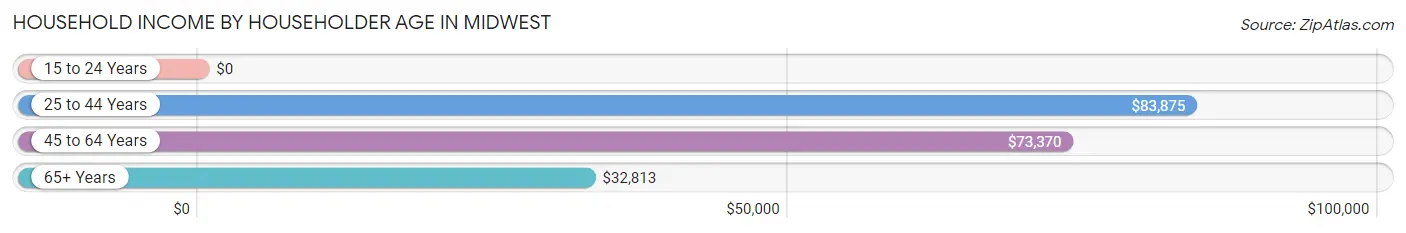
| Income Bracket | # Households | Median Income |
| 15 to 24 Years | 4 (3.2%) | $0 |
| 25 to 44 Years | 17 (13.7%) | $83,875 |
| 45 to 64 Years | 80 (64.5%) | $73,370 |
| 65+ Years | 23 (18.5%) | $32,813 |
| Total | 124 (100.0%) | $72,826 |
Poverty in Midwest
Income Below Poverty by Sex and Age in Midwest
With 6.8% poverty level for males and 13.6% for females among the residents of Midwest, 16 and 17 year old males and 18 to 24 year old females are the most vulnerable to poverty, with 1 males (100.0%) and 4 females (100.0%) in their respective age groups living below the poverty level.
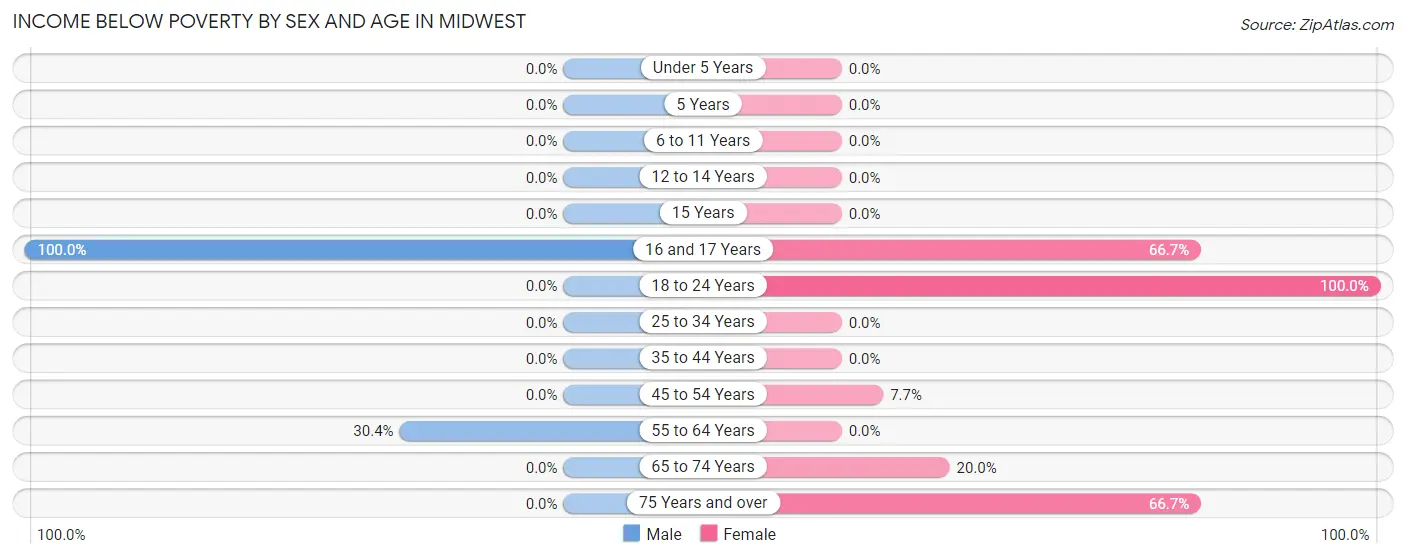
| Age Bracket | Male | Female |
| Under 5 Years | 0 (0.0%) | 0 (0.0%) |
| 5 Years | 0 (0.0%) | 0 (0.0%) |
| 6 to 11 Years | 0 (0.0%) | 0 (0.0%) |
| 12 to 14 Years | 0 (0.0%) | 0 (0.0%) |
| 15 Years | 0 (0.0%) | 0 (0.0%) |
| 16 and 17 Years | 1 (100.0%) | 2 (66.7%) |
| 18 to 24 Years | 0 (0.0%) | 4 (100.0%) |
| 25 to 34 Years | 0 (0.0%) | 0 (0.0%) |
| 35 to 44 Years | 0 (0.0%) | 0 (0.0%) |
| 45 to 54 Years | 0 (0.0%) | 1 (7.7%) |
| 55 to 64 Years | 7 (30.4%) | 0 (0.0%) |
| 65 to 74 Years | 0 (0.0%) | 3 (20.0%) |
| 75 Years and over | 0 (0.0%) | 2 (66.7%) |
| Total | 8 (6.8%) | 12 (13.6%) |
Income Above Poverty by Sex and Age in Midwest
According to the poverty statistics in Midwest, males aged 6 to 11 years and females aged 6 to 11 years are the age groups that are most secure financially, with 100.0% of males and 100.0% of females in these age groups living above the poverty line.
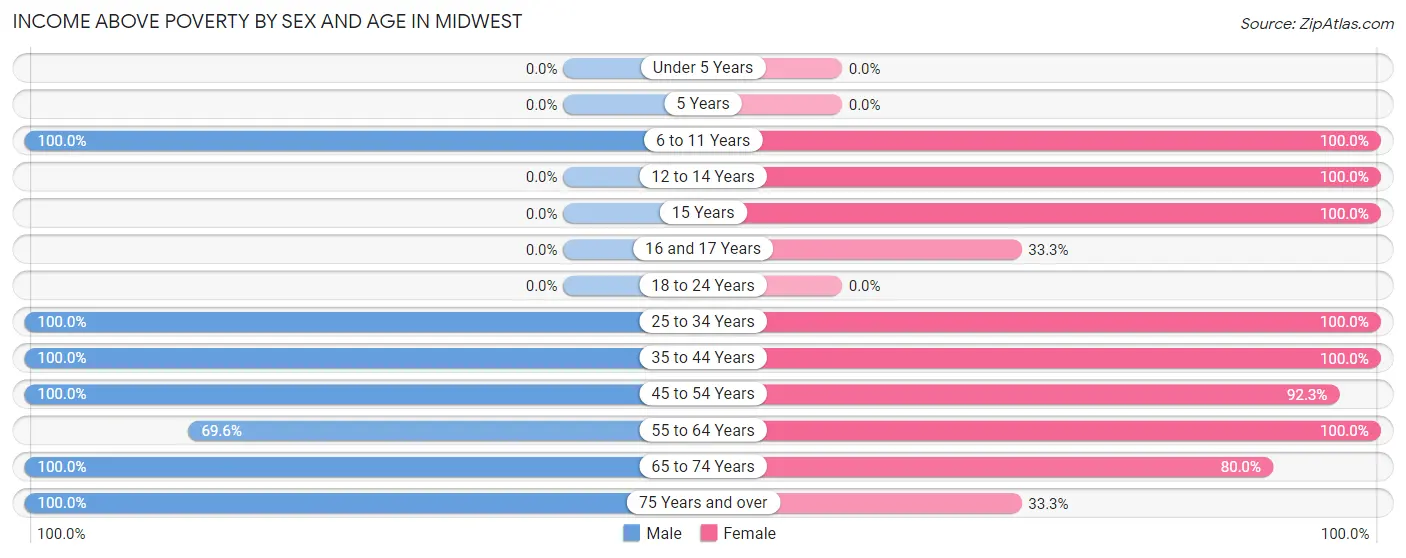
| Age Bracket | Male | Female |
| Under 5 Years | 0 (0.0%) | 0 (0.0%) |
| 5 Years | 0 (0.0%) | 0 (0.0%) |
| 6 to 11 Years | 5 (100.0%) | 1 (100.0%) |
| 12 to 14 Years | 0 (0.0%) | 4 (100.0%) |
| 15 Years | 0 (0.0%) | 3 (100.0%) |
| 16 and 17 Years | 0 (0.0%) | 1 (33.3%) |
| 18 to 24 Years | 0 (0.0%) | 0 (0.0%) |
| 25 to 34 Years | 10 (100.0%) | 8 (100.0%) |
| 35 to 44 Years | 12 (100.0%) | 6 (100.0%) |
| 45 to 54 Years | 43 (100.0%) | 12 (92.3%) |
| 55 to 64 Years | 16 (69.6%) | 28 (100.0%) |
| 65 to 74 Years | 17 (100.0%) | 12 (80.0%) |
| 75 Years and over | 6 (100.0%) | 1 (33.3%) |
| Total | 109 (93.2%) | 76 (86.4%) |
Income Below Poverty Among Married-Couple Families in Midwest
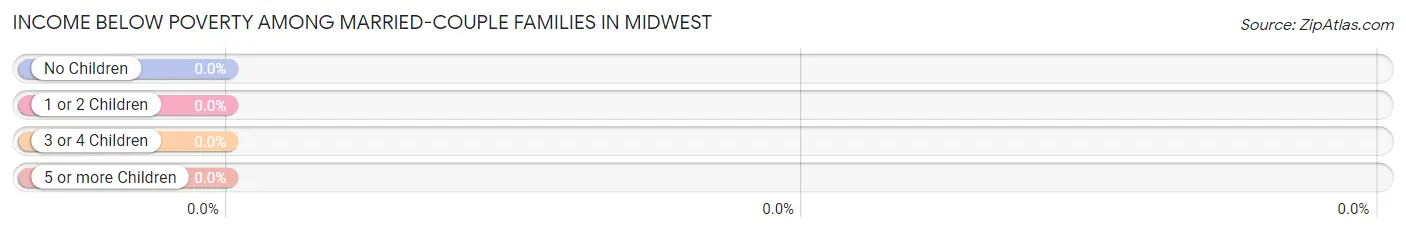
| Children | Above Poverty | Below Poverty |
| No Children | 38 (100.0%) | 0 (0.0%) |
| 1 or 2 Children | 18 (100.0%) | 0 (0.0%) |
| 3 or 4 Children | 0 (0.0%) | 0 (0.0%) |
| 5 or more Children | 0 (0.0%) | 0 (0.0%) |
| Total | 56 (100.0%) | 0 (0.0%) |
Income Below Poverty Among Single-Parent Households in Midwest
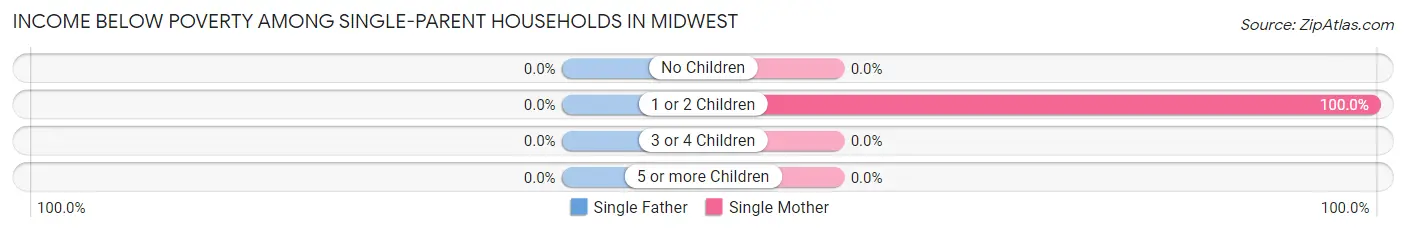
| Children | Single Father | Single Mother |
| No Children | 0 (0.0%) | 0 (0.0%) |
| 1 or 2 Children | 0 (0.0%) | 1 (100.0%) |
| 3 or 4 Children | 0 (0.0%) | 0 (0.0%) |
| 5 or more Children | 0 (0.0%) | 0 (0.0%) |
| Total | 0 (0.0%) | 1 (100.0%) |
Income Below Poverty Among Married-Couple vs Single-Parent Households in Midwest
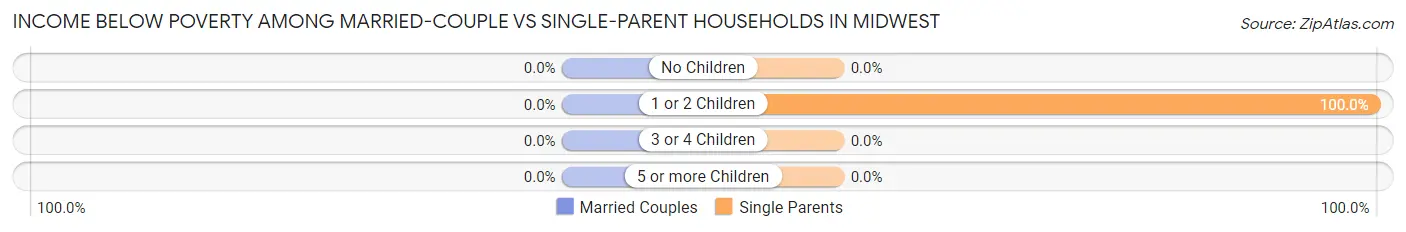
| Children | Married-Couple Families | Single-Parent Households |
| No Children | 0 (0.0%) | 0 (0.0%) |
| 1 or 2 Children | 0 (0.0%) | 1 (100.0%) |
| 3 or 4 Children | 0 (0.0%) | 0 (0.0%) |
| 5 or more Children | 0 (0.0%) | 0 (0.0%) |
| Total | 0 (0.0%) | 1 (100.0%) |
Race in Midwest
The most populous races in Midwest are White / Caucasian (197 | 96.1%), Hispanic or Latino (7 | 3.4%), and Some other Race (5 | 2.4%).
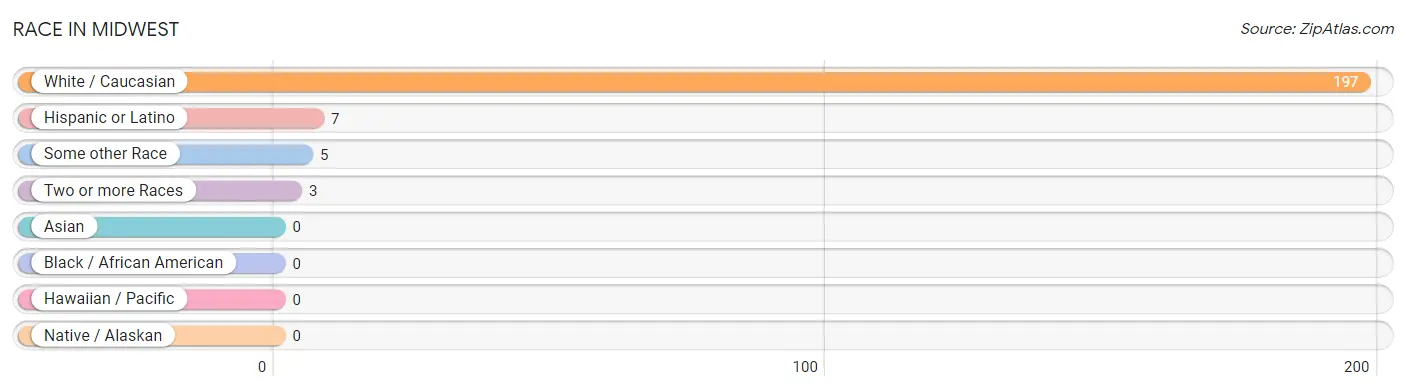
| Race | # Population | % Population |
| Asian | 0 | 0.0% |
| Black / African American | 0 | 0.0% |
| Hawaiian / Pacific | 0 | 0.0% |
| Hispanic or Latino | 7 | 3.4% |
| Native / Alaskan | 0 | 0.0% |
| White / Caucasian | 197 | 96.1% |
| Two or more Races | 3 | 1.5% |
| Some other Race | 5 | 2.4% |
| Total | 205 | 100.0% |
Ancestry in Midwest
The most populous ancestries reported in Midwest are Irish (27 | 13.2%), German (23 | 11.2%), British (8 | 3.9%), Swedish (8 | 3.9%), and American (5 | 2.4%), together accounting for 34.6% of all Midwest residents.
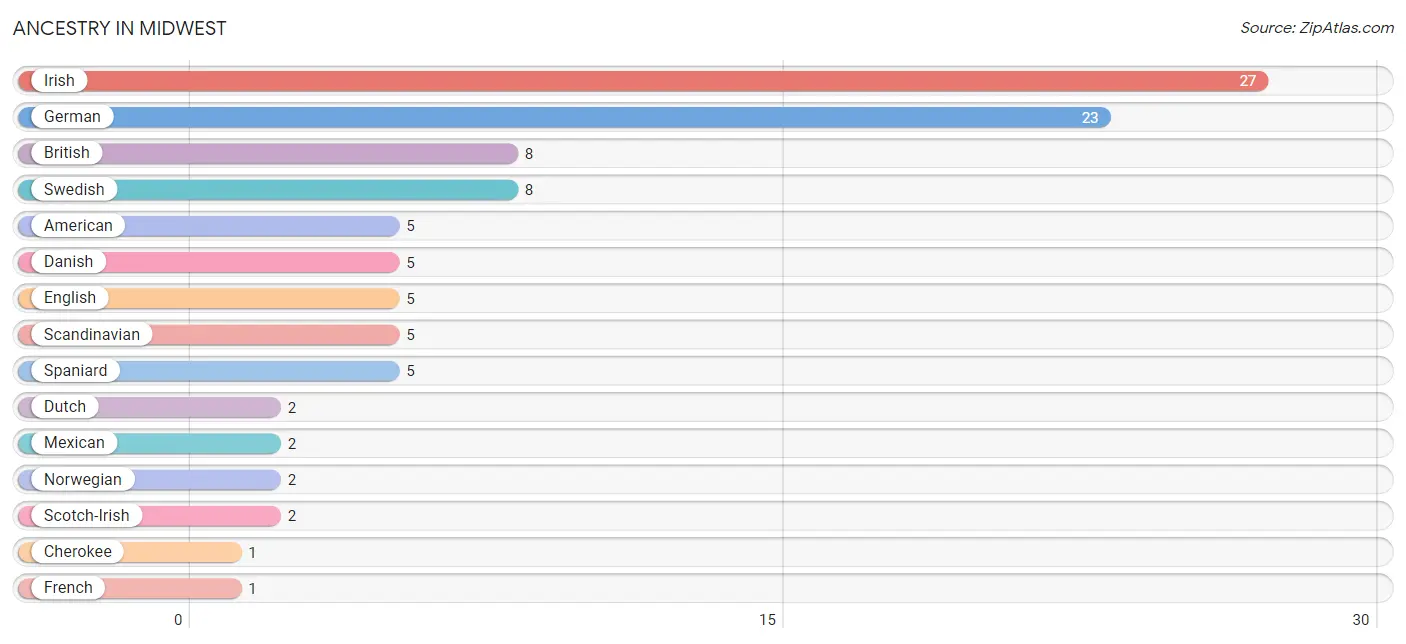
| Ancestry | # Population | % Population |
| American | 5 | 2.4% |
| British | 8 | 3.9% |
| Cherokee | 1 | 0.5% |
| Danish | 5 | 2.4% |
| Dutch | 2 | 1.0% |
| English | 5 | 2.4% |
| French | 1 | 0.5% |
| French American Indian | 1 | 0.5% |
| French Canadian | 1 | 0.5% |
| German | 23 | 11.2% |
| Irish | 27 | 13.2% |
| Mexican | 2 | 1.0% |
| Norwegian | 2 | 1.0% |
| Scandinavian | 5 | 2.4% |
| Scotch-Irish | 2 | 1.0% |
| Spaniard | 5 | 2.4% |
| Swedish | 8 | 3.9% | View All 17 Rows |
Immigrants in Midwest

| Immigration Origin | # Population | % Population | View All 0 Rows |
Sex and Age in Midwest
Sex and Age in Midwest
The most populous age groups in Midwest are 50 to 54 Years (37 | 31.6%) for men and 60 to 64 Years (15 | 17.1%) for women.
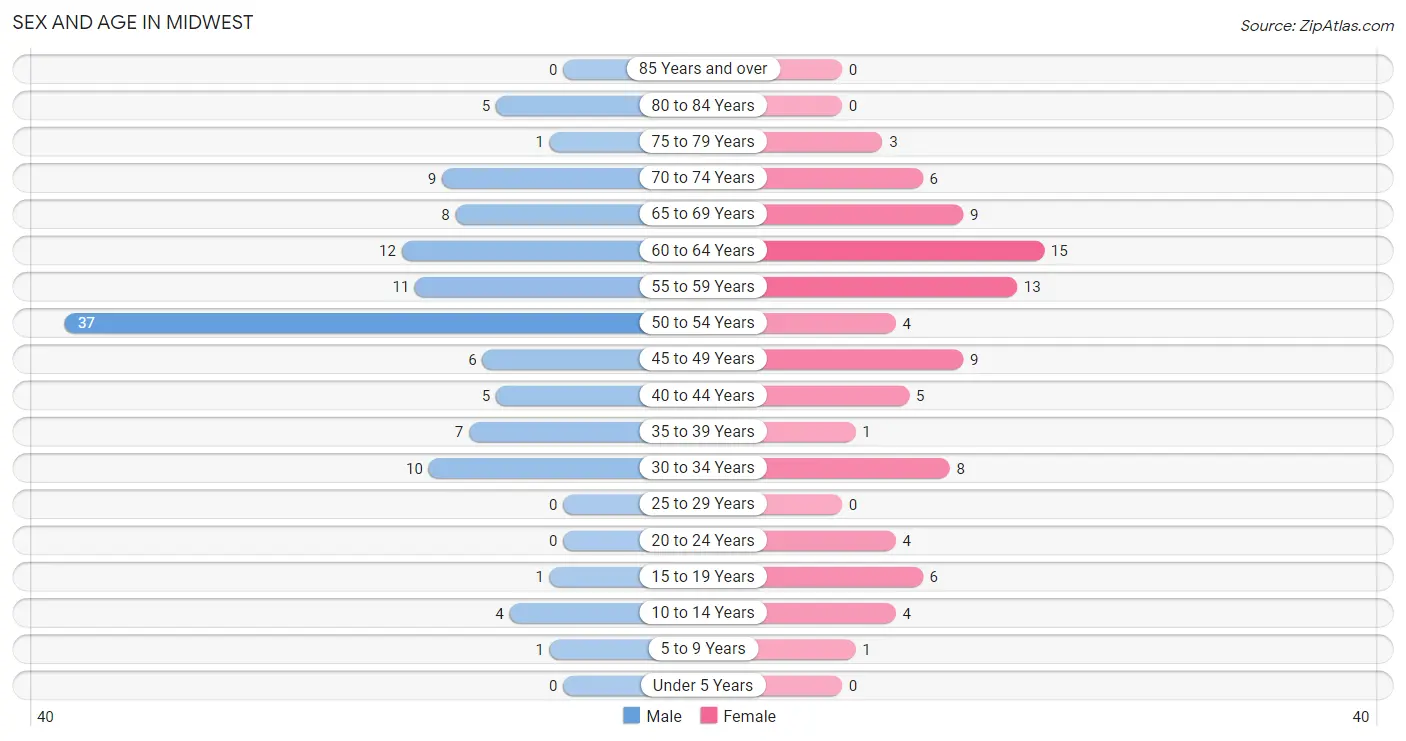
| Age Bracket | Male | Female |
| Under 5 Years | 0 (0.0%) | 0 (0.0%) |
| 5 to 9 Years | 1 (0.9%) | 1 (1.1%) |
| 10 to 14 Years | 4 (3.4%) | 4 (4.5%) |
| 15 to 19 Years | 1 (0.9%) | 6 (6.8%) |
| 20 to 24 Years | 0 (0.0%) | 4 (4.5%) |
| 25 to 29 Years | 0 (0.0%) | 0 (0.0%) |
| 30 to 34 Years | 10 (8.6%) | 8 (9.1%) |
| 35 to 39 Years | 7 (6.0%) | 1 (1.1%) |
| 40 to 44 Years | 5 (4.3%) | 5 (5.7%) |
| 45 to 49 Years | 6 (5.1%) | 9 (10.2%) |
| 50 to 54 Years | 37 (31.6%) | 4 (4.5%) |
| 55 to 59 Years | 11 (9.4%) | 13 (14.8%) |
| 60 to 64 Years | 12 (10.3%) | 15 (17.1%) |
| 65 to 69 Years | 8 (6.8%) | 9 (10.2%) |
| 70 to 74 Years | 9 (7.7%) | 6 (6.8%) |
| 75 to 79 Years | 1 (0.9%) | 3 (3.4%) |
| 80 to 84 Years | 5 (4.3%) | 0 (0.0%) |
| 85 Years and over | 0 (0.0%) | 0 (0.0%) |
| Total | 117 (100.0%) | 88 (100.0%) |
Families and Households in Midwest
Median Family Size in Midwest
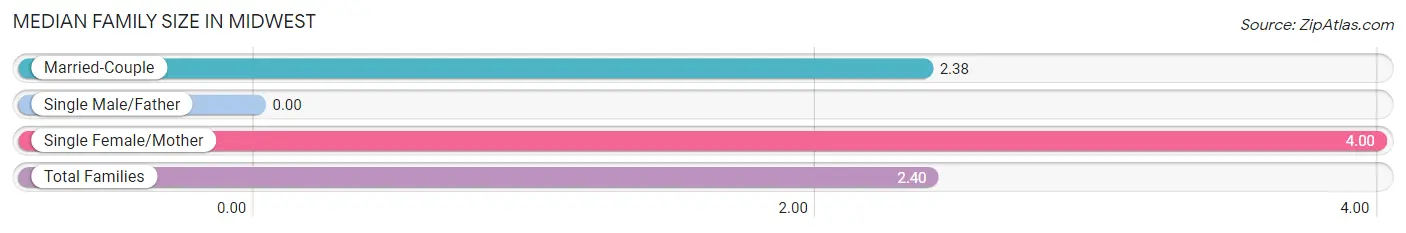
| Family Type | # Families | Family Size |
| Married-Couple | 56 (98.3%) | 2.38 |
| Single Male/Father | 0 (0.0%) | - |
| Single Female/Mother | 1 (1.8%) | 4.00 |
| Total Families | 57 (100.0%) | 2.40 |
Median Household Size in Midwest
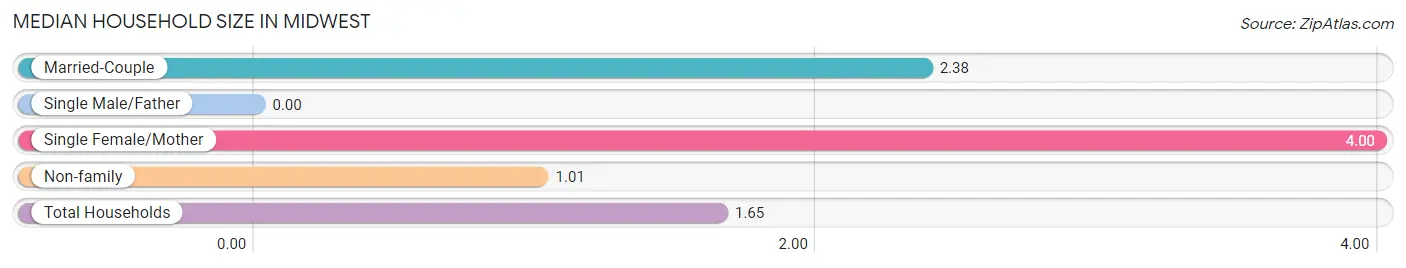
| Household Type | # Households | Household Size |
| Married-Couple | 56 (45.2%) | 2.38 |
| Single Male/Father | 0 (0.0%) | - |
| Single Female/Mother | 1 (0.8%) | 4.00 |
| Non-family | 67 (54.0%) | 1.01 |
| Total Households | 124 (100.0%) | 1.65 |
Household Size by Marriage Status in Midwest
Out of a total of 124 households in Midwest, 57 (46.0%) are family households, while 67 (54.0%) are nonfamily households. The most numerous type of family households are 2-person households, comprising 33, and the most common type of nonfamily households are 1-person households, comprising 66.
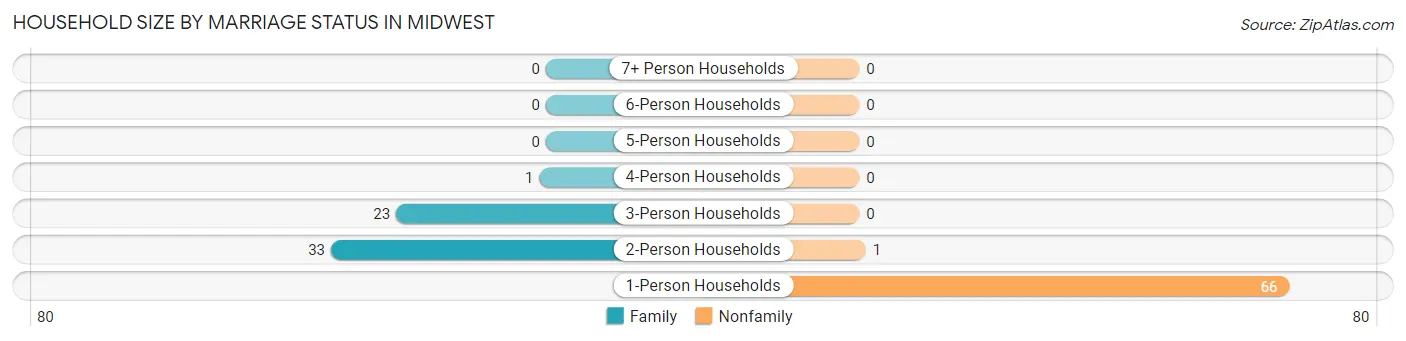
| Household Size | Family Households | Nonfamily Households |
| 1-Person Households | - | 66 (53.2%) |
| 2-Person Households | 33 (26.6%) | 1 (0.8%) |
| 3-Person Households | 23 (18.5%) | 0 (0.0%) |
| 4-Person Households | 1 (0.8%) | 0 (0.0%) |
| 5-Person Households | 0 (0.0%) | 0 (0.0%) |
| 6-Person Households | 0 (0.0%) | 0 (0.0%) |
| 7+ Person Households | 0 (0.0%) | 0 (0.0%) |
| Total | 57 (46.0%) | 67 (54.0%) |
Female Fertility in Midwest
Fertility by Age in Midwest
| Age Bracket | Women with Births | Births / 1,000 Women |
| 15 to 19 years | 0 (0.0%) | 0.0 |
| 20 to 34 years | 0 (0.0%) | 0.0 |
| 35 to 50 years | 0 (0.0%) | 0.0 |
| Total | 0 (0.0%) | 0.0 |
Fertility by Age by Marriage Status in Midwest
| Age Bracket | Married | Unmarried |
| 15 to 19 years | 0 (0.0%) | 0 (0.0%) |
| 20 to 34 years | 0 (0.0%) | 0 (0.0%) |
| 35 to 50 years | 0 (0.0%) | 0 (0.0%) |
| Total | 0 (0.0%) | 0 (0.0%) |
Fertility by Education in Midwest
| Educational Attainment | Women with Births | Births / 1,000 Women |
| Less than High School | 0 (0.0%) | 0.0 |
| High School Diploma | 0 (0.0%) | 0.0 |
| College or Associate's Degree | 0 (0.0%) | 0.0 |
| Bachelor's Degree | 0 (0.0%) | 0.0 |
| Graduate Degree | 0 (0.0%) | 0.0 |
| Total | 0 (0.0%) | 0.0 |
Fertility by Education by Marriage Status in Midwest
| Educational Attainment | Married | Unmarried |
| Less than High School | 0 (0.0%) | 0 (0.0%) |
| High School Diploma | 0 (0.0%) | 0 (0.0%) |
| College or Associate's Degree | 0 (0.0%) | 0 (0.0%) |
| Bachelor's Degree | 0 (0.0%) | 0 (0.0%) |
| Graduate Degree | 0 (0.0%) | 0 (0.0%) |
| Total | 0 (0.0%) | 0 (0.0%) |
Employment Characteristics in Midwest
Employment by Class of Employer in Midwest
Among the 109 employed individuals in Midwest, private company employees (43 | 39.5%), self-employed (incorporated) (28 | 25.7%), and local government employees (25 | 22.9%) make up the most common classes of employment.
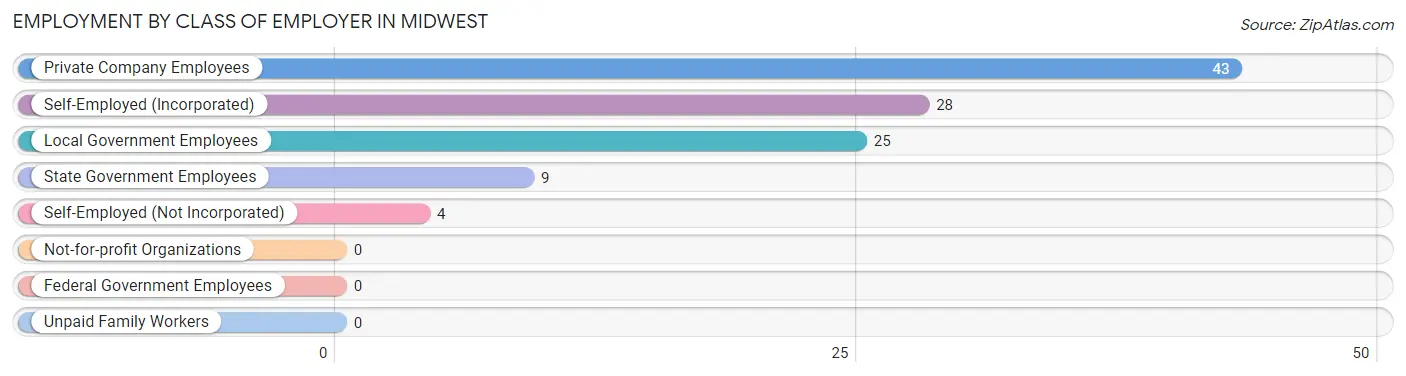
| Employer Class | # Employees | % Employees |
| Private Company Employees | 43 | 39.5% |
| Self-Employed (Incorporated) | 28 | 25.7% |
| Self-Employed (Not Incorporated) | 4 | 3.7% |
| Not-for-profit Organizations | 0 | 0.0% |
| Local Government Employees | 25 | 22.9% |
| State Government Employees | 9 | 8.3% |
| Federal Government Employees | 0 | 0.0% |
| Unpaid Family Workers | 0 | 0.0% |
| Total | 109 | 100.0% |
Employment Status by Age in Midwest
According to the labor force statistics for Midwest, out of the total population over 16 years of age (192), 61.5% or 118 individuals are in the labor force, with 1.7% or 2 of them unemployed. The age group with the highest labor force participation rate is 20 to 24 years, with 100.0% or 4 individuals in the labor force. Within the labor force, the 60 to 64 years age range has the highest percentage of unemployed individuals, with 10.5% or 2 of them being unemployed.
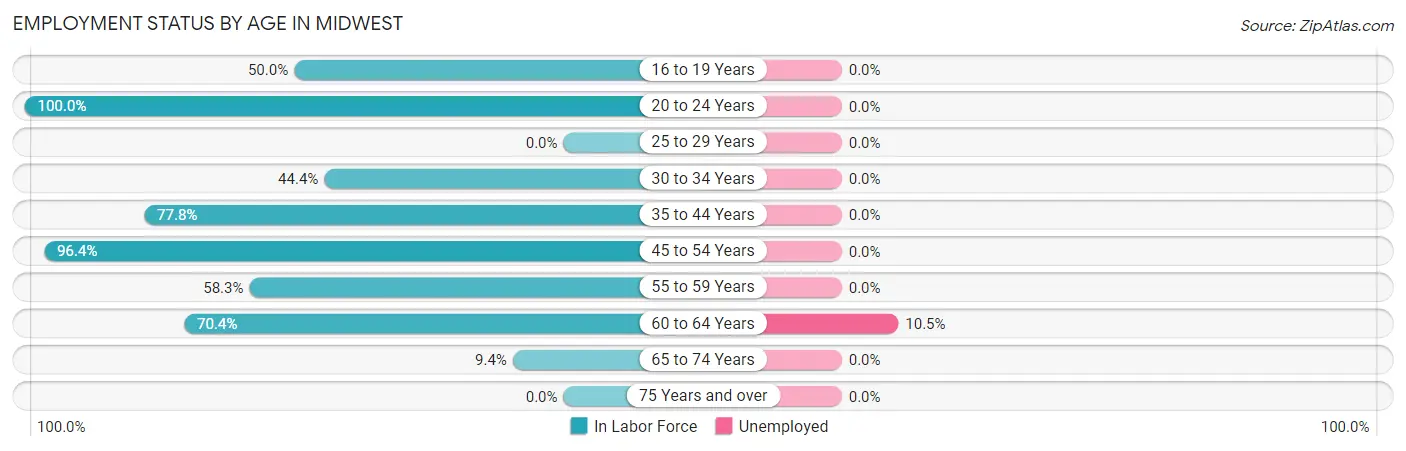
| Age Bracket | In Labor Force | Unemployed |
| 16 to 19 Years | 2 (50.0%) | 0 (0.0%) |
| 20 to 24 Years | 4 (100.0%) | 0 (0.0%) |
| 25 to 29 Years | 0 (0.0%) | 0 (0.0%) |
| 30 to 34 Years | 8 (44.4%) | 0 (0.0%) |
| 35 to 44 Years | 14 (77.8%) | 0 (0.0%) |
| 45 to 54 Years | 54 (96.4%) | 0 (0.0%) |
| 55 to 59 Years | 14 (58.3%) | 0 (0.0%) |
| 60 to 64 Years | 19 (70.4%) | 2 (10.5%) |
| 65 to 74 Years | 3 (9.4%) | 0 (0.0%) |
| 75 Years and over | 0 (0.0%) | 0 (0.0%) |
| Total | 118 (61.5%) | 2 (1.7%) |
Employment Status by Educational Attainment in Midwest
According to labor force statistics for Midwest, 76.2% of individuals (109) out of the total population between 25 and 64 years of age (143) are in the labor force, with 1.8% or 2 of them being unemployed. The group with the highest labor force participation rate are those with the educational attainment of college / associate degree, with 95.7% or 44 individuals in the labor force. Within the labor force, individuals with high school diploma education have the highest percentage of unemployment, with 4.1% or 2 of them being unemployed.
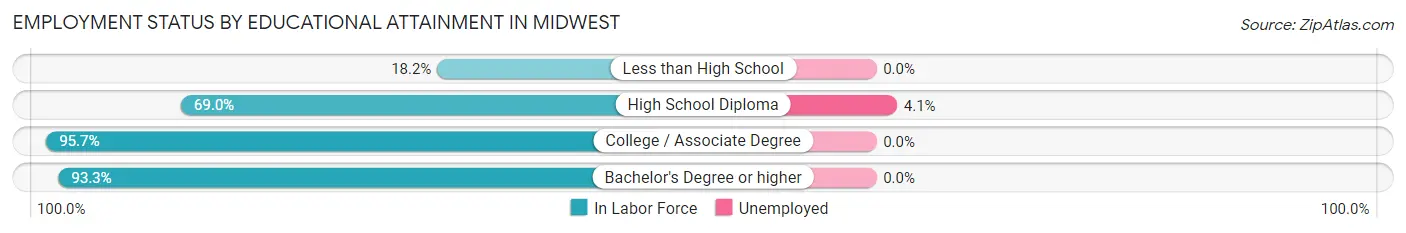
| Educational Attainment | In Labor Force | Unemployed |
| Less than High School | 2 (18.2%) | 0 (0.0%) |
| High School Diploma | 49 (69.0%) | 3 (4.1%) |
| College / Associate Degree | 44 (95.7%) | 0 (0.0%) |
| Bachelor's Degree or higher | 14 (93.3%) | 0 (0.0%) |
| Total | 109 (76.2%) | 3 (1.8%) |
Employment Occupations by Sex in Midwest
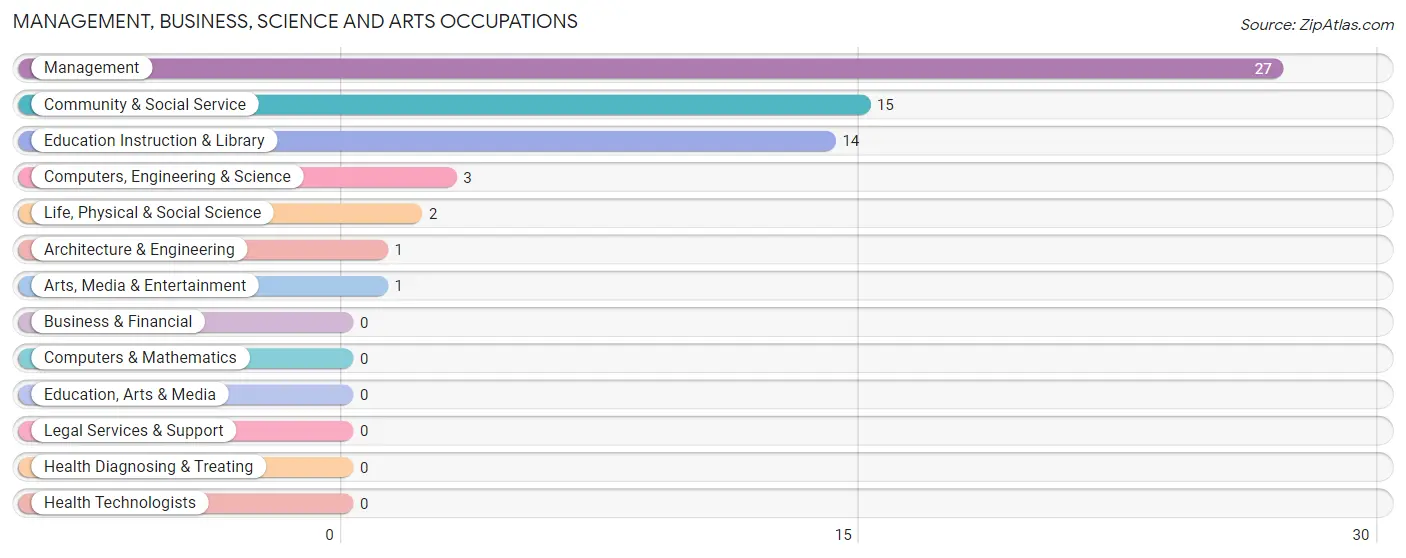
Management, Business, Science and Arts Occupations
The most common Management, Business, Science and Arts occupations in Midwest are Management (27 | 23.3%), Community & Social Service (15 | 12.9%), Education Instruction & Library (14 | 12.1%), Computers, Engineering & Science (3 | 2.6%), and Life, Physical & Social Science (2 | 1.7%).
Management, Business, Science and Arts Occupations by Sex
Within the Management, Business, Science and Arts occupations in Midwest, the most male-oriented occupations are Architecture & Engineering (100.0%), Management (96.3%), and Computers, Engineering & Science (33.3%), while the most female-oriented occupations are Life, Physical & Social Science (100.0%), Arts, Media & Entertainment (100.0%), and Community & Social Service (93.3%).
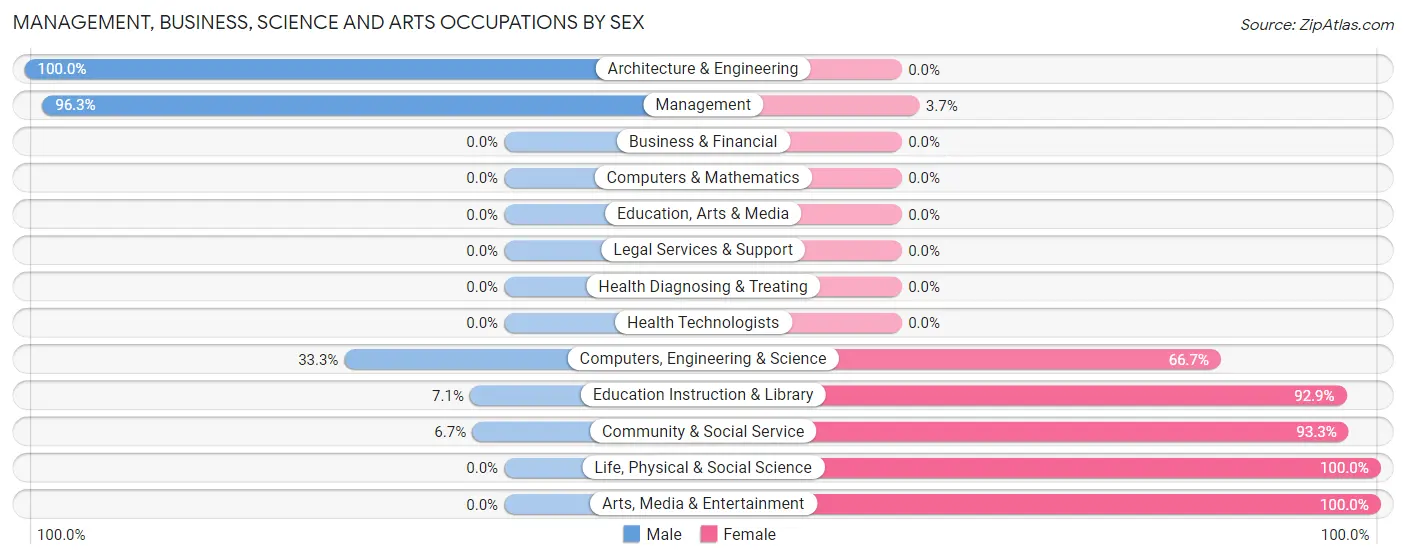
| Occupation | Male | Female |
| Management | 26 (96.3%) | 1 (3.7%) |
| Business & Financial | 0 (0.0%) | 0 (0.0%) |
| Computers, Engineering & Science | 1 (33.3%) | 2 (66.7%) |
| Computers & Mathematics | 0 (0.0%) | 0 (0.0%) |
| Architecture & Engineering | 1 (100.0%) | 0 (0.0%) |
| Life, Physical & Social Science | 0 (0.0%) | 2 (100.0%) |
| Community & Social Service | 1 (6.7%) | 14 (93.3%) |
| Education, Arts & Media | 0 (0.0%) | 0 (0.0%) |
| Legal Services & Support | 0 (0.0%) | 0 (0.0%) |
| Education Instruction & Library | 1 (7.1%) | 13 (92.9%) |
| Arts, Media & Entertainment | 0 (0.0%) | 1 (100.0%) |
| Health Diagnosing & Treating | 0 (0.0%) | 0 (0.0%) |
| Health Technologists | 0 (0.0%) | 0 (0.0%) |
| Total (Category) | 28 (62.2%) | 17 (37.8%) |
| Total (Overall) | 70 (60.3%) | 46 (39.7%) |
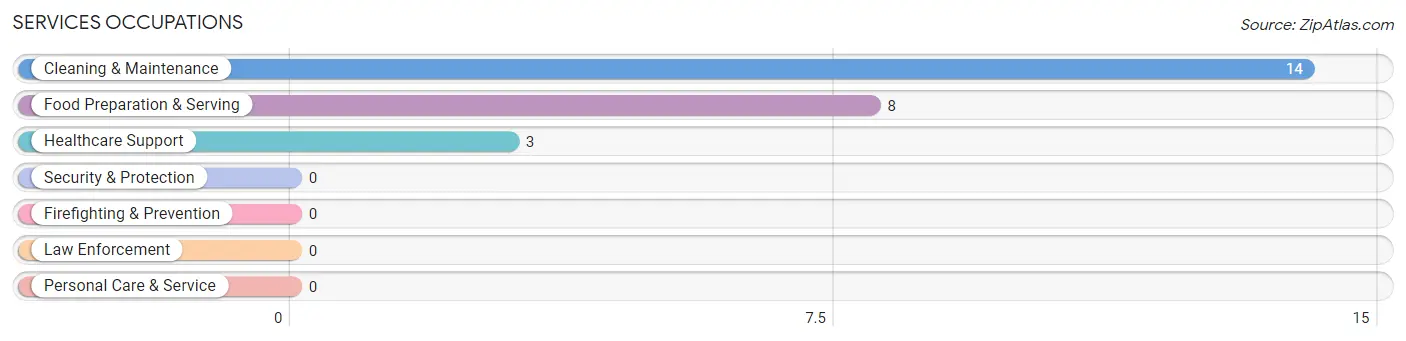
Services Occupations
The most common Services occupations in Midwest are Cleaning & Maintenance (14 | 12.1%), Food Preparation & Serving (8 | 6.9%), and Healthcare Support (3 | 2.6%).
Services Occupations by Sex
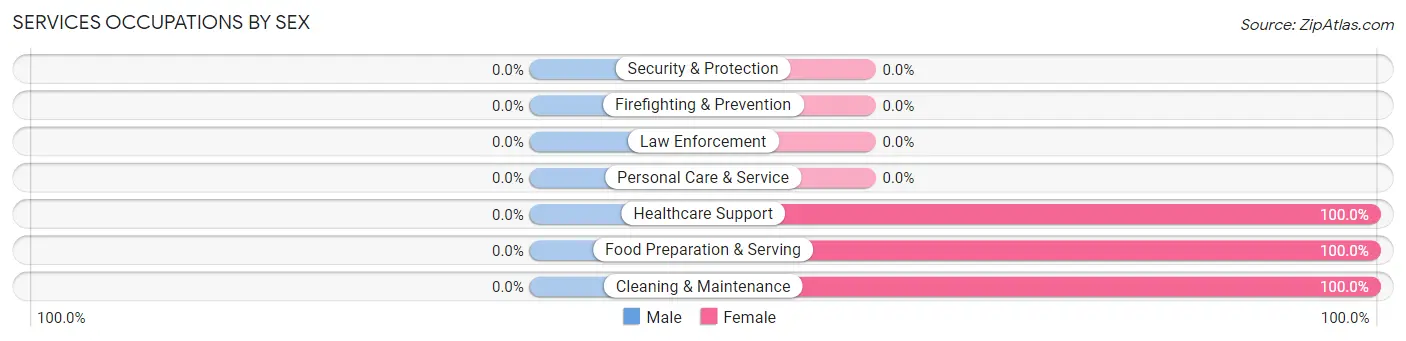
| Occupation | Male | Female |
| Healthcare Support | 0 (0.0%) | 3 (100.0%) |
| Security & Protection | 0 (0.0%) | 0 (0.0%) |
| Firefighting & Prevention | 0 (0.0%) | 0 (0.0%) |
| Law Enforcement | 0 (0.0%) | 0 (0.0%) |
| Food Preparation & Serving | 0 (0.0%) | 8 (100.0%) |
| Cleaning & Maintenance | 0 (0.0%) | 14 (100.0%) |
| Personal Care & Service | 0 (0.0%) | 0 (0.0%) |
| Total (Category) | 0 (0.0%) | 25 (100.0%) |
| Total (Overall) | 70 (60.3%) | 46 (39.7%) |
Sales and Office Occupations
The most common Sales and Office occupations in Midwest are Office & Administration (3 | 2.6%), and Sales & Related (1 | 0.9%).

Sales and Office Occupations by Sex

| Occupation | Male | Female |
| Sales & Related | 1 (100.0%) | 0 (0.0%) |
| Office & Administration | 0 (0.0%) | 3 (100.0%) |
| Total (Category) | 1 (25.0%) | 3 (75.0%) |
| Total (Overall) | 70 (60.3%) | 46 (39.7%) |
Natural Resources, Construction and Maintenance Occupations
The most common Natural Resources, Construction and Maintenance occupations in Midwest are Construction & Extraction (24 | 20.7%), and Installation, Maintenance & Repair (7 | 6.0%).
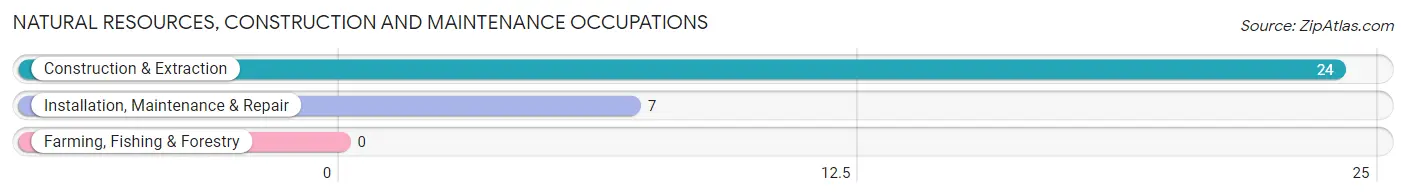
Natural Resources, Construction and Maintenance Occupations by Sex
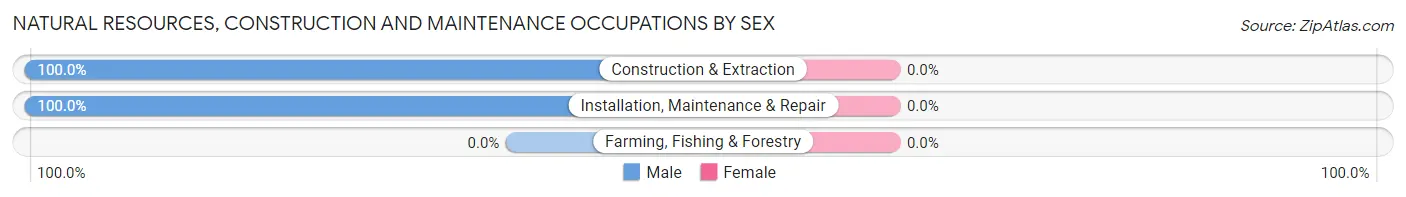
| Occupation | Male | Female |
| Farming, Fishing & Forestry | 0 (0.0%) | 0 (0.0%) |
| Construction & Extraction | 24 (100.0%) | 0 (0.0%) |
| Installation, Maintenance & Repair | 7 (100.0%) | 0 (0.0%) |
| Total (Category) | 31 (100.0%) | 0 (0.0%) |
| Total (Overall) | 70 (60.3%) | 46 (39.7%) |
Production, Transportation and Moving Occupations
The most common Production, Transportation and Moving occupations in Midwest are Transportation (8 | 6.9%), and Material Moving (3 | 2.6%).
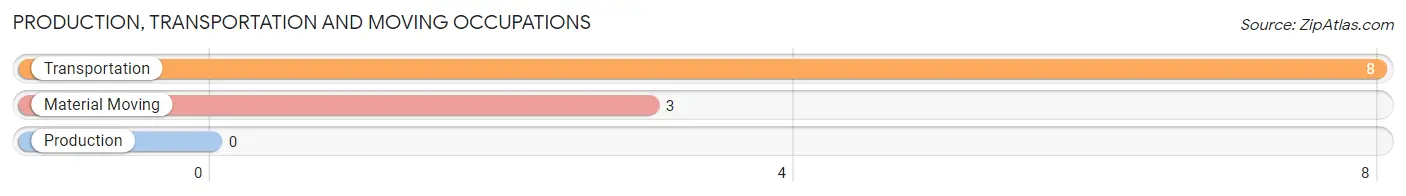
Production, Transportation and Moving Occupations by Sex
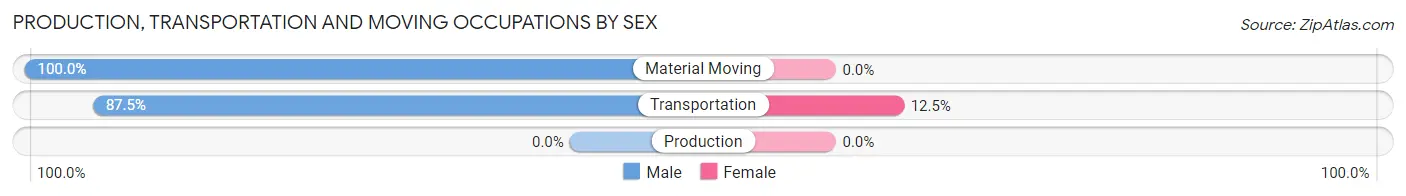
| Occupation | Male | Female |
| Production | 0 (0.0%) | 0 (0.0%) |
| Transportation | 7 (87.5%) | 1 (12.5%) |
| Material Moving | 3 (100.0%) | 0 (0.0%) |
| Total (Category) | 10 (90.9%) | 1 (9.1%) |
| Total (Overall) | 70 (60.3%) | 46 (39.7%) |
Employment Industries by Sex in Midwest
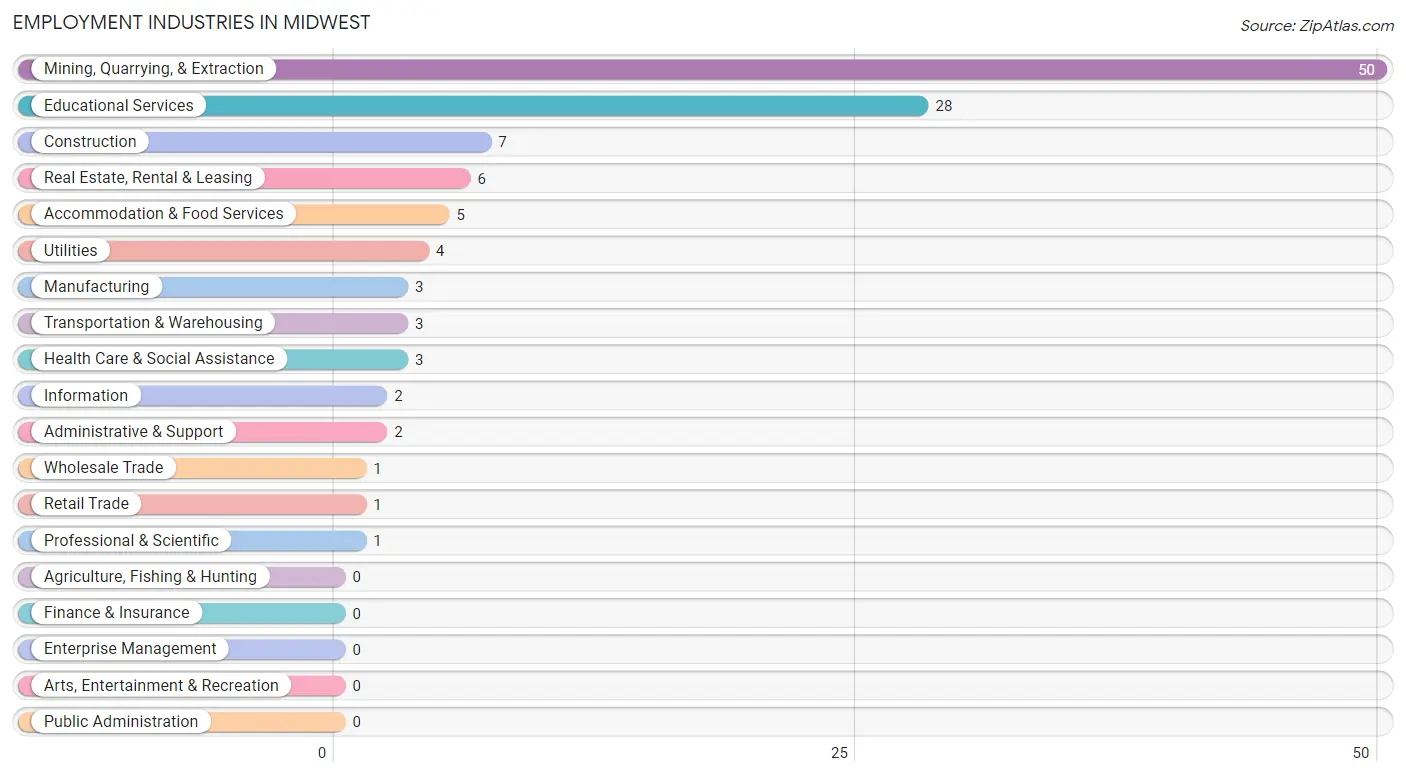
Employment Industries in Midwest
The major employment industries in Midwest include Mining, Quarrying, & Extraction (50 | 43.1%), Educational Services (28 | 24.1%), Construction (7 | 6.0%), Real Estate, Rental & Leasing (6 | 5.2%), and Accommodation & Food Services (5 | 4.3%).
Employment Industries by Sex in Midwest
The Midwest industries that see more men than women are Construction (100.0%), Manufacturing (100.0%), and Wholesale Trade (100.0%), whereas the industries that tend to have a higher number of women are Utilities (100.0%), Information (100.0%), and Professional & Scientific (100.0%).
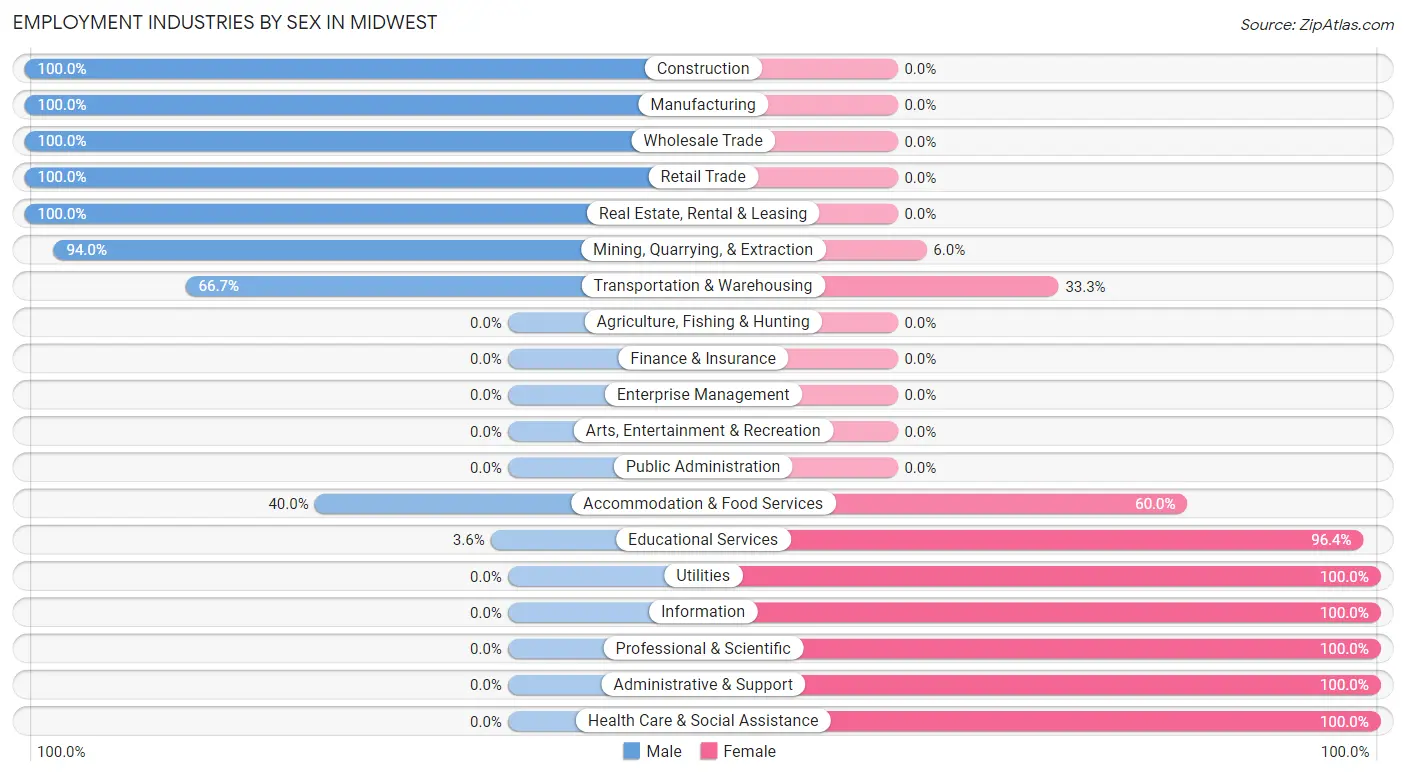
| Industry | Male | Female |
| Agriculture, Fishing & Hunting | 0 (0.0%) | 0 (0.0%) |
| Mining, Quarrying, & Extraction | 47 (94.0%) | 3 (6.0%) |
| Construction | 7 (100.0%) | 0 (0.0%) |
| Manufacturing | 3 (100.0%) | 0 (0.0%) |
| Wholesale Trade | 1 (100.0%) | 0 (0.0%) |
| Retail Trade | 1 (100.0%) | 0 (0.0%) |
| Transportation & Warehousing | 2 (66.7%) | 1 (33.3%) |
| Utilities | 0 (0.0%) | 4 (100.0%) |
| Information | 0 (0.0%) | 2 (100.0%) |
| Finance & Insurance | 0 (0.0%) | 0 (0.0%) |
| Real Estate, Rental & Leasing | 6 (100.0%) | 0 (0.0%) |
| Professional & Scientific | 0 (0.0%) | 1 (100.0%) |
| Enterprise Management | 0 (0.0%) | 0 (0.0%) |
| Administrative & Support | 0 (0.0%) | 2 (100.0%) |
| Educational Services | 1 (3.6%) | 27 (96.4%) |
| Health Care & Social Assistance | 0 (0.0%) | 3 (100.0%) |
| Arts, Entertainment & Recreation | 0 (0.0%) | 0 (0.0%) |
| Accommodation & Food Services | 2 (40.0%) | 3 (60.0%) |
| Public Administration | 0 (0.0%) | 0 (0.0%) |
| Total | 70 (60.3%) | 46 (39.7%) |
Education in Midwest
School Enrollment in Midwest
The most common levels of schooling among the 25 students in Midwest are high school (11 | 44.0%), college / undergraduate (8 | 32.0%), and middle school (4 | 16.0%).
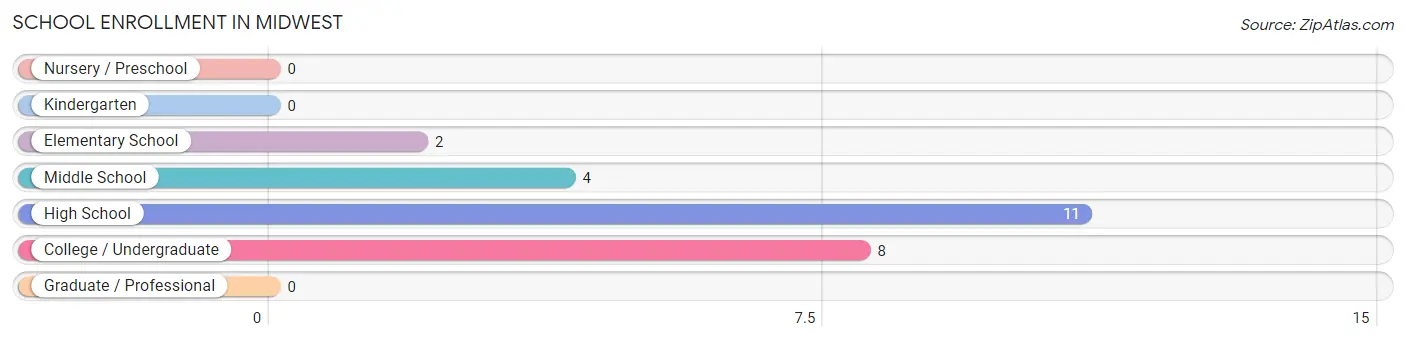
| School Level | # Students | % Students |
| Nursery / Preschool | 0 | 0.0% |
| Kindergarten | 0 | 0.0% |
| Elementary School | 2 | 8.0% |
| Middle School | 4 | 16.0% |
| High School | 11 | 44.0% |
| College / Undergraduate | 8 | 32.0% |
| Graduate / Professional | 0 | 0.0% |
| Total | 25 | 100.0% |
School Enrollment by Age by Funding Source in Midwest
Out of a total of 25 students who are enrolled in schools in Midwest, 2 (8.0%) attend a private institution, while the remaining 23 (92.0%) are enrolled in public schools. The age group of 5 to 9 year old has the highest likelihood of being enrolled in private schools, with 1 (50.0% in the age bracket) enrolled. Conversely, the age group of 10 to 14 year olds has the lowest likelihood of being enrolled in a private school, with 8 (100.0% in the age bracket) attending a public institution.
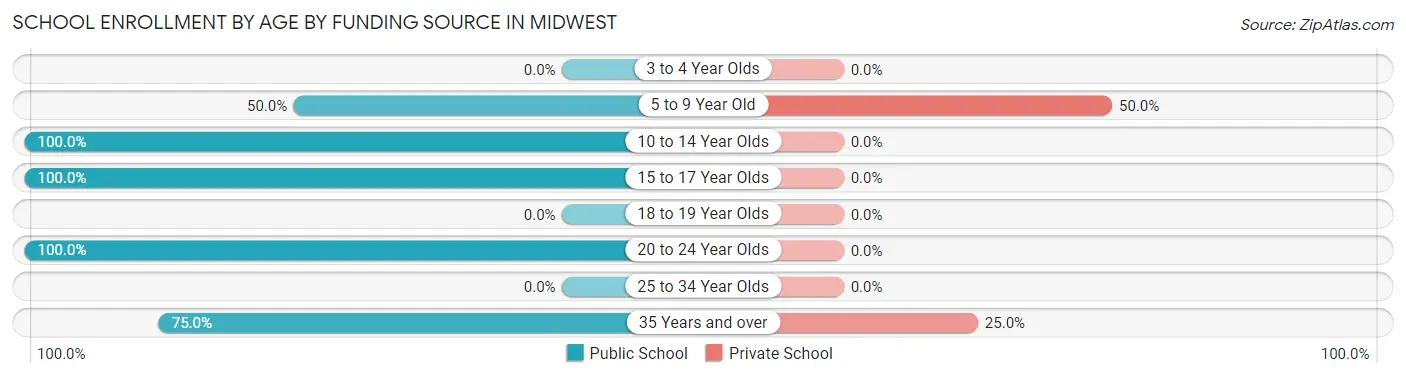
| Age Bracket | Public School | Private School |
| 3 to 4 Year Olds | 0 (0.0%) | 0 (0.0%) |
| 5 to 9 Year Old | 1 (50.0%) | 1 (50.0%) |
| 10 to 14 Year Olds | 8 (100.0%) | 0 (0.0%) |
| 15 to 17 Year Olds | 7 (100.0%) | 0 (0.0%) |
| 18 to 19 Year Olds | 0 (0.0%) | 0 (0.0%) |
| 20 to 24 Year Olds | 4 (100.0%) | 0 (0.0%) |
| 25 to 34 Year Olds | 0 (0.0%) | 0 (0.0%) |
| 35 Years and over | 3 (75.0%) | 1 (25.0%) |
| Total | 23 (92.0%) | 2 (8.0%) |
Educational Attainment by Field of Study in Midwest
Education (10 | 66.7%), science & technology (3 | 20.0%), computers & mathematics (1 | 6.7%), and visual & performing arts (1 | 6.7%) are the most common fields of study among 15 individuals in Midwest who have obtained a bachelor's degree or higher.
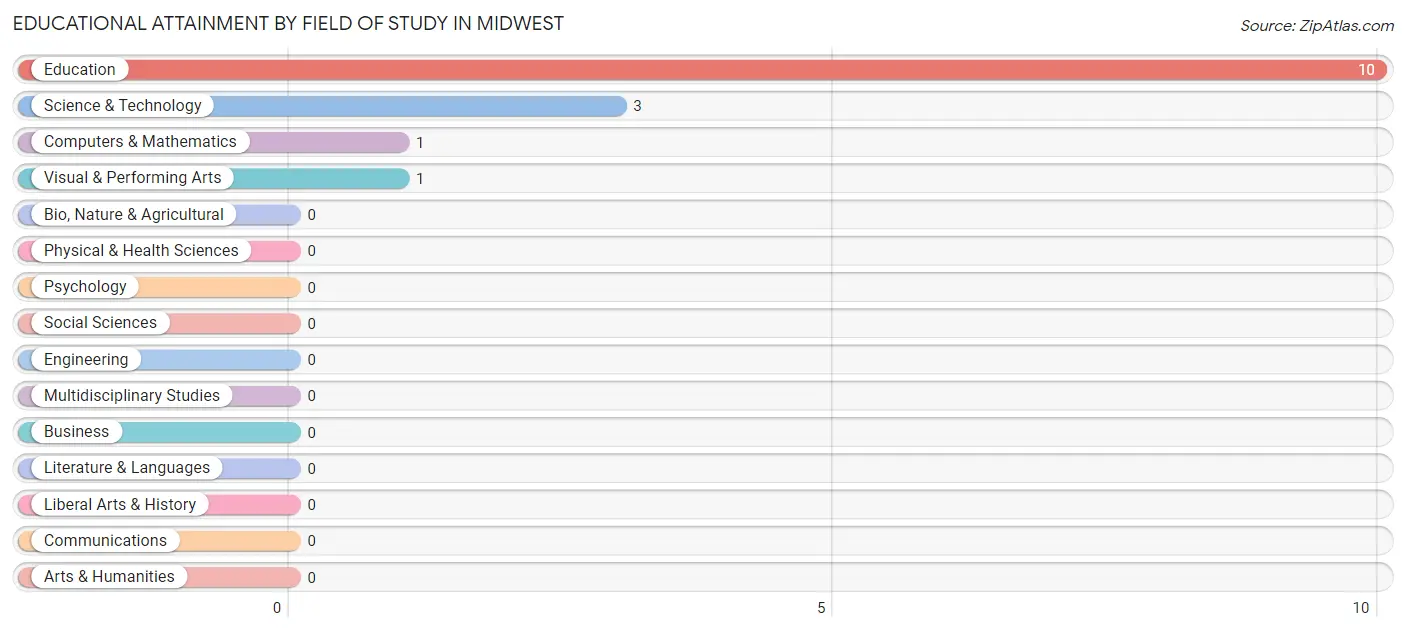
| Field of Study | # Graduates | % Graduates |
| Computers & Mathematics | 1 | 6.7% |
| Bio, Nature & Agricultural | 0 | 0.0% |
| Physical & Health Sciences | 0 | 0.0% |
| Psychology | 0 | 0.0% |
| Social Sciences | 0 | 0.0% |
| Engineering | 0 | 0.0% |
| Multidisciplinary Studies | 0 | 0.0% |
| Science & Technology | 3 | 20.0% |
| Business | 0 | 0.0% |
| Education | 10 | 66.7% |
| Literature & Languages | 0 | 0.0% |
| Liberal Arts & History | 0 | 0.0% |
| Visual & Performing Arts | 1 | 6.7% |
| Communications | 0 | 0.0% |
| Arts & Humanities | 0 | 0.0% |
| Total | 15 | 100.0% |
Transportation & Commute in Midwest
Vehicle Availability by Sex in Midwest
The most prevalent vehicle ownership categories in Midwest are males with 3 vehicles (26, accounting for 40.6%) and females with 3 vehicles (2, making up 57.8%).
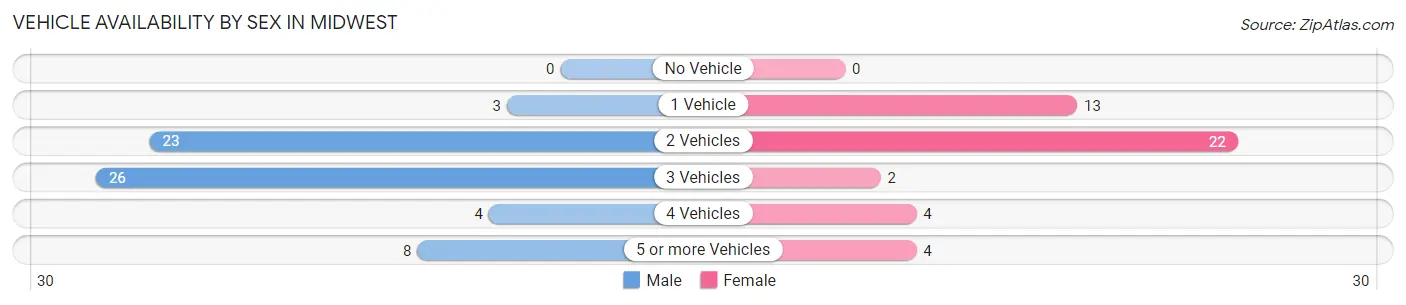
| Vehicles Available | Male | Female |
| No Vehicle | 0 (0.0%) | 0 (0.0%) |
| 1 Vehicle | 3 (4.7%) | 13 (28.9%) |
| 2 Vehicles | 23 (35.9%) | 22 (48.9%) |
| 3 Vehicles | 26 (40.6%) | 2 (4.4%) |
| 4 Vehicles | 4 (6.2%) | 4 (8.9%) |
| 5 or more Vehicles | 8 (12.5%) | 4 (8.9%) |
| Total | 64 (100.0%) | 45 (100.0%) |
Commute Time in Midwest
The most frequently occuring commute durations in Midwest are 5 to 9 minutes (45 commuters, 44.1%), less than 5 minutes (16 commuters, 15.7%), and 10 to 14 minutes (15 commuters, 14.7%).
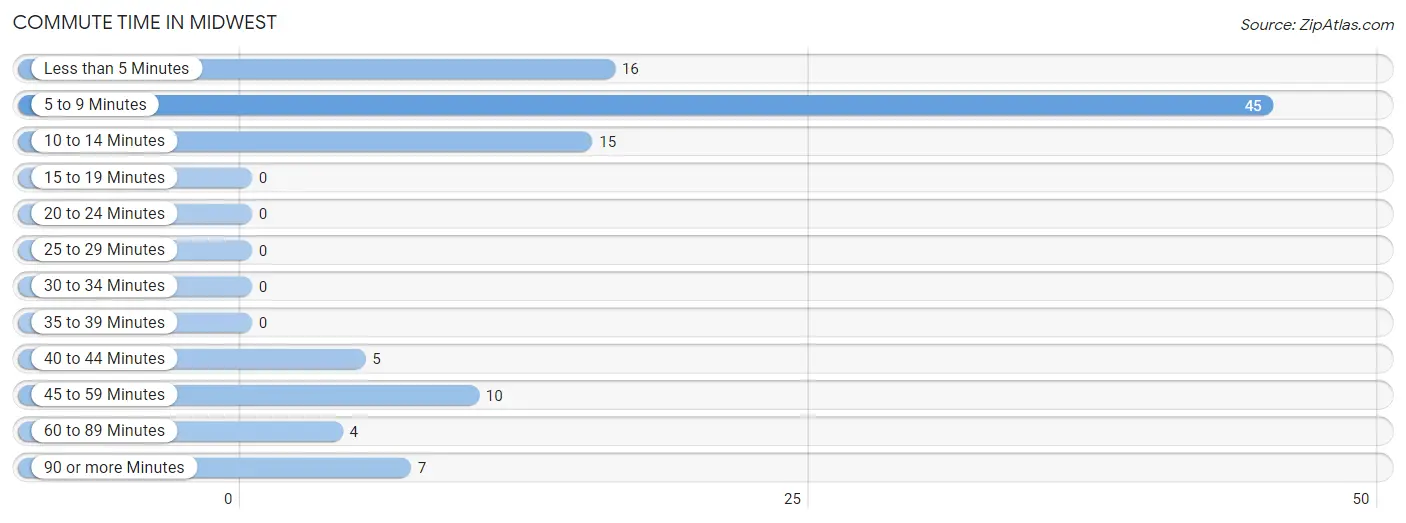
| Commute Time | # Commuters | % Commuters |
| Less than 5 Minutes | 16 | 15.7% |
| 5 to 9 Minutes | 45 | 44.1% |
| 10 to 14 Minutes | 15 | 14.7% |
| 15 to 19 Minutes | 0 | 0.0% |
| 20 to 24 Minutes | 0 | 0.0% |
| 25 to 29 Minutes | 0 | 0.0% |
| 30 to 34 Minutes | 0 | 0.0% |
| 35 to 39 Minutes | 0 | 0.0% |
| 40 to 44 Minutes | 5 | 4.9% |
| 45 to 59 Minutes | 10 | 9.8% |
| 60 to 89 Minutes | 4 | 3.9% |
| 90 or more Minutes | 7 | 6.9% |
Commute Time by Sex in Midwest
The most common commute times in Midwest are 5 to 9 minutes (33 commuters, 54.1%) for males and 10 to 14 minutes (13 commuters, 31.7%) for females.
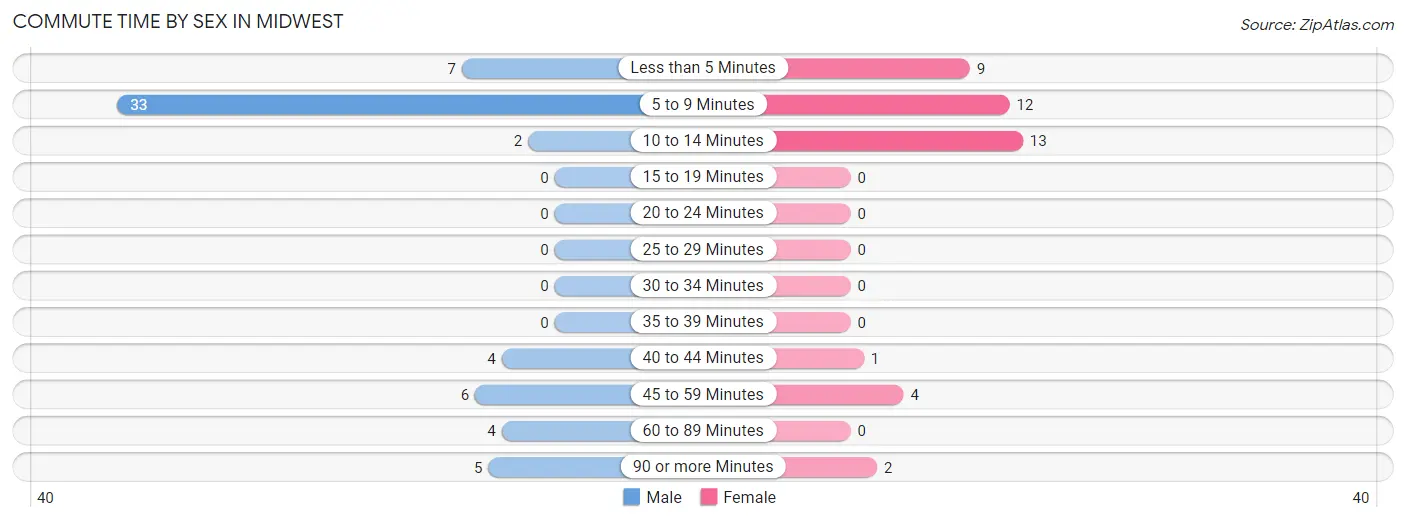
| Commute Time | Male | Female |
| Less than 5 Minutes | 7 (11.5%) | 9 (22.0%) |
| 5 to 9 Minutes | 33 (54.1%) | 12 (29.3%) |
| 10 to 14 Minutes | 2 (3.3%) | 13 (31.7%) |
| 15 to 19 Minutes | 0 (0.0%) | 0 (0.0%) |
| 20 to 24 Minutes | 0 (0.0%) | 0 (0.0%) |
| 25 to 29 Minutes | 0 (0.0%) | 0 (0.0%) |
| 30 to 34 Minutes | 0 (0.0%) | 0 (0.0%) |
| 35 to 39 Minutes | 0 (0.0%) | 0 (0.0%) |
| 40 to 44 Minutes | 4 (6.6%) | 1 (2.4%) |
| 45 to 59 Minutes | 6 (9.8%) | 4 (9.8%) |
| 60 to 89 Minutes | 4 (6.6%) | 0 (0.0%) |
| 90 or more Minutes | 5 (8.2%) | 2 (4.9%) |
Time of Departure to Work by Sex in Midwest
The most frequent times of departure to work in Midwest are 6:30 AM to 6:59 AM (29, 47.5%) for males and 7:00 AM to 7:29 AM (15, 36.6%) for females.
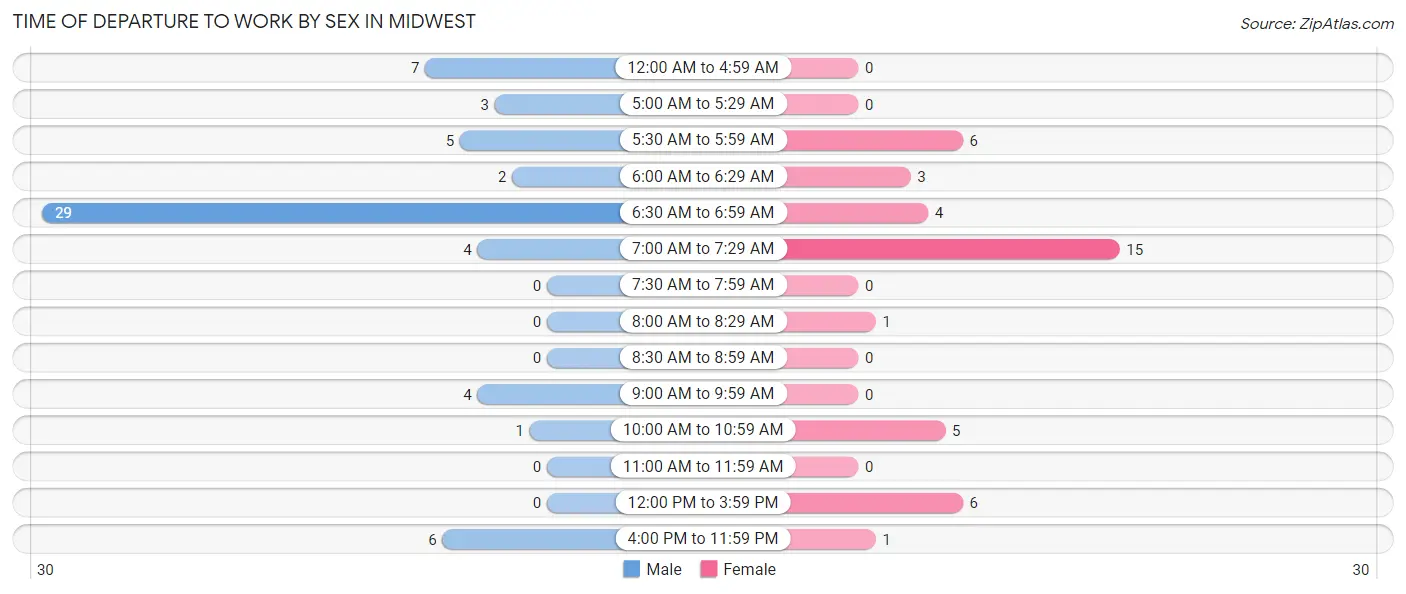
| Time of Departure | Male | Female |
| 12:00 AM to 4:59 AM | 7 (11.5%) | 0 (0.0%) |
| 5:00 AM to 5:29 AM | 3 (4.9%) | 0 (0.0%) |
| 5:30 AM to 5:59 AM | 5 (8.2%) | 6 (14.6%) |
| 6:00 AM to 6:29 AM | 2 (3.3%) | 3 (7.3%) |
| 6:30 AM to 6:59 AM | 29 (47.5%) | 4 (9.8%) |
| 7:00 AM to 7:29 AM | 4 (6.6%) | 15 (36.6%) |
| 7:30 AM to 7:59 AM | 0 (0.0%) | 0 (0.0%) |
| 8:00 AM to 8:29 AM | 0 (0.0%) | 1 (2.4%) |
| 8:30 AM to 8:59 AM | 0 (0.0%) | 0 (0.0%) |
| 9:00 AM to 9:59 AM | 4 (6.6%) | 0 (0.0%) |
| 10:00 AM to 10:59 AM | 1 (1.6%) | 5 (12.2%) |
| 11:00 AM to 11:59 AM | 0 (0.0%) | 0 (0.0%) |
| 12:00 PM to 3:59 PM | 0 (0.0%) | 6 (14.6%) |
| 4:00 PM to 11:59 PM | 6 (9.8%) | 1 (2.4%) |
| Total | 61 (100.0%) | 41 (100.0%) |
Housing Occupancy in Midwest
Occupancy by Ownership in Midwest
Of the total 124 dwellings in Midwest, owner-occupied units account for 114 (91.9%), while renter-occupied units make up 10 (8.1%).
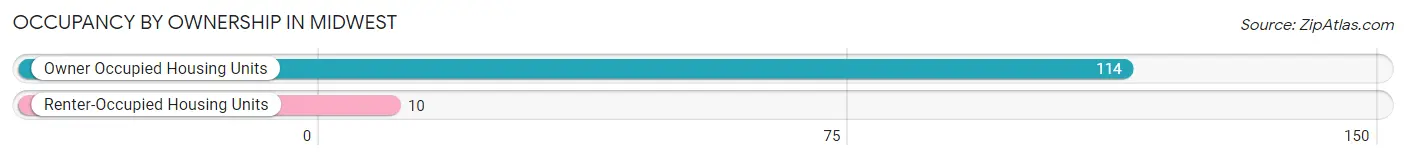
| Occupancy | # Housing Units | % Housing Units |
| Owner Occupied Housing Units | 114 | 91.9% |
| Renter-Occupied Housing Units | 10 | 8.1% |
| Total Occupied Housing Units | 124 | 100.0% |
Occupancy by Household Size in Midwest
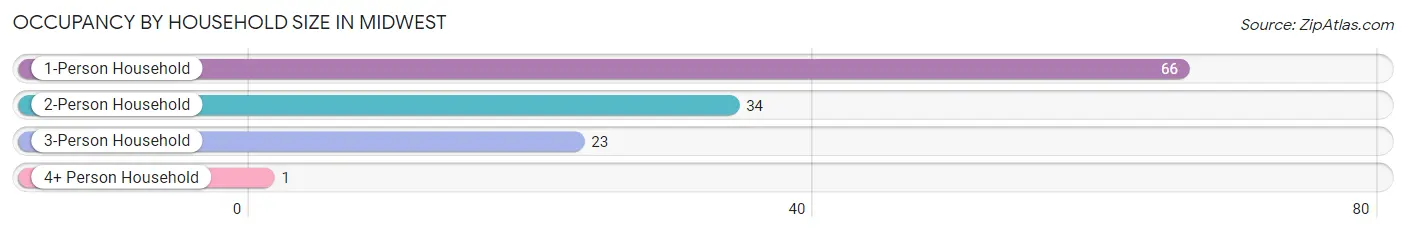
| Household Size | # Housing Units | % Housing Units |
| 1-Person Household | 66 | 53.2% |
| 2-Person Household | 34 | 27.4% |
| 3-Person Household | 23 | 18.5% |
| 4+ Person Household | 1 | 0.8% |
| Total Housing Units | 124 | 100.0% |
Occupancy by Ownership by Household Size in Midwest
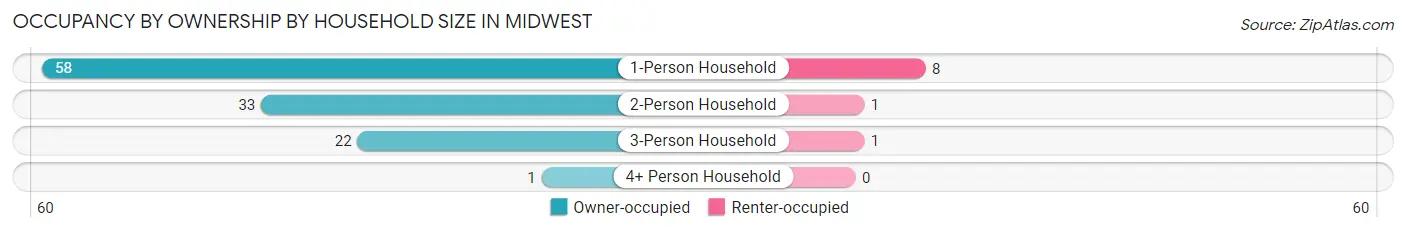
| Household Size | Owner-occupied | Renter-occupied |
| 1-Person Household | 58 (87.9%) | 8 (12.1%) |
| 2-Person Household | 33 (97.1%) | 1 (2.9%) |
| 3-Person Household | 22 (95.7%) | 1 (4.3%) |
| 4+ Person Household | 1 (100.0%) | 0 (0.0%) |
| Total Housing Units | 114 (91.9%) | 10 (8.1%) |
Occupancy by Educational Attainment in Midwest
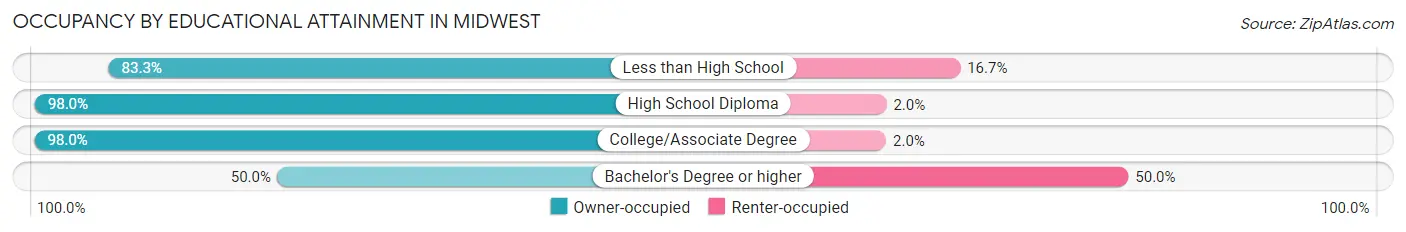
| Household Size | Owner-occupied | Renter-occupied |
| Less than High School | 10 (83.3%) | 2 (16.7%) |
| High School Diploma | 48 (98.0%) | 1 (2.0%) |
| College/Associate Degree | 50 (98.0%) | 1 (2.0%) |
| Bachelor's Degree or higher | 6 (50.0%) | 6 (50.0%) |
Occupancy by Age of Householder in Midwest
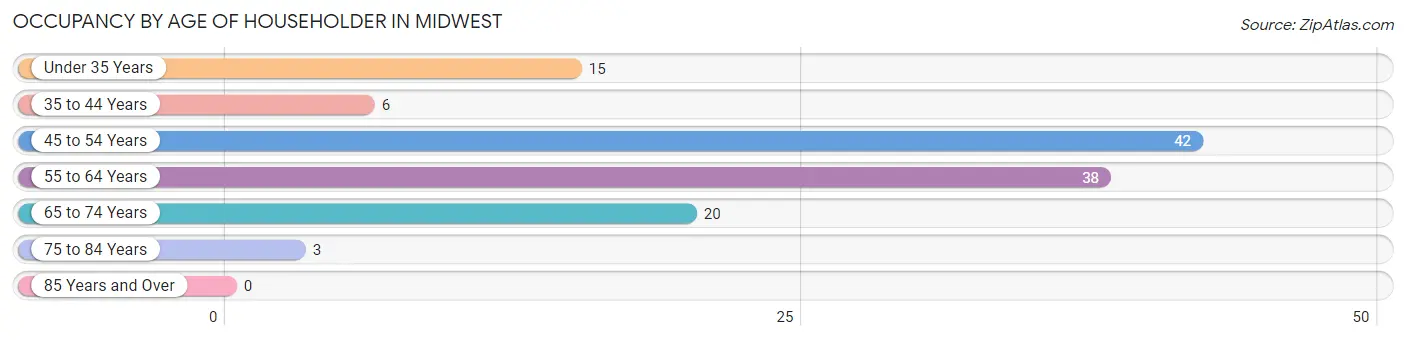
| Age Bracket | # Households | % Households |
| Under 35 Years | 15 | 12.1% |
| 35 to 44 Years | 6 | 4.8% |
| 45 to 54 Years | 42 | 33.9% |
| 55 to 64 Years | 38 | 30.6% |
| 65 to 74 Years | 20 | 16.1% |
| 75 to 84 Years | 3 | 2.4% |
| 85 Years and Over | 0 | 0.0% |
| Total | 124 | 100.0% |
Housing Finances in Midwest
Median Income by Occupancy in Midwest
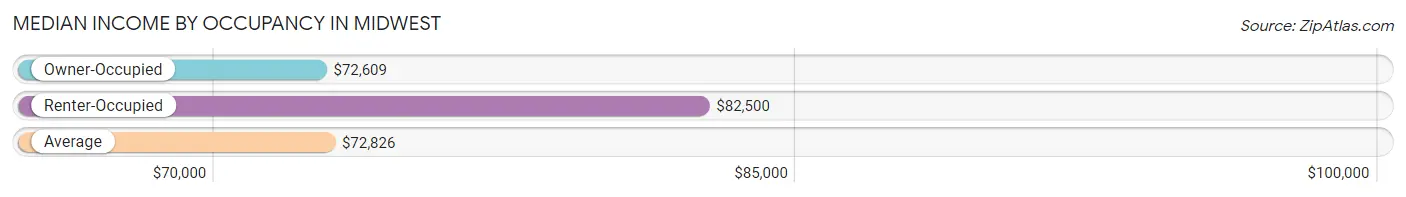
| Occupancy Type | # Households | Median Income |
| Owner-Occupied | 114 (91.9%) | $72,609 |
| Renter-Occupied | 10 (8.1%) | $82,500 |
| Average | 124 (100.0%) | $72,826 |
Occupancy by Householder Income Bracket in Midwest
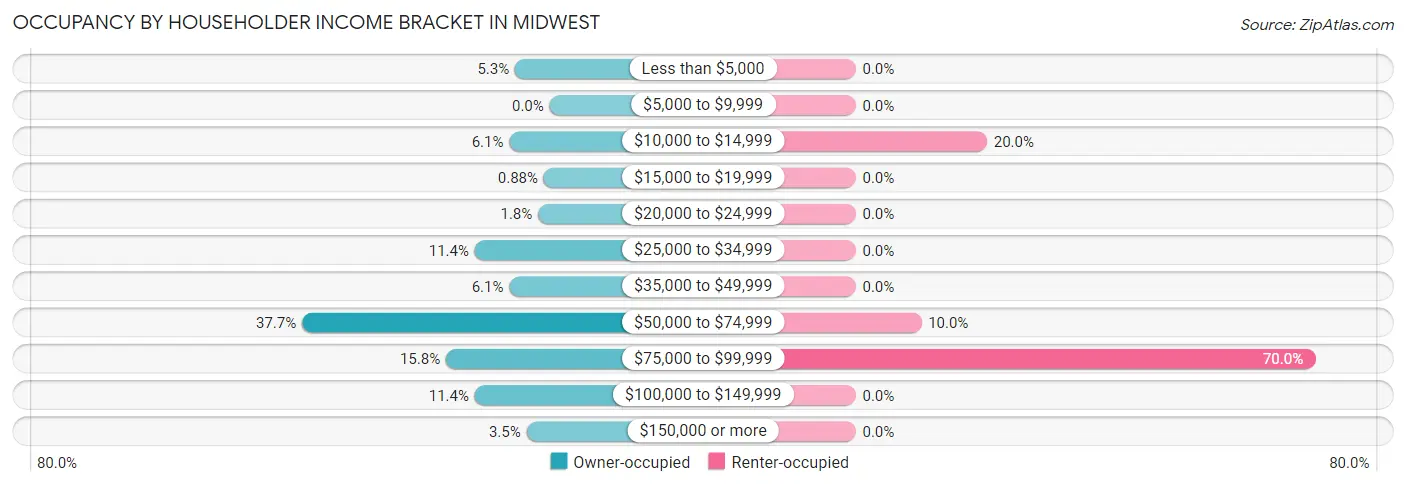
| Income Bracket | Owner-occupied | Renter-occupied |
| Less than $5,000 | 6 (5.3%) | 0 (0.0%) |
| $5,000 to $9,999 | 0 (0.0%) | 0 (0.0%) |
| $10,000 to $14,999 | 7 (6.1%) | 2 (20.0%) |
| $15,000 to $19,999 | 1 (0.9%) | 0 (0.0%) |
| $20,000 to $24,999 | 2 (1.8%) | 0 (0.0%) |
| $25,000 to $34,999 | 13 (11.4%) | 0 (0.0%) |
| $35,000 to $49,999 | 7 (6.1%) | 0 (0.0%) |
| $50,000 to $74,999 | 43 (37.7%) | 1 (10.0%) |
| $75,000 to $99,999 | 18 (15.8%) | 7 (70.0%) |
| $100,000 to $149,999 | 13 (11.4%) | 0 (0.0%) |
| $150,000 or more | 4 (3.5%) | 0 (0.0%) |
| Total | 114 (100.0%) | 10 (100.0%) |
Monthly Housing Cost Tiers in Midwest
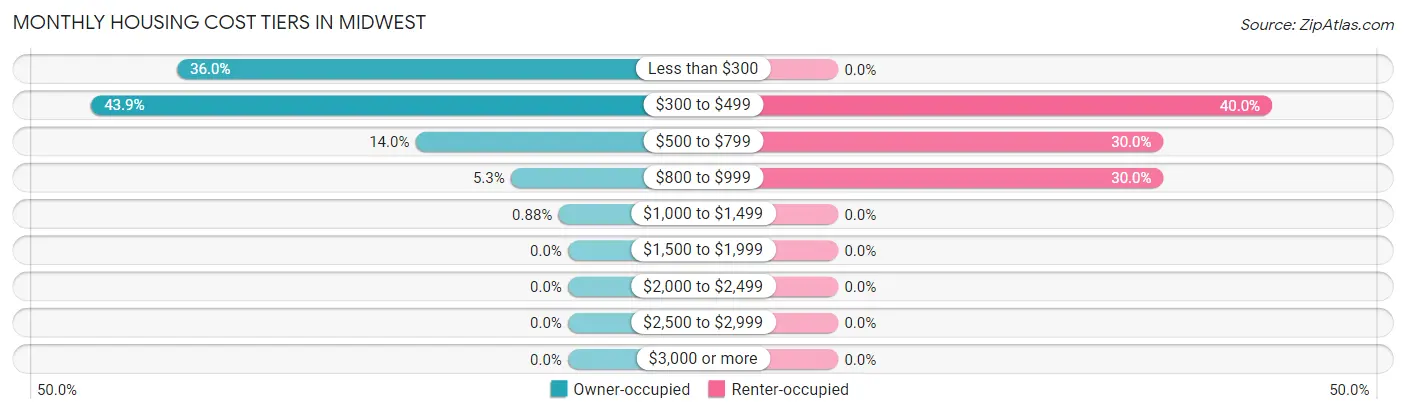
| Monthly Cost | Owner-occupied | Renter-occupied |
| Less than $300 | 41 (36.0%) | 0 (0.0%) |
| $300 to $499 | 50 (43.9%) | 4 (40.0%) |
| $500 to $799 | 16 (14.0%) | 3 (30.0%) |
| $800 to $999 | 6 (5.3%) | 3 (30.0%) |
| $1,000 to $1,499 | 1 (0.9%) | 0 (0.0%) |
| $1,500 to $1,999 | 0 (0.0%) | 0 (0.0%) |
| $2,000 to $2,499 | 0 (0.0%) | 0 (0.0%) |
| $2,500 to $2,999 | 0 (0.0%) | 0 (0.0%) |
| $3,000 or more | 0 (0.0%) | 0 (0.0%) |
| Total | 114 (100.0%) | 10 (100.0%) |
Physical Housing Characteristics in Midwest
Housing Structures in Midwest
| Structure Type | # Housing Units | % Housing Units |
| Single Unit, Detached | 121 | 97.6% |
| Single Unit, Attached | 1 | 0.8% |
| 2 Unit Apartments | 0 | 0.0% |
| 3 or 4 Unit Apartments | 0 | 0.0% |
| 5 to 9 Unit Apartments | 0 | 0.0% |
| 10 or more Apartments | 0 | 0.0% |
| Mobile Home / Other | 2 | 1.6% |
| Total | 124 | 100.0% |
Housing Structures by Occupancy in Midwest
| Structure Type | Owner-occupied | Renter-occupied |
| Single Unit, Detached | 111 (91.7%) | 10 (8.3%) |
| Single Unit, Attached | 1 (100.0%) | 0 (0.0%) |
| 2 Unit Apartments | 0 (0.0%) | 0 (0.0%) |
| 3 or 4 Unit Apartments | 0 (0.0%) | 0 (0.0%) |
| 5 to 9 Unit Apartments | 0 (0.0%) | 0 (0.0%) |
| 10 or more Apartments | 0 (0.0%) | 0 (0.0%) |
| Mobile Home / Other | 2 (100.0%) | 0 (0.0%) |
| Total | 114 (91.9%) | 10 (8.1%) |
Housing Structures by Number of Rooms in Midwest
| Number of Rooms | Owner-occupied | Renter-occupied |
| 1 Room | 0 (0.0%) | 0 (0.0%) |
| 2 or 3 Rooms | 10 (8.8%) | 0 (0.0%) |
| 4 or 5 Rooms | 69 (60.5%) | 2 (20.0%) |
| 6 or 7 Rooms | 24 (21.0%) | 7 (70.0%) |
| 8 or more Rooms | 11 (9.7%) | 1 (10.0%) |
| Total | 114 (100.0%) | 10 (100.0%) |
Housing Structure by Heating Type in Midwest
| Heating Type | Owner-occupied | Renter-occupied |
| Utility Gas | 59 (51.7%) | 10 (100.0%) |
| Bottled, Tank, or LP Gas | 4 (3.5%) | 0 (0.0%) |
| Electricity | 18 (15.8%) | 0 (0.0%) |
| Fuel Oil or Kerosene | 23 (20.2%) | 0 (0.0%) |
| Coal or Coke | 0 (0.0%) | 0 (0.0%) |
| All other Fuels | 5 (4.4%) | 0 (0.0%) |
| No Fuel Used | 5 (4.4%) | 0 (0.0%) |
| Total | 114 (100.0%) | 10 (100.0%) |
Household Vehicle Usage in Midwest
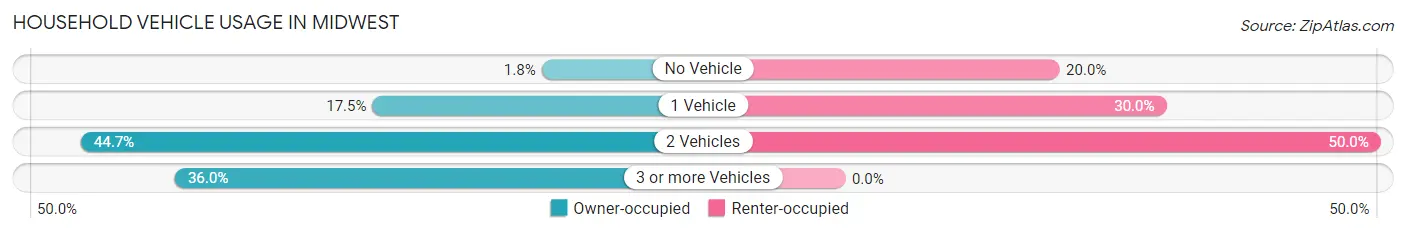
| Vehicles per Household | Owner-occupied | Renter-occupied |
| No Vehicle | 2 (1.8%) | 2 (20.0%) |
| 1 Vehicle | 20 (17.5%) | 3 (30.0%) |
| 2 Vehicles | 51 (44.7%) | 5 (50.0%) |
| 3 or more Vehicles | 41 (36.0%) | 0 (0.0%) |
| Total | 114 (100.0%) | 10 (100.0%) |
Real Estate & Mortgages in Midwest
Real Estate and Mortgage Overview in Midwest
| Characteristic | Without Mortgage | With Mortgage |
| Housing Units | 94 | 20 |
| Median Property Value | $61,700 | $38,000 |
| Median Household Income | $63,000 | $4 |
| Monthly Housing Costs | $325 | $0 |
| Real Estate Taxes | $416 | $0 |
Property Value by Mortgage Status in Midwest
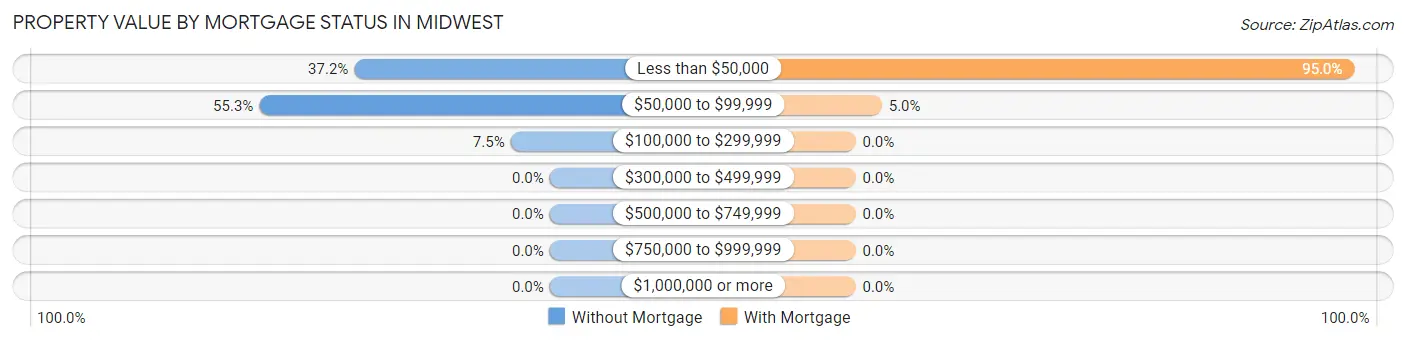
| Property Value | Without Mortgage | With Mortgage |
| Less than $50,000 | 35 (37.2%) | 19 (95.0%) |
| $50,000 to $99,999 | 52 (55.3%) | 1 (5.0%) |
| $100,000 to $299,999 | 7 (7.4%) | 0 (0.0%) |
| $300,000 to $499,999 | 0 (0.0%) | 0 (0.0%) |
| $500,000 to $749,999 | 0 (0.0%) | 0 (0.0%) |
| $750,000 to $999,999 | 0 (0.0%) | 0 (0.0%) |
| $1,000,000 or more | 0 (0.0%) | 0 (0.0%) |
| Total | 94 (100.0%) | 20 (100.0%) |
Household Income by Mortgage Status in Midwest
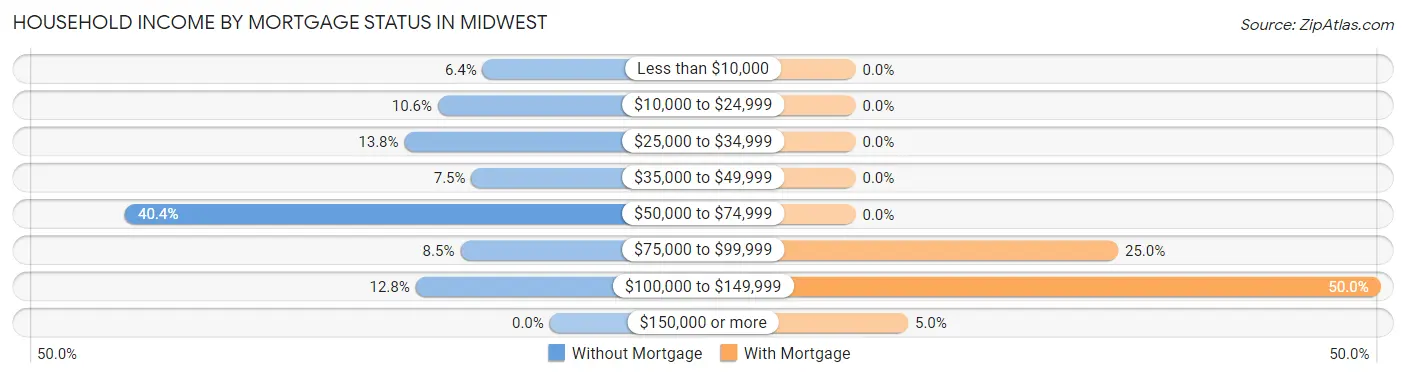
| Household Income | Without Mortgage | With Mortgage |
| Less than $10,000 | 6 (6.4%) | 0 (0.0%) |
| $10,000 to $24,999 | 10 (10.6%) | 0 (0.0%) |
| $25,000 to $34,999 | 13 (13.8%) | 0 (0.0%) |
| $35,000 to $49,999 | 7 (7.4%) | 0 (0.0%) |
| $50,000 to $74,999 | 38 (40.4%) | 0 (0.0%) |
| $75,000 to $99,999 | 8 (8.5%) | 5 (25.0%) |
| $100,000 to $149,999 | 12 (12.8%) | 10 (50.0%) |
| $150,000 or more | 0 (0.0%) | 1 (5.0%) |
| Total | 94 (100.0%) | 20 (100.0%) |
Property Value to Household Income Ratio in Midwest
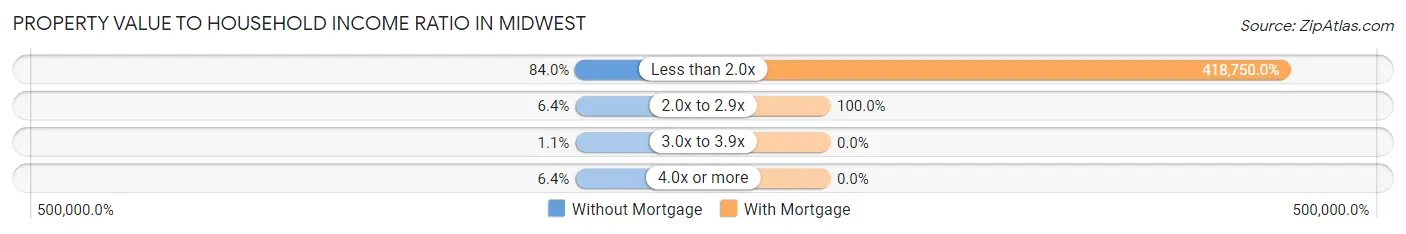
| Value-to-Income Ratio | Without Mortgage | With Mortgage |
| Less than 2.0x | 79 (84.0%) | 83,750 (418,750.0%) |
| 2.0x to 2.9x | 6 (6.4%) | 20 (100.0%) |
| 3.0x to 3.9x | 1 (1.1%) | 0 (0.0%) |
| 4.0x or more | 6 (6.4%) | 0 (0.0%) |
| Total | 94 (100.0%) | 20 (100.0%) |
Real Estate Taxes by Mortgage Status in Midwest
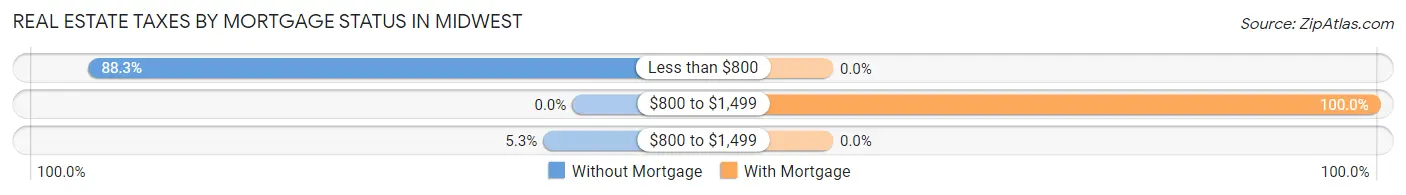
| Property Taxes | Without Mortgage | With Mortgage |
| Less than $800 | 83 (88.3%) | 0 (0.0%) |
| $800 to $1,499 | 0 (0.0%) | 20 (100.0%) |
| $800 to $1,499 | 5 (5.3%) | 0 (0.0%) |
| Total | 94 (100.0%) | 20 (100.0%) |
Health & Disability in Midwest
Health Insurance Coverage by Age in Midwest
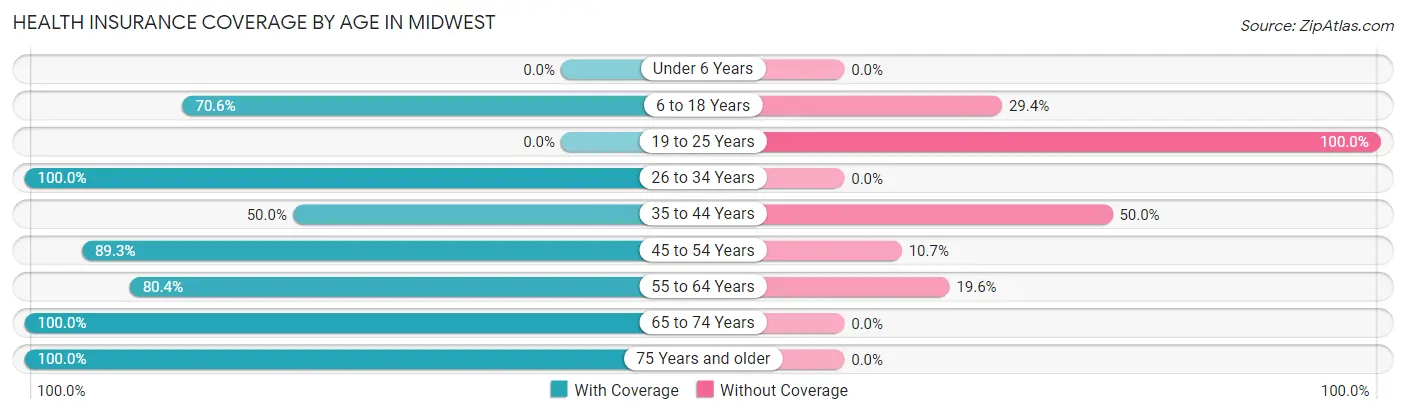
| Age Bracket | With Coverage | Without Coverage |
| Under 6 Years | 0 (0.0%) | 0 (0.0%) |
| 6 to 18 Years | 12 (70.6%) | 5 (29.4%) |
| 19 to 25 Years | 0 (0.0%) | 4 (100.0%) |
| 26 to 34 Years | 18 (100.0%) | 0 (0.0%) |
| 35 to 44 Years | 9 (50.0%) | 9 (50.0%) |
| 45 to 54 Years | 50 (89.3%) | 6 (10.7%) |
| 55 to 64 Years | 41 (80.4%) | 10 (19.6%) |
| 65 to 74 Years | 32 (100.0%) | 0 (0.0%) |
| 75 Years and older | 9 (100.0%) | 0 (0.0%) |
| Total | 171 (83.4%) | 34 (16.6%) |
Health Insurance Coverage by Citizenship Status in Midwest
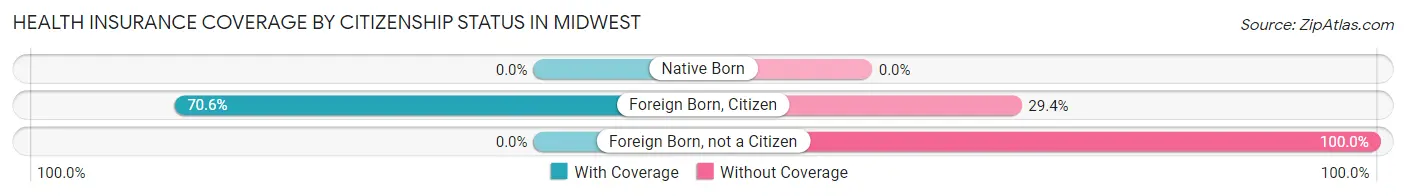
| Citizenship Status | With Coverage | Without Coverage |
| Native Born | 0 (0.0%) | 0 (0.0%) |
| Foreign Born, Citizen | 12 (70.6%) | 5 (29.4%) |
| Foreign Born, not a Citizen | 0 (0.0%) | 4 (100.0%) |
Health Insurance Coverage by Household Income in Midwest
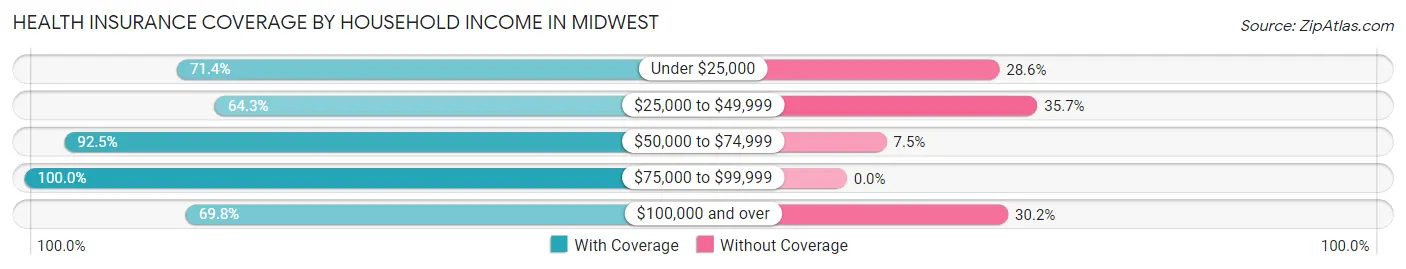
| Household Income | With Coverage | Without Coverage |
| Under $25,000 | 15 (71.4%) | 6 (28.6%) |
| $25,000 to $49,999 | 18 (64.3%) | 10 (35.7%) |
| $50,000 to $74,999 | 62 (92.5%) | 5 (7.5%) |
| $75,000 to $99,999 | 46 (100.0%) | 0 (0.0%) |
| $100,000 and over | 30 (69.8%) | 13 (30.2%) |
Public vs Private Health Insurance Coverage by Age in Midwest
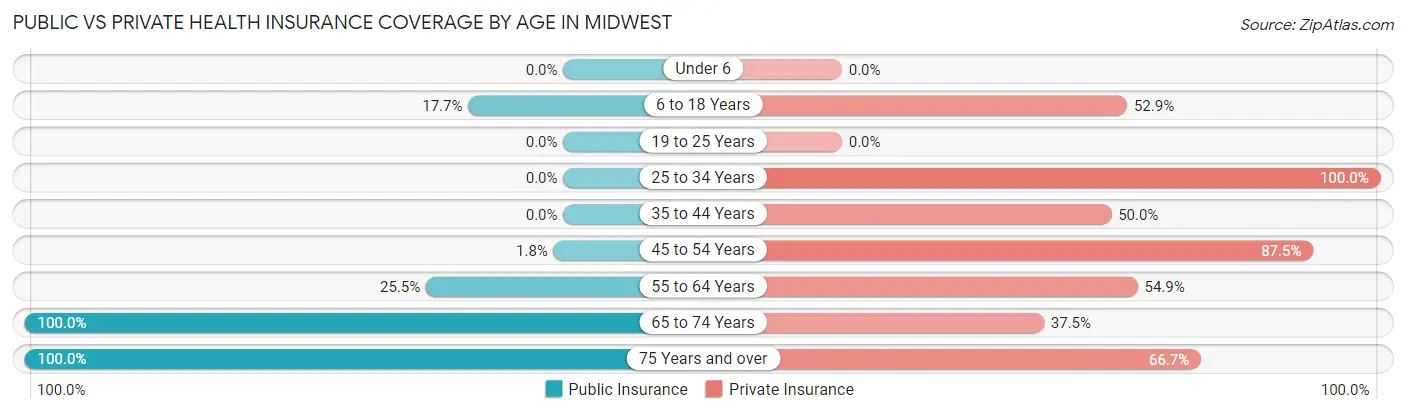
| Age Bracket | Public Insurance | Private Insurance |
| Under 6 | 0 (0.0%) | 0 (0.0%) |
| 6 to 18 Years | 3 (17.6%) | 9 (52.9%) |
| 19 to 25 Years | 0 (0.0%) | 0 (0.0%) |
| 25 to 34 Years | 0 (0.0%) | 18 (100.0%) |
| 35 to 44 Years | 0 (0.0%) | 9 (50.0%) |
| 45 to 54 Years | 1 (1.8%) | 49 (87.5%) |
| 55 to 64 Years | 13 (25.5%) | 28 (54.9%) |
| 65 to 74 Years | 32 (100.0%) | 12 (37.5%) |
| 75 Years and over | 9 (100.0%) | 6 (66.7%) |
| Total | 58 (28.3%) | 131 (63.9%) |
Disability Status by Sex by Age in Midwest
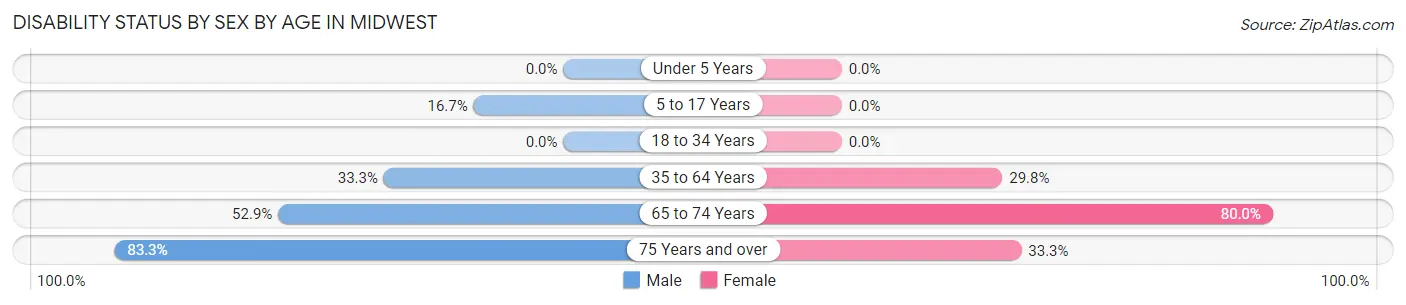
| Age Bracket | Male | Female |
| Under 5 Years | 0 (0.0%) | 0 (0.0%) |
| 5 to 17 Years | 1 (16.7%) | 0 (0.0%) |
| 18 to 34 Years | 0 (0.0%) | 0 (0.0%) |
| 35 to 64 Years | 26 (33.3%) | 14 (29.8%) |
| 65 to 74 Years | 9 (52.9%) | 12 (80.0%) |
| 75 Years and over | 5 (83.3%) | 1 (33.3%) |
Disability Class by Sex by Age in Midwest
Disability Class: Hearing Difficulty
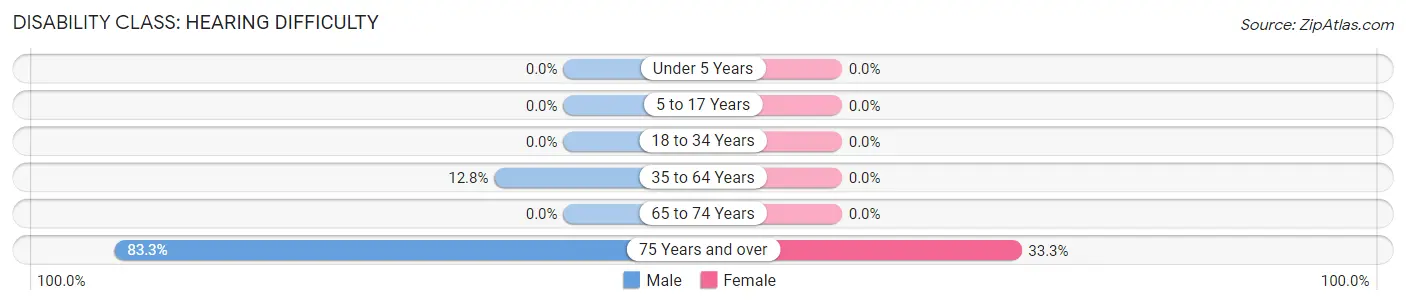
| Age Bracket | Male | Female |
| Under 5 Years | 0 (0.0%) | 0 (0.0%) |
| 5 to 17 Years | 0 (0.0%) | 0 (0.0%) |
| 18 to 34 Years | 0 (0.0%) | 0 (0.0%) |
| 35 to 64 Years | 10 (12.8%) | 0 (0.0%) |
| 65 to 74 Years | 0 (0.0%) | 0 (0.0%) |
| 75 Years and over | 5 (83.3%) | 1 (33.3%) |
Disability Class: Vision Difficulty
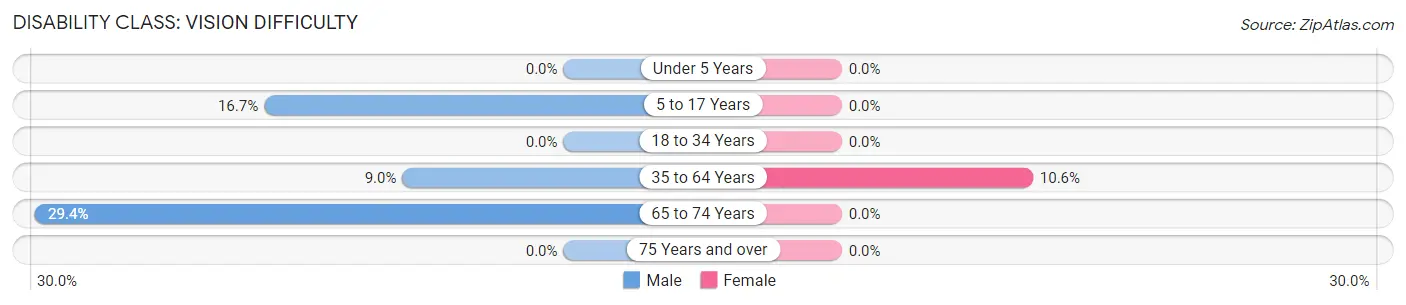
| Age Bracket | Male | Female |
| Under 5 Years | 0 (0.0%) | 0 (0.0%) |
| 5 to 17 Years | 1 (16.7%) | 0 (0.0%) |
| 18 to 34 Years | 0 (0.0%) | 0 (0.0%) |
| 35 to 64 Years | 7 (9.0%) | 5 (10.6%) |
| 65 to 74 Years | 5 (29.4%) | 0 (0.0%) |
| 75 Years and over | 0 (0.0%) | 0 (0.0%) |
Disability Class: Cognitive Difficulty
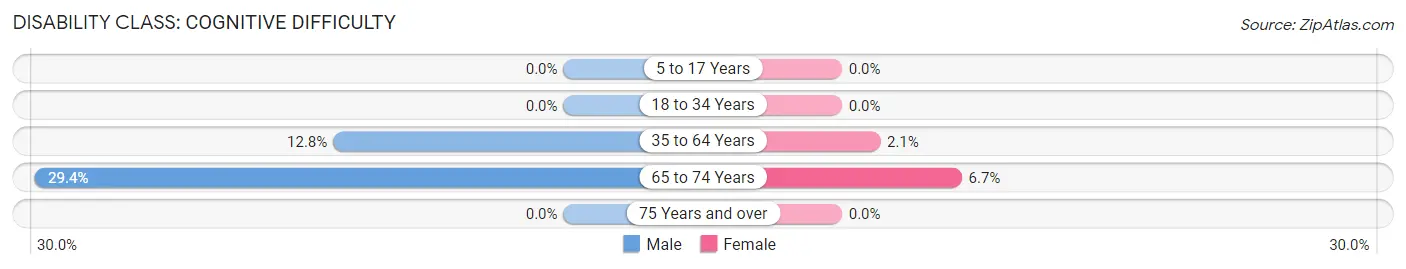
| Age Bracket | Male | Female |
| 5 to 17 Years | 0 (0.0%) | 0 (0.0%) |
| 18 to 34 Years | 0 (0.0%) | 0 (0.0%) |
| 35 to 64 Years | 10 (12.8%) | 1 (2.1%) |
| 65 to 74 Years | 5 (29.4%) | 1 (6.7%) |
| 75 Years and over | 0 (0.0%) | 0 (0.0%) |
Disability Class: Ambulatory Difficulty
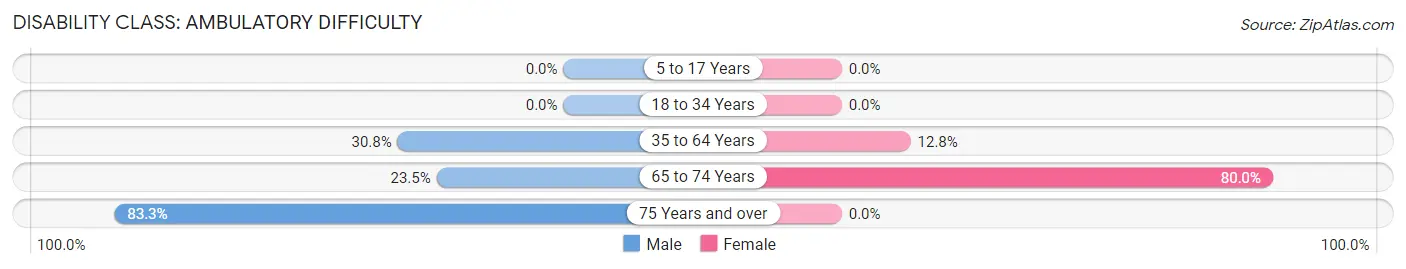
| Age Bracket | Male | Female |
| 5 to 17 Years | 0 (0.0%) | 0 (0.0%) |
| 18 to 34 Years | 0 (0.0%) | 0 (0.0%) |
| 35 to 64 Years | 24 (30.8%) | 6 (12.8%) |
| 65 to 74 Years | 4 (23.5%) | 12 (80.0%) |
| 75 Years and over | 5 (83.3%) | 0 (0.0%) |
Disability Class: Self-Care Difficulty
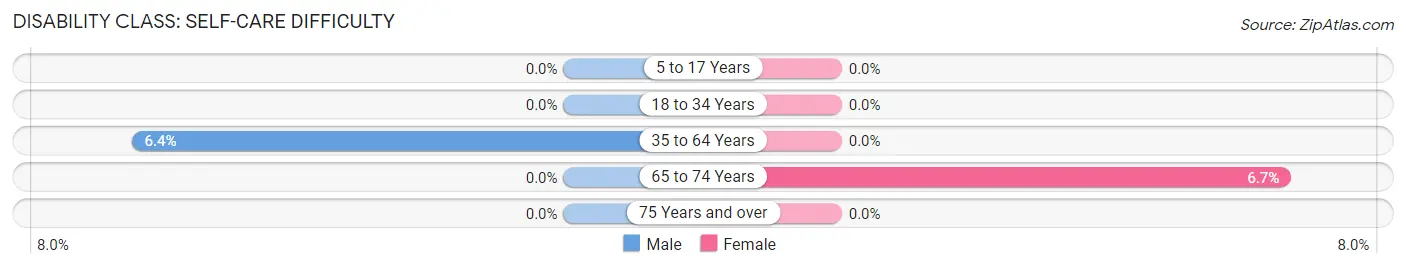
| Age Bracket | Male | Female |
| 5 to 17 Years | 0 (0.0%) | 0 (0.0%) |
| 18 to 34 Years | 0 (0.0%) | 0 (0.0%) |
| 35 to 64 Years | 5 (6.4%) | 0 (0.0%) |
| 65 to 74 Years | 0 (0.0%) | 1 (6.7%) |
| 75 Years and over | 0 (0.0%) | 0 (0.0%) |
Technology Access in Midwest
Computing Device Access in Midwest
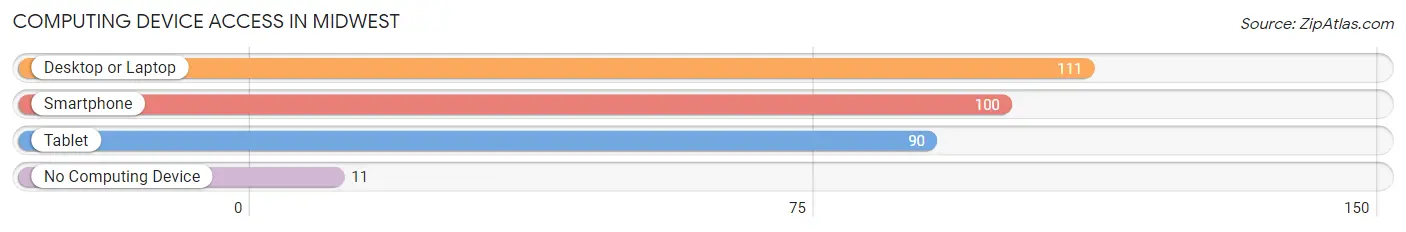
| Device Type | # Households | % Households |
| Desktop or Laptop | 111 | 89.5% |
| Smartphone | 100 | 80.6% |
| Tablet | 90 | 72.6% |
| No Computing Device | 11 | 8.9% |
| Total | 124 | 100.0% |
Internet Access in Midwest
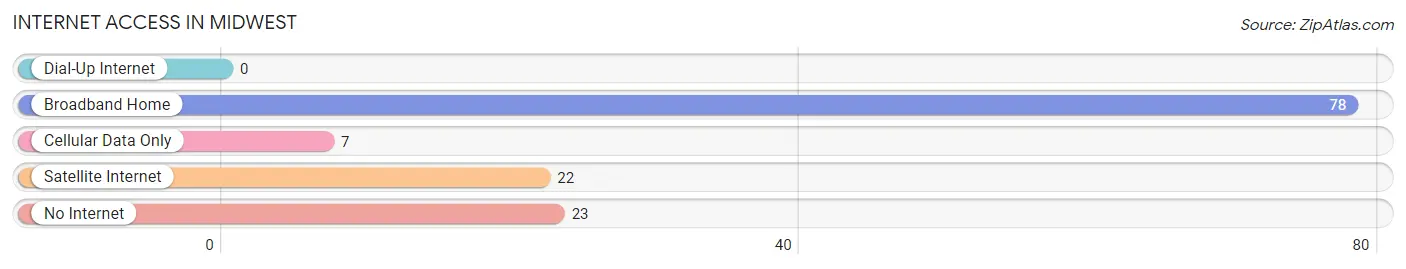
| Internet Type | # Households | % Households |
| Dial-Up Internet | 0 | 0.0% |
| Broadband Home | 78 | 62.9% |
| Cellular Data Only | 7 | 5.7% |
| Satellite Internet | 22 | 17.7% |
| No Internet | 23 | 18.5% |
| Total | 124 | 100.0% |
Midwest Summary
The Midwest region of the United States is comprised of 12 states, including Wisconsin (WY). Wisconsin is located in the north-central part of the United States, bordered by Minnesota to the west, Michigan to the north, Illinois to the south, and Lake Michigan and Lake Superior to the east. The state is known for its rolling hills, lush forests, and abundant lakes and rivers.
History
The first inhabitants of Wisconsin were Native American tribes, including the Ojibwe, Menominee, Potawatomi, and Ho-Chunk. The first Europeans to explore the area were French fur traders, who arrived in the late 1600s. In 1787, the Northwest Ordinance established Wisconsin as part of the Northwest Territory. In 1848, Wisconsin became the 30th state to join the Union.
During the 19th century, Wisconsin experienced a period of rapid growth and development. The state was a major producer of wheat, corn, and dairy products, and its economy was largely based on agriculture. In the late 19th century, the state also experienced a period of industrialization, with the development of factories and railroads.
Geography
Wisconsin is located in the north-central part of the United States. It is bordered by Minnesota to the west, Michigan to the north, Illinois to the south, and Lake Michigan and Lake Superior to the east. The state is known for its rolling hills, lush forests, and abundant lakes and rivers.
The state is divided into five distinct geographic regions: the Central Plain, the Eastern Ridges and Lowlands, the Northern Highlands, the Western Uplands, and the Lake Superior Lowland. The Central Plain is a flat, fertile region that is home to most of the state’s population. The Eastern Ridges and Lowlands are characterized by rolling hills and valleys, while the Northern Highlands are a rugged, heavily forested region. The Western Uplands are a hilly region, while the Lake Superior Lowland is a flat, marshy region along the shore of Lake Superior.
Economy
Wisconsin’s economy is largely based on agriculture, manufacturing, and tourism. The state is a major producer of dairy products, corn, and wheat, and is also known for its cranberry and ginseng production. Manufacturing is also an important part of the state’s economy, with major industries including paper products, machinery, and food processing.
Tourism is also an important part of the state’s economy. Wisconsin is home to numerous state and national parks, as well as a variety of outdoor activities, such as fishing, hunting, and camping. The state is also home to several major cities, including Milwaukee, Madison, and Green Bay.
Demographics
As of 2020, the population of Wisconsin was estimated to be 5.8 million. The state is predominantly white, with 84.3% of the population identifying as white. The next largest racial group is Hispanic or Latino, at 6.2%. Other racial groups include African American (5.7%), Asian (2.3%), and Native American (1.2%).
The median household income in Wisconsin is $60,811, and the median age is 38.7. The state’s largest cities are Milwaukee, Madison, and Green Bay. The state’s capital is Madison.
Wisconsin is home to a variety of religious groups, including Christianity (63.3%), Judaism (2.2%), and Islam (1.2%). The state is also home to a variety of cultural and ethnic groups, including German (25.2%), Irish (13.2%), Polish (9.2%), and Norwegian (7.2%).
Common Questions
What is Per Capita Income in Midwest?
Per Capita income in Midwest is $40,970.
What is the Median Family Income in Midwest?
Median Family Income in Midwest is $83,021.
What is the Median Household income in Midwest?
Median Household Income in Midwest is $72,826.
What is Income or Wage Gap in Midwest?
Income or Wage Gap in Midwest is 48.8%.
Women in Midwest earn 51.2 cents for every dollar earned by a man.
What is Inequality or Gini Index in Midwest?
Inequality or Gini Index in Midwest is 0.32.
What is the Total Population of Midwest?
Total Population of Midwest is 205.
What is the Total Male Population of Midwest?
Total Male Population of Midwest is 117.
What is the Total Female Population of Midwest?
Total Female Population of Midwest is 88.
What is the Ratio of Males per 100 Females in Midwest?
There are 132.95 Males per 100 Females in Midwest.
What is the Ratio of Females per 100 Males in Midwest?
There are 75.21 Females per 100 Males in Midwest.
What is the Median Population Age in Midwest?
Median Population Age in Midwest is 51.8 Years.
What is the Average Family Size in Midwest
Average Family Size in Midwest is 2.4 People.
What is the Average Household Size in Midwest
Average Household Size in Midwest is 1.6 People.
How Large is the Labor Force in Midwest?
There are 118 People in the Labor Forcein in Midwest.
What is the Percentage of People in the Labor Force in Midwest?
61.5% of People are in the Labor Force in Midwest.
What is the Unemployment Rate in Midwest?
Unemployment Rate in Midwest is 1.7%.