Sarah Ann, WV Map & Demographics
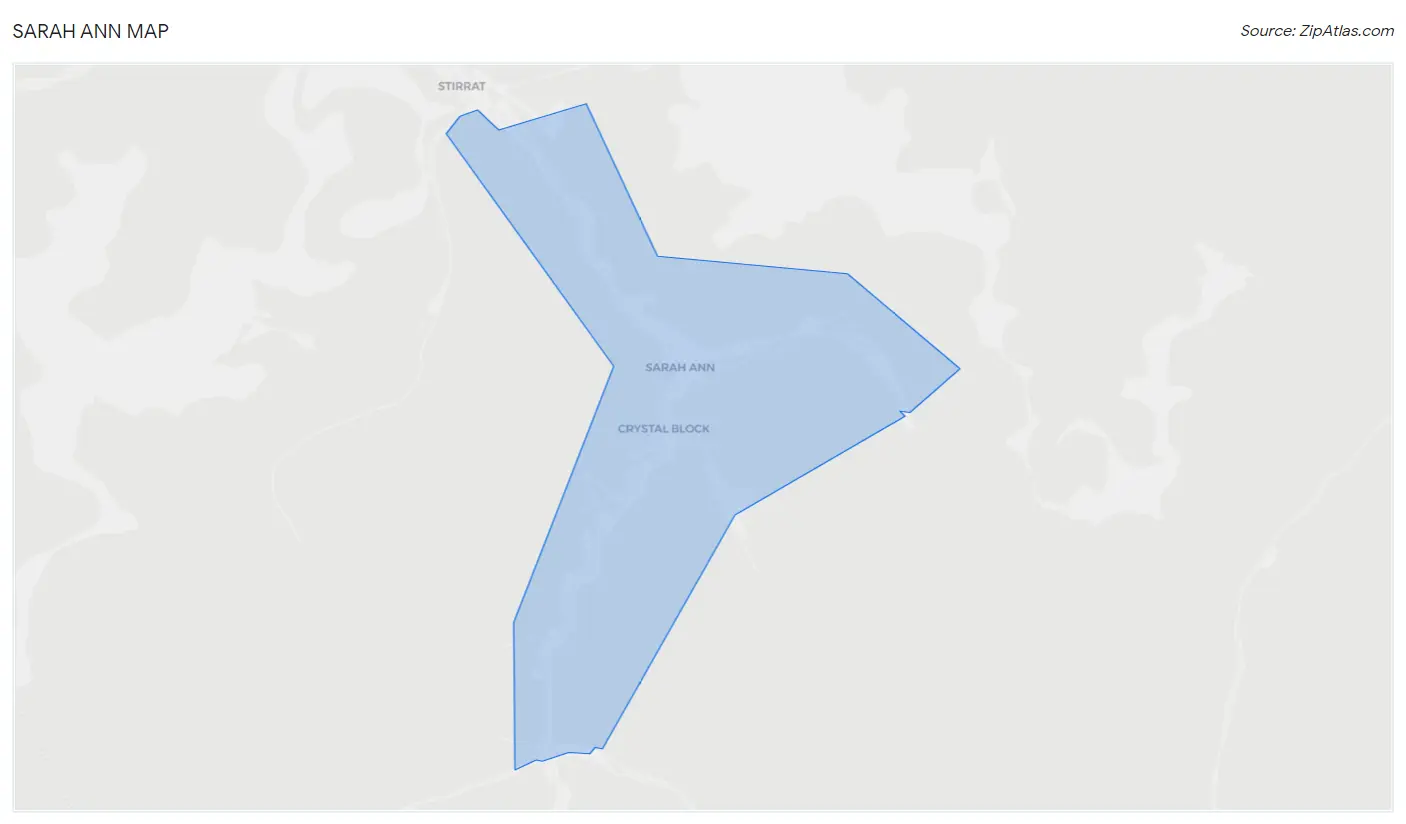
Sarah Ann Map
Sarah Ann Overview
$32,034
PER CAPITA INCOME
$115,680
AVG FAMILY INCOME
0.28
INEQUALITY / GINI INDEX
289
TOTAL POPULATION
127
MALE POPULATION
162
FEMALE POPULATION
78.40
MALES / 100 FEMALES
127.56
FEMALES / 100 MALES
44.2
MEDIAN AGE
2.4
AVG FAMILY SIZE
2.3
AVG HOUSEHOLD SIZE
82
LABOR FORCE [ PEOPLE ]
32.2%
PERCENT IN LABOR FORCE
Sarah Ann Zip Codes
Sarah Ann Area Codes
Income in Sarah Ann
Income Overview in Sarah Ann
| Characteristic | Number | Measure |
| Per Capita Income | 289 | $32,034 |
| Median Family Income | 115 | $115,680 |
| Mean Family Income | 115 | $88,466 |
| Median Household Income | 128 | $0 |
| Mean Household Income | 128 | $80,566 |
| Income Deficit | 115 | $0 |
| Wage / Income Gap (%) | 289 | 0.00% |
| Wage / Income Gap ($) | 289 | 100.00¢ per $1 |
| Gini / Inequality Index | 289 | 0.28 |
Earnings by Sex in Sarah Ann
| Sex | Number | Average Earnings |
| Male | 69 (84.2%) | $0 |
| Female | 13 (15.9%) | $0 |
| Total | 82 (100.0%) | $0 |
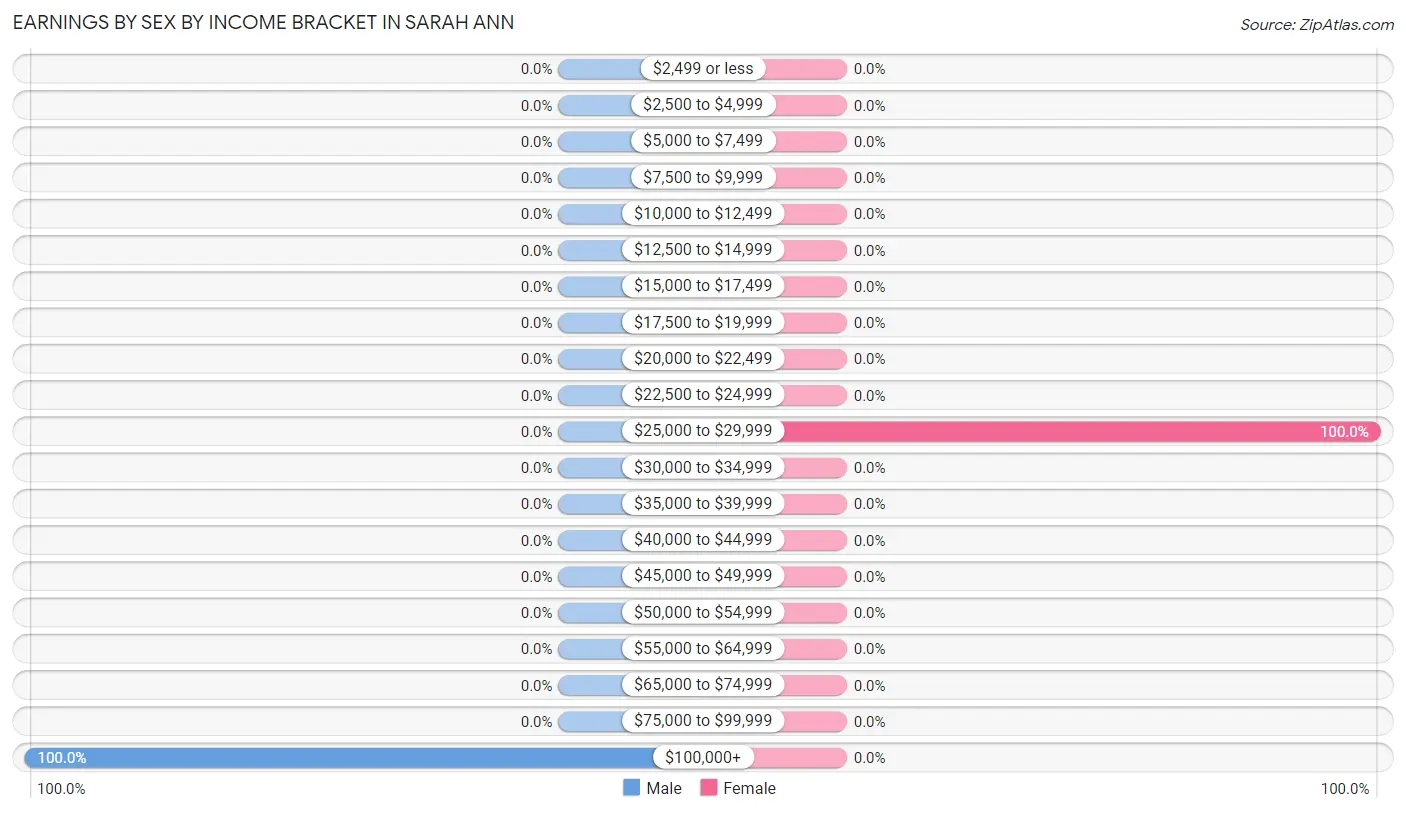
Earnings by Sex by Income Bracket in Sarah Ann
The most common earnings brackets in Sarah Ann are $100,000+ for men (69 | 100.0%) and $25,000 to $29,999 for women (13 | 100.0%).
| Income | Male | Female |
| $2,499 or less | 0 (0.0%) | 0 (0.0%) |
| $2,500 to $4,999 | 0 (0.0%) | 0 (0.0%) |
| $5,000 to $7,499 | 0 (0.0%) | 0 (0.0%) |
| $7,500 to $9,999 | 0 (0.0%) | 0 (0.0%) |
| $10,000 to $12,499 | 0 (0.0%) | 0 (0.0%) |
| $12,500 to $14,999 | 0 (0.0%) | 0 (0.0%) |
| $15,000 to $17,499 | 0 (0.0%) | 0 (0.0%) |
| $17,500 to $19,999 | 0 (0.0%) | 0 (0.0%) |
| $20,000 to $22,499 | 0 (0.0%) | 0 (0.0%) |
| $22,500 to $24,999 | 0 (0.0%) | 0 (0.0%) |
| $25,000 to $29,999 | 0 (0.0%) | 13 (100.0%) |
| $30,000 to $34,999 | 0 (0.0%) | 0 (0.0%) |
| $35,000 to $39,999 | 0 (0.0%) | 0 (0.0%) |
| $40,000 to $44,999 | 0 (0.0%) | 0 (0.0%) |
| $45,000 to $49,999 | 0 (0.0%) | 0 (0.0%) |
| $50,000 to $54,999 | 0 (0.0%) | 0 (0.0%) |
| $55,000 to $64,999 | 0 (0.0%) | 0 (0.0%) |
| $65,000 to $74,999 | 0 (0.0%) | 0 (0.0%) |
| $75,000 to $99,999 | 0 (0.0%) | 0 (0.0%) |
| $100,000+ | 69 (100.0%) | 0 (0.0%) |
| Total | 69 (100.0%) | 13 (100.0%) |
Earnings by Sex by Educational Attainment in Sarah Ann
| Educational Attainment | Male Income | Female Income |
| Less than High School | - | - |
| High School Diploma | - | - |
| College or Associate's Degree | - | - |
| Bachelor's Degree | - | - |
| Graduate Degree | - | - |
| Total | - | - |
Family Income in Sarah Ann
Family Income Brackets in Sarah Ann
According to the Sarah Ann family income data, there are 79 families falling into the $100,000 to $149,999 income range, which is the most common income bracket and makes up 68.7% of all families.
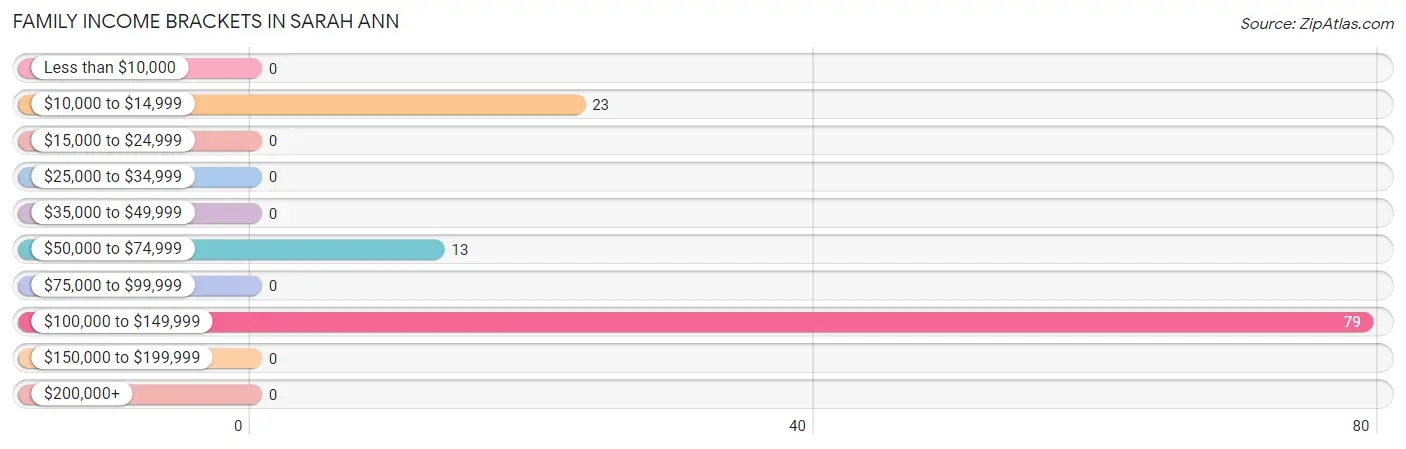
| Income Bracket | # Families | % Families |
| Less than $10,000 | 0 | 0.0% |
| $10,000 to $14,999 | 23 | 20.0% |
| $15,000 to $24,999 | 0 | 0.0% |
| $25,000 to $34,999 | 0 | 0.0% |
| $35,000 to $49,999 | 0 | 0.0% |
| $50,000 to $74,999 | 13 | 11.3% |
| $75,000 to $99,999 | 0 | 0.0% |
| $100,000 to $149,999 | 79 | 68.7% |
| $150,000 to $199,999 | 0 | 0.0% |
| $200,000+ | 0 | 0.0% |
Family Income by Famaliy Size in Sarah Ann
| Income Bracket | # Families | Median Income |
| 2-Person Families | 79 (68.7%) | $0 |
| 3-Person Families | 36 (31.3%) | $0 |
| 4-Person Families | 0 (0.0%) | $0 |
| 5-Person Families | 0 (0.0%) | $0 |
| 6-Person Families | 0 (0.0%) | $0 |
| 7+ Person Families | 0 (0.0%) | $0 |
| Total | 115 (100.0%) | $115,680 |
Family Income by Number of Earners in Sarah Ann
| Number of Earners | # Families | Median Income |
| No Earners | 23 (20.0%) | $0 |
| 1 Earner | 92 (80.0%) | $0 |
| 2 Earners | 0 (0.0%) | $0 |
| 3+ Earners | 0 (0.0%) | $0 |
| Total | 115 (100.0%) | $115,680 |
Household Income in Sarah Ann
Household Income Brackets in Sarah Ann
With 79 households falling in the category, the $100,000 to $149,999 income range is the most frequent in Sarah Ann, accounting for 61.7% of all households.
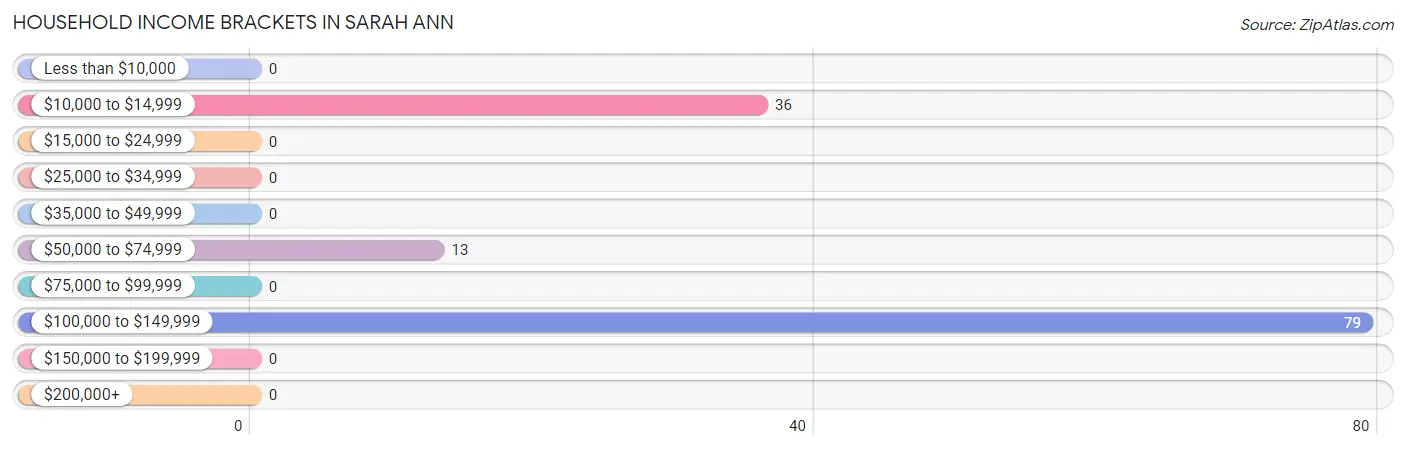
| Income Bracket | # Households | % Households |
| Less than $10,000 | 0 | 0.0% |
| $10,000 to $14,999 | 36 | 28.1% |
| $15,000 to $24,999 | 0 | 0.0% |
| $25,000 to $34,999 | 0 | 0.0% |
| $35,000 to $49,999 | 0 | 0.0% |
| $50,000 to $74,999 | 13 | 10.2% |
| $75,000 to $99,999 | 0 | 0.0% |
| $100,000 to $149,999 | 79 | 61.7% |
| $150,000 to $199,999 | 0 | 0.0% |
| $200,000+ | 0 | 0.0% |
Household Income by Householder Age in Sarah Ann
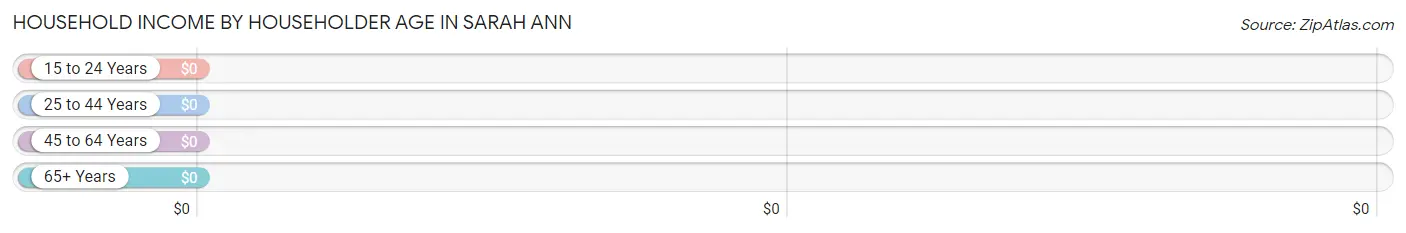
| Income Bracket | # Households | Median Income |
| 15 to 24 Years | 0 (0.0%) | $0 |
| 25 to 44 Years | 79 (61.7%) | $0 |
| 45 to 64 Years | 36 (28.1%) | $0 |
| 65+ Years | 13 (10.2%) | $0 |
| Total | 128 (100.0%) | $0 |
Poverty in Sarah Ann
Income Below Poverty by Sex and Age in Sarah Ann
With 17.3% poverty level for males and 43.2% for females among the residents of Sarah Ann, 65 to 74 year old males and 12 to 14 year old females are the most vulnerable to poverty, with 22 males (62.9%) and 34 females (100.0%) in their respective age groups living below the poverty level.
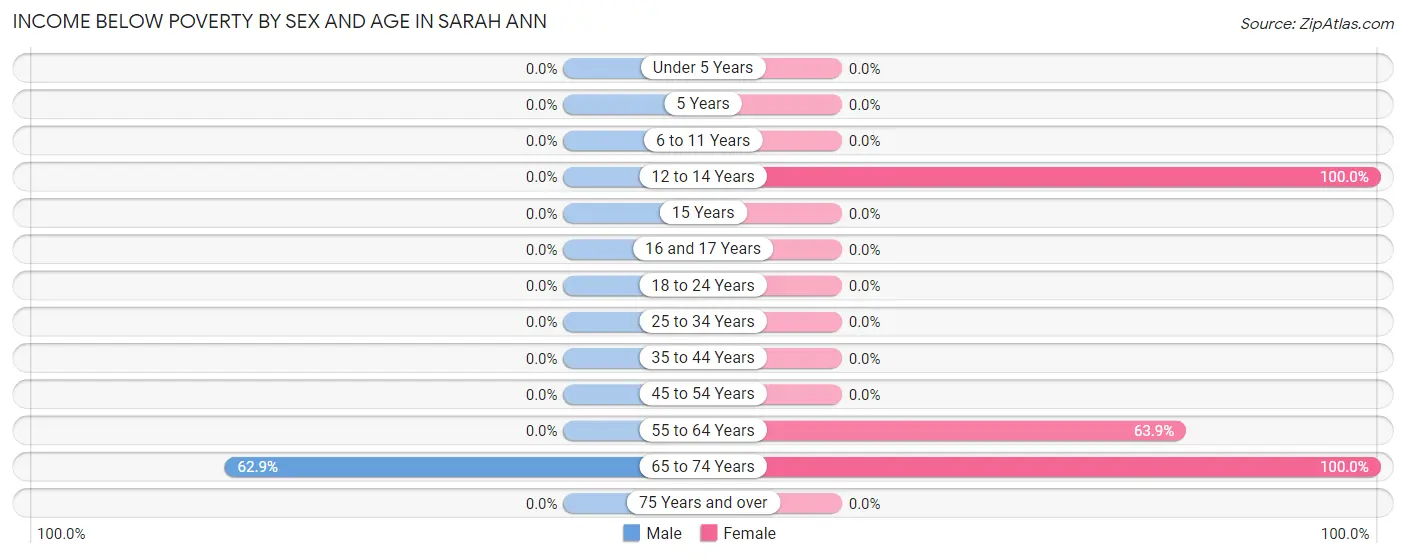
| Age Bracket | Male | Female |
| Under 5 Years | 0 (0.0%) | 0 (0.0%) |
| 5 Years | 0 (0.0%) | 0 (0.0%) |
| 6 to 11 Years | 0 (0.0%) | 0 (0.0%) |
| 12 to 14 Years | 0 (0.0%) | 34 (100.0%) |
| 15 Years | 0 (0.0%) | 0 (0.0%) |
| 16 and 17 Years | 0 (0.0%) | 0 (0.0%) |
| 18 to 24 Years | 0 (0.0%) | 0 (0.0%) |
| 25 to 34 Years | 0 (0.0%) | 0 (0.0%) |
| 35 to 44 Years | 0 (0.0%) | 0 (0.0%) |
| 45 to 54 Years | 0 (0.0%) | 0 (0.0%) |
| 55 to 64 Years | 0 (0.0%) | 23 (63.9%) |
| 65 to 74 Years | 22 (62.9%) | 13 (100.0%) |
| 75 Years and over | 0 (0.0%) | 0 (0.0%) |
| Total | 22 (17.3%) | 70 (43.2%) |
Income Above Poverty by Sex and Age in Sarah Ann
According to the poverty statistics in Sarah Ann, males aged 35 to 44 years and females aged 35 to 44 years are the age groups that are most secure financially, with 100.0% of males and 100.0% of females in these age groups living above the poverty line.
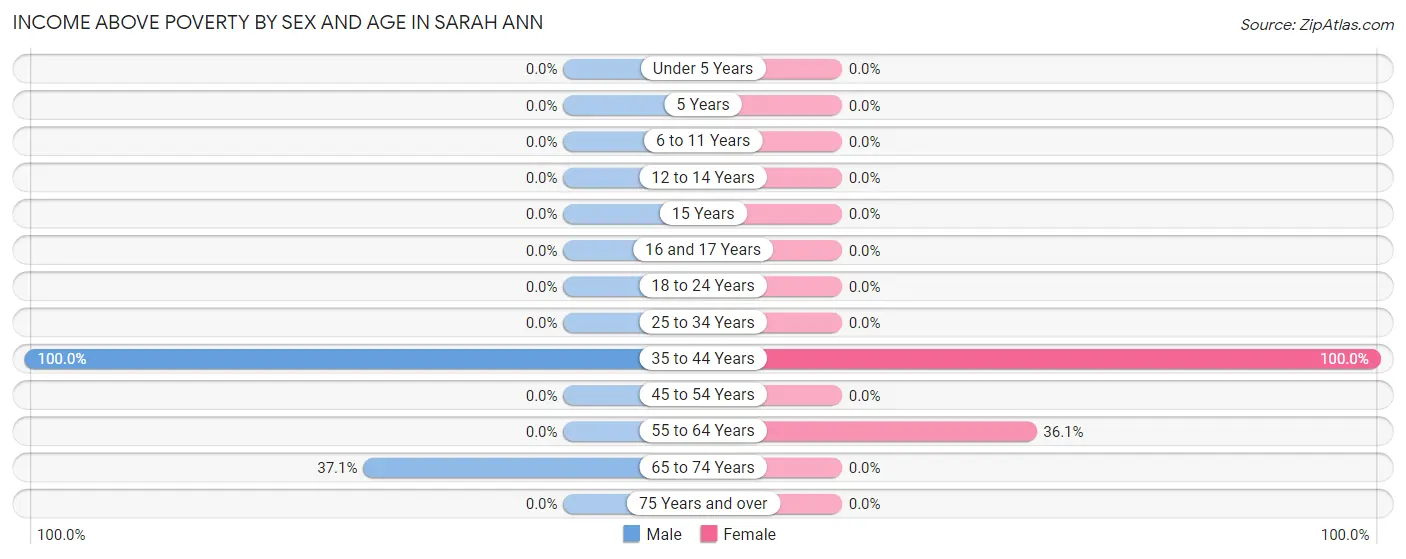
| Age Bracket | Male | Female |
| Under 5 Years | 0 (0.0%) | 0 (0.0%) |
| 5 Years | 0 (0.0%) | 0 (0.0%) |
| 6 to 11 Years | 0 (0.0%) | 0 (0.0%) |
| 12 to 14 Years | 0 (0.0%) | 0 (0.0%) |
| 15 Years | 0 (0.0%) | 0 (0.0%) |
| 16 and 17 Years | 0 (0.0%) | 0 (0.0%) |
| 18 to 24 Years | 0 (0.0%) | 0 (0.0%) |
| 25 to 34 Years | 0 (0.0%) | 0 (0.0%) |
| 35 to 44 Years | 92 (100.0%) | 79 (100.0%) |
| 45 to 54 Years | 0 (0.0%) | 0 (0.0%) |
| 55 to 64 Years | 0 (0.0%) | 13 (36.1%) |
| 65 to 74 Years | 13 (37.1%) | 0 (0.0%) |
| 75 Years and over | 0 (0.0%) | 0 (0.0%) |
| Total | 105 (82.7%) | 92 (56.8%) |
Income Below Poverty Among Married-Couple Families in Sarah Ann
The poverty statistics for married-couple families in Sarah Ann show that 20.0% or 23 of the total 115 families live below the poverty line. Families with 1 or 2 children have the highest poverty rate of 100.0%, comprising of 23 families. On the other hand, families with no children have the lowest poverty rate of 0.0%, which includes 0 families.
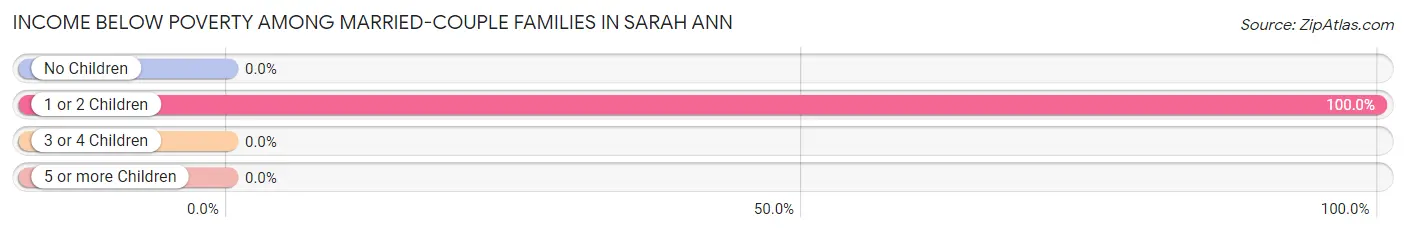
| Children | Above Poverty | Below Poverty |
| No Children | 92 (100.0%) | 0 (0.0%) |
| 1 or 2 Children | 0 (0.0%) | 23 (100.0%) |
| 3 or 4 Children | 0 (0.0%) | 0 (0.0%) |
| 5 or more Children | 0 (0.0%) | 0 (0.0%) |
| Total | 92 (80.0%) | 23 (20.0%) |
Income Below Poverty Among Single-Parent Households in Sarah Ann
| Children | Single Father | Single Mother |
| No Children | 0 (0.0%) | 0 (0.0%) |
| 1 or 2 Children | 0 (0.0%) | 0 (0.0%) |
| 3 or 4 Children | 0 (0.0%) | 0 (0.0%) |
| 5 or more Children | 0 (0.0%) | 0 (0.0%) |
| Total | 0 (0.0%) | 0 (0.0%) |
Income Below Poverty Among Married-Couple vs Single-Parent Households in Sarah Ann
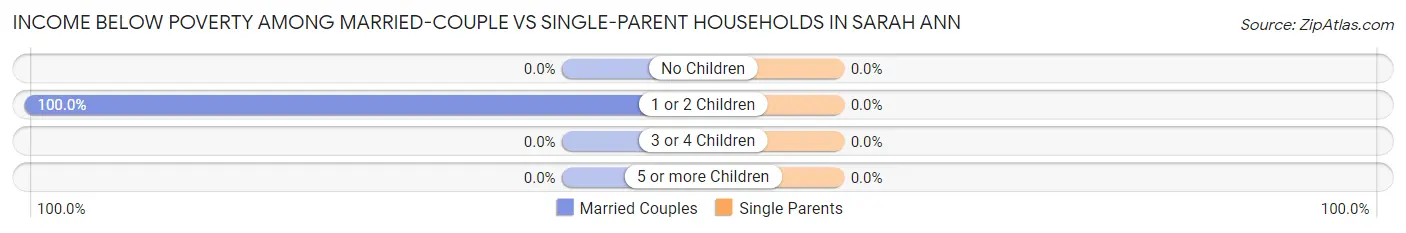
| Children | Married-Couple Families | Single-Parent Households |
| No Children | 0 (0.0%) | 0 (0.0%) |
| 1 or 2 Children | 23 (100.0%) | 0 (0.0%) |
| 3 or 4 Children | 0 (0.0%) | 0 (0.0%) |
| 5 or more Children | 0 (0.0%) | 0 (0.0%) |
| Total | 23 (20.0%) | 0 (0.0%) |
Race in Sarah Ann
The most populous races in Sarah Ann are , and White / Caucasian (289 | 100.0%).
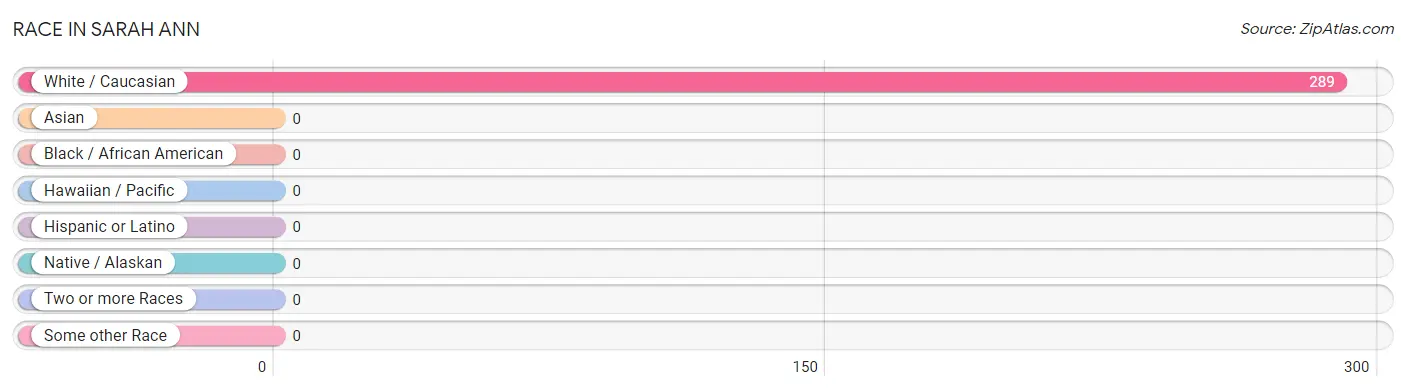
| Race | # Population | % Population |
| Asian | 0 | 0.0% |
| Black / African American | 0 | 0.0% |
| Hawaiian / Pacific | 0 | 0.0% |
| Hispanic or Latino | 0 | 0.0% |
| Native / Alaskan | 0 | 0.0% |
| White / Caucasian | 289 | 100.0% |
| Two or more Races | 0 | 0.0% |
| Some other Race | 0 | 0.0% |
| Total | 289 | 100.0% |
Ancestry in Sarah Ann
The most populous ancestries reported in Sarah Ann are English (13 | 4.5%), and Scotch-Irish (13 | 4.5%), together accounting for 9.0% of all Sarah Ann residents.
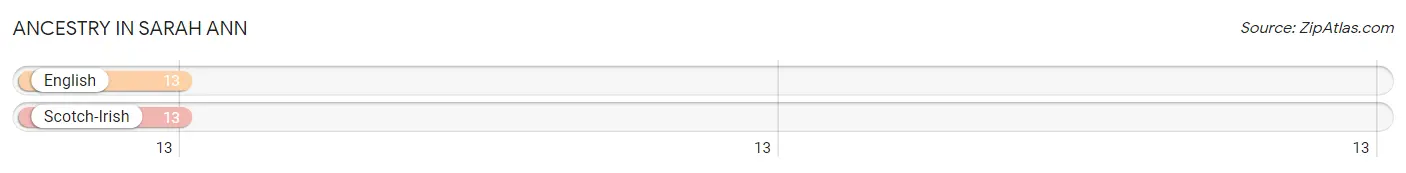
| Ancestry | # Population | % Population |
| English | 13 | 4.5% |
| Scotch-Irish | 13 | 4.5% | View All 2 Rows |
Immigrants in Sarah Ann

| Immigration Origin | # Population | % Population | View All 0 Rows |
Sex and Age in Sarah Ann
Sex and Age in Sarah Ann
The most populous age groups in Sarah Ann are 40 to 44 Years (92 | 72.4%) for men and 40 to 44 Years (79 | 48.8%) for women.
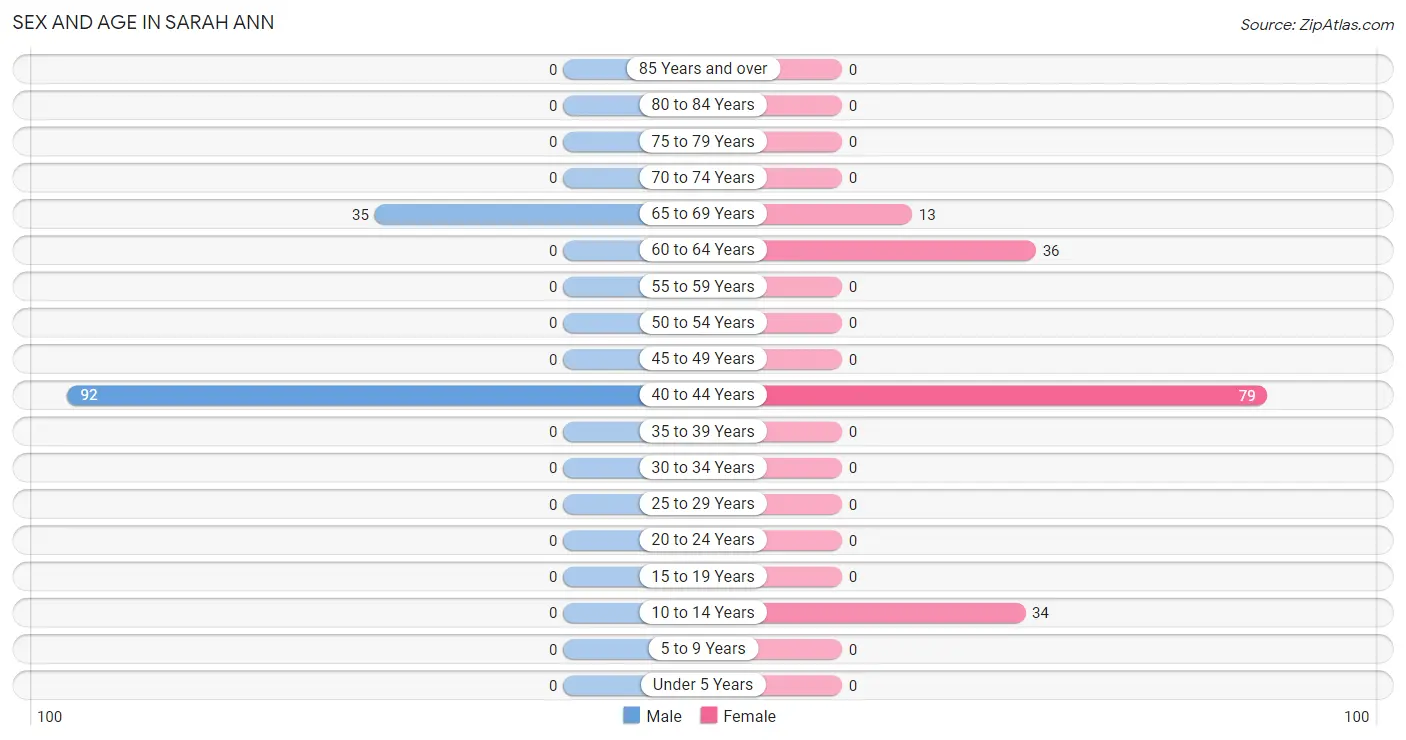
| Age Bracket | Male | Female |
| Under 5 Years | 0 (0.0%) | 0 (0.0%) |
| 5 to 9 Years | 0 (0.0%) | 0 (0.0%) |
| 10 to 14 Years | 0 (0.0%) | 34 (21.0%) |
| 15 to 19 Years | 0 (0.0%) | 0 (0.0%) |
| 20 to 24 Years | 0 (0.0%) | 0 (0.0%) |
| 25 to 29 Years | 0 (0.0%) | 0 (0.0%) |
| 30 to 34 Years | 0 (0.0%) | 0 (0.0%) |
| 35 to 39 Years | 0 (0.0%) | 0 (0.0%) |
| 40 to 44 Years | 92 (72.4%) | 79 (48.8%) |
| 45 to 49 Years | 0 (0.0%) | 0 (0.0%) |
| 50 to 54 Years | 0 (0.0%) | 0 (0.0%) |
| 55 to 59 Years | 0 (0.0%) | 0 (0.0%) |
| 60 to 64 Years | 0 (0.0%) | 36 (22.2%) |
| 65 to 69 Years | 35 (27.6%) | 13 (8.0%) |
| 70 to 74 Years | 0 (0.0%) | 0 (0.0%) |
| 75 to 79 Years | 0 (0.0%) | 0 (0.0%) |
| 80 to 84 Years | 0 (0.0%) | 0 (0.0%) |
| 85 Years and over | 0 (0.0%) | 0 (0.0%) |
| Total | 127 (100.0%) | 162 (100.0%) |
Families and Households in Sarah Ann
Median Family Size in Sarah Ann
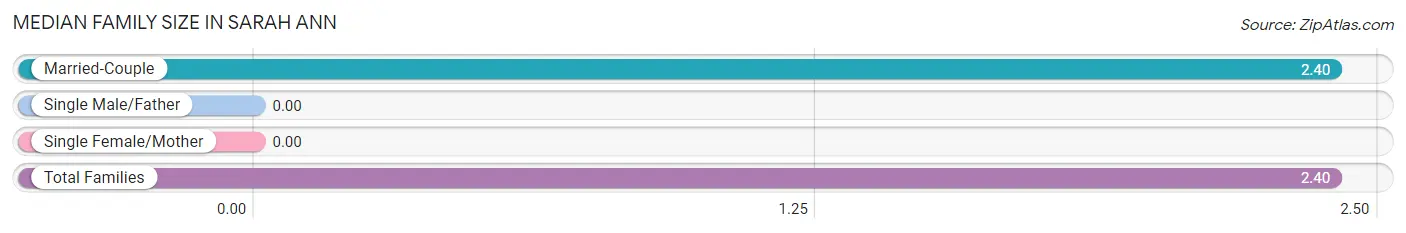
| Family Type | # Families | Family Size |
| Married-Couple | 115 (100.0%) | 2.40 |
| Single Male/Father | 0 (0.0%) | - |
| Single Female/Mother | 0 (0.0%) | - |
| Total Families | 115 (100.0%) | 2.40 |
Median Household Size in Sarah Ann
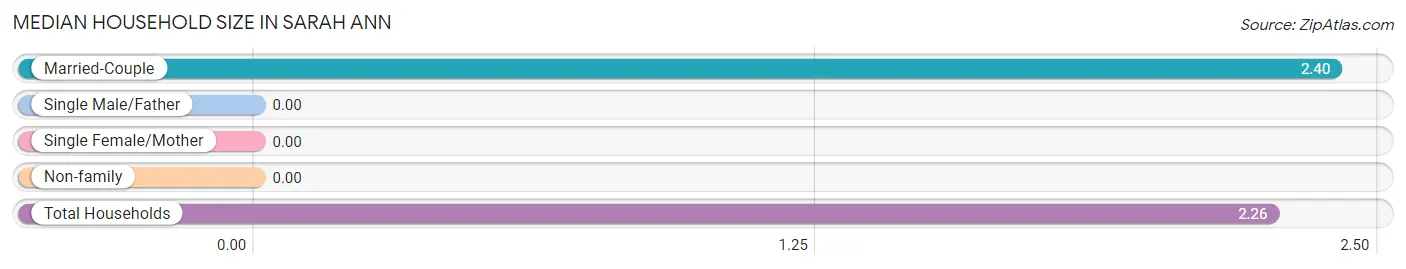
| Household Type | # Households | Household Size |
| Married-Couple | 115 (89.8%) | 2.40 |
| Single Male/Father | 0 (0.0%) | - |
| Single Female/Mother | 0 (0.0%) | - |
| Non-family | 13 (10.2%) | - |
| Total Households | 128 (100.0%) | 2.26 |
Household Size by Marriage Status in Sarah Ann
Out of a total of 128 households in Sarah Ann, 115 (89.8%) are family households, while 13 (10.2%) are nonfamily households. The most numerous type of family households are 2-person households, comprising 79, and the most common type of nonfamily households are 1-person households, comprising 13.
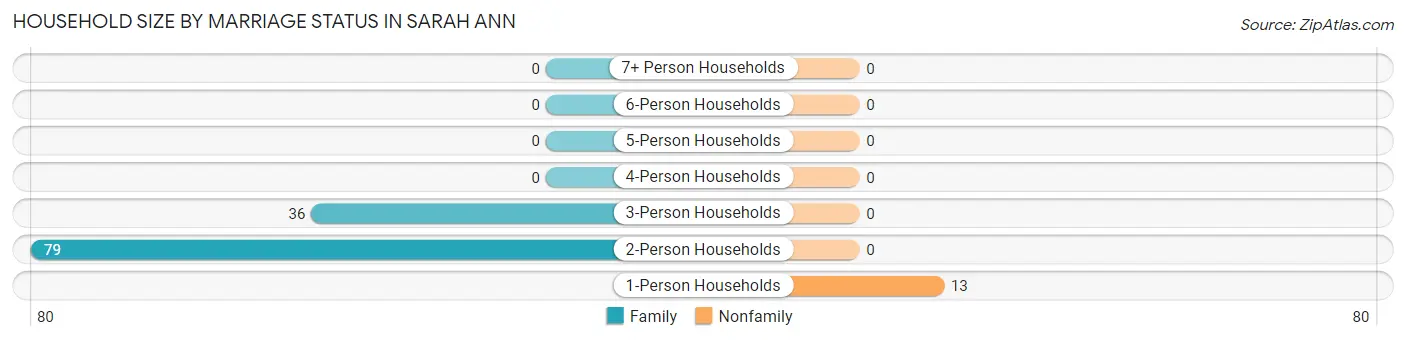
| Household Size | Family Households | Nonfamily Households |
| 1-Person Households | - | 13 (10.2%) |
| 2-Person Households | 79 (61.7%) | 0 (0.0%) |
| 3-Person Households | 36 (28.1%) | 0 (0.0%) |
| 4-Person Households | 0 (0.0%) | 0 (0.0%) |
| 5-Person Households | 0 (0.0%) | 0 (0.0%) |
| 6-Person Households | 0 (0.0%) | 0 (0.0%) |
| 7+ Person Households | 0 (0.0%) | 0 (0.0%) |
| Total | 115 (89.8%) | 13 (10.2%) |
Female Fertility in Sarah Ann
Fertility by Age in Sarah Ann
| Age Bracket | Women with Births | Births / 1,000 Women |
| 15 to 19 years | 0 (0.0%) | 0.0 |
| 20 to 34 years | 0 (0.0%) | 0.0 |
| 35 to 50 years | 0 (0.0%) | 0.0 |
| Total | 0 (0.0%) | 0.0 |
Fertility by Age by Marriage Status in Sarah Ann
| Age Bracket | Married | Unmarried |
| 15 to 19 years | 0 (0.0%) | 0 (0.0%) |
| 20 to 34 years | 0 (0.0%) | 0 (0.0%) |
| 35 to 50 years | 0 (0.0%) | 0 (0.0%) |
| Total | 0 (0.0%) | 0 (0.0%) |
Fertility by Education in Sarah Ann
| Educational Attainment | Women with Births | Births / 1,000 Women |
| Less than High School | 0 (0.0%) | 0.0 |
| High School Diploma | 0 (0.0%) | 0.0 |
| College or Associate's Degree | 0 (0.0%) | 0.0 |
| Bachelor's Degree | 0 (0.0%) | 0.0 |
| Graduate Degree | 0 (0.0%) | 0.0 |
| Total | 0 (0.0%) | 0.0 |
Fertility by Education by Marriage Status in Sarah Ann
| Educational Attainment | Married | Unmarried |
| Less than High School | 0 (0.0%) | 0 (0.0%) |
| High School Diploma | 0 (0.0%) | 0 (0.0%) |
| College or Associate's Degree | 0 (0.0%) | 0 (0.0%) |
| Bachelor's Degree | 0 (0.0%) | 0 (0.0%) |
| Graduate Degree | 0 (0.0%) | 0 (0.0%) |
| Total | 0 (0.0%) | 0 (0.0%) |
Employment Characteristics in Sarah Ann
Employment by Class of Employer in Sarah Ann
Among the 82 employed individuals in Sarah Ann, private company employees (69 | 84.2%), and local government employees (13 | 15.9%) make up the most common classes of employment.
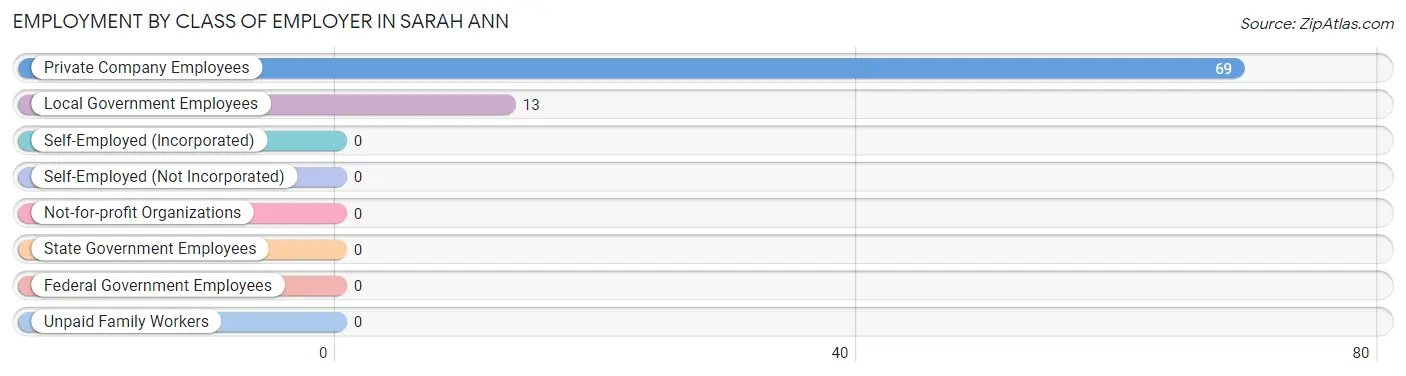
| Employer Class | # Employees | % Employees |
| Private Company Employees | 69 | 84.2% |
| Self-Employed (Incorporated) | 0 | 0.0% |
| Self-Employed (Not Incorporated) | 0 | 0.0% |
| Not-for-profit Organizations | 0 | 0.0% |
| Local Government Employees | 13 | 15.9% |
| State Government Employees | 0 | 0.0% |
| Federal Government Employees | 0 | 0.0% |
| Unpaid Family Workers | 0 | 0.0% |
| Total | 82 | 100.0% |
Employment Status by Age in Sarah Ann
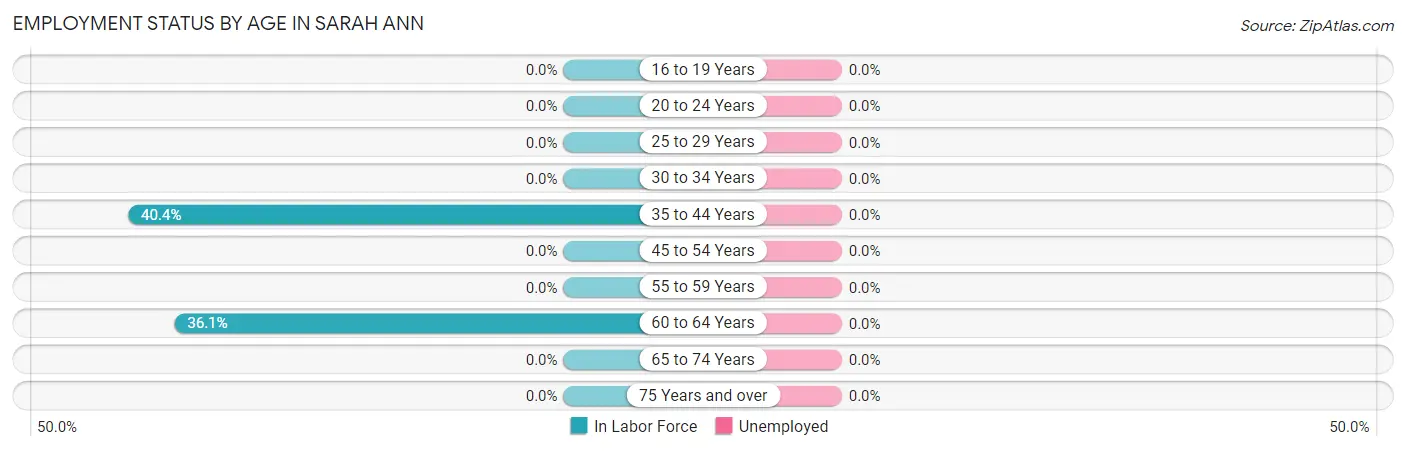
| Age Bracket | In Labor Force | Unemployed |
| 16 to 19 Years | 0 (0.0%) | 0 (0.0%) |
| 20 to 24 Years | 0 (0.0%) | 0 (0.0%) |
| 25 to 29 Years | 0 (0.0%) | 0 (0.0%) |
| 30 to 34 Years | 0 (0.0%) | 0 (0.0%) |
| 35 to 44 Years | 69 (40.4%) | 0 (0.0%) |
| 45 to 54 Years | 0 (0.0%) | 0 (0.0%) |
| 55 to 59 Years | 0 (0.0%) | 0 (0.0%) |
| 60 to 64 Years | 13 (36.1%) | 0 (0.0%) |
| 65 to 74 Years | 0 (0.0%) | 0 (0.0%) |
| 75 Years and over | 0 (0.0%) | 0 (0.0%) |
| Total | 82 (32.2%) | 0 (0.0%) |
Employment Status by Educational Attainment in Sarah Ann
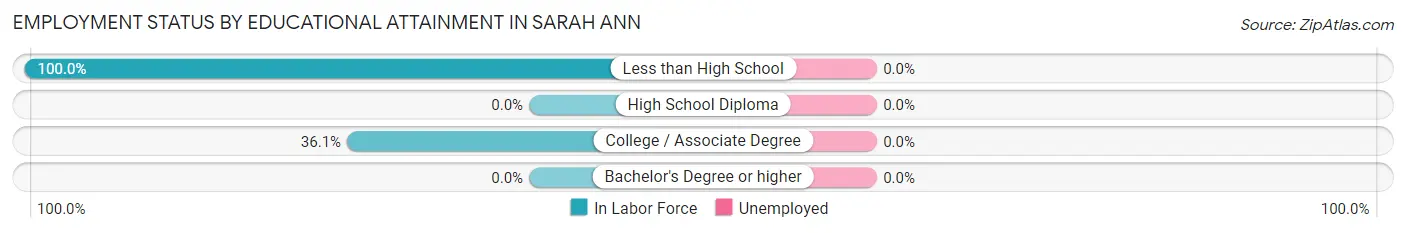
| Educational Attainment | In Labor Force | Unemployed |
| Less than High School | 69 (100.0%) | 0 (0.0%) |
| High School Diploma | 0 (0.0%) | 0 (0.0%) |
| College / Associate Degree | 13 (36.1%) | 0 (0.0%) |
| Bachelor's Degree or higher | 0 (0.0%) | 0 (0.0%) |
| Total | 82 (39.6%) | 0 (0.0%) |
Employment Occupations by Sex in Sarah Ann
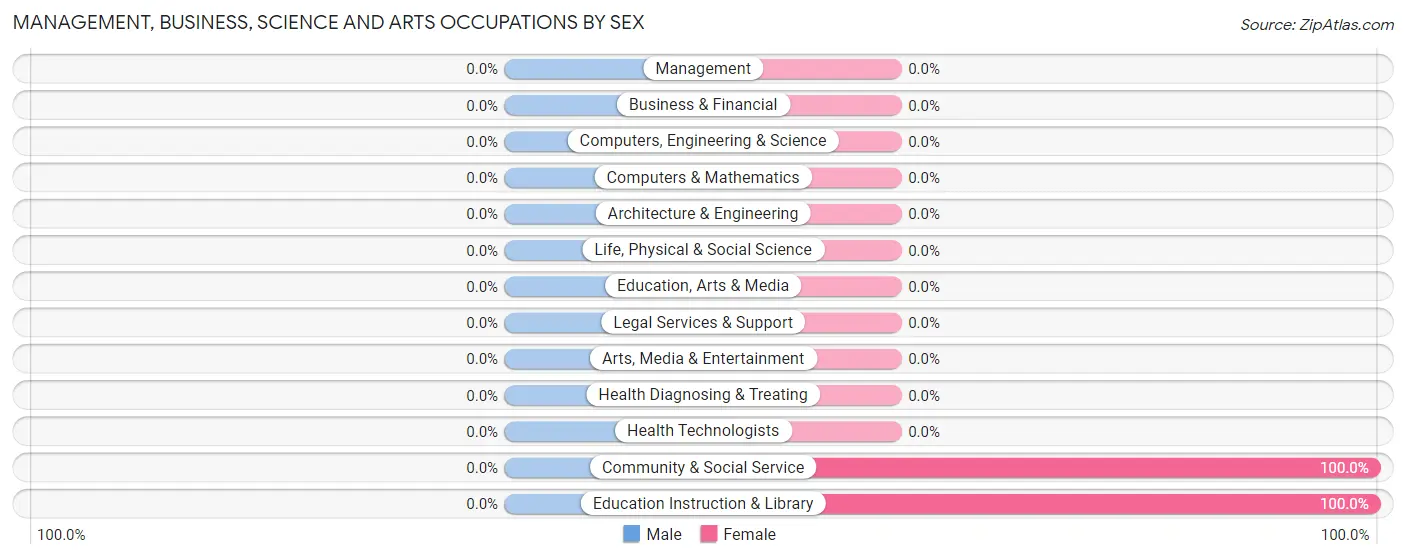
Management, Business, Science and Arts Occupations
The most common Management, Business, Science and Arts occupations in Sarah Ann are Community & Social Service (13 | 15.9%), and Education Instruction & Library (13 | 15.9%).
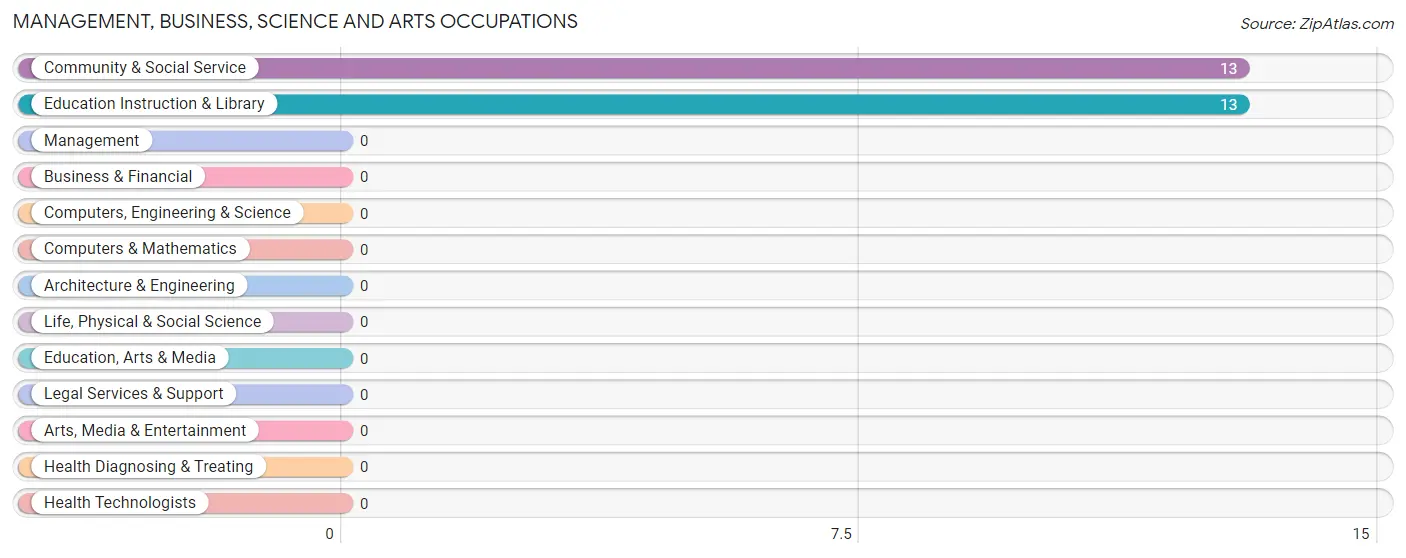
Management, Business, Science and Arts Occupations by Sex
| Occupation | Male | Female |
| Management | 0 (0.0%) | 0 (0.0%) |
| Business & Financial | 0 (0.0%) | 0 (0.0%) |
| Computers, Engineering & Science | 0 (0.0%) | 0 (0.0%) |
| Computers & Mathematics | 0 (0.0%) | 0 (0.0%) |
| Architecture & Engineering | 0 (0.0%) | 0 (0.0%) |
| Life, Physical & Social Science | 0 (0.0%) | 0 (0.0%) |
| Community & Social Service | 0 (0.0%) | 13 (100.0%) |
| Education, Arts & Media | 0 (0.0%) | 0 (0.0%) |
| Legal Services & Support | 0 (0.0%) | 0 (0.0%) |
| Education Instruction & Library | 0 (0.0%) | 13 (100.0%) |
| Arts, Media & Entertainment | 0 (0.0%) | 0 (0.0%) |
| Health Diagnosing & Treating | 0 (0.0%) | 0 (0.0%) |
| Health Technologists | 0 (0.0%) | 0 (0.0%) |
| Total (Category) | 0 (0.0%) | 13 (100.0%) |
| Total (Overall) | 69 (84.2%) | 13 (15.9%) |
Services Occupations
Services Occupations by Sex
| Occupation | Male | Female |
| Healthcare Support | 0 (0.0%) | 0 (0.0%) |
| Security & Protection | 0 (0.0%) | 0 (0.0%) |
| Firefighting & Prevention | 0 (0.0%) | 0 (0.0%) |
| Law Enforcement | 0 (0.0%) | 0 (0.0%) |
| Food Preparation & Serving | 0 (0.0%) | 0 (0.0%) |
| Cleaning & Maintenance | 0 (0.0%) | 0 (0.0%) |
| Personal Care & Service | 0 (0.0%) | 0 (0.0%) |
| Total (Category) | 0 (0.0%) | 0 (0.0%) |
| Total (Overall) | 69 (84.2%) | 13 (15.9%) |
Sales and Office Occupations
Sales and Office Occupations by Sex
| Occupation | Male | Female |
| Sales & Related | 0 (0.0%) | 0 (0.0%) |
| Office & Administration | 0 (0.0%) | 0 (0.0%) |
| Total (Category) | 0 (0.0%) | 0 (0.0%) |
| Total (Overall) | 69 (84.2%) | 13 (15.9%) |
Natural Resources, Construction and Maintenance Occupations
Natural Resources, Construction and Maintenance Occupations by Sex
| Occupation | Male | Female |
| Farming, Fishing & Forestry | 0 (0.0%) | 0 (0.0%) |
| Construction & Extraction | 0 (0.0%) | 0 (0.0%) |
| Installation, Maintenance & Repair | 0 (0.0%) | 0 (0.0%) |
| Total (Category) | 0 (0.0%) | 0 (0.0%) |
| Total (Overall) | 69 (84.2%) | 13 (15.9%) |
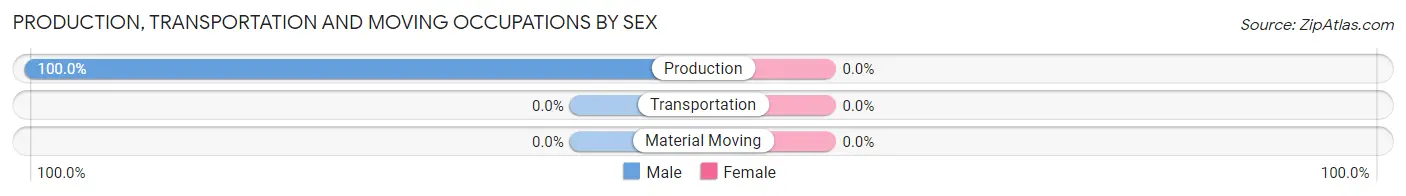
Production, Transportation and Moving Occupations
The most common Production, Transportation and Moving occupations in Sarah Ann are , and Production (69 | 84.2%).
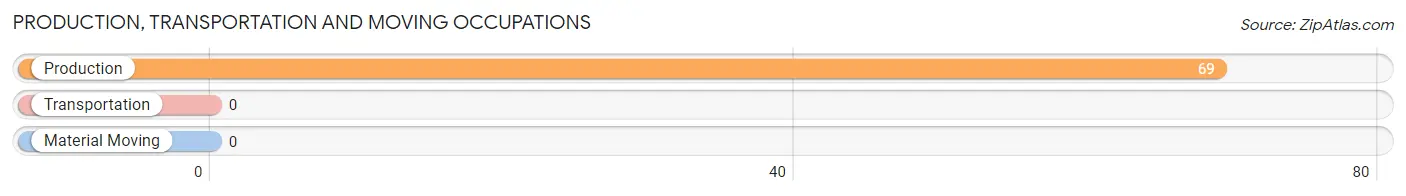
Production, Transportation and Moving Occupations by Sex
| Occupation | Male | Female |
| Production | 69 (100.0%) | 0 (0.0%) |
| Transportation | 0 (0.0%) | 0 (0.0%) |
| Material Moving | 0 (0.0%) | 0 (0.0%) |
| Total (Category) | 69 (100.0%) | 0 (0.0%) |
| Total (Overall) | 69 (84.2%) | 13 (15.9%) |
Employment Industries by Sex in Sarah Ann
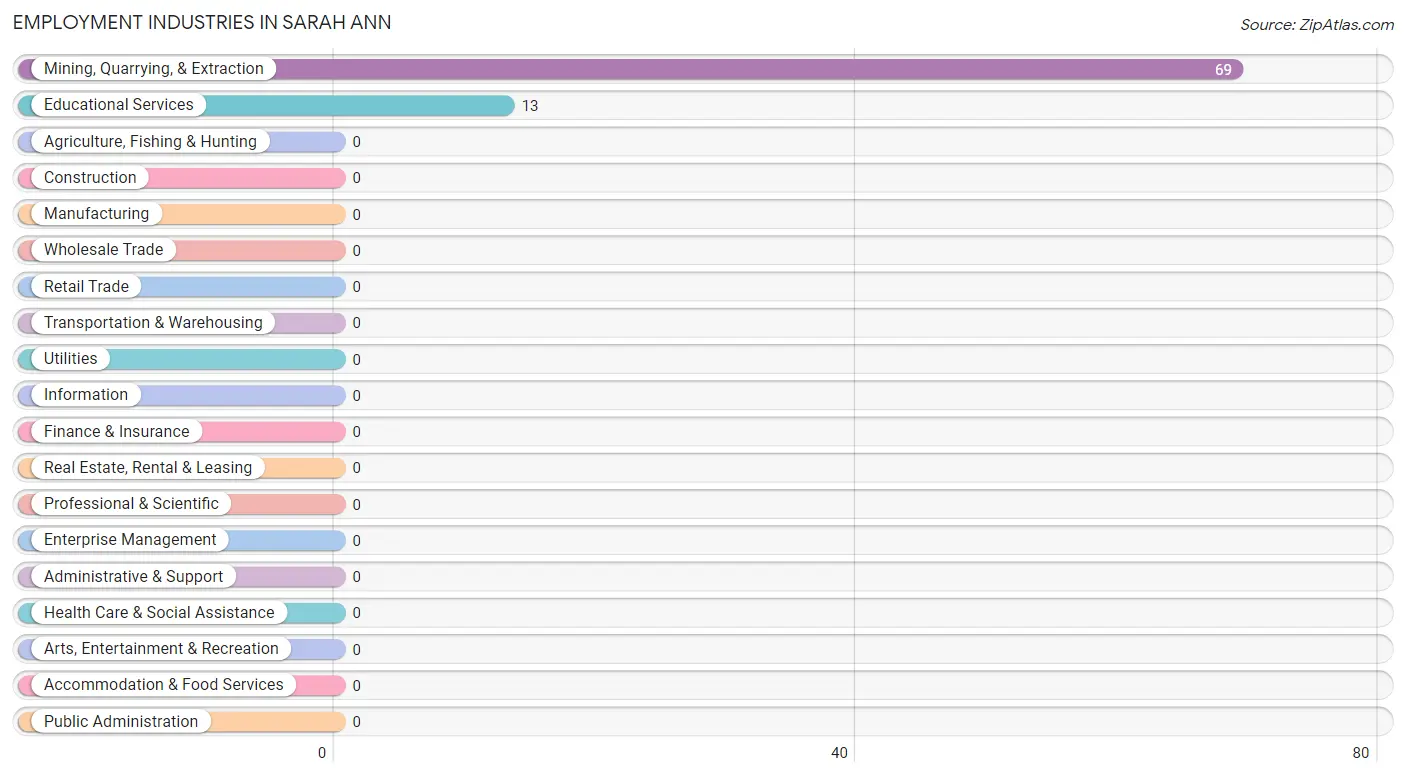
Employment Industries in Sarah Ann
The major employment industries in Sarah Ann include Mining, Quarrying, & Extraction (69 | 84.2%), and Educational Services (13 | 15.9%).
Employment Industries by Sex in Sarah Ann
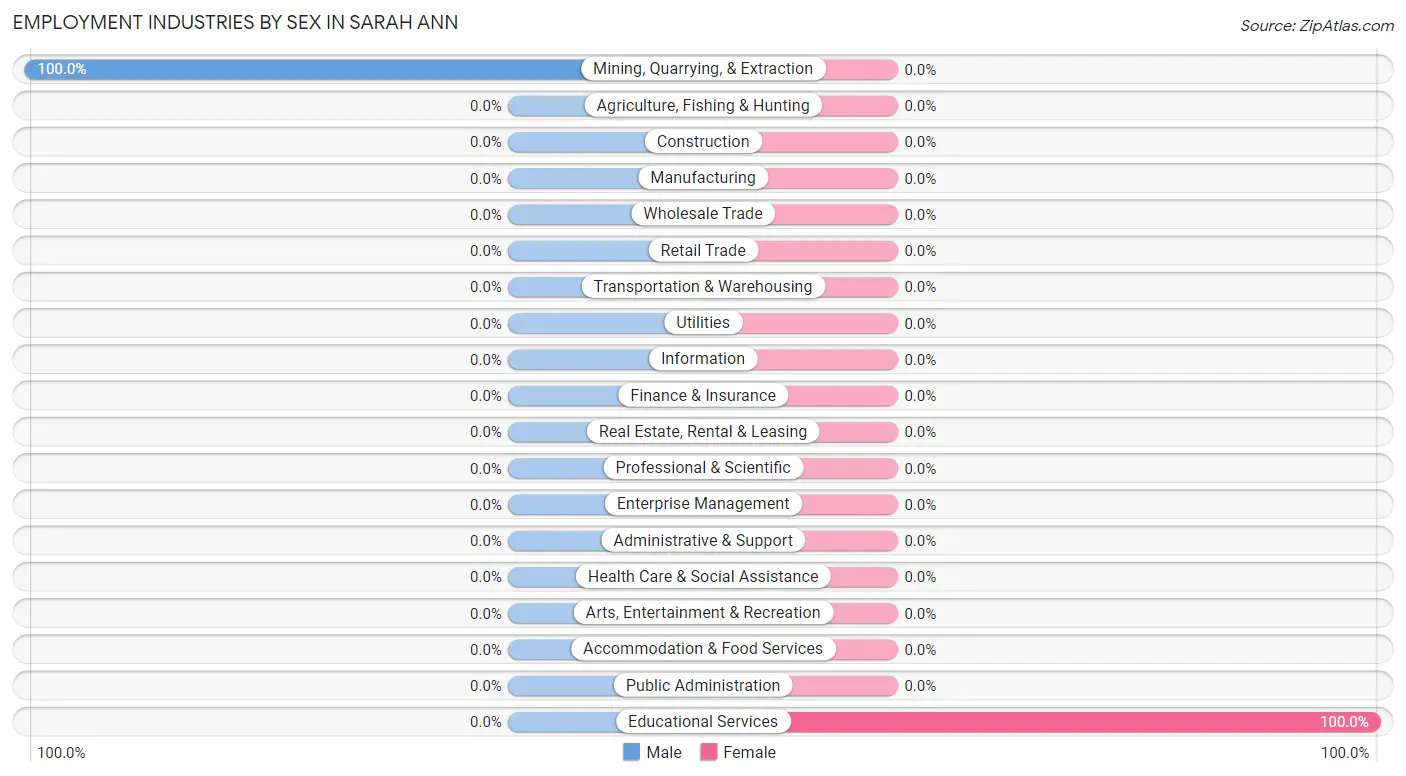
| Industry | Male | Female |
| Agriculture, Fishing & Hunting | 0 (0.0%) | 0 (0.0%) |
| Mining, Quarrying, & Extraction | 69 (100.0%) | 0 (0.0%) |
| Construction | 0 (0.0%) | 0 (0.0%) |
| Manufacturing | 0 (0.0%) | 0 (0.0%) |
| Wholesale Trade | 0 (0.0%) | 0 (0.0%) |
| Retail Trade | 0 (0.0%) | 0 (0.0%) |
| Transportation & Warehousing | 0 (0.0%) | 0 (0.0%) |
| Utilities | 0 (0.0%) | 0 (0.0%) |
| Information | 0 (0.0%) | 0 (0.0%) |
| Finance & Insurance | 0 (0.0%) | 0 (0.0%) |
| Real Estate, Rental & Leasing | 0 (0.0%) | 0 (0.0%) |
| Professional & Scientific | 0 (0.0%) | 0 (0.0%) |
| Enterprise Management | 0 (0.0%) | 0 (0.0%) |
| Administrative & Support | 0 (0.0%) | 0 (0.0%) |
| Educational Services | 0 (0.0%) | 13 (100.0%) |
| Health Care & Social Assistance | 0 (0.0%) | 0 (0.0%) |
| Arts, Entertainment & Recreation | 0 (0.0%) | 0 (0.0%) |
| Accommodation & Food Services | 0 (0.0%) | 0 (0.0%) |
| Public Administration | 0 (0.0%) | 0 (0.0%) |
| Total | 69 (84.2%) | 13 (15.9%) |
Education in Sarah Ann
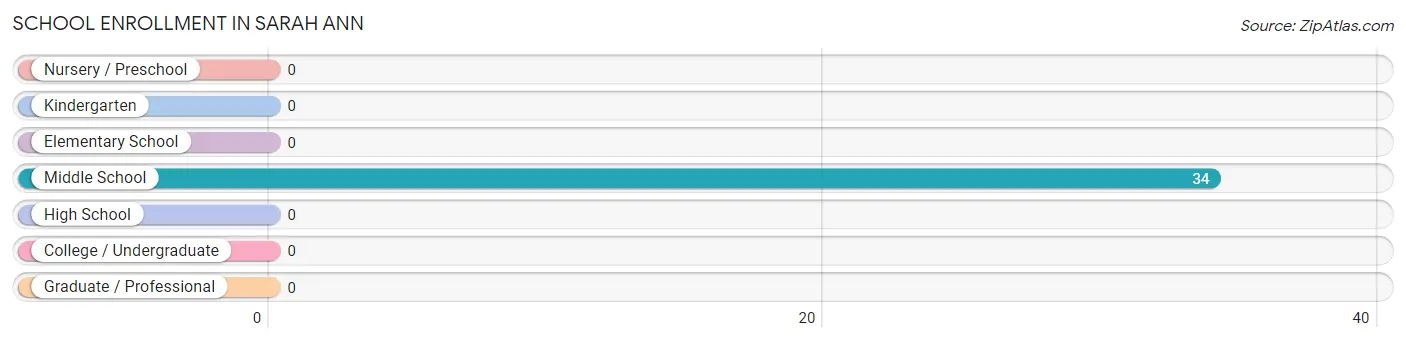
School Enrollment in Sarah Ann
| School Level | # Students | % Students |
| Nursery / Preschool | 0 | 0.0% |
| Kindergarten | 0 | 0.0% |
| Elementary School | 0 | 0.0% |
| Middle School | 34 | 100.0% |
| High School | 0 | 0.0% |
| College / Undergraduate | 0 | 0.0% |
| Graduate / Professional | 0 | 0.0% |
| Total | 34 | 100.0% |
School Enrollment by Age by Funding Source in Sarah Ann
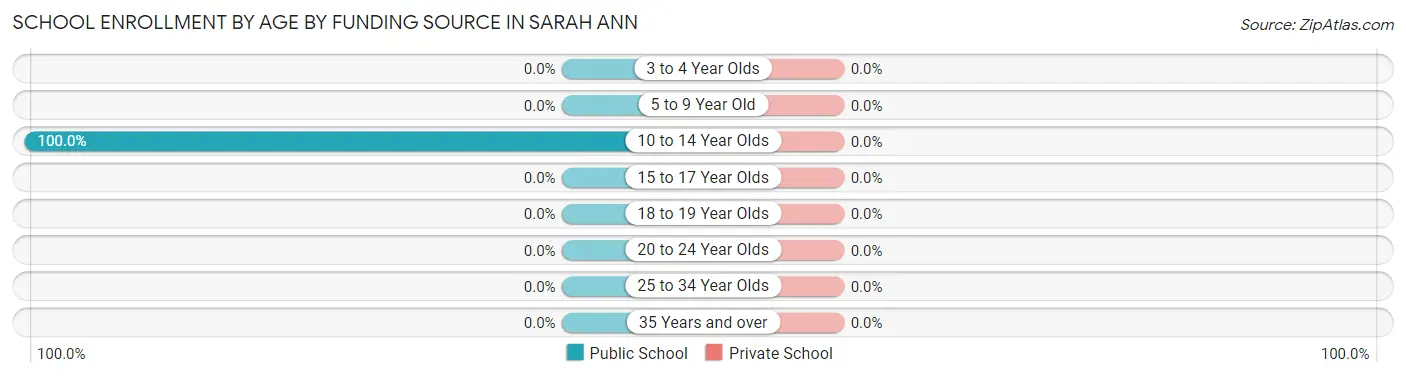
| Age Bracket | Public School | Private School |
| 3 to 4 Year Olds | 0 (0.0%) | 0 (0.0%) |
| 5 to 9 Year Old | 0 (0.0%) | 0 (0.0%) |
| 10 to 14 Year Olds | 34 (100.0%) | 0 (0.0%) |
| 15 to 17 Year Olds | 0 (0.0%) | 0 (0.0%) |
| 18 to 19 Year Olds | 0 (0.0%) | 0 (0.0%) |
| 20 to 24 Year Olds | 0 (0.0%) | 0 (0.0%) |
| 25 to 34 Year Olds | 0 (0.0%) | 0 (0.0%) |
| 35 Years and over | 0 (0.0%) | 0 (0.0%) |
| Total | 34 (100.0%) | 0 (0.0%) |
Educational Attainment by Field of Study in Sarah Ann
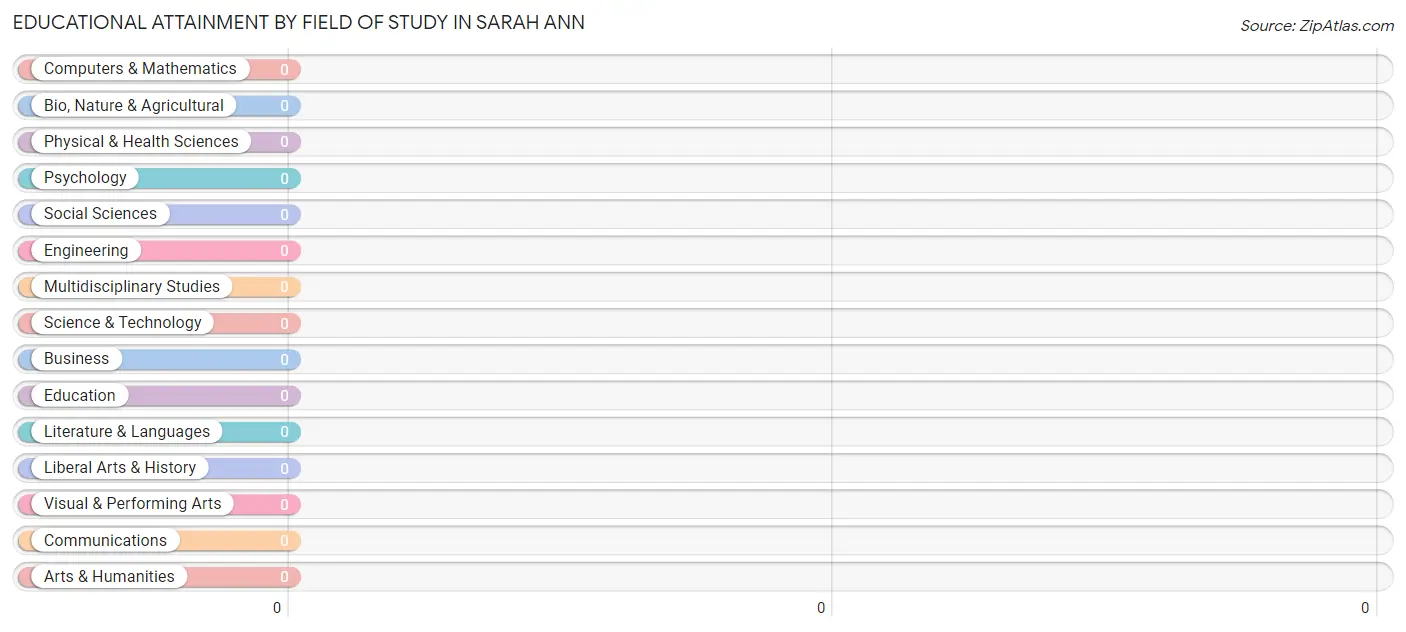
| Field of Study | # Graduates | % Graduates |
| Computers & Mathematics | 0 | 0.0% |
| Bio, Nature & Agricultural | 0 | 0.0% |
| Physical & Health Sciences | 0 | 0.0% |
| Psychology | 0 | 0.0% |
| Social Sciences | 0 | 0.0% |
| Engineering | 0 | 0.0% |
| Multidisciplinary Studies | 0 | 0.0% |
| Science & Technology | 0 | 0.0% |
| Business | 0 | 0.0% |
| Education | 0 | 0.0% |
| Literature & Languages | 0 | 0.0% |
| Liberal Arts & History | 0 | 0.0% |
| Visual & Performing Arts | 0 | 0.0% |
| Communications | 0 | 0.0% |
| Arts & Humanities | 0 | 0.0% |
| Total | 0 | 0.0% |
Transportation & Commute in Sarah Ann
Vehicle Availability by Sex in Sarah Ann
The most prevalent vehicle ownership categories in Sarah Ann are males with 3 vehicles (69, accounting for 100.0%) and females with 3 vehicles (0, making up 530.8%).
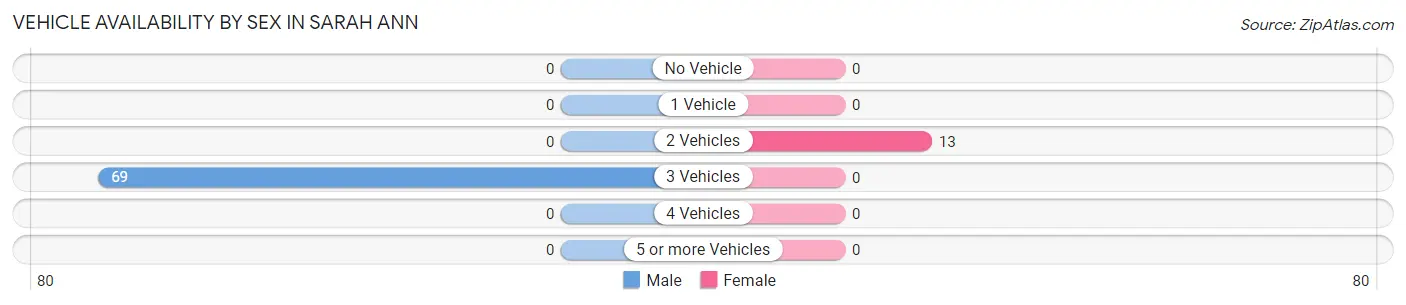
| Vehicles Available | Male | Female |
| No Vehicle | 0 (0.0%) | 0 (0.0%) |
| 1 Vehicle | 0 (0.0%) | 0 (0.0%) |
| 2 Vehicles | 0 (0.0%) | 13 (100.0%) |
| 3 Vehicles | 69 (100.0%) | 0 (0.0%) |
| 4 Vehicles | 0 (0.0%) | 0 (0.0%) |
| 5 or more Vehicles | 0 (0.0%) | 0 (0.0%) |
| Total | 69 (100.0%) | 13 (100.0%) |
Commute Time in Sarah Ann
The most frequently occuring commute durations in Sarah Ann are 30 to 34 minutes (69 commuters, 84.2%), 15 to 19 minutes (13 commuters, 15.9%), and less than 5 minutes (0 commuters, 0.0%).
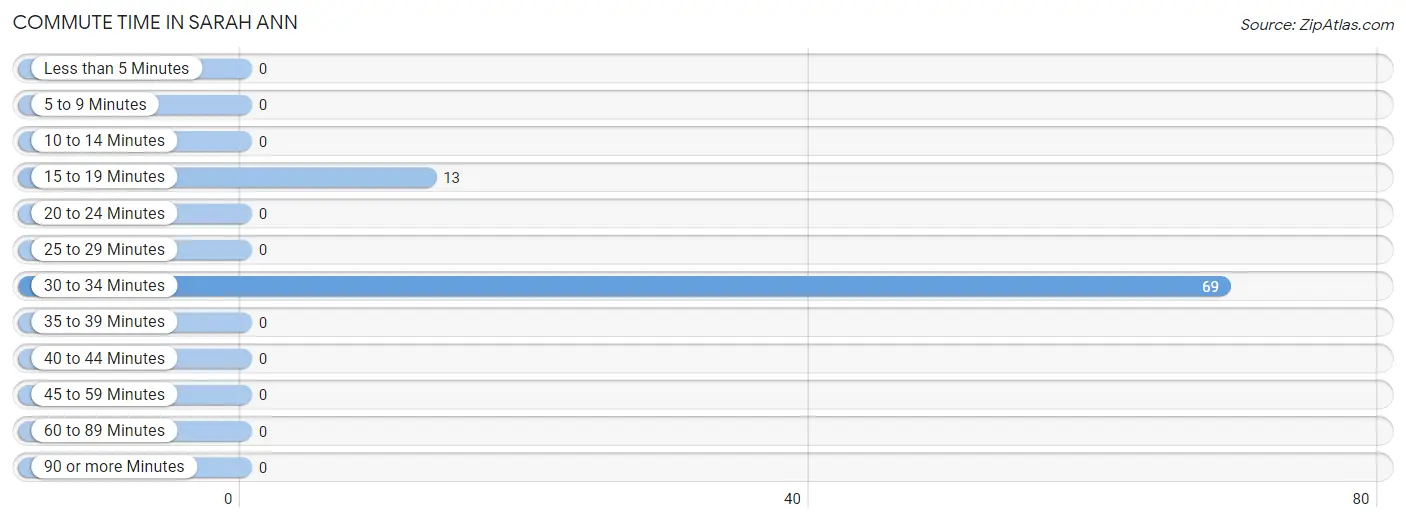
| Commute Time | # Commuters | % Commuters |
| Less than 5 Minutes | 0 | 0.0% |
| 5 to 9 Minutes | 0 | 0.0% |
| 10 to 14 Minutes | 0 | 0.0% |
| 15 to 19 Minutes | 13 | 15.9% |
| 20 to 24 Minutes | 0 | 0.0% |
| 25 to 29 Minutes | 0 | 0.0% |
| 30 to 34 Minutes | 69 | 84.2% |
| 35 to 39 Minutes | 0 | 0.0% |
| 40 to 44 Minutes | 0 | 0.0% |
| 45 to 59 Minutes | 0 | 0.0% |
| 60 to 89 Minutes | 0 | 0.0% |
| 90 or more Minutes | 0 | 0.0% |
Commute Time by Sex in Sarah Ann
The most common commute times in Sarah Ann are 30 to 34 minutes (69 commuters, 100.0%) for males and 15 to 19 minutes (13 commuters, 100.0%) for females.
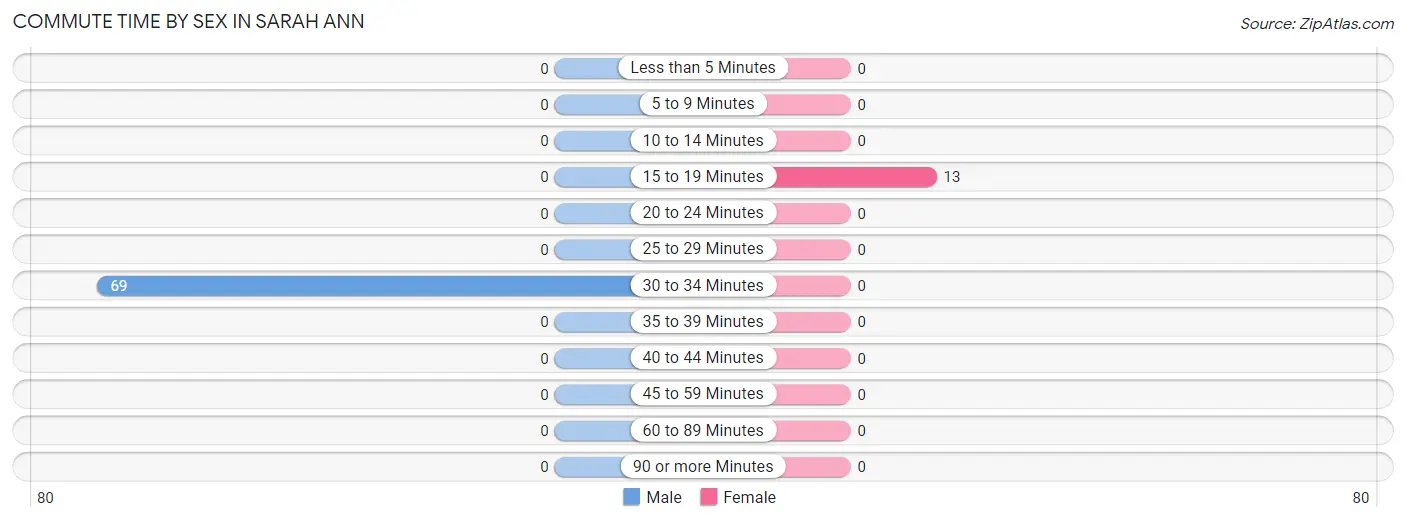
| Commute Time | Male | Female |
| Less than 5 Minutes | 0 (0.0%) | 0 (0.0%) |
| 5 to 9 Minutes | 0 (0.0%) | 0 (0.0%) |
| 10 to 14 Minutes | 0 (0.0%) | 0 (0.0%) |
| 15 to 19 Minutes | 0 (0.0%) | 13 (100.0%) |
| 20 to 24 Minutes | 0 (0.0%) | 0 (0.0%) |
| 25 to 29 Minutes | 0 (0.0%) | 0 (0.0%) |
| 30 to 34 Minutes | 69 (100.0%) | 0 (0.0%) |
| 35 to 39 Minutes | 0 (0.0%) | 0 (0.0%) |
| 40 to 44 Minutes | 0 (0.0%) | 0 (0.0%) |
| 45 to 59 Minutes | 0 (0.0%) | 0 (0.0%) |
| 60 to 89 Minutes | 0 (0.0%) | 0 (0.0%) |
| 90 or more Minutes | 0 (0.0%) | 0 (0.0%) |
Time of Departure to Work by Sex in Sarah Ann
The most frequent times of departure to work in Sarah Ann are 4:00 PM to 11:59 PM (69, 100.0%) for males and 7:00 AM to 7:29 AM (13, 100.0%) for females.
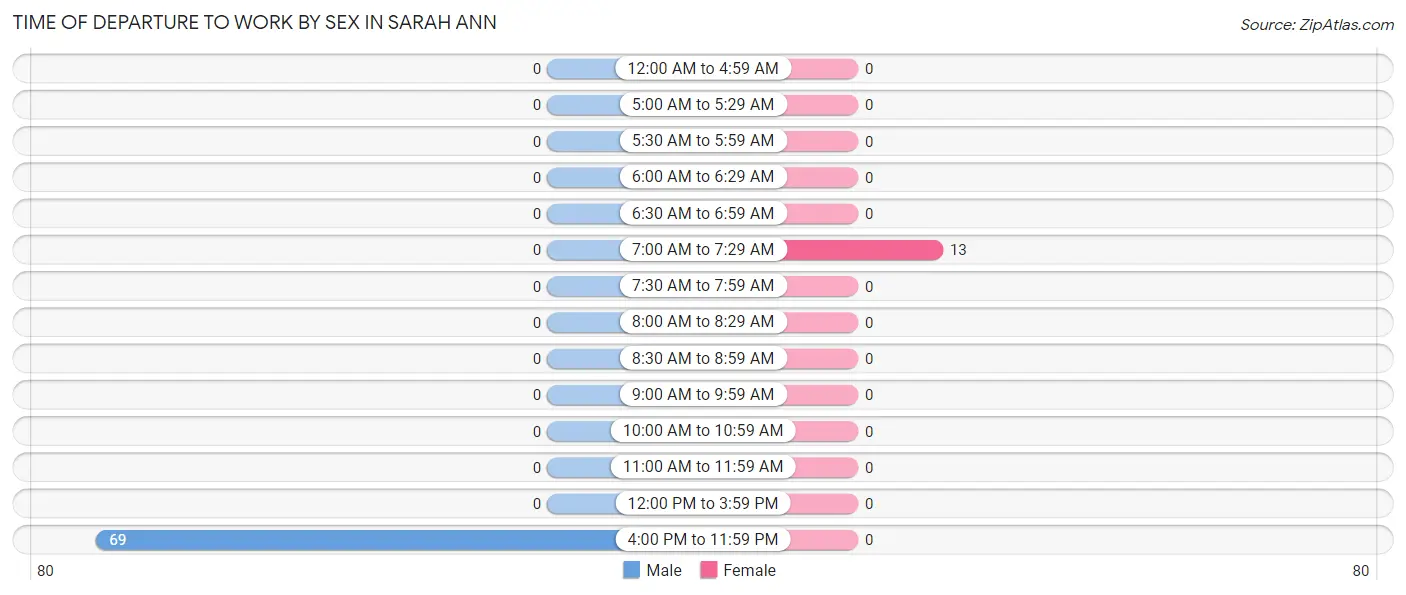
| Time of Departure | Male | Female |
| 12:00 AM to 4:59 AM | 0 (0.0%) | 0 (0.0%) |
| 5:00 AM to 5:29 AM | 0 (0.0%) | 0 (0.0%) |
| 5:30 AM to 5:59 AM | 0 (0.0%) | 0 (0.0%) |
| 6:00 AM to 6:29 AM | 0 (0.0%) | 0 (0.0%) |
| 6:30 AM to 6:59 AM | 0 (0.0%) | 0 (0.0%) |
| 7:00 AM to 7:29 AM | 0 (0.0%) | 13 (100.0%) |
| 7:30 AM to 7:59 AM | 0 (0.0%) | 0 (0.0%) |
| 8:00 AM to 8:29 AM | 0 (0.0%) | 0 (0.0%) |
| 8:30 AM to 8:59 AM | 0 (0.0%) | 0 (0.0%) |
| 9:00 AM to 9:59 AM | 0 (0.0%) | 0 (0.0%) |
| 10:00 AM to 10:59 AM | 0 (0.0%) | 0 (0.0%) |
| 11:00 AM to 11:59 AM | 0 (0.0%) | 0 (0.0%) |
| 12:00 PM to 3:59 PM | 0 (0.0%) | 0 (0.0%) |
| 4:00 PM to 11:59 PM | 69 (100.0%) | 0 (0.0%) |
| Total | 69 (100.0%) | 13 (100.0%) |
Housing Occupancy in Sarah Ann
Occupancy by Ownership in Sarah Ann
Of the total 128 dwellings in Sarah Ann, owner-occupied units account for 128 (100.0%), while renter-occupied units make up 0 (0.0%).
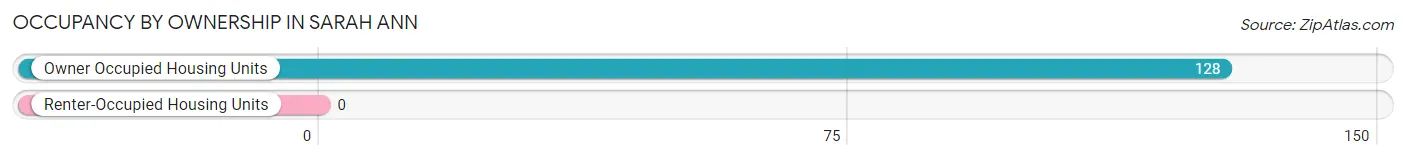
| Occupancy | # Housing Units | % Housing Units |
| Owner Occupied Housing Units | 128 | 100.0% |
| Renter-Occupied Housing Units | 0 | 0.0% |
| Total Occupied Housing Units | 128 | 100.0% |
Occupancy by Household Size in Sarah Ann
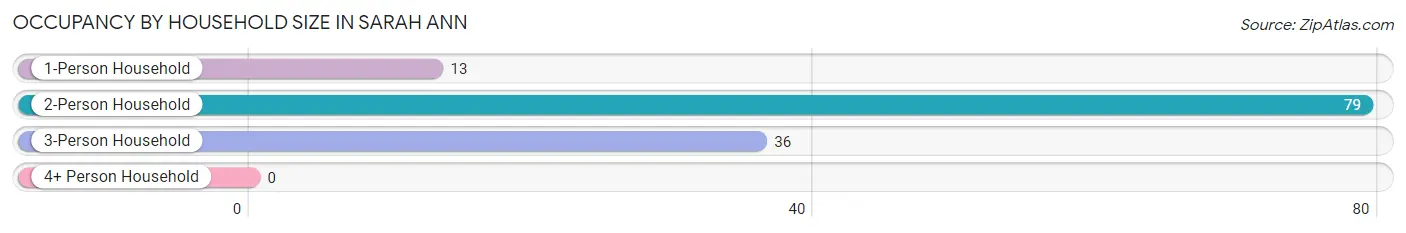
| Household Size | # Housing Units | % Housing Units |
| 1-Person Household | 13 | 10.2% |
| 2-Person Household | 79 | 61.7% |
| 3-Person Household | 36 | 28.1% |
| 4+ Person Household | 0 | 0.0% |
| Total Housing Units | 128 | 100.0% |
Occupancy by Ownership by Household Size in Sarah Ann
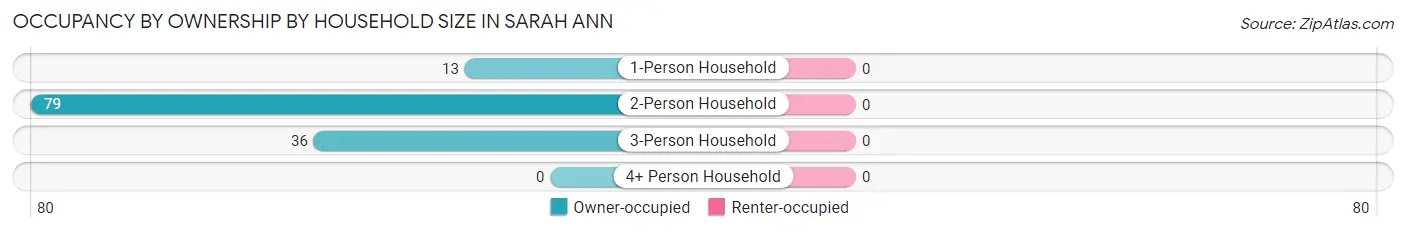
| Household Size | Owner-occupied | Renter-occupied |
| 1-Person Household | 13 (100.0%) | 0 (0.0%) |
| 2-Person Household | 79 (100.0%) | 0 (0.0%) |
| 3-Person Household | 36 (100.0%) | 0 (0.0%) |
| 4+ Person Household | 0 (0.0%) | 0 (0.0%) |
| Total Housing Units | 128 (100.0%) | 0 (0.0%) |
Occupancy by Educational Attainment in Sarah Ann
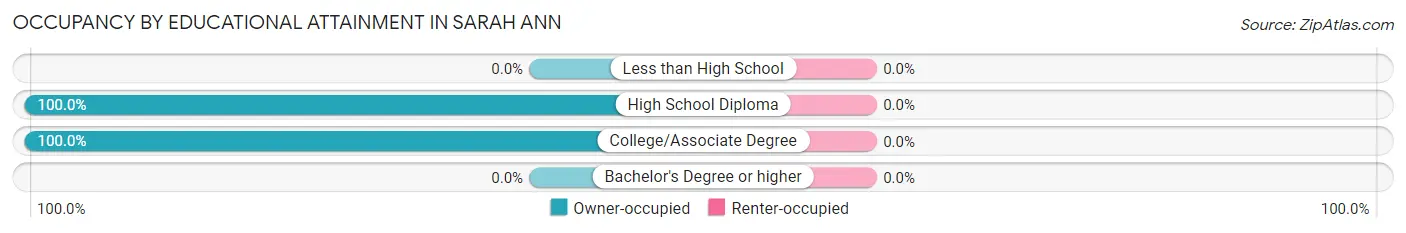
| Household Size | Owner-occupied | Renter-occupied |
| Less than High School | 0 (0.0%) | 0 (0.0%) |
| High School Diploma | 92 (100.0%) | 0 (0.0%) |
| College/Associate Degree | 36 (100.0%) | 0 (0.0%) |
| Bachelor's Degree or higher | 0 (0.0%) | 0 (0.0%) |
Occupancy by Age of Householder in Sarah Ann
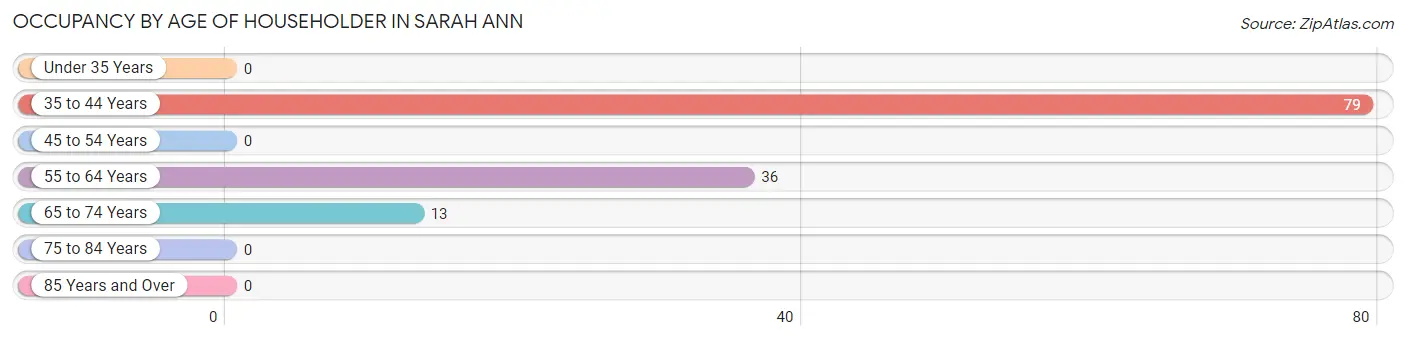
| Age Bracket | # Households | % Households |
| Under 35 Years | 0 | 0.0% |
| 35 to 44 Years | 79 | 61.7% |
| 45 to 54 Years | 0 | 0.0% |
| 55 to 64 Years | 36 | 28.1% |
| 65 to 74 Years | 13 | 10.2% |
| 75 to 84 Years | 0 | 0.0% |
| 85 Years and Over | 0 | 0.0% |
| Total | 128 | 100.0% |
Housing Finances in Sarah Ann
Median Income by Occupancy in Sarah Ann
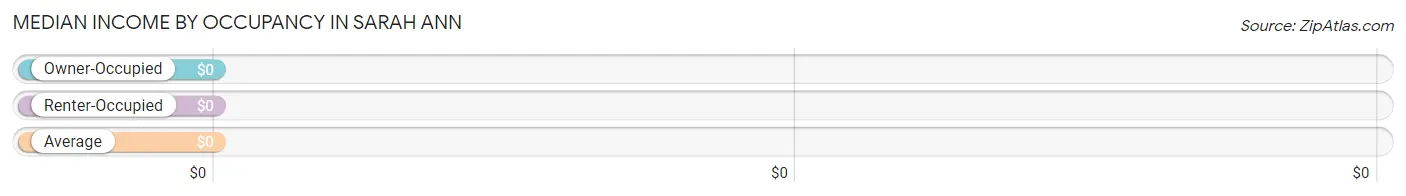
| Occupancy Type | # Households | Median Income |
| Owner-Occupied | 128 (100.0%) | $0 |
| Renter-Occupied | 0 (0.0%) | $0 |
| Average | 128 (100.0%) | $0 |
Occupancy by Householder Income Bracket in Sarah Ann
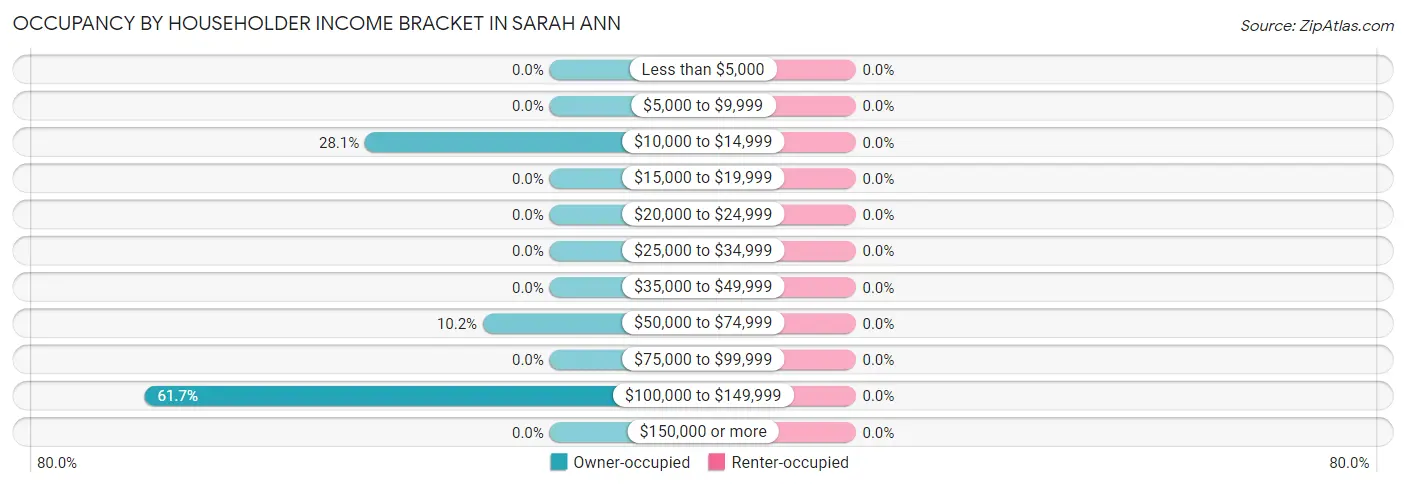
| Income Bracket | Owner-occupied | Renter-occupied |
| Less than $5,000 | 0 (0.0%) | 0 (0.0%) |
| $5,000 to $9,999 | 0 (0.0%) | 0 (0.0%) |
| $10,000 to $14,999 | 36 (28.1%) | 0 (0.0%) |
| $15,000 to $19,999 | 0 (0.0%) | 0 (0.0%) |
| $20,000 to $24,999 | 0 (0.0%) | 0 (0.0%) |
| $25,000 to $34,999 | 0 (0.0%) | 0 (0.0%) |
| $35,000 to $49,999 | 0 (0.0%) | 0 (0.0%) |
| $50,000 to $74,999 | 13 (10.2%) | 0 (0.0%) |
| $75,000 to $99,999 | 0 (0.0%) | 0 (0.0%) |
| $100,000 to $149,999 | 79 (61.7%) | 0 (0.0%) |
| $150,000 or more | 0 (0.0%) | 0 (0.0%) |
| Total | 128 (100.0%) | 0 (0.0%) |
Monthly Housing Cost Tiers in Sarah Ann
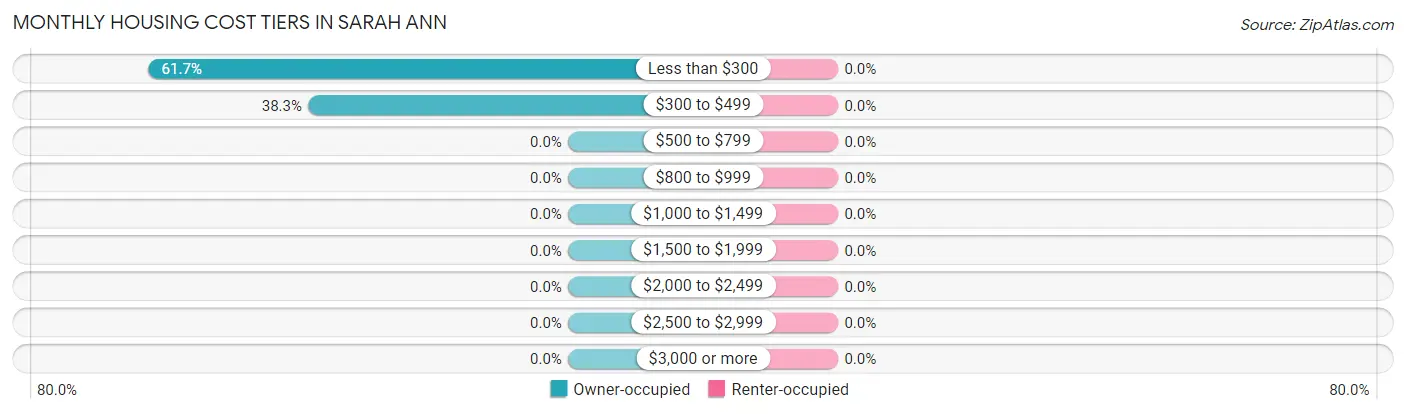
| Monthly Cost | Owner-occupied | Renter-occupied |
| Less than $300 | 79 (61.7%) | 0 (0.0%) |
| $300 to $499 | 49 (38.3%) | 0 (0.0%) |
| $500 to $799 | 0 (0.0%) | 0 (0.0%) |
| $800 to $999 | 0 (0.0%) | 0 (0.0%) |
| $1,000 to $1,499 | 0 (0.0%) | 0 (0.0%) |
| $1,500 to $1,999 | 0 (0.0%) | 0 (0.0%) |
| $2,000 to $2,499 | 0 (0.0%) | 0 (0.0%) |
| $2,500 to $2,999 | 0 (0.0%) | 0 (0.0%) |
| $3,000 or more | 0 (0.0%) | 0 (0.0%) |
| Total | 128 (100.0%) | 0 (0.0%) |
Physical Housing Characteristics in Sarah Ann
Housing Structures in Sarah Ann
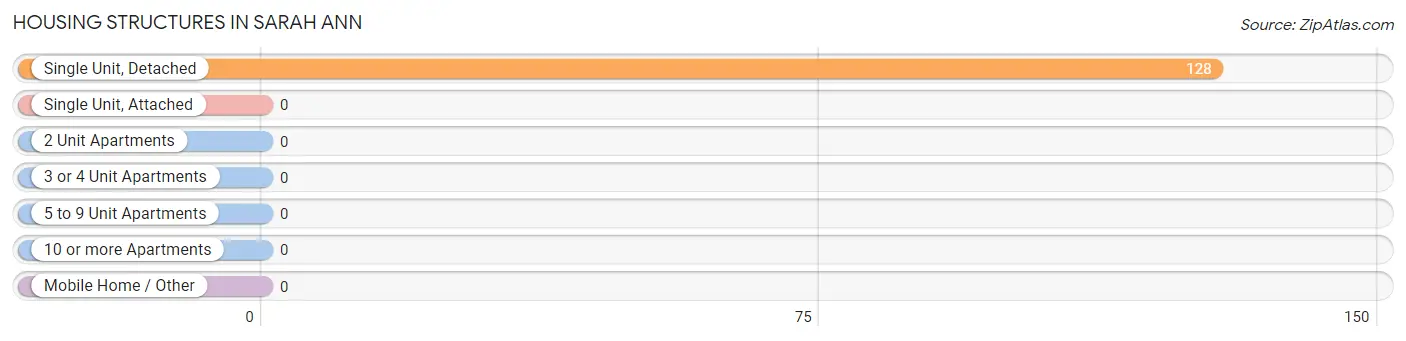
| Structure Type | # Housing Units | % Housing Units |
| Single Unit, Detached | 128 | 100.0% |
| Single Unit, Attached | 0 | 0.0% |
| 2 Unit Apartments | 0 | 0.0% |
| 3 or 4 Unit Apartments | 0 | 0.0% |
| 5 to 9 Unit Apartments | 0 | 0.0% |
| 10 or more Apartments | 0 | 0.0% |
| Mobile Home / Other | 0 | 0.0% |
| Total | 128 | 100.0% |
Housing Structures by Occupancy in Sarah Ann
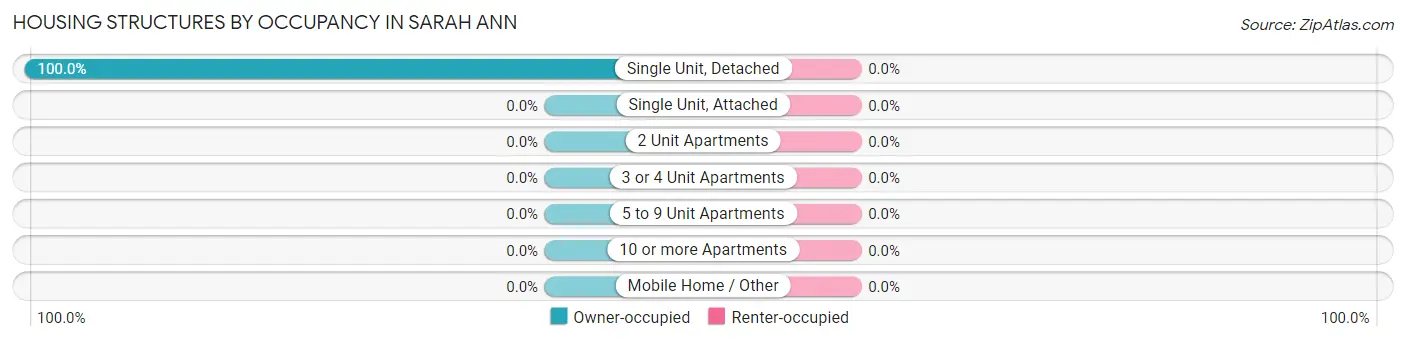
| Structure Type | Owner-occupied | Renter-occupied |
| Single Unit, Detached | 128 (100.0%) | 0 (0.0%) |
| Single Unit, Attached | 0 (0.0%) | 0 (0.0%) |
| 2 Unit Apartments | 0 (0.0%) | 0 (0.0%) |
| 3 or 4 Unit Apartments | 0 (0.0%) | 0 (0.0%) |
| 5 to 9 Unit Apartments | 0 (0.0%) | 0 (0.0%) |
| 10 or more Apartments | 0 (0.0%) | 0 (0.0%) |
| Mobile Home / Other | 0 (0.0%) | 0 (0.0%) |
| Total | 128 (100.0%) | 0 (0.0%) |
Housing Structures by Number of Rooms in Sarah Ann
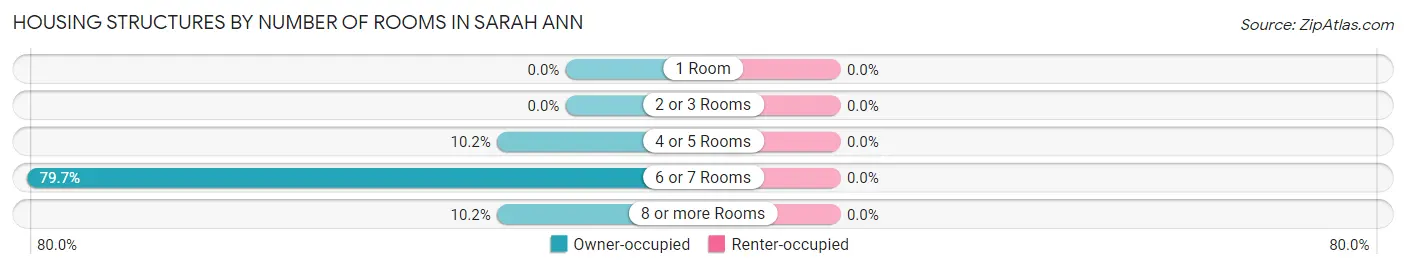
| Number of Rooms | Owner-occupied | Renter-occupied |
| 1 Room | 0 (0.0%) | 0 (0.0%) |
| 2 or 3 Rooms | 0 (0.0%) | 0 (0.0%) |
| 4 or 5 Rooms | 13 (10.2%) | 0 (0.0%) |
| 6 or 7 Rooms | 102 (79.7%) | 0 (0.0%) |
| 8 or more Rooms | 13 (10.2%) | 0 (0.0%) |
| Total | 128 (100.0%) | 0 (0.0%) |
Housing Structure by Heating Type in Sarah Ann
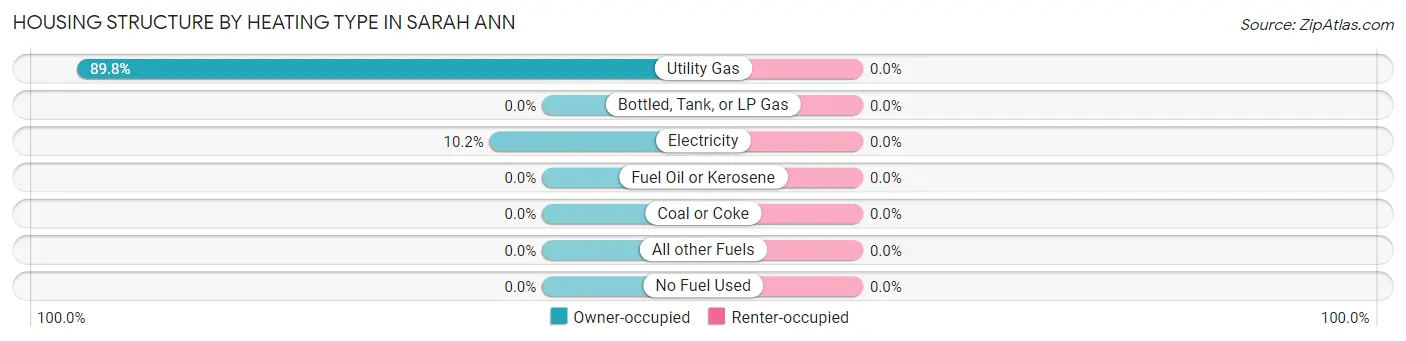
| Heating Type | Owner-occupied | Renter-occupied |
| Utility Gas | 115 (89.8%) | 0 (0.0%) |
| Bottled, Tank, or LP Gas | 0 (0.0%) | 0 (0.0%) |
| Electricity | 13 (10.2%) | 0 (0.0%) |
| Fuel Oil or Kerosene | 0 (0.0%) | 0 (0.0%) |
| Coal or Coke | 0 (0.0%) | 0 (0.0%) |
| All other Fuels | 0 (0.0%) | 0 (0.0%) |
| No Fuel Used | 0 (0.0%) | 0 (0.0%) |
| Total | 128 (100.0%) | 0 (0.0%) |
Household Vehicle Usage in Sarah Ann
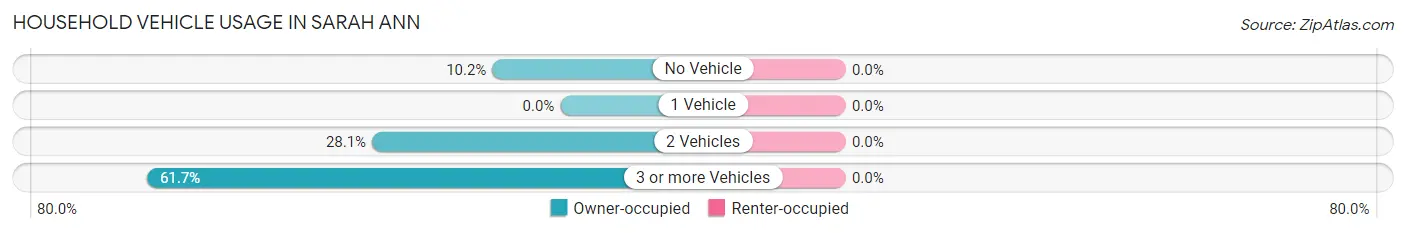
| Vehicles per Household | Owner-occupied | Renter-occupied |
| No Vehicle | 13 (10.2%) | 0 (0.0%) |
| 1 Vehicle | 0 (0.0%) | 0 (0.0%) |
| 2 Vehicles | 36 (28.1%) | 0 (0.0%) |
| 3 or more Vehicles | 79 (61.7%) | 0 (0.0%) |
| Total | 128 (100.0%) | 0 (0.0%) |
Real Estate & Mortgages in Sarah Ann
Real Estate and Mortgage Overview in Sarah Ann
| Characteristic | Without Mortgage | With Mortgage |
| Housing Units | 115 | 13 |
| Median Property Value | $57,300 | $0 |
| Median Household Income | $115,680 | $0 |
| Monthly Housing Costs | $286 | $0 |
| Real Estate Taxes | $654 | $0 |
Property Value by Mortgage Status in Sarah Ann
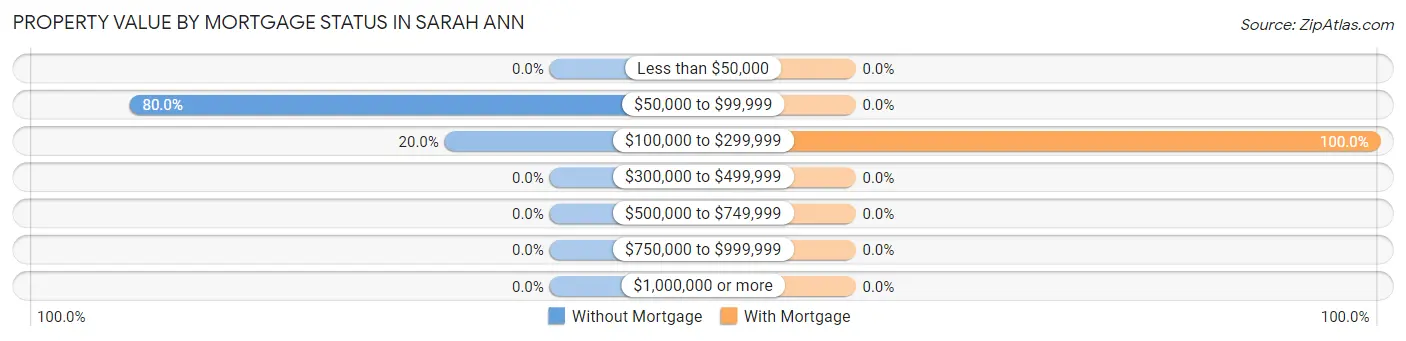
| Property Value | Without Mortgage | With Mortgage |
| Less than $50,000 | 0 (0.0%) | 0 (0.0%) |
| $50,000 to $99,999 | 92 (80.0%) | 0 (0.0%) |
| $100,000 to $299,999 | 23 (20.0%) | 13 (100.0%) |
| $300,000 to $499,999 | 0 (0.0%) | 0 (0.0%) |
| $500,000 to $749,999 | 0 (0.0%) | 0 (0.0%) |
| $750,000 to $999,999 | 0 (0.0%) | 0 (0.0%) |
| $1,000,000 or more | 0 (0.0%) | 0 (0.0%) |
| Total | 115 (100.0%) | 13 (100.0%) |
Household Income by Mortgage Status in Sarah Ann
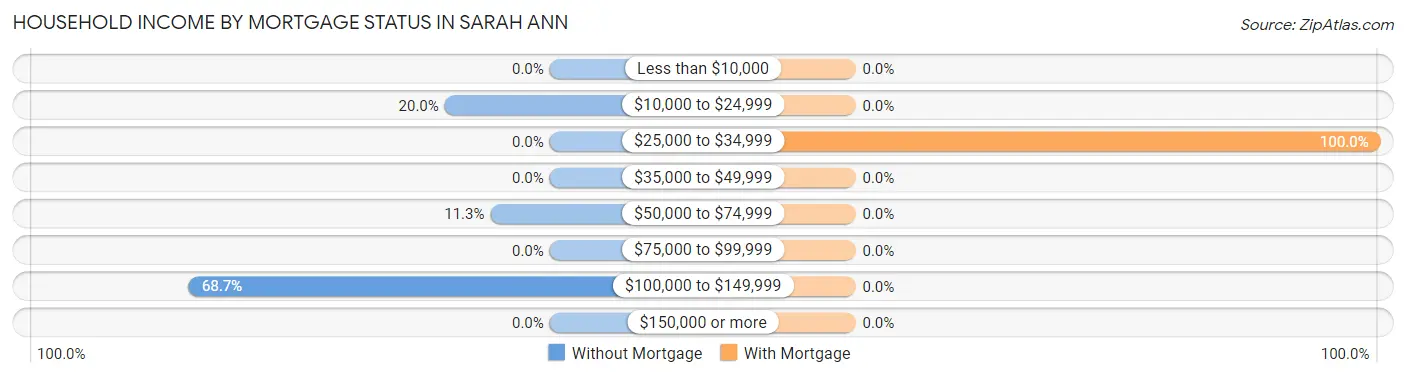
| Household Income | Without Mortgage | With Mortgage |
| Less than $10,000 | 0 (0.0%) | 0 (0.0%) |
| $10,000 to $24,999 | 23 (20.0%) | 0 (0.0%) |
| $25,000 to $34,999 | 0 (0.0%) | 13 (100.0%) |
| $35,000 to $49,999 | 0 (0.0%) | 0 (0.0%) |
| $50,000 to $74,999 | 13 (11.3%) | 0 (0.0%) |
| $75,000 to $99,999 | 0 (0.0%) | 0 (0.0%) |
| $100,000 to $149,999 | 79 (68.7%) | 0 (0.0%) |
| $150,000 or more | 0 (0.0%) | 0 (0.0%) |
| Total | 115 (100.0%) | 13 (100.0%) |
Property Value to Household Income Ratio in Sarah Ann
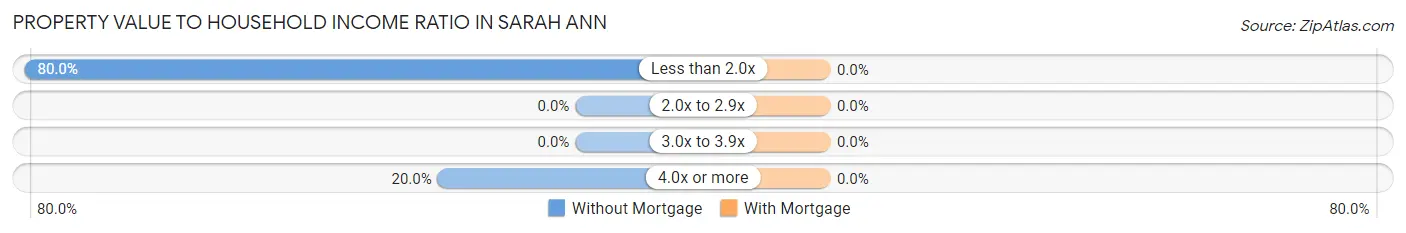
| Value-to-Income Ratio | Without Mortgage | With Mortgage |
| Less than 2.0x | 92 (80.0%) | 0 (0.0%) |
| 2.0x to 2.9x | 0 (0.0%) | 0 (0.0%) |
| 3.0x to 3.9x | 0 (0.0%) | 0 (0.0%) |
| 4.0x or more | 23 (20.0%) | 0 (0.0%) |
| Total | 115 (100.0%) | 13 (100.0%) |
Real Estate Taxes by Mortgage Status in Sarah Ann
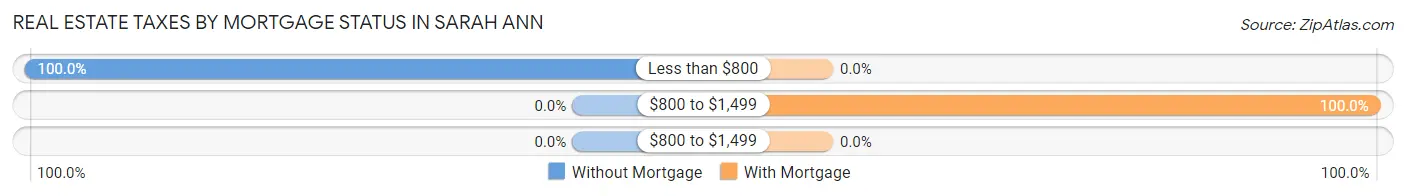
| Property Taxes | Without Mortgage | With Mortgage |
| Less than $800 | 115 (100.0%) | 0 (0.0%) |
| $800 to $1,499 | 0 (0.0%) | 13 (100.0%) |
| $800 to $1,499 | 0 (0.0%) | 0 (0.0%) |
| Total | 115 (100.0%) | 13 (100.0%) |
Health & Disability in Sarah Ann
Health Insurance Coverage by Age in Sarah Ann
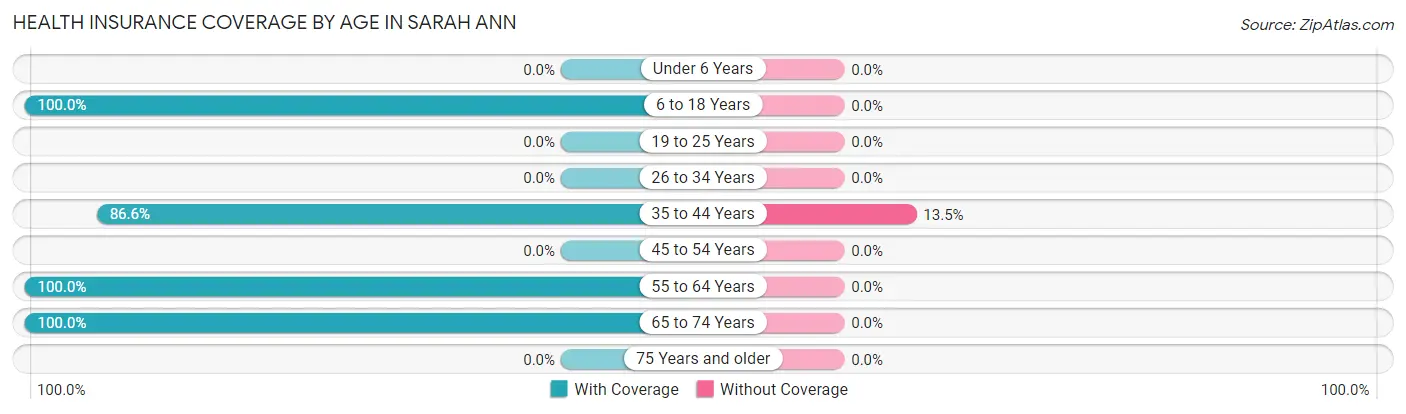
| Age Bracket | With Coverage | Without Coverage |
| Under 6 Years | 0 (0.0%) | 0 (0.0%) |
| 6 to 18 Years | 34 (100.0%) | 0 (0.0%) |
| 19 to 25 Years | 0 (0.0%) | 0 (0.0%) |
| 26 to 34 Years | 0 (0.0%) | 0 (0.0%) |
| 35 to 44 Years | 148 (86.6%) | 23 (13.5%) |
| 45 to 54 Years | 0 (0.0%) | 0 (0.0%) |
| 55 to 64 Years | 36 (100.0%) | 0 (0.0%) |
| 65 to 74 Years | 48 (100.0%) | 0 (0.0%) |
| 75 Years and older | 0 (0.0%) | 0 (0.0%) |
| Total | 266 (92.0%) | 23 (8.0%) |
Health Insurance Coverage by Citizenship Status in Sarah Ann
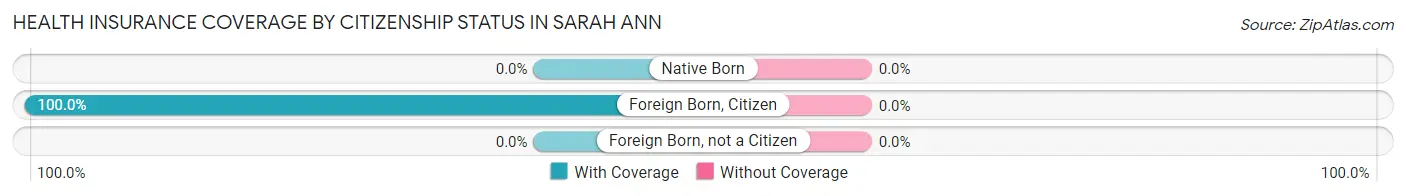
| Citizenship Status | With Coverage | Without Coverage |
| Native Born | 0 (0.0%) | 0 (0.0%) |
| Foreign Born, Citizen | 34 (100.0%) | 0 (0.0%) |
| Foreign Born, not a Citizen | 0 (0.0%) | 0 (0.0%) |
Health Insurance Coverage by Household Income in Sarah Ann
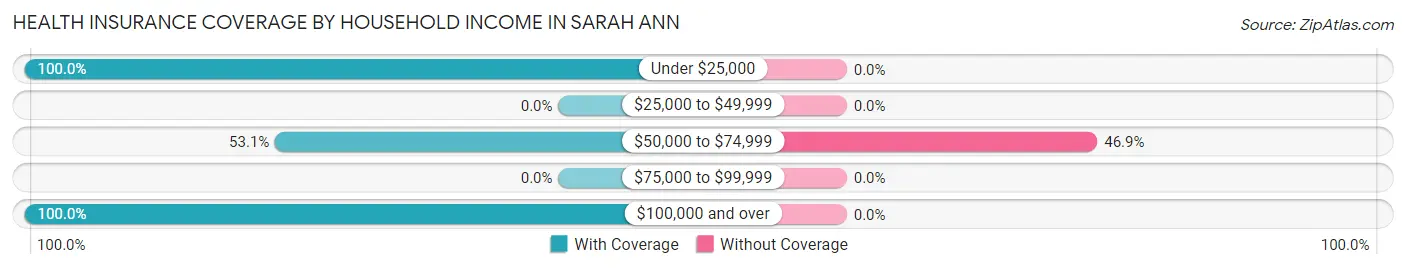
| Household Income | With Coverage | Without Coverage |
| Under $25,000 | 92 (100.0%) | 0 (0.0%) |
| $25,000 to $49,999 | 0 (0.0%) | 0 (0.0%) |
| $50,000 to $74,999 | 26 (53.1%) | 23 (46.9%) |
| $75,000 to $99,999 | 0 (0.0%) | 0 (0.0%) |
| $100,000 and over | 148 (100.0%) | 0 (0.0%) |
Public vs Private Health Insurance Coverage by Age in Sarah Ann
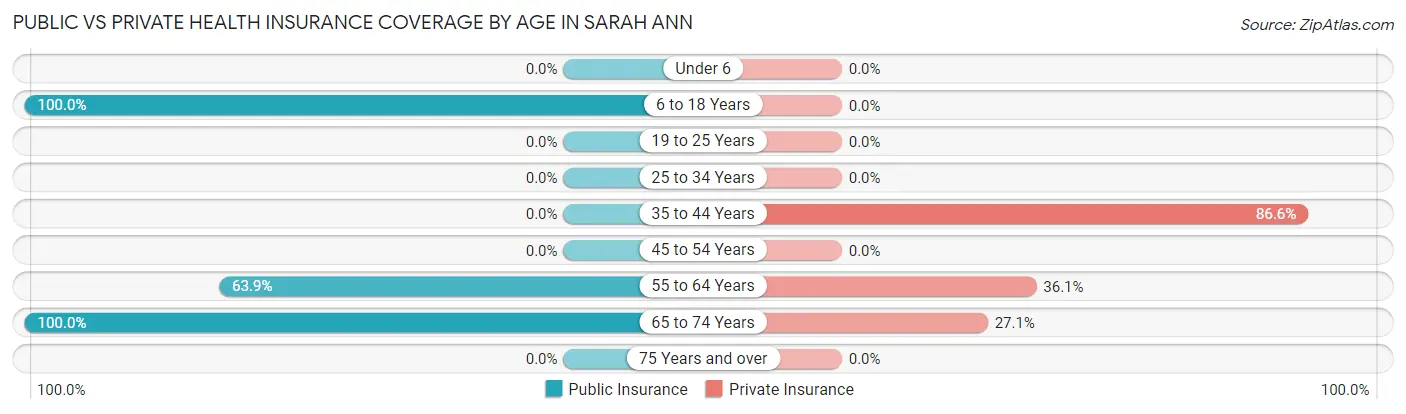
| Age Bracket | Public Insurance | Private Insurance |
| Under 6 | 0 (0.0%) | 0 (0.0%) |
| 6 to 18 Years | 34 (100.0%) | 0 (0.0%) |
| 19 to 25 Years | 0 (0.0%) | 0 (0.0%) |
| 25 to 34 Years | 0 (0.0%) | 0 (0.0%) |
| 35 to 44 Years | 0 (0.0%) | 148 (86.6%) |
| 45 to 54 Years | 0 (0.0%) | 0 (0.0%) |
| 55 to 64 Years | 23 (63.9%) | 13 (36.1%) |
| 65 to 74 Years | 48 (100.0%) | 13 (27.1%) |
| 75 Years and over | 0 (0.0%) | 0 (0.0%) |
| Total | 105 (36.3%) | 174 (60.2%) |
Disability Status by Sex by Age in Sarah Ann
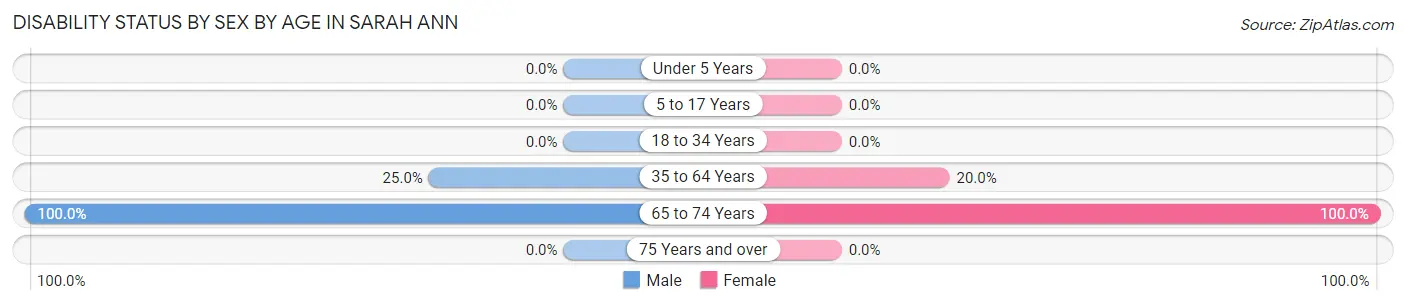
| Age Bracket | Male | Female |
| Under 5 Years | 0 (0.0%) | 0 (0.0%) |
| 5 to 17 Years | 0 (0.0%) | 0 (0.0%) |
| 18 to 34 Years | 0 (0.0%) | 0 (0.0%) |
| 35 to 64 Years | 23 (25.0%) | 23 (20.0%) |
| 65 to 74 Years | 35 (100.0%) | 13 (100.0%) |
| 75 Years and over | 0 (0.0%) | 0 (0.0%) |
Disability Class by Sex by Age in Sarah Ann
Disability Class: Hearing Difficulty
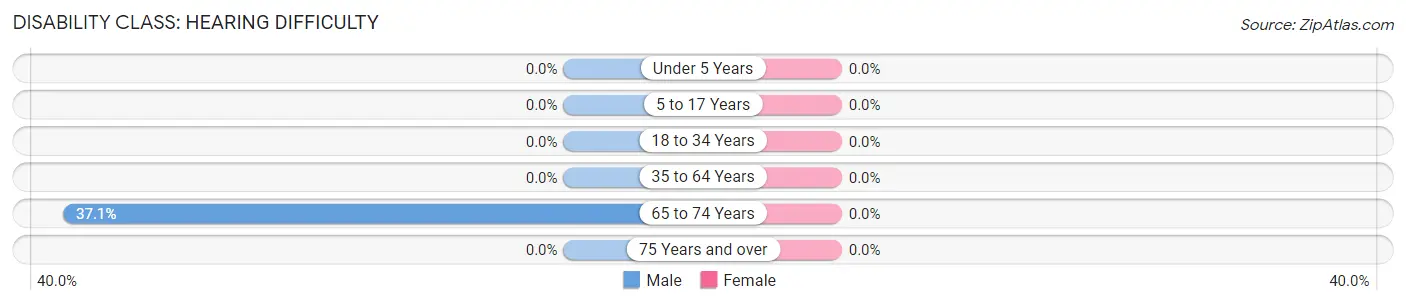
| Age Bracket | Male | Female |
| Under 5 Years | 0 (0.0%) | 0 (0.0%) |
| 5 to 17 Years | 0 (0.0%) | 0 (0.0%) |
| 18 to 34 Years | 0 (0.0%) | 0 (0.0%) |
| 35 to 64 Years | 0 (0.0%) | 0 (0.0%) |
| 65 to 74 Years | 13 (37.1%) | 0 (0.0%) |
| 75 Years and over | 0 (0.0%) | 0 (0.0%) |
Disability Class: Vision Difficulty
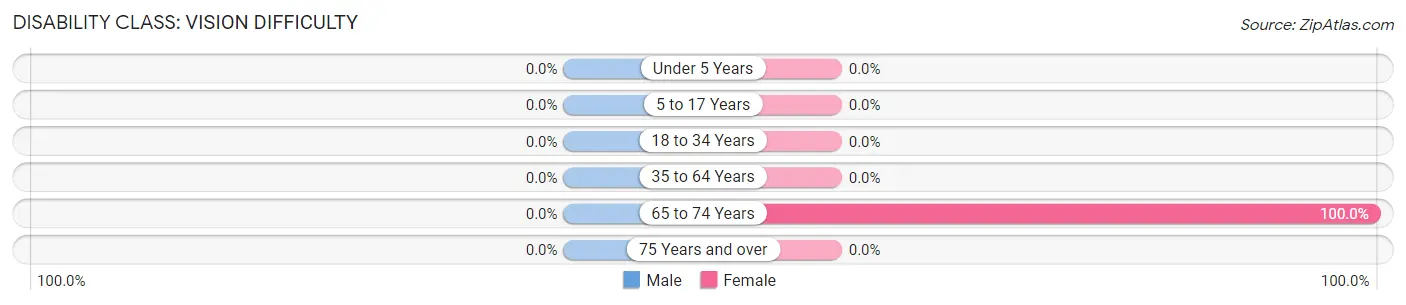
| Age Bracket | Male | Female |
| Under 5 Years | 0 (0.0%) | 0 (0.0%) |
| 5 to 17 Years | 0 (0.0%) | 0 (0.0%) |
| 18 to 34 Years | 0 (0.0%) | 0 (0.0%) |
| 35 to 64 Years | 0 (0.0%) | 0 (0.0%) |
| 65 to 74 Years | 0 (0.0%) | 13 (100.0%) |
| 75 Years and over | 0 (0.0%) | 0 (0.0%) |
Disability Class: Cognitive Difficulty
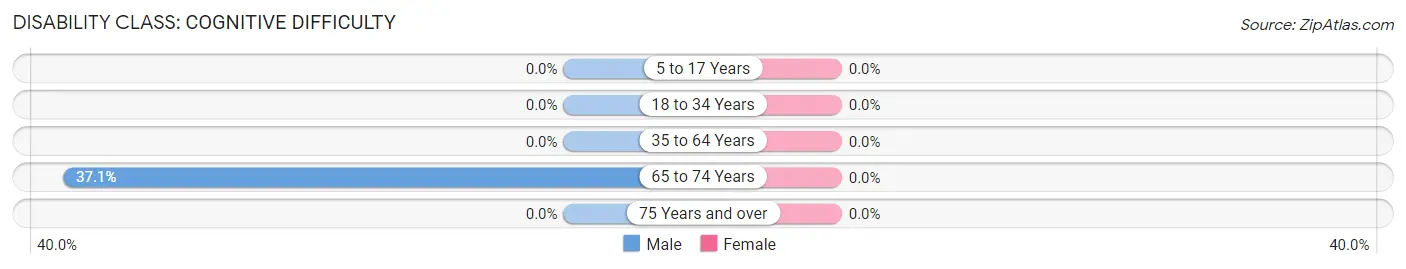
| Age Bracket | Male | Female |
| 5 to 17 Years | 0 (0.0%) | 0 (0.0%) |
| 18 to 34 Years | 0 (0.0%) | 0 (0.0%) |
| 35 to 64 Years | 0 (0.0%) | 0 (0.0%) |
| 65 to 74 Years | 13 (37.1%) | 0 (0.0%) |
| 75 Years and over | 0 (0.0%) | 0 (0.0%) |
Disability Class: Ambulatory Difficulty
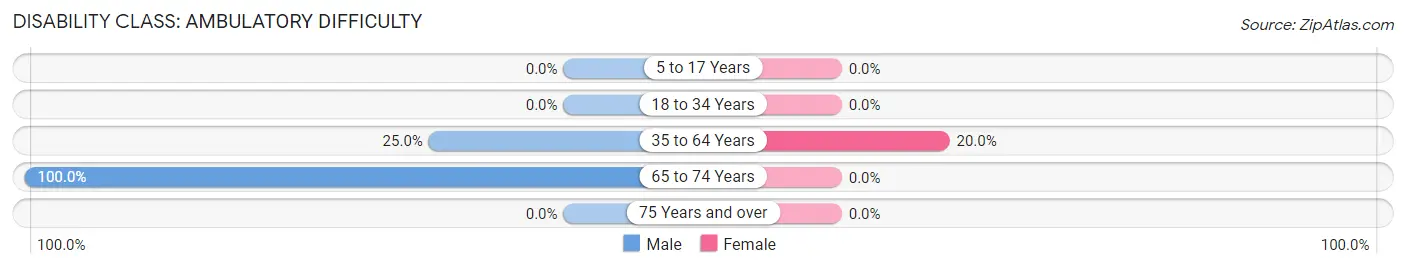
| Age Bracket | Male | Female |
| 5 to 17 Years | 0 (0.0%) | 0 (0.0%) |
| 18 to 34 Years | 0 (0.0%) | 0 (0.0%) |
| 35 to 64 Years | 23 (25.0%) | 23 (20.0%) |
| 65 to 74 Years | 35 (100.0%) | 0 (0.0%) |
| 75 Years and over | 0 (0.0%) | 0 (0.0%) |
Disability Class: Self-Care Difficulty

| Age Bracket | Male | Female |
| 5 to 17 Years | 0 (0.0%) | 0 (0.0%) |
| 18 to 34 Years | 0 (0.0%) | 0 (0.0%) |
| 35 to 64 Years | 0 (0.0%) | 0 (0.0%) |
| 65 to 74 Years | 13 (37.1%) | 0 (0.0%) |
| 75 Years and over | 0 (0.0%) | 0 (0.0%) |
Technology Access in Sarah Ann
Computing Device Access in Sarah Ann
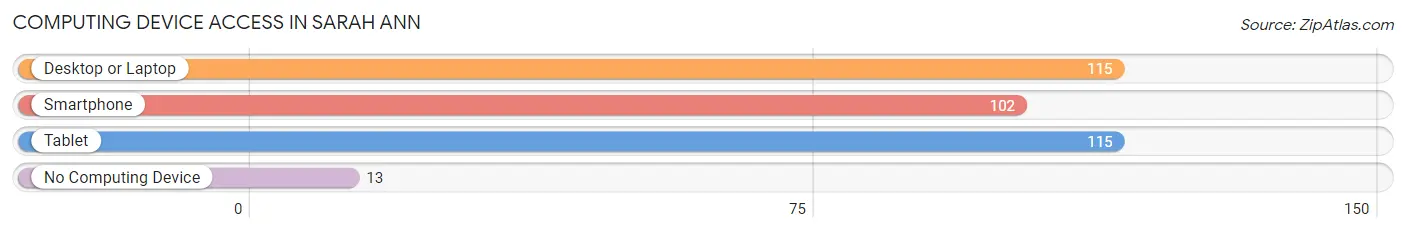
| Device Type | # Households | % Households |
| Desktop or Laptop | 115 | 89.8% |
| Smartphone | 102 | 79.7% |
| Tablet | 115 | 89.8% |
| No Computing Device | 13 | 10.2% |
| Total | 128 | 100.0% |
Internet Access in Sarah Ann
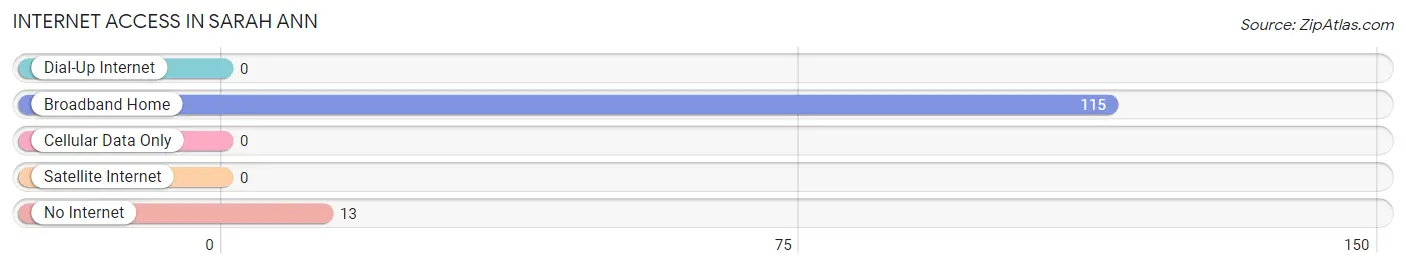
| Internet Type | # Households | % Households |
| Dial-Up Internet | 0 | 0.0% |
| Broadband Home | 115 | 89.8% |
| Cellular Data Only | 0 | 0.0% |
| Satellite Internet | 0 | 0.0% |
| No Internet | 13 | 10.2% |
| Total | 128 | 100.0% |
Sarah Ann Summary
Sarah Ann is an unincorporated community located in Logan County, West Virginia. It is situated in the Appalachian Mountains and is part of the Coal River Valley. The population of Sarah Ann was estimated to be around 200 people in 2020.
Geography
Sarah Ann is located in the Coal River Valley, which is part of the Appalachian Mountains. The valley is surrounded by steep hills and mountains, and the terrain is mostly forested. The area is known for its coal mining and timber production. The nearest major city is Charleston, which is about 40 miles away.
The climate in Sarah Ann is humid subtropical, with hot summers and cold winters. The average annual temperature is around 55 degrees Fahrenheit. The average annual precipitation is around 40 inches.
Economy
The economy of Sarah Ann is largely based on coal mining and timber production. The coal industry has been in decline in recent years, but timber production is still a major source of income for the area. There are also some small businesses in the area, such as convenience stores and restaurants.
Demographics
The population of Sarah Ann was estimated to be around 200 people in 2020. The racial makeup of the town is predominantly white, with a small percentage of African Americans and Native Americans. The median household income is around $30,000, and the median home value is around $90,000.
Education
The town of Sarah Ann does not have its own school system. Students in the area attend schools in the nearby towns of Logan and Man. There are also several private schools in the area.
Conclusion
Sarah Ann is a small unincorporated community located in Logan County, West Virginia. It is situated in the Appalachian Mountains and is part of the Coal River Valley. The economy of Sarah Ann is largely based on coal mining and timber production. The population of Sarah Ann was estimated to be around 200 people in 2020. The racial makeup of the town is predominantly white, with a small percentage of African Americans and Native Americans. The median household income is around $30,000, and the median home value is around $90,000. Students in the area attend schools in the nearby towns of Logan and Man. There are also several private schools in the area.
Common Questions
What is Per Capita Income in Sarah Ann?
Per Capita income in Sarah Ann is $32,034.
What is the Median Family Income in Sarah Ann?
Median Family Income in Sarah Ann is $115,680.
What is Inequality or Gini Index in Sarah Ann?
Inequality or Gini Index in Sarah Ann is 0.28.
What is the Total Population of Sarah Ann?
Total Population of Sarah Ann is 289.
What is the Total Male Population of Sarah Ann?
Total Male Population of Sarah Ann is 127.
What is the Total Female Population of Sarah Ann?
Total Female Population of Sarah Ann is 162.
What is the Ratio of Males per 100 Females in Sarah Ann?
There are 78.40 Males per 100 Females in Sarah Ann.
What is the Ratio of Females per 100 Males in Sarah Ann?
There are 127.56 Females per 100 Males in Sarah Ann.
What is the Median Population Age in Sarah Ann?
Median Population Age in Sarah Ann is 44.2 Years.
What is the Average Family Size in Sarah Ann
Average Family Size in Sarah Ann is 2.4 People.
What is the Average Household Size in Sarah Ann
Average Household Size in Sarah Ann is 2.3 People.
How Large is the Labor Force in Sarah Ann?
There are 82 People in the Labor Forcein in Sarah Ann.
What is the Percentage of People in the Labor Force in Sarah Ann?
32.2% of People are in the Labor Force in Sarah Ann.