Tuluksak, AK Map & Demographics
Tuluksak Map
Tuluksak Overview
$107,211
PER CAPITA INCOME
0.60
INEQUALITY / GINI INDEX
456
TOTAL POPULATION
412
MALE POPULATION
44
FEMALE POPULATION
936.36
MALES / 100 FEMALES
10.68
FEMALES / 100 MALES
33.9
MEDIAN AGE
4.5
AVG FAMILY SIZE
4.0
AVG HOUSEHOLD SIZE
389
LABOR FORCE [ PEOPLE ]
92.2%
PERCENT IN LABOR FORCE
1.5%
UNEMPLOYMENT RATE
Tuluksak Zip Codes
Tuluksak Area Codes
Income in Tuluksak
Income Overview in Tuluksak
| Characteristic | Number | Measure |
| Per Capita Income | 456 | $107,211 |
| Median Family Income | 18 | $0 |
| Mean Family Income | 18 | $30,933 |
| Median Household Income | 25 | $0 |
| Mean Household Income | 25 | $64,016 |
| Income Deficit | 18 | $0 |
| Wage / Income Gap (%) | 456 | 0.00% |
| Wage / Income Gap ($) | 456 | 100.00¢ per $1 |
| Gini / Inequality Index | 456 | 0.60 |
Earnings by Sex in Tuluksak
| Sex | Number | Average Earnings |
| Male | 376 (97.2%) | $0 |
| Female | 11 (2.8%) | $0 |
| Total | 387 (100.0%) | $0 |
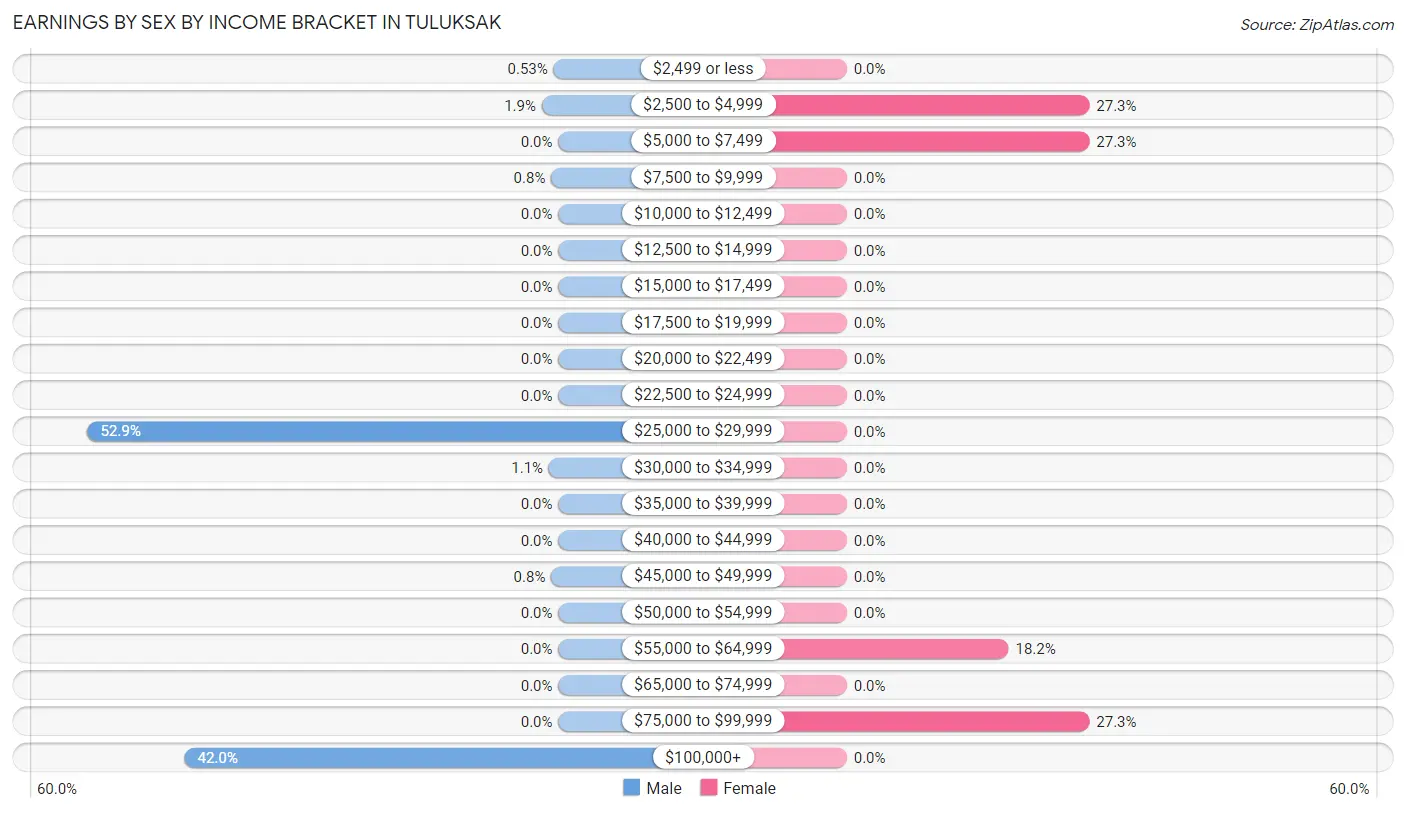
Earnings by Sex by Income Bracket in Tuluksak
The most common earnings brackets in Tuluksak are $25,000 to $29,999 for men (199 | 52.9%) and $2,500 to $4,999 for women (3 | 27.3%).
| Income | Male | Female |
| $2,499 or less | 2 (0.5%) | 0 (0.0%) |
| $2,500 to $4,999 | 7 (1.9%) | 3 (27.3%) |
| $5,000 to $7,499 | 0 (0.0%) | 3 (27.3%) |
| $7,500 to $9,999 | 3 (0.8%) | 0 (0.0%) |
| $10,000 to $12,499 | 0 (0.0%) | 0 (0.0%) |
| $12,500 to $14,999 | 0 (0.0%) | 0 (0.0%) |
| $15,000 to $17,499 | 0 (0.0%) | 0 (0.0%) |
| $17,500 to $19,999 | 0 (0.0%) | 0 (0.0%) |
| $20,000 to $22,499 | 0 (0.0%) | 0 (0.0%) |
| $22,500 to $24,999 | 0 (0.0%) | 0 (0.0%) |
| $25,000 to $29,999 | 199 (52.9%) | 0 (0.0%) |
| $30,000 to $34,999 | 4 (1.1%) | 0 (0.0%) |
| $35,000 to $39,999 | 0 (0.0%) | 0 (0.0%) |
| $40,000 to $44,999 | 0 (0.0%) | 0 (0.0%) |
| $45,000 to $49,999 | 3 (0.8%) | 0 (0.0%) |
| $50,000 to $54,999 | 0 (0.0%) | 0 (0.0%) |
| $55,000 to $64,999 | 0 (0.0%) | 2 (18.2%) |
| $65,000 to $74,999 | 0 (0.0%) | 0 (0.0%) |
| $75,000 to $99,999 | 0 (0.0%) | 3 (27.3%) |
| $100,000+ | 158 (42.0%) | 0 (0.0%) |
| Total | 376 (100.0%) | 11 (100.0%) |
Earnings by Sex by Educational Attainment in Tuluksak
| Educational Attainment | Male Income | Female Income |
| Less than High School | - | - |
| High School Diploma | - | - |
| College or Associate's Degree | - | - |
| Bachelor's Degree | - | - |
| Graduate Degree | - | - |
| Total | - | - |
Family Income in Tuluksak
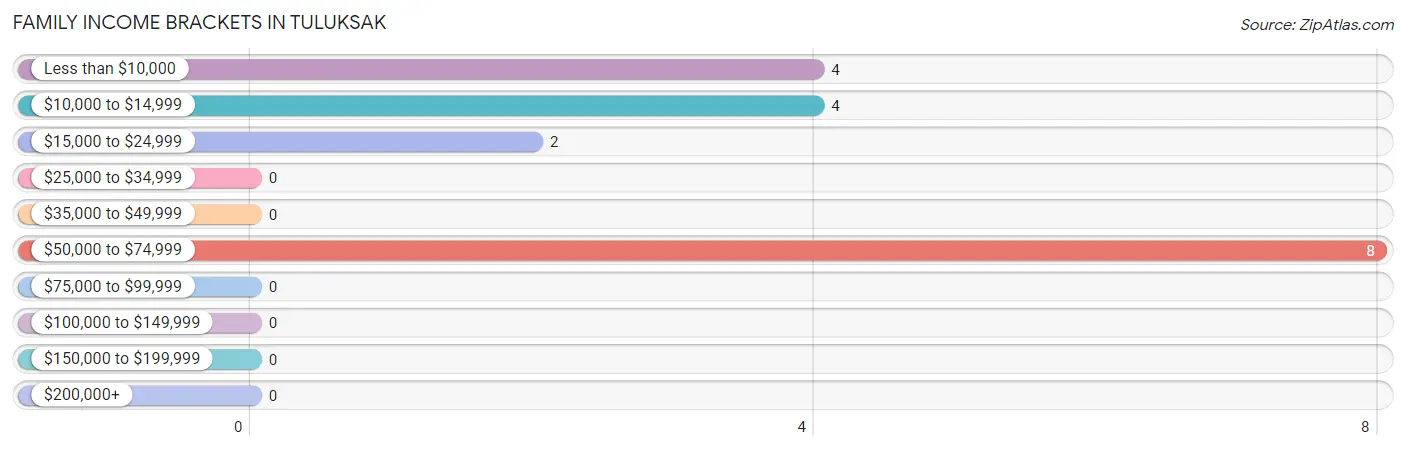
Family Income Brackets in Tuluksak
According to the Tuluksak family income data, there are 8 families falling into the $50,000 to $74,999 income range, which is the most common income bracket and makes up 44.4% of all families.
| Income Bracket | # Families | % Families |
| Less than $10,000 | 4 | 22.2% |
| $10,000 to $14,999 | 4 | 22.2% |
| $15,000 to $24,999 | 2 | 11.1% |
| $25,000 to $34,999 | 0 | 0.0% |
| $35,000 to $49,999 | 0 | 0.0% |
| $50,000 to $74,999 | 8 | 44.4% |
| $75,000 to $99,999 | 0 | 0.0% |
| $100,000 to $149,999 | 0 | 0.0% |
| $150,000 to $199,999 | 0 | 0.0% |
| $200,000+ | 0 | 0.0% |
Family Income by Famaliy Size in Tuluksak
| Income Bracket | # Families | Median Income |
| 2-Person Families | 0 (0.0%) | $0 |
| 3-Person Families | 7 (38.9%) | $0 |
| 4-Person Families | 6 (33.3%) | $0 |
| 5-Person Families | 0 (0.0%) | $0 |
| 6-Person Families | 0 (0.0%) | $0 |
| 7+ Person Families | 5 (27.8%) | $0 |
| Total | 18 (100.0%) | $0 |
Family Income by Number of Earners in Tuluksak
| Number of Earners | # Families | Median Income |
| No Earners | 6 (33.3%) | $0 |
| 1 Earner | 6 (33.3%) | $0 |
| 2 Earners | 6 (33.3%) | $0 |
| 3+ Earners | 0 (0.0%) | $0 |
| Total | 18 (100.0%) | $0 |
Household Income in Tuluksak
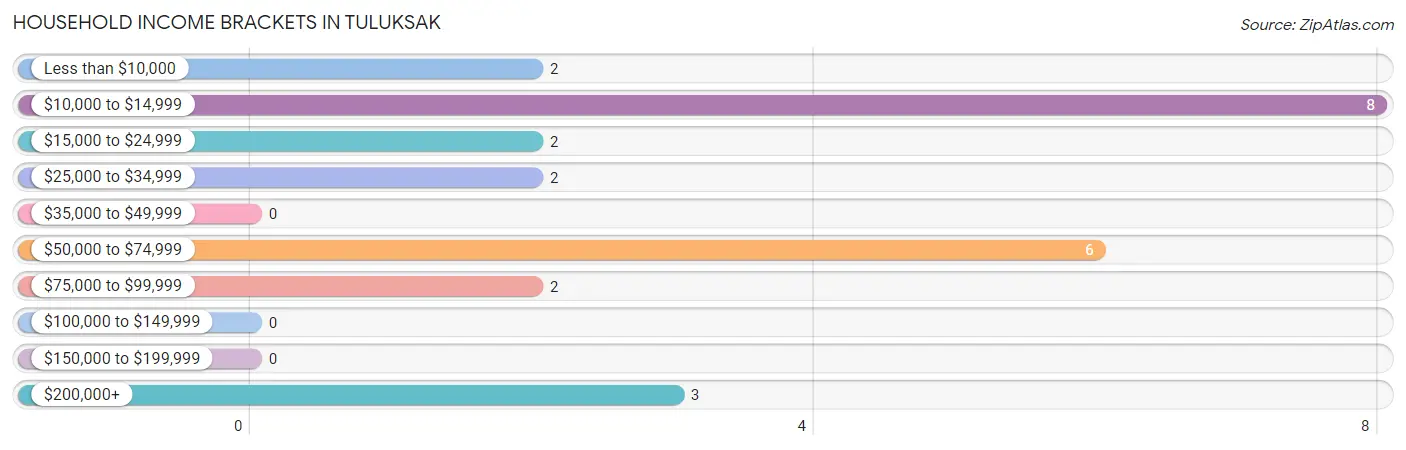
Household Income Brackets in Tuluksak
With 8 households falling in the category, the $10,000 to $14,999 income range is the most frequent in Tuluksak, accounting for 32.0% of all households.
| Income Bracket | # Households | % Households |
| Less than $10,000 | 2 | 8.0% |
| $10,000 to $14,999 | 8 | 32.0% |
| $15,000 to $24,999 | 2 | 8.0% |
| $25,000 to $34,999 | 2 | 8.0% |
| $35,000 to $49,999 | 0 | 0.0% |
| $50,000 to $74,999 | 6 | 24.0% |
| $75,000 to $99,999 | 2 | 8.0% |
| $100,000 to $149,999 | 0 | 0.0% |
| $150,000 to $199,999 | 0 | 0.0% |
| $200,000+ | 3 | 12.0% |
Household Income by Householder Age in Tuluksak
The median household income in Tuluksak is $0, with the highest median household income of $33,125 found in the 45 to 64 years age bracket for the primary householder. A total of 9 households (36.0%) fall into this category.
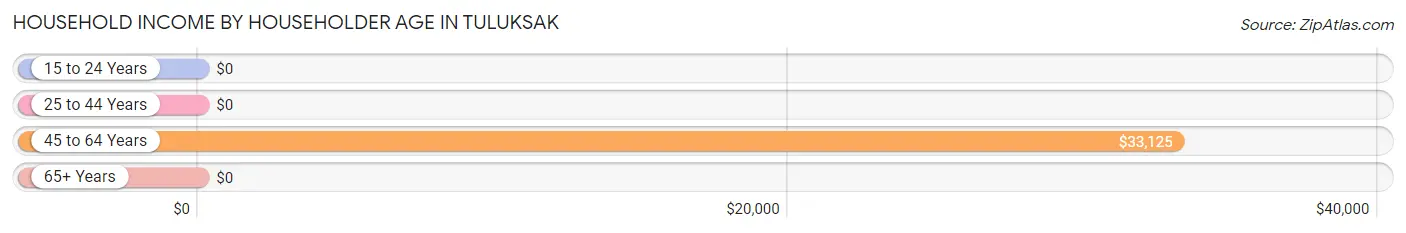
| Income Bracket | # Households | Median Income |
| 15 to 24 Years | 0 (0.0%) | $0 |
| 25 to 44 Years | 9 (36.0%) | $0 |
| 45 to 64 Years | 9 (36.0%) | $33,125 |
| 65+ Years | 7 (28.0%) | $0 |
| Total | 25 (100.0%) | $0 |
Poverty in Tuluksak
Income Below Poverty by Sex and Age in Tuluksak
With 8.0% poverty level for males and 72.7% for females among the residents of Tuluksak, 16 and 17 year old males and 6 to 11 year old females are the most vulnerable to poverty, with 3 males (100.0%) and 6 females (100.0%) in their respective age groups living below the poverty level.
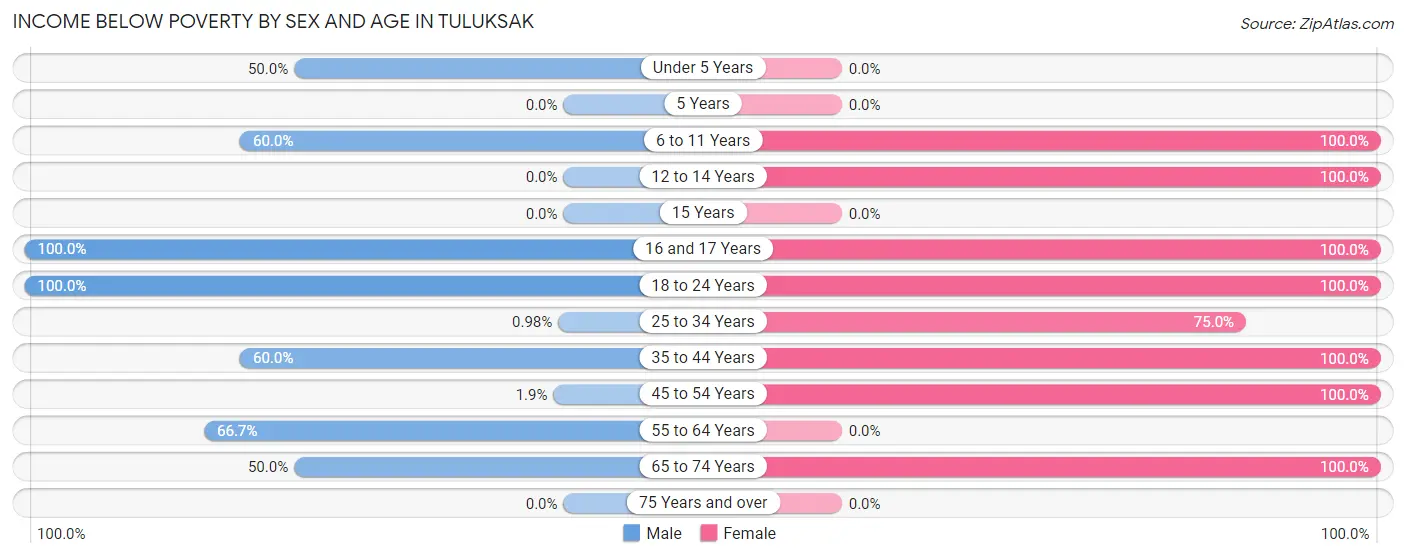
| Age Bracket | Male | Female |
| Under 5 Years | 3 (50.0%) | 0 (0.0%) |
| 5 Years | 0 (0.0%) | 0 (0.0%) |
| 6 to 11 Years | 3 (60.0%) | 6 (100.0%) |
| 12 to 14 Years | 0 (0.0%) | 6 (100.0%) |
| 15 Years | 0 (0.0%) | 0 (0.0%) |
| 16 and 17 Years | 3 (100.0%) | 3 (100.0%) |
| 18 to 24 Years | 5 (100.0%) | 2 (100.0%) |
| 25 to 34 Years | 2 (1.0%) | 3 (75.0%) |
| 35 to 44 Years | 6 (60.0%) | 4 (100.0%) |
| 45 to 54 Years | 3 (1.9%) | 5 (100.0%) |
| 55 to 64 Years | 6 (66.7%) | 0 (0.0%) |
| 65 to 74 Years | 2 (50.0%) | 3 (100.0%) |
| 75 Years and over | 0 (0.0%) | 0 (0.0%) |
| Total | 33 (8.0%) | 32 (72.7%) |
Income Above Poverty by Sex and Age in Tuluksak
According to the poverty statistics in Tuluksak, males aged 12 to 14 years and females aged under 5 years are the age groups that are most secure financially, with 100.0% of males and 100.0% of females in these age groups living above the poverty line.
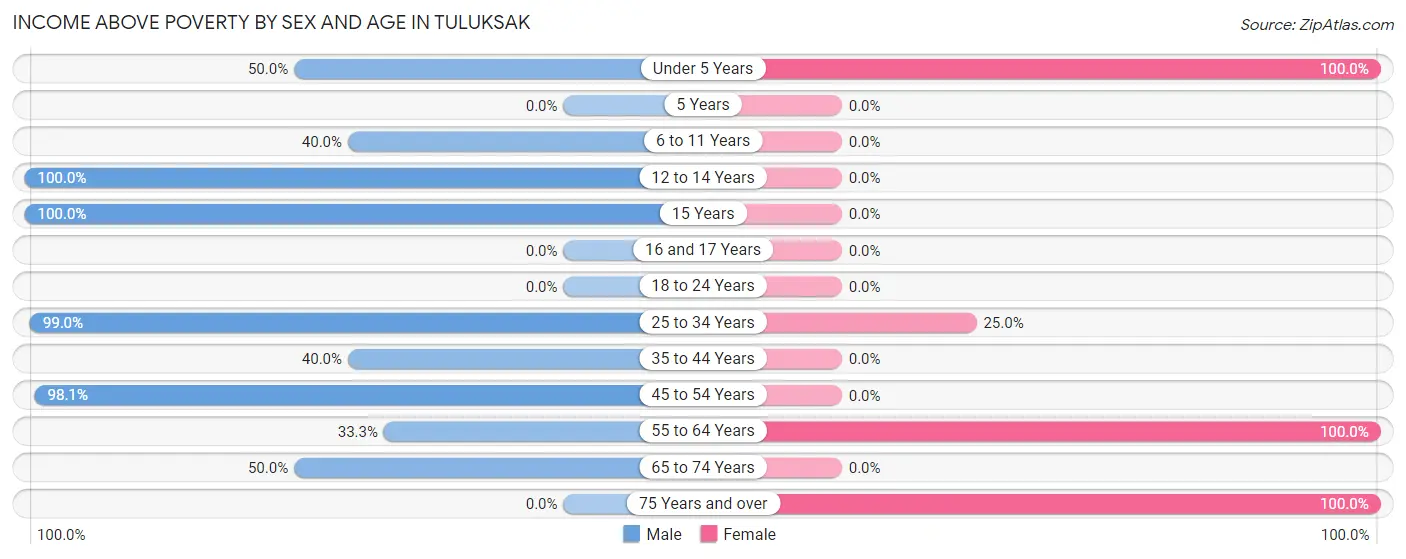
| Age Bracket | Male | Female |
| Under 5 Years | 3 (50.0%) | 6 (100.0%) |
| 5 Years | 0 (0.0%) | 0 (0.0%) |
| 6 to 11 Years | 2 (40.0%) | 0 (0.0%) |
| 12 to 14 Years | 2 (100.0%) | 0 (0.0%) |
| 15 Years | 3 (100.0%) | 0 (0.0%) |
| 16 and 17 Years | 0 (0.0%) | 0 (0.0%) |
| 18 to 24 Years | 0 (0.0%) | 0 (0.0%) |
| 25 to 34 Years | 202 (99.0%) | 1 (25.0%) |
| 35 to 44 Years | 4 (40.0%) | 0 (0.0%) |
| 45 to 54 Years | 158 (98.1%) | 0 (0.0%) |
| 55 to 64 Years | 3 (33.3%) | 2 (100.0%) |
| 65 to 74 Years | 2 (50.0%) | 0 (0.0%) |
| 75 Years and over | 0 (0.0%) | 3 (100.0%) |
| Total | 379 (92.0%) | 12 (27.3%) |
Income Below Poverty Among Married-Couple Families in Tuluksak
The poverty statistics for married-couple families in Tuluksak show that 50.0% or 6 of the total 12 families live below the poverty line. Families with 3 or 4 children have the highest poverty rate of 100.0%, comprising of 2 families. On the other hand, families with 5 or more children have the lowest poverty rate of 0.0%, which includes 0 families.
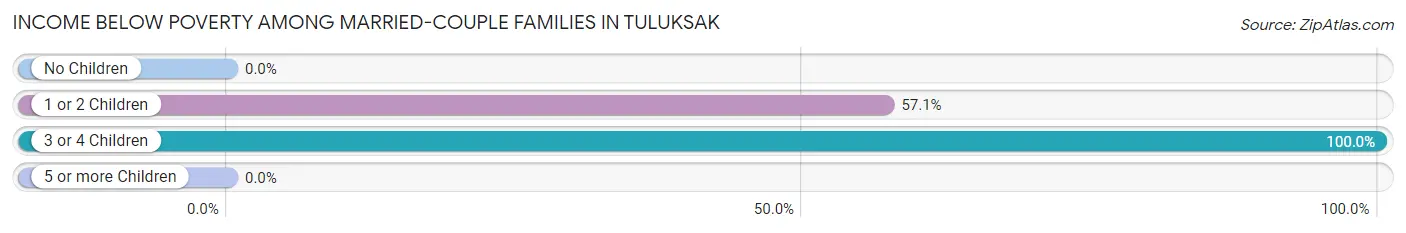
| Children | Above Poverty | Below Poverty |
| No Children | 0 (0.0%) | 0 (0.0%) |
| 1 or 2 Children | 3 (42.9%) | 4 (57.1%) |
| 3 or 4 Children | 0 (0.0%) | 2 (100.0%) |
| 5 or more Children | 3 (100.0%) | 0 (0.0%) |
| Total | 6 (50.0%) | 6 (50.0%) |
Income Below Poverty Among Single-Parent Households in Tuluksak
According to the poverty data in Tuluksak, 100.0% or 2 single-father households and 100.0% or 4 single-mother households are living below the poverty line. Among single-father households, those with 1 or 2 children have the highest poverty rate, with 2 households (100.0%) experiencing poverty. Likewise, among single-mother households, those with 1 or 2 children have the highest poverty rate, with 4 households (100.0%) falling below the poverty line.
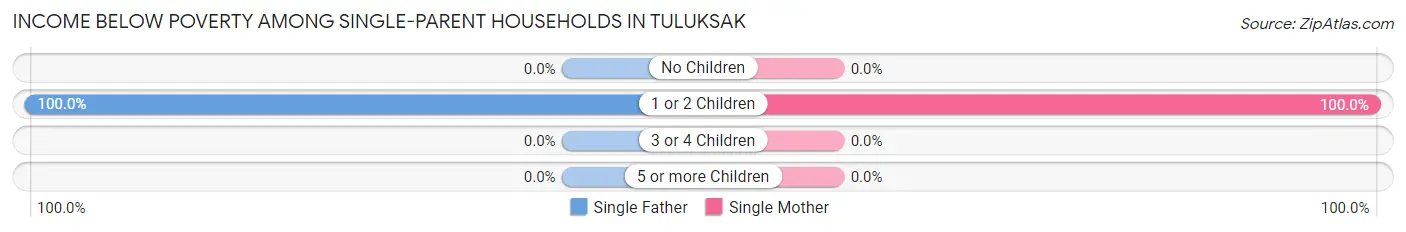
| Children | Single Father | Single Mother |
| No Children | 0 (0.0%) | 0 (0.0%) |
| 1 or 2 Children | 2 (100.0%) | 4 (100.0%) |
| 3 or 4 Children | 0 (0.0%) | 0 (0.0%) |
| 5 or more Children | 0 (0.0%) | 0 (0.0%) |
| Total | 2 (100.0%) | 4 (100.0%) |
Income Below Poverty Among Married-Couple vs Single-Parent Households in Tuluksak
The poverty data for Tuluksak shows that 6 of the married-couple family households (50.0%) and 6 of the single-parent households (100.0%) are living below the poverty level. Within the married-couple family households, those with 3 or 4 children have the highest poverty rate, with 2 households (100.0%) falling below the poverty line. Among the single-parent households, those with 1 or 2 children have the highest poverty rate, with 6 household (100.0%) living below poverty.
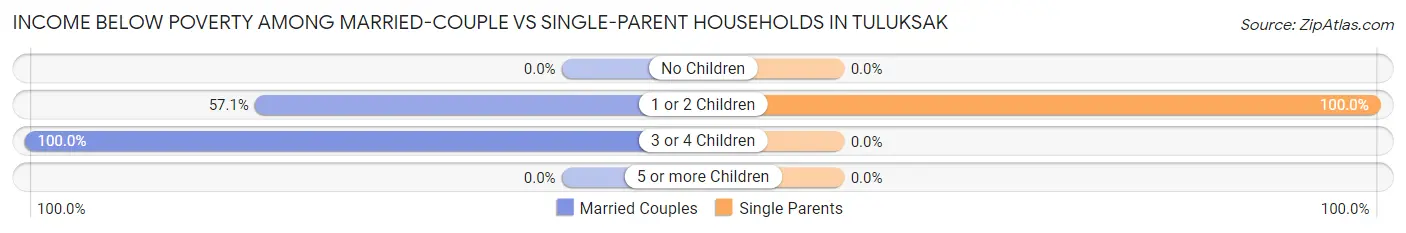
| Children | Married-Couple Families | Single-Parent Households |
| No Children | 0 (0.0%) | 0 (0.0%) |
| 1 or 2 Children | 4 (57.1%) | 6 (100.0%) |
| 3 or 4 Children | 2 (100.0%) | 0 (0.0%) |
| 5 or more Children | 0 (0.0%) | 0 (0.0%) |
| Total | 6 (50.0%) | 6 (100.0%) |
Race in Tuluksak
The most populous races in Tuluksak are White / Caucasian (361 | 79.2%), Native / Alaskan (89 | 19.5%), and Two or more Races (6 | 1.3%).
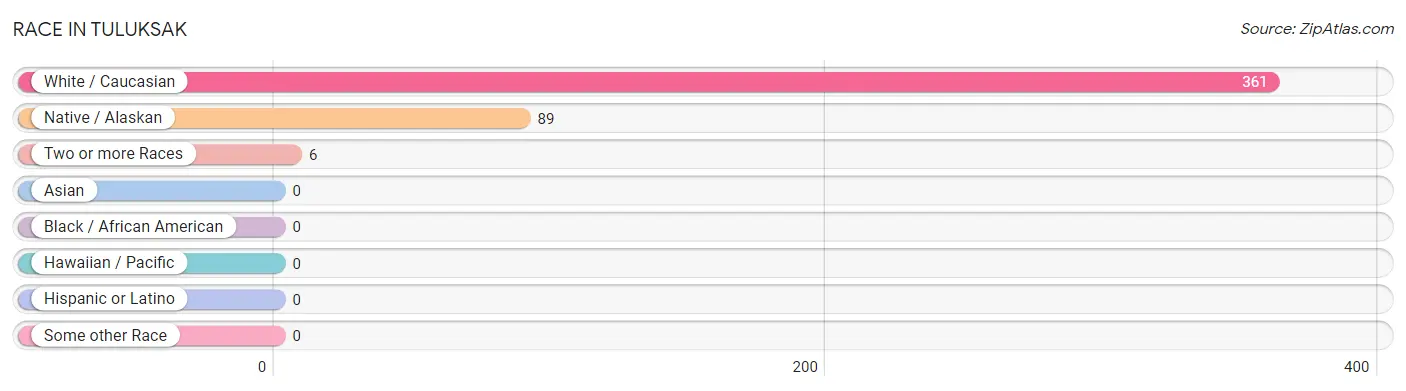
| Race | # Population | % Population |
| Asian | 0 | 0.0% |
| Black / African American | 0 | 0.0% |
| Hawaiian / Pacific | 0 | 0.0% |
| Hispanic or Latino | 0 | 0.0% |
| Native / Alaskan | 89 | 19.5% |
| White / Caucasian | 361 | 79.2% |
| Two or more Races | 6 | 1.3% |
| Some other Race | 0 | 0.0% |
| Total | 456 | 100.0% |
Ancestry in Tuluksak
The most populous ancestries reported in Tuluksak are Yup'ik (83 | 18.2%), Alaska Native (6 | 1.3%), Norwegian (6 | 1.3%), Thai (6 | 1.3%), and Irish (4 | 0.9%), together accounting for 23.0% of all Tuluksak residents.
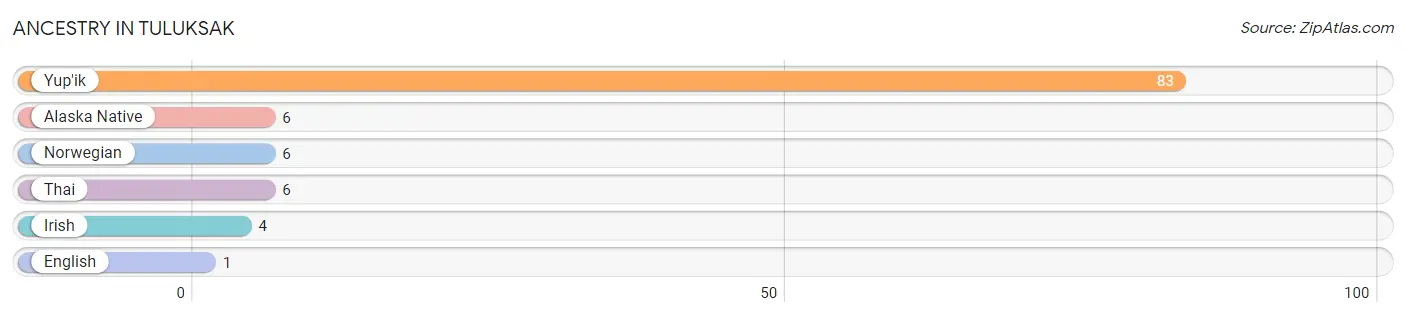
| Ancestry | # Population | % Population |
| Alaska Native | 6 | 1.3% |
| English | 1 | 0.2% |
| Irish | 4 | 0.9% |
| Norwegian | 6 | 1.3% |
| Thai | 6 | 1.3% |
| Yup'ik | 83 | 18.2% | View All 6 Rows |
Immigrants in Tuluksak

| Immigration Origin | # Population | % Population | View All 0 Rows |
Sex and Age in Tuluksak
Sex and Age in Tuluksak
The most populous age groups in Tuluksak are 30 to 34 Years (199 | 48.3%) for men and 10 to 14 Years (12 | 27.3%) for women.
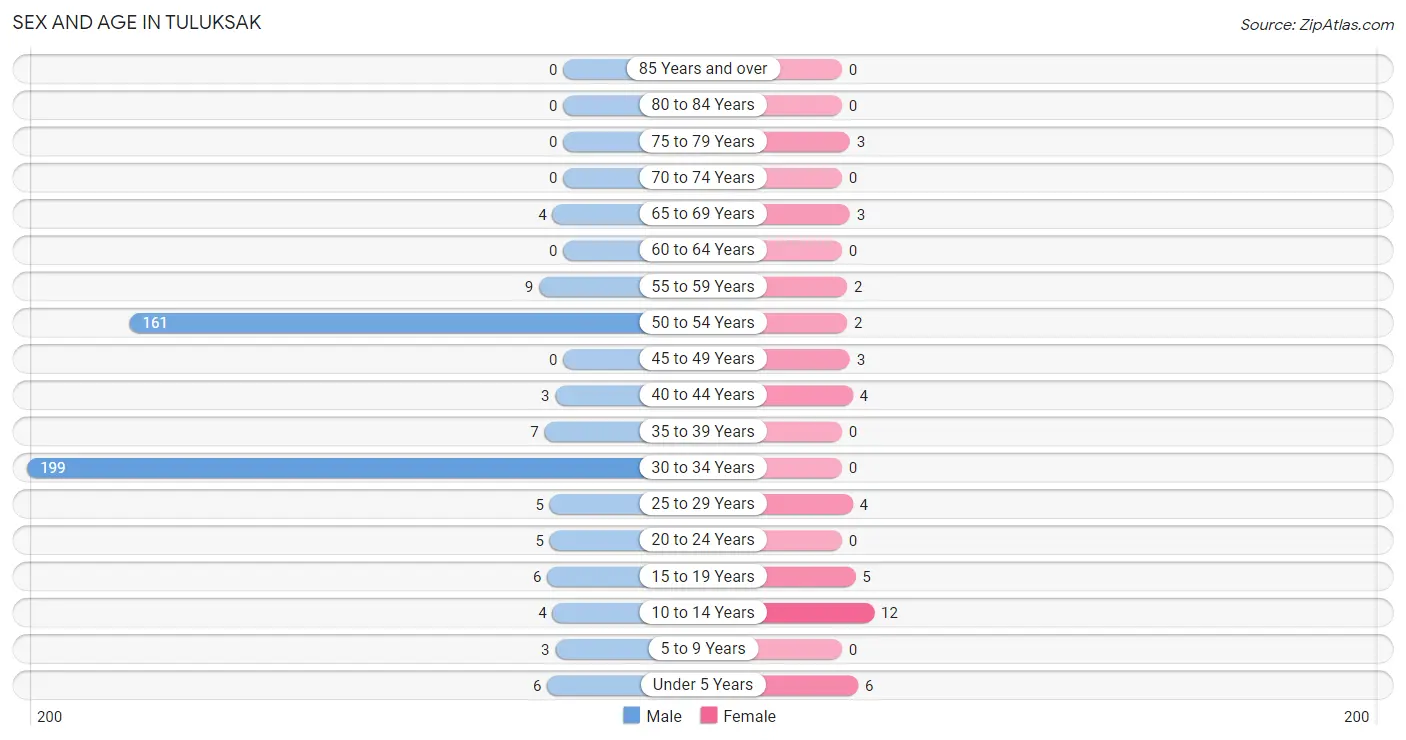
| Age Bracket | Male | Female |
| Under 5 Years | 6 (1.5%) | 6 (13.6%) |
| 5 to 9 Years | 3 (0.7%) | 0 (0.0%) |
| 10 to 14 Years | 4 (1.0%) | 12 (27.3%) |
| 15 to 19 Years | 6 (1.5%) | 5 (11.4%) |
| 20 to 24 Years | 5 (1.2%) | 0 (0.0%) |
| 25 to 29 Years | 5 (1.2%) | 4 (9.1%) |
| 30 to 34 Years | 199 (48.3%) | 0 (0.0%) |
| 35 to 39 Years | 7 (1.7%) | 0 (0.0%) |
| 40 to 44 Years | 3 (0.7%) | 4 (9.1%) |
| 45 to 49 Years | 0 (0.0%) | 3 (6.8%) |
| 50 to 54 Years | 161 (39.1%) | 2 (4.5%) |
| 55 to 59 Years | 9 (2.2%) | 2 (4.5%) |
| 60 to 64 Years | 0 (0.0%) | 0 (0.0%) |
| 65 to 69 Years | 4 (1.0%) | 3 (6.8%) |
| 70 to 74 Years | 0 (0.0%) | 0 (0.0%) |
| 75 to 79 Years | 0 (0.0%) | 3 (6.8%) |
| 80 to 84 Years | 0 (0.0%) | 0 (0.0%) |
| 85 Years and over | 0 (0.0%) | 0 (0.0%) |
| Total | 412 (100.0%) | 44 (100.0%) |
Families and Households in Tuluksak
Median Family Size in Tuluksak
The median family size in Tuluksak is 4.50 persons per family, with married-couple families (12 | 66.7%) accounting for the largest median family size of 5.08 persons per family. On the other hand, single female/mother families (4 | 22.2%) represent the smallest median family size with 2.50 persons per family.
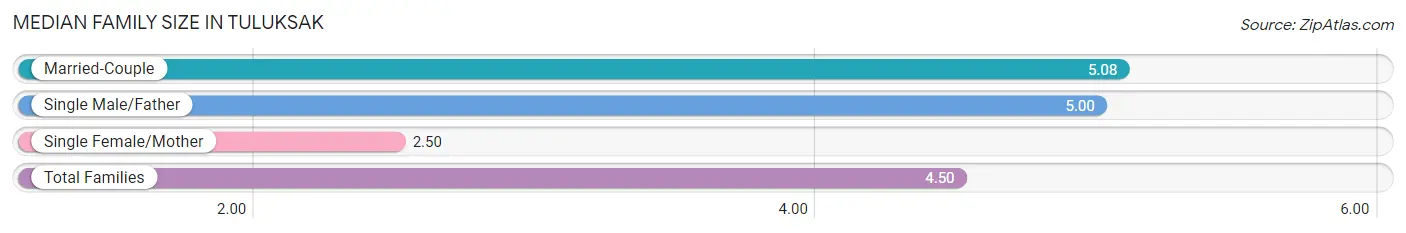
| Family Type | # Families | Family Size |
| Married-Couple | 12 (66.7%) | 5.08 |
| Single Male/Father | 2 (11.1%) | 5.00 |
| Single Female/Mother | 4 (22.2%) | 2.50 |
| Total Families | 18 (100.0%) | 4.50 |
Median Household Size in Tuluksak
The median household size in Tuluksak is 3.96 persons per household, with single male/father households (2 | 8.0%) accounting for the largest median household size of 6 persons per household. non-family households (7 | 28.0%) represent the smallest median household size with 1.29 persons per household.
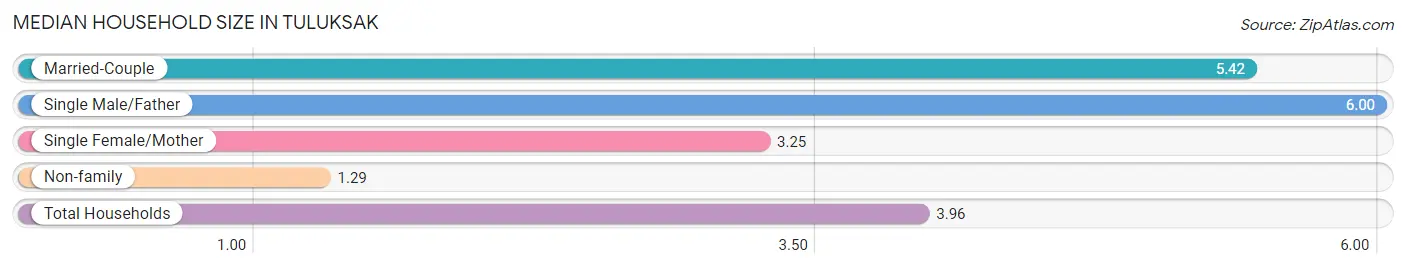
| Household Type | # Households | Household Size |
| Married-Couple | 12 (48.0%) | 5.42 |
| Single Male/Father | 2 (8.0%) | 6.00 |
| Single Female/Mother | 4 (16.0%) | 3.25 |
| Non-family | 7 (28.0%) | 1.29 |
| Total Households | 25 (100.0%) | 3.96 |
Household Size by Marriage Status in Tuluksak
Out of a total of 25 households in Tuluksak, 18 (72.0%) are family households, while 7 (28.0%) are nonfamily households. The most numerous type of family households are 4-person households, comprising 8, and the most common type of nonfamily households are 1-person households, comprising 5.
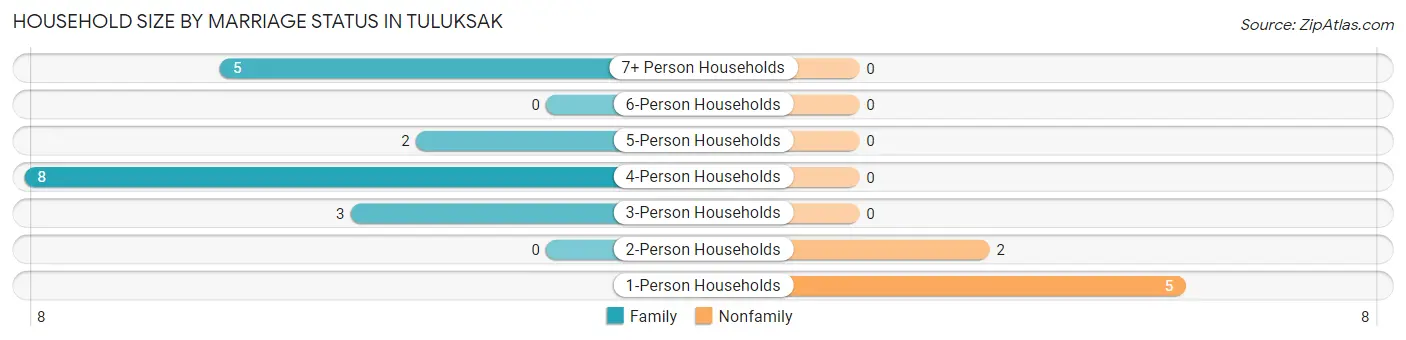
| Household Size | Family Households | Nonfamily Households |
| 1-Person Households | - | 5 (20.0%) |
| 2-Person Households | 0 (0.0%) | 2 (8.0%) |
| 3-Person Households | 3 (12.0%) | 0 (0.0%) |
| 4-Person Households | 8 (32.0%) | 0 (0.0%) |
| 5-Person Households | 2 (8.0%) | 0 (0.0%) |
| 6-Person Households | 0 (0.0%) | 0 (0.0%) |
| 7+ Person Households | 5 (20.0%) | 0 (0.0%) |
| Total | 18 (72.0%) | 7 (28.0%) |
Female Fertility in Tuluksak
Fertility by Age in Tuluksak
Average fertility rate in Tuluksak is 63.0 births per 1,000 women. Women in the age bracket of 20 to 34 years have the highest fertility rate with 250.0 births per 1,000 women. Women in the age bracket of 20 to 34 years acount for 100.0% of all women with births.
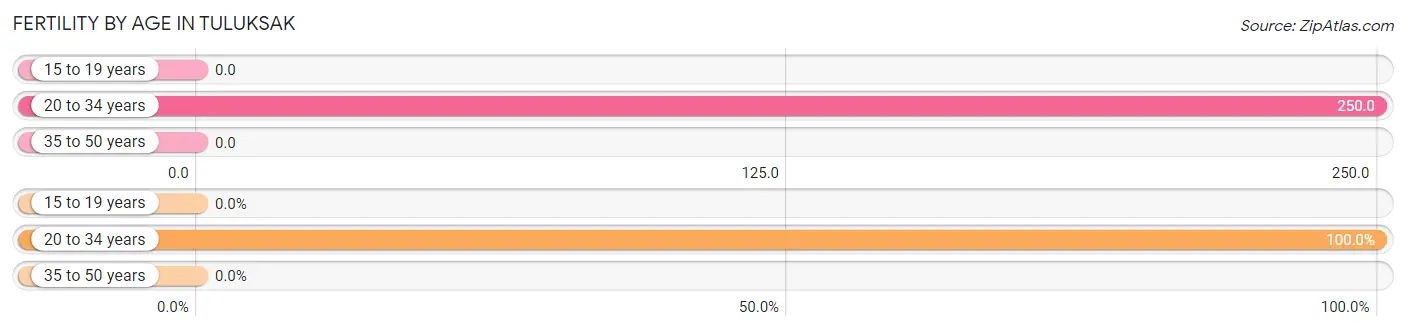
| Age Bracket | Women with Births | Births / 1,000 Women |
| 15 to 19 years | 0 (0.0%) | 0.0 |
| 20 to 34 years | 1 (100.0%) | 250.0 |
| 35 to 50 years | 0 (0.0%) | 0.0 |
| Total | 1 (100.0%) | 63.0 |
Fertility by Age by Marriage Status in Tuluksak
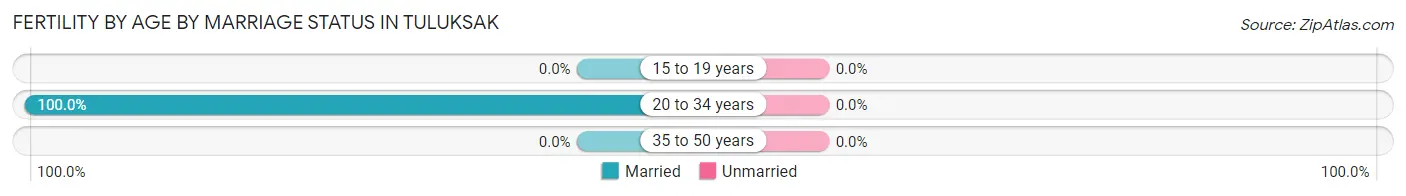
| Age Bracket | Married | Unmarried |
| 15 to 19 years | 0 (0.0%) | 0 (0.0%) |
| 20 to 34 years | 1 (100.0%) | 0 (0.0%) |
| 35 to 50 years | 0 (0.0%) | 0 (0.0%) |
| Total | 1 (100.0%) | 0 (0.0%) |
Fertility by Education in Tuluksak
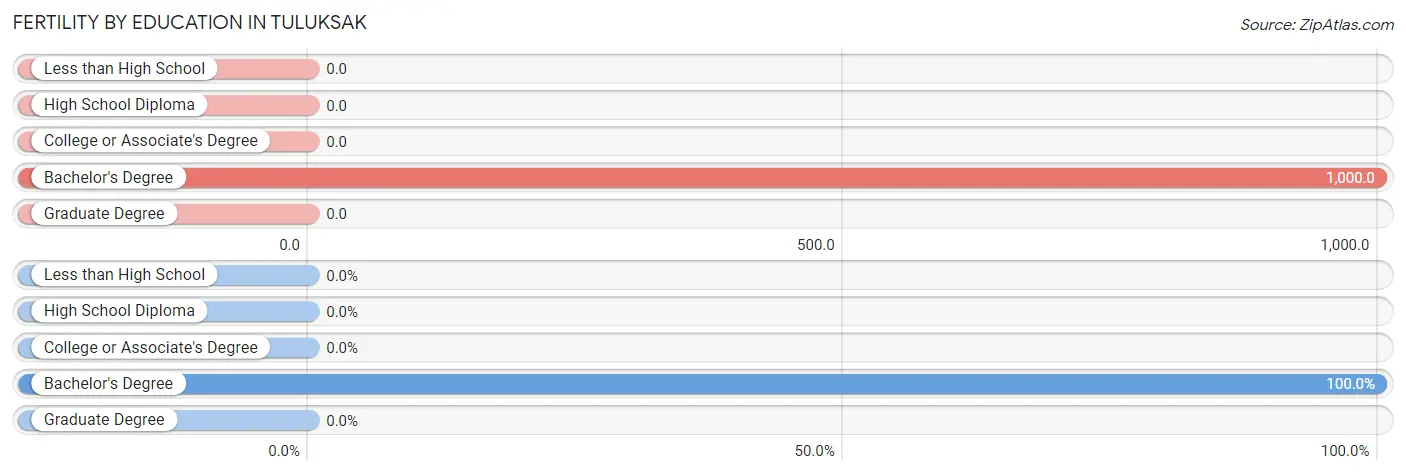
| Educational Attainment | Women with Births | Births / 1,000 Women |
| Less than High School | 0 (0.0%) | 0.0 |
| High School Diploma | 0 (0.0%) | 0.0 |
| College or Associate's Degree | 0 (0.0%) | 0.0 |
| Bachelor's Degree | 1 (100.0%) | 1,000.0 |
| Graduate Degree | 0 (0.0%) | 0.0 |
| Total | 1 (100.0%) | 63.0 |
Fertility by Education by Marriage Status in Tuluksak
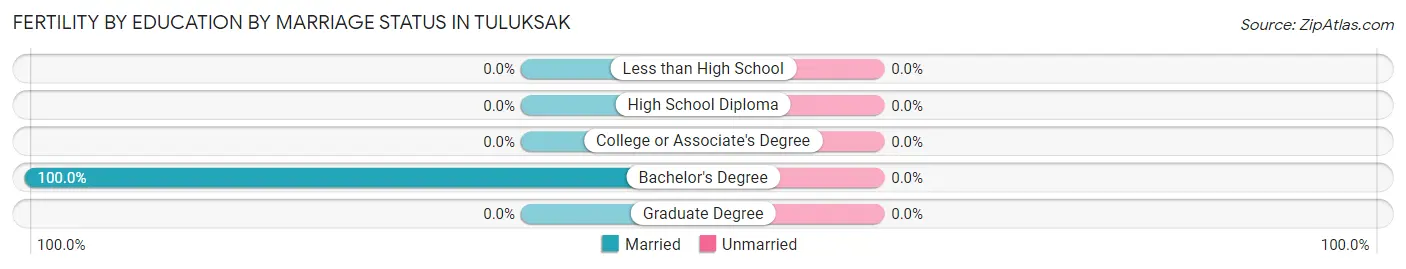
| Educational Attainment | Married | Unmarried |
| Less than High School | 0 (0.0%) | 0 (0.0%) |
| High School Diploma | 0 (0.0%) | 0 (0.0%) |
| College or Associate's Degree | 0 (0.0%) | 0 (0.0%) |
| Bachelor's Degree | 1 (100.0%) | 0 (0.0%) |
| Graduate Degree | 0 (0.0%) | 0 (0.0%) |
| Total | 1 (100.0%) | 0 (0.0%) |
Employment Characteristics in Tuluksak
Employment by Class of Employer in Tuluksak
Among the 383 employed individuals in Tuluksak, private company employees (364 | 95.0%), local government employees (12 | 3.1%), and federal government employees (4 | 1.0%) make up the most common classes of employment.
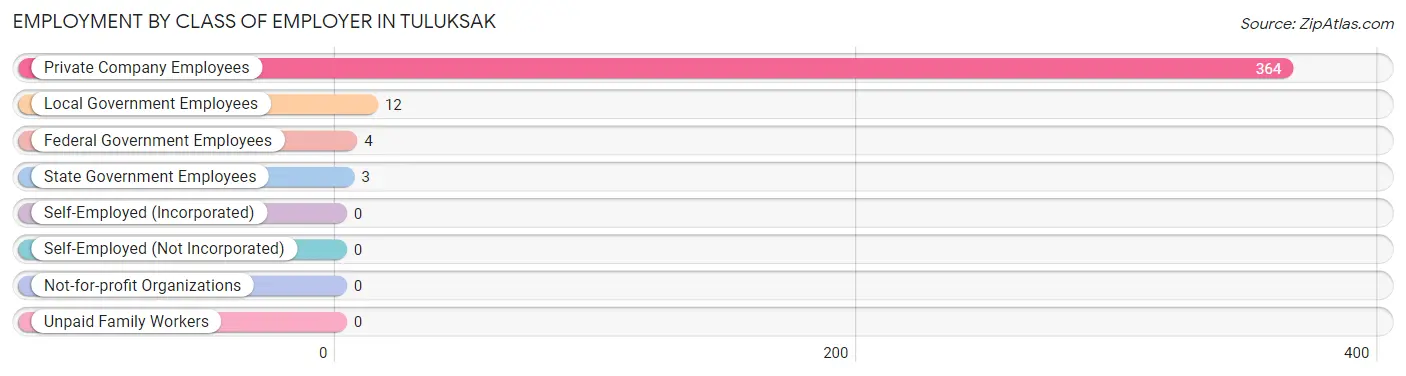
| Employer Class | # Employees | % Employees |
| Private Company Employees | 364 | 95.0% |
| Self-Employed (Incorporated) | 0 | 0.0% |
| Self-Employed (Not Incorporated) | 0 | 0.0% |
| Not-for-profit Organizations | 0 | 0.0% |
| Local Government Employees | 12 | 3.1% |
| State Government Employees | 3 | 0.8% |
| Federal Government Employees | 4 | 1.0% |
| Unpaid Family Workers | 0 | 0.0% |
| Total | 383 | 100.0% |
Employment Status by Age in Tuluksak
According to the labor force statistics for Tuluksak, out of the total population over 16 years of age (422), 92.2% or 389 individuals are in the labor force, with 1.5% or 6 of them unemployed. The age group with the highest labor force participation rate is 30 to 34 years, with 100.0% or 199 individuals in the labor force. Within the labor force, the 20 to 24 years age range has the highest percentage of unemployed individuals, with 100.0% or 2 of them being unemployed.
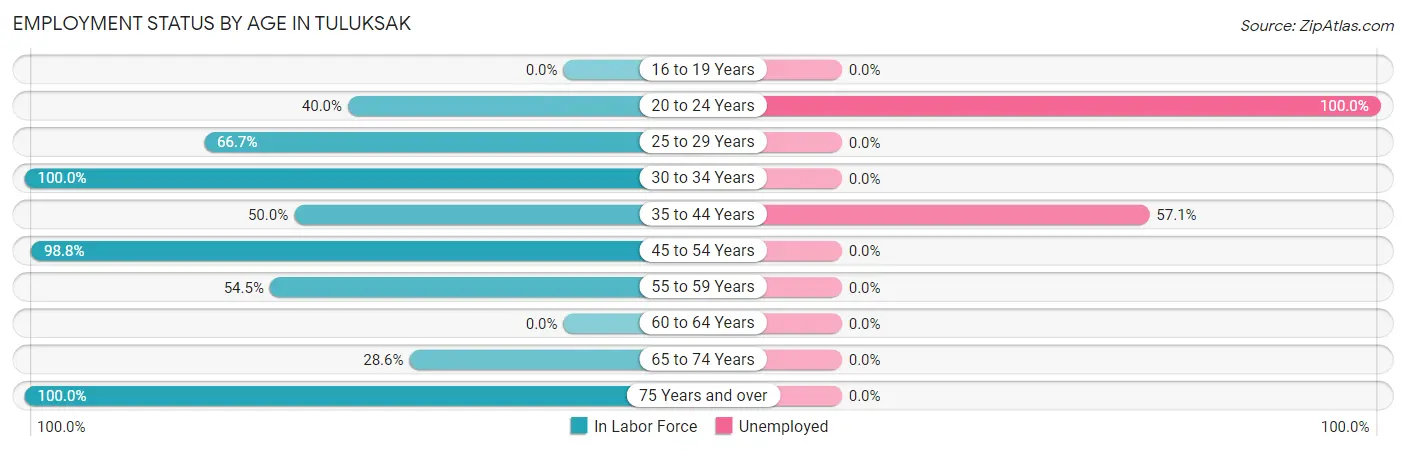
| Age Bracket | In Labor Force | Unemployed |
| 16 to 19 Years | 0 (0.0%) | 0 (0.0%) |
| 20 to 24 Years | 2 (40.0%) | 2 (100.0%) |
| 25 to 29 Years | 6 (66.7%) | 0 (0.0%) |
| 30 to 34 Years | 199 (100.0%) | 0 (0.0%) |
| 35 to 44 Years | 7 (50.0%) | 4 (57.1%) |
| 45 to 54 Years | 164 (98.8%) | 0 (0.0%) |
| 55 to 59 Years | 6 (54.5%) | 0 (0.0%) |
| 60 to 64 Years | 0 (0.0%) | 0 (0.0%) |
| 65 to 74 Years | 2 (28.6%) | 0 (0.0%) |
| 75 Years and over | 3 (100.0%) | 0 (0.0%) |
| Total | 389 (92.2%) | 6 (1.5%) |
Employment Status by Educational Attainment in Tuluksak
According to labor force statistics for Tuluksak, 95.7% of individuals (382) out of the total population between 25 and 64 years of age (399) are in the labor force, with 1.0% or 4 of them being unemployed. The group with the highest labor force participation rate are those with the educational attainment of college / associate degree, with 100.0% or 360 individuals in the labor force. Within the labor force, individuals with high school diploma education have the highest percentage of unemployment, with 25.0% or 4 of them being unemployed.
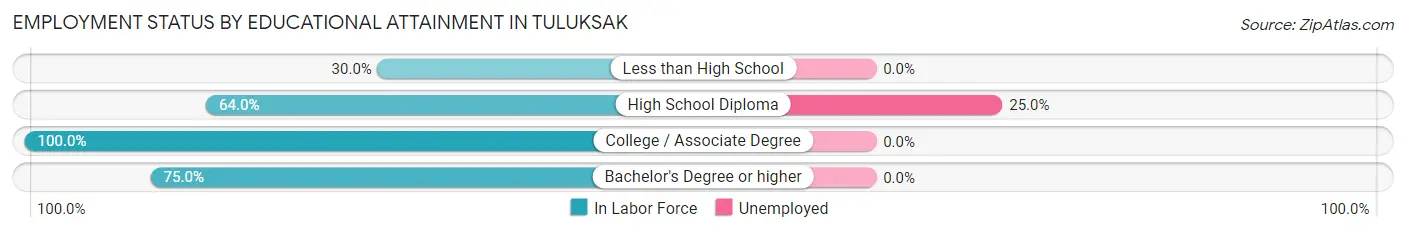
| Educational Attainment | In Labor Force | Unemployed |
| Less than High School | 3 (30.0%) | 0 (0.0%) |
| High School Diploma | 16 (64.0%) | 6 (25.0%) |
| College / Associate Degree | 360 (100.0%) | 0 (0.0%) |
| Bachelor's Degree or higher | 3 (75.0%) | 0 (0.0%) |
| Total | 382 (95.7%) | 4 (1.0%) |
Employment Occupations by Sex in Tuluksak
Management, Business, Science and Arts Occupations
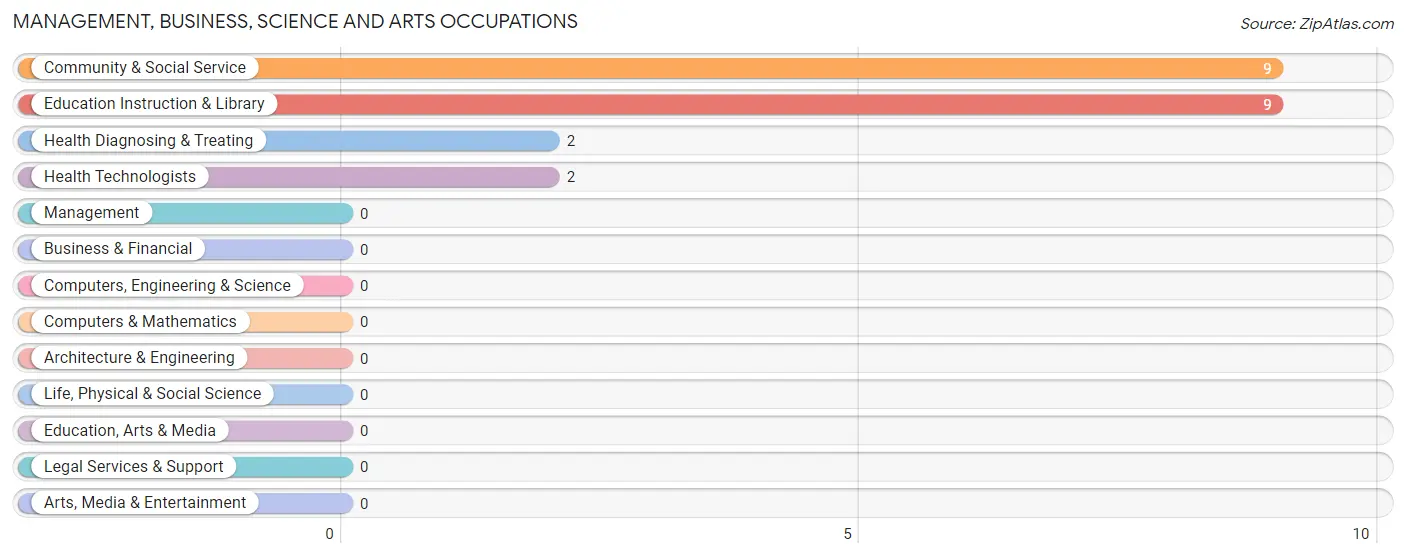
The most common Management, Business, Science and Arts occupations in Tuluksak are Community & Social Service (9 | 2.4%), Education Instruction & Library (9 | 2.4%), Health Diagnosing & Treating (2 | 0.5%), and Health Technologists (2 | 0.5%).
Management, Business, Science and Arts Occupations by Sex
Within the Management, Business, Science and Arts occupations in Tuluksak, the most male-oriented occupations are Community & Social Service (33.3%), and Education Instruction & Library (33.3%), while the most female-oriented occupations are Health Diagnosing & Treating (100.0%), Health Technologists (100.0%), and Community & Social Service (66.7%).
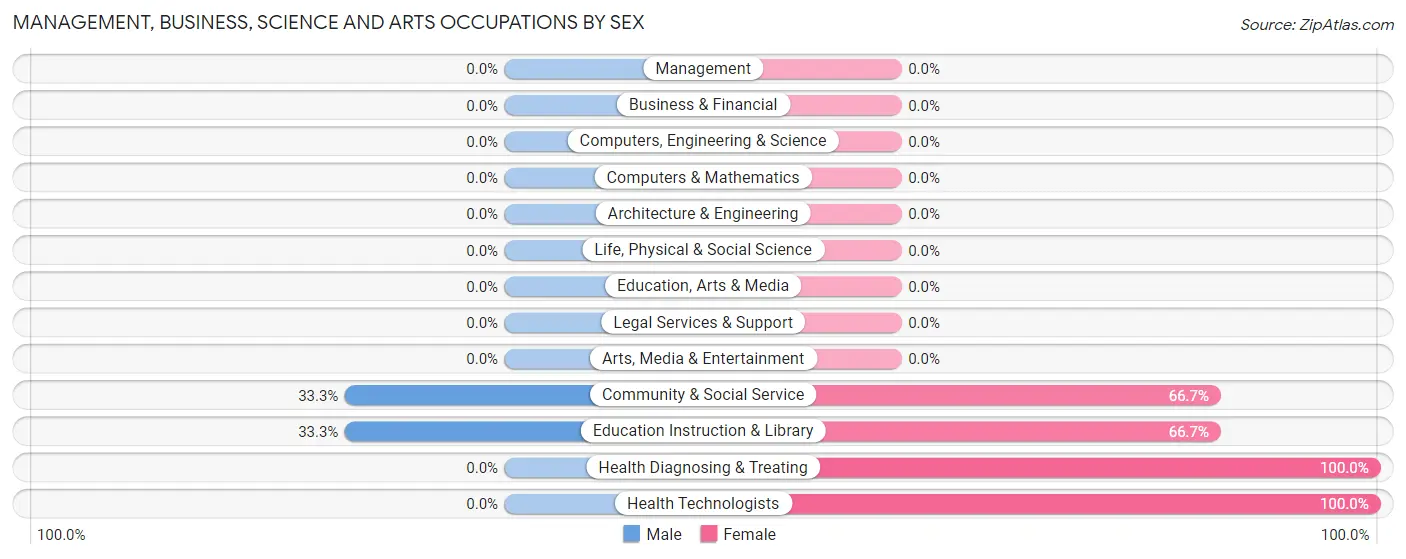
| Occupation | Male | Female |
| Management | 0 (0.0%) | 0 (0.0%) |
| Business & Financial | 0 (0.0%) | 0 (0.0%) |
| Computers, Engineering & Science | 0 (0.0%) | 0 (0.0%) |
| Computers & Mathematics | 0 (0.0%) | 0 (0.0%) |
| Architecture & Engineering | 0 (0.0%) | 0 (0.0%) |
| Life, Physical & Social Science | 0 (0.0%) | 0 (0.0%) |
| Community & Social Service | 3 (33.3%) | 6 (66.7%) |
| Education, Arts & Media | 0 (0.0%) | 0 (0.0%) |
| Legal Services & Support | 0 (0.0%) | 0 (0.0%) |
| Education Instruction & Library | 3 (33.3%) | 6 (66.7%) |
| Arts, Media & Entertainment | 0 (0.0%) | 0 (0.0%) |
| Health Diagnosing & Treating | 0 (0.0%) | 2 (100.0%) |
| Health Technologists | 0 (0.0%) | 2 (100.0%) |
| Total (Category) | 3 (27.3%) | 8 (72.7%) |
| Total (Overall) | 372 (97.1%) | 11 (2.9%) |
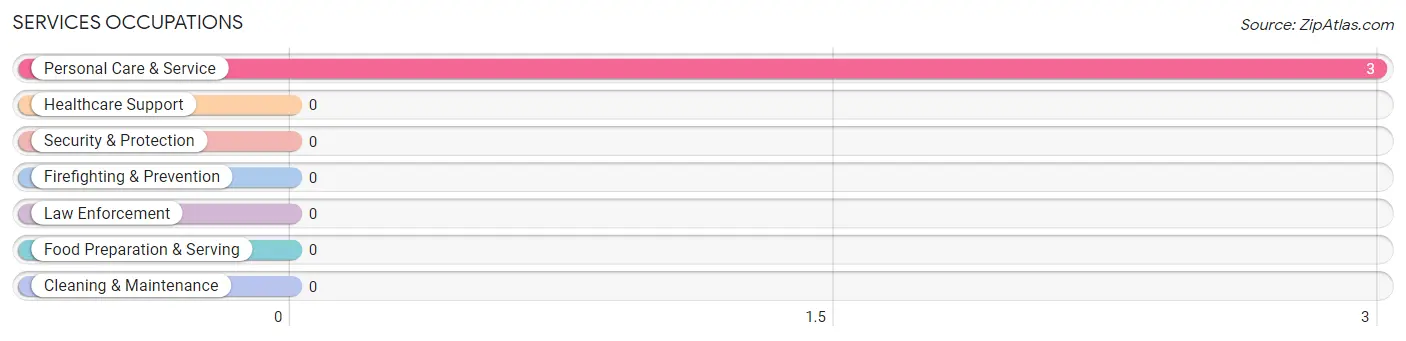
Services Occupations
The most common Services occupations in Tuluksak are , and Personal Care & Service (3 | 0.8%).
Services Occupations by Sex
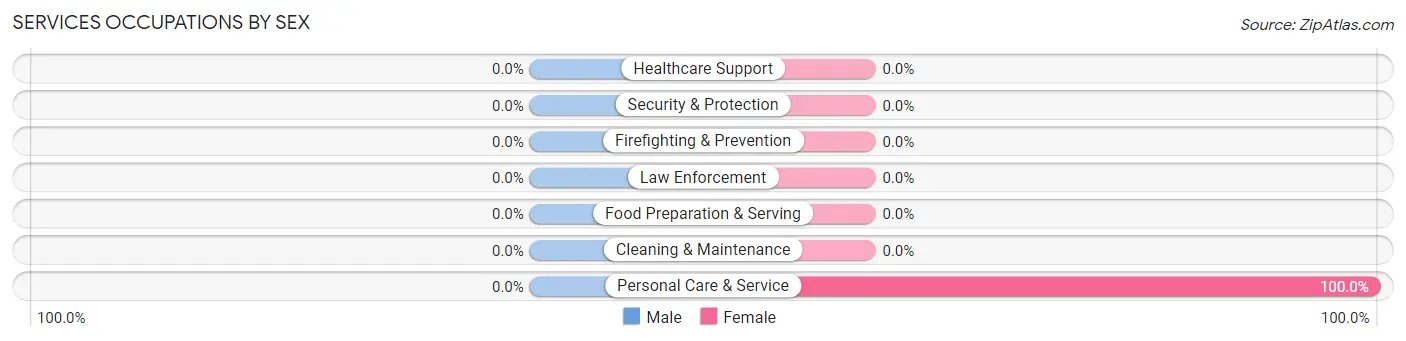
| Occupation | Male | Female |
| Healthcare Support | 0 (0.0%) | 0 (0.0%) |
| Security & Protection | 0 (0.0%) | 0 (0.0%) |
| Firefighting & Prevention | 0 (0.0%) | 0 (0.0%) |
| Law Enforcement | 0 (0.0%) | 0 (0.0%) |
| Food Preparation & Serving | 0 (0.0%) | 0 (0.0%) |
| Cleaning & Maintenance | 0 (0.0%) | 0 (0.0%) |
| Personal Care & Service | 0 (0.0%) | 3 (100.0%) |
| Total (Category) | 0 (0.0%) | 3 (100.0%) |
| Total (Overall) | 372 (97.1%) | 11 (2.9%) |
Sales and Office Occupations
The most common Sales and Office occupations in Tuluksak are , and Office & Administration (7 | 1.8%).
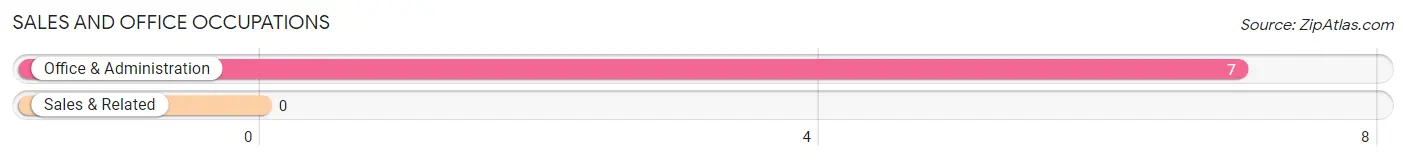
Sales and Office Occupations by Sex
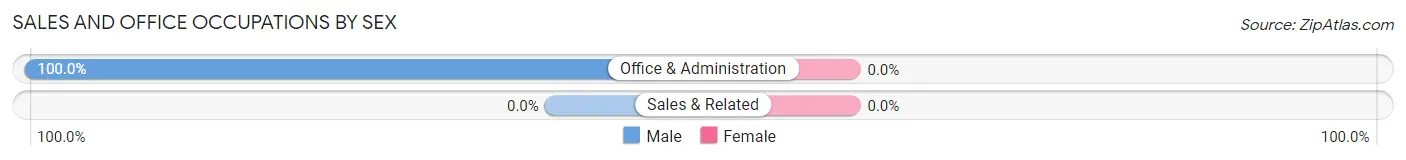
| Occupation | Male | Female |
| Sales & Related | 0 (0.0%) | 0 (0.0%) |
| Office & Administration | 7 (100.0%) | 0 (0.0%) |
| Total (Category) | 7 (100.0%) | 0 (0.0%) |
| Total (Overall) | 372 (97.1%) | 11 (2.9%) |
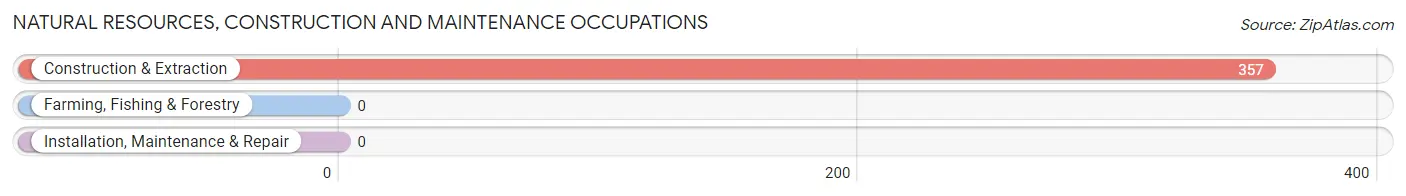
Natural Resources, Construction and Maintenance Occupations
The most common Natural Resources, Construction and Maintenance occupations in Tuluksak are , and Construction & Extraction (357 | 93.2%).
Natural Resources, Construction and Maintenance Occupations by Sex
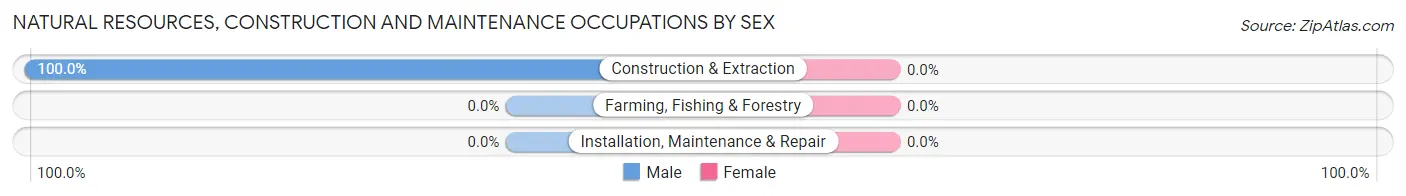
| Occupation | Male | Female |
| Farming, Fishing & Forestry | 0 (0.0%) | 0 (0.0%) |
| Construction & Extraction | 357 (100.0%) | 0 (0.0%) |
| Installation, Maintenance & Repair | 0 (0.0%) | 0 (0.0%) |
| Total (Category) | 357 (100.0%) | 0 (0.0%) |
| Total (Overall) | 372 (97.1%) | 11 (2.9%) |
Production, Transportation and Moving Occupations
The most common Production, Transportation and Moving occupations in Tuluksak are , and Material Moving (5 | 1.3%).
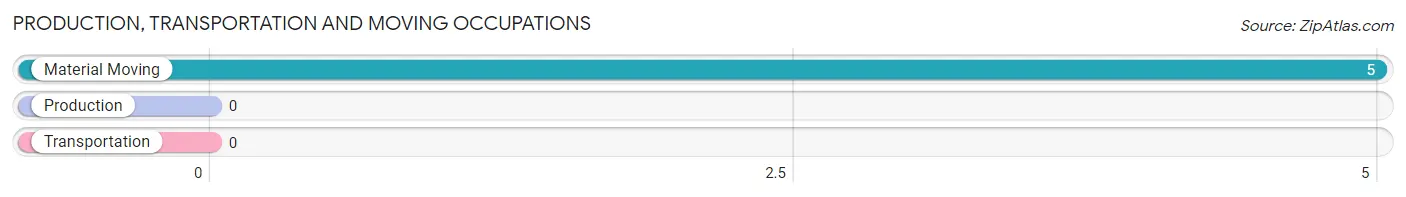
Production, Transportation and Moving Occupations by Sex
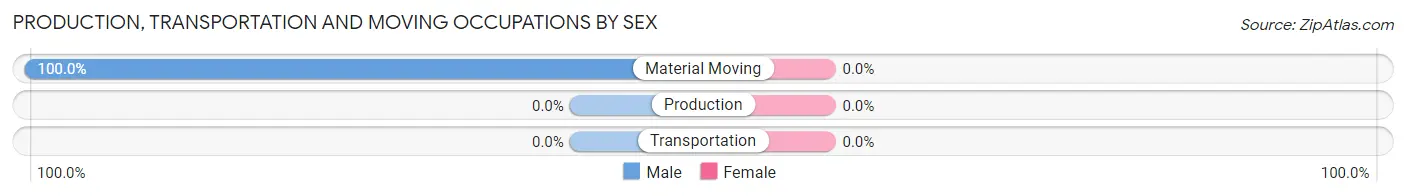
| Occupation | Male | Female |
| Production | 0 (0.0%) | 0 (0.0%) |
| Transportation | 0 (0.0%) | 0 (0.0%) |
| Material Moving | 5 (100.0%) | 0 (0.0%) |
| Total (Category) | 5 (100.0%) | 0 (0.0%) |
| Total (Overall) | 372 (97.1%) | 11 (2.9%) |
Employment Industries by Sex in Tuluksak
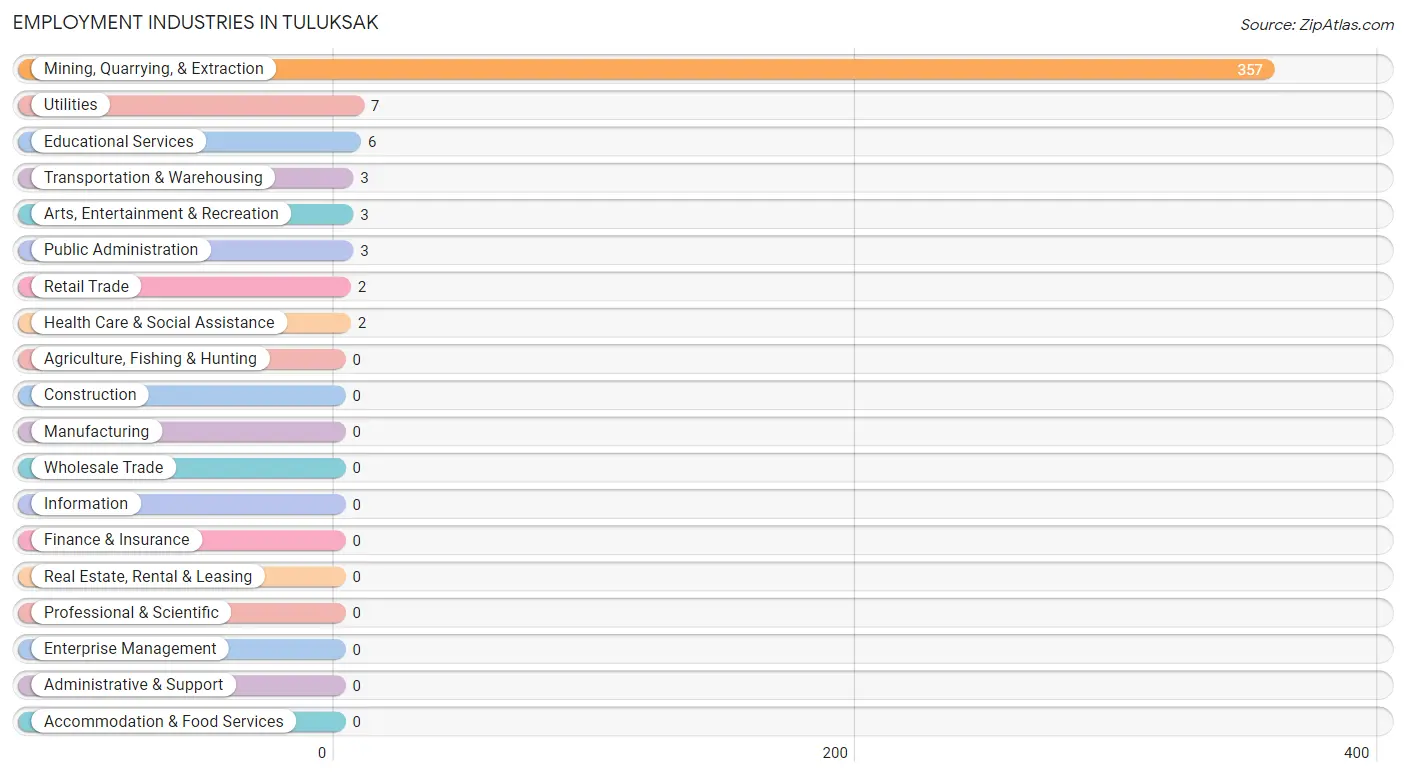
Employment Industries in Tuluksak
The major employment industries in Tuluksak include Mining, Quarrying, & Extraction (357 | 93.2%), Utilities (7 | 1.8%), Educational Services (6 | 1.6%), Transportation & Warehousing (3 | 0.8%), and Arts, Entertainment & Recreation (3 | 0.8%).
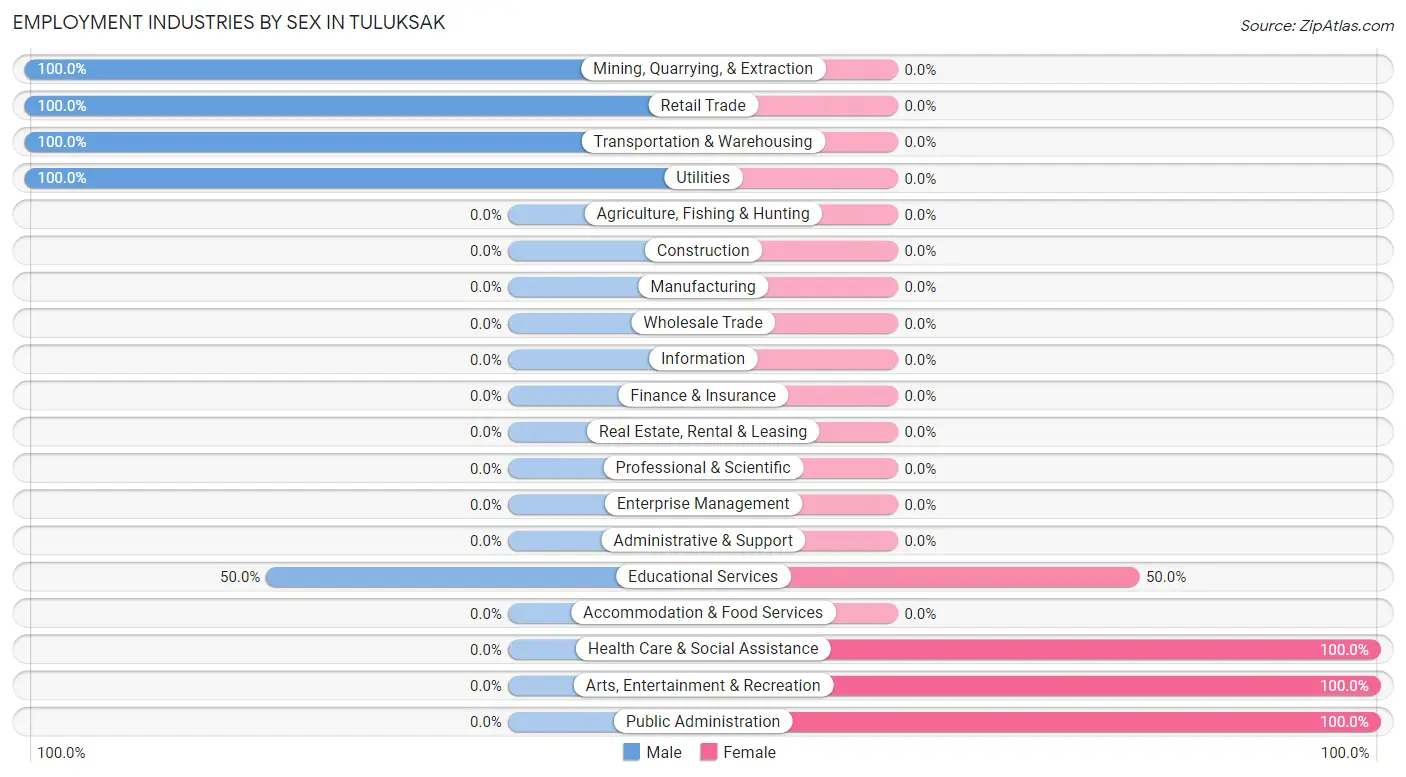
Employment Industries by Sex in Tuluksak
The Tuluksak industries that see more men than women are Mining, Quarrying, & Extraction (100.0%), Retail Trade (100.0%), and Transportation & Warehousing (100.0%), whereas the industries that tend to have a higher number of women are Health Care & Social Assistance (100.0%), Arts, Entertainment & Recreation (100.0%), and Public Administration (100.0%).
| Industry | Male | Female |
| Agriculture, Fishing & Hunting | 0 (0.0%) | 0 (0.0%) |
| Mining, Quarrying, & Extraction | 357 (100.0%) | 0 (0.0%) |
| Construction | 0 (0.0%) | 0 (0.0%) |
| Manufacturing | 0 (0.0%) | 0 (0.0%) |
| Wholesale Trade | 0 (0.0%) | 0 (0.0%) |
| Retail Trade | 2 (100.0%) | 0 (0.0%) |
| Transportation & Warehousing | 3 (100.0%) | 0 (0.0%) |
| Utilities | 7 (100.0%) | 0 (0.0%) |
| Information | 0 (0.0%) | 0 (0.0%) |
| Finance & Insurance | 0 (0.0%) | 0 (0.0%) |
| Real Estate, Rental & Leasing | 0 (0.0%) | 0 (0.0%) |
| Professional & Scientific | 0 (0.0%) | 0 (0.0%) |
| Enterprise Management | 0 (0.0%) | 0 (0.0%) |
| Administrative & Support | 0 (0.0%) | 0 (0.0%) |
| Educational Services | 3 (50.0%) | 3 (50.0%) |
| Health Care & Social Assistance | 0 (0.0%) | 2 (100.0%) |
| Arts, Entertainment & Recreation | 0 (0.0%) | 3 (100.0%) |
| Accommodation & Food Services | 0 (0.0%) | 0 (0.0%) |
| Public Administration | 0 (0.0%) | 3 (100.0%) |
| Total | 372 (97.1%) | 11 (2.9%) |
Education in Tuluksak
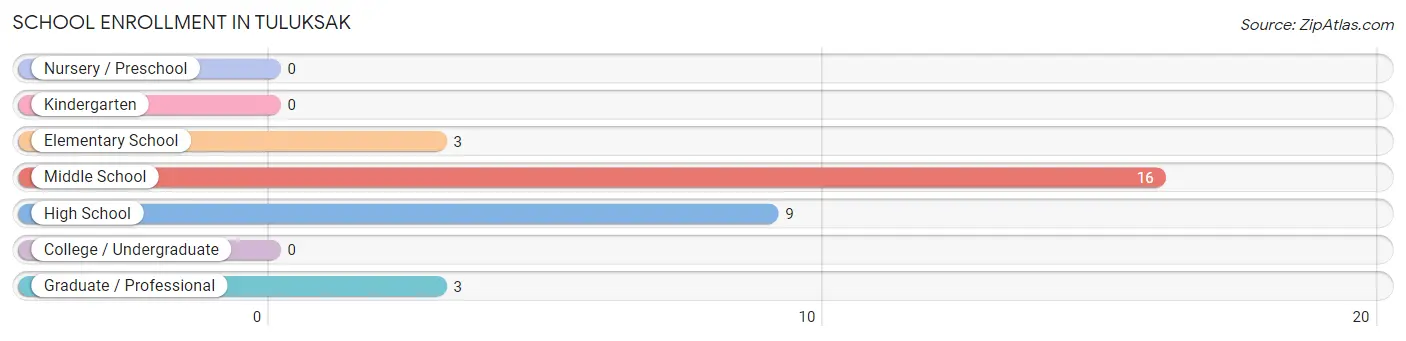
School Enrollment in Tuluksak
The most common levels of schooling among the 31 students in Tuluksak are middle school (16 | 51.6%), high school (9 | 29.0%), and elementary school (3 | 9.7%).
| School Level | # Students | % Students |
| Nursery / Preschool | 0 | 0.0% |
| Kindergarten | 0 | 0.0% |
| Elementary School | 3 | 9.7% |
| Middle School | 16 | 51.6% |
| High School | 9 | 29.0% |
| College / Undergraduate | 0 | 0.0% |
| Graduate / Professional | 3 | 9.7% |
| Total | 31 | 100.0% |
School Enrollment by Age by Funding Source in Tuluksak
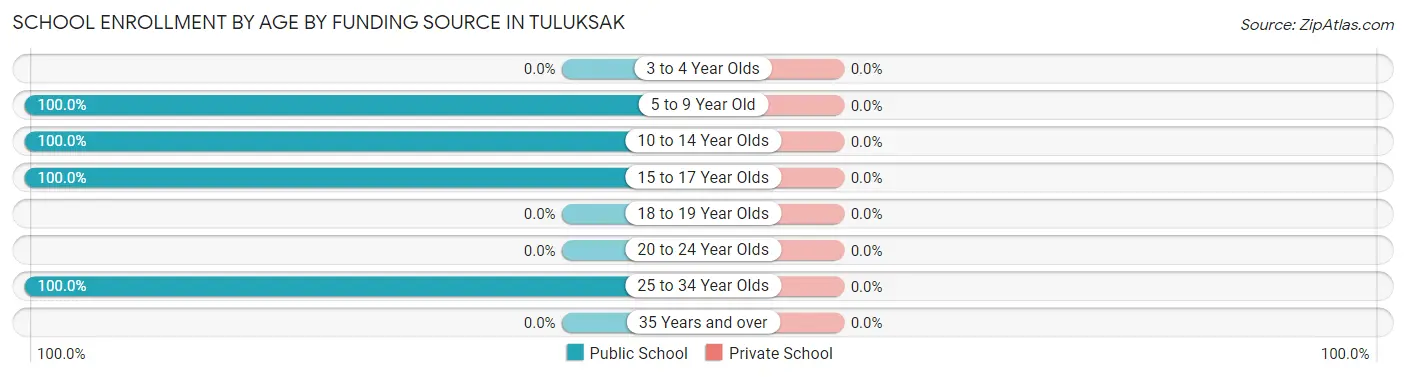
| Age Bracket | Public School | Private School |
| 3 to 4 Year Olds | 0 (0.0%) | 0 (0.0%) |
| 5 to 9 Year Old | 3 (100.0%) | 0 (0.0%) |
| 10 to 14 Year Olds | 16 (100.0%) | 0 (0.0%) |
| 15 to 17 Year Olds | 9 (100.0%) | 0 (0.0%) |
| 18 to 19 Year Olds | 0 (0.0%) | 0 (0.0%) |
| 20 to 24 Year Olds | 0 (0.0%) | 0 (0.0%) |
| 25 to 34 Year Olds | 3 (100.0%) | 0 (0.0%) |
| 35 Years and over | 0 (0.0%) | 0 (0.0%) |
| Total | 31 (100.0%) | 0 (0.0%) |
Educational Attainment by Field of Study in Tuluksak
Engineering (3 | 42.9%), education (3 | 42.9%), and business (1 | 14.3%) are the most common fields of study among 7 individuals in Tuluksak who have obtained a bachelor's degree or higher.
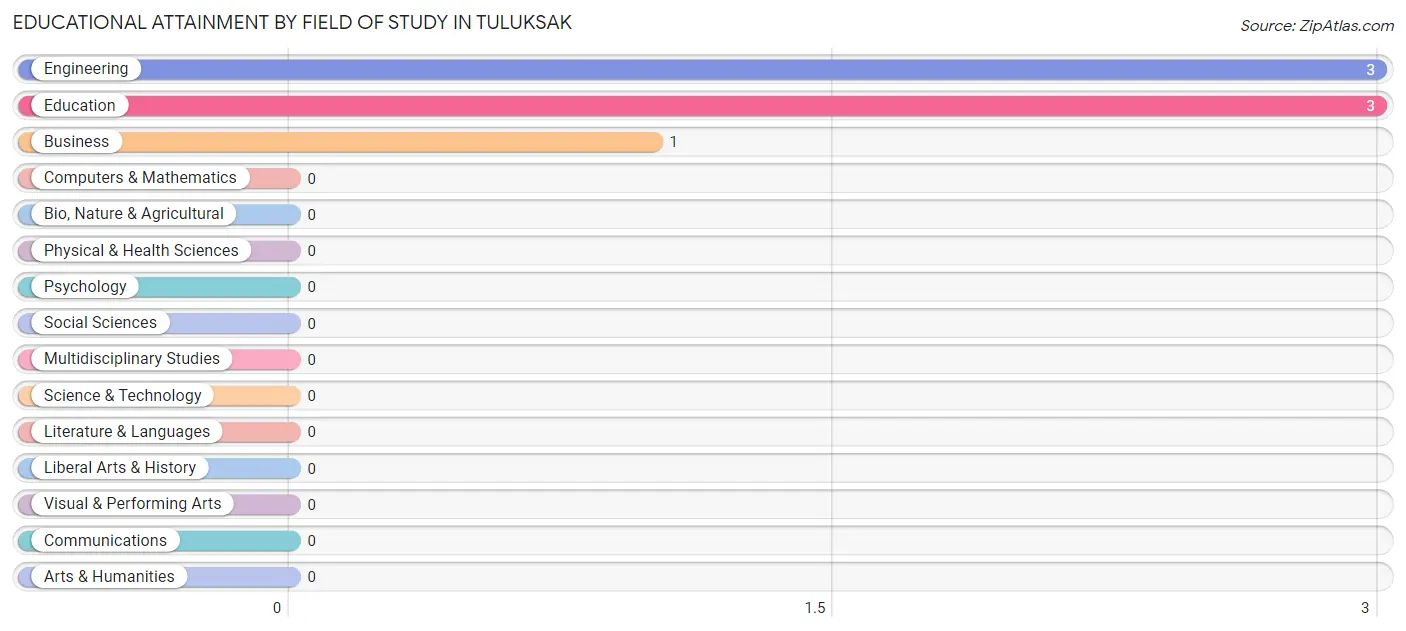
| Field of Study | # Graduates | % Graduates |
| Computers & Mathematics | 0 | 0.0% |
| Bio, Nature & Agricultural | 0 | 0.0% |
| Physical & Health Sciences | 0 | 0.0% |
| Psychology | 0 | 0.0% |
| Social Sciences | 0 | 0.0% |
| Engineering | 3 | 42.9% |
| Multidisciplinary Studies | 0 | 0.0% |
| Science & Technology | 0 | 0.0% |
| Business | 1 | 14.3% |
| Education | 3 | 42.9% |
| Literature & Languages | 0 | 0.0% |
| Liberal Arts & History | 0 | 0.0% |
| Visual & Performing Arts | 0 | 0.0% |
| Communications | 0 | 0.0% |
| Arts & Humanities | 0 | 0.0% |
| Total | 7 | 100.0% |
Transportation & Commute in Tuluksak
Vehicle Availability by Sex in Tuluksak
The most prevalent vehicle ownership categories in Tuluksak are males with no vehicle (9, accounting for 60.0%) and females with no vehicle (9, making up 81.8%).
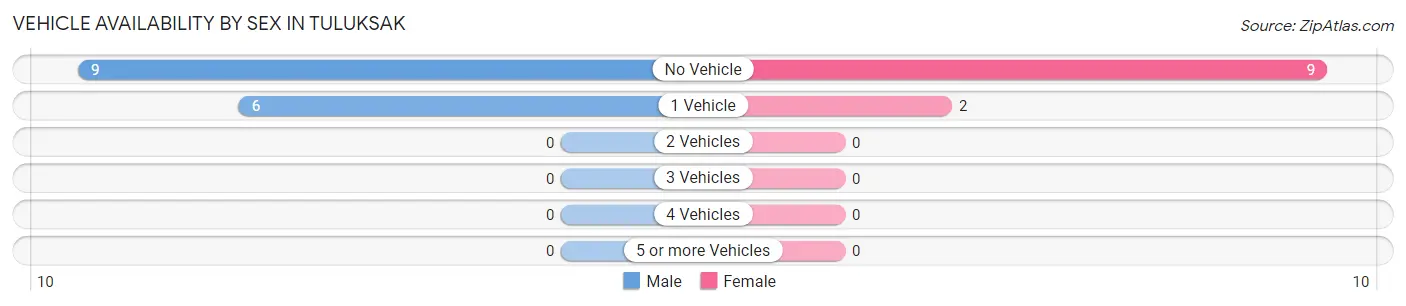
| Vehicles Available | Male | Female |
| No Vehicle | 9 (60.0%) | 9 (81.8%) |
| 1 Vehicle | 6 (40.0%) | 2 (18.2%) |
| 2 Vehicles | 0 (0.0%) | 0 (0.0%) |
| 3 Vehicles | 0 (0.0%) | 0 (0.0%) |
| 4 Vehicles | 0 (0.0%) | 0 (0.0%) |
| 5 or more Vehicles | 0 (0.0%) | 0 (0.0%) |
| Total | 15 (100.0%) | 11 (100.0%) |
Commute Time in Tuluksak
The most frequently occuring commute durations in Tuluksak are 5 to 9 minutes (374 commuters, 98.7%), less than 5 minutes (3 commuters, 0.8%), and 10 to 14 minutes (2 commuters, 0.5%).
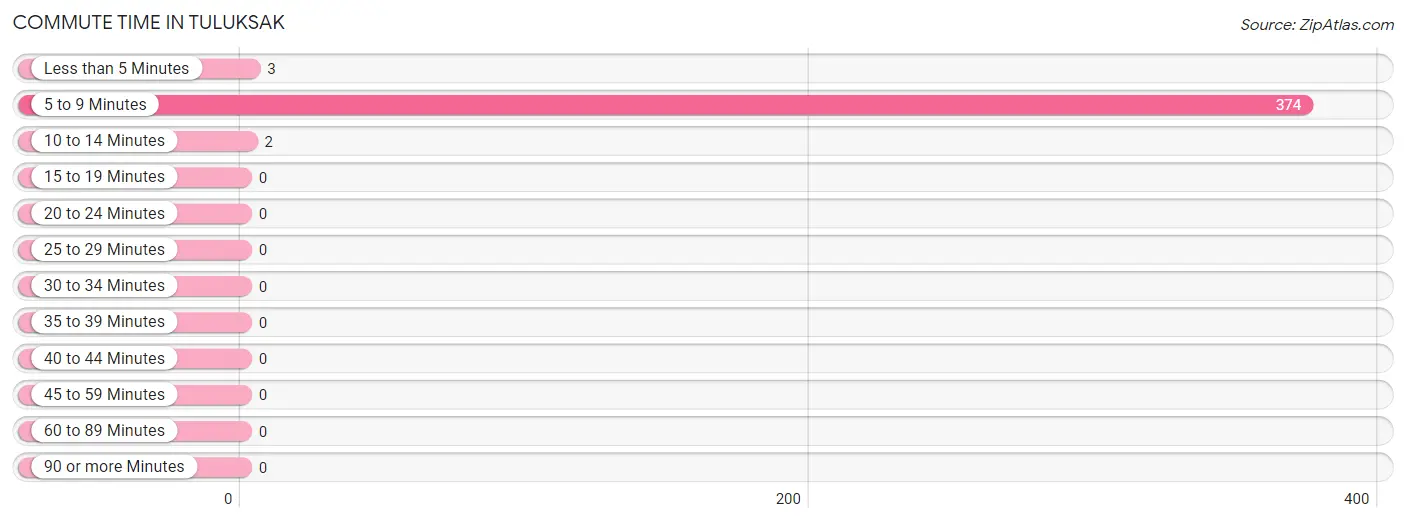
| Commute Time | # Commuters | % Commuters |
| Less than 5 Minutes | 3 | 0.8% |
| 5 to 9 Minutes | 374 | 98.7% |
| 10 to 14 Minutes | 2 | 0.5% |
| 15 to 19 Minutes | 0 | 0.0% |
| 20 to 24 Minutes | 0 | 0.0% |
| 25 to 29 Minutes | 0 | 0.0% |
| 30 to 34 Minutes | 0 | 0.0% |
| 35 to 39 Minutes | 0 | 0.0% |
| 40 to 44 Minutes | 0 | 0.0% |
| 45 to 59 Minutes | 0 | 0.0% |
| 60 to 89 Minutes | 0 | 0.0% |
| 90 or more Minutes | 0 | 0.0% |
Commute Time by Sex in Tuluksak
The most common commute times in Tuluksak are 5 to 9 minutes (363 commuters, 98.6%) for males and 5 to 9 minutes (11 commuters, 100.0%) for females.
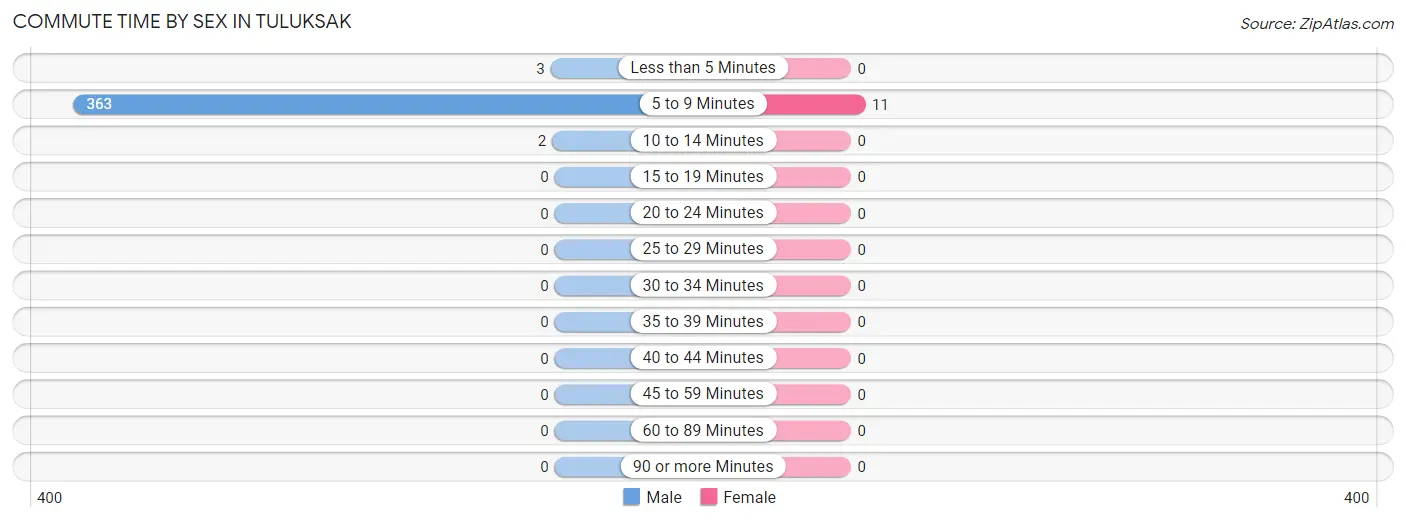
| Commute Time | Male | Female |
| Less than 5 Minutes | 3 (0.8%) | 0 (0.0%) |
| 5 to 9 Minutes | 363 (98.6%) | 11 (100.0%) |
| 10 to 14 Minutes | 2 (0.5%) | 0 (0.0%) |
| 15 to 19 Minutes | 0 (0.0%) | 0 (0.0%) |
| 20 to 24 Minutes | 0 (0.0%) | 0 (0.0%) |
| 25 to 29 Minutes | 0 (0.0%) | 0 (0.0%) |
| 30 to 34 Minutes | 0 (0.0%) | 0 (0.0%) |
| 35 to 39 Minutes | 0 (0.0%) | 0 (0.0%) |
| 40 to 44 Minutes | 0 (0.0%) | 0 (0.0%) |
| 45 to 59 Minutes | 0 (0.0%) | 0 (0.0%) |
| 60 to 89 Minutes | 0 (0.0%) | 0 (0.0%) |
| 90 or more Minutes | 0 (0.0%) | 0 (0.0%) |
Time of Departure to Work by Sex in Tuluksak
The most frequent times of departure to work in Tuluksak are 6:00 AM to 6:29 AM (202, 54.9%) for males and 4:00 PM to 11:59 PM (5, 45.5%) for females.
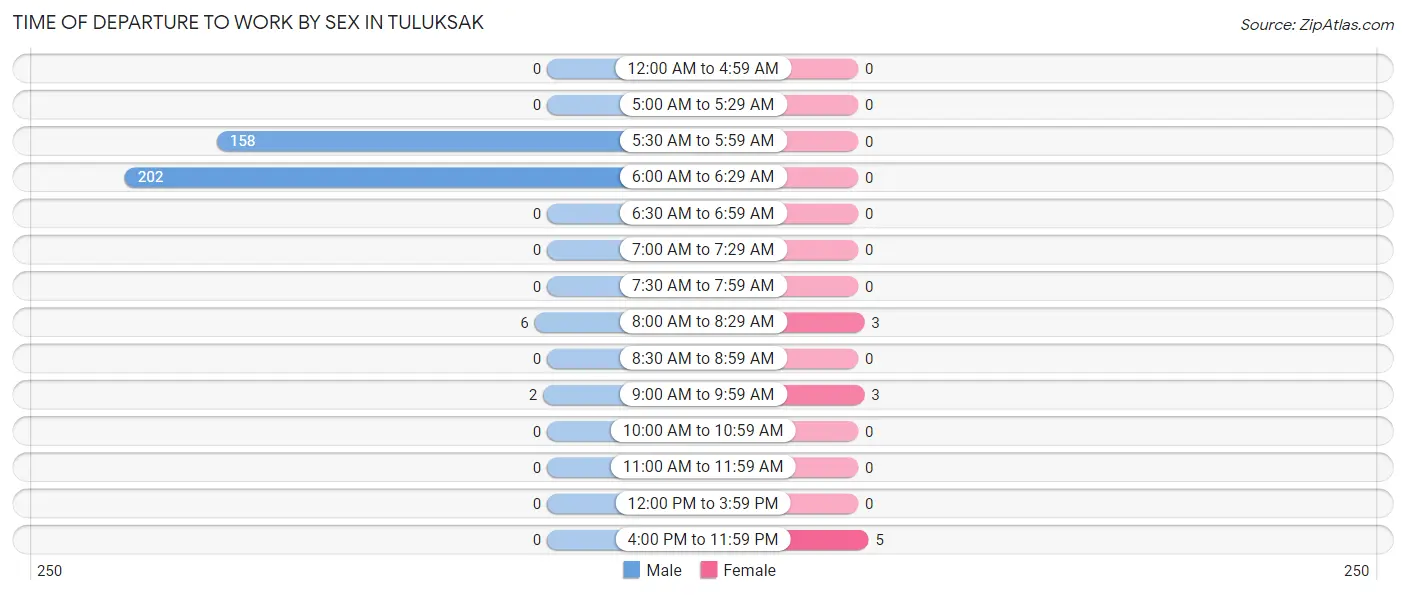
| Time of Departure | Male | Female |
| 12:00 AM to 4:59 AM | 0 (0.0%) | 0 (0.0%) |
| 5:00 AM to 5:29 AM | 0 (0.0%) | 0 (0.0%) |
| 5:30 AM to 5:59 AM | 158 (42.9%) | 0 (0.0%) |
| 6:00 AM to 6:29 AM | 202 (54.9%) | 0 (0.0%) |
| 6:30 AM to 6:59 AM | 0 (0.0%) | 0 (0.0%) |
| 7:00 AM to 7:29 AM | 0 (0.0%) | 0 (0.0%) |
| 7:30 AM to 7:59 AM | 0 (0.0%) | 0 (0.0%) |
| 8:00 AM to 8:29 AM | 6 (1.6%) | 3 (27.3%) |
| 8:30 AM to 8:59 AM | 0 (0.0%) | 0 (0.0%) |
| 9:00 AM to 9:59 AM | 2 (0.5%) | 3 (27.3%) |
| 10:00 AM to 10:59 AM | 0 (0.0%) | 0 (0.0%) |
| 11:00 AM to 11:59 AM | 0 (0.0%) | 0 (0.0%) |
| 12:00 PM to 3:59 PM | 0 (0.0%) | 0 (0.0%) |
| 4:00 PM to 11:59 PM | 0 (0.0%) | 5 (45.5%) |
| Total | 368 (100.0%) | 11 (100.0%) |
Housing Occupancy in Tuluksak
Occupancy by Ownership in Tuluksak
Of the total 25 dwellings in Tuluksak, owner-occupied units account for 9 (36.0%), while renter-occupied units make up 16 (64.0%).
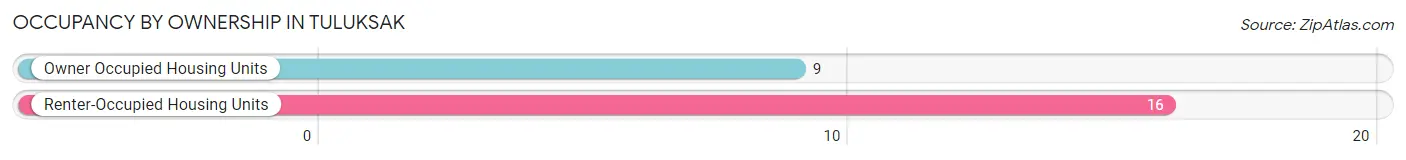
| Occupancy | # Housing Units | % Housing Units |
| Owner Occupied Housing Units | 9 | 36.0% |
| Renter-Occupied Housing Units | 16 | 64.0% |
| Total Occupied Housing Units | 25 | 100.0% |
Occupancy by Household Size in Tuluksak
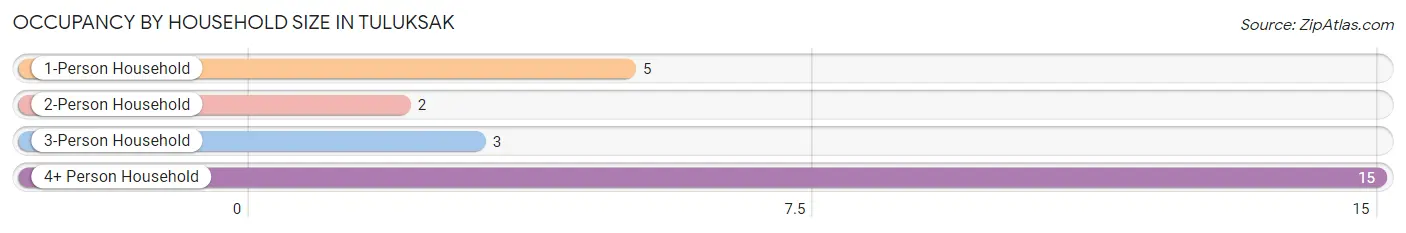
| Household Size | # Housing Units | % Housing Units |
| 1-Person Household | 5 | 20.0% |
| 2-Person Household | 2 | 8.0% |
| 3-Person Household | 3 | 12.0% |
| 4+ Person Household | 15 | 60.0% |
| Total Housing Units | 25 | 100.0% |
Occupancy by Ownership by Household Size in Tuluksak
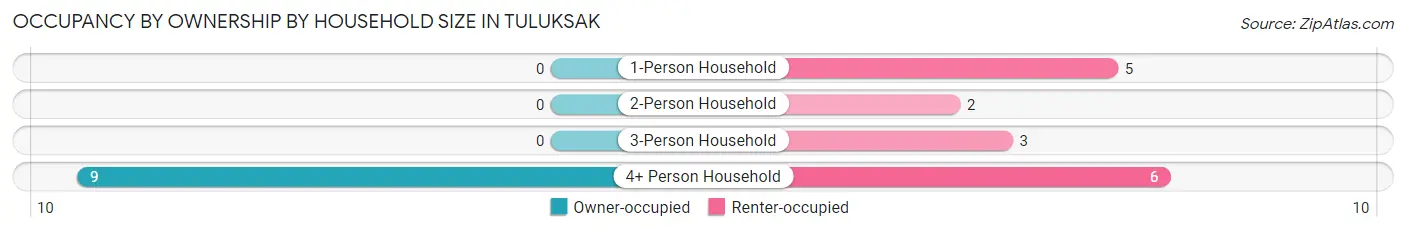
| Household Size | Owner-occupied | Renter-occupied |
| 1-Person Household | 0 (0.0%) | 5 (100.0%) |
| 2-Person Household | 0 (0.0%) | 2 (100.0%) |
| 3-Person Household | 0 (0.0%) | 3 (100.0%) |
| 4+ Person Household | 9 (60.0%) | 6 (40.0%) |
| Total Housing Units | 9 (36.0%) | 16 (64.0%) |
Occupancy by Educational Attainment in Tuluksak
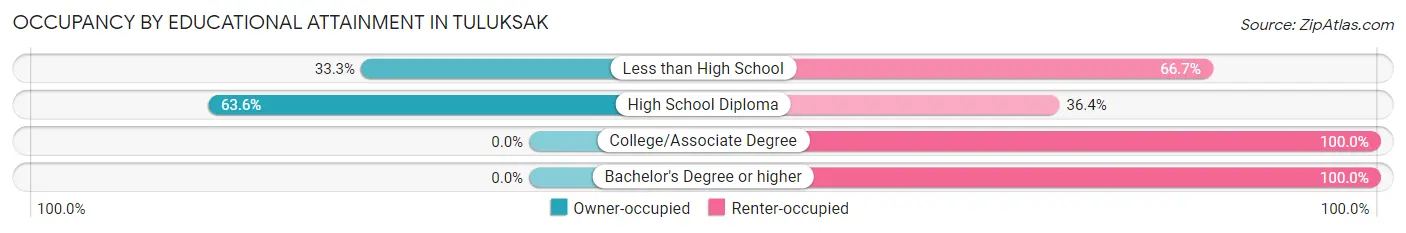
| Household Size | Owner-occupied | Renter-occupied |
| Less than High School | 2 (33.3%) | 4 (66.7%) |
| High School Diploma | 7 (63.6%) | 4 (36.4%) |
| College/Associate Degree | 0 (0.0%) | 2 (100.0%) |
| Bachelor's Degree or higher | 0 (0.0%) | 6 (100.0%) |
Occupancy by Age of Householder in Tuluksak
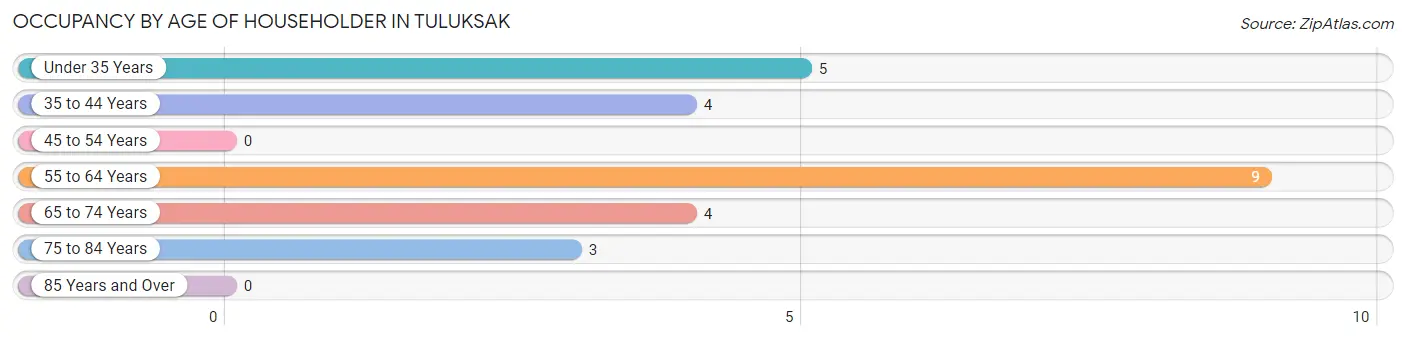
| Age Bracket | # Households | % Households |
| Under 35 Years | 5 | 20.0% |
| 35 to 44 Years | 4 | 16.0% |
| 45 to 54 Years | 0 | 0.0% |
| 55 to 64 Years | 9 | 36.0% |
| 65 to 74 Years | 4 | 16.0% |
| 75 to 84 Years | 3 | 12.0% |
| 85 Years and Over | 0 | 0.0% |
| Total | 25 | 100.0% |
Housing Finances in Tuluksak
Median Income by Occupancy in Tuluksak
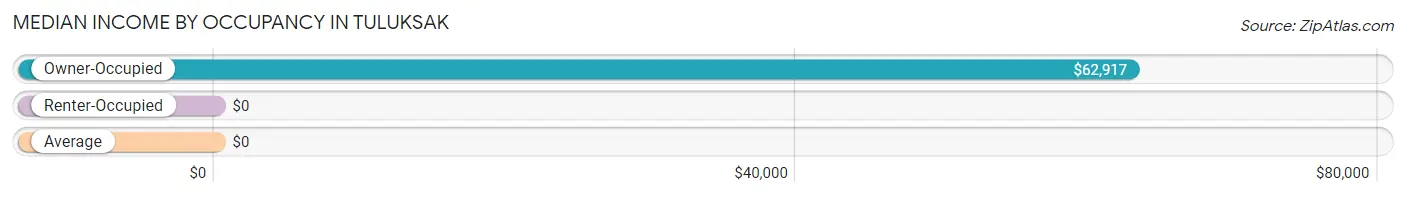
| Occupancy Type | # Households | Median Income |
| Owner-Occupied | 9 (36.0%) | $62,917 |
| Renter-Occupied | 16 (64.0%) | $0 |
| Average | 25 (100.0%) | $0 |
Occupancy by Householder Income Bracket in Tuluksak
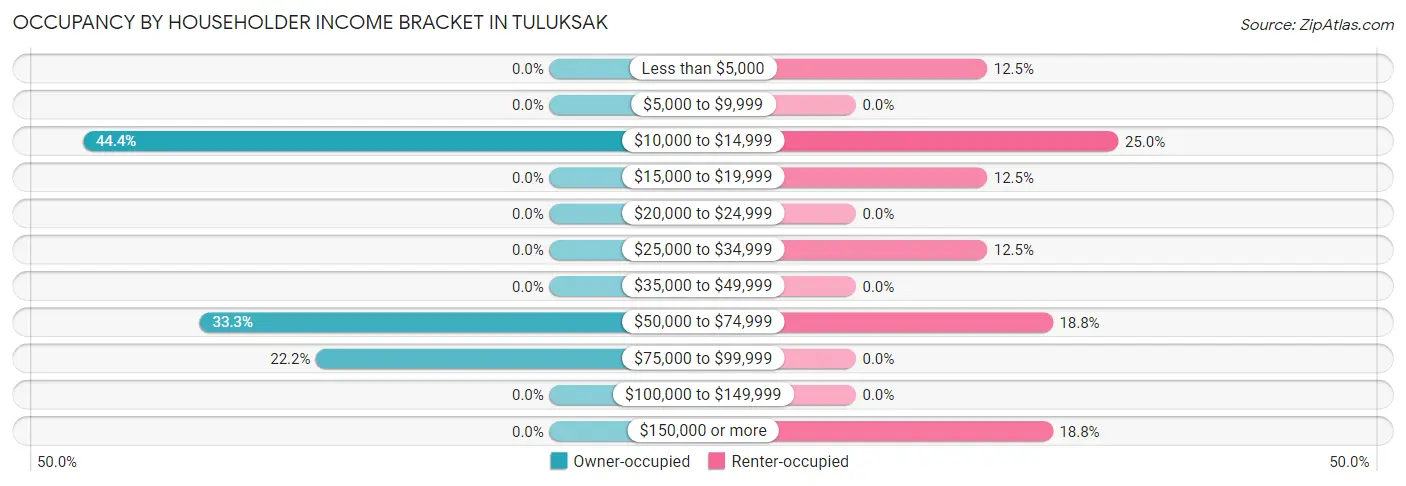
| Income Bracket | Owner-occupied | Renter-occupied |
| Less than $5,000 | 0 (0.0%) | 2 (12.5%) |
| $5,000 to $9,999 | 0 (0.0%) | 0 (0.0%) |
| $10,000 to $14,999 | 4 (44.4%) | 4 (25.0%) |
| $15,000 to $19,999 | 0 (0.0%) | 2 (12.5%) |
| $20,000 to $24,999 | 0 (0.0%) | 0 (0.0%) |
| $25,000 to $34,999 | 0 (0.0%) | 2 (12.5%) |
| $35,000 to $49,999 | 0 (0.0%) | 0 (0.0%) |
| $50,000 to $74,999 | 3 (33.3%) | 3 (18.8%) |
| $75,000 to $99,999 | 2 (22.2%) | 0 (0.0%) |
| $100,000 to $149,999 | 0 (0.0%) | 0 (0.0%) |
| $150,000 or more | 0 (0.0%) | 3 (18.8%) |
| Total | 9 (100.0%) | 16 (100.0%) |
Monthly Housing Cost Tiers in Tuluksak
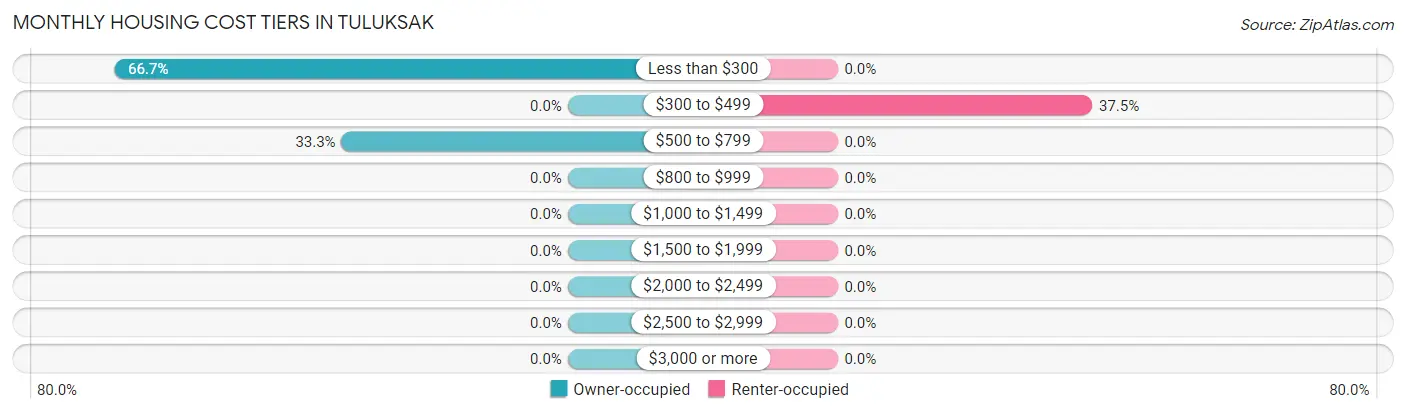
| Monthly Cost | Owner-occupied | Renter-occupied |
| Less than $300 | 6 (66.7%) | 0 (0.0%) |
| $300 to $499 | 0 (0.0%) | 6 (37.5%) |
| $500 to $799 | 3 (33.3%) | 0 (0.0%) |
| $800 to $999 | 0 (0.0%) | 0 (0.0%) |
| $1,000 to $1,499 | 0 (0.0%) | 0 (0.0%) |
| $1,500 to $1,999 | 0 (0.0%) | 0 (0.0%) |
| $2,000 to $2,499 | 0 (0.0%) | 0 (0.0%) |
| $2,500 to $2,999 | 0 (0.0%) | 0 (0.0%) |
| $3,000 or more | 0 (0.0%) | 0 (0.0%) |
| Total | 9 (100.0%) | 16 (100.0%) |
Physical Housing Characteristics in Tuluksak
Housing Structures in Tuluksak
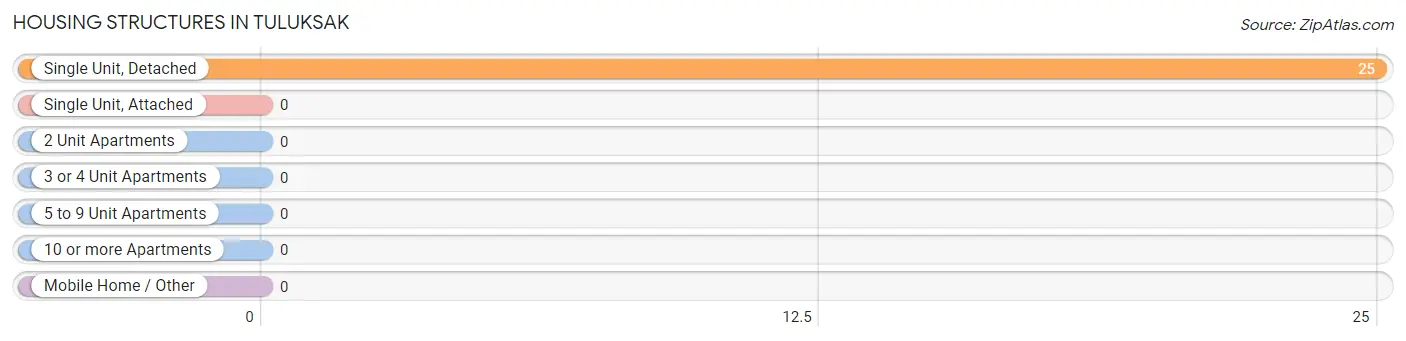
| Structure Type | # Housing Units | % Housing Units |
| Single Unit, Detached | 25 | 100.0% |
| Single Unit, Attached | 0 | 0.0% |
| 2 Unit Apartments | 0 | 0.0% |
| 3 or 4 Unit Apartments | 0 | 0.0% |
| 5 to 9 Unit Apartments | 0 | 0.0% |
| 10 or more Apartments | 0 | 0.0% |
| Mobile Home / Other | 0 | 0.0% |
| Total | 25 | 100.0% |
Housing Structures by Occupancy in Tuluksak
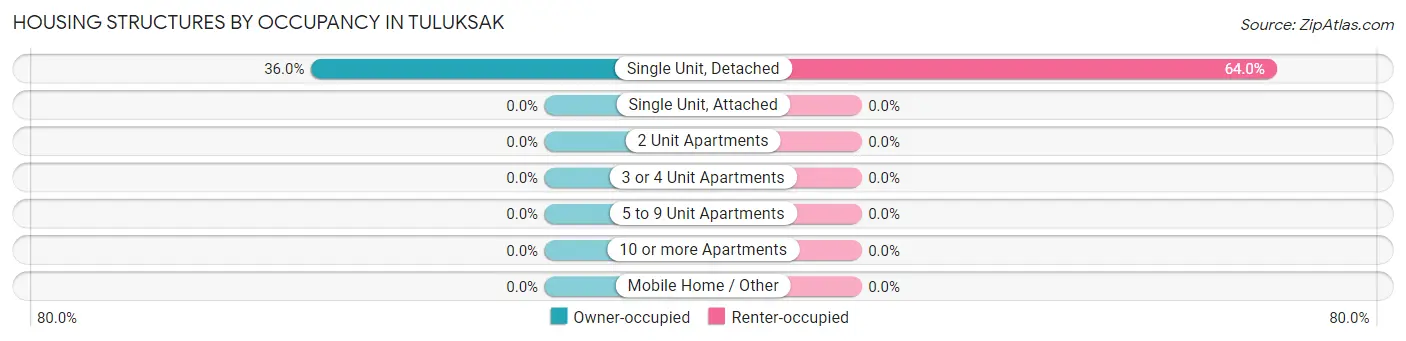
| Structure Type | Owner-occupied | Renter-occupied |
| Single Unit, Detached | 9 (36.0%) | 16 (64.0%) |
| Single Unit, Attached | 0 (0.0%) | 0 (0.0%) |
| 2 Unit Apartments | 0 (0.0%) | 0 (0.0%) |
| 3 or 4 Unit Apartments | 0 (0.0%) | 0 (0.0%) |
| 5 to 9 Unit Apartments | 0 (0.0%) | 0 (0.0%) |
| 10 or more Apartments | 0 (0.0%) | 0 (0.0%) |
| Mobile Home / Other | 0 (0.0%) | 0 (0.0%) |
| Total | 9 (36.0%) | 16 (64.0%) |
Housing Structures by Number of Rooms in Tuluksak
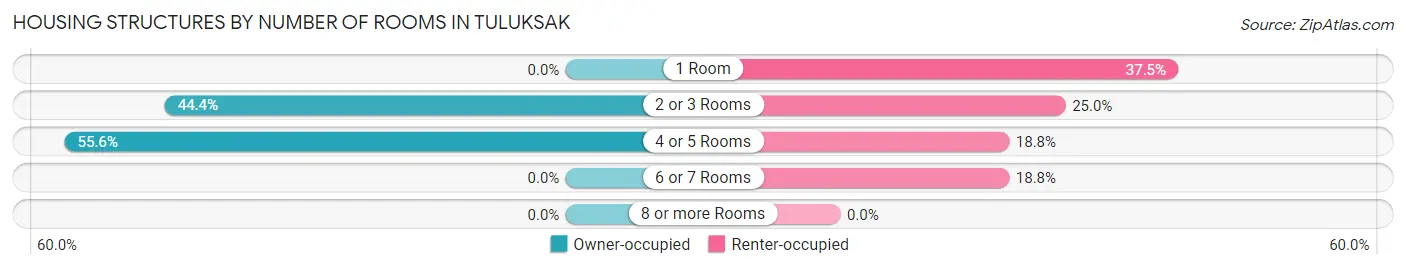
| Number of Rooms | Owner-occupied | Renter-occupied |
| 1 Room | 0 (0.0%) | 6 (37.5%) |
| 2 or 3 Rooms | 4 (44.4%) | 4 (25.0%) |
| 4 or 5 Rooms | 5 (55.6%) | 3 (18.8%) |
| 6 or 7 Rooms | 0 (0.0%) | 3 (18.8%) |
| 8 or more Rooms | 0 (0.0%) | 0 (0.0%) |
| Total | 9 (100.0%) | 16 (100.0%) |
Housing Structure by Heating Type in Tuluksak
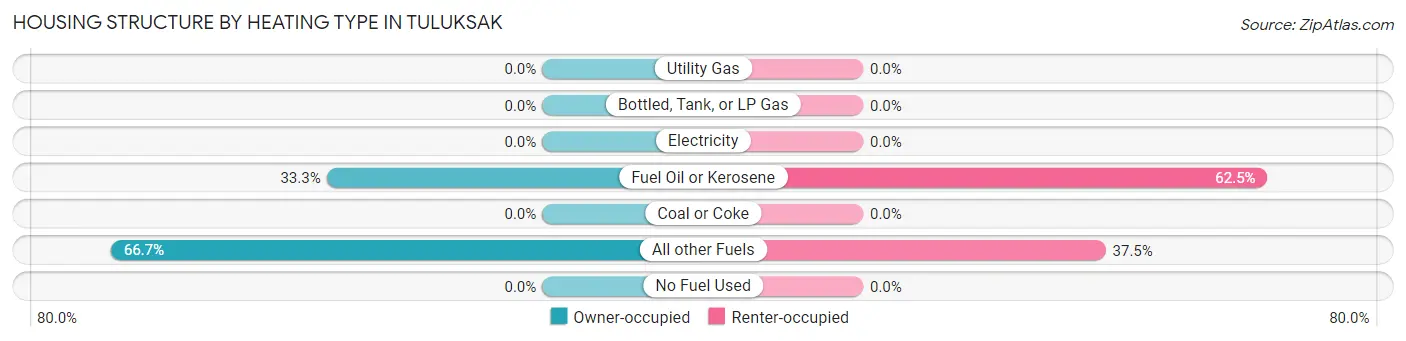
| Heating Type | Owner-occupied | Renter-occupied |
| Utility Gas | 0 (0.0%) | 0 (0.0%) |
| Bottled, Tank, or LP Gas | 0 (0.0%) | 0 (0.0%) |
| Electricity | 0 (0.0%) | 0 (0.0%) |
| Fuel Oil or Kerosene | 3 (33.3%) | 10 (62.5%) |
| Coal or Coke | 0 (0.0%) | 0 (0.0%) |
| All other Fuels | 6 (66.7%) | 6 (37.5%) |
| No Fuel Used | 0 (0.0%) | 0 (0.0%) |
| Total | 9 (100.0%) | 16 (100.0%) |
Household Vehicle Usage in Tuluksak
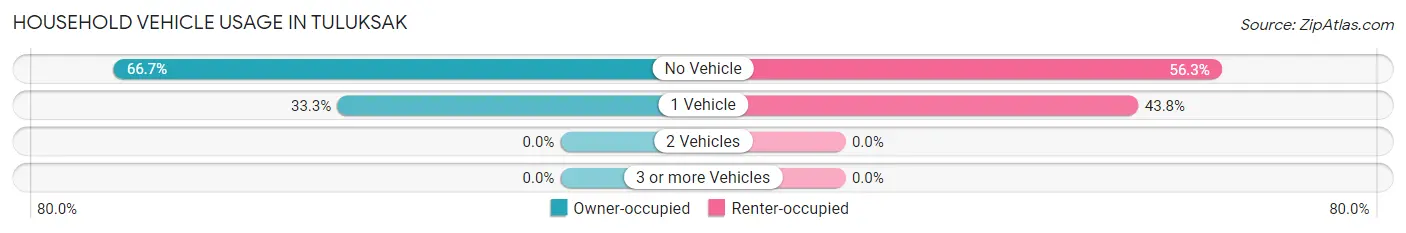
| Vehicles per Household | Owner-occupied | Renter-occupied |
| No Vehicle | 6 (66.7%) | 9 (56.2%) |
| 1 Vehicle | 3 (33.3%) | 7 (43.8%) |
| 2 Vehicles | 0 (0.0%) | 0 (0.0%) |
| 3 or more Vehicles | 0 (0.0%) | 0 (0.0%) |
| Total | 9 (100.0%) | 16 (100.0%) |
Real Estate & Mortgages in Tuluksak
Real Estate and Mortgage Overview in Tuluksak
| Characteristic | Without Mortgage | With Mortgage |
| Housing Units | 6 | 3 |
| Median Property Value | - | - |
| Median Household Income | - | - |
| Monthly Housing Costs | - | - |
| Real Estate Taxes | - | - |
Property Value by Mortgage Status in Tuluksak
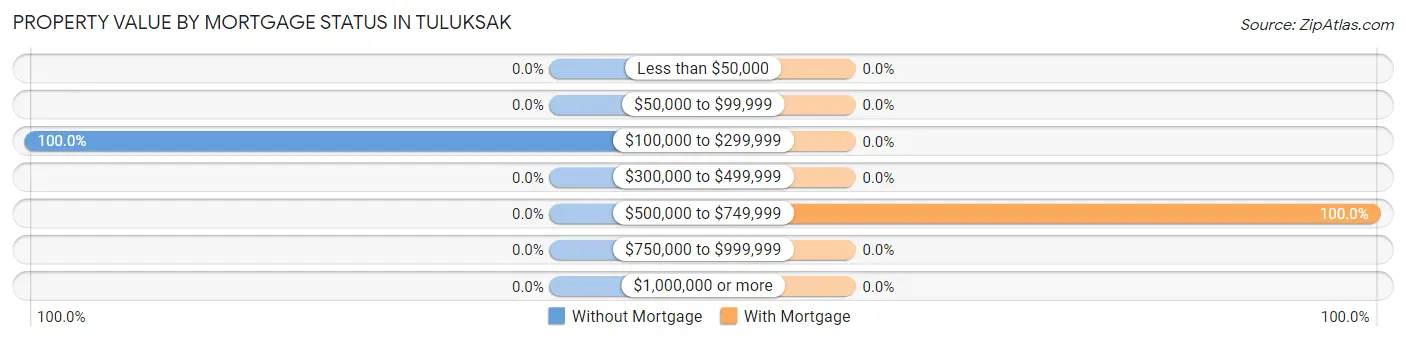
| Property Value | Without Mortgage | With Mortgage |
| Less than $50,000 | 0 (0.0%) | 0 (0.0%) |
| $50,000 to $99,999 | 0 (0.0%) | 0 (0.0%) |
| $100,000 to $299,999 | 6 (100.0%) | 0 (0.0%) |
| $300,000 to $499,999 | 0 (0.0%) | 0 (0.0%) |
| $500,000 to $749,999 | 0 (0.0%) | 3 (100.0%) |
| $750,000 to $999,999 | 0 (0.0%) | 0 (0.0%) |
| $1,000,000 or more | 0 (0.0%) | 0 (0.0%) |
| Total | 6 (100.0%) | 3 (100.0%) |
Household Income by Mortgage Status in Tuluksak
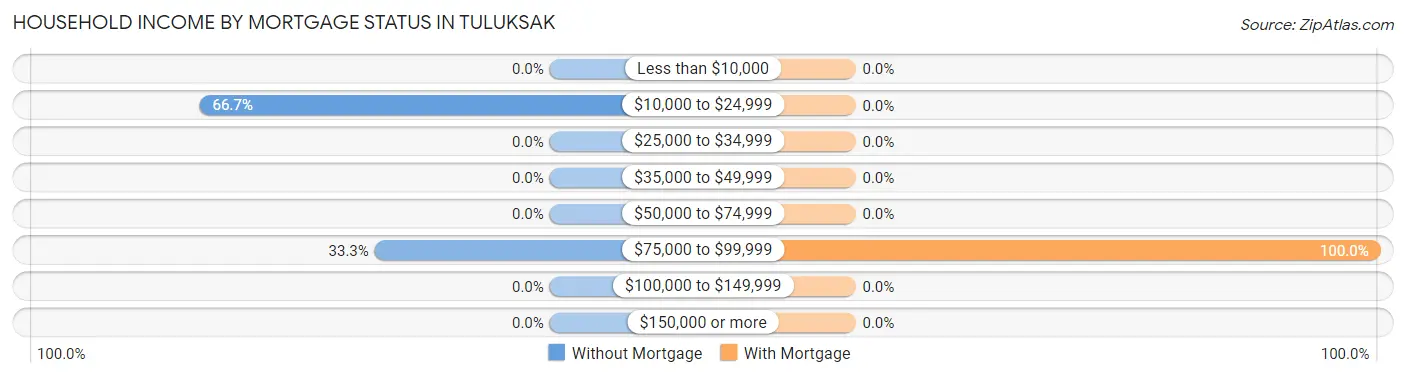
| Household Income | Without Mortgage | With Mortgage |
| Less than $10,000 | 0 (0.0%) | 0 (0.0%) |
| $10,000 to $24,999 | 4 (66.7%) | 0 (0.0%) |
| $25,000 to $34,999 | 0 (0.0%) | 0 (0.0%) |
| $35,000 to $49,999 | 0 (0.0%) | 0 (0.0%) |
| $50,000 to $74,999 | 0 (0.0%) | 0 (0.0%) |
| $75,000 to $99,999 | 2 (33.3%) | 3 (100.0%) |
| $100,000 to $149,999 | 0 (0.0%) | 0 (0.0%) |
| $150,000 or more | 0 (0.0%) | 0 (0.0%) |
| Total | 6 (100.0%) | 3 (100.0%) |
Property Value to Household Income Ratio in Tuluksak
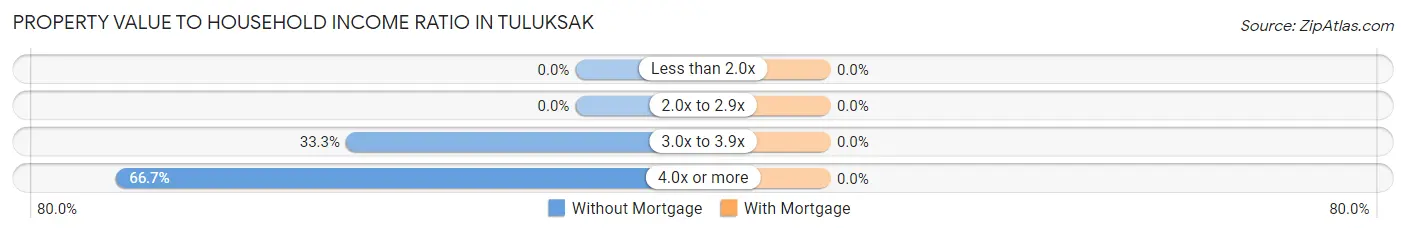
| Value-to-Income Ratio | Without Mortgage | With Mortgage |
| Less than 2.0x | 0 (0.0%) | 0 (0.0%) |
| 2.0x to 2.9x | 0 (0.0%) | 0 (0.0%) |
| 3.0x to 3.9x | 2 (33.3%) | 0 (0.0%) |
| 4.0x or more | 4 (66.7%) | 0 (0.0%) |
| Total | 6 (100.0%) | 3 (100.0%) |
Real Estate Taxes by Mortgage Status in Tuluksak
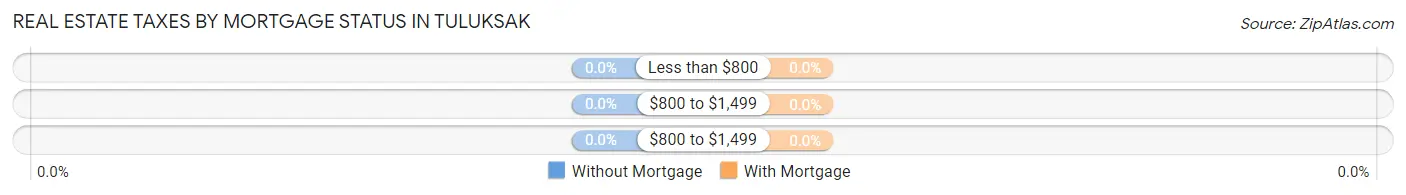
| Property Taxes | Without Mortgage | With Mortgage |
| Less than $800 | 0 (0.0%) | 0 (0.0%) |
| $800 to $1,499 | 0 (0.0%) | 0 (0.0%) |
| $800 to $1,499 | 0 (0.0%) | 0 (0.0%) |
| Total | 6 (100.0%) | 3 (100.0%) |
Health & Disability in Tuluksak
Health Insurance Coverage by Age in Tuluksak
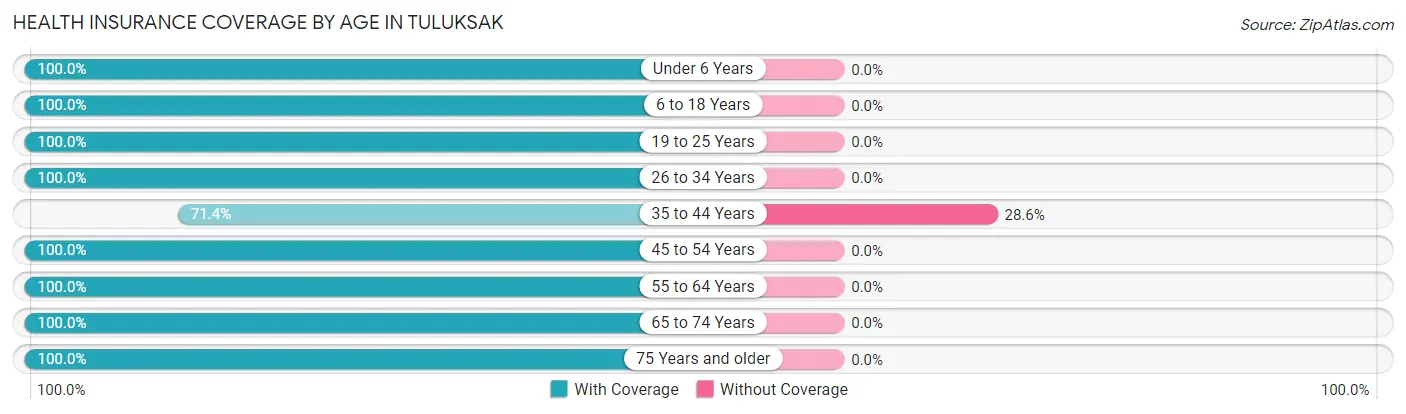
| Age Bracket | With Coverage | Without Coverage |
| Under 6 Years | 12 (100.0%) | 0 (0.0%) |
| 6 to 18 Years | 28 (100.0%) | 0 (0.0%) |
| 19 to 25 Years | 11 (100.0%) | 0 (0.0%) |
| 26 to 34 Years | 204 (100.0%) | 0 (0.0%) |
| 35 to 44 Years | 10 (71.4%) | 4 (28.6%) |
| 45 to 54 Years | 166 (100.0%) | 0 (0.0%) |
| 55 to 64 Years | 11 (100.0%) | 0 (0.0%) |
| 65 to 74 Years | 7 (100.0%) | 0 (0.0%) |
| 75 Years and older | 3 (100.0%) | 0 (0.0%) |
| Total | 452 (99.1%) | 4 (0.9%) |
Health Insurance Coverage by Citizenship Status in Tuluksak
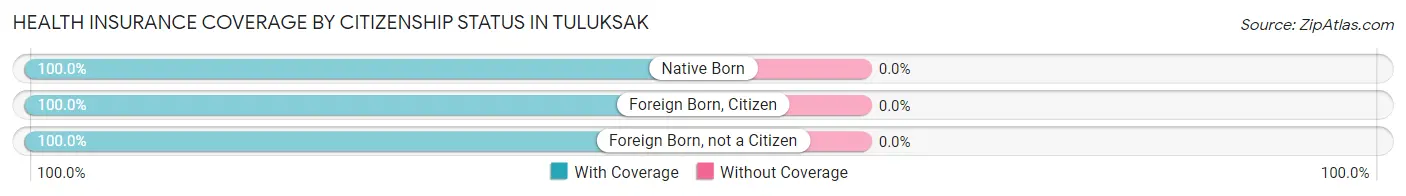
| Citizenship Status | With Coverage | Without Coverage |
| Native Born | 12 (100.0%) | 0 (0.0%) |
| Foreign Born, Citizen | 28 (100.0%) | 0 (0.0%) |
| Foreign Born, not a Citizen | 11 (100.0%) | 0 (0.0%) |
Health Insurance Coverage by Household Income in Tuluksak
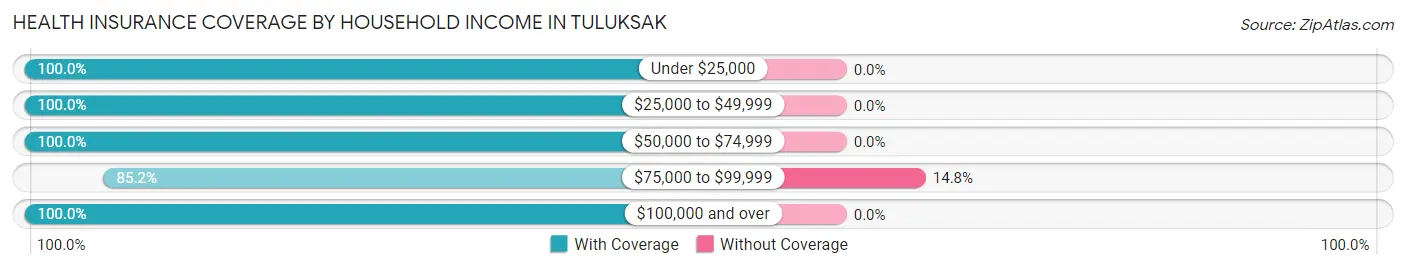
| Household Income | With Coverage | Without Coverage |
| Under $25,000 | 32 (100.0%) | 0 (0.0%) |
| $25,000 to $49,999 | 12 (100.0%) | 0 (0.0%) |
| $50,000 to $74,999 | 25 (100.0%) | 0 (0.0%) |
| $75,000 to $99,999 | 23 (85.2%) | 4 (14.8%) |
| $100,000 and over | 3 (100.0%) | 0 (0.0%) |
Public vs Private Health Insurance Coverage by Age in Tuluksak
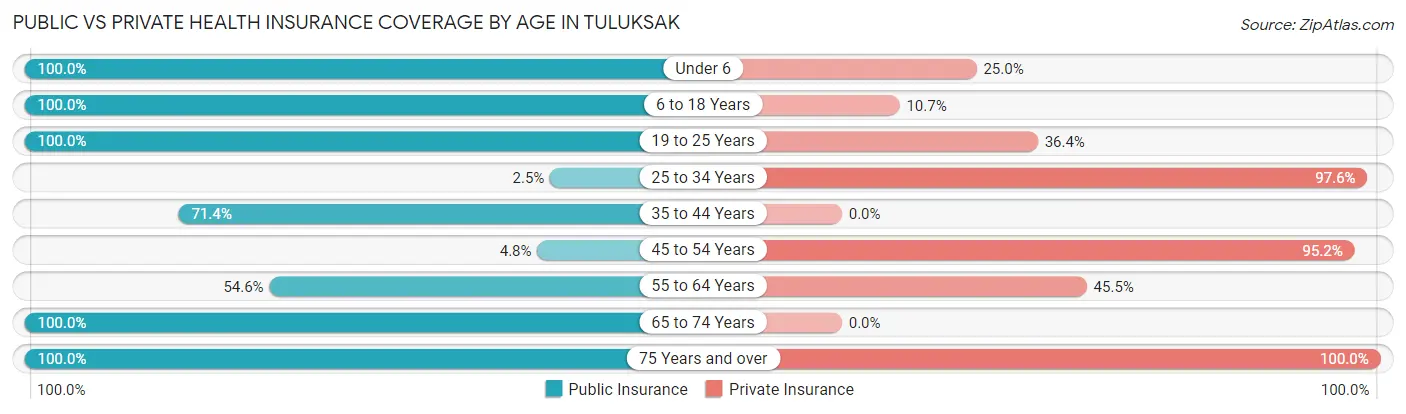
| Age Bracket | Public Insurance | Private Insurance |
| Under 6 | 12 (100.0%) | 3 (25.0%) |
| 6 to 18 Years | 28 (100.0%) | 3 (10.7%) |
| 19 to 25 Years | 11 (100.0%) | 4 (36.4%) |
| 25 to 34 Years | 5 (2.5%) | 199 (97.6%) |
| 35 to 44 Years | 10 (71.4%) | 0 (0.0%) |
| 45 to 54 Years | 8 (4.8%) | 158 (95.2%) |
| 55 to 64 Years | 6 (54.5%) | 5 (45.5%) |
| 65 to 74 Years | 7 (100.0%) | 0 (0.0%) |
| 75 Years and over | 3 (100.0%) | 3 (100.0%) |
| Total | 90 (19.7%) | 375 (82.2%) |
Disability Status by Sex by Age in Tuluksak
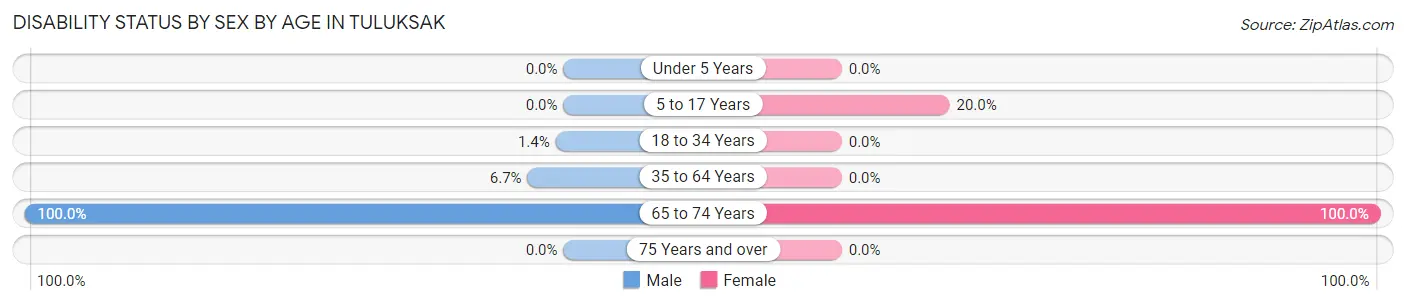
| Age Bracket | Male | Female |
| Under 5 Years | 0 (0.0%) | 0 (0.0%) |
| 5 to 17 Years | 0 (0.0%) | 3 (20.0%) |
| 18 to 34 Years | 3 (1.4%) | 0 (0.0%) |
| 35 to 64 Years | 12 (6.7%) | 0 (0.0%) |
| 65 to 74 Years | 4 (100.0%) | 3 (100.0%) |
| 75 Years and over | 0 (0.0%) | 0 (0.0%) |
Disability Class by Sex by Age in Tuluksak
Disability Class: Hearing Difficulty
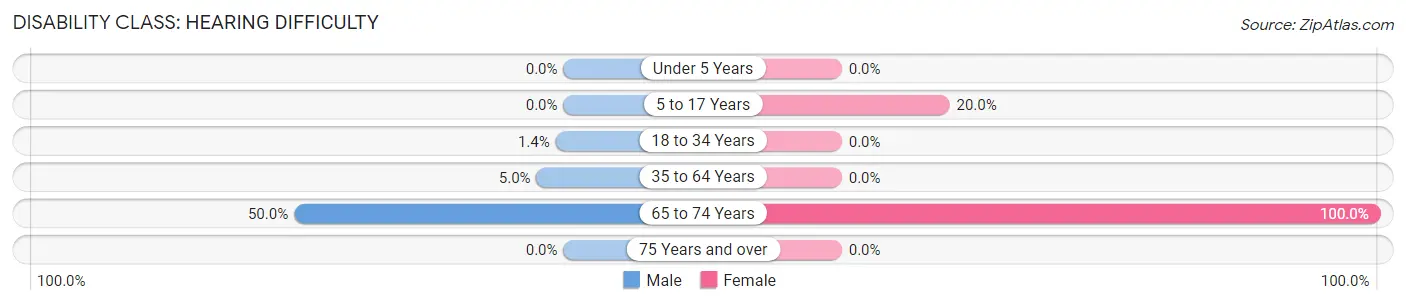
| Age Bracket | Male | Female |
| Under 5 Years | 0 (0.0%) | 0 (0.0%) |
| 5 to 17 Years | 0 (0.0%) | 3 (20.0%) |
| 18 to 34 Years | 3 (1.4%) | 0 (0.0%) |
| 35 to 64 Years | 9 (5.0%) | 0 (0.0%) |
| 65 to 74 Years | 2 (50.0%) | 3 (100.0%) |
| 75 Years and over | 0 (0.0%) | 0 (0.0%) |
Disability Class: Vision Difficulty
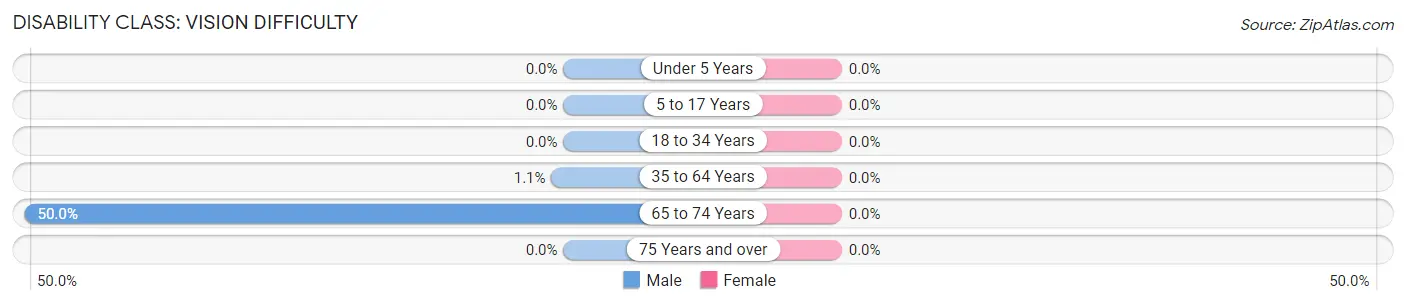
| Age Bracket | Male | Female |
| Under 5 Years | 0 (0.0%) | 0 (0.0%) |
| 5 to 17 Years | 0 (0.0%) | 0 (0.0%) |
| 18 to 34 Years | 0 (0.0%) | 0 (0.0%) |
| 35 to 64 Years | 2 (1.1%) | 0 (0.0%) |
| 65 to 74 Years | 2 (50.0%) | 0 (0.0%) |
| 75 Years and over | 0 (0.0%) | 0 (0.0%) |
Disability Class: Cognitive Difficulty
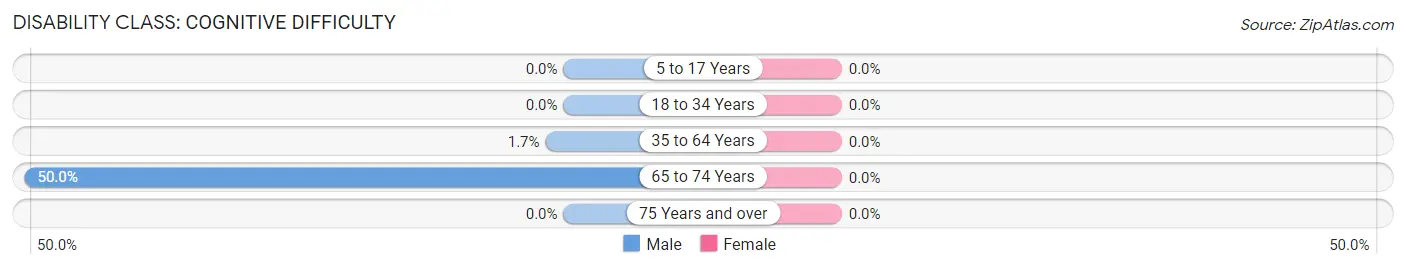
| Age Bracket | Male | Female |
| 5 to 17 Years | 0 (0.0%) | 0 (0.0%) |
| 18 to 34 Years | 0 (0.0%) | 0 (0.0%) |
| 35 to 64 Years | 3 (1.7%) | 0 (0.0%) |
| 65 to 74 Years | 2 (50.0%) | 0 (0.0%) |
| 75 Years and over | 0 (0.0%) | 0 (0.0%) |
Disability Class: Ambulatory Difficulty
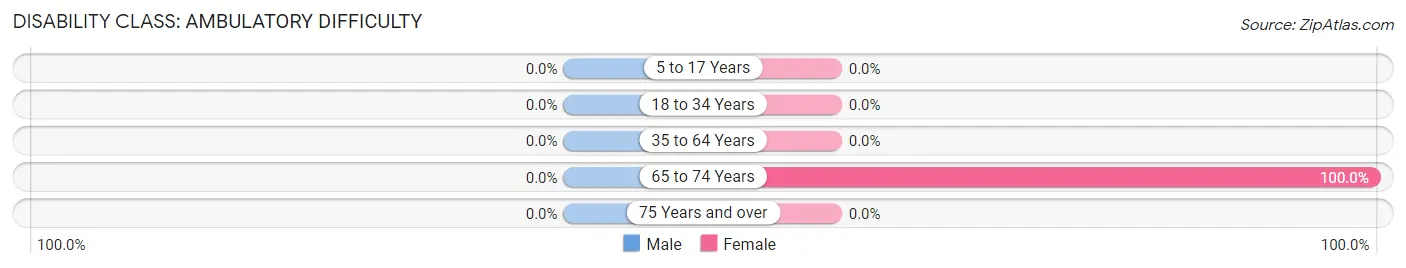
| Age Bracket | Male | Female |
| 5 to 17 Years | 0 (0.0%) | 0 (0.0%) |
| 18 to 34 Years | 0 (0.0%) | 0 (0.0%) |
| 35 to 64 Years | 0 (0.0%) | 0 (0.0%) |
| 65 to 74 Years | 0 (0.0%) | 3 (100.0%) |
| 75 Years and over | 0 (0.0%) | 0 (0.0%) |
Disability Class: Self-Care Difficulty
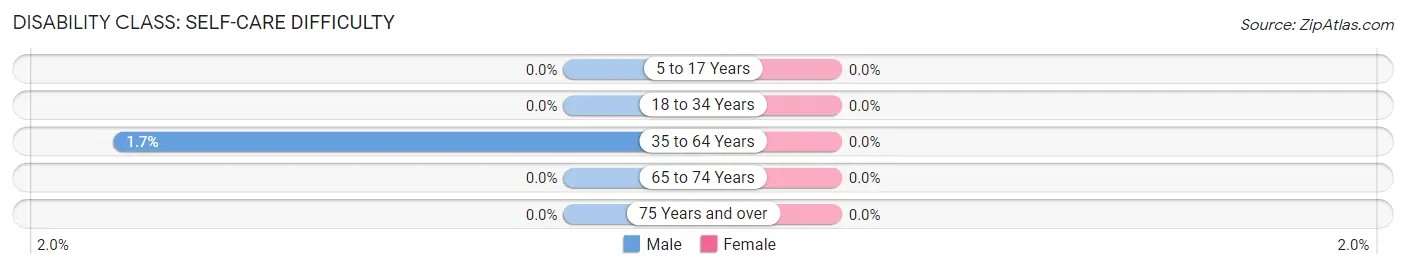
| Age Bracket | Male | Female |
| 5 to 17 Years | 0 (0.0%) | 0 (0.0%) |
| 18 to 34 Years | 0 (0.0%) | 0 (0.0%) |
| 35 to 64 Years | 3 (1.7%) | 0 (0.0%) |
| 65 to 74 Years | 0 (0.0%) | 0 (0.0%) |
| 75 Years and over | 0 (0.0%) | 0 (0.0%) |
Technology Access in Tuluksak
Computing Device Access in Tuluksak
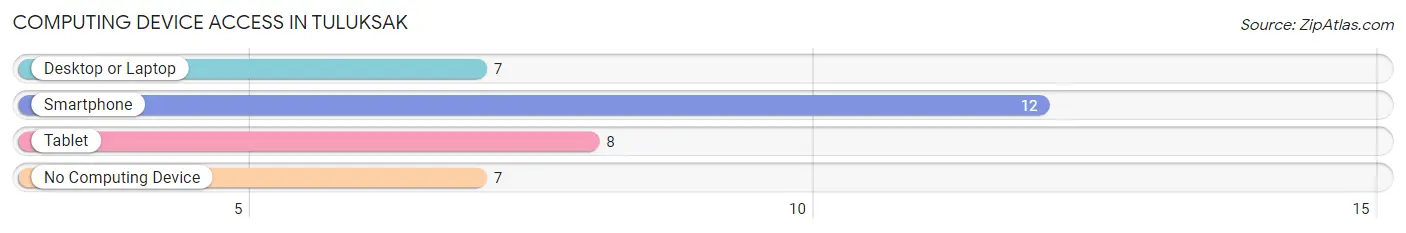
| Device Type | # Households | % Households |
| Desktop or Laptop | 7 | 28.0% |
| Smartphone | 12 | 48.0% |
| Tablet | 8 | 32.0% |
| No Computing Device | 7 | 28.0% |
| Total | 25 | 100.0% |
Internet Access in Tuluksak
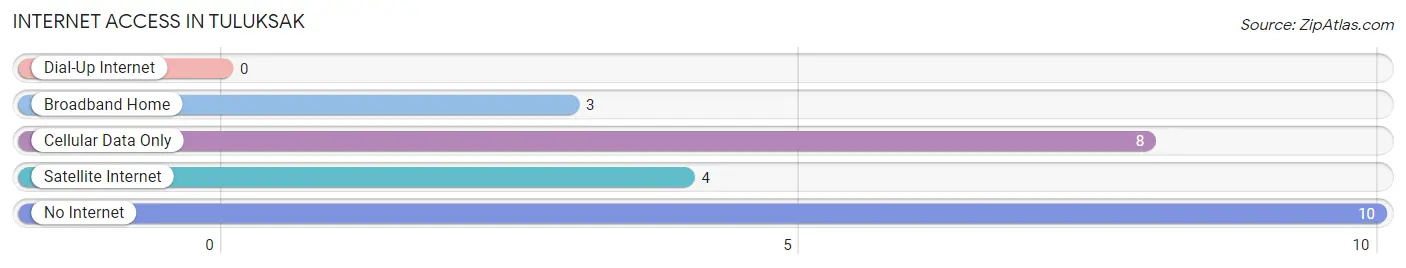
| Internet Type | # Households | % Households |
| Dial-Up Internet | 0 | 0.0% |
| Broadband Home | 3 | 12.0% |
| Cellular Data Only | 8 | 32.0% |
| Satellite Internet | 4 | 16.0% |
| No Internet | 10 | 40.0% |
| Total | 25 | 100.0% |
Tuluksak Summary
Tuluksak is a small village located in the Bethel Census Area of Alaska. It is situated on the north bank of the Kuskokwim River, approximately 80 miles upstream from Bethel. The village is home to the Yup’ik Eskimo people, who have lived in the area for centuries.
History
The Yup’ik people have lived in the Tuluksak area for centuries, and the village was first established in the late 1800s. The name “Tuluksak” is derived from the Yup’ik word “tuluk”, which means “to be in the middle”. The village was originally located on the south bank of the Kuskokwim River, but was moved to its current location in the early 1900s.
The village was traditionally a fishing and hunting community, and the Yup’ik people relied on the Kuskokwim River for sustenance. In the early 1900s, the village was visited by a Catholic priest, who established a mission and school in the village. The school was later taken over by the Bureau of Indian Affairs, and is now operated by the Lower Kuskokwim School District.
Geography
Tuluksak is located in the Bethel Census Area of Alaska, approximately 80 miles upstream from Bethel. The village is situated on the north bank of the Kuskokwim River, and is surrounded by tundra and boreal forest. The climate in the area is subarctic, with long, cold winters and short, mild summers.
The village is accessible by air and river, and is served by the Tuluksak Airport. The Kuskokwim River is a major transportation route in the region, and is used by locals to travel to nearby villages.
Economy
The economy of Tuluksak is largely based on subsistence activities, such as fishing and hunting. The village is also home to a small commercial fishing fleet, which harvests salmon, whitefish, and other species from the Kuskokwim River.
The village is also home to a small retail sector, which includes a general store, a post office, and a few other small businesses. The Lower Kuskokwim School District also provides employment opportunities in the village.
Demographics
As of the 2010 census, the population of Tuluksak was 517, of which 97.7% were Native American. The median age in the village was 24.7 years, and the median household income was $25,000. The majority of the population (90.2%) spoke Yup’ik as their primary language.
The village is served by the Lower Kuskokwim School District, which operates a K-12 school in the village. The school serves approximately 200 students, and offers classes in Yup’ik language and culture.
Conclusion
Tuluksak is a small village located in the Bethel Census Area of Alaska. It is home to the Yup’ik Eskimo people, who have lived in the area for centuries. The economy of the village is largely based on subsistence activities, such as fishing and hunting. The village is also home to a small retail sector, and is served by the Lower Kuskokwim School District. As of the 2010 census, the population of Tuluksak was 517, of which 97.7% were Native American.
Common Questions
What is Per Capita Income in Tuluksak?
Per Capita income in Tuluksak is $107,211.
What is Inequality or Gini Index in Tuluksak?
Inequality or Gini Index in Tuluksak is 0.60.
What is the Total Population of Tuluksak?
Total Population of Tuluksak is 456.
What is the Total Male Population of Tuluksak?
Total Male Population of Tuluksak is 412.
What is the Total Female Population of Tuluksak?
Total Female Population of Tuluksak is 44.
What is the Ratio of Males per 100 Females in Tuluksak?
There are 936.36 Males per 100 Females in Tuluksak.
What is the Ratio of Females per 100 Males in Tuluksak?
There are 10.68 Females per 100 Males in Tuluksak.
What is the Median Population Age in Tuluksak?
Median Population Age in Tuluksak is 33.9 Years.
What is the Average Family Size in Tuluksak
Average Family Size in Tuluksak is 4.5 People.
What is the Average Household Size in Tuluksak
Average Household Size in Tuluksak is 4.0 People.
How Large is the Labor Force in Tuluksak?
There are 389 People in the Labor Forcein in Tuluksak.
What is the Percentage of People in the Labor Force in Tuluksak?
92.2% of People are in the Labor Force in Tuluksak.
What is the Unemployment Rate in Tuluksak?
Unemployment Rate in Tuluksak is 1.5%.