Area Code 949 Map & Demographics
Area Code 949 Map
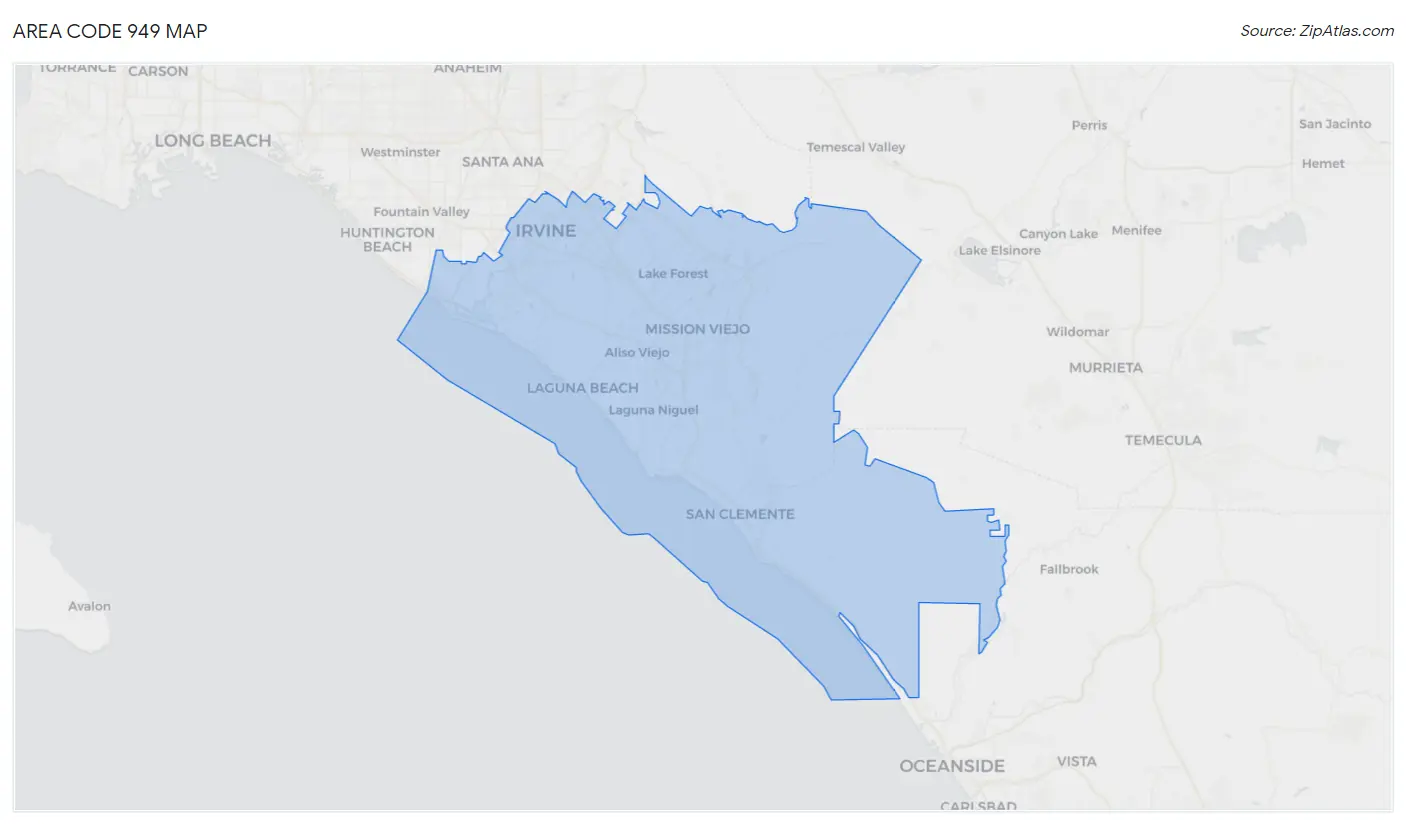
Area Code 949 Overview
$67,719
PER CAPITA INCOME
$154,194
AVG FAMILY INCOME
$131,014
AVG HOUSEHOLD INCOME
34.8%
WAGE / INCOME GAP [ % ]
65.2¢/ $1
WAGE / INCOME GAP [ $ ]
$12,499
FAMILY INCOME DEFICIT
17.14
INEQUALITY / GINI INDEX
1,260,975
TOTAL POPULATION
626,977
MALE POPULATION
633,998
FEMALE POPULATION
98.89
MALES / 100 FEMALES
101.12
FEMALES / 100 MALES
42.4
MEDIAN AGE
3.2
AVG FAMILY SIZE
2.7
AVG HOUSEHOLD SIZE
657,318
LABOR FORCE [ PEOPLE ]
64.3%
PERCENT IN LABOR FORCE
5.0%
UNEMPLOYMENT RATE
Income in Area Code 949
Income Overview in Area Code 949
Per Capita Income in Area Code 949 is $67,719, while median incomes of families and households are $154,194 and $131,014 respectively.
| Characteristic | Number | Measure |
| Per Capita Income | 1,260,975 | $67,719 |
| Median Family Income | 309,928 | $154,194 |
| Mean Family Income | 309,928 | $7,538,628 |
| Median Household Income | 449,198 | $131,014 |
| Mean Household Income | 449,198 | $6,562,410 |
| Income Deficit | 309,928 | $12,499 |
| Wage / Income Gap (%) | 1,260,975 | 34.80% |
| Wage / Income Gap ($) | 1,260,975 | 65.20¢ per $1 |
| Gini / Inequality Index | 1,260,975 | 17.14 |
Earnings by Sex in Area Code 949
Average Earnings in Area Code 949 are $66,167, $81,746 for men and $50,715 for women, a difference of 38.0%.
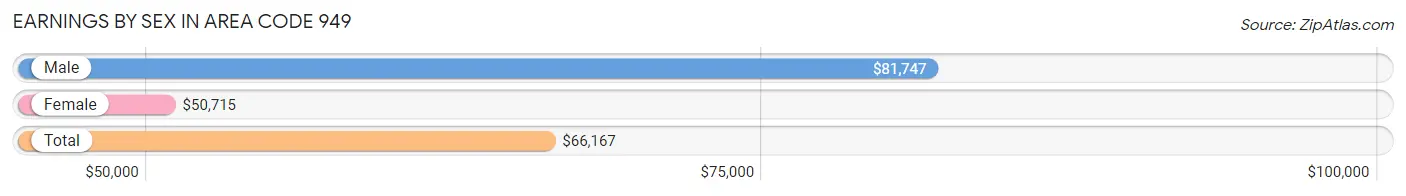
| Sex | Number | Average Earnings |
| Male | 375,541 (54.4%) | $81,746 |
| Female | 315,074 (45.6%) | $50,715 |
| Total | 690,615 (100.0%) | $66,167 |
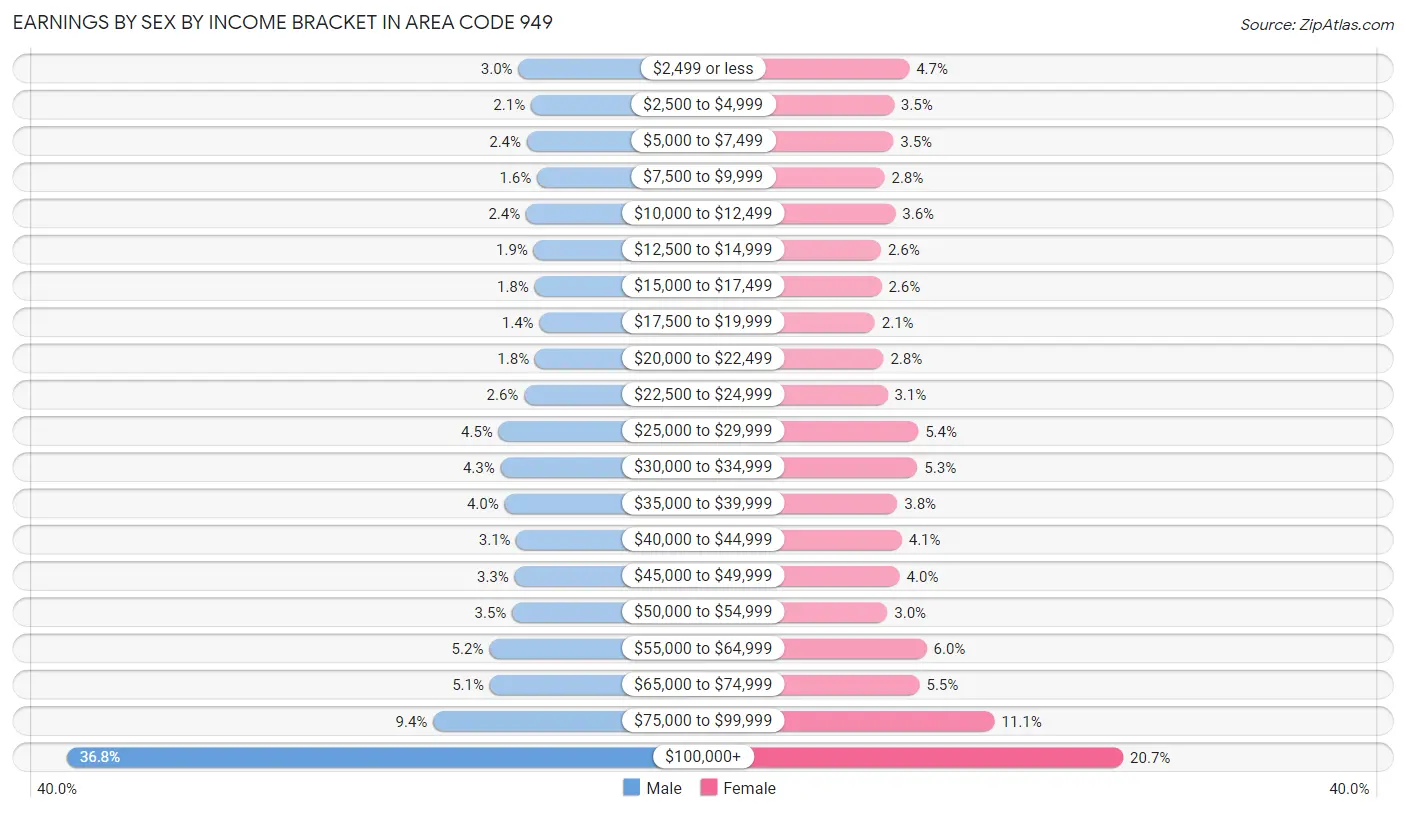
Earnings by Sex by Income Bracket in Area Code 949
The most common earnings brackets in Area Code 949 are $100,000+ for men (138,294 | 36.8%) and $100,000+ for women (65,256 | 20.7%).
| Income | Male | Female |
| $2,499 or less | 11,241 (3.0%) | 14,744 (4.7%) |
| $2,500 to $4,999 | 7,680 (2.1%) | 11,129 (3.5%) |
| $5,000 to $7,499 | 8,868 (2.4%) | 10,996 (3.5%) |
| $7,500 to $9,999 | 5,956 (1.6%) | 8,931 (2.8%) |
| $10,000 to $12,499 | 9,077 (2.4%) | 11,473 (3.6%) |
| $12,500 to $14,999 | 6,930 (1.8%) | 8,053 (2.6%) |
| $15,000 to $17,499 | 6,671 (1.8%) | 8,183 (2.6%) |
| $17,500 to $19,999 | 5,333 (1.4%) | 6,614 (2.1%) |
| $20,000 to $22,499 | 6,555 (1.8%) | 8,661 (2.8%) |
| $22,500 to $24,999 | 9,612 (2.6%) | 9,617 (3.0%) |
| $25,000 to $29,999 | 16,792 (4.5%) | 16,871 (5.3%) |
| $30,000 to $34,999 | 16,256 (4.3%) | 16,660 (5.3%) |
| $35,000 to $39,999 | 15,150 (4.0%) | 11,953 (3.8%) |
| $40,000 to $44,999 | 11,788 (3.1%) | 12,983 (4.1%) |
| $45,000 to $49,999 | 12,324 (3.3%) | 12,475 (4.0%) |
| $50,000 to $54,999 | 13,010 (3.5%) | 9,579 (3.0%) |
| $55,000 to $64,999 | 19,469 (5.2%) | 18,855 (6.0%) |
| $65,000 to $74,999 | 19,302 (5.1%) | 17,164 (5.4%) |
| $75,000 to $99,999 | 35,233 (9.4%) | 34,877 (11.1%) |
| $100,000+ | 138,294 (36.8%) | 65,256 (20.7%) |
| Total | 375,541 (100.0%) | 315,074 (100.0%) |
Earnings by Sex by Educational Attainment in Area Code 949
Average earnings in Area Code 949 are $3,444,170 for men and $2,193,213 for women, a difference of 36.3%. Men with an educational attainment of graduate degree enjoy the highest average annual earnings of $5,097,719, while those with less than high school education earn the least with $983,176. Women with an educational attainment of graduate degree earn the most with the average annual earnings of $3,246,515, while those with less than high school education have the smallest earnings of $685,307.
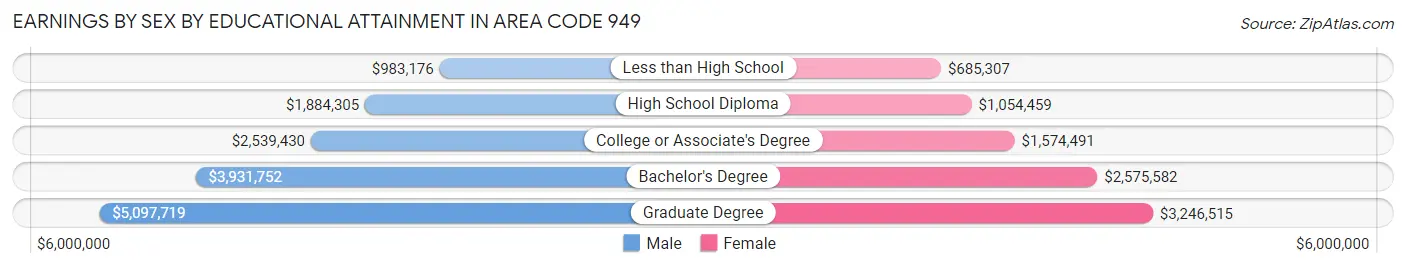
| Educational Attainment | Male Income | Female Income |
| Less than High School | $983,176 | $685,307 |
| High School Diploma | $1,884,305 | $1,054,459 |
| College or Associate's Degree | $2,539,430 | $1,574,491 |
| Bachelor's Degree | $3,931,752 | $2,575,582 |
| Graduate Degree | $5,097,719 | $3,246,515 |
| Total | $3,444,170 | $2,193,213 |
Family Income in Area Code 949
Family Income Brackets in Area Code 949
According to the Area Code 949 family income data, there are 3,954,061 families falling into the $200,000+ income range, which is the most common income bracket and makes up 1,275.8% of all families. Conversely, the $10,000 to $14,999 income bracket is the least frequent group with only 130,170 families (42.0%) belonging to this category.
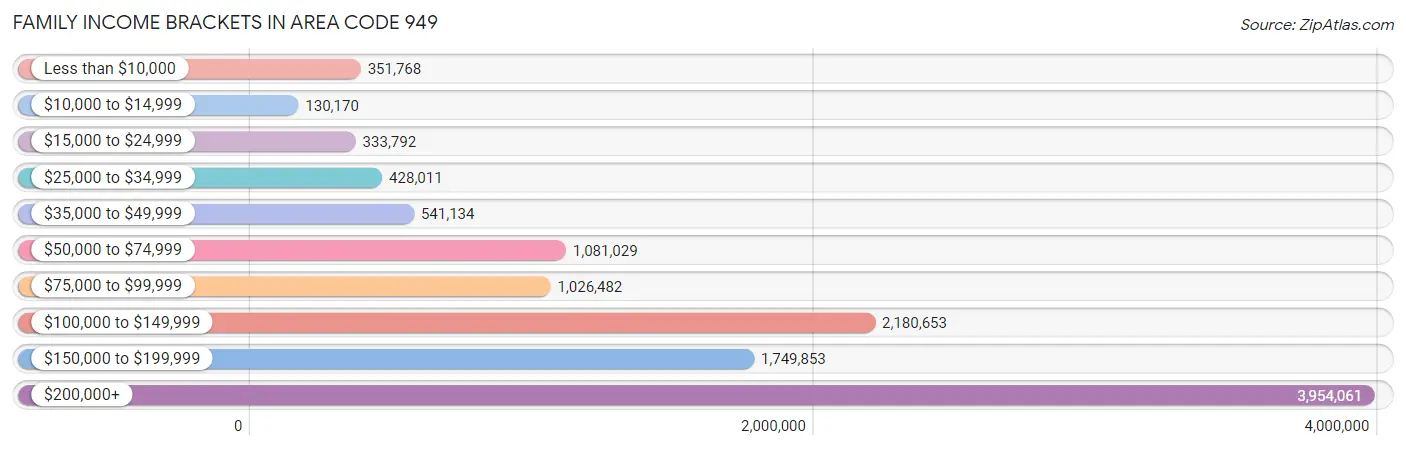
| Income Bracket | # Families | % Families |
| Less than $10,000 | 351,768 | 113.5% |
| $10,000 to $14,999 | 130,170 | 42.0% |
| $15,000 to $24,999 | 333,792 | 107.7% |
| $25,000 to $34,999 | 428,011 | 138.1% |
| $35,000 to $49,999 | 541,134 | 174.6% |
| $50,000 to $74,999 | 1,081,029 | 348.8% |
| $75,000 to $99,999 | 1,026,482 | 331.2% |
| $100,000 to $149,999 | 2,180,653 | 703.6% |
| $150,000 to $199,999 | 1,749,853 | 564.6% |
| $200,000+ | 3,954,061 | 1,275.8% |
Family Income by Famaliy Size in Area Code 949
6-person families (9,619 | 3.1%) account for the highest median family income in Area Code 949 with $182,187 per family, while 2-person families (127,618 | 41.2%) have the highest median income of $65,471 per family member.

| Income Bracket | # Families | Median Income |
| 2-Person Families | 127,618 (41.2%) | $130,943 |
| 3-Person Families | 71,057 (22.9%) | $158,688 |
| 4-Person Families | 68,020 (22.0%) | $181,644 |
| 5-Person Families | 27,000 (8.7%) | $174,939 |
| 6-Person Families | 9,619 (3.1%) | $182,187 |
| 7+ Person Families | 6,614 (2.1%) | $172,297 |
| Total | 309,928 (100.0%) | $154,194 |
Family Income by Number of Earners in Area Code 949
The median family income in Area Code 949 is $154,194, with families comprising 3+ earners (46,878) having the highest median family income of $196,428, while families with no earners (37,895) have the lowest median family income of $77,141, accounting for 15.1% and 12.2% of families, respectively.
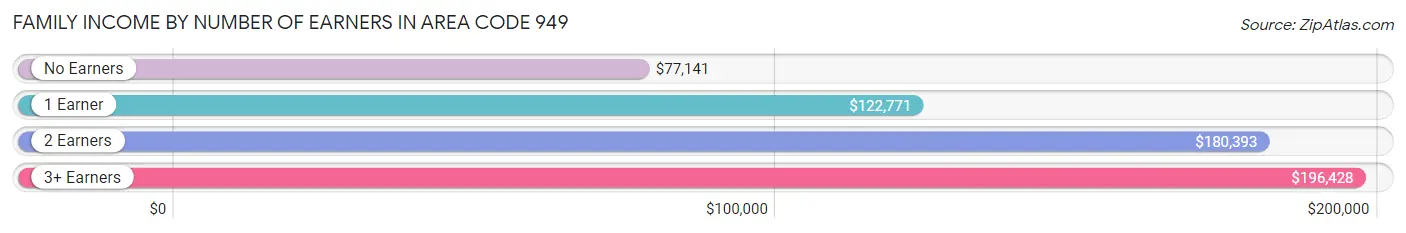
| Number of Earners | # Families | Median Income |
| No Earners | 37,895 (12.2%) | $77,141 |
| 1 Earner | 94,417 (30.5%) | $122,771 |
| 2 Earners | 130,738 (42.2%) | $180,393 |
| 3+ Earners | 46,878 (15.1%) | $196,428 |
| Total | 309,928 (100.0%) | $154,194 |
Household Income in Area Code 949
Household Income Brackets in Area Code 949
With 4,790,247 households falling in the category, the $200,000+ income range is the most frequent in Area Code 949, accounting for 1,066.4% of all households. In contrast, only 339,594 households (75.6%) fall into the $10,000 to $14,999 income bracket, making it the least populous group.
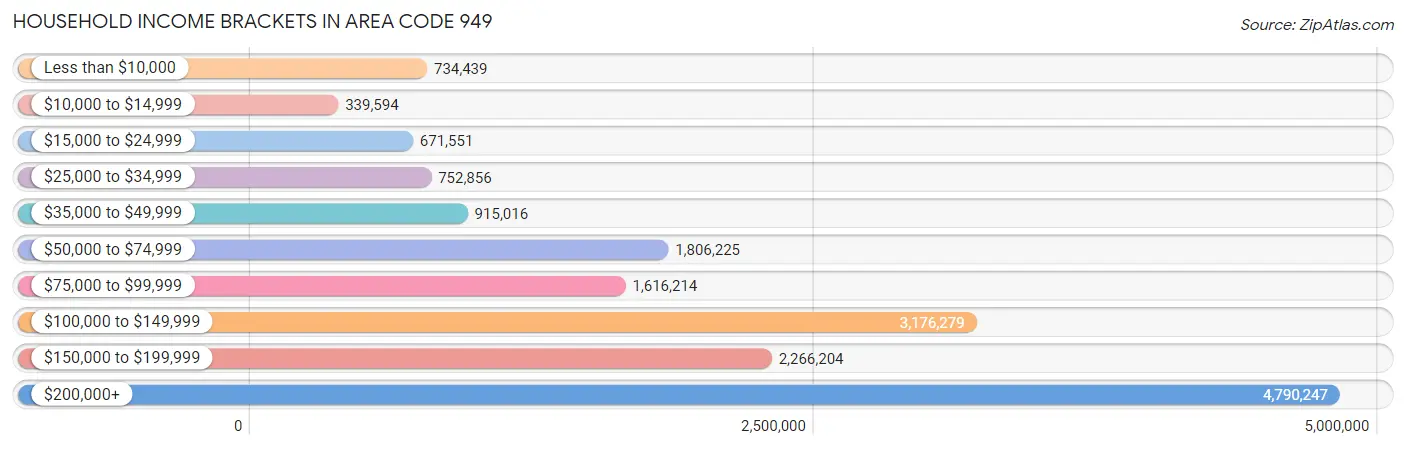
| Income Bracket | # Households | % Households |
| Less than $10,000 | 734,439 | 163.5% |
| $10,000 to $14,999 | 339,594 | 75.6% |
| $15,000 to $24,999 | 671,551 | 149.5% |
| $25,000 to $34,999 | 752,856 | 167.6% |
| $35,000 to $49,999 | 915,016 | 203.7% |
| $50,000 to $74,999 | 1,806,225 | 402.1% |
| $75,000 to $99,999 | 1,616,214 | 359.8% |
| $100,000 to $149,999 | 3,176,279 | 707.1% |
| $150,000 to $199,999 | 2,266,204 | 504.5% |
| $200,000+ | 4,790,247 | 1,066.4% |
Household Income by Householder Age in Area Code 949
The median household income in Area Code 949 is $131,014, with the highest median household income of $150,100 found in the 45 to 64 years age bracket for the primary householder. A total of 180,159 households (40.1%) fall into this category. Meanwhile, the 15 to 24 years age bracket for the primary householder has the lowest median household income of $58,391, with 12,111 households (2.7%) in this group.
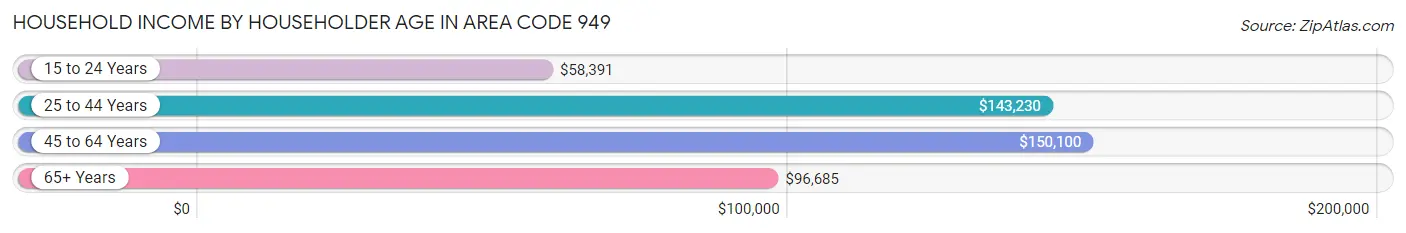
| Income Bracket | # Households | Median Income |
| 15 to 24 Years | 12,111 (2.7%) | $58,391 |
| 25 to 44 Years | 142,790 (31.8%) | $143,230 |
| 45 to 64 Years | 180,159 (40.1%) | $150,100 |
| 65+ Years | 114,138 (25.4%) | $96,685 |
| Total | 449,198 (100.0%) | $131,014 |
Poverty in Area Code 949
Income Below Poverty by Sex and Age in Area Code 949
With 8.2% poverty level for males and 9.9% for females among the residents of Area Code 949, 18 to 24 year old males and 18 to 24 year old females are the most vulnerable to poverty, with 10,544 males (18.9%) and 9,552 females (18.4%) in their respective age groups living below the poverty level.
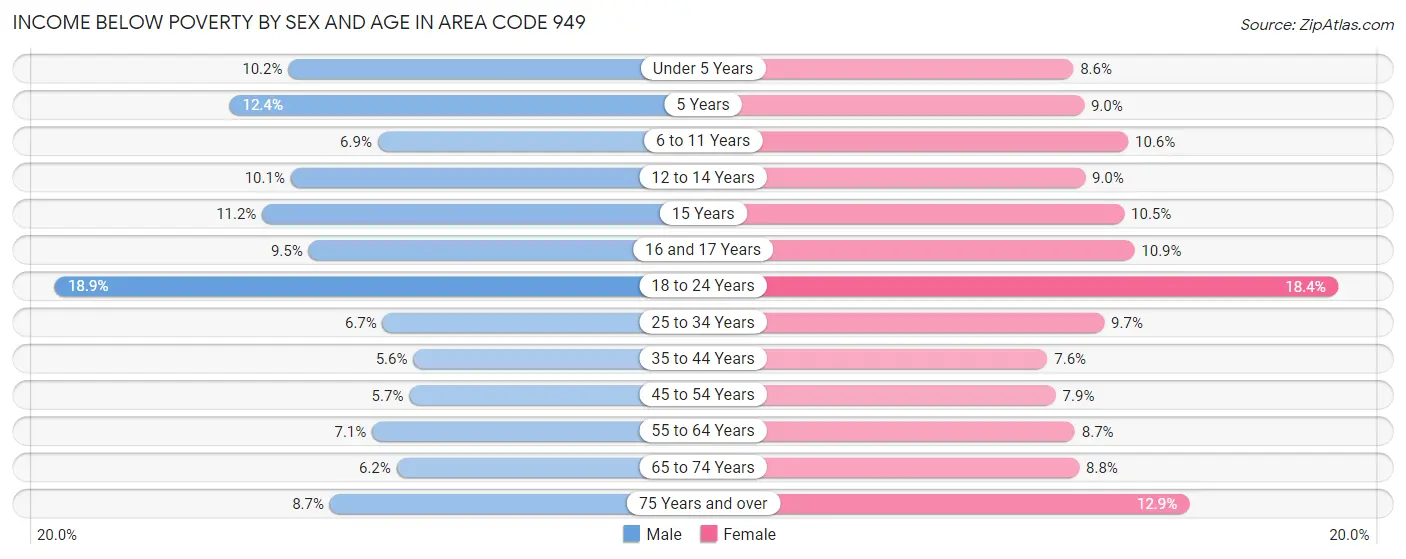
| Age Bracket | Male | Female |
| Under 5 Years | 3,718 (10.2%) | 2,888 (8.6%) |
| 5 Years | 851 (12.4%) | 567 (9.0%) |
| 6 to 11 Years | 3,138 (6.9%) | 4,531 (10.6%) |
| 12 to 14 Years | 2,499 (10.1%) | 2,192 (9.0%) |
| 15 Years | 921 (11.2%) | 771 (10.5%) |
| 16 and 17 Years | 1,637 (9.5%) | 1,694 (10.9%) |
| 18 to 24 Years | 10,544 (18.9%) | 9,552 (18.4%) |
| 25 to 34 Years | 5,911 (6.7%) | 8,275 (9.7%) |
| 35 to 44 Years | 4,620 (5.6%) | 6,473 (7.6%) |
| 45 to 54 Years | 4,939 (5.7%) | 7,090 (7.9%) |
| 55 to 64 Years | 5,567 (7.1%) | 7,085 (8.6%) |
| 65 to 74 Years | 3,244 (6.2%) | 5,340 (8.8%) |
| 75 Years and over | 3,098 (8.7%) | 6,019 (12.9%) |
| Total | 50,687 (8.2%) | 62,477 (9.9%) |
Income Above Poverty by Sex and Age in Area Code 949
According to the poverty statistics in Area Code 949, males aged 35 to 44 years and females aged 35 to 44 years are the age groups that are most secure financially, with 94.4% of males and 92.4% of females in these age groups living above the poverty line.
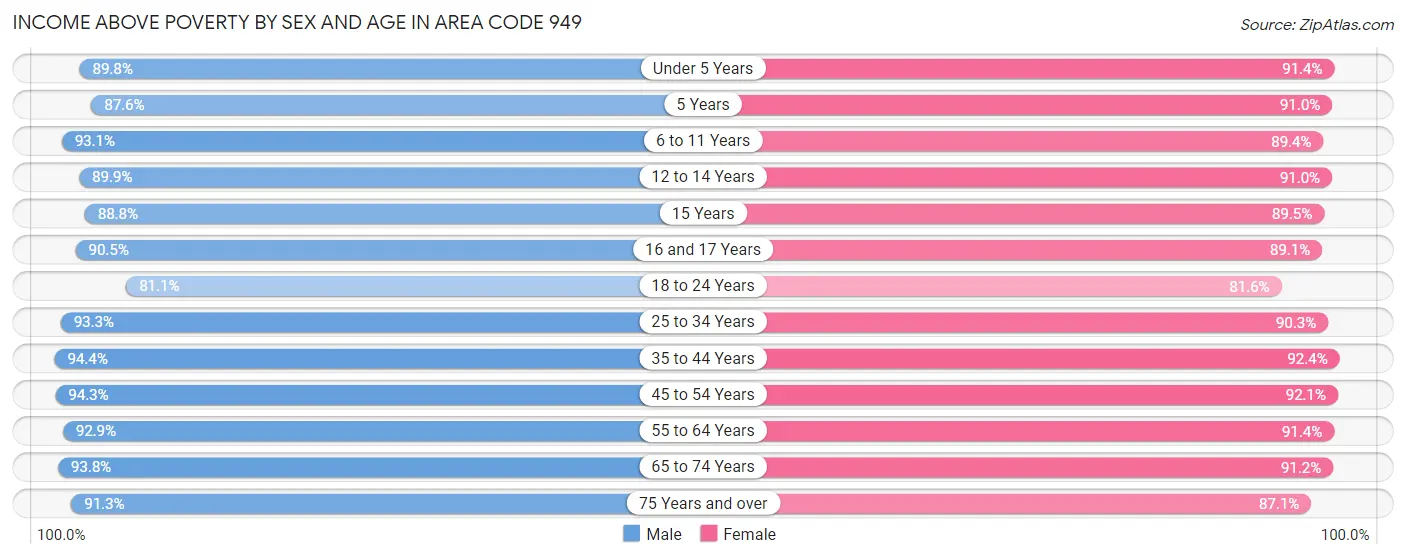
| Age Bracket | Male | Female |
| Under 5 Years | 32,685 (89.8%) | 30,721 (91.4%) |
| 5 Years | 6,019 (87.6%) | 5,738 (91.0%) |
| 6 to 11 Years | 42,411 (93.1%) | 38,106 (89.4%) |
| 12 to 14 Years | 22,184 (89.9%) | 22,090 (91.0%) |
| 15 Years | 7,315 (88.8%) | 6,586 (89.5%) |
| 16 and 17 Years | 15,663 (90.5%) | 13,901 (89.1%) |
| 18 to 24 Years | 45,338 (81.1%) | 42,367 (81.6%) |
| 25 to 34 Years | 82,187 (93.3%) | 76,665 (90.3%) |
| 35 to 44 Years | 78,259 (94.4%) | 78,405 (92.4%) |
| 45 to 54 Years | 81,474 (94.3%) | 82,182 (92.1%) |
| 55 to 64 Years | 72,857 (92.9%) | 74,865 (91.3%) |
| 65 to 74 Years | 49,185 (93.8%) | 55,247 (91.2%) |
| 75 Years and over | 32,625 (91.3%) | 40,670 (87.1%) |
| Total | 568,202 (91.8%) | 567,543 (90.1%) |
Income Below Poverty Among Married-Couple Families in Area Code 949
The poverty statistics for married-couple families in Area Code 949 show that 4.0% or 9,758 of the total 244,648 families live below the poverty line. Families with 5 or more children have the highest poverty rate of 19.3%, comprising of 189 families. On the other hand, families with 1 or 2 children have the lowest poverty rate of 3.5%, which includes 3,296 families.
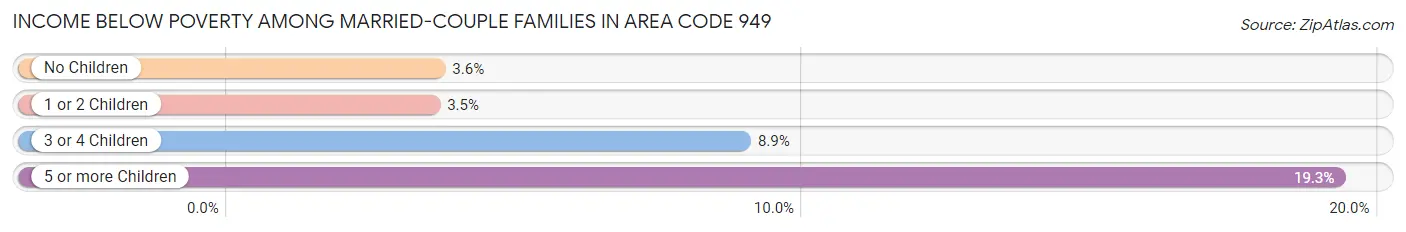
| Children | Above Poverty | Below Poverty |
| No Children | 128,862 (96.4%) | 4,823 (3.6%) |
| 1 or 2 Children | 90,444 (96.5%) | 3,296 (3.5%) |
| 3 or 4 Children | 14,793 (91.1%) | 1,450 (8.9%) |
| 5 or more Children | 791 (80.7%) | 189 (19.3%) |
| Total | 234,890 (96.0%) | 9,758 (4.0%) |
Income Below Poverty Among Single-Parent Households in Area Code 949
According to the poverty data in Area Code 949, 10.2% or 2,040 single-father households and 17.2% or 7,781 single-mother households are living below the poverty line. Among single-father households, those with 3 or 4 children have the highest poverty rate, with 201 households (21.4%) experiencing poverty. Likewise, among single-mother households, those with 5 or more children have the highest poverty rate, with 149 households (60.8%) falling below the poverty line.
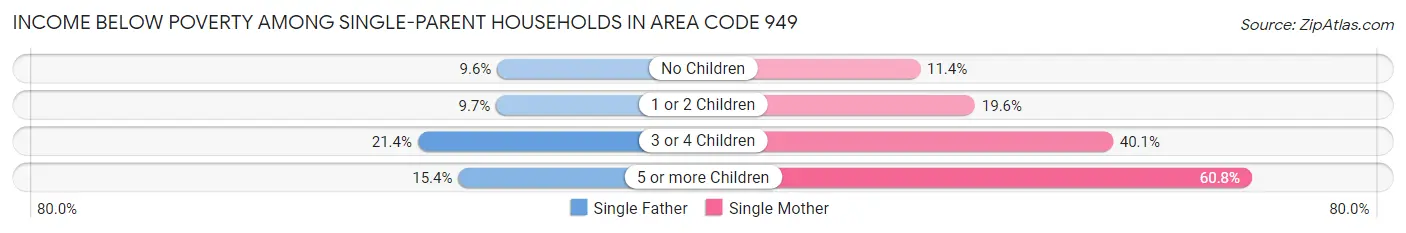
| Children | Single Father | Single Mother |
| No Children | 1,031 (9.6%) | 2,457 (11.4%) |
| 1 or 2 Children | 788 (9.7%) | 4,049 (19.6%) |
| 3 or 4 Children | 201 (21.4%) | 1,126 (40.1%) |
| 5 or more Children | 20 (15.4%) | 149 (60.8%) |
| Total | 2,040 (10.2%) | 7,781 (17.2%) |
Income Below Poverty Among Married-Couple vs Single-Parent Households in Area Code 949
The poverty data for Area Code 949 shows that 9,758 of the married-couple family households (4.0%) and 9,821 of the single-parent households (15.0%) are living below the poverty level. Within the married-couple family households, those with 5 or more children have the highest poverty rate, with 189 households (19.3%) falling below the poverty line. Among the single-parent households, those with 5 or more children have the highest poverty rate, with 169 household (45.1%) living below poverty.
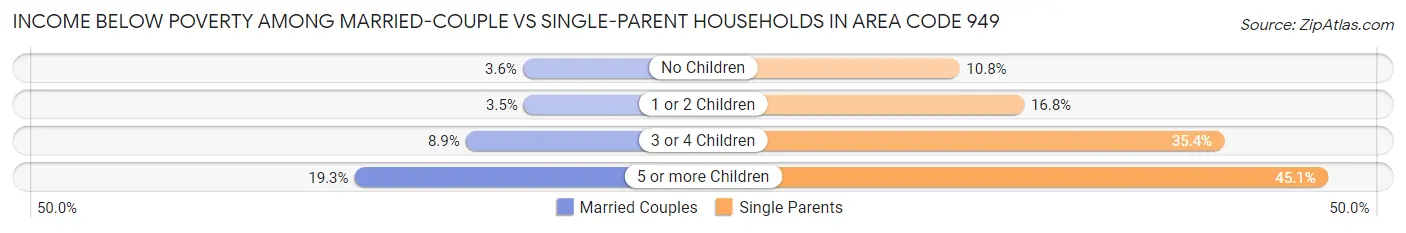
| Children | Married-Couple Families | Single-Parent Households |
| No Children | 4,823 (3.6%) | 3,488 (10.8%) |
| 1 or 2 Children | 3,296 (3.5%) | 4,837 (16.8%) |
| 3 or 4 Children | 1,450 (8.9%) | 1,327 (35.4%) |
| 5 or more Children | 189 (19.3%) | 169 (45.1%) |
| Total | 9,758 (4.0%) | 9,821 (15.0%) |
Race in Area Code 949
The most populous races in Area Code 949 are White / Caucasian (701,899 | 55.7%), Hispanic or Latino (354,487 | 28.1%), and Asian (239,675 | 19.0%).
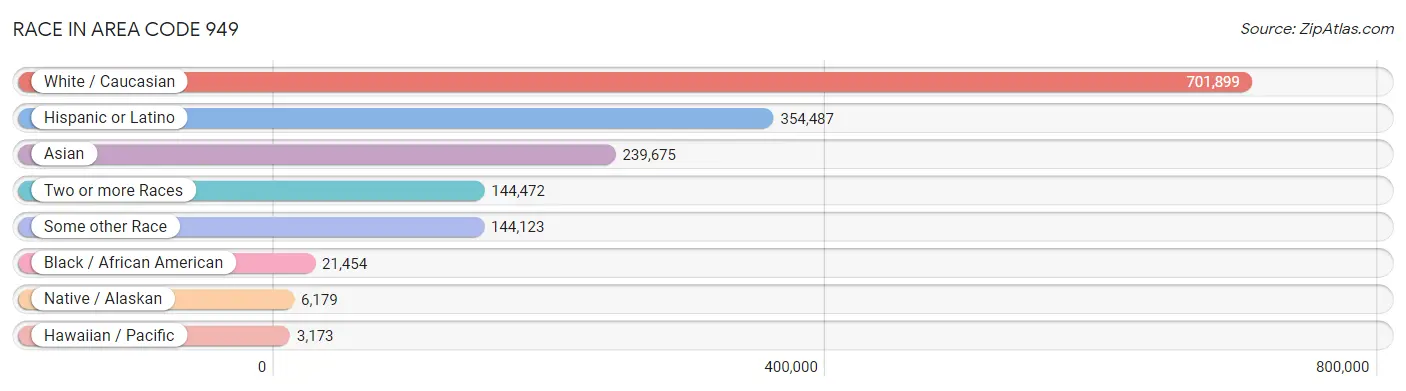
| Race | # Population | % Population |
| Asian | 239,675 | 19.0% |
| Black / African American | 21,454 | 1.7% |
| Hawaiian / Pacific | 3,173 | 0.3% |
| Hispanic or Latino | 354,487 | 28.1% |
| Native / Alaskan | 6,179 | 0.5% |
| White / Caucasian | 701,899 | 55.7% |
| Two or more Races | 144,472 | 11.5% |
| Some other Race | 144,123 | 11.4% |
| Total | 1,260,975 | 100.0% |
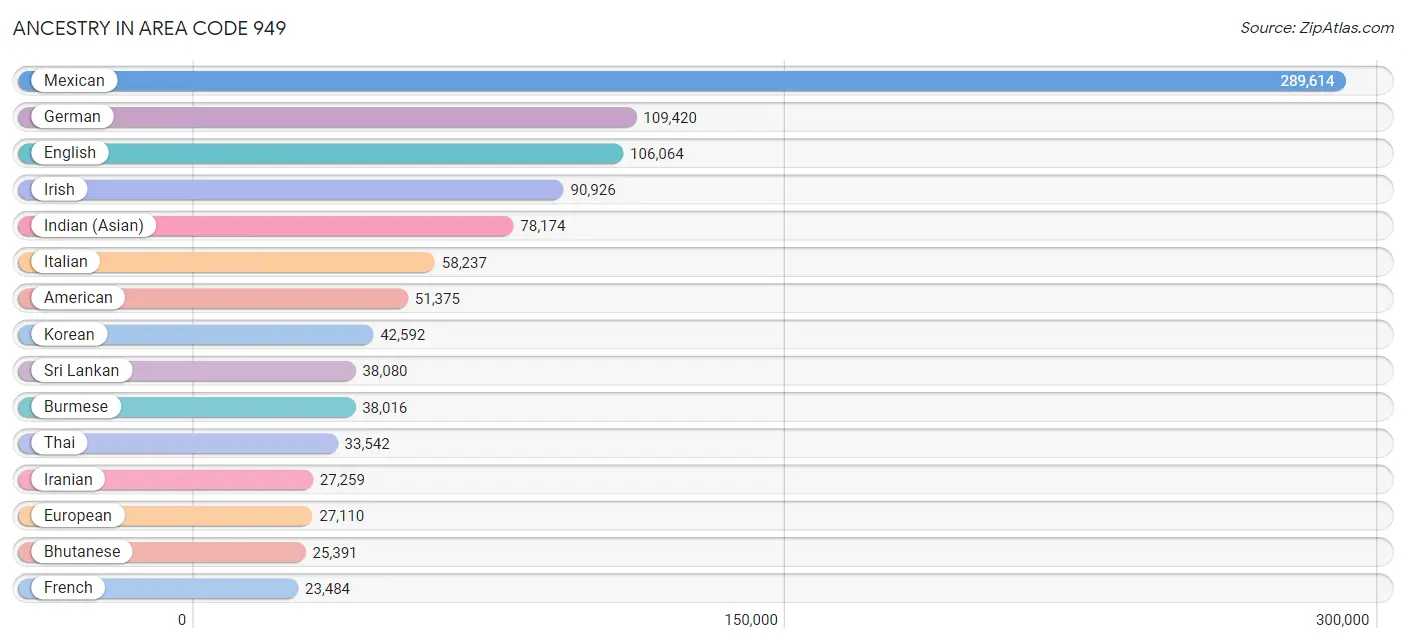
Ancestry in Area Code 949
The most populous ancestries reported in Area Code 949 are Mexican (289,614 | 23.0%), German (109,420 | 8.7%), English (106,064 | 8.4%), Irish (90,926 | 7.2%), and Indian (Asian) (78,174 | 6.2%), together accounting for 53.5% of all Area Code 949 residents.
| Ancestry | # Population | % Population |
| Afghan | 3,222 | 0.3% |
| African | 2,544 | 0.2% |
| Albanian | 342 | 0.0% |
| Aleut | 54 | 0.0% |
| Alsatian | 30 | 0.0% |
| American | 51,375 | 4.1% |
| Apache | 668 | 0.1% |
| Arab | 18,820 | 1.5% |
| Argentinean | 2,684 | 0.2% |
| Armenian | 4,471 | 0.4% |
| Assyrian / Chaldean / Syriac | 417 | 0.0% |
| Australian | 838 | 0.1% |
| Austrian | 3,358 | 0.3% |
| Bahamian | 25 | 0.0% |
| Bangladeshi | 288 | 0.0% |
| Barbadian | 50 | 0.0% |
| Basque | 587 | 0.1% |
| Belgian | 1,090 | 0.1% |
| Belizean | 14 | 0.0% |
| Bhutanese | 25,391 | 2.0% |
| Blackfeet | 380 | 0.0% |
| Bolivian | 1,371 | 0.1% |
| Brazilian | 2,261 | 0.2% |
| British | 9,442 | 0.7% |
| British West Indian | 30 | 0.0% |
| Bulgarian | 516 | 0.0% |
| Burmese | 38,016 | 3.0% |
| Cajun | 64 | 0.0% |
| Cambodian | 68 | 0.0% |
| Canadian | 4,057 | 0.3% |
| Cape Verdean | 113 | 0.0% |
| Carpatho Rusyn | 13 | 0.0% |
| Celtic | 104 | 0.0% |
| Central American | 23,321 | 1.8% |
| Central American Indian | 1,110 | 0.1% |
| Cherokee | 2,413 | 0.2% |
| Cheyenne | 28 | 0.0% |
| Chickasaw | 38 | 0.0% |
| Chilean | 824 | 0.1% |
| Chinese | 116 | 0.0% |
| Chippewa | 303 | 0.0% |
| Choctaw | 617 | 0.1% |
| Colombian | 4,029 | 0.3% |
| Costa Rican | 1,455 | 0.1% |
| Cree | 29 | 0.0% |
| Creek | 102 | 0.0% |
| Croatian | 2,092 | 0.2% |
| Cuban | 3,442 | 0.3% |
| Czech | 3,262 | 0.3% |
| Czechoslovakian | 703 | 0.1% |
| Danish | 6,386 | 0.5% |
| Delaware | 13 | 0.0% |
| Dominican | 671 | 0.1% |
| Dutch | 11,040 | 0.9% |
| Eastern European | 5,588 | 0.4% |
| Ecuadorian | 1,371 | 0.1% |
| Egyptian | 3,918 | 0.3% |
| English | 106,064 | 8.4% |
| Estonian | 357 | 0.0% |
| Ethiopian | 506 | 0.0% |
| European | 27,110 | 2.1% |
| Fijian | 12 | 0.0% |
| Filipino | 10,035 | 0.8% |
| Finnish | 1,719 | 0.1% |
| French | 23,484 | 1.9% |
| French American Indian | 39 | 0.0% |
| French Canadian | 4,501 | 0.4% |
| German | 109,420 | 8.7% |
| German Russian | 30 | 0.0% |
| Ghanaian | 146 | 0.0% |
| Greek | 5,140 | 0.4% |
| Guamanian / Chamorro | 938 | 0.1% |
| Guatemalan | 7,711 | 0.6% |
| Guyanese | 184 | 0.0% |
| Haitian | 109 | 0.0% |
| Hmong | 13 | 0.0% |
| Honduran | 1,389 | 0.1% |
| Hopi | 50 | 0.0% |
| Hungarian | 4,904 | 0.4% |
| Icelander | 425 | 0.0% |
| Indian (Asian) | 78,174 | 6.2% |
| Indonesian | 405 | 0.0% |
| Iranian | 27,259 | 2.2% |
| Iraqi | 699 | 0.1% |
| Irish | 90,926 | 7.2% |
| Iroquois | 487 | 0.0% |
| Israeli | 1,136 | 0.1% |
| Italian | 58,237 | 4.6% |
| Jamaican | 531 | 0.0% |
| Japanese | 3,149 | 0.3% |
| Jordanian | 1,267 | 0.1% |
| Kenyan | 496 | 0.0% |
| Korean | 42,592 | 3.4% |
| Laotian | 3,263 | 0.3% |
| Latvian | 441 | 0.0% |
| Lebanese | 3,902 | 0.3% |
| Lithuanian | 1,593 | 0.1% |
| Luxembourger | 114 | 0.0% |
| Macedonian | 248 | 0.0% |
| Malaysian | 1,796 | 0.1% |
| Maltese | 256 | 0.0% |
| Mexican | 289,614 | 23.0% |
| Mexican American Indian | 3,737 | 0.3% |
| Mongolian | 289 | 0.0% |
| Moroccan | 707 | 0.1% |
| Native Hawaiian | 3,020 | 0.2% |
| Navajo | 576 | 0.1% |
| Nepalese | 10 | 0.0% |
| New Zealander | 287 | 0.0% |
| Nicaraguan | 1,408 | 0.1% |
| Nigerian | 697 | 0.1% |
| Northern European | 3,179 | 0.3% |
| Norwegian | 14,117 | 1.1% |
| Okinawan | 186 | 0.0% |
| Osage | 31 | 0.0% |
| Paiute | 11 | 0.0% |
| Pakistani | 3,853 | 0.3% |
| Palestinian | 984 | 0.1% |
| Panamanian | 420 | 0.0% |
| Paraguayan | 80 | 0.0% |
| Pennsylvania German | 151 | 0.0% |
| Peruvian | 3,473 | 0.3% |
| Polish | 22,966 | 1.8% |
| Portuguese | 5,224 | 0.4% |
| Potawatomi | 105 | 0.0% |
| Pueblo | 229 | 0.0% |
| Puerto Rican | 5,552 | 0.4% |
| Puget Sound Salish | 4 | 0.0% |
| Romanian | 3,333 | 0.3% |
| Russian | 15,301 | 1.2% |
| Salvadoran | 10,854 | 0.9% |
| Samoan | 1,426 | 0.1% |
| Scandinavian | 4,638 | 0.4% |
| Scotch-Irish | 6,804 | 0.5% |
| Scottish | 19,678 | 1.6% |
| Seminole | 159 | 0.0% |
| Serbian | 1,096 | 0.1% |
| Shoshone | 74 | 0.0% |
| Sioux | 301 | 0.0% |
| Slavic | 339 | 0.0% |
| Slovak | 1,500 | 0.1% |
| Slovene | 571 | 0.1% |
| Somali | 170 | 0.0% |
| South African | 1,106 | 0.1% |
| South American | 15,895 | 1.3% |
| South American Indian | 193 | 0.0% |
| Spaniard | 4,813 | 0.4% |
| Spanish | 4,683 | 0.4% |
| Spanish American | 86 | 0.0% |
| Spanish American Indian | 63 | 0.0% |
| Sri Lankan | 38,080 | 3.0% |
| Subsaharan African | 6,268 | 0.5% |
| Sudanese | 198 | 0.0% |
| Swedish | 15,922 | 1.3% |
| Swiss | 2,970 | 0.2% |
| Syrian | 2,538 | 0.2% |
| Thai | 33,542 | 2.7% |
| Tohono O'Odham | 29 | 0.0% |
| Tongan | 185 | 0.0% |
| Trinidadian and Tobagonian | 175 | 0.0% |
| Turkish | 2,443 | 0.2% |
| U.S. Virgin Islander | 5 | 0.0% |
| Ugandan | 75 | 0.0% |
| Ukrainian | 4,077 | 0.3% |
| Uruguayan | 292 | 0.0% |
| Venezuelan | 1,556 | 0.1% |
| Vietnamese | 439 | 0.0% |
| Welsh | 5,727 | 0.4% |
| West Indian | 101 | 0.0% |
| Yaqui | 474 | 0.0% |
| Yugoslavian | 729 | 0.1% |
| Yup'ik | 9 | 0.0% |
| Zimbabwean | 74 | 0.0% | View All 173 Rows |
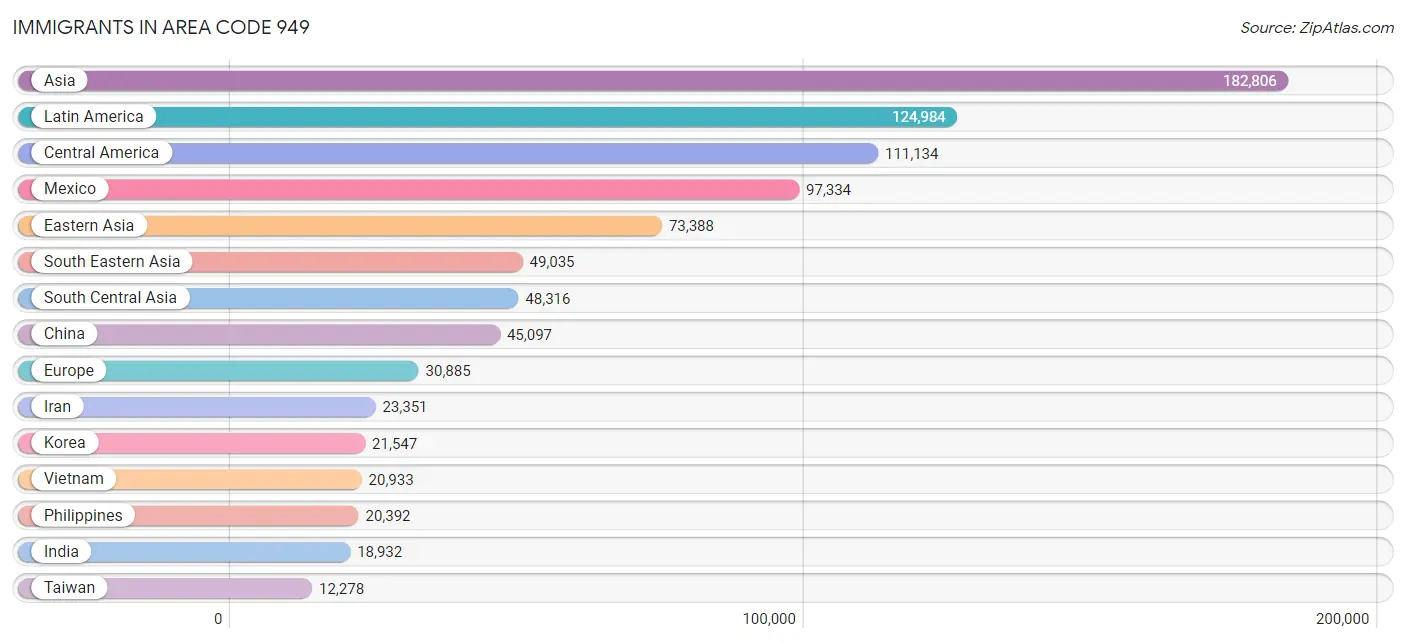
Immigrants in Area Code 949
The most numerous immigrant groups reported in Area Code 949 came from Asia (182,806 | 14.5%), Latin America (124,984 | 9.9%), Central America (111,134 | 8.8%), Mexico (97,334 | 7.7%), and Eastern Asia (73,388 | 5.8%), together accounting for 46.8% of all Area Code 949 residents.
| Immigration Origin | # Population | % Population |
| Afghanistan | 2,214 | 0.2% |
| Africa | 9,215 | 0.7% |
| Albania | 118 | 0.0% |
| Argentina | 1,531 | 0.1% |
| Armenia | 532 | 0.0% |
| Asia | 182,806 | 14.5% |
| Australia | 1,089 | 0.1% |
| Austria | 276 | 0.0% |
| Bahamas | 8 | 0.0% |
| Bangladesh | 409 | 0.0% |
| Barbados | 13 | 0.0% |
| Belarus | 317 | 0.0% |
| Belgium | 411 | 0.0% |
| Belize | 44 | 0.0% |
| Bolivia | 562 | 0.0% |
| Bosnia and Herzegovina | 147 | 0.0% |
| Brazil | 2,601 | 0.2% |
| Bulgaria | 610 | 0.1% |
| Cambodia | 1,621 | 0.1% |
| Canada | 7,040 | 0.6% |
| Caribbean | 1,821 | 0.1% |
| Central America | 111,134 | 8.8% |
| Chile | 676 | 0.1% |
| China | 45,097 | 3.6% |
| Colombia | 2,364 | 0.2% |
| Congo | 17 | 0.0% |
| Costa Rica | 652 | 0.1% |
| Croatia | 151 | 0.0% |
| Cuba | 674 | 0.1% |
| Czechoslovakia | 698 | 0.1% |
| Denmark | 374 | 0.0% |
| Dominica | 24 | 0.0% |
| Dominican Republic | 206 | 0.0% |
| Eastern Africa | 1,998 | 0.2% |
| Eastern Asia | 73,388 | 5.8% |
| Eastern Europe | 12,256 | 1.0% |
| Ecuador | 683 | 0.1% |
| Egypt | 3,348 | 0.3% |
| El Salvador | 7,027 | 0.6% |
| England | 3,446 | 0.3% |
| Eritrea | 63 | 0.0% |
| Ethiopia | 398 | 0.0% |
| Europe | 30,885 | 2.5% |
| Fiji | 230 | 0.0% |
| France | 1,776 | 0.1% |
| Germany | 3,411 | 0.3% |
| Ghana | 166 | 0.0% |
| Greece | 268 | 0.0% |
| Grenada | 62 | 0.0% |
| Guatemala | 4,418 | 0.4% |
| Guyana | 243 | 0.0% |
| Haiti | 66 | 0.0% |
| Honduras | 640 | 0.1% |
| Hong Kong | 2,580 | 0.2% |
| Hungary | 655 | 0.1% |
| India | 18,932 | 1.5% |
| Indonesia | 2,355 | 0.2% |
| Iran | 23,351 | 1.8% |
| Iraq | 616 | 0.1% |
| Ireland | 594 | 0.1% |
| Israel | 1,394 | 0.1% |
| Italy | 1,438 | 0.1% |
| Jamaica | 399 | 0.0% |
| Japan | 6,705 | 0.5% |
| Jordan | 1,040 | 0.1% |
| Kazakhstan | 307 | 0.0% |
| Kenya | 1,038 | 0.1% |
| Korea | 21,547 | 1.7% |
| Kuwait | 447 | 0.0% |
| Laos | 719 | 0.1% |
| Latin America | 124,984 | 9.9% |
| Latvia | 79 | 0.0% |
| Lebanon | 1,675 | 0.1% |
| Liberia | 22 | 0.0% |
| Lithuania | 54 | 0.0% |
| Malaysia | 576 | 0.1% |
| Mexico | 97,334 | 7.7% |
| Middle Africa | 54 | 0.0% |
| Moldova | 72 | 0.0% |
| Morocco | 447 | 0.0% |
| Nepal | 118 | 0.0% |
| Netherlands | 862 | 0.1% |
| Nicaragua | 698 | 0.1% |
| Nigeria | 332 | 0.0% |
| North Macedonia | 43 | 0.0% |
| Northern Africa | 4,086 | 0.3% |
| Northern Europe | 9,205 | 0.7% |
| Norway | 224 | 0.0% |
| Oceania | 2,038 | 0.2% |
| Pakistan | 2,213 | 0.2% |
| Panama | 235 | 0.0% |
| Peru | 2,492 | 0.2% |
| Philippines | 20,392 | 1.6% |
| Poland | 1,271 | 0.1% |
| Portugal | 264 | 0.0% |
| Romania | 1,792 | 0.1% |
| Russia | 3,439 | 0.3% |
| Saudi Arabia | 1,130 | 0.1% |
| Scotland | 463 | 0.0% |
| Senegal | 233 | 0.0% |
| Serbia | 304 | 0.0% |
| Sierra Leone | 81 | 0.0% |
| Singapore | 393 | 0.0% |
| Somalia | 26 | 0.0% |
| South Africa | 2,182 | 0.2% |
| South America | 12,029 | 0.9% |
| South Central Asia | 48,316 | 3.8% |
| South Eastern Asia | 49,035 | 3.9% |
| Southern Europe | 2,293 | 0.2% |
| Spain | 291 | 0.0% |
| Sri Lanka | 534 | 0.0% |
| Sudan | 197 | 0.0% |
| Sweden | 437 | 0.0% |
| Switzerland | 380 | 0.0% |
| Syria | 2,435 | 0.2% |
| Taiwan | 12,278 | 1.0% |
| Thailand | 1,678 | 0.1% |
| Trinidad and Tobago | 111 | 0.0% |
| Turkey | 1,930 | 0.2% |
| Uganda | 110 | 0.0% |
| Ukraine | 1,793 | 0.1% |
| Uruguay | 162 | 0.0% |
| Uzbekistan | 157 | 0.0% |
| Venezuela | 553 | 0.0% |
| Vietnam | 20,933 | 1.7% |
| West Indies | 16 | 0.0% |
| Western Africa | 883 | 0.1% |
| Western Asia | 11,792 | 0.9% |
| Western Europe | 7,116 | 0.6% |
| Yemen | 44 | 0.0% |
| Zaire | 37 | 0.0% |
| Zimbabwe | 140 | 0.0% | View All 132 Rows |
Sex and Age in Area Code 949
Sex and Age in Area Code 949
The most populous age groups in Area Code 949 are 50 to 54 Years (46,052 | 7.3%) for men and 50 to 54 Years (45,585 | 7.2%) for women.

| Age Bracket | Male | Female |
| Under 5 Years | 37,144 (5.9%) | 34,016 (5.4%) |
| 5 to 9 Years | 37,336 (5.9%) | 34,199 (5.4%) |
| 10 to 14 Years | 40,988 (6.5%) | 39,877 (6.3%) |
| 15 to 19 Years | 42,016 (6.7%) | 38,301 (6.0%) |
| 20 to 24 Years | 41,827 (6.7%) | 37,496 (5.9%) |
| 25 to 29 Years | 44,776 (7.1%) | 42,892 (6.8%) |
| 30 to 34 Years | 44,733 (7.1%) | 42,126 (6.6%) |
| 35 to 39 Years | 44,021 (7.0%) | 42,869 (6.8%) |
| 40 to 44 Years | 39,572 (6.3%) | 42,058 (6.6%) |
| 45 to 49 Years | 40,766 (6.5%) | 43,778 (6.9%) |
| 50 to 54 Years | 46,052 (7.3%) | 45,585 (7.2%) |
| 55 to 59 Years | 42,095 (6.7%) | 43,379 (6.8%) |
| 60 to 64 Years | 36,743 (5.9%) | 38,697 (6.1%) |
| 65 to 69 Years | 27,928 (4.4%) | 32,263 (5.1%) |
| 70 to 74 Years | 24,802 (4.0%) | 28,620 (4.5%) |
| 75 to 79 Years | 15,998 (2.5%) | 18,419 (2.9%) |
| 80 to 84 Years | 8,999 (1.4%) | 12,484 (2.0%) |
| 85 Years and over | 11,181 (1.8%) | 16,939 (2.7%) |
| Total | 626,977 (100.0%) | 633,998 (100.0%) |
Families and Households in Area Code 949
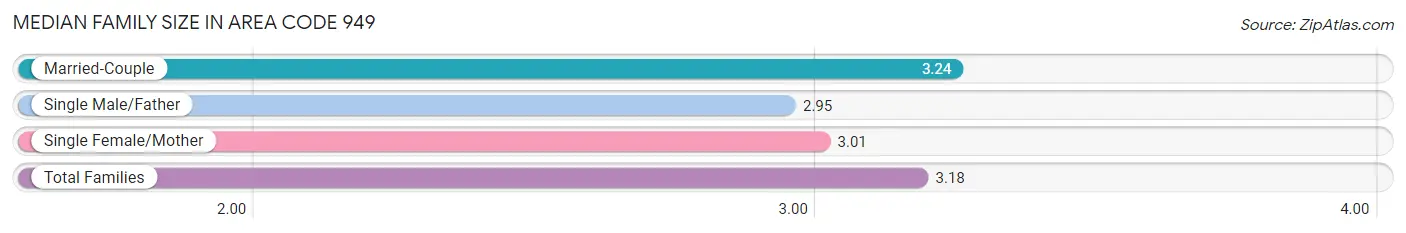
Median Family Size in Area Code 949
The median family size in Area Code 949 is 3.18 persons per family, with married-couple families (244,648 | 78.9%) accounting for the largest median family size of 3.24394 persons per family. On the other hand, single male/father families (19,927 | 6.4%) represent the smallest median family size with 2.95 persons per family.
| Family Type | # Families | Family Size |
| Married-Couple | 244,648 (78.9%) | 3.24 |
| Single Male/Father | 19,927 (6.4%) | 2.95 |
| Single Female/Mother | 45,353 (14.6%) | 3.01 |
| Total Families | 309,928 (100.0%) | 3.18 |
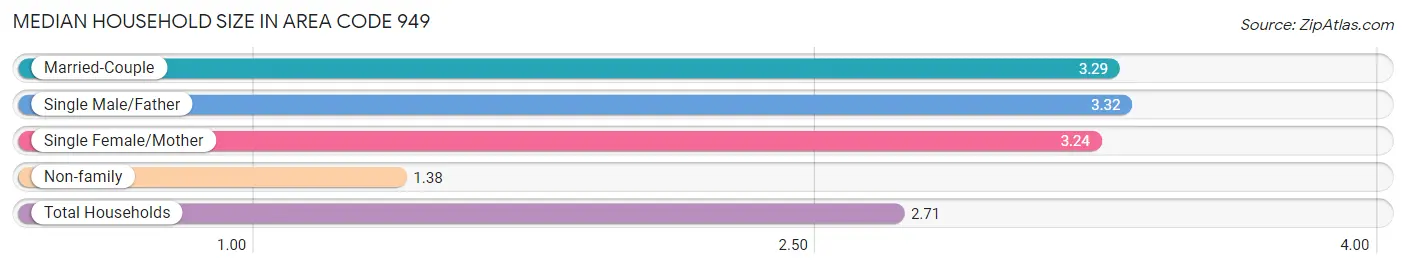
Median Household Size in Area Code 949
The median household size in Area Code 949 is 2.71 persons per household, with single male/father households (19,927 | 4.4%) accounting for the largest median household size of 3.31864 persons per household. non-family households (139,270 | 31.0%) represent the smallest median household size with 1.38 persons per household.
| Household Type | # Households | Household Size |
| Married-Couple | 244,648 (54.5%) | 3.29 |
| Single Male/Father | 19,927 (4.4%) | 3.32 |
| Single Female/Mother | 45,353 (10.1%) | 3.24 |
| Non-family | 139,270 (31.0%) | 1.38 |
| Total Households | 449,198 (100.0%) | 2.71 |
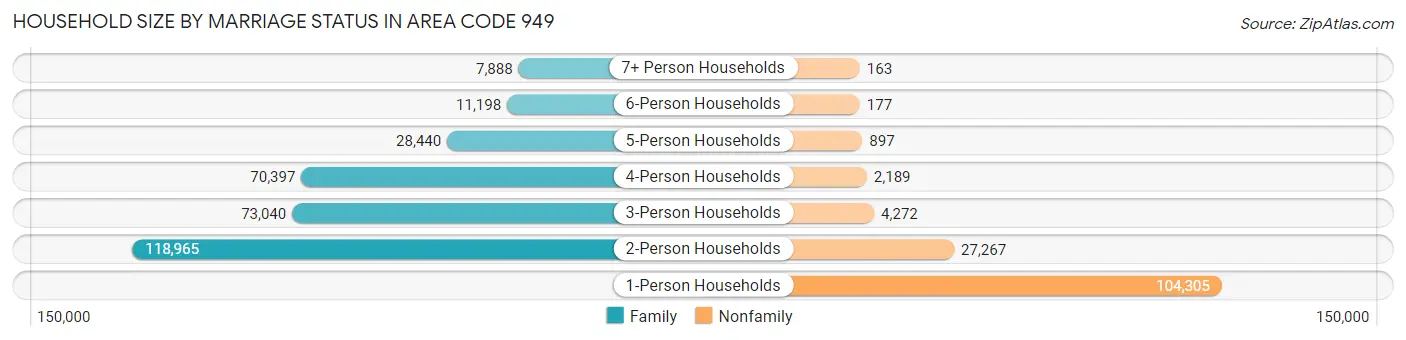
Household Size by Marriage Status in Area Code 949
Out of a total of 449,198 households in Area Code 949, 309,928 (69.0%) are family households, while 139,270 (31.0%) are nonfamily households. The most numerous type of family households are 2-person households, comprising 118,965, and the most common type of nonfamily households are 1-person households, comprising 104,305.
| Household Size | Family Households | Nonfamily Households |
| 1-Person Households | - | 104,305 (23.2%) |
| 2-Person Households | 118,965 (26.5%) | 27,267 (6.1%) |
| 3-Person Households | 73,040 (16.3%) | 4,272 (0.9%) |
| 4-Person Households | 70,397 (15.7%) | 2,189 (0.5%) |
| 5-Person Households | 28,440 (6.3%) | 897 (0.2%) |
| 6-Person Households | 11,198 (2.5%) | 177 (0.0%) |
| 7+ Person Households | 7,888 (1.8%) | 163 (0.0%) |
| Total | 309,928 (69.0%) | 139,270 (31.0%) |
Female Fertility in Area Code 949
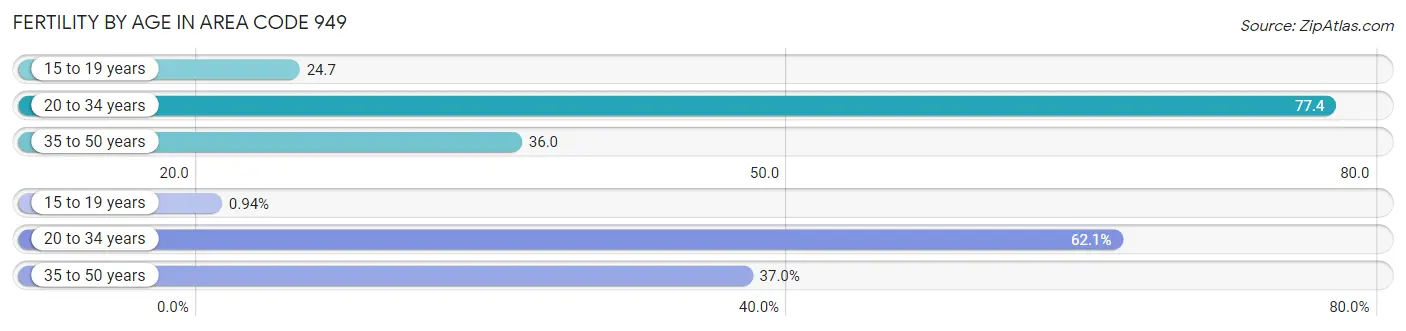
Fertility by Age in Area Code 949
Average fertility rate in Area Code 949 is 44.6 births per 1,000 women. Women in the age bracket of 20 to 34 years have the highest fertility rate with 77.4 births per 1,000 women. Women in the age bracket of 20 to 34 years acount for 62.1% of all women with births.
| Age Bracket | Women with Births | Births / 1,000 Women |
| 15 to 19 years | 131 (0.9%) | 24.7 |
| 20 to 34 years | 8,656 (62.1%) | 77.4 |
| 35 to 50 years | 5,152 (37.0%) | 36.0 |
| Total | 13,939 (100.0%) | 44.6 |
Fertility by Age by Marriage Status in Area Code 949
77.5% of women with births (13,939) in Area Code 949 are married. The highest percentage of unmarried women with births falls into 15 to 19 years age bracket with 100.0% of them unmarried at the time of birth, while the lowest percentage of unmarried women with births belong to 20 to 34 years age bracket with 23.8% of them unmarried.
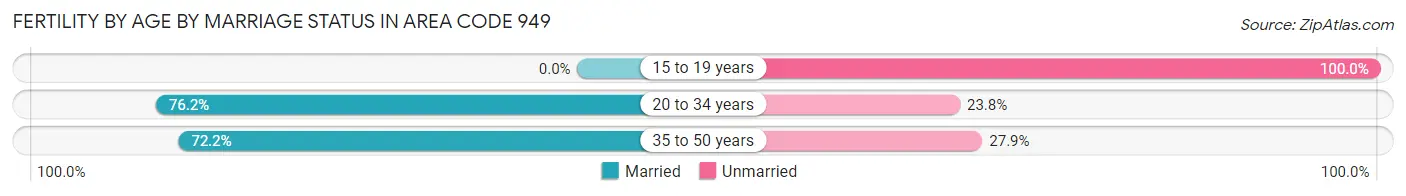
| Age Bracket | Married | Unmarried |
| 15 to 19 years | 0 (0.0%) | 131 (100.0%) |
| 20 to 34 years | 6,596 (76.2%) | 2,060 (23.8%) |
| 35 to 50 years | 3,717 (72.2%) | 1,435 (27.9%) |
| Total | 10,805 (77.5%) | 3,134 (22.5%) |
Fertility by Education in Area Code 949
Average fertility rate in Area Code 949 is 44.6 births per 1,000 women. Women with the education attainment of graduate degree have the highest fertility rate of 70.1 births per 1,000 women, while women with the education attainment of college or associate's degree have the lowest fertility at 41.4 births per 1,000 women. Women with the education attainment of bachelor's degree represent 37.6% of all women with births.
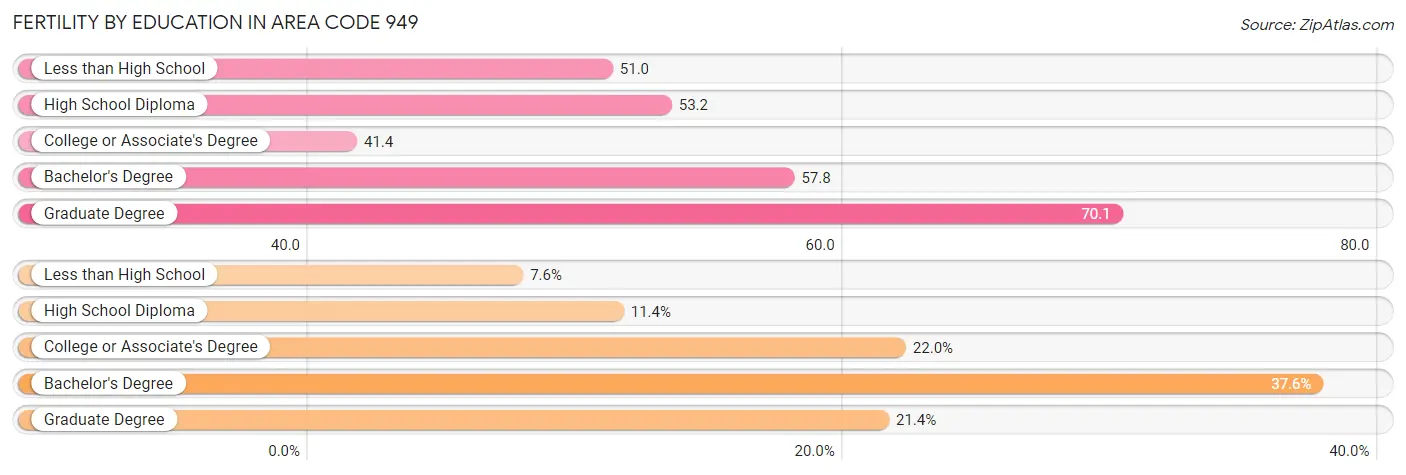
| Educational Attainment | Women with Births | Births / 1,000 Women |
| Less than High School | 1,065 (7.6%) | 51.0 |
| High School Diploma | 1,590 (11.4%) | 53.2 |
| College or Associate's Degree | 3,064 (22.0%) | 41.4 |
| Bachelor's Degree | 5,244 (37.6%) | 57.8 |
| Graduate Degree | 2,976 (21.3%) | 70.1 |
| Total | 13,939 (100.0%) | 44.6 |
Fertility by Education by Marriage Status in Area Code 949
22.5% of women with births in Area Code 949 are unmarried. Women with the educational attainment of bachelor's degree are most likely to be married with 72.3% of them married at childbirth, while women with the educational attainment of less than high school are least likely to be married with 70.2% of them unmarried at childbirth.
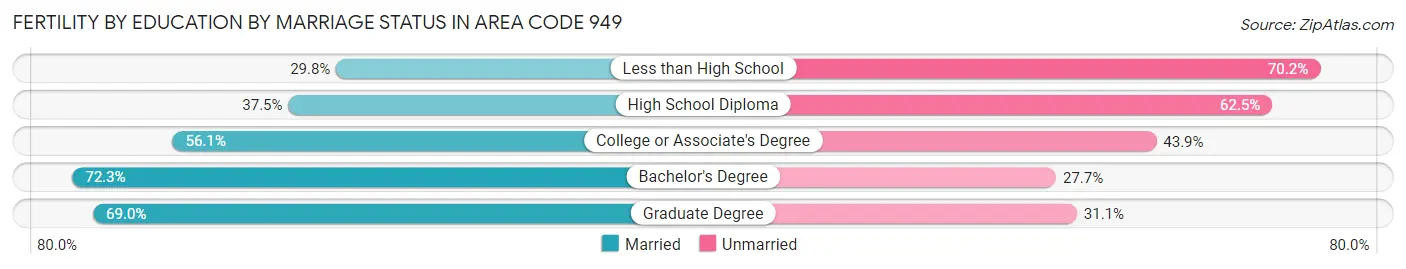
| Educational Attainment | Married | Unmarried |
| Less than High School | 317 (29.8%) | 748 (70.2%) |
| High School Diploma | 596 (37.5%) | 994 (62.5%) |
| College or Associate's Degree | 1,720 (56.1%) | 1,344 (43.9%) |
| Bachelor's Degree | 3,792 (72.3%) | 1,452 (27.7%) |
| Graduate Degree | 2,052 (69.0%) | 924 (31.0%) |
| Total | 10,805 (77.5%) | 3,134 (22.5%) |
Employment Characteristics in Area Code 949
Employment by Class of Employer in Area Code 949
Among the 626,014 employed individuals in Area Code 949, private company employees (438,233 | 70.0%), self-employed (not incorporated) (49,185 | 7.9%), and self-employed (incorporated) (37,148 | 5.9%) make up the most common classes of employment.
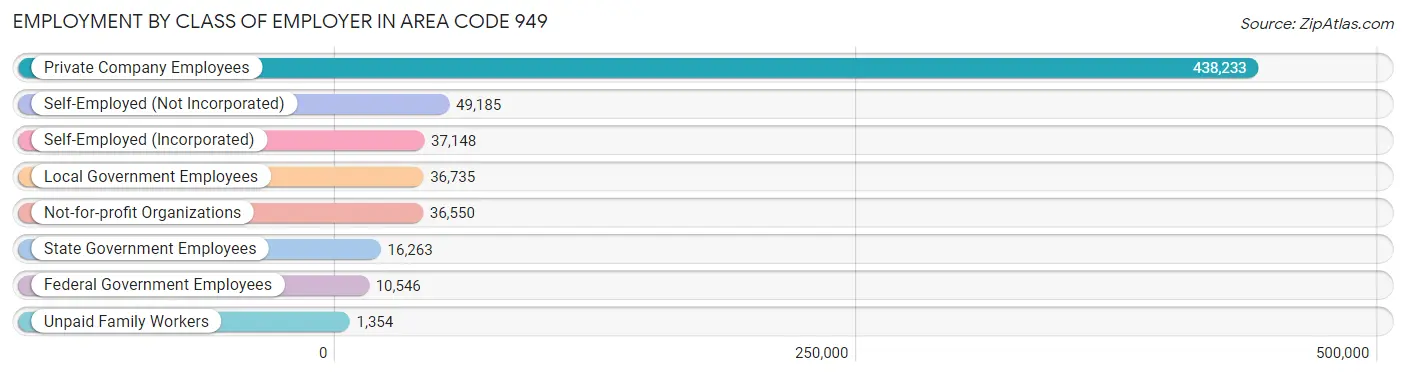
| Employer Class | # Employees | % Employees |
| Private Company Employees | 438,233 | 70.0% |
| Self-Employed (Incorporated) | 37,148 | 5.9% |
| Self-Employed (Not Incorporated) | 49,185 | 7.9% |
| Not-for-profit Organizations | 36,550 | 5.8% |
| Local Government Employees | 36,735 | 5.9% |
| State Government Employees | 16,263 | 2.6% |
| Federal Government Employees | 10,546 | 1.7% |
| Unpaid Family Workers | 1,354 | 0.2% |
| Total | 626,014 | 100.0% |
Employment Status by Age in Area Code 949
According to the labor force statistics for Area Code 949, out of the total population over 16 years of age (1,021,766), 64.3% or 657,302 individuals are in the labor force, with 5.0% or 32,997 of them unemployed. The age group with the highest labor force participation rate is 30 to 34 years, with 84.7% or 73,578 individuals in the labor force. Within the labor force, the 20 to 24 years age range has the highest percentage of unemployed individuals, with 376.0% or 213,670 of them being unemployed.
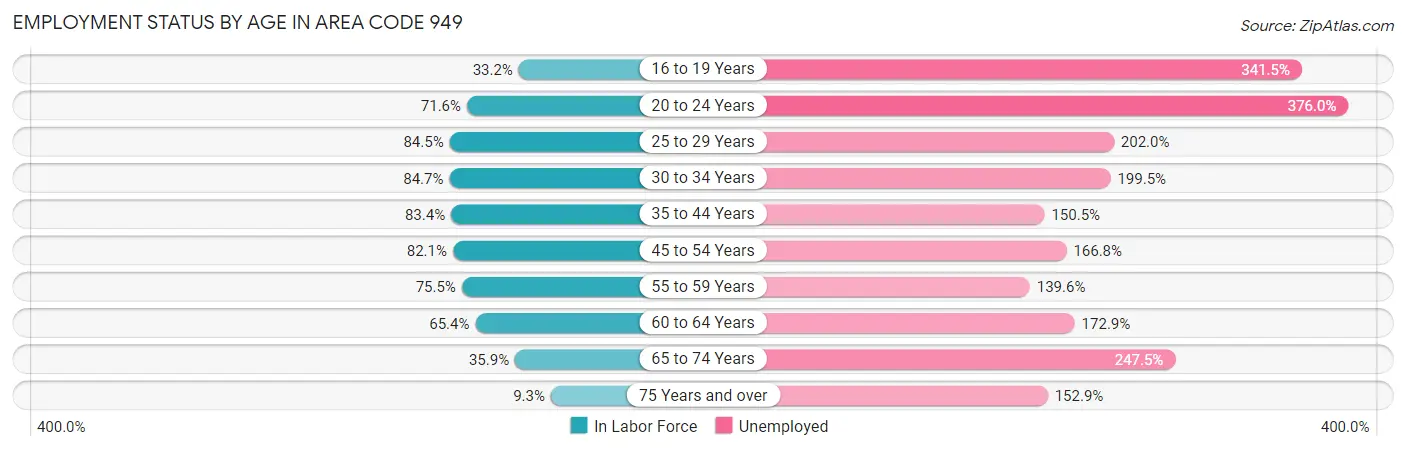
| Age Bracket | In Labor Force | Unemployed |
| 16 to 19 Years | 21,442 (33.2%) | 73,231 (341.5%) |
| 20 to 24 Years | 56,823 (71.6%) | 213,670 (376.0%) |
| 25 to 29 Years | 74,105 (84.5%) | 149,694 (202.0%) |
| 30 to 34 Years | 73,579 (84.7%) | 146,788 (199.5%) |
| 35 to 44 Years | 140,577 (83.4%) | 211,571 (150.5%) |
| 45 to 54 Years | 144,631 (82.1%) | 241,238 (166.8%) |
| 55 to 59 Years | 64,522 (75.5%) | 90,076 (139.6%) |
| 60 to 64 Years | 49,340 (65.4%) | 85,305 (172.9%) |
| 65 to 74 Years | 40,790 (35.9%) | 100,948 (247.5%) |
| 75 Years and over | 7,845 (9.3%) | 11,998 (152.9%) |
| Total | 657,318 (64.3%) | 32,969 (5.0%) |
Employment Status by Educational Attainment in Area Code 949
According to labor force statistics for Area Code 949, 79.8% of individuals (542,481) out of the total population between 25 and 64 years of age (680,142) are in the labor force, with 159.2% or 863,630 of them being unemployed. The group with the highest labor force participation rate are those with the educational attainment of bachelor's degree or higher, with 83.8% or 297,787 individuals in the labor force. Within the labor force, individuals with high school diploma education have the highest percentage of unemployment, with 251.8% or 170,776 of them being unemployed.
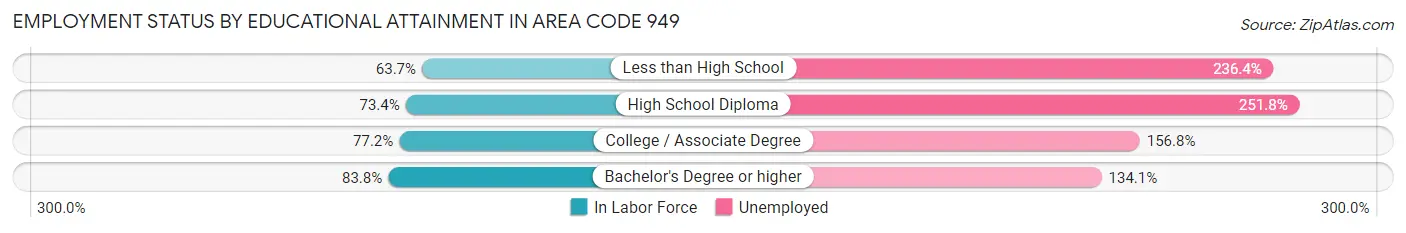
| Educational Attainment | In Labor Force | Unemployed |
| Less than High School | 42,730 (63.7%) | 158,509 (236.4%) |
| High School Diploma | 67,823 (73.4%) | 232,633 (251.8%) |
| College / Associate Degree | 127,854 (77.2%) | 259,532 (156.8%) |
| Bachelor's Degree or higher | 297,776 (83.8%) | 476,303 (134.1%) |
| Total | 542,449 (79.8%) | 1,082,786 (159.2%) |
Employment Occupations by Sex in Area Code 949
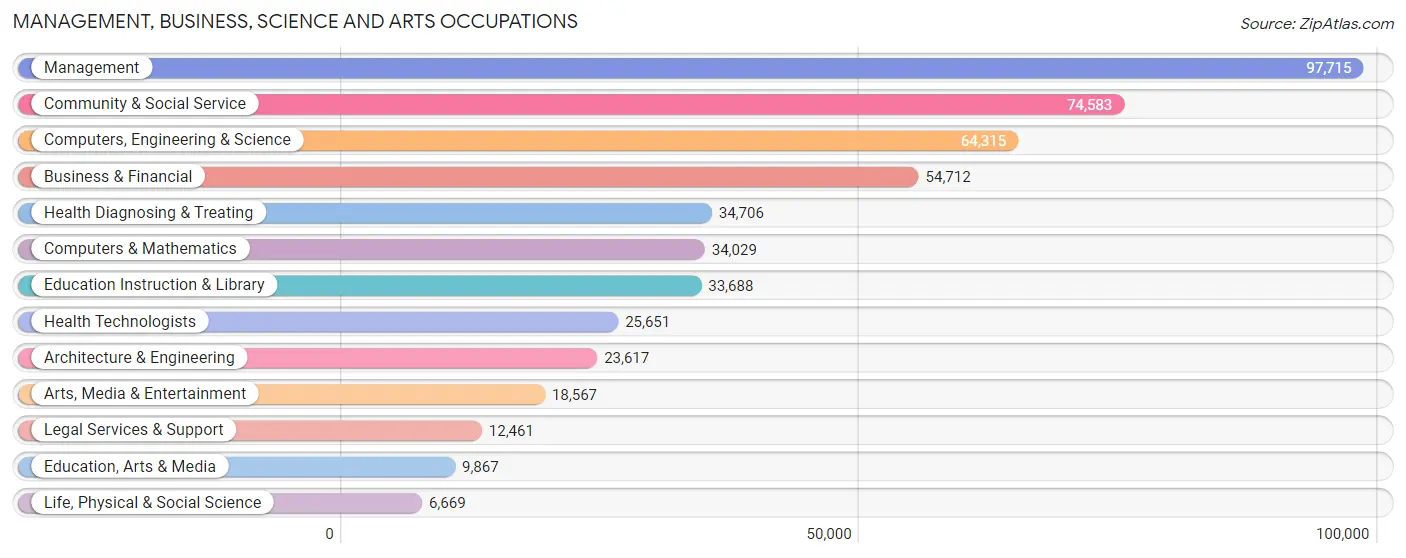
Management, Business, Science and Arts Occupations
The most common Management, Business, Science and Arts occupations in Area Code 949 are Management (97,715 | 15.4%), Community & Social Service (74,583 | 11.7%), Computers, Engineering & Science (64,315 | 10.1%), Business & Financial (54,712 | 8.6%), and Health Diagnosing & Treating (34,706 | 5.5%).
Management, Business, Science and Arts Occupations by Sex
Within the Management, Business, Science and Arts occupations in Area Code 949, the most male-oriented occupations are Architecture & Engineering (83.5%), Computers & Mathematics (76.1%), and Computers, Engineering & Science (76.1%), while the most female-oriented occupations are Education Instruction & Library (70.5%), Health Technologists (70.0%), and Health Diagnosing & Treating (68.0%).
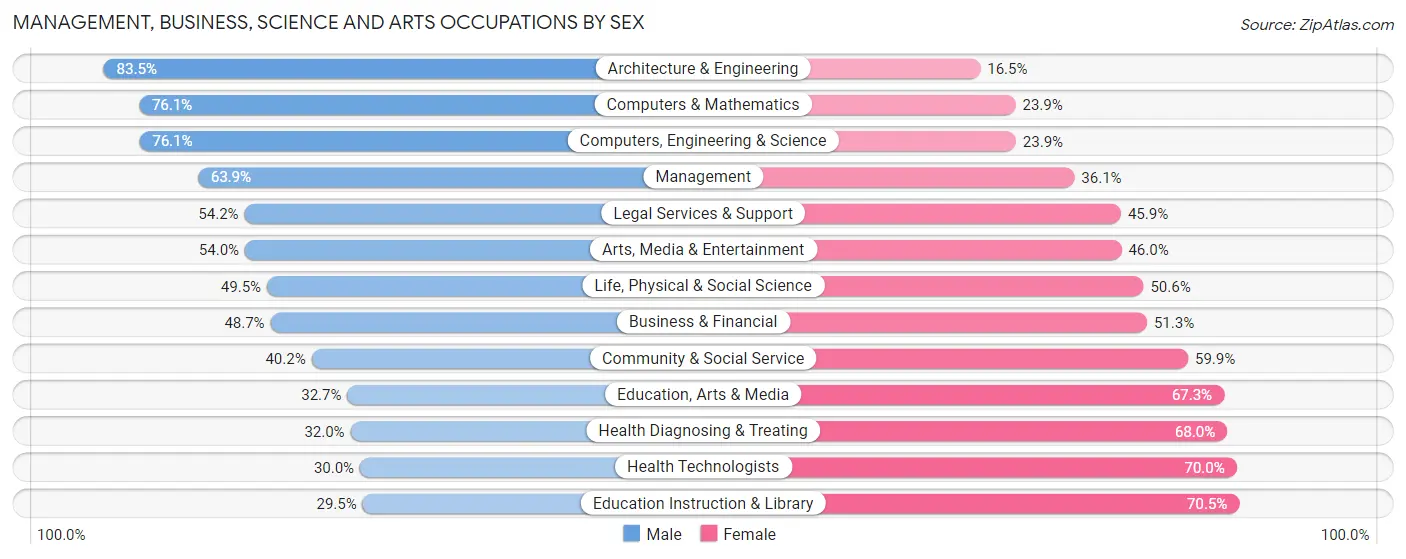
| Occupation | Male | Female |
| Management | 62,399 (63.9%) | 35,316 (36.1%) |
| Business & Financial | 26,655 (48.7%) | 28,057 (51.3%) |
| Computers, Engineering & Science | 48,927 (76.1%) | 15,388 (23.9%) |
| Computers & Mathematics | 25,908 (76.1%) | 8,121 (23.9%) |
| Architecture & Engineering | 19,721 (83.5%) | 3,896 (16.5%) |
| Life, Physical & Social Science | 3,298 (49.4%) | 3,371 (50.5%) |
| Community & Social Service | 29,945 (40.2%) | 44,638 (59.9%) |
| Education, Arts & Media | 3,225 (32.7%) | 6,642 (67.3%) |
| Legal Services & Support | 6,748 (54.1%) | 5,713 (45.9%) |
| Education Instruction & Library | 9,938 (29.5%) | 23,750 (70.5%) |
| Arts, Media & Entertainment | 10,034 (54.0%) | 8,533 (46.0%) |
| Health Diagnosing & Treating | 11,118 (32.0%) | 23,588 (68.0%) |
| Health Technologists | 7,705 (30.0%) | 17,946 (70.0%) |
| Total (Category) | 179,044 (54.9%) | 146,987 (45.1%) |
| Total (Overall) | 348,167 (54.7%) | 287,905 (45.3%) |
Services Occupations
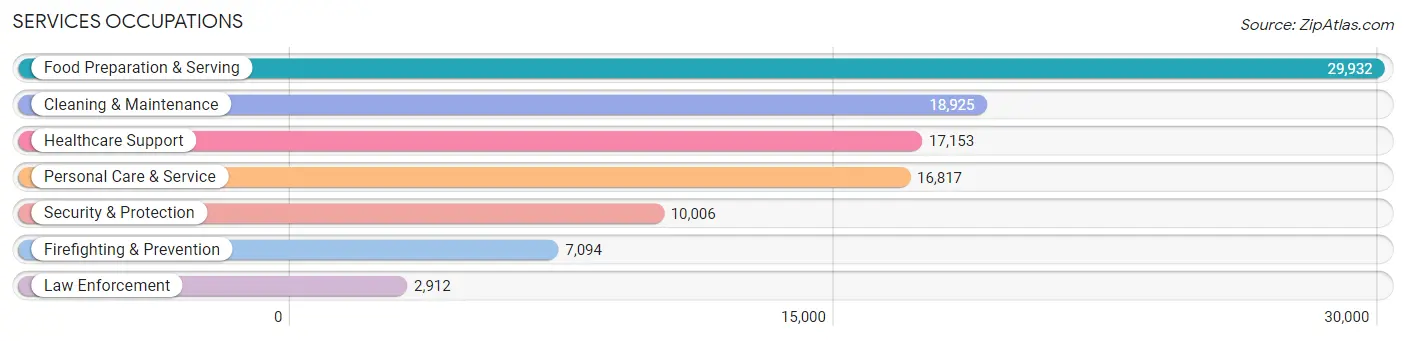
The most common Services occupations in Area Code 949 are Food Preparation & Serving (29,932 | 4.7%), Cleaning & Maintenance (18,925 | 3.0%), Healthcare Support (17,153 | 2.7%), Personal Care & Service (16,817 | 2.6%), and Security & Protection (10,006 | 1.6%).
Services Occupations by Sex
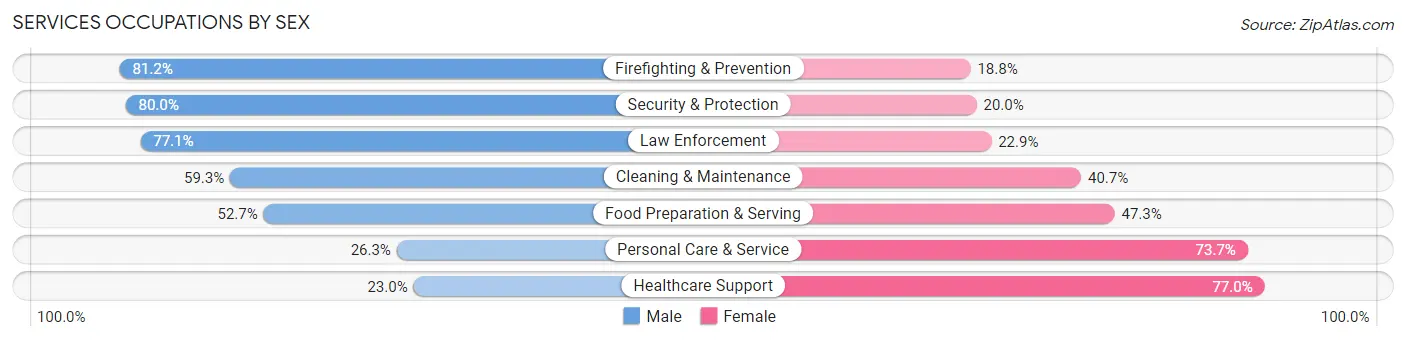
Within the Services occupations in Area Code 949, the most male-oriented occupations are Firefighting & Prevention (81.2%), Security & Protection (80.0%), and Law Enforcement (77.1%), while the most female-oriented occupations are Healthcare Support (77.0%), Personal Care & Service (73.7%), and Food Preparation & Serving (47.3%).
| Occupation | Male | Female |
| Healthcare Support | 3,944 (23.0%) | 13,209 (77.0%) |
| Security & Protection | 8,005 (80.0%) | 2,001 (20.0%) |
| Firefighting & Prevention | 5,760 (81.2%) | 1,334 (18.8%) |
| Law Enforcement | 2,245 (77.1%) | 667 (22.9%) |
| Food Preparation & Serving | 15,768 (52.7%) | 14,164 (47.3%) |
| Cleaning & Maintenance | 11,225 (59.3%) | 7,700 (40.7%) |
| Personal Care & Service | 4,426 (26.3%) | 12,391 (73.7%) |
| Total (Category) | 43,368 (46.7%) | 49,465 (53.3%) |
| Total (Overall) | 348,167 (54.7%) | 287,905 (45.3%) |
Sales and Office Occupations
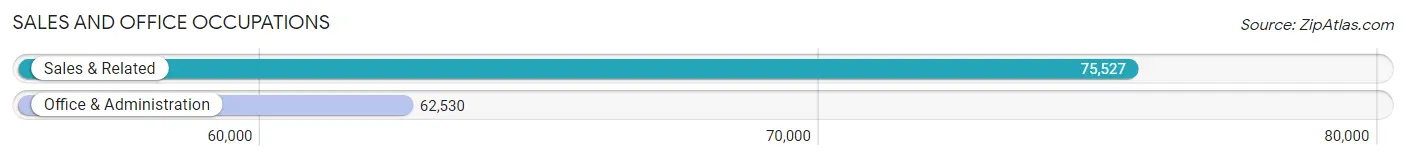
The most common Sales and Office occupations in Area Code 949 are Sales & Related (75,527 | 11.9%), and Office & Administration (62,530 | 9.8%).
Sales and Office Occupations by Sex
| Occupation | Male | Female |
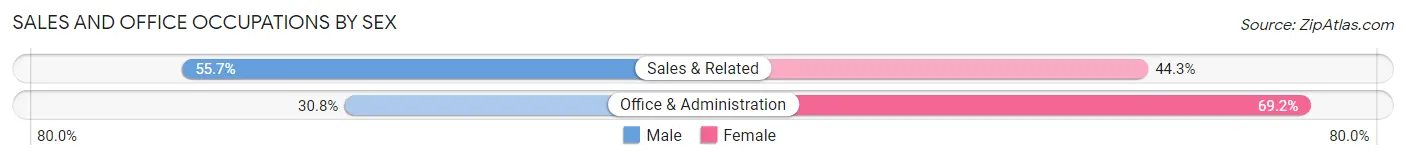
| Sales & Related | 42,097 (55.7%) | 33,430 (44.3%) |
| Office & Administration | 19,287 (30.8%) | 43,243 (69.2%) |
| Total (Category) | 61,384 (44.5%) | 76,673 (55.5%) |
| Total (Overall) | 348,167 (54.7%) | 287,905 (45.3%) |
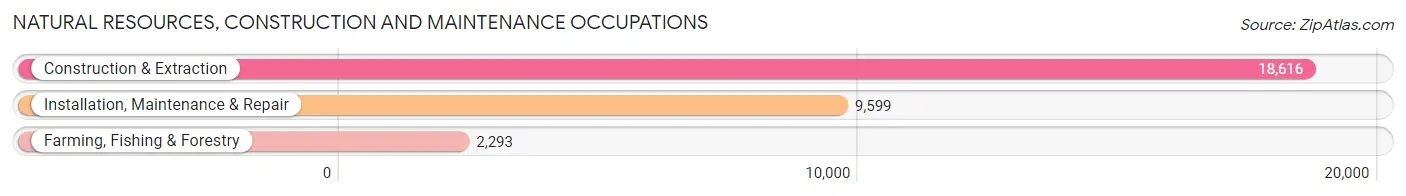
Natural Resources, Construction and Maintenance Occupations
The most common Natural Resources, Construction and Maintenance occupations in Area Code 949 are Construction & Extraction (18,616 | 2.9%), Installation, Maintenance & Repair (9,599 | 1.5%), and Farming, Fishing & Forestry (2,293 | 0.4%).
Natural Resources, Construction and Maintenance Occupations by Sex
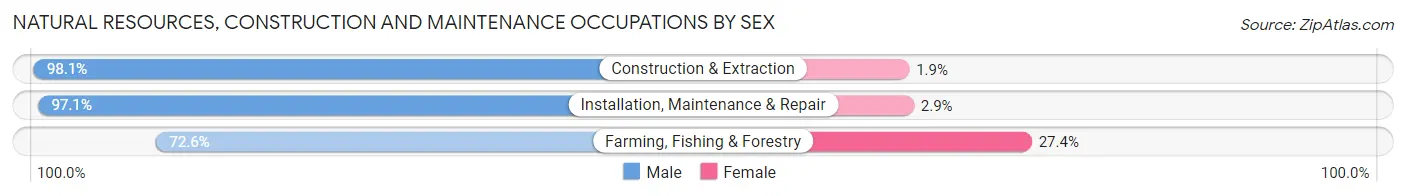
| Occupation | Male | Female |
| Farming, Fishing & Forestry | 1,664 (72.6%) | 629 (27.4%) |
| Construction & Extraction | 18,255 (98.1%) | 361 (1.9%) |
| Installation, Maintenance & Repair | 9,321 (97.1%) | 278 (2.9%) |
| Total (Category) | 29,240 (95.8%) | 1,268 (4.2%) |
| Total (Overall) | 348,167 (54.7%) | 287,905 (45.3%) |
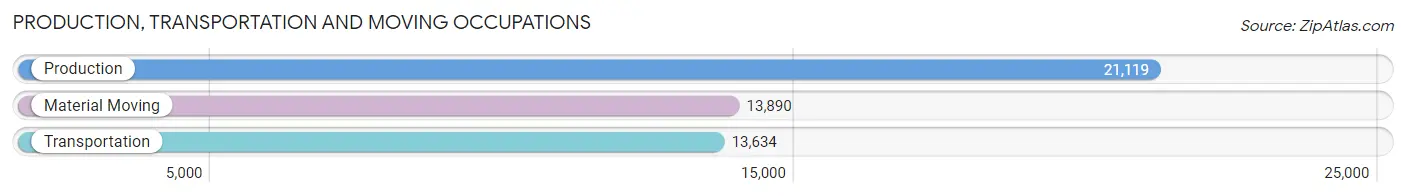
Production, Transportation and Moving Occupations
The most common Production, Transportation and Moving occupations in Area Code 949 are Production (21,119 | 3.3%), Material Moving (13,890 | 2.2%), and Transportation (13,634 | 2.1%).
Production, Transportation and Moving Occupations by Sex
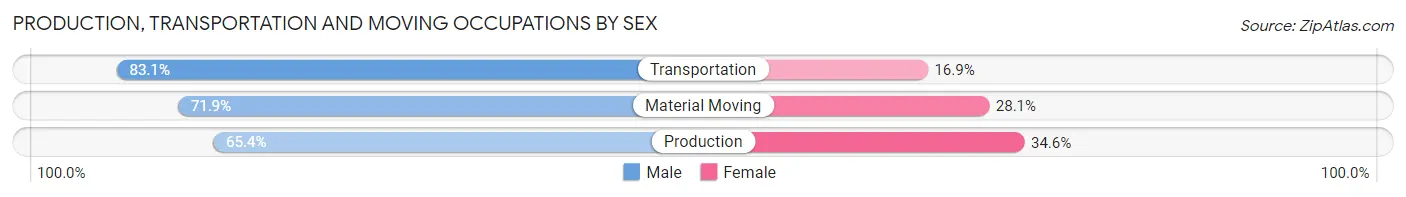
| Occupation | Male | Female |
| Production | 13,814 (65.4%) | 7,305 (34.6%) |
| Transportation | 11,334 (83.1%) | 2,300 (16.9%) |
| Material Moving | 9,983 (71.9%) | 3,907 (28.1%) |
| Total (Category) | 35,131 (72.2%) | 13,512 (27.8%) |
| Total (Overall) | 348,167 (54.7%) | 287,905 (45.3%) |
Employment Industries by Sex in Area Code 949
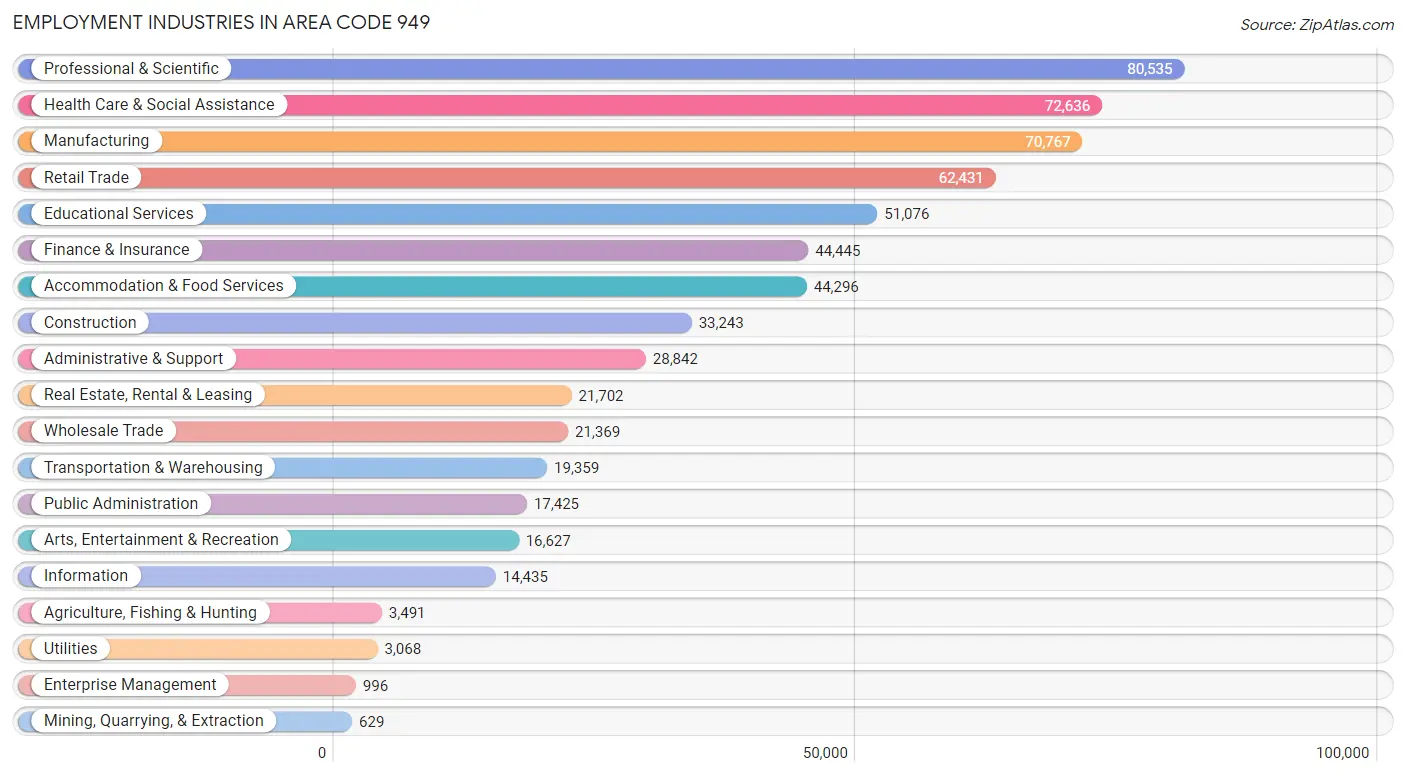
Employment Industries in Area Code 949
The major employment industries in Area Code 949 include Professional & Scientific (80,535 | 12.7%), Health Care & Social Assistance (72,636 | 11.4%), Manufacturing (70,767 | 11.1%), Retail Trade (62,431 | 9.8%), and Educational Services (51,076 | 8.0%).
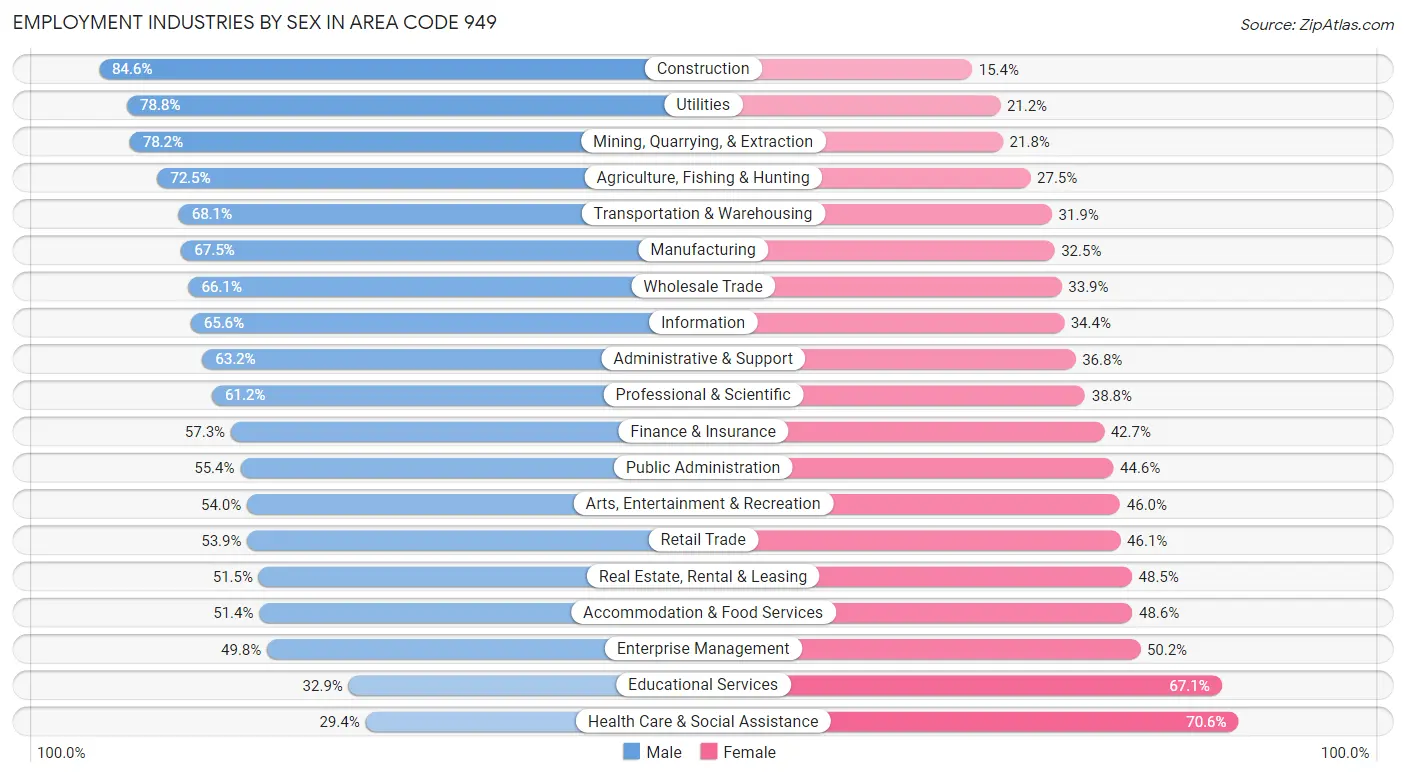
Employment Industries by Sex in Area Code 949
The Area Code 949 industries that see more men than women are Construction (84.6%), Utilities (78.8%), and Mining, Quarrying, & Extraction (78.2%), whereas the industries that tend to have a higher number of women are Health Care & Social Assistance (70.6%), Educational Services (67.1%), and Enterprise Management (50.2%).
| Industry | Male | Female |
| Agriculture, Fishing & Hunting | 2,532 (72.5%) | 959 (27.5%) |
| Mining, Quarrying, & Extraction | 492 (78.2%) | 137 (21.8%) |
| Construction | 28,122 (84.6%) | 5,121 (15.4%) |
| Manufacturing | 47,798 (67.5%) | 22,969 (32.5%) |
| Wholesale Trade | 14,118 (66.1%) | 7,251 (33.9%) |
| Retail Trade | 33,650 (53.9%) | 28,781 (46.1%) |
| Transportation & Warehousing | 13,179 (68.1%) | 6,180 (31.9%) |
| Utilities | 2,417 (78.8%) | 651 (21.2%) |
| Information | 9,467 (65.6%) | 4,968 (34.4%) |
| Finance & Insurance | 25,465 (57.3%) | 18,980 (42.7%) |
| Real Estate, Rental & Leasing | 11,182 (51.5%) | 10,520 (48.5%) |
| Professional & Scientific | 49,291 (61.2%) | 31,244 (38.8%) |
| Enterprise Management | 496 (49.8%) | 500 (50.2%) |
| Administrative & Support | 18,228 (63.2%) | 10,614 (36.8%) |
| Educational Services | 16,815 (32.9%) | 34,261 (67.1%) |
| Health Care & Social Assistance | 21,381 (29.4%) | 51,255 (70.6%) |
| Arts, Entertainment & Recreation | 8,972 (54.0%) | 7,655 (46.0%) |
| Accommodation & Food Services | 22,780 (51.4%) | 21,516 (48.6%) |
| Public Administration | 9,647 (55.4%) | 7,778 (44.6%) |
| Total | 348,167 (54.7%) | 287,905 (45.3%) |
Education in Area Code 949
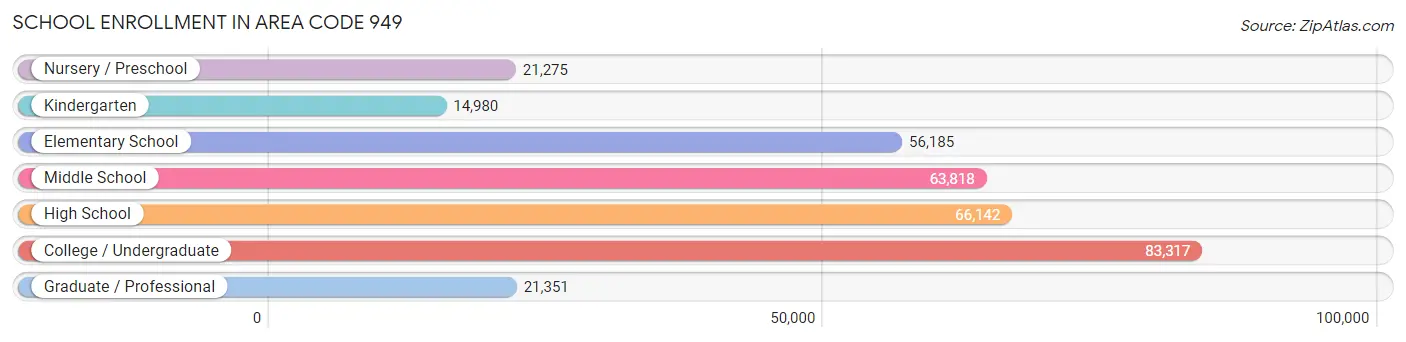
School Enrollment in Area Code 949
The most common levels of schooling among the 327,068 students in Area Code 949 are college / undergraduate (83,317 | 25.5%), high school (66,142 | 20.2%), and middle school (63,818 | 19.5%).
| School Level | # Students | % Students |
| Nursery / Preschool | 21,275 | 6.5% |
| Kindergarten | 14,980 | 4.6% |
| Elementary School | 56,185 | 17.2% |
| Middle School | 63,818 | 19.5% |
| High School | 66,142 | 20.2% |
| College / Undergraduate | 83,317 | 25.5% |
| Graduate / Professional | 21,351 | 6.5% |
| Total | 327,068 | 100.0% |
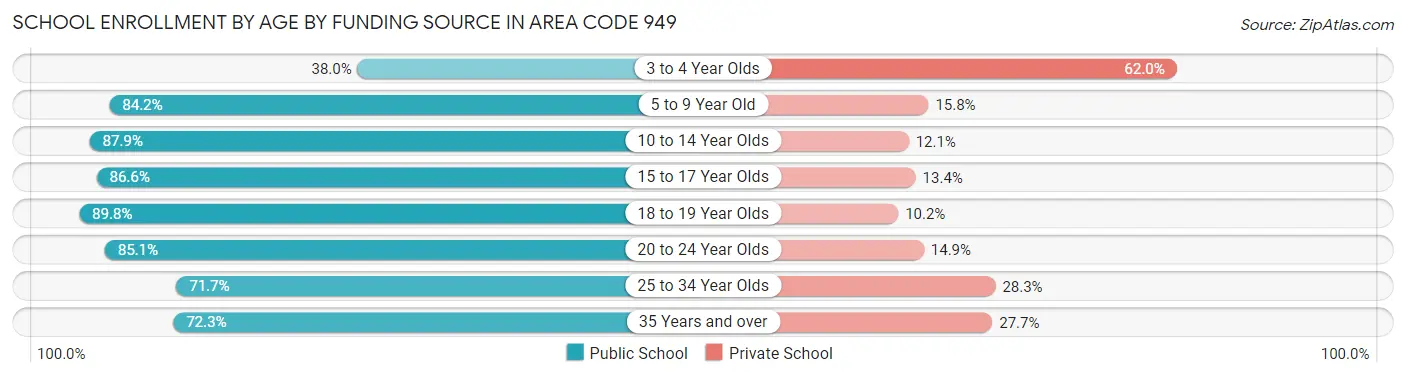
School Enrollment by Age by Funding Source in Area Code 949
Out of a total of 327,068 students who are enrolled in schools in Area Code 949, 59,420 (18.2%) attend a private institution, while the remaining 267,648 (81.8%) are enrolled in public schools. The age group of 3 to 4 year olds has the highest likelihood of being enrolled in private schools, with 10,882 (62.0% in the age bracket) enrolled. Conversely, the age group of 18 to 19 year olds has the lowest likelihood of being enrolled in a private school, with 23,218 (89.8% in the age bracket) attending a public institution.
| Age Bracket | Public School | Private School |
| 3 to 4 Year Olds | 6,668 (38.0%) | 10,882 (62.0%) |
| 5 to 9 Year Old | 57,303 (84.2%) | 10,747 (15.8%) |
| 10 to 14 Year Olds | 70,151 (87.9%) | 9,662 (12.1%) |
| 15 to 17 Year Olds | 41,512 (86.6%) | 6,431 (13.4%) |
| 18 to 19 Year Olds | 23,218 (89.8%) | 2,625 (10.2%) |
| 20 to 24 Year Olds | 36,069 (85.1%) | 6,336 (14.9%) |
| 25 to 34 Year Olds | 18,119 (71.7%) | 7,140 (28.3%) |
| 35 Years and over | 14,611 (72.3%) | 5,594 (27.7%) |
| Total | 267,648 (81.8%) | 59,420 (18.2%) |
Educational Attainment by Field of Study in Area Code 949
Business (100,700 | 21.1%), engineering (54,018 | 11.3%), social sciences (50,271 | 10.5%), science & technology (35,927 | 7.5%), and bio, nature & agricultural (30,474 | 6.4%) are the most common fields of study among 477,974 individuals in Area Code 949 who have obtained a bachelor's degree or higher.
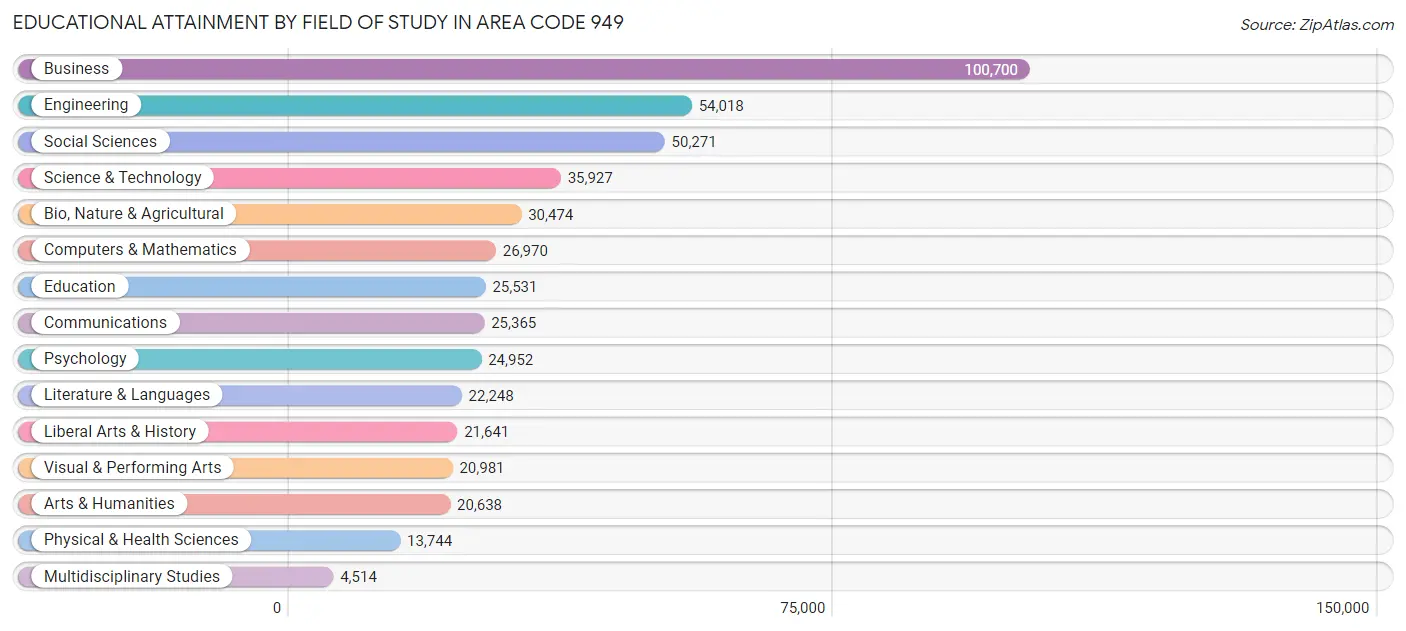
| Field of Study | # Graduates | % Graduates |
| Computers & Mathematics | 26,970 | 5.6% |
| Bio, Nature & Agricultural | 30,474 | 6.4% |
| Physical & Health Sciences | 13,744 | 2.9% |
| Psychology | 24,952 | 5.2% |
| Social Sciences | 50,271 | 10.5% |
| Engineering | 54,018 | 11.3% |
| Multidisciplinary Studies | 4,514 | 0.9% |
| Science & Technology | 35,927 | 7.5% |
| Business | 100,700 | 21.1% |
| Education | 25,531 | 5.3% |
| Literature & Languages | 22,248 | 4.6% |
| Liberal Arts & History | 21,641 | 4.5% |
| Visual & Performing Arts | 20,981 | 4.4% |
| Communications | 25,365 | 5.3% |
| Arts & Humanities | 20,638 | 4.3% |
| Total | 477,974 | 100.0% |
Transportation & Commute in Area Code 949
Vehicle Availability by Sex in Area Code 949
The most prevalent vehicle ownership categories in Area Code 949 are males with 2 vehicles (151,688, accounting for 44.1%) and females with 2 vehicles (117,885, making up 54.2%).
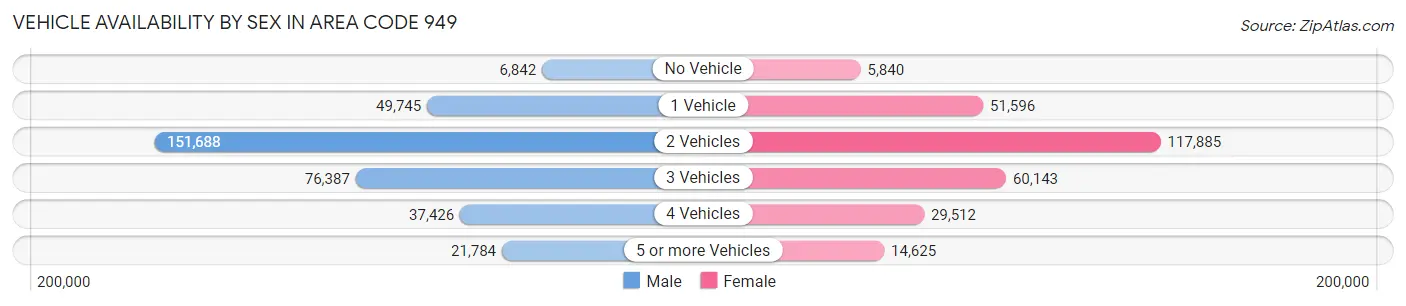
| Vehicles Available | Male | Female |
| No Vehicle | 6,842 (2.0%) | 5,840 (2.1%) |
| 1 Vehicle | 49,745 (14.5%) | 51,596 (18.4%) |
| 2 Vehicles | 151,688 (44.1%) | 117,885 (42.2%) |
| 3 Vehicles | 76,387 (22.2%) | 60,143 (21.5%) |
| 4 Vehicles | 37,426 (10.9%) | 29,512 (10.6%) |
| 5 or more Vehicles | 21,784 (6.3%) | 14,625 (5.2%) |
| Total | 343,872 (100.0%) | 279,601 (100.0%) |
Commute Time in Area Code 949
The most frequently occuring commute durations in Area Code 949 are 15 to 19 minutes (90,327 commuters, 17.6%), 20 to 24 minutes (82,816 commuters, 16.2%), and 30 to 34 minutes (79,595 commuters, 15.5%).
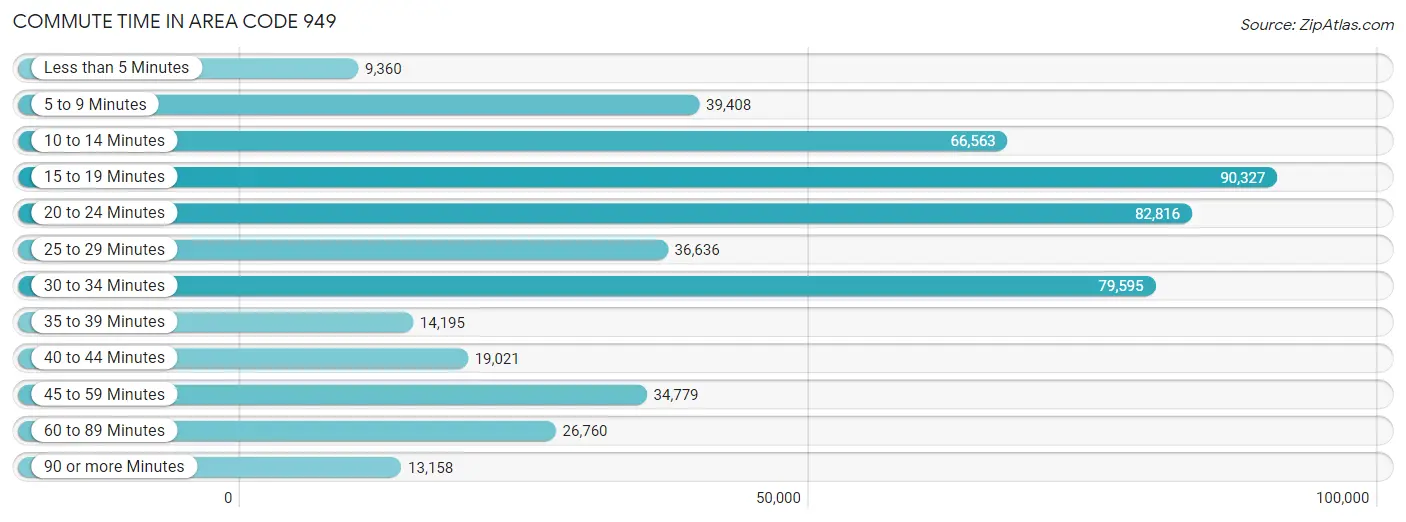
| Commute Time | # Commuters | % Commuters |
| Less than 5 Minutes | 9,360 | 1.8% |
| 5 to 9 Minutes | 39,408 | 7.7% |
| 10 to 14 Minutes | 66,563 | 13.0% |
| 15 to 19 Minutes | 90,327 | 17.6% |
| 20 to 24 Minutes | 82,816 | 16.2% |
| 25 to 29 Minutes | 36,636 | 7.1% |
| 30 to 34 Minutes | 79,595 | 15.5% |
| 35 to 39 Minutes | 14,195 | 2.8% |
| 40 to 44 Minutes | 19,021 | 3.7% |
| 45 to 59 Minutes | 34,779 | 6.8% |
| 60 to 89 Minutes | 26,760 | 5.2% |
| 90 or more Minutes | 13,158 | 2.6% |
Commute Time by Sex in Area Code 949
The most common commute times in Area Code 949 are 15 to 19 minutes (47,978 commuters, 16.8%) for males and 15 to 19 minutes (42,349 commuters, 18.6%) for females.
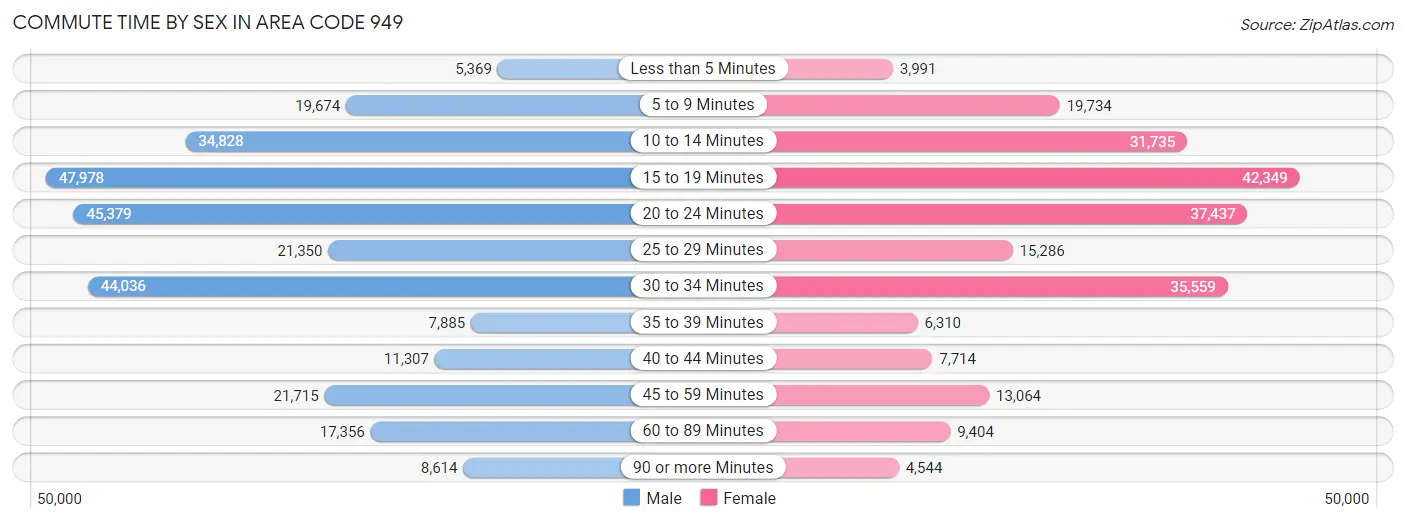
| Commute Time | Male | Female |
| Less than 5 Minutes | 5,369 (1.9%) | 3,991 (1.8%) |
| 5 to 9 Minutes | 19,674 (6.9%) | 19,734 (8.7%) |
| 10 to 14 Minutes | 34,828 (12.2%) | 31,735 (14.0%) |
| 15 to 19 Minutes | 47,978 (16.8%) | 42,349 (18.6%) |
| 20 to 24 Minutes | 45,379 (15.9%) | 37,437 (16.5%) |
| 25 to 29 Minutes | 21,350 (7.5%) | 15,286 (6.7%) |
| 30 to 34 Minutes | 44,036 (15.4%) | 35,559 (15.7%) |
| 35 to 39 Minutes | 7,885 (2.8%) | 6,310 (2.8%) |
| 40 to 44 Minutes | 11,307 (4.0%) | 7,714 (3.4%) |
| 45 to 59 Minutes | 21,715 (7.6%) | 13,064 (5.8%) |
| 60 to 89 Minutes | 17,356 (6.1%) | 9,404 (4.1%) |
| 90 or more Minutes | 8,614 (3.0%) | 4,544 (2.0%) |
Time of Departure to Work by Sex in Area Code 949
The most frequent times of departure to work in Area Code 949 are 8:00 AM to 8:29 AM (40,760, 14.3%) for males and 8:00 AM to 8:29 AM (33,695, 14.8%) for females.
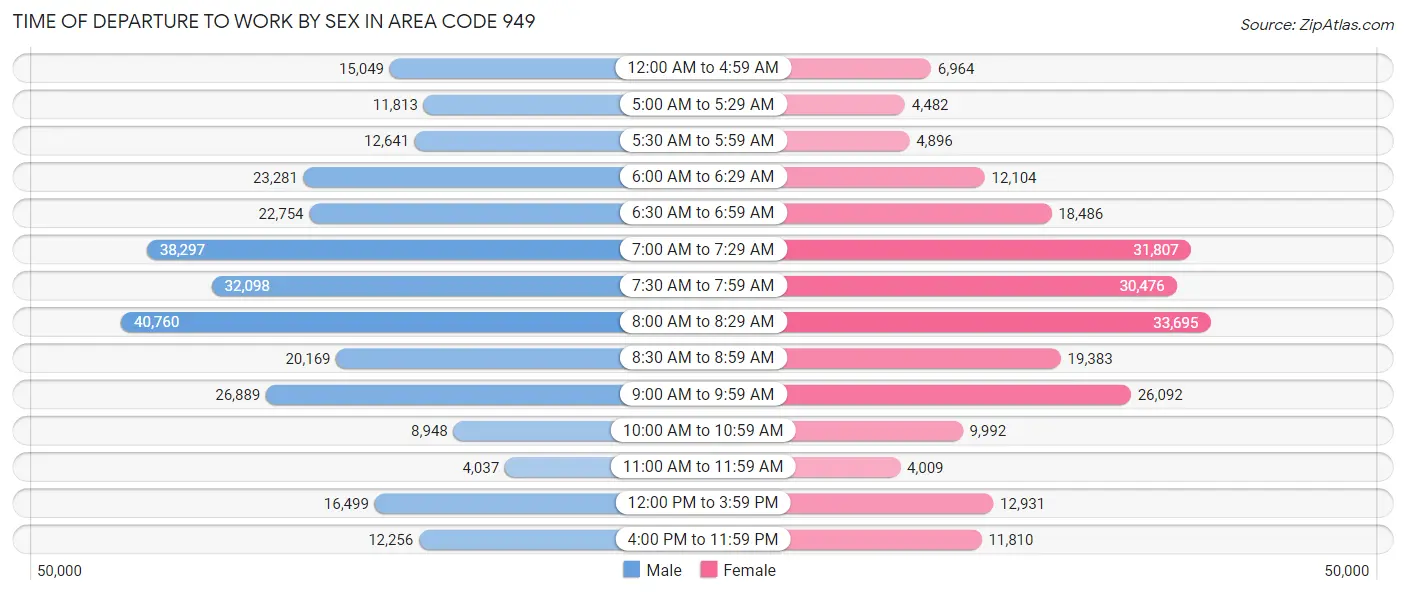
| Time of Departure | Male | Female |
| 12:00 AM to 4:59 AM | 15,049 (5.3%) | 6,964 (3.1%) |
| 5:00 AM to 5:29 AM | 11,813 (4.1%) | 4,482 (2.0%) |
| 5:30 AM to 5:59 AM | 12,641 (4.4%) | 4,896 (2.2%) |
| 6:00 AM to 6:29 AM | 23,281 (8.2%) | 12,104 (5.3%) |
| 6:30 AM to 6:59 AM | 22,754 (8.0%) | 18,486 (8.1%) |
| 7:00 AM to 7:29 AM | 38,297 (13.4%) | 31,807 (14.0%) |
| 7:30 AM to 7:59 AM | 32,098 (11.2%) | 30,476 (13.4%) |
| 8:00 AM to 8:29 AM | 40,760 (14.3%) | 33,695 (14.8%) |
| 8:30 AM to 8:59 AM | 20,169 (7.1%) | 19,383 (8.5%) |
| 9:00 AM to 9:59 AM | 26,889 (9.4%) | 26,092 (11.5%) |
| 10:00 AM to 10:59 AM | 8,948 (3.1%) | 9,992 (4.4%) |
| 11:00 AM to 11:59 AM | 4,037 (1.4%) | 4,009 (1.8%) |
| 12:00 PM to 3:59 PM | 16,499 (5.8%) | 12,931 (5.7%) |
| 4:00 PM to 11:59 PM | 12,256 (4.3%) | 11,810 (5.2%) |
| Total | 285,491 (100.0%) | 227,127 (100.0%) |
Housing Occupancy in Area Code 949
Occupancy by Ownership in Area Code 949
Of the total 449,198 dwellings in Area Code 949, owner-occupied units account for 256,560 (57.1%), while renter-occupied units make up 192,638 (42.9%).
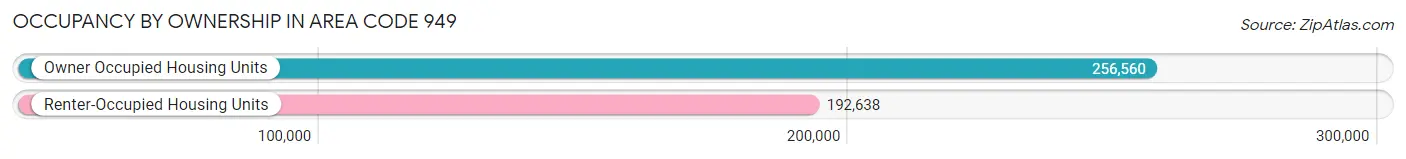
| Occupancy | # Housing Units | % Housing Units |
| Owner Occupied Housing Units | 256,560 | 57.1% |
| Renter-Occupied Housing Units | 192,638 | 42.9% |
| Total Occupied Housing Units | 449,198 | 100.0% |
Occupancy by Household Size in Area Code 949
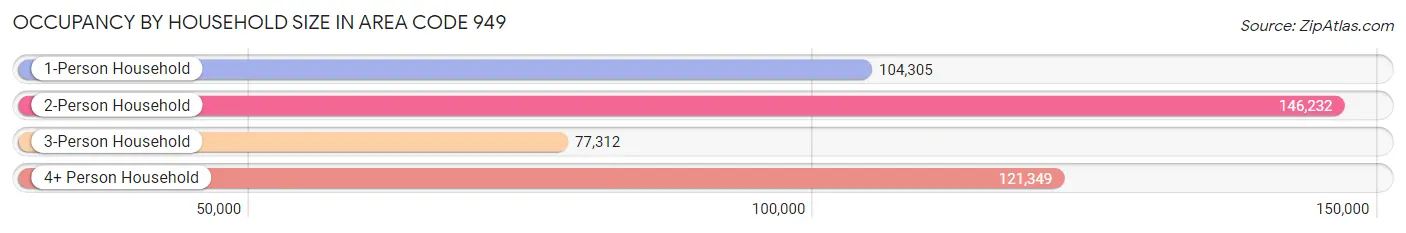
| Household Size | # Housing Units | % Housing Units |
| 1-Person Household | 104,305 | 23.2% |
| 2-Person Household | 146,232 | 32.6% |
| 3-Person Household | 77,312 | 17.2% |
| 4+ Person Household | 121,349 | 27.0% |
| Total Housing Units | 449,198 | 100.0% |
Occupancy by Ownership by Household Size in Area Code 949
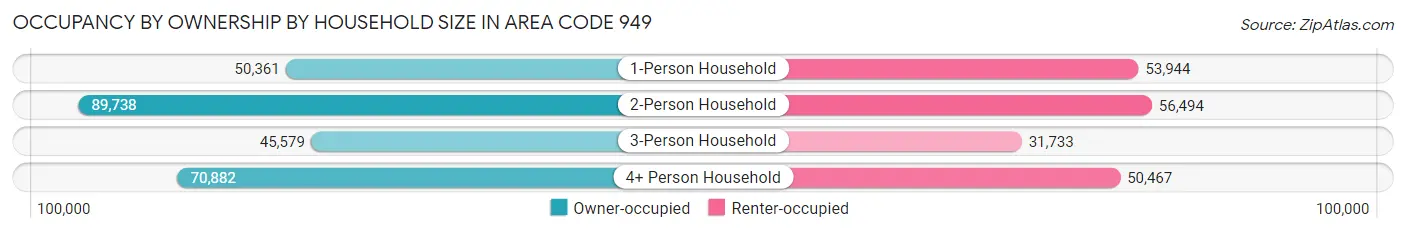
| Household Size | Owner-occupied | Renter-occupied |
| 1-Person Household | 50,361 (48.3%) | 53,944 (51.7%) |
| 2-Person Household | 89,738 (61.4%) | 56,494 (38.6%) |
| 3-Person Household | 45,579 (59.0%) | 31,733 (41.0%) |
| 4+ Person Household | 70,882 (58.4%) | 50,467 (41.6%) |
| Total Housing Units | 256,560 (57.1%) | 192,638 (42.9%) |
Occupancy by Educational Attainment in Area Code 949
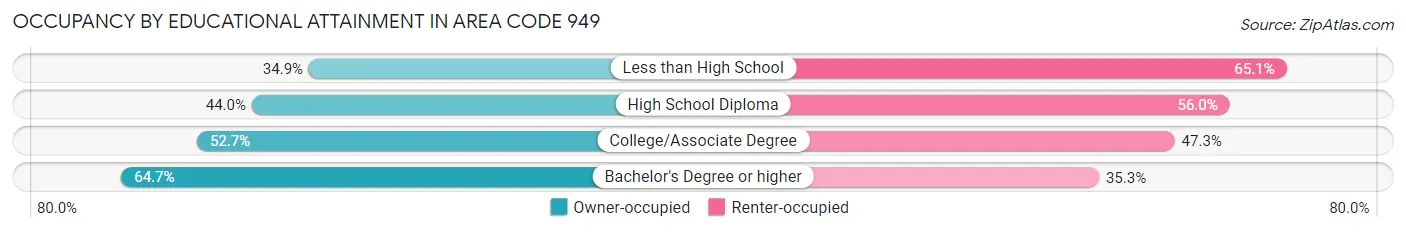
| Household Size | Owner-occupied | Renter-occupied |
| Less than High School | 11,705 (34.9%) | 21,821 (65.1%) |
| High School Diploma | 21,294 (44.0%) | 27,143 (56.0%) |
| College/Associate Degree | 60,909 (52.7%) | 54,757 (47.3%) |
| Bachelor's Degree or higher | 162,652 (64.7%) | 88,917 (35.3%) |
Occupancy by Age of Householder in Area Code 949
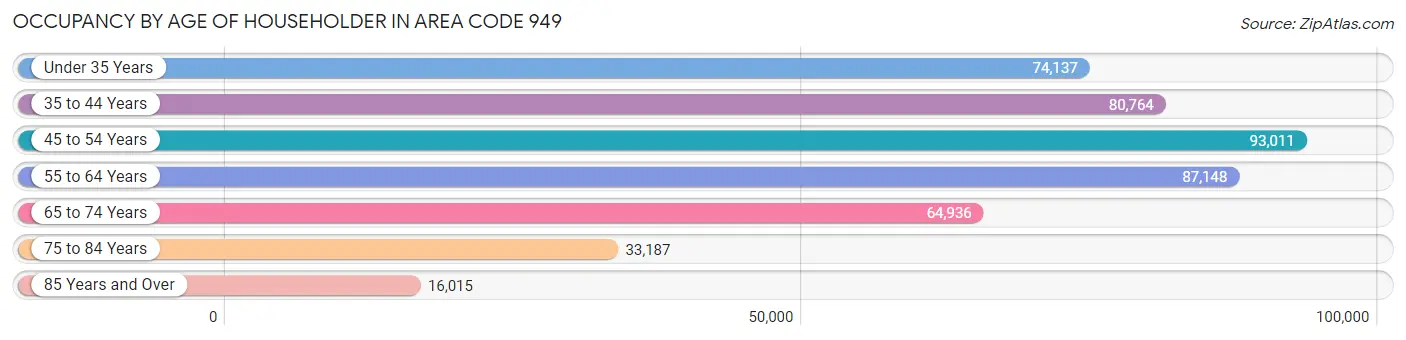
| Age Bracket | # Households | % Households |
| Under 35 Years | 74,137 | 16.5% |
| 35 to 44 Years | 80,764 | 18.0% |
| 45 to 54 Years | 93,011 | 20.7% |
| 55 to 64 Years | 87,148 | 19.4% |
| 65 to 74 Years | 64,936 | 14.5% |
| 75 to 84 Years | 33,187 | 7.4% |
| 85 Years and Over | 16,015 | 3.6% |
| Total | 449,198 | 100.0% |
Housing Finances in Area Code 949
Median Income by Occupancy in Area Code 949
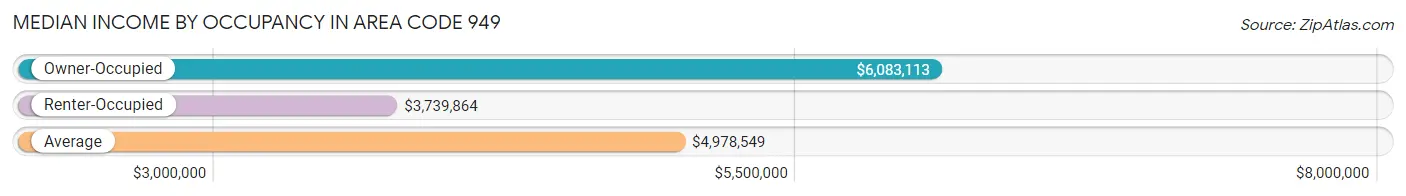
| Occupancy Type | # Households | Median Income |
| Owner-Occupied | 256,560 (57.1%) | $6,083,113 |
| Renter-Occupied | 192,638 (42.9%) | $3,739,864 |
| Average | 449,198 (100.0%) | $4,978,549 |
Occupancy by Householder Income Bracket in Area Code 949
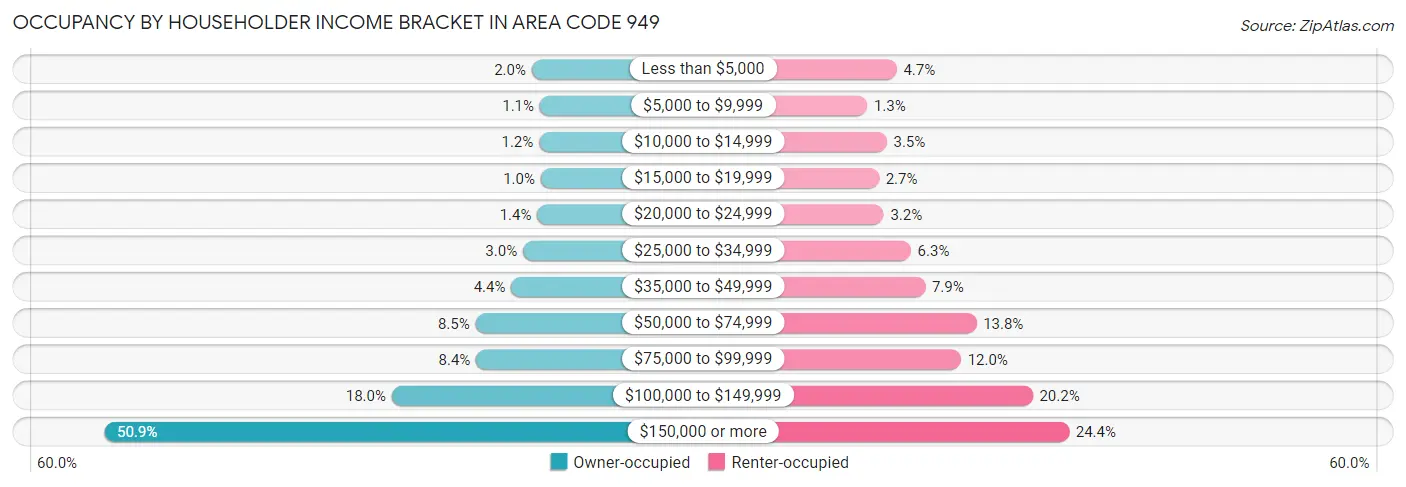
| Income Bracket | Owner-occupied | Renter-occupied |
| Less than $5,000 | 5,207 (2.0%) | 9,023 (4.7%) |
| $5,000 to $9,999 | 2,849 (1.1%) | 2,523 (1.3%) |
| $10,000 to $14,999 | 3,083 (1.2%) | 6,825 (3.5%) |
| $15,000 to $19,999 | 2,594 (1.0%) | 5,097 (2.6%) |
| $20,000 to $24,999 | 3,630 (1.4%) | 6,143 (3.2%) |
| $25,000 to $34,999 | 7,803 (3.0%) | 12,131 (6.3%) |
| $35,000 to $49,999 | 11,228 (4.4%) | 15,269 (7.9%) |
| $50,000 to $74,999 | 21,712 (8.5%) | 26,573 (13.8%) |
| $75,000 to $99,999 | 21,517 (8.4%) | 23,151 (12.0%) |
| $100,000 to $149,999 | 46,296 (18.0%) | 38,952 (20.2%) |
| $150,000 or more | 130,641 (50.9%) | 46,951 (24.4%) |
| Total | 256,560 (100.0%) | 192,638 (100.0%) |
Monthly Housing Cost Tiers in Area Code 949
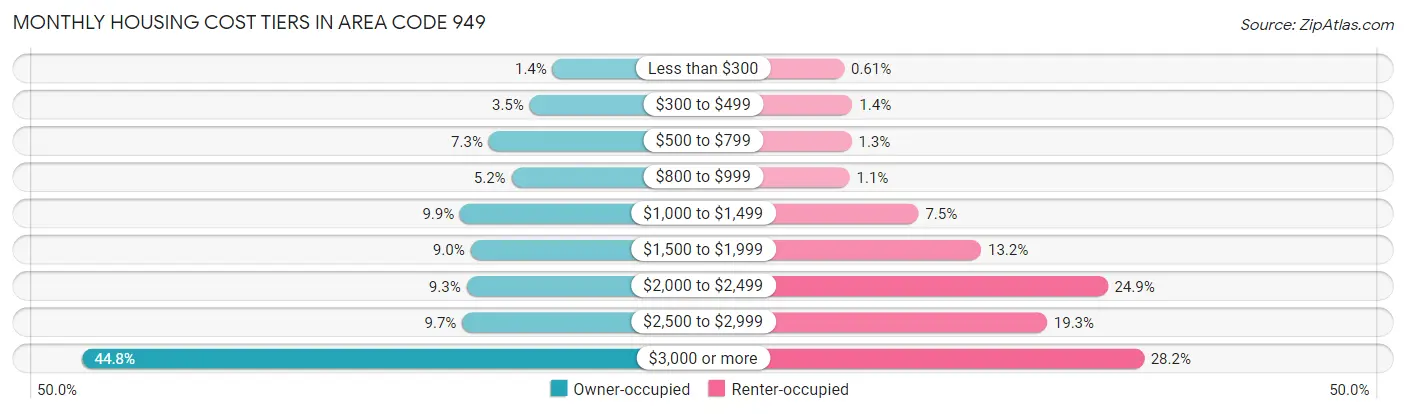
| Monthly Cost | Owner-occupied | Renter-occupied |
| Less than $300 | 3,558 (1.4%) | 1,166 (0.6%) |
| $300 to $499 | 9,016 (3.5%) | 2,650 (1.4%) |
| $500 to $799 | 18,651 (7.3%) | 2,508 (1.3%) |
| $800 to $999 | 13,291 (5.2%) | 2,161 (1.1%) |
| $1,000 to $1,499 | 25,433 (9.9%) | 14,373 (7.5%) |
| $1,500 to $1,999 | 22,970 (8.9%) | 25,467 (13.2%) |
| $2,000 to $2,499 | 23,901 (9.3%) | 47,899 (24.9%) |
| $2,500 to $2,999 | 24,932 (9.7%) | 37,136 (19.3%) |
| $3,000 or more | 114,808 (44.8%) | 54,320 (28.2%) |
| Total | 256,560 (100.0%) | 192,638 (100.0%) |
Physical Housing Characteristics in Area Code 949
Housing Structures in Area Code 949
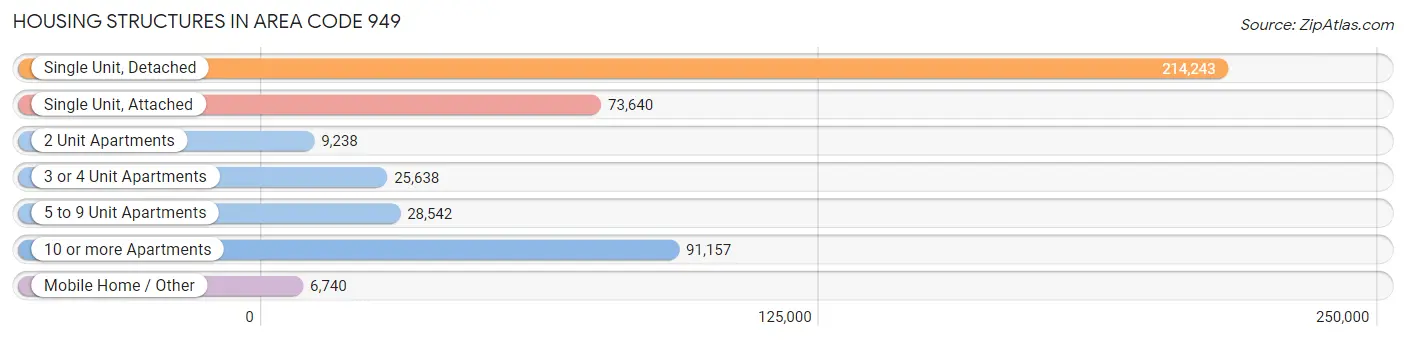
| Structure Type | # Housing Units | % Housing Units |
| Single Unit, Detached | 214,243 | 47.7% |
| Single Unit, Attached | 73,640 | 16.4% |
| 2 Unit Apartments | 9,238 | 2.1% |
| 3 or 4 Unit Apartments | 25,638 | 5.7% |
| 5 to 9 Unit Apartments | 28,542 | 6.4% |
| 10 or more Apartments | 91,157 | 20.3% |
| Mobile Home / Other | 6,740 | 1.5% |
| Total | 449,198 | 100.0% |
Housing Structures by Occupancy in Area Code 949
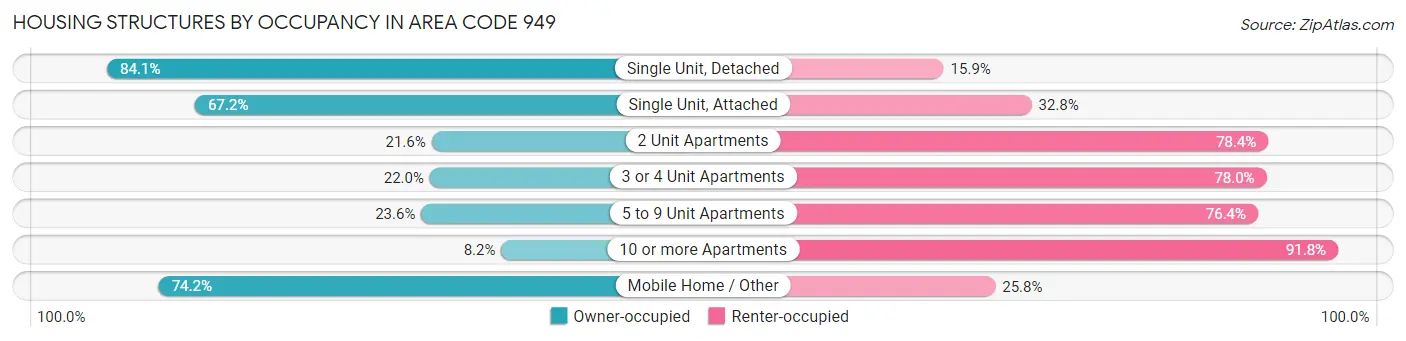
| Structure Type | Owner-occupied | Renter-occupied |
| Single Unit, Detached | 180,220 (84.1%) | 34,023 (15.9%) |
| Single Unit, Attached | 49,476 (67.2%) | 24,164 (32.8%) |
| 2 Unit Apartments | 1,999 (21.6%) | 7,239 (78.4%) |
| 3 or 4 Unit Apartments | 5,636 (22.0%) | 20,002 (78.0%) |
| 5 to 9 Unit Apartments | 6,745 (23.6%) | 21,797 (76.4%) |
| 10 or more Apartments | 7,485 (8.2%) | 83,672 (91.8%) |
| Mobile Home / Other | 4,999 (74.2%) | 1,741 (25.8%) |
| Total | 256,560 (57.1%) | 192,638 (42.9%) |
Housing Structures by Number of Rooms in Area Code 949
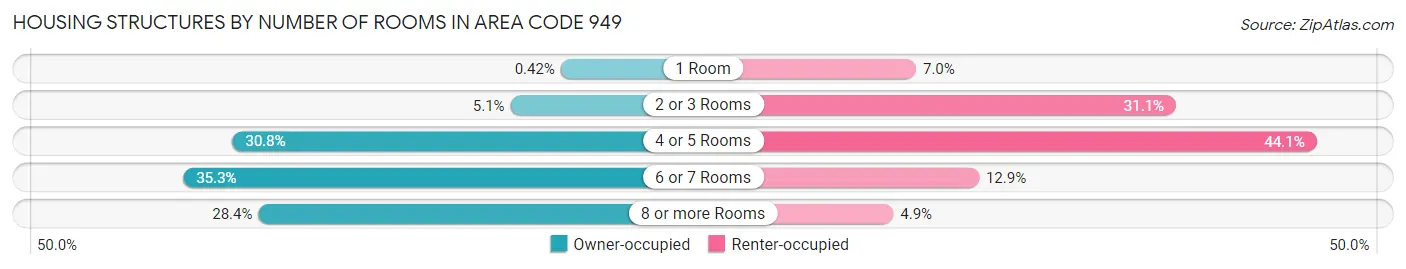
| Number of Rooms | Owner-occupied | Renter-occupied |
| 1 Room | 1,069 (0.4%) | 13,565 (7.0%) |
| 2 or 3 Rooms | 13,007 (5.1%) | 59,857 (31.1%) |
| 4 or 5 Rooms | 78,986 (30.8%) | 84,912 (44.1%) |
| 6 or 7 Rooms | 90,651 (35.3%) | 24,779 (12.9%) |
| 8 or more Rooms | 72,847 (28.4%) | 9,525 (4.9%) |
| Total | 256,560 (100.0%) | 192,638 (100.0%) |
Housing Structure by Heating Type in Area Code 949
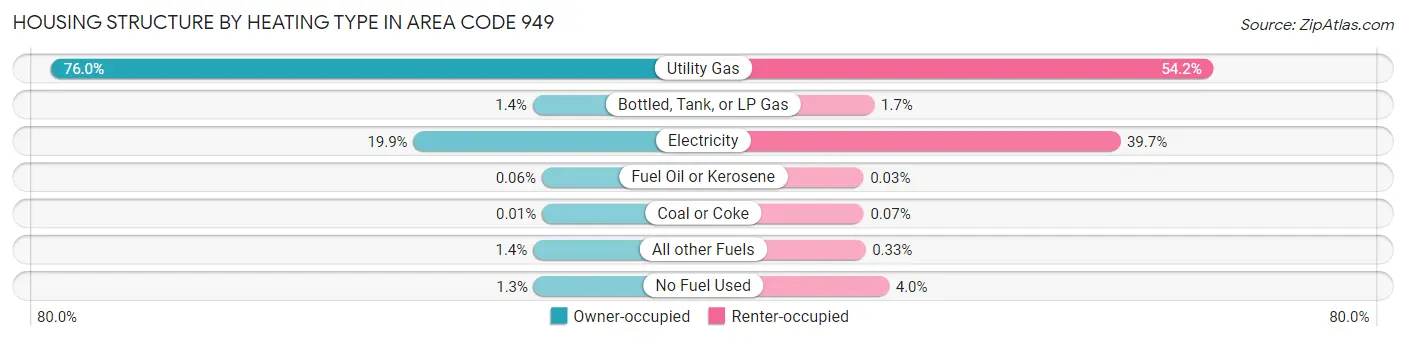
| Heating Type | Owner-occupied | Renter-occupied |
| Utility Gas | 194,847 (75.9%) | 104,361 (54.2%) |
| Bottled, Tank, or LP Gas | 3,667 (1.4%) | 3,294 (1.7%) |
| Electricity | 51,035 (19.9%) | 76,516 (39.7%) |
| Fuel Oil or Kerosene | 144 (0.1%) | 49 (0.0%) |
| Coal or Coke | 33 (0.0%) | 127 (0.1%) |
| All other Fuels | 3,565 (1.4%) | 632 (0.3%) |
| No Fuel Used | 3,269 (1.3%) | 7,659 (4.0%) |
| Total | 256,560 (100.0%) | 192,638 (100.0%) |
Household Vehicle Usage in Area Code 949
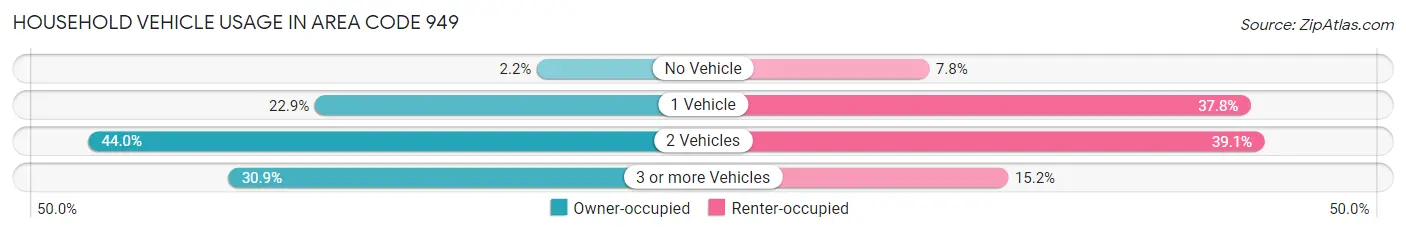
| Vehicles per Household | Owner-occupied | Renter-occupied |
| No Vehicle | 5,521 (2.1%) | 15,109 (7.8%) |
| 1 Vehicle | 58,724 (22.9%) | 72,866 (37.8%) |
| 2 Vehicles | 112,939 (44.0%) | 75,340 (39.1%) |
| 3 or more Vehicles | 79,376 (30.9%) | 29,323 (15.2%) |
| Total | 256,560 (100.0%) | 192,638 (100.0%) |
Real Estate & Mortgages in Area Code 949
Real Estate and Mortgage Overview in Area Code 949
| Characteristic | Without Mortgage | With Mortgage |
| Housing Units | 76,243 | 180,317 |
| Median Property Value | $42,297,606 | $42,284,806 |
| Median Household Income | $4,398,735 | $104,105 |
| Monthly Housing Costs | $37,994 | $110,950 |
| Real Estate Taxes | $229,234 | $2,287 |
Property Value by Mortgage Status in Area Code 949
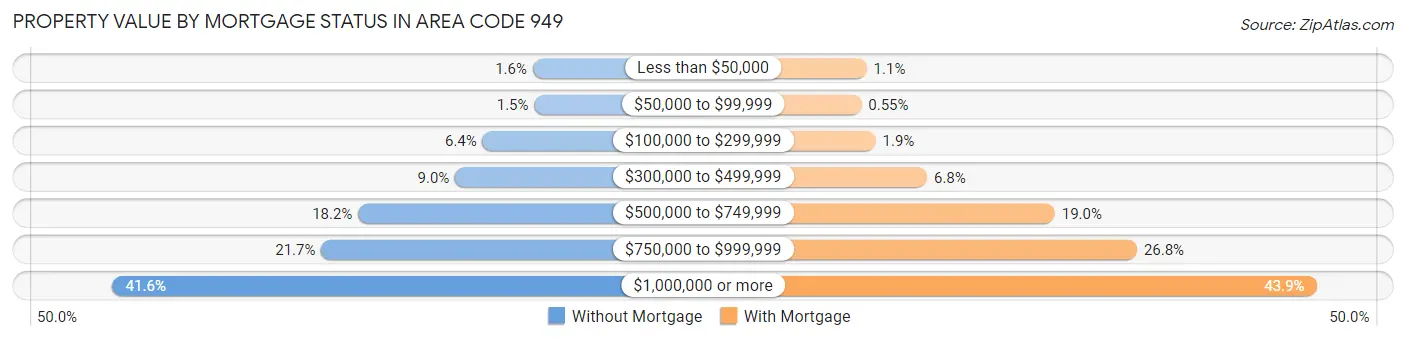
| Property Value | Without Mortgage | With Mortgage |
| Less than $50,000 | 1,217 (1.6%) | 1,906 (1.1%) |
| $50,000 to $99,999 | 1,104 (1.5%) | 998 (0.5%) |
| $100,000 to $299,999 | 4,864 (6.4%) | 3,438 (1.9%) |
| $300,000 to $499,999 | 6,856 (9.0%) | 12,286 (6.8%) |
| $500,000 to $749,999 | 13,900 (18.2%) | 34,227 (19.0%) |
| $750,000 to $999,999 | 16,574 (21.7%) | 48,323 (26.8%) |
| $1,000,000 or more | 31,728 (41.6%) | 79,139 (43.9%) |
| Total | 76,243 (100.0%) | 180,317 (100.0%) |
Household Income by Mortgage Status in Area Code 949
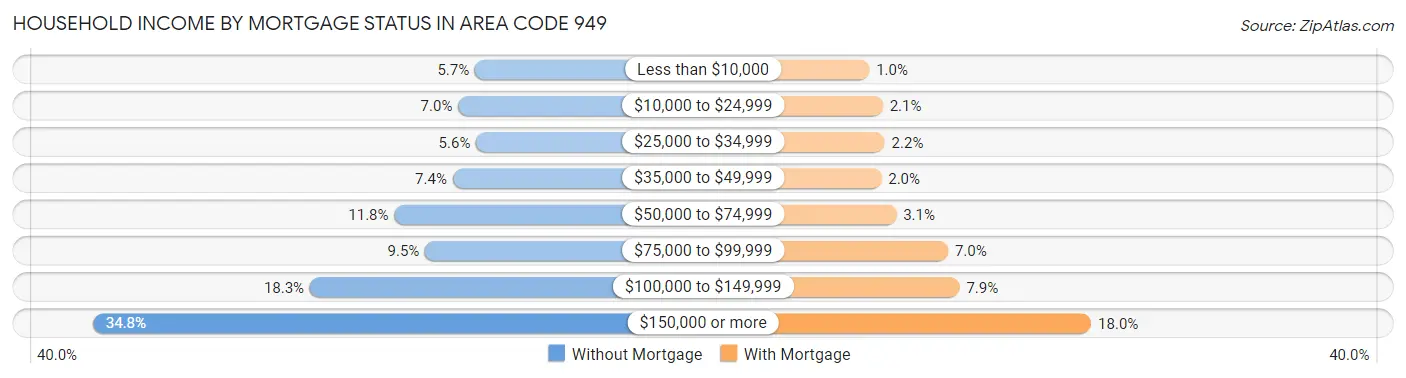
| Household Income | Without Mortgage | With Mortgage |
| Less than $10,000 | 4,332 (5.7%) | 1,877 (1.0%) |
| $10,000 to $24,999 | 5,309 (7.0%) | 3,724 (2.1%) |
| $25,000 to $34,999 | 4,263 (5.6%) | 3,998 (2.2%) |
| $35,000 to $49,999 | 5,630 (7.4%) | 3,540 (2.0%) |
| $50,000 to $74,999 | 9,021 (11.8%) | 5,598 (3.1%) |
| $75,000 to $99,999 | 7,230 (9.5%) | 12,691 (7.0%) |
| $100,000 to $149,999 | 13,922 (18.3%) | 14,287 (7.9%) |
| $150,000 or more | 26,536 (34.8%) | 32,374 (17.9%) |
| Total | 76,243 (100.0%) | 180,317 (100.0%) |
Property Value to Household Income Ratio in Area Code 949
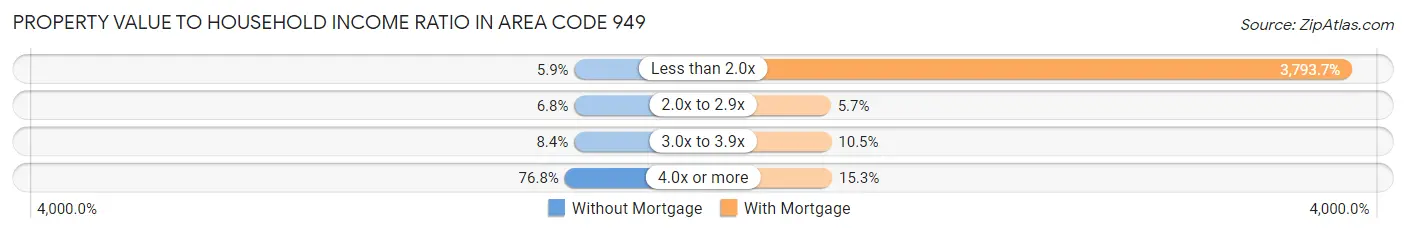
| Value-to-Income Ratio | Without Mortgage | With Mortgage |
| Less than 2.0x | 4,485 (5.9%) | 6,840,615 (3,793.7%) |
| 2.0x to 2.9x | 5,179 (6.8%) | 10,267 (5.7%) |
| 3.0x to 3.9x | 6,399 (8.4%) | 18,860 (10.5%) |
| 4.0x or more | 58,550 (76.8%) | 27,622 (15.3%) |
| Total | 76,243 (100.0%) | 180,317 (100.0%) |
Real Estate Taxes by Mortgage Status in Area Code 949
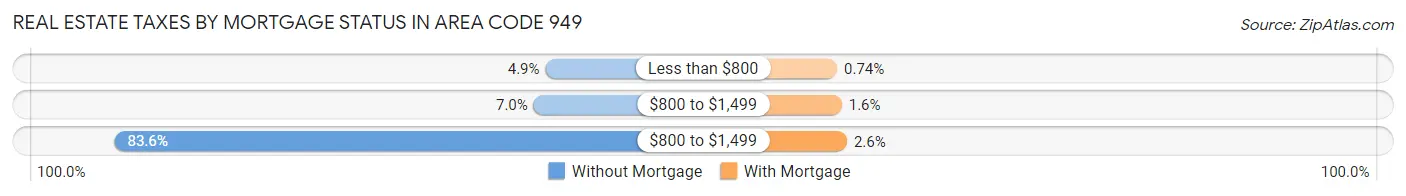
| Property Taxes | Without Mortgage | With Mortgage |
| Less than $800 | 3,718 (4.9%) | 1,334 (0.7%) |
| $800 to $1,499 | 5,358 (7.0%) | 2,884 (1.6%) |
| $800 to $1,499 | 63,713 (83.6%) | 4,597 (2.5%) |
| Total | 76,243 (100.0%) | 180,317 (100.0%) |
Health & Disability in Area Code 949
Health Insurance Coverage by Age in Area Code 949
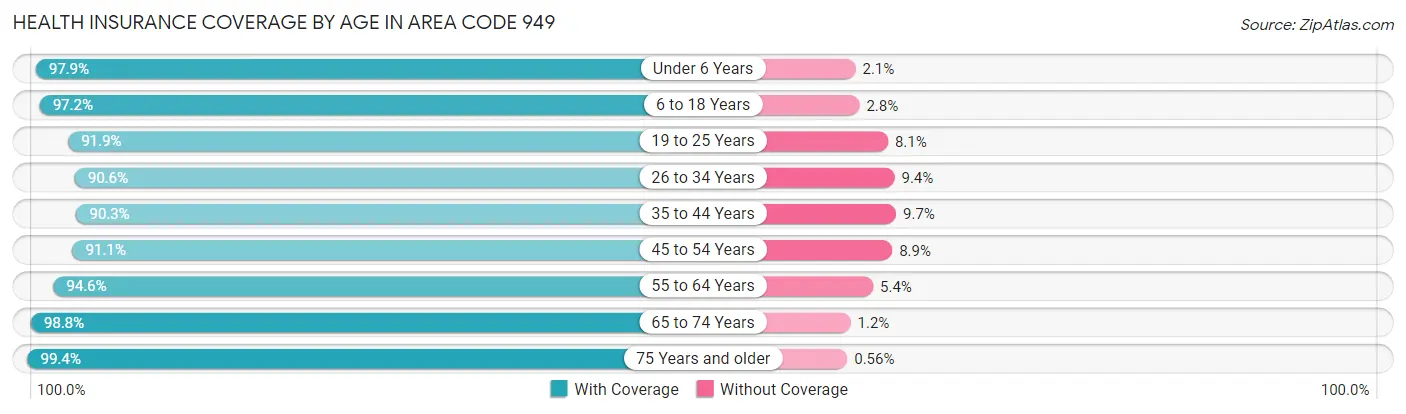
| Age Bracket | With Coverage | Without Coverage |
| Under 6 Years | 82,776 (97.9%) | 1,779 (2.1%) |
| 6 to 18 Years | 198,060 (97.2%) | 5,766 (2.8%) |
| 19 to 25 Years | 101,329 (91.9%) | 8,978 (8.1%) |
| 26 to 34 Years | 139,817 (90.6%) | 14,454 (9.4%) |
| 35 to 44 Years | 151,196 (90.3%) | 16,167 (9.7%) |
| 45 to 54 Years | 159,842 (91.1%) | 15,692 (8.9%) |
| 55 to 64 Years | 151,715 (94.6%) | 8,615 (5.4%) |
| 65 to 74 Years | 111,686 (98.8%) | 1,330 (1.2%) |
| 75 Years and older | 81,948 (99.4%) | 464 (0.6%) |
| Total | 1,178,369 (94.2%) | 73,245 (5.9%) |
Health Insurance Coverage by Citizenship Status in Area Code 949
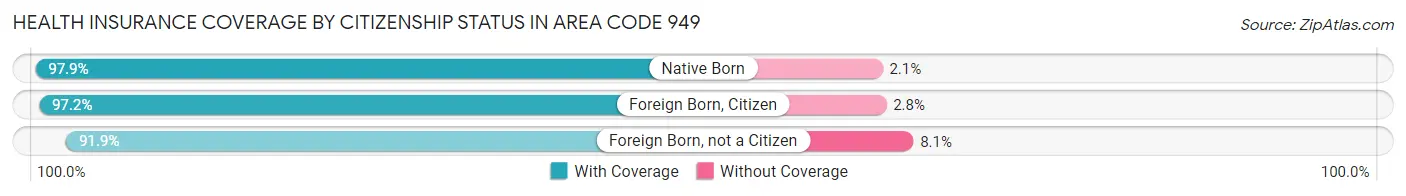
| Citizenship Status | With Coverage | Without Coverage |
| Native Born | 82,776 (97.9%) | 1,779 (2.1%) |
| Foreign Born, Citizen | 198,060 (97.2%) | 5,766 (2.8%) |
| Foreign Born, not a Citizen | 101,329 (91.9%) | 8,978 (8.1%) |
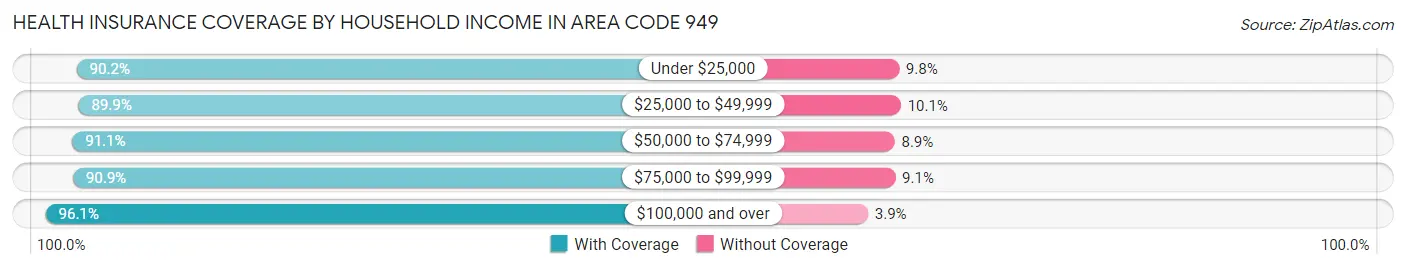
Health Insurance Coverage by Household Income in Area Code 949
| Household Income | With Coverage | Without Coverage |
| Under $25,000 | 78,620 (90.2%) | 8,499 (9.8%) |
| $25,000 to $49,999 | 97,117 (89.9%) | 10,913 (10.1%) |
| $50,000 to $74,999 | 109,191 (91.1%) | 10,720 (8.9%) |
| $75,000 to $99,999 | 107,930 (90.9%) | 10,758 (9.1%) |
| $100,000 and over | 777,410 (96.1%) | 31,856 (3.9%) |
Public vs Private Health Insurance Coverage by Age in Area Code 949
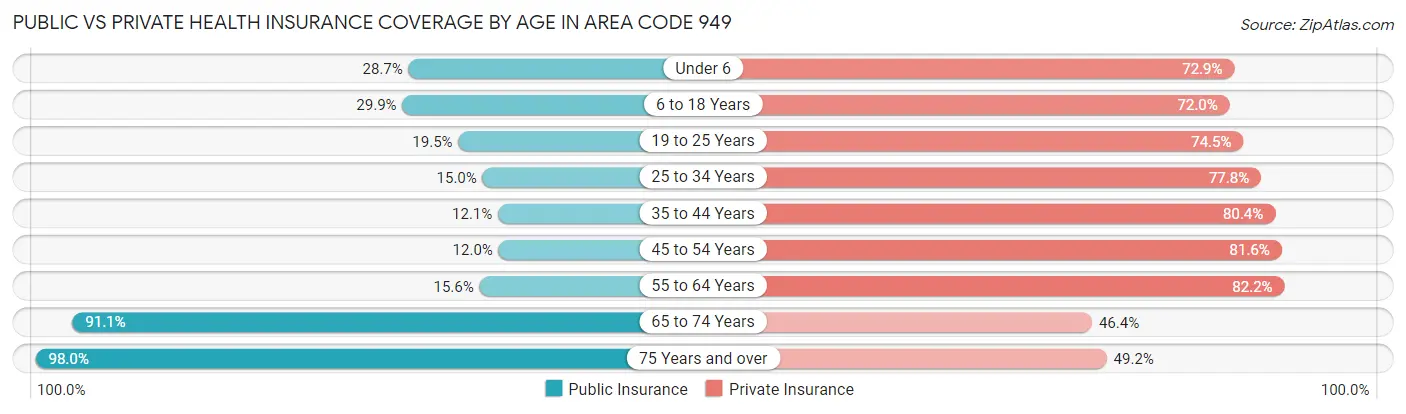
| Age Bracket | Public Insurance | Private Insurance |
| Under 6 | 24,293 (28.7%) | 61,600 (72.9%) |
| 6 to 18 Years | 60,890 (29.9%) | 146,724 (72.0%) |
| 19 to 25 Years | 21,488 (19.5%) | 82,199 (74.5%) |
| 25 to 34 Years | 23,123 (15.0%) | 120,018 (77.8%) |
| 35 to 44 Years | 20,265 (12.1%) | 134,601 (80.4%) |
| 45 to 54 Years | 21,078 (12.0%) | 143,302 (81.6%) |
| 55 to 64 Years | 24,933 (15.5%) | 131,706 (82.2%) |
| 65 to 74 Years | 102,992 (91.1%) | 52,488 (46.4%) |
| 75 Years and over | 80,727 (98.0%) | 40,512 (49.2%) |
| Total | 379,789 (30.3%) | 913,150 (73.0%) |
Disability Status by Sex by Age in Area Code 949
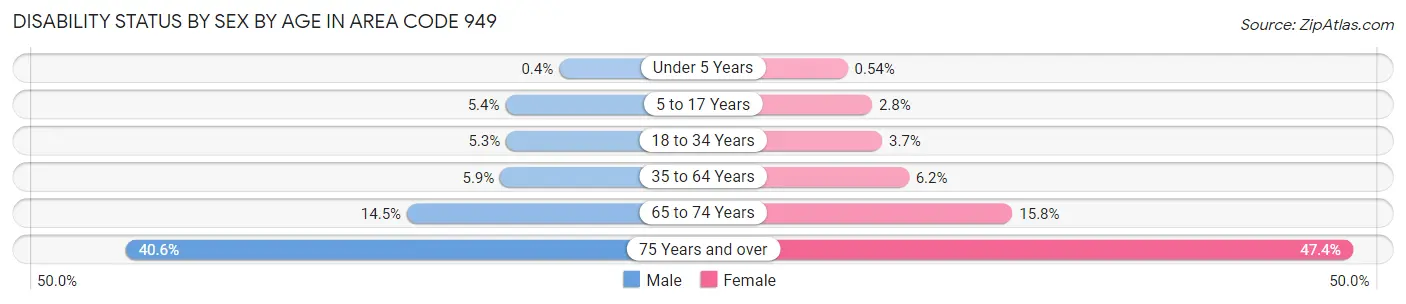
| Age Bracket | Male | Female |
| Under 5 Years | 150 (0.4%) | 183 (0.5%) |
| 5 to 17 Years | 5,597 (5.4%) | 2,712 (2.8%) |
| 18 to 34 Years | 7,623 (5.3%) | 5,144 (3.7%) |
| 35 to 64 Years | 14,512 (5.9%) | 15,890 (6.2%) |
| 65 to 74 Years | 7,612 (14.5%) | 9,592 (15.8%) |
| 75 Years and over | 14,506 (40.6%) | 22,132 (47.4%) |
Disability Class by Sex by Age in Area Code 949
Disability Class: Hearing Difficulty
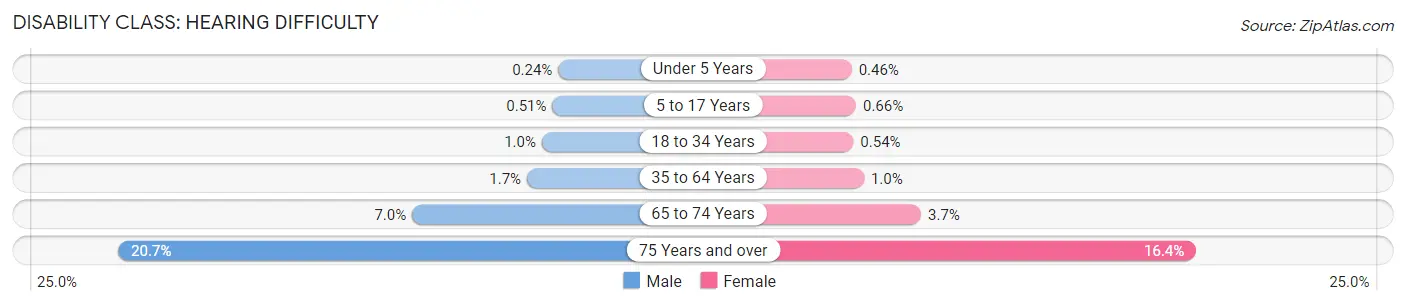
| Age Bracket | Male | Female |
| Under 5 Years | 90 (0.2%) | 156 (0.5%) |
| 5 to 17 Years | 525 (0.5%) | 641 (0.7%) |
| 18 to 34 Years | 1,432 (1.0%) | 748 (0.5%) |
| 35 to 64 Years | 4,174 (1.7%) | 2,635 (1.0%) |
| 65 to 74 Years | 3,682 (7.0%) | 2,231 (3.7%) |
| 75 Years and over | 7,380 (20.7%) | 7,675 (16.4%) |
Disability Class: Vision Difficulty
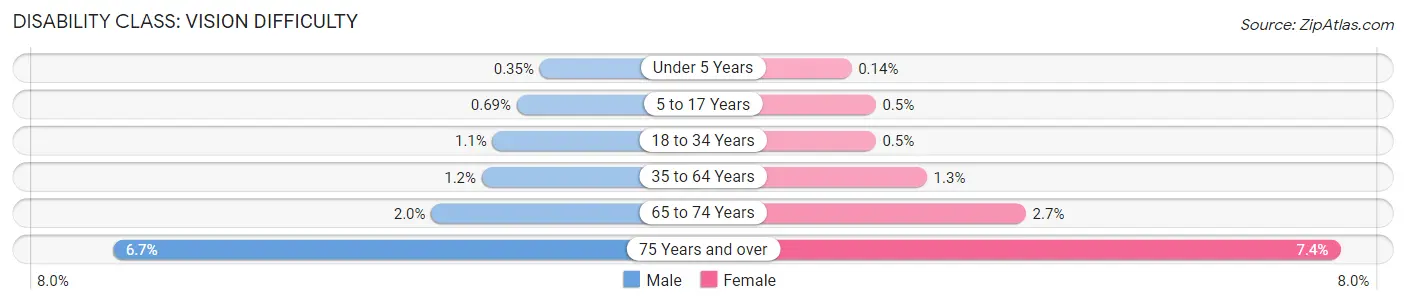
| Age Bracket | Male | Female |
| Under 5 Years | 131 (0.4%) | 48 (0.1%) |
| 5 to 17 Years | 721 (0.7%) | 483 (0.5%) |
| 18 to 34 Years | 1,504 (1.1%) | 688 (0.5%) |
| 35 to 64 Years | 2,993 (1.2%) | 3,221 (1.3%) |
| 65 to 74 Years | 1,027 (2.0%) | 1,652 (2.7%) |
| 75 Years and over | 2,391 (6.7%) | 3,457 (7.4%) |
Disability Class: Cognitive Difficulty
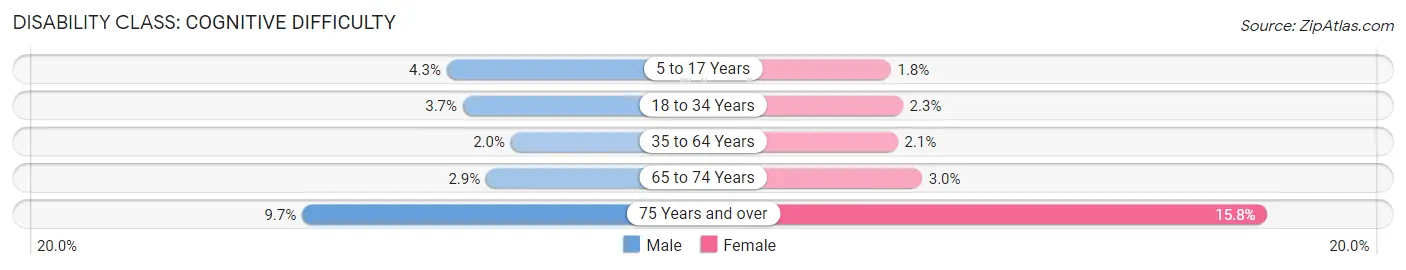
| Age Bracket | Male | Female |
| 5 to 17 Years | 4,497 (4.3%) | 1,759 (1.8%) |
| 18 to 34 Years | 5,351 (3.7%) | 3,117 (2.3%) |
| 35 to 64 Years | 4,822 (1.9%) | 5,308 (2.1%) |
| 65 to 74 Years | 1,505 (2.9%) | 1,802 (3.0%) |
| 75 Years and over | 3,464 (9.7%) | 7,379 (15.8%) |
Disability Class: Ambulatory Difficulty
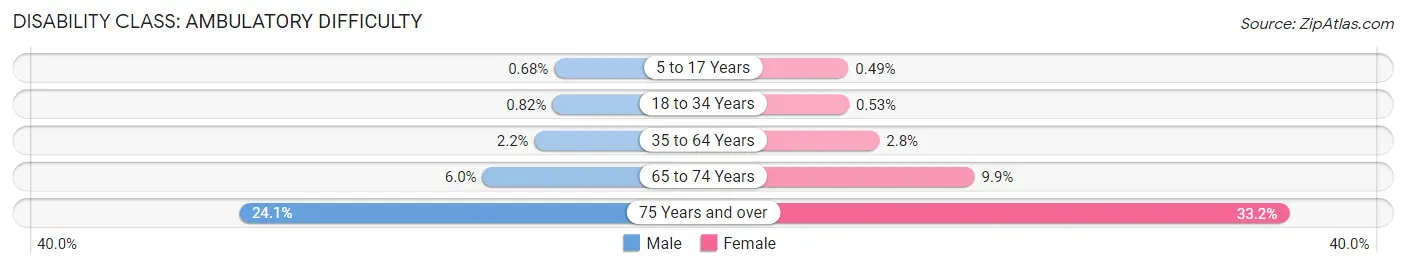
| Age Bracket | Male | Female |
| 5 to 17 Years | 704 (0.7%) | 475 (0.5%) |
| 18 to 34 Years | 1,170 (0.8%) | 725 (0.5%) |
| 35 to 64 Years | 5,308 (2.1%) | 7,149 (2.8%) |
| 65 to 74 Years | 3,150 (6.0%) | 5,975 (9.9%) |
| 75 Years and over | 8,602 (24.1%) | 15,507 (33.2%) |
Disability Class: Self-Care Difficulty
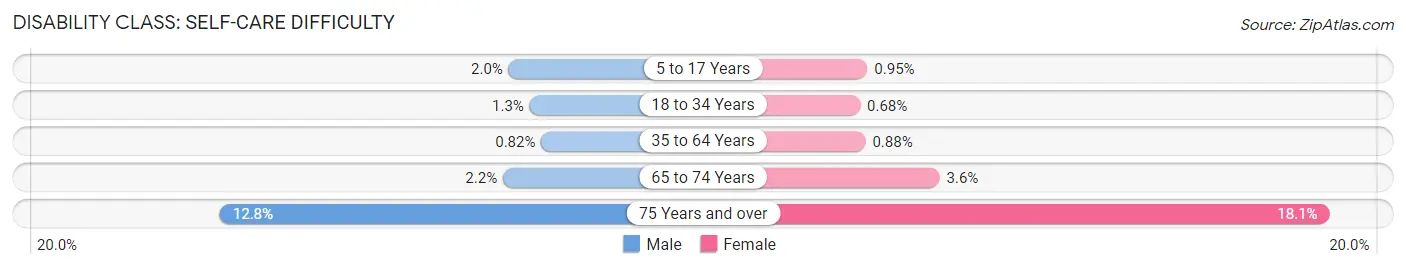
| Age Bracket | Male | Female |
| 5 to 17 Years | 2,105 (2.0%) | 921 (0.9%) |
| 18 to 34 Years | 1,785 (1.3%) | 939 (0.7%) |
| 35 to 64 Years | 2,019 (0.8%) | 2,245 (0.9%) |
| 65 to 74 Years | 1,177 (2.2%) | 2,201 (3.6%) |
| 75 Years and over | 4,555 (12.8%) | 8,450 (18.1%) |
Technology Access in Area Code 949
Computing Device Access in Area Code 949
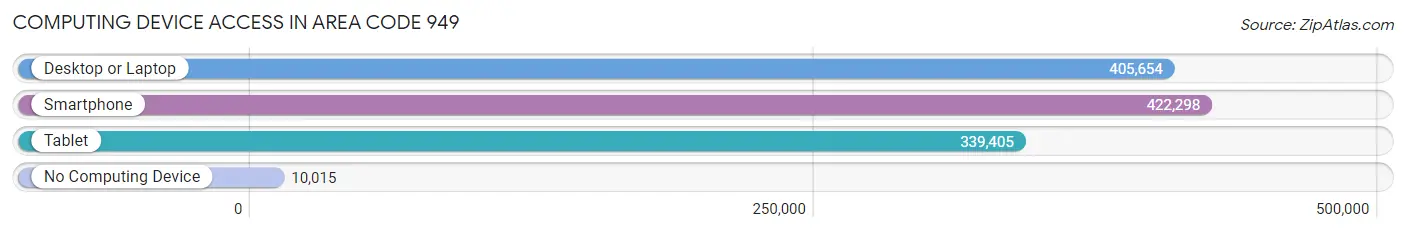
| Device Type | # Households | % Households |
| Desktop or Laptop | 405,654 | 90.3% |
| Smartphone | 422,298 | 94.0% |
| Tablet | 339,405 | 75.6% |
| No Computing Device | 10,015 | 2.2% |
| Total | 449,198 | 100.0% |
Internet Access in Area Code 949
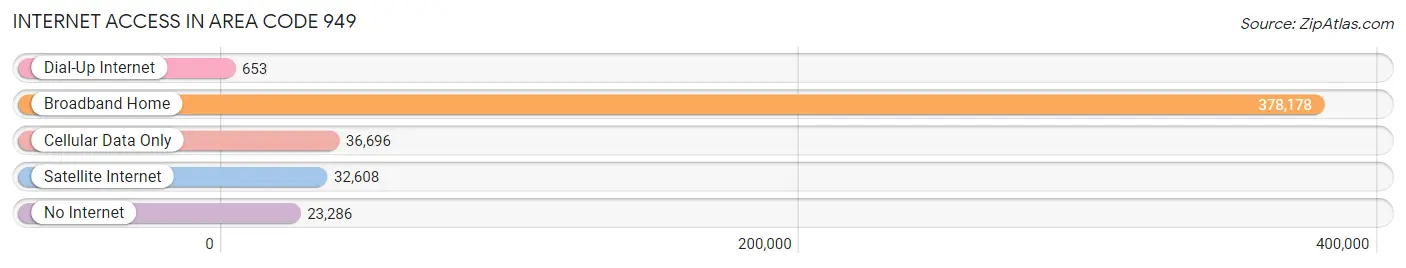
| Internet Type | # Households | % Households |
| Dial-Up Internet | 653 | 0.2% |
| Broadband Home | 378,178 | 84.2% |
| Cellular Data Only | 36,696 | 8.2% |
| Satellite Internet | 32,608 | 7.3% |
| No Internet | 23,286 | 5.2% |
| Total | 449,198 | 100.0% |
Area Code 949 Summary
Geography
Area code 949 is located in the state of California and covers the cities of Irvine, Newport Beach, Laguna Beach, and Mission Viejo. It is bordered by area codes 714, 562, and 858.
Social
Area code 949 is home to many affluent communities, and is known for its beautiful beaches and coastal lifestyle. It is a popular destination for tourists and is home to many celebrities.
Economics
Area code 949 is home to many large businesses and corporations, including the headquarters of Allergan, Broadcom, and Edwards Lifesciences. It is also home to the University of California, Irvine, and many other educational institutions.
Demographics
Area code 949 is home to a diverse population, with a median age of 37. The population is predominantly white, with a large Asian population. The median household income is $90,000, and the median home value is $735,000.
Common Questions
What is Per Capita Income in Area Code 949?
Per Capita income in Area Code 949 is $67,719.
What is the Median Family Income in Area Code 949?
Median Family Income in Area Code 949 is $154,194.
What is the Median Household income in Area Code 949?
Median Household Income in Area Code 949 is $131,014.
What is Income or Wage Gap in Area Code 949?
Income or Wage Gap in Area Code 949 is 34.8%.
Women in Area Code 949 earn 65.2 cents for every dollar earned by a man.
What is Family Income Deficit in Area Code 949?
Family Income Deficit in Area Code 949 is $12,499.
Families that are below poverty line in Area Code 949 earn $12,499 less on average than the poverty threshold level.
What is Inequality or Gini Index in Area Code 949?
Inequality or Gini Index in Area Code 949 is 17.14.
What is the Total Population of Area Code 949?
Total Population of Area Code 949 is 1,260,975.
What is the Total Male Population of Area Code 949?
Total Male Population of Area Code 949 is 626,977.
What is the Total Female Population of Area Code 949?
Total Female Population of Area Code 949 is 633,998.
What is the Ratio of Males per 100 Females in Area Code 949?
There are 98.89 Males per 100 Females in Area Code 949.
What is the Ratio of Females per 100 Males in Area Code 949?
There are 101.12 Females per 100 Males in Area Code 949.
What is the Median Population Age in Area Code 949?
Median Population Age in Area Code 949 is 42.4 Years.
What is the Average Family Size in Area Code 949
Average Family Size in Area Code 949 is 3.2 People.
What is the Average Household Size in Area Code 949
Average Household Size in Area Code 949 is 2.7 People.
How Large is the Labor Force in Area Code 949?
There are 657,318 People in the Labor Forcein in Area Code 949.
What is the Percentage of People in the Labor Force in Area Code 949?
64.3% of People are in the Labor Force in Area Code 949.
What is the Unemployment Rate in Area Code 949?
Unemployment Rate in Area Code 949 is 5.0%.