Area Code 909 Map & Demographics
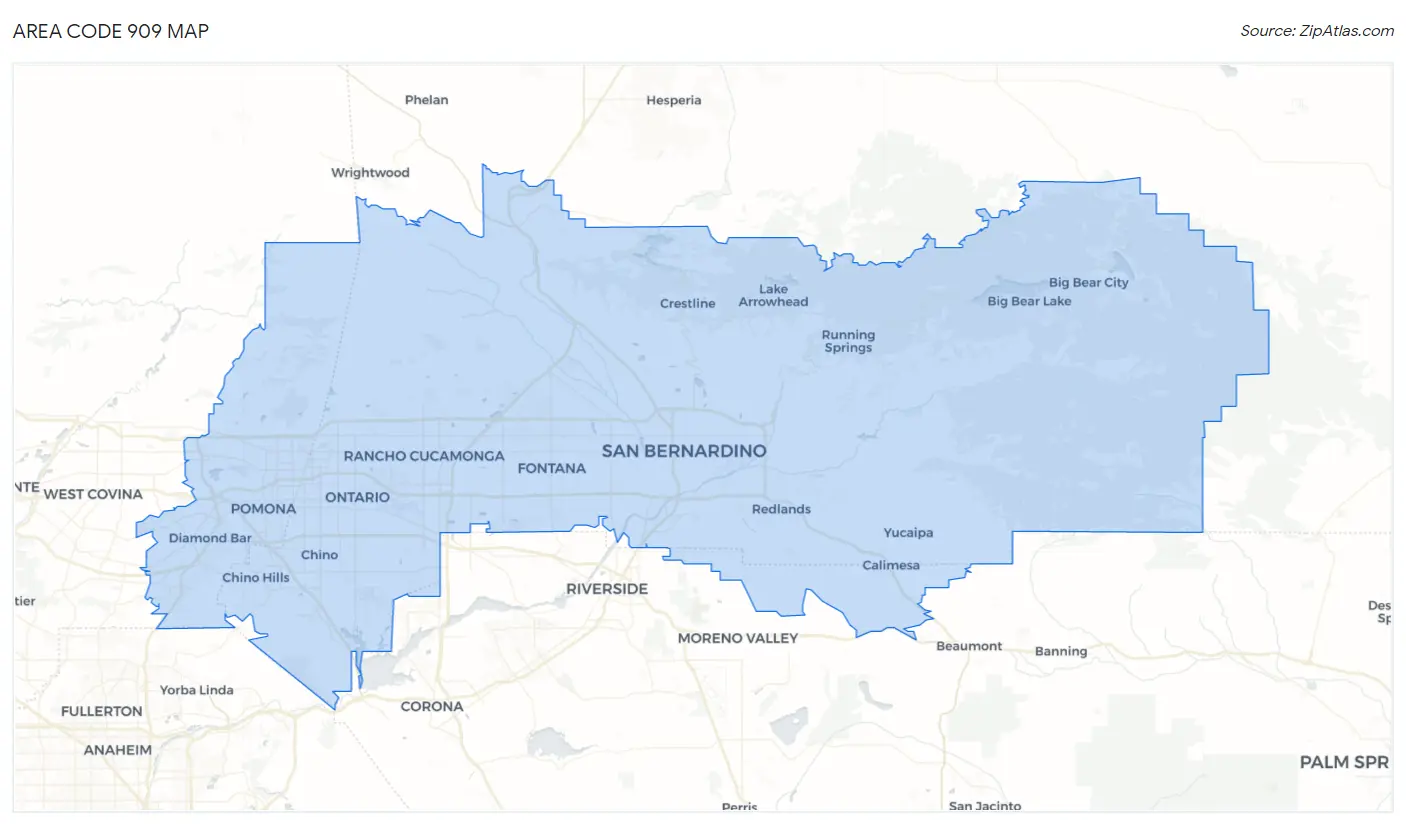
Area Code 909 Map
Area Code 909 Overview
$34,344
PER CAPITA INCOME
$96,288
AVG FAMILY INCOME
$87,272
AVG HOUSEHOLD INCOME
24.9%
WAGE / INCOME GAP [ % ]
75.1¢/ $1
WAGE / INCOME GAP [ $ ]
$11,639
FAMILY INCOME DEFICIT
28.62
INEQUALITY / GINI INDEX
3,038,297
TOTAL POPULATION
1,510,053
MALE POPULATION
1,528,244
FEMALE POPULATION
98.81
MALES / 100 FEMALES
101.20
FEMALES / 100 MALES
36.1
MEDIAN AGE
3.6
AVG FAMILY SIZE
3.2
AVG HOUSEHOLD SIZE
1,472,960
LABOR FORCE [ PEOPLE ]
62.0%
PERCENT IN LABOR FORCE
6.6%
UNEMPLOYMENT RATE
Income in Area Code 909
Income Overview in Area Code 909
Per Capita Income in Area Code 909 is $34,344, while median incomes of families and households are $96,288 and $87,272 respectively.
| Characteristic | Number | Measure |
| Per Capita Income | 3,038,297 | $34,344 |
| Median Family Income | 697,548 | $96,288 |
| Mean Family Income | 697,548 | $8,009,308 |
| Median Household Income | 908,771 | $87,272 |
| Mean Household Income | 908,771 | $7,413,404 |
| Income Deficit | 697,548 | $11,639 |
| Wage / Income Gap (%) | 3,038,297 | 24.93% |
| Wage / Income Gap ($) | 3,038,297 | 75.07¢ per $1 |
| Gini / Inequality Index | 3,038,297 | 28.62 |
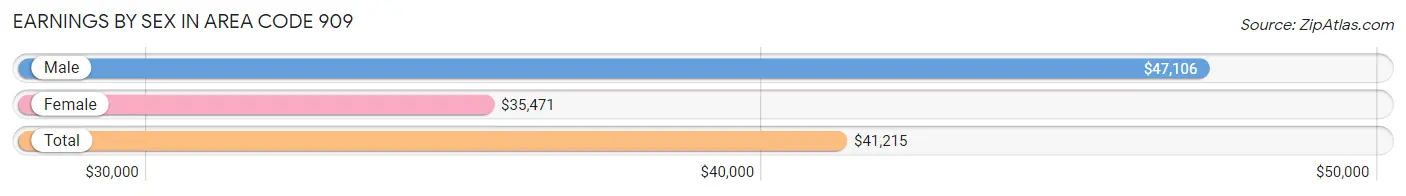
Earnings by Sex in Area Code 909
Average Earnings in Area Code 909 are $41,215, $47,106 for men and $35,471 for women, a difference of 24.7%.
| Sex | Number | Average Earnings |
| Male | 834,023 (54.2%) | $47,106 |
| Female | 703,222 (45.8%) | $35,471 |
| Total | 1,537,245 (100.0%) | $41,215 |
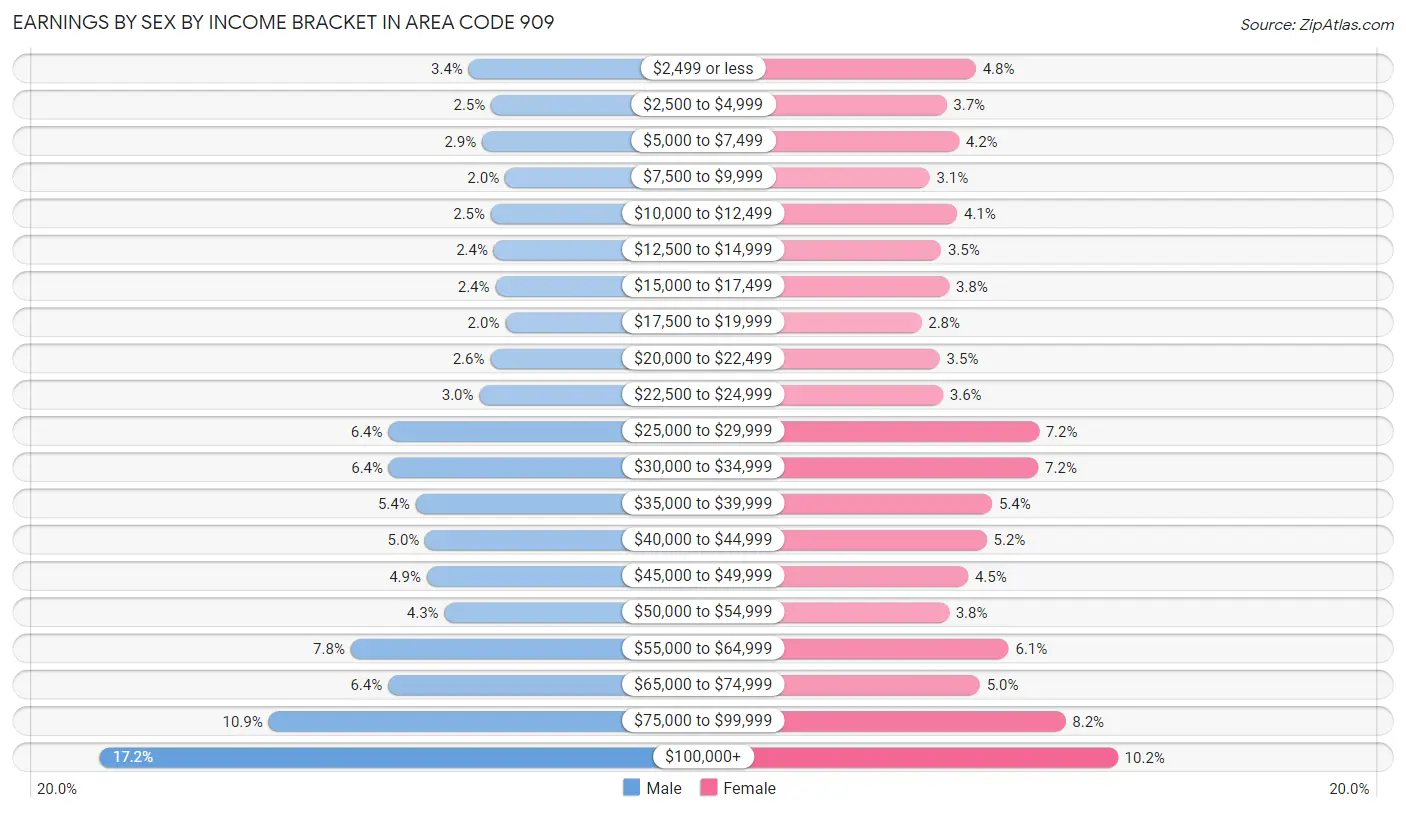
Earnings by Sex by Income Bracket in Area Code 909
The most common earnings brackets in Area Code 909 are $100,000+ for men (143,319 | 17.2%) and $100,000+ for women (71,367 | 10.2%).
| Income | Male | Female |
| $2,499 or less | 28,046 (3.4%) | 33,990 (4.8%) |
| $2,500 to $4,999 | 21,012 (2.5%) | 26,225 (3.7%) |
| $5,000 to $7,499 | 23,824 (2.9%) | 29,550 (4.2%) |
| $7,500 to $9,999 | 16,712 (2.0%) | 21,765 (3.1%) |
| $10,000 to $12,499 | 21,061 (2.5%) | 29,013 (4.1%) |
| $12,500 to $14,999 | 20,147 (2.4%) | 24,836 (3.5%) |
| $15,000 to $17,499 | 19,693 (2.4%) | 26,962 (3.8%) |
| $17,500 to $19,999 | 16,577 (2.0%) | 19,645 (2.8%) |
| $20,000 to $22,499 | 21,264 (2.5%) | 24,456 (3.5%) |
| $22,500 to $24,999 | 24,654 (3.0%) | 25,287 (3.6%) |
| $25,000 to $29,999 | 53,116 (6.4%) | 50,591 (7.2%) |
| $30,000 to $34,999 | 52,976 (6.4%) | 50,386 (7.2%) |
| $35,000 to $39,999 | 44,647 (5.3%) | 38,223 (5.4%) |
| $40,000 to $44,999 | 41,657 (5.0%) | 36,861 (5.2%) |
| $45,000 to $49,999 | 41,113 (4.9%) | 31,947 (4.5%) |
| $50,000 to $54,999 | 35,606 (4.3%) | 26,868 (3.8%) |
| $55,000 to $64,999 | 64,848 (7.8%) | 42,583 (6.1%) |
| $65,000 to $74,999 | 53,177 (6.4%) | 35,039 (5.0%) |
| $75,000 to $99,999 | 90,574 (10.9%) | 57,628 (8.2%) |
| $100,000+ | 143,319 (17.2%) | 71,367 (10.2%) |
| Total | 834,023 (100.0%) | 703,222 (100.0%) |
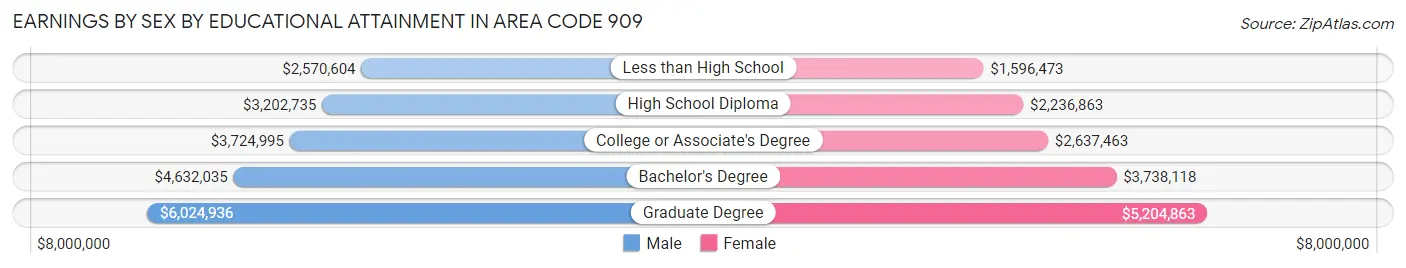
Earnings by Sex by Educational Attainment in Area Code 909
Average earnings in Area Code 909 are $3,734,011 for men and $2,850,735 for women, a difference of 23.6%. Men with an educational attainment of graduate degree enjoy the highest average annual earnings of $6,024,936, while those with less than high school education earn the least with $2,570,604. Women with an educational attainment of graduate degree earn the most with the average annual earnings of $5,204,863, while those with less than high school education have the smallest earnings of $1,596,473.
| Educational Attainment | Male Income | Female Income |
| Less than High School | $2,570,604 | $1,596,473 |
| High School Diploma | $3,202,735 | $2,236,863 |
| College or Associate's Degree | $3,724,995 | $2,637,463 |
| Bachelor's Degree | $4,632,035 | $3,738,118 |
| Graduate Degree | $6,024,936 | $5,204,863 |
| Total | $3,734,011 | $2,850,735 |
Family Income in Area Code 909
Family Income Brackets in Area Code 909
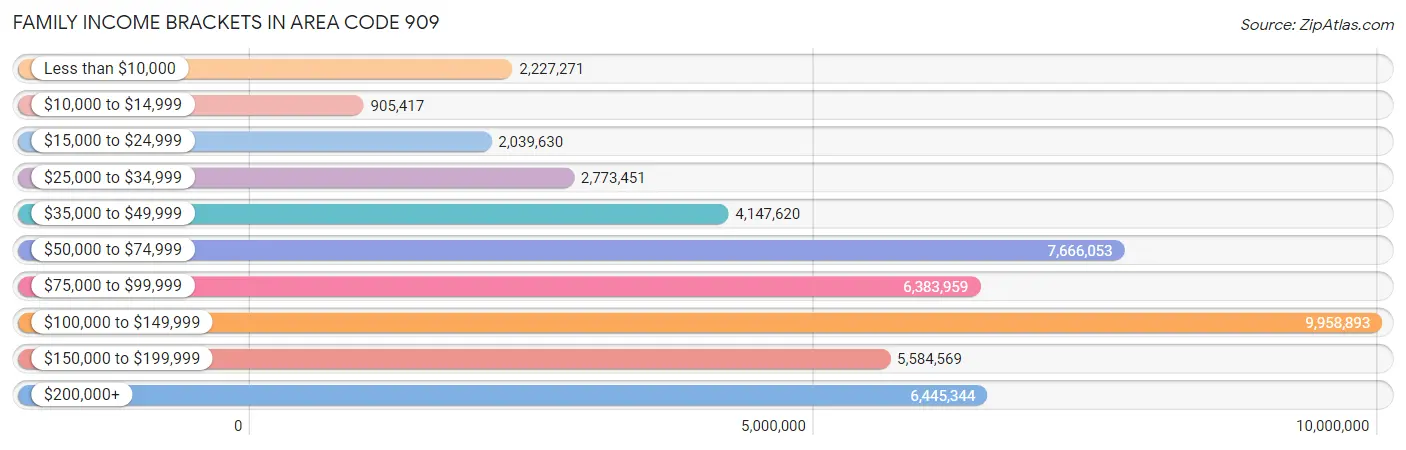
According to the Area Code 909 family income data, there are 9,958,893 families falling into the $100,000 to $149,999 income range, which is the most common income bracket and makes up 1,427.7% of all families. Conversely, the $10,000 to $14,999 income bracket is the least frequent group with only 905,417 families (129.8%) belonging to this category.
| Income Bracket | # Families | % Families |
| Less than $10,000 | 2,227,271 | 319.3% |
| $10,000 to $14,999 | 905,417 | 129.8% |
| $15,000 to $24,999 | 2,039,630 | 292.4% |
| $25,000 to $34,999 | 2,773,451 | 397.6% |
| $35,000 to $49,999 | 4,147,620 | 594.6% |
| $50,000 to $74,999 | 7,666,053 | 1,099.0% |
| $75,000 to $99,999 | 6,383,959 | 915.2% |
| $100,000 to $149,999 | 9,958,893 | 1,427.7% |
| $150,000 to $199,999 | 5,584,569 | 800.6% |
| $200,000+ | 6,445,344 | 924.0% |
Family Income by Famaliy Size in Area Code 909
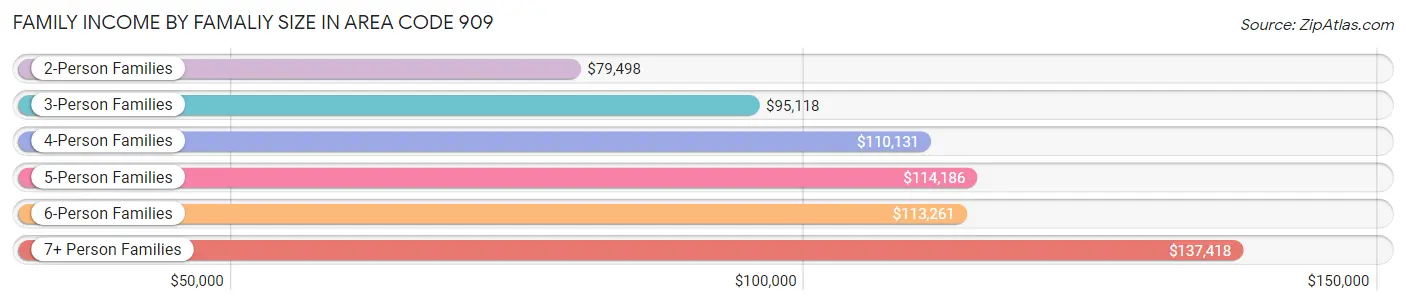
7+ person families (29,516 | 4.2%) account for the highest median family income in Area Code 909 with $137,418 per family, while 2-person families (231,909 | 33.3%) have the highest median income of $39,749 per family member.
| Income Bracket | # Families | Median Income |
| 2-Person Families | 231,909 (33.3%) | $79,498 |
| 3-Person Families | 156,129 (22.4%) | $95,118 |
| 4-Person Families | 152,441 (21.8%) | $110,131 |
| 5-Person Families | 87,729 (12.6%) | $114,186 |
| 6-Person Families | 39,824 (5.7%) | $113,261 |
| 7+ Person Families | 29,516 (4.2%) | $137,418 |
| Total | 697,548 (100.0%) | $96,288 |
Family Income by Number of Earners in Area Code 909
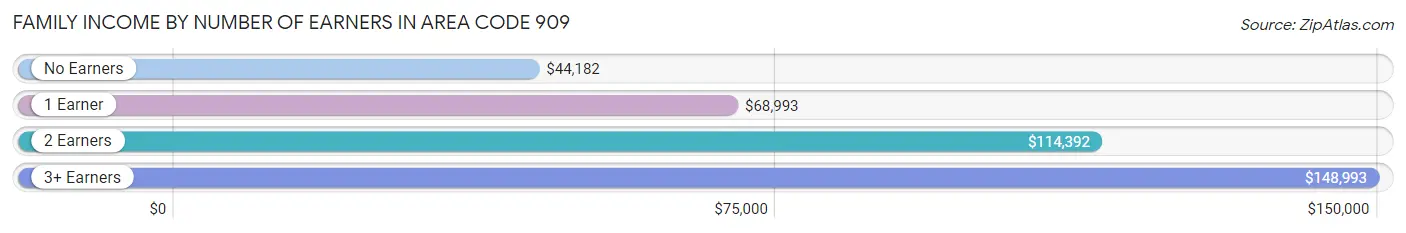
The median family income in Area Code 909 is $96,288, with families comprising 3+ earners (131,563) having the highest median family income of $148,993, while families with no earners (80,116) have the lowest median family income of $44,182, accounting for 18.9% and 11.5% of families, respectively.
| Number of Earners | # Families | Median Income |
| No Earners | 80,116 (11.5%) | $44,182 |
| 1 Earner | 216,595 (31.0%) | $68,993 |
| 2 Earners | 269,274 (38.6%) | $114,392 |
| 3+ Earners | 131,563 (18.9%) | $148,993 |
| Total | 697,548 (100.0%) | $96,288 |
Household Income in Area Code 909
Household Income Brackets in Area Code 909
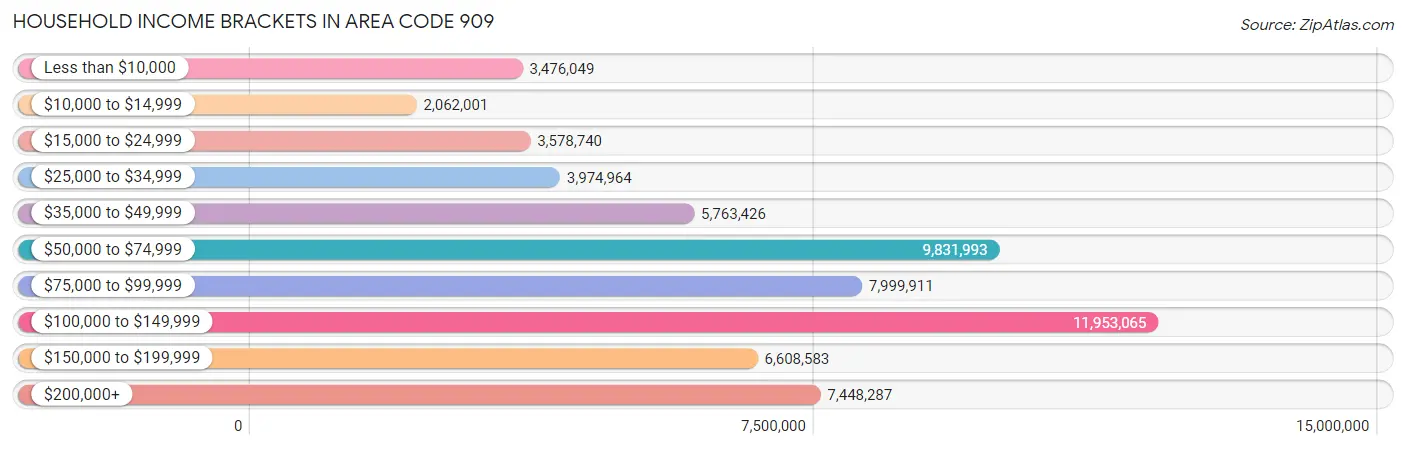
With 11,953,065 households falling in the category, the $100,000 to $149,999 income range is the most frequent in Area Code 909, accounting for 1,315.3% of all households. In contrast, only 2,062,001 households (226.9%) fall into the $10,000 to $14,999 income bracket, making it the least populous group.
| Income Bracket | # Households | % Households |
| Less than $10,000 | 3,476,049 | 382.5% |
| $10,000 to $14,999 | 2,062,001 | 226.9% |
| $15,000 to $24,999 | 3,578,740 | 393.8% |
| $25,000 to $34,999 | 3,974,964 | 437.4% |
| $35,000 to $49,999 | 5,763,426 | 634.2% |
| $50,000 to $74,999 | 9,831,993 | 1,081.9% |
| $75,000 to $99,999 | 7,999,911 | 880.3% |
| $100,000 to $149,999 | 11,953,065 | 1,315.3% |
| $150,000 to $199,999 | 6,608,583 | 727.2% |
| $200,000+ | 7,448,287 | 819.6% |
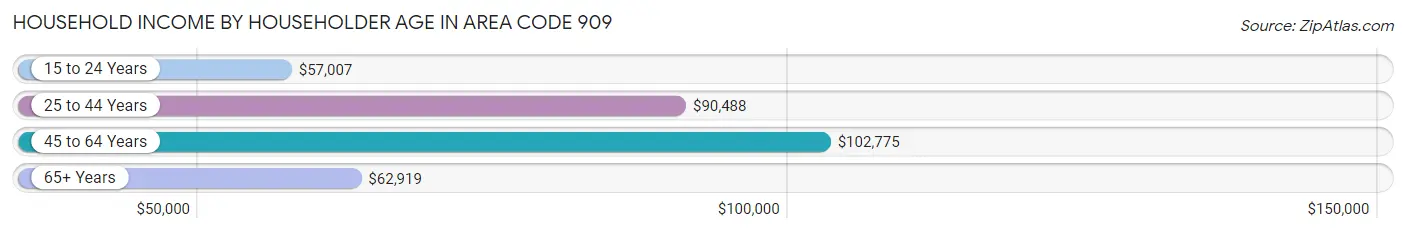
Household Income by Householder Age in Area Code 909
The median household income in Area Code 909 is $87,272, with the highest median household income of $102,775 found in the 45 to 64 years age bracket for the primary householder. A total of 362,403 households (39.9%) fall into this category. Meanwhile, the 15 to 24 years age bracket for the primary householder has the lowest median household income of $57,007, with 21,229 households (2.3%) in this group.
| Income Bracket | # Households | Median Income |
| 15 to 24 Years | 21,229 (2.3%) | $57,007 |
| 25 to 44 Years | 320,548 (35.3%) | $90,488 |
| 45 to 64 Years | 362,403 (39.9%) | $102,775 |
| 65+ Years | 204,591 (22.5%) | $62,919 |
| Total | 908,771 (100.0%) | $87,272 |
Poverty in Area Code 909
Income Below Poverty by Sex and Age in Area Code 909
With 10.7% poverty level for males and 13.1% for females among the residents of Area Code 909, 6 to 11 year old males and under 5 year old females are the most vulnerable to poverty, with 19,629 males (15.7%) and 15,433 females (17.1%) in their respective age groups living below the poverty level.
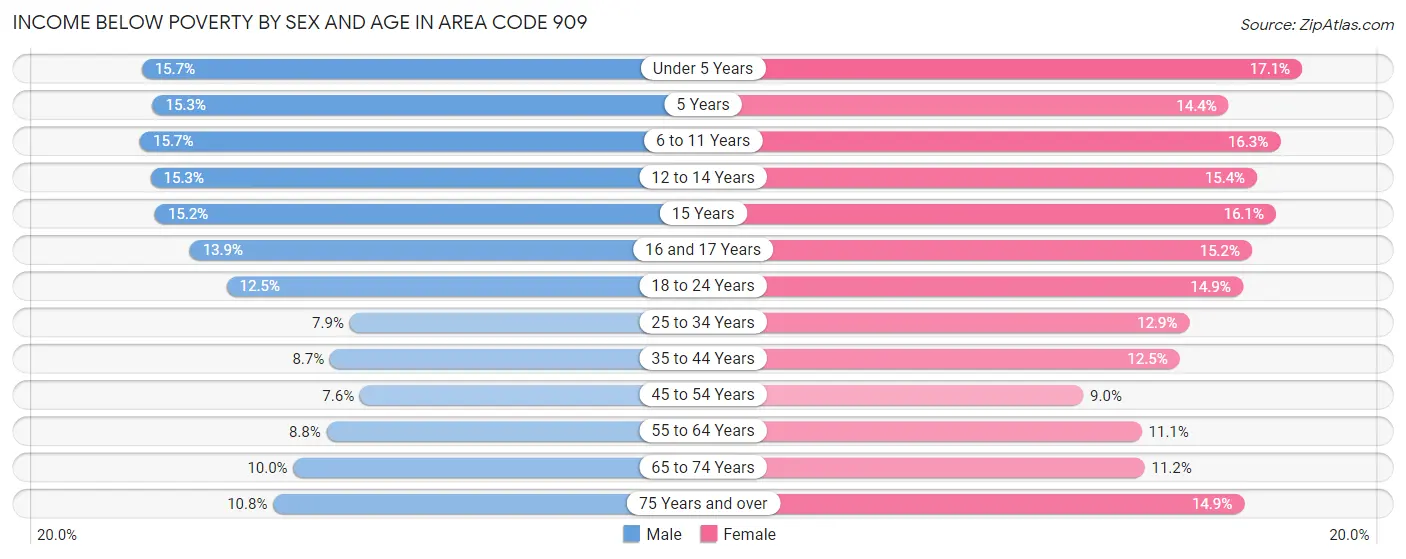
| Age Bracket | Male | Female |
| Under 5 Years | 14,656 (15.7%) | 15,433 (17.1%) |
| 5 Years | 3,050 (15.2%) | 2,845 (14.4%) |
| 6 to 11 Years | 19,629 (15.7%) | 19,548 (16.3%) |
| 12 to 14 Years | 10,625 (15.3%) | 10,212 (15.4%) |
| 15 Years | 3,455 (15.2%) | 3,539 (16.1%) |
| 16 and 17 Years | 6,249 (13.9%) | 6,642 (15.2%) |
| 18 to 24 Years | 19,037 (12.5%) | 21,613 (14.9%) |
| 25 to 34 Years | 18,062 (7.9%) | 28,227 (12.9%) |
| 35 to 44 Years | 17,507 (8.7%) | 25,170 (12.5%) |
| 45 to 54 Years | 14,250 (7.5%) | 17,172 (9.0%) |
| 55 to 64 Years | 14,498 (8.8%) | 19,313 (11.1%) |
| 65 to 74 Years | 10,746 (10.0%) | 13,764 (11.2%) |
| 75 Years and over | 6,347 (10.8%) | 12,874 (14.9%) |
| Total | 158,111 (10.7%) | 196,352 (13.1%) |
Income Above Poverty by Sex and Age in Area Code 909
According to the poverty statistics in Area Code 909, males aged 45 to 54 years and females aged 45 to 54 years are the age groups that are most secure financially, with 92.4% of males and 91.0% of females in these age groups living above the poverty line.
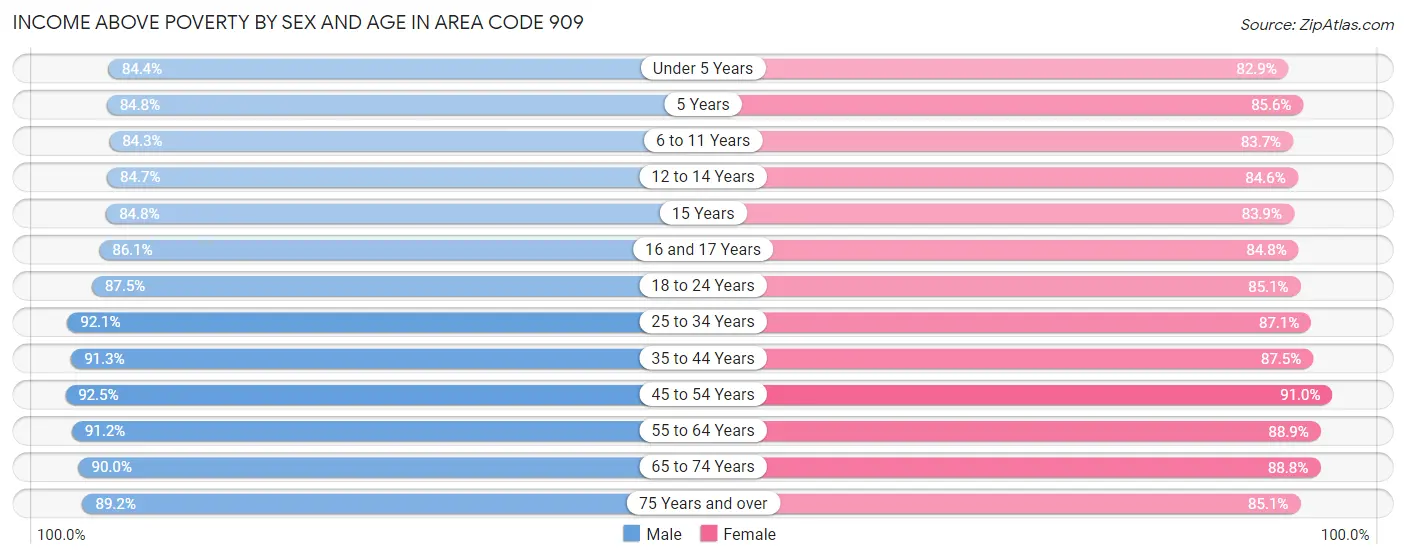
| Age Bracket | Male | Female |
| Under 5 Years | 78,963 (84.4%) | 74,944 (82.9%) |
| 5 Years | 16,956 (84.8%) | 16,961 (85.6%) |
| 6 to 11 Years | 105,350 (84.3%) | 100,566 (83.7%) |
| 12 to 14 Years | 58,750 (84.7%) | 56,049 (84.6%) |
| 15 Years | 19,341 (84.8%) | 18,425 (83.9%) |
| 16 and 17 Years | 38,814 (86.1%) | 36,985 (84.8%) |
| 18 to 24 Years | 133,265 (87.5%) | 123,628 (85.1%) |
| 25 to 34 Years | 209,563 (92.1%) | 190,566 (87.1%) |
| 35 to 44 Years | 184,559 (91.3%) | 175,471 (87.5%) |
| 45 to 54 Years | 174,394 (92.4%) | 174,585 (91.0%) |
| 55 to 64 Years | 150,356 (91.2%) | 154,275 (88.9%) |
| 65 to 74 Years | 96,536 (90.0%) | 108,715 (88.8%) |
| 75 Years and over | 52,588 (89.2%) | 73,331 (85.1%) |
| Total | 1,319,435 (89.3%) | 1,304,501 (86.9%) |
Income Below Poverty Among Married-Couple Families in Area Code 909
The poverty statistics for married-couple families in Area Code 909 show that 5.5% or 26,526 of the total 485,895 families live below the poverty line. Families with 5 or more children have the highest poverty rate of 20.2%, comprising of 818 families. On the other hand, families with no children have the lowest poverty rate of 4.2%, which includes 10,312 families.
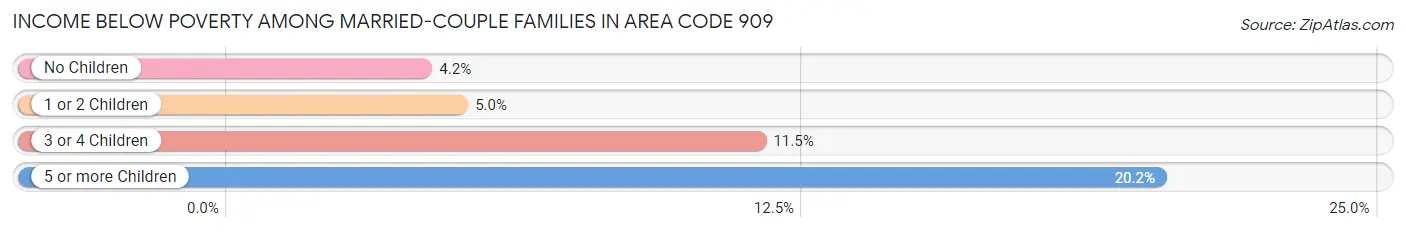
| Children | Above Poverty | Below Poverty |
| No Children | 233,576 (95.8%) | 10,312 (4.2%) |
| 1 or 2 Children | 175,255 (95.0%) | 9,247 (5.0%) |
| 3 or 4 Children | 47,308 (88.5%) | 6,149 (11.5%) |
| 5 or more Children | 3,230 (79.8%) | 818 (20.2%) |
| Total | 459,369 (94.5%) | 26,526 (5.5%) |
Income Below Poverty Among Single-Parent Households in Area Code 909
According to the poverty data in Area Code 909, 11.3% or 7,772 single-father households and 21.3% or 30,417 single-mother households are living below the poverty line. Among single-father households, those with 3 or 4 children have the highest poverty rate, with 1,485 households (23.9%) experiencing poverty. Likewise, among single-mother households, those with 5 or more children have the highest poverty rate, with 1,189 households (64.9%) falling below the poverty line.
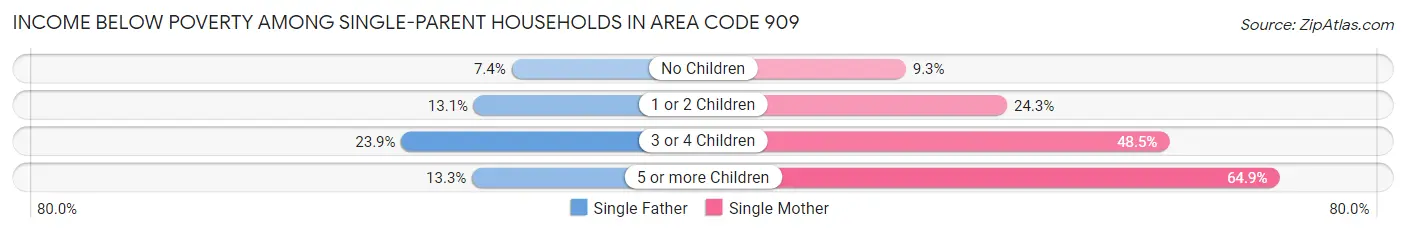
| Children | Single Father | Single Mother |
| No Children | 2,454 (7.4%) | 5,610 (9.3%) |
| 1 or 2 Children | 3,753 (13.1%) | 15,628 (24.3%) |
| 3 or 4 Children | 1,485 (23.9%) | 7,990 (48.5%) |
| 5 or more Children | 80 (13.3%) | 1,189 (64.9%) |
| Total | 7,772 (11.3%) | 30,417 (21.3%) |
Income Below Poverty Among Married-Couple vs Single-Parent Households in Area Code 909
The poverty data for Area Code 909 shows that 26,526 of the married-couple family households (5.5%) and 38,189 of the single-parent households (18.0%) are living below the poverty level. Within the married-couple family households, those with 5 or more children have the highest poverty rate, with 818 households (20.2%) falling below the poverty line. Among the single-parent households, those with 5 or more children have the highest poverty rate, with 1,269 household (52.2%) living below poverty.
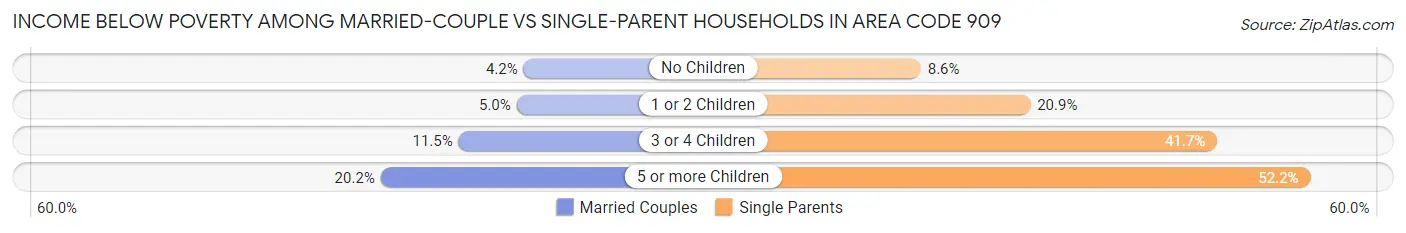
| Children | Married-Couple Families | Single-Parent Households |
| No Children | 10,312 (4.2%) | 8,064 (8.6%) |
| 1 or 2 Children | 9,247 (5.0%) | 19,381 (20.8%) |
| 3 or 4 Children | 6,149 (11.5%) | 9,475 (41.7%) |
| 5 or more Children | 818 (20.2%) | 1,269 (52.2%) |
| Total | 26,526 (5.5%) | 38,189 (18.0%) |
Race in Area Code 909
The most populous races in Area Code 909 are Hispanic or Latino (1,648,109 | 54.2%), White / Caucasian (1,318,228 | 43.4%), and Some other Race (702,723 | 23.1%).
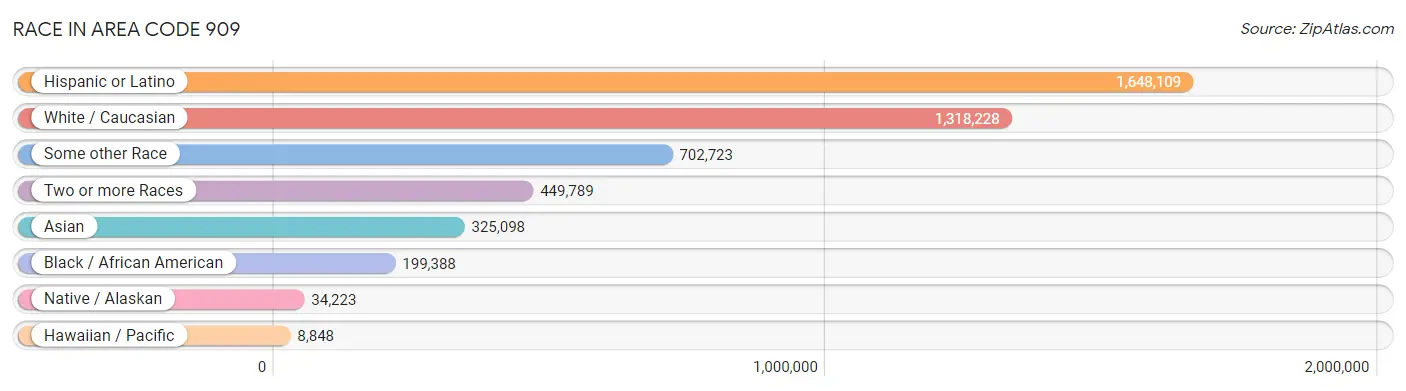
| Race | # Population | % Population |
| Asian | 325,098 | 10.7% |
| Black / African American | 199,388 | 6.6% |
| Hawaiian / Pacific | 8,848 | 0.3% |
| Hispanic or Latino | 1,648,109 | 54.2% |
| Native / Alaskan | 34,223 | 1.1% |
| White / Caucasian | 1,318,228 | 43.4% |
| Two or more Races | 449,789 | 14.8% |
| Some other Race | 702,723 | 23.1% |
| Total | 3,038,297 | 100.0% |
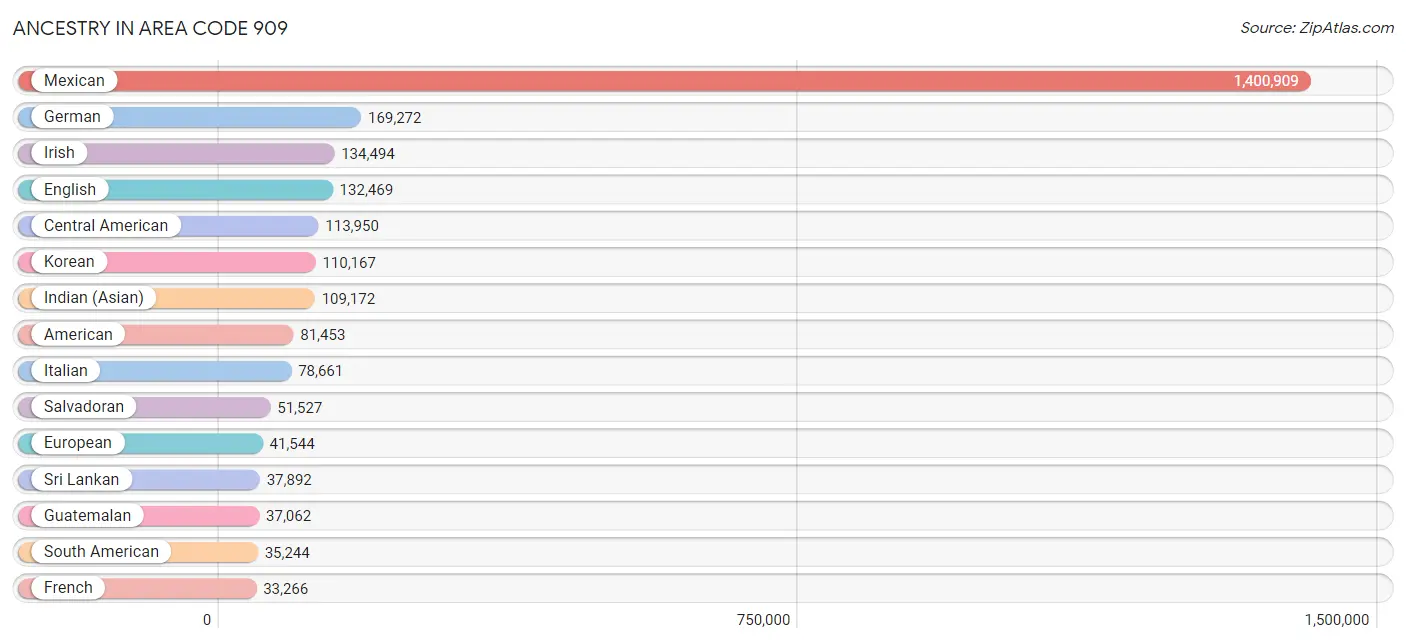
Ancestry in Area Code 909
The most populous ancestries reported in Area Code 909 are Mexican (1,400,909 | 46.1%), German (169,272 | 5.6%), Irish (134,494 | 4.4%), English (132,469 | 4.4%), and Central American (113,950 | 3.7%), together accounting for 64.2% of all Area Code 909 residents.
| Ancestry | # Population | % Population |
| Afghan | 2,130 | 0.1% |
| African | 12,200 | 0.4% |
| Alaska Native | 36 | 0.0% |
| Alaskan Athabascan | 88 | 0.0% |
| Albanian | 137 | 0.0% |
| Aleut | 209 | 0.0% |
| Alsatian | 16 | 0.0% |
| American | 81,453 | 2.7% |
| Apache | 2,971 | 0.1% |
| Arab | 31,361 | 1.0% |
| Arapaho | 70 | 0.0% |
| Argentinean | 6,178 | 0.2% |
| Armenian | 5,148 | 0.2% |
| Assyrian / Chaldean / Syriac | 296 | 0.0% |
| Australian | 538 | 0.0% |
| Austrian | 2,611 | 0.1% |
| Bahamian | 110 | 0.0% |
| Bangladeshi | 903 | 0.0% |
| Barbadian | 174 | 0.0% |
| Basque | 897 | 0.0% |
| Belgian | 881 | 0.0% |
| Belizean | 1,372 | 0.1% |
| Bermudan | 25 | 0.0% |
| Bhutanese | 20,296 | 0.7% |
| Blackfeet | 1,564 | 0.1% |
| Bolivian | 1,553 | 0.1% |
| Brazilian | 1,762 | 0.1% |
| British | 9,977 | 0.3% |
| British West Indian | 361 | 0.0% |
| Bulgarian | 215 | 0.0% |
| Burmese | 31,833 | 1.1% |
| Cajun | 298 | 0.0% |
| Cambodian | 218 | 0.0% |
| Canadian | 4,051 | 0.1% |
| Cape Verdean | 278 | 0.0% |
| Celtic | 129 | 0.0% |
| Central American | 113,950 | 3.7% |
| Central American Indian | 6,413 | 0.2% |
| Cherokee | 7,412 | 0.2% |
| Cheyenne | 181 | 0.0% |
| Chickasaw | 537 | 0.0% |
| Chilean | 1,611 | 0.1% |
| Chinese | 98 | 0.0% |
| Chippewa | 785 | 0.0% |
| Choctaw | 2,508 | 0.1% |
| Colombian | 9,093 | 0.3% |
| Comanche | 225 | 0.0% |
| Costa Rican | 3,507 | 0.1% |
| Cree | 26 | 0.0% |
| Creek | 435 | 0.0% |
| Croatian | 2,248 | 0.1% |
| Cuban | 12,893 | 0.4% |
| Czech | 3,506 | 0.1% |
| Czechoslovakian | 1,635 | 0.1% |
| Danish | 6,378 | 0.2% |
| Delaware | 92 | 0.0% |
| Dominican | 1,670 | 0.1% |
| Dutch | 21,513 | 0.7% |
| Eastern European | 3,460 | 0.1% |
| Ecuadorian | 5,083 | 0.2% |
| Egyptian | 7,188 | 0.2% |
| English | 132,469 | 4.4% |
| Estonian | 36 | 0.0% |
| Ethiopian | 1,144 | 0.0% |
| European | 41,544 | 1.4% |
| Fijian | 10 | 0.0% |
| Filipino | 9,672 | 0.3% |
| Finnish | 2,180 | 0.1% |
| French | 33,266 | 1.1% |
| French American Indian | 350 | 0.0% |
| French Canadian | 5,878 | 0.2% |
| German | 169,272 | 5.6% |
| German Russian | 49 | 0.0% |
| Ghanaian | 1,352 | 0.0% |
| Greek | 5,653 | 0.2% |
| Guamanian / Chamorro | 2,316 | 0.1% |
| Guatemalan | 37,062 | 1.2% |
| Guyanese | 451 | 0.0% |
| Haitian | 615 | 0.0% |
| Honduran | 8,023 | 0.3% |
| Hopi | 284 | 0.0% |
| Hungarian | 5,016 | 0.2% |
| Icelander | 305 | 0.0% |
| Indian (Asian) | 109,172 | 3.6% |
| Indonesian | 1,685 | 0.1% |
| Inupiat | 41 | 0.0% |
| Iranian | 4,945 | 0.2% |
| Iraqi | 1,010 | 0.0% |
| Irish | 134,494 | 4.4% |
| Iroquois | 437 | 0.0% |
| Israeli | 474 | 0.0% |
| Italian | 78,661 | 2.6% |
| Jamaican | 3,409 | 0.1% |
| Japanese | 6,854 | 0.2% |
| Jordanian | 3,152 | 0.1% |
| Kenyan | 674 | 0.0% |
| Kiowa | 49 | 0.0% |
| Korean | 110,167 | 3.6% |
| Laotian | 10,176 | 0.3% |
| Latvian | 430 | 0.0% |
| Lebanese | 5,522 | 0.2% |
| Liberian | 124 | 0.0% |
| Lithuanian | 1,529 | 0.1% |
| Lumbee | 337 | 0.0% |
| Luxembourger | 53 | 0.0% |
| Macedonian | 46 | 0.0% |
| Malaysian | 2,685 | 0.1% |
| Maltese | 265 | 0.0% |
| Mexican | 1,400,909 | 46.1% |
| Mexican American Indian | 18,354 | 0.6% |
| Mongolian | 419 | 0.0% |
| Moroccan | 251 | 0.0% |
| Native Hawaiian | 6,210 | 0.2% |
| Navajo | 2,574 | 0.1% |
| Nepalese | 121 | 0.0% |
| New Zealander | 27 | 0.0% |
| Nicaraguan | 11,366 | 0.4% |
| Nigerian | 4,716 | 0.2% |
| Northern European | 3,094 | 0.1% |
| Norwegian | 20,925 | 0.7% |
| Okinawan | 67 | 0.0% |
| Osage | 220 | 0.0% |
| Ottawa | 32 | 0.0% |
| Paiute | 252 | 0.0% |
| Pakistani | 5,779 | 0.2% |
| Palestinian | 2,563 | 0.1% |
| Panamanian | 1,841 | 0.1% |
| Paraguayan | 352 | 0.0% |
| Pennsylvania German | 380 | 0.0% |
| Peruvian | 9,739 | 0.3% |
| Pima | 273 | 0.0% |
| Polish | 23,520 | 0.8% |
| Portuguese | 8,239 | 0.3% |
| Potawatomi | 84 | 0.0% |
| Pueblo | 1,546 | 0.1% |
| Puerto Rican | 20,522 | 0.7% |
| Puget Sound Salish | 17 | 0.0% |
| Romanian | 3,510 | 0.1% |
| Russian | 9,452 | 0.3% |
| Salvadoran | 51,527 | 1.7% |
| Samoan | 4,876 | 0.2% |
| Scandinavian | 5,798 | 0.2% |
| Scotch-Irish | 9,973 | 0.3% |
| Scottish | 23,983 | 0.8% |
| Seminole | 89 | 0.0% |
| Senegalese | 43 | 0.0% |
| Serbian | 750 | 0.0% |
| Shoshone | 177 | 0.0% |
| Sierra Leonean | 202 | 0.0% |
| Sioux | 1,224 | 0.0% |
| Slavic | 429 | 0.0% |
| Slovak | 1,569 | 0.1% |
| Slovene | 616 | 0.0% |
| South African | 394 | 0.0% |
| South American | 35,244 | 1.2% |
| South American Indian | 394 | 0.0% |
| Soviet Union | 8 | 0.0% |
| Spaniard | 13,734 | 0.4% |
| Spanish | 11,793 | 0.4% |
| Spanish American | 416 | 0.0% |
| Spanish American Indian | 648 | 0.0% |
| Sri Lankan | 37,892 | 1.3% |
| Subsaharan African | 22,321 | 0.7% |
| Sudanese | 394 | 0.0% |
| Swedish | 17,853 | 0.6% |
| Swiss | 3,387 | 0.1% |
| Syrian | 4,483 | 0.2% |
| Taiwanese | 19 | 0.0% |
| Thai | 30,340 | 1.0% |
| Tlingit-Haida | 33 | 0.0% |
| Tohono O'Odham | 606 | 0.0% |
| Tongan | 1,902 | 0.1% |
| Trinidadian and Tobagonian | 787 | 0.0% |
| Tsimshian | 14 | 0.0% |
| Turkish | 983 | 0.0% |
| Ugandan | 34 | 0.0% |
| Ukrainian | 2,927 | 0.1% |
| Uruguayan | 210 | 0.0% |
| Ute | 203 | 0.0% |
| Venezuelan | 1,225 | 0.0% |
| Vietnamese | 1,428 | 0.1% |
| Welsh | 8,163 | 0.3% |
| West Indian | 740 | 0.0% |
| Yaqui | 1,695 | 0.1% |
| Yugoslavian | 785 | 0.0% |
| Yuman | 582 | 0.0% |
| Yup'ik | 9 | 0.0% |
| Zimbabwean | 144 | 0.0% | View All 188 Rows |
Immigrants in Area Code 909
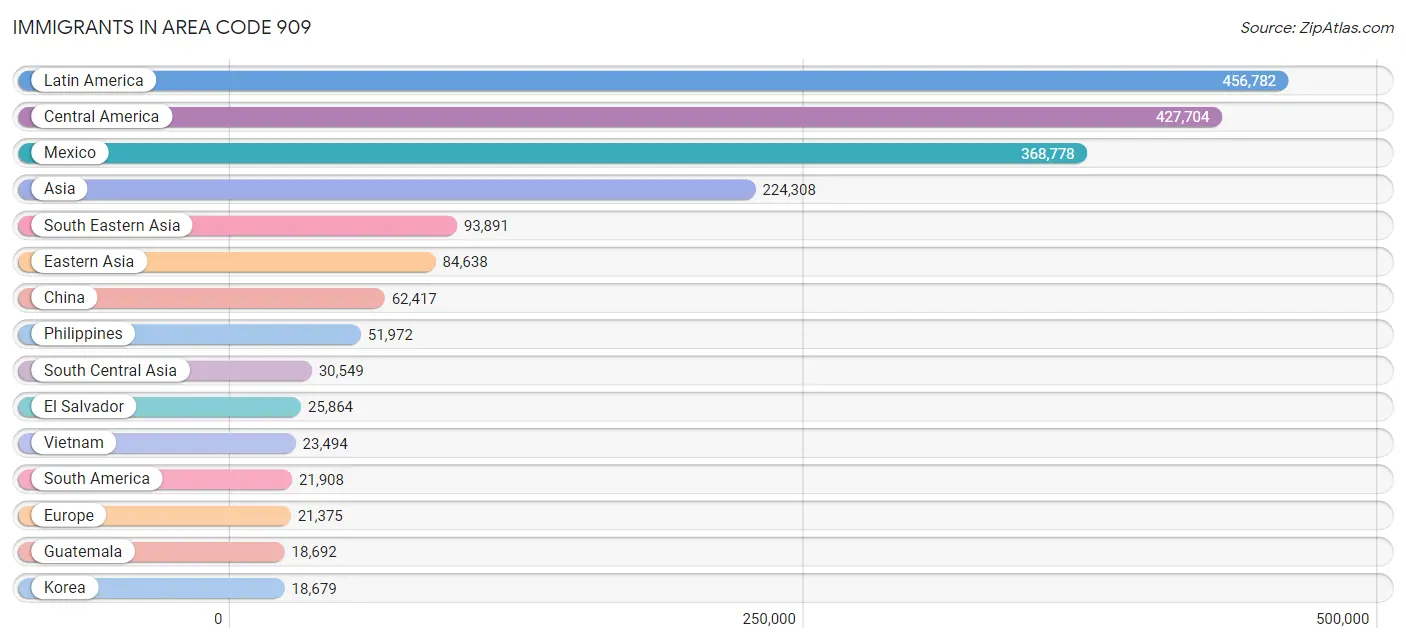
The most numerous immigrant groups reported in Area Code 909 came from Latin America (456,782 | 15.0%), Central America (427,704 | 14.1%), Mexico (368,778 | 12.1%), Asia (224,308 | 7.4%), and South Eastern Asia (93,891 | 3.1%), together accounting for 51.7% of all Area Code 909 residents.
| Immigration Origin | # Population | % Population |
| Afghanistan | 1,676 | 0.1% |
| Africa | 17,177 | 0.6% |
| Albania | 86 | 0.0% |
| Argentina | 3,121 | 0.1% |
| Armenia | 524 | 0.0% |
| Asia | 224,308 | 7.4% |
| Australia | 498 | 0.0% |
| Austria | 287 | 0.0% |
| Azores | 330 | 0.0% |
| Bahamas | 45 | 0.0% |
| Bangladesh | 1,394 | 0.1% |
| Barbados | 168 | 0.0% |
| Belarus | 27 | 0.0% |
| Belgium | 186 | 0.0% |
| Belize | 1,022 | 0.0% |
| Bolivia | 631 | 0.0% |
| Bosnia and Herzegovina | 37 | 0.0% |
| Brazil | 1,703 | 0.1% |
| Bulgaria | 173 | 0.0% |
| Cabo Verde | 47 | 0.0% |
| Cambodia | 3,087 | 0.1% |
| Cameroon | 235 | 0.0% |
| Canada | 5,811 | 0.2% |
| Caribbean | 7,170 | 0.2% |
| Central America | 427,704 | 14.1% |
| Chile | 800 | 0.0% |
| China | 62,417 | 2.1% |
| Colombia | 5,291 | 0.2% |
| Congo | 18 | 0.0% |
| Costa Rica | 1,379 | 0.1% |
| Croatia | 169 | 0.0% |
| Cuba | 4,127 | 0.1% |
| Czechoslovakia | 461 | 0.0% |
| Denmark | 387 | 0.0% |
| Dominica | 24 | 0.0% |
| Dominican Republic | 371 | 0.0% |
| Eastern Africa | 3,097 | 0.1% |
| Eastern Asia | 84,638 | 2.8% |
| Eastern Europe | 6,135 | 0.2% |
| Ecuador | 2,207 | 0.1% |
| Egypt | 6,193 | 0.2% |
| El Salvador | 25,864 | 0.9% |
| England | 2,641 | 0.1% |
| Eritrea | 279 | 0.0% |
| Ethiopia | 980 | 0.0% |
| Europe | 21,375 | 0.7% |
| Fiji | 509 | 0.0% |
| France | 883 | 0.0% |
| Germany | 2,800 | 0.1% |
| Ghana | 1,270 | 0.0% |
| Greece | 458 | 0.0% |
| Grenada | 6 | 0.0% |
| Guatemala | 18,692 | 0.6% |
| Guyana | 508 | 0.0% |
| Haiti | 253 | 0.0% |
| Honduras | 4,605 | 0.2% |
| Hong Kong | 5,059 | 0.2% |
| Hungary | 343 | 0.0% |
| India | 16,627 | 0.5% |
| Indonesia | 6,409 | 0.2% |
| Iran | 3,632 | 0.1% |
| Iraq | 1,513 | 0.1% |
| Ireland | 479 | 0.0% |
| Israel | 713 | 0.0% |
| Italy | 1,058 | 0.0% |
| Jamaica | 1,258 | 0.0% |
| Japan | 3,441 | 0.1% |
| Jordan | 2,823 | 0.1% |
| Kazakhstan | 148 | 0.0% |
| Kenya | 674 | 0.0% |
| Korea | 18,679 | 0.6% |
| Kuwait | 494 | 0.0% |
| Laos | 1,520 | 0.1% |
| Latin America | 456,782 | 15.0% |
| Latvia | 26 | 0.0% |
| Lebanon | 2,587 | 0.1% |
| Liberia | 212 | 0.0% |
| Lithuania | 7 | 0.0% |
| Malaysia | 1,602 | 0.1% |
| Mexico | 368,778 | 12.1% |
| Micronesia | 37 | 0.0% |
| Middle Africa | 349 | 0.0% |
| Moldova | 44 | 0.0% |
| Morocco | 325 | 0.0% |
| Nepal | 1,491 | 0.1% |
| Netherlands | 1,122 | 0.0% |
| Nicaragua | 6,179 | 0.2% |
| Nigeria | 3,813 | 0.1% |
| North Macedonia | 39 | 0.0% |
| Northern Africa | 6,817 | 0.2% |
| Northern Europe | 6,528 | 0.2% |
| Norway | 253 | 0.0% |
| Oceania | 2,273 | 0.1% |
| Pakistan | 4,575 | 0.2% |
| Panama | 984 | 0.0% |
| Peru | 6,269 | 0.2% |
| Philippines | 51,972 | 1.7% |
| Poland | 835 | 0.0% |
| Portugal | 735 | 0.0% |
| Romania | 1,667 | 0.1% |
| Russia | 1,041 | 0.0% |
| Saudi Arabia | 526 | 0.0% |
| Scotland | 407 | 0.0% |
| Serbia | 122 | 0.0% |
| Sierra Leone | 217 | 0.0% |
| Singapore | 414 | 0.0% |
| Somalia | 4 | 0.0% |
| South Africa | 435 | 0.0% |
| South America | 21,908 | 0.7% |
| South Central Asia | 30,549 | 1.0% |
| South Eastern Asia | 93,891 | 3.1% |
| Southern Europe | 3,065 | 0.1% |
| Spain | 777 | 0.0% |
| Sri Lanka | 916 | 0.0% |
| St. Vincent and the Grenadines | 7 | 0.0% |
| Sudan | 207 | 0.0% |
| Sweden | 291 | 0.0% |
| Switzerland | 311 | 0.0% |
| Syria | 3,851 | 0.1% |
| Taiwan | 16,088 | 0.5% |
| Thailand | 3,508 | 0.1% |
| Trinidad and Tobago | 554 | 0.0% |
| Turkey | 566 | 0.0% |
| Uganda | 299 | 0.0% |
| Ukraine | 479 | 0.0% |
| Uruguay | 192 | 0.0% |
| Uzbekistan | 44 | 0.0% |
| Venezuela | 936 | 0.0% |
| Vietnam | 23,494 | 0.8% |
| West Indies | 81 | 0.0% |
| Western Africa | 5,698 | 0.2% |
| Western Asia | 14,086 | 0.5% |
| Western Europe | 5,594 | 0.2% |
| Yemen | 25 | 0.0% |
| Zaire | 32 | 0.0% |
| Zimbabwe | 353 | 0.0% | View All 136 Rows |
Sex and Age in Area Code 909
Sex and Age in Area Code 909
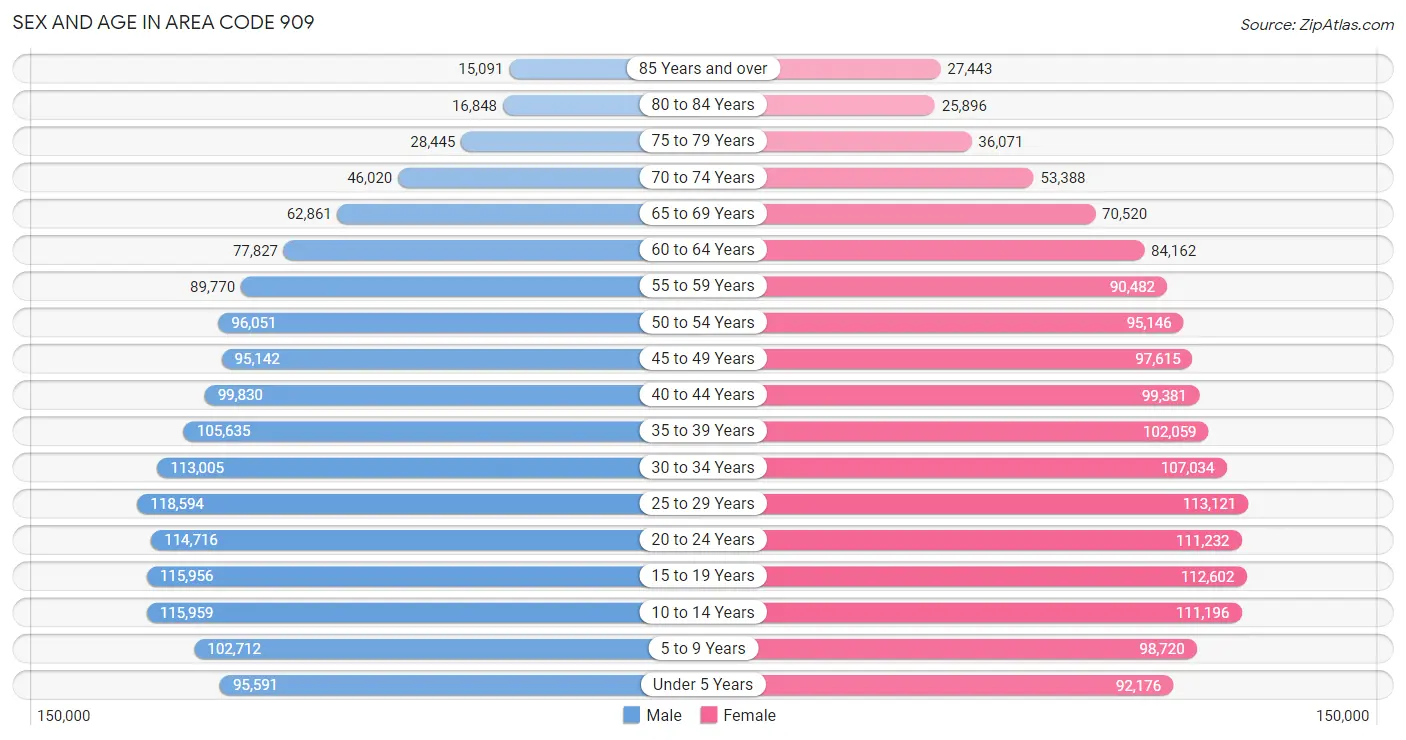
The most populous age groups in Area Code 909 are 25 to 29 Years (118,594 | 7.9%) for men and 25 to 29 Years (113,121 | 7.4%) for women.
| Age Bracket | Male | Female |
| Under 5 Years | 95,591 (6.3%) | 92,176 (6.0%) |
| 5 to 9 Years | 102,712 (6.8%) | 98,720 (6.5%) |
| 10 to 14 Years | 115,959 (7.7%) | 111,196 (7.3%) |
| 15 to 19 Years | 115,956 (7.7%) | 112,602 (7.4%) |
| 20 to 24 Years | 114,716 (7.6%) | 111,232 (7.3%) |
| 25 to 29 Years | 118,594 (7.9%) | 113,121 (7.4%) |
| 30 to 34 Years | 113,005 (7.5%) | 107,034 (7.0%) |
| 35 to 39 Years | 105,635 (7.0%) | 102,059 (6.7%) |
| 40 to 44 Years | 99,830 (6.6%) | 99,381 (6.5%) |
| 45 to 49 Years | 95,142 (6.3%) | 97,615 (6.4%) |
| 50 to 54 Years | 96,051 (6.4%) | 95,146 (6.2%) |
| 55 to 59 Years | 89,770 (5.9%) | 90,482 (5.9%) |
| 60 to 64 Years | 77,827 (5.1%) | 84,162 (5.5%) |
| 65 to 69 Years | 62,861 (4.2%) | 70,520 (4.6%) |
| 70 to 74 Years | 46,020 (3.0%) | 53,388 (3.5%) |
| 75 to 79 Years | 28,445 (1.9%) | 36,071 (2.4%) |
| 80 to 84 Years | 16,848 (1.1%) | 25,896 (1.7%) |
| 85 Years and over | 15,091 (1.0%) | 27,443 (1.8%) |
| Total | 1,510,053 (100.0%) | 1,528,244 (100.0%) |
Families and Households in Area Code 909
Median Family Size in Area Code 909
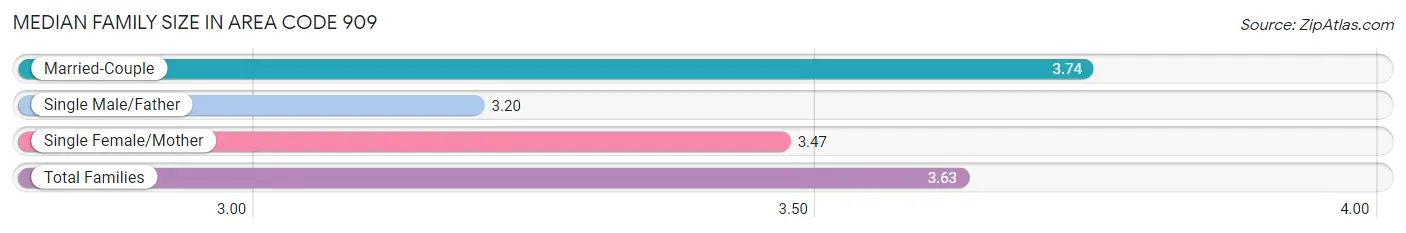
The median family size in Area Code 909 is 3.63 persons per family, with married-couple families (485,895 | 69.7%) accounting for the largest median family size of 3.73855 persons per family. On the other hand, single male/father families (68,570 | 9.8%) represent the smallest median family size with 3.20 persons per family.
| Family Type | # Families | Family Size |
| Married-Couple | 485,895 (69.7%) | 3.74 |
| Single Male/Father | 68,570 (9.8%) | 3.20 |
| Single Female/Mother | 143,083 (20.5%) | 3.47 |
| Total Families | 697,548 (100.0%) | 3.63 |
Median Household Size in Area Code 909
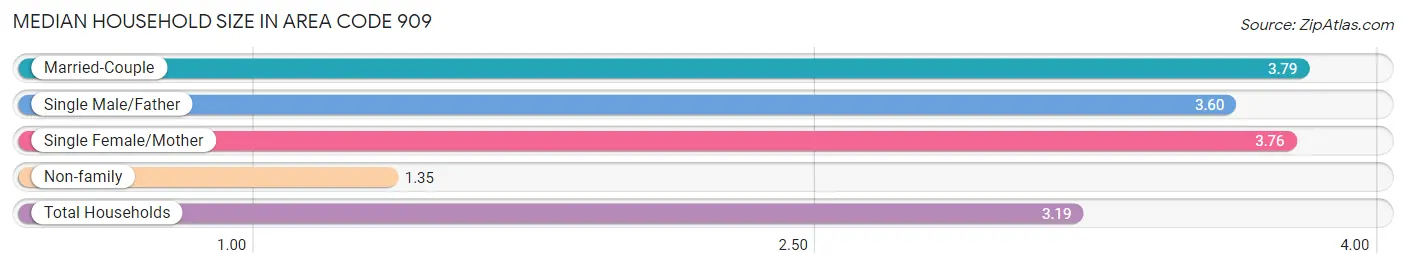
The median household size in Area Code 909 is 3.19 persons per household, with married-couple households (485,895 | 53.5%) accounting for the largest median household size of 3.79188 persons per household. non-family households (211,223 | 23.2%) represent the smallest median household size with 1.35 persons per household.
| Household Type | # Households | Household Size |
| Married-Couple | 485,895 (53.5%) | 3.79 |
| Single Male/Father | 68,570 (7.5%) | 3.60 |
| Single Female/Mother | 143,083 (15.7%) | 3.76 |
| Non-family | 211,223 (23.2%) | 1.35 |
| Total Households | 908,771 (100.0%) | 3.19 |
Household Size by Marriage Status in Area Code 909
Out of a total of 908,771 households in Area Code 909, 697,548 (76.8%) are family households, while 211,223 (23.2%) are nonfamily households. The most numerous type of family households are 2-person households, comprising 207,007, and the most common type of nonfamily households are 1-person households, comprising 160,722.
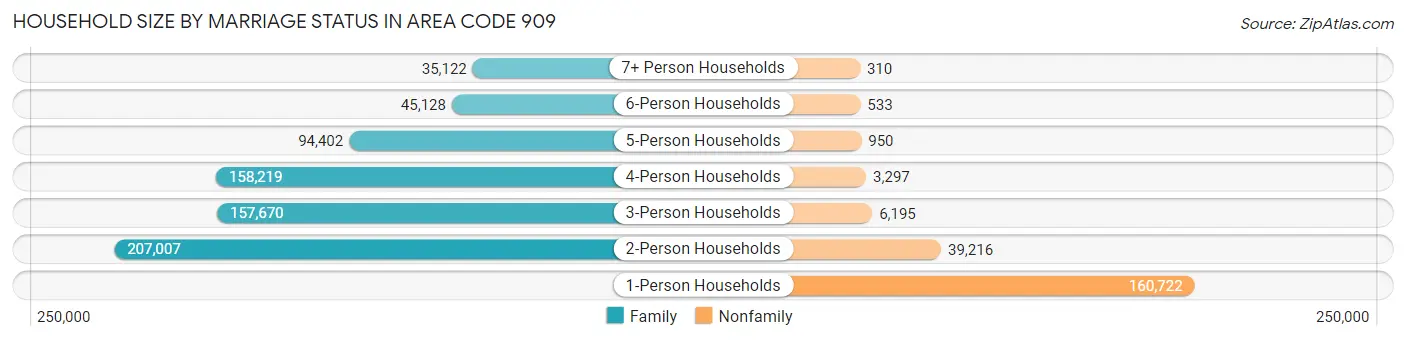
| Household Size | Family Households | Nonfamily Households |
| 1-Person Households | - | 160,722 (17.7%) |
| 2-Person Households | 207,007 (22.8%) | 39,216 (4.3%) |
| 3-Person Households | 157,670 (17.3%) | 6,195 (0.7%) |
| 4-Person Households | 158,219 (17.4%) | 3,297 (0.4%) |
| 5-Person Households | 94,402 (10.4%) | 950 (0.1%) |
| 6-Person Households | 45,128 (5.0%) | 533 (0.1%) |
| 7+ Person Households | 35,122 (3.9%) | 310 (0.0%) |
| Total | 697,548 (76.8%) | 211,223 (23.2%) |
Female Fertility in Area Code 909
Fertility by Age in Area Code 909
Average fertility rate in Area Code 909 is 46.4 births per 1,000 women. Women in the age bracket of 20 to 34 years have the highest fertility rate with 77.9 births per 1,000 women. Women in the age bracket of 20 to 34 years acount for 69.6% of all women with births.
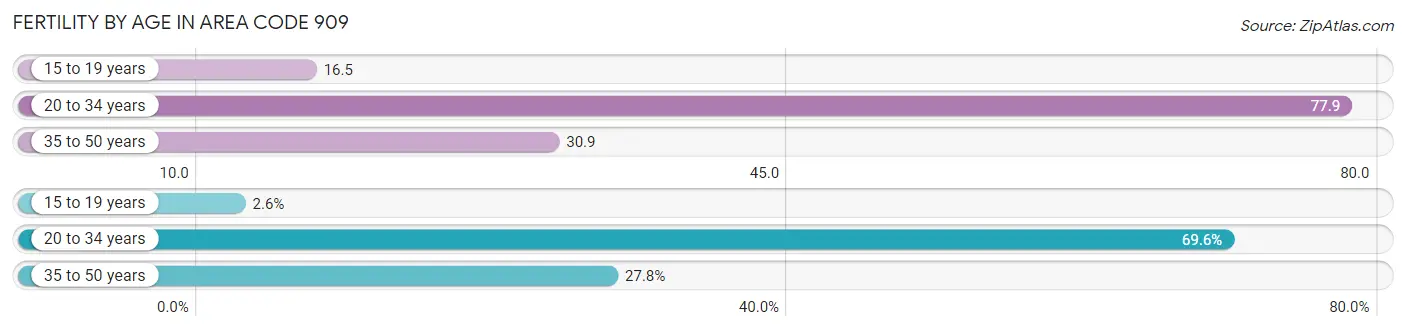
| Age Bracket | Women with Births | Births / 1,000 Women |
| 15 to 19 years | 937 (2.5%) | 16.5 |
| 20 to 34 years | 25,611 (69.6%) | 77.9 |
| 35 to 50 years | 10,237 (27.8%) | 30.9 |
| Total | 36,785 (100.0%) | 46.4 |
Fertility by Age by Marriage Status in Area Code 909
64.9% of women with births (36,785) in Area Code 909 are married. The highest percentage of unmarried women with births falls into 15 to 19 years age bracket with 92.5% of them unmarried at the time of birth, while the lowest percentage of unmarried women with births belong to 35 to 50 years age bracket with 30.5% of them unmarried.
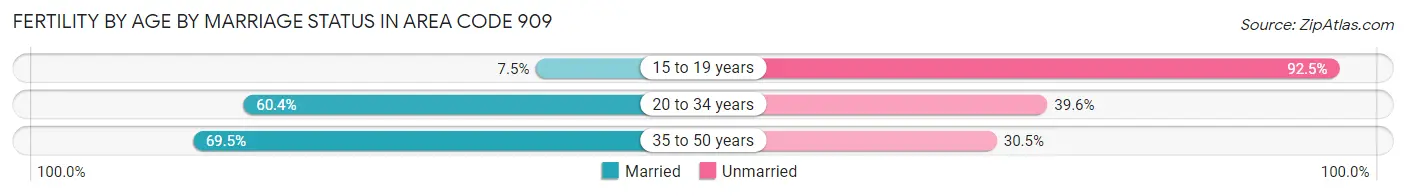
| Age Bracket | Married | Unmarried |
| 15 to 19 years | 70 (7.5%) | 867 (92.5%) |
| 20 to 34 years | 15,461 (60.4%) | 10,150 (39.6%) |
| 35 to 50 years | 7,118 (69.5%) | 3,119 (30.5%) |
| Total | 23,884 (64.9%) | 12,901 (35.1%) |
Fertility by Education in Area Code 909
Average fertility rate in Area Code 909 is 46.4 births per 1,000 women. Women with the education attainment of graduate degree have the highest fertility rate of 76.2 births per 1,000 women, while women with the education attainment of less than high school have the lowest fertility at 30.0 births per 1,000 women. Women with the education attainment of college or associate's degree represent 36.4% of all women with births.
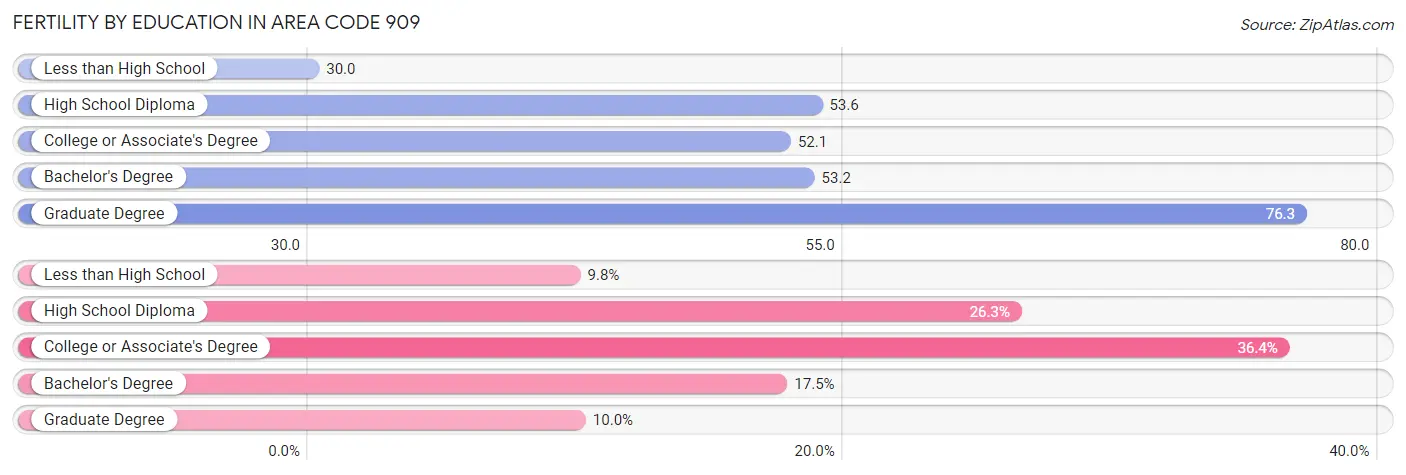
| Educational Attainment | Women with Births | Births / 1,000 Women |
| Less than High School | 3,600 (9.8%) | 30.0 |
| High School Diploma | 9,682 (26.3%) | 53.6 |
| College or Associate's Degree | 13,376 (36.4%) | 52.1 |
| Bachelor's Degree | 6,452 (17.5%) | 53.2 |
| Graduate Degree | 3,675 (10.0%) | 76.2 |
| Total | 36,785 (100.0%) | 46.4 |
Fertility by Education by Marriage Status in Area Code 909
35.1% of women with births in Area Code 909 are unmarried. Women with the educational attainment of bachelor's degree are most likely to be married with 72.1% of them married at childbirth, while women with the educational attainment of less than high school are least likely to be married with 59.4% of them unmarried at childbirth.
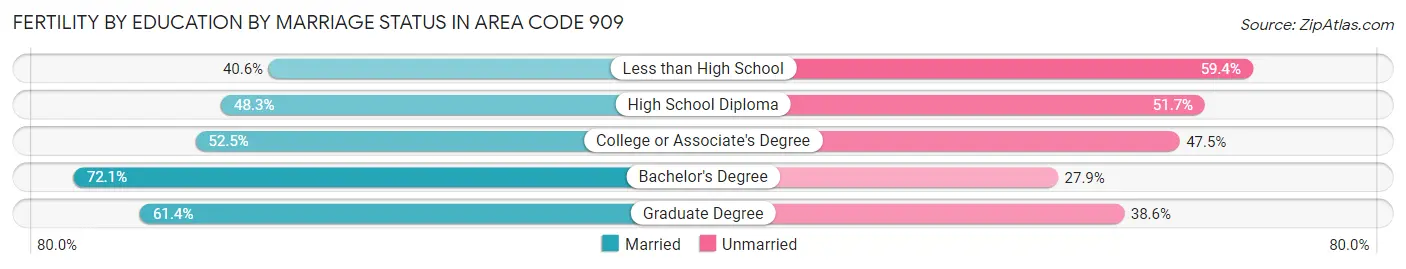
| Educational Attainment | Married | Unmarried |
| Less than High School | 1,462 (40.6%) | 2,138 (59.4%) |
| High School Diploma | 4,678 (48.3%) | 5,004 (51.7%) |
| College or Associate's Degree | 7,017 (52.5%) | 6,359 (47.5%) |
| Bachelor's Degree | 4,649 (72.1%) | 1,803 (27.9%) |
| Graduate Degree | 2,256 (61.4%) | 1,419 (38.6%) |
| Total | 23,884 (64.9%) | 12,901 (35.1%) |
Employment Characteristics in Area Code 909
Employment by Class of Employer in Area Code 909
Among the 1,379,498 employed individuals in Area Code 909, private company employees (944,055 | 68.4%), local government employees (131,841 | 9.6%), and not-for-profit organizations (91,001 | 6.6%) make up the most common classes of employment.
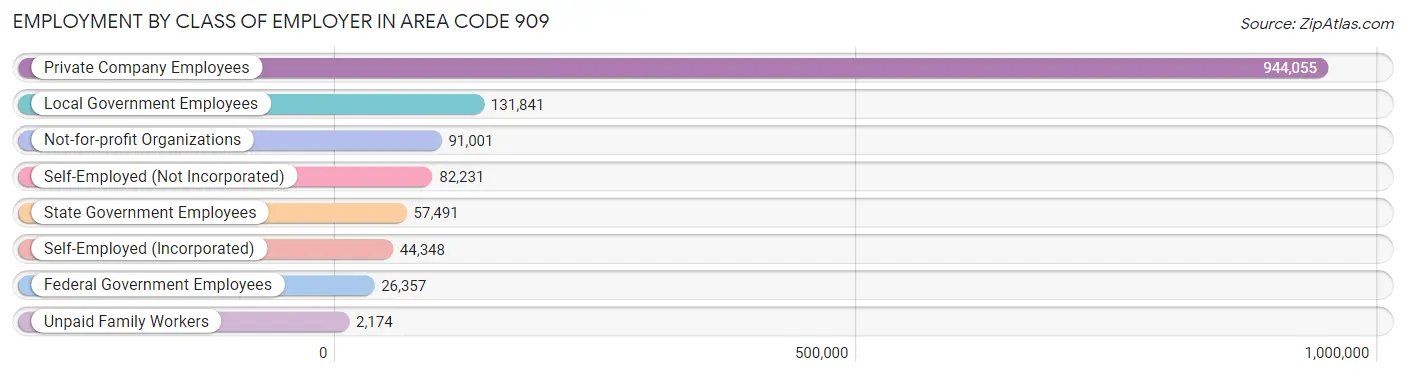
| Employer Class | # Employees | % Employees |
| Private Company Employees | 944,055 | 68.4% |
| Self-Employed (Incorporated) | 44,348 | 3.2% |
| Self-Employed (Not Incorporated) | 82,231 | 6.0% |
| Not-for-profit Organizations | 91,001 | 6.6% |
| Local Government Employees | 131,841 | 9.6% |
| State Government Employees | 57,491 | 4.2% |
| Federal Government Employees | 26,357 | 1.9% |
| Unpaid Family Workers | 2,174 | 0.2% |
| Total | 1,379,498 | 100.0% |
Employment Status by Age in Area Code 909
According to the labor force statistics for Area Code 909, out of the total population over 16 years of age (2,377,111), 62.0% or 1,472,858 individuals are in the labor force, with 6.6% or 97,356 of them unemployed. The age group with the highest labor force participation rate is 35 to 44 years, with 81.6% or 332,116 individuals in the labor force. Within the labor force, the 16 to 19 years age range has the highest percentage of unemployed individuals, with 1,094.2% or 619,788 of them being unemployed.
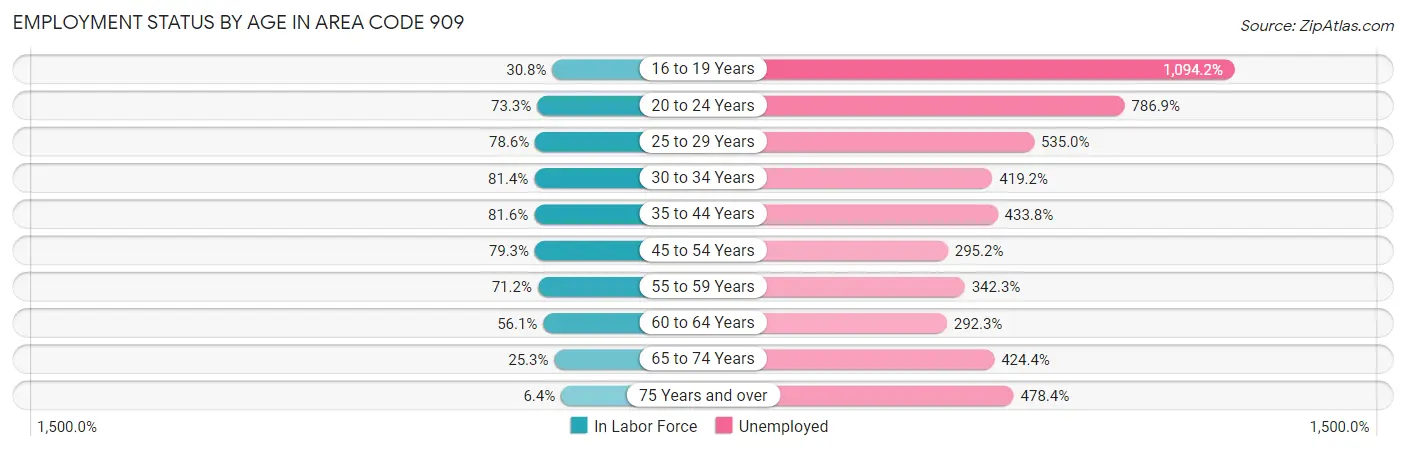
| Age Bracket | In Labor Force | Unemployed |
| 16 to 19 Years | 56,652 (30.8%) | 619,788 (1,094.2%) |
| 20 to 24 Years | 165,662 (73.3%) | 1,303,618 (786.9%) |
| 25 to 29 Years | 182,108 (78.6%) | 974,262 (535.0%) |
| 30 to 34 Years | 179,128 (81.4%) | 750,930 (419.2%) |
| 35 to 44 Years | 332,123 (81.6%) | 1,440,719 (433.8%) |
| 45 to 54 Years | 304,385 (79.3%) | 898,586 (295.2%) |
| 55 to 59 Years | 128,403 (71.2%) | 439,554 (342.3%) |
| 60 to 64 Years | 90,937 (56.1%) | 265,821 (292.3%) |
| 65 to 74 Years | 58,844 (25.3%) | 249,755 (424.4%) |
| 75 Years and over | 9,589 (6.4%) | 45,864 (478.4%) |
| Total | 1,472,960 (62.0%) | 97,315 (6.6%) |
Employment Status by Educational Attainment in Area Code 909
According to labor force statistics for Area Code 909, 75.3% of individuals (1,194,029) out of the total population between 25 and 64 years of age (1,584,854) are in the labor force, with 385.0% or 4,597,012 of them being unemployed. The group with the highest labor force participation rate are those with the educational attainment of bachelor's degree or higher, with 85.0% or 356,165 individuals in the labor force. Within the labor force, individuals with less than high school education have the highest percentage of unemployment, with 467.0% or 779,409 of them being unemployed.
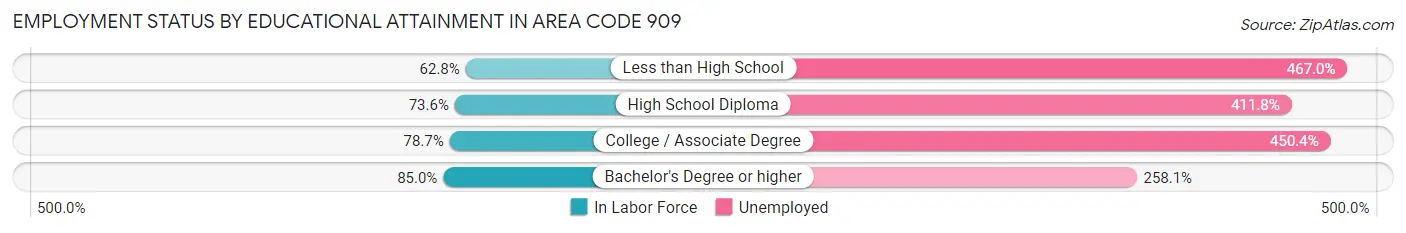
| Educational Attainment | In Labor Force | Unemployed |
| Less than High School | 166,886 (62.8%) | 1,240,702 (467.0%) |
| High School Diploma | 301,262 (73.6%) | 1,685,493 (411.8%) |
| College / Associate Degree | 386,578 (78.7%) | 2,211,734 (450.4%) |
| Bachelor's Degree or higher | 356,185 (85.0%) | 1,080,974 (258.1%) |
| Total | 1,194,097 (75.3%) | 6,101,688 (385.0%) |
Employment Occupations by Sex in Area Code 909
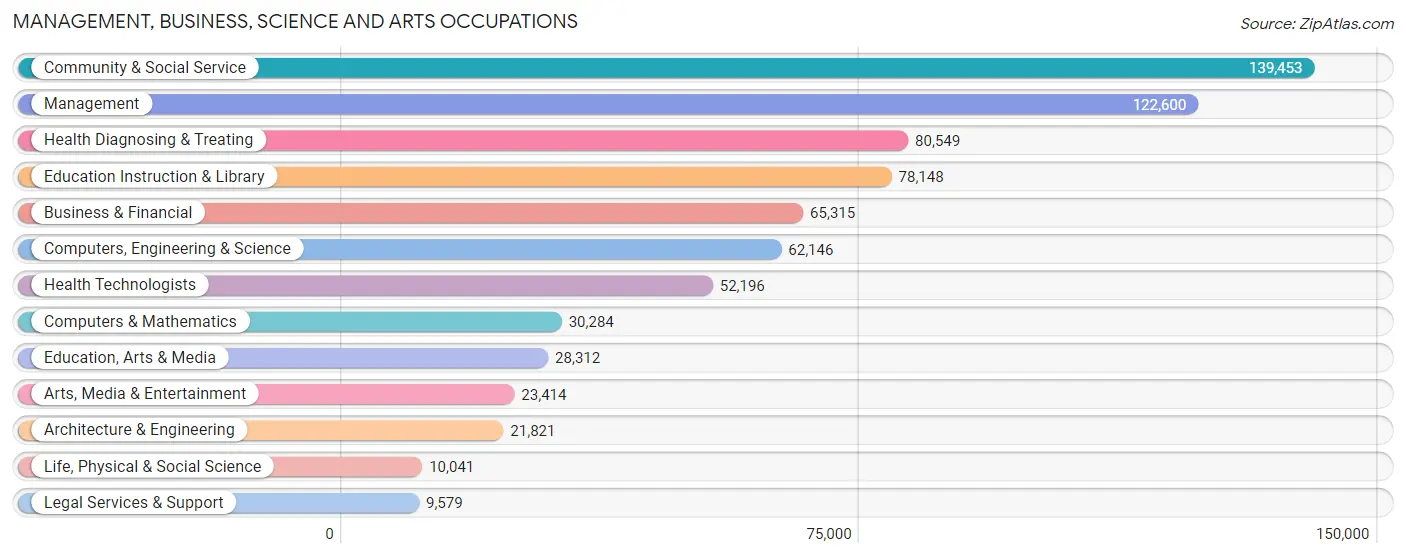
Management, Business, Science and Arts Occupations
The most common Management, Business, Science and Arts occupations in Area Code 909 are Community & Social Service (139,453 | 9.9%), Management (122,600 | 8.7%), Health Diagnosing & Treating (80,549 | 5.7%), Education Instruction & Library (78,148 | 5.5%), and Business & Financial (65,315 | 4.6%).
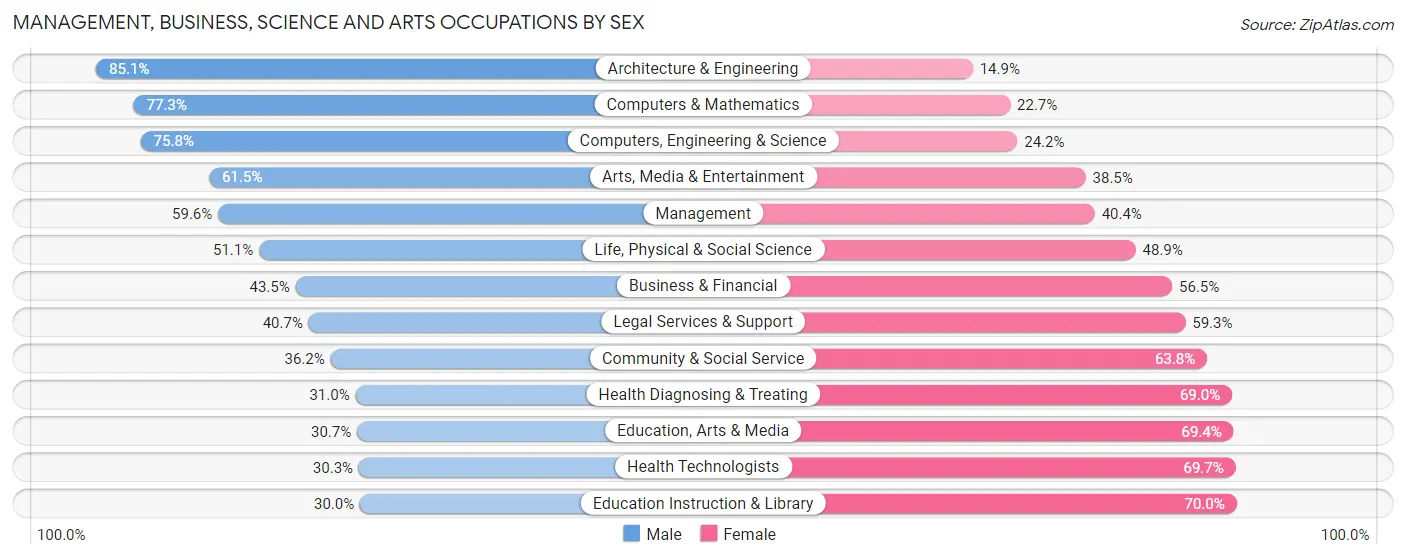
Management, Business, Science and Arts Occupations by Sex
Within the Management, Business, Science and Arts occupations in Area Code 909, the most male-oriented occupations are Architecture & Engineering (85.1%), Computers & Mathematics (77.3%), and Computers, Engineering & Science (75.8%), while the most female-oriented occupations are Education Instruction & Library (70.0%), Health Technologists (69.7%), and Education, Arts & Media (69.4%).
| Occupation | Male | Female |
| Management | 73,106 (59.6%) | 49,494 (40.4%) |
| Business & Financial | 28,396 (43.5%) | 36,919 (56.5%) |
| Computers, Engineering & Science | 47,093 (75.8%) | 15,053 (24.2%) |
| Computers & Mathematics | 23,399 (77.3%) | 6,885 (22.7%) |
| Architecture & Engineering | 18,564 (85.1%) | 3,257 (14.9%) |
| Life, Physical & Social Science | 5,130 (51.1%) | 4,911 (48.9%) |
| Community & Social Service | 50,455 (36.2%) | 88,998 (63.8%) |
| Education, Arts & Media | 8,679 (30.6%) | 19,633 (69.4%) |
| Legal Services & Support | 3,902 (40.7%) | 5,677 (59.3%) |
| Education Instruction & Library | 23,468 (30.0%) | 54,680 (70.0%) |
| Arts, Media & Entertainment | 14,406 (61.5%) | 9,008 (38.5%) |
| Health Diagnosing & Treating | 24,952 (31.0%) | 55,597 (69.0%) |
| Health Technologists | 15,797 (30.3%) | 36,399 (69.7%) |
| Total (Category) | 224,002 (47.6%) | 246,061 (52.3%) |
| Total (Overall) | 770,529 (54.5%) | 642,576 (45.5%) |
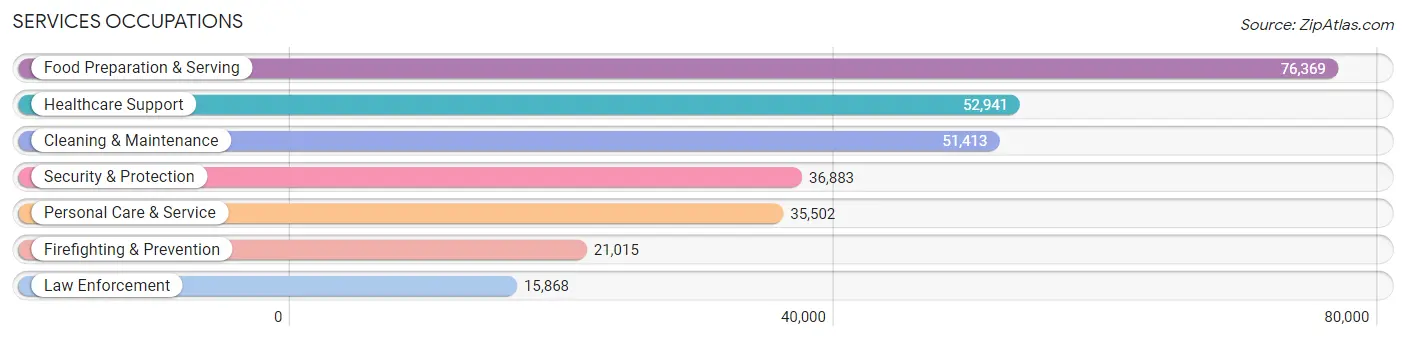
Services Occupations
The most common Services occupations in Area Code 909 are Food Preparation & Serving (76,369 | 5.4%), Healthcare Support (52,941 | 3.7%), Cleaning & Maintenance (51,413 | 3.6%), Security & Protection (36,883 | 2.6%), and Personal Care & Service (35,502 | 2.5%).
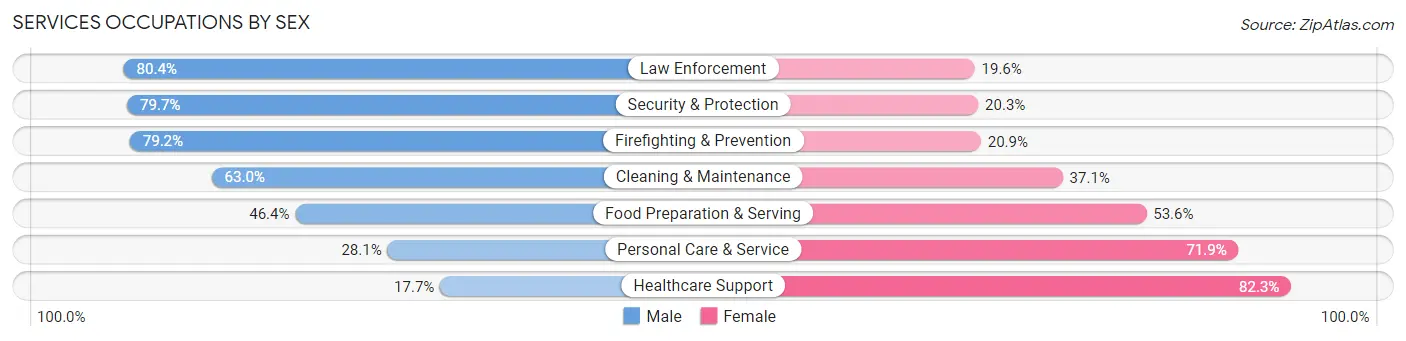
Services Occupations by Sex
Within the Services occupations in Area Code 909, the most male-oriented occupations are Law Enforcement (80.4%), Security & Protection (79.7%), and Firefighting & Prevention (79.1%), while the most female-oriented occupations are Healthcare Support (82.3%), Personal Care & Service (71.9%), and Food Preparation & Serving (53.6%).
| Occupation | Male | Female |
| Healthcare Support | 9,377 (17.7%) | 43,564 (82.3%) |
| Security & Protection | 29,388 (79.7%) | 7,495 (20.3%) |
| Firefighting & Prevention | 16,633 (79.1%) | 4,382 (20.8%) |
| Law Enforcement | 12,755 (80.4%) | 3,113 (19.6%) |
| Food Preparation & Serving | 35,431 (46.4%) | 40,938 (53.6%) |
| Cleaning & Maintenance | 32,364 (62.9%) | 19,049 (37.0%) |
| Personal Care & Service | 9,992 (28.1%) | 25,510 (71.9%) |
| Total (Category) | 116,552 (46.1%) | 136,556 (53.9%) |
| Total (Overall) | 770,529 (54.5%) | 642,576 (45.5%) |
Sales and Office Occupations
The most common Sales and Office occupations in Area Code 909 are Office & Administration (169,240 | 12.0%), and Sales & Related (138,200 | 9.8%).
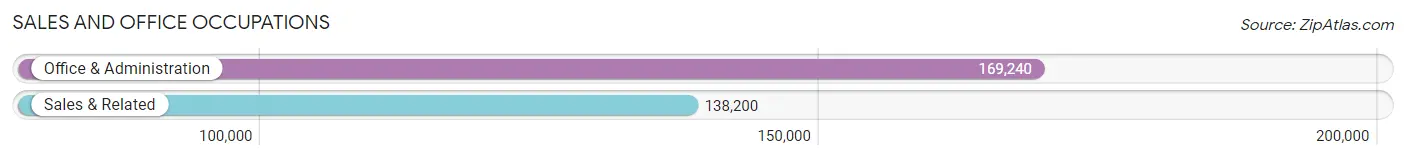
Sales and Office Occupations by Sex
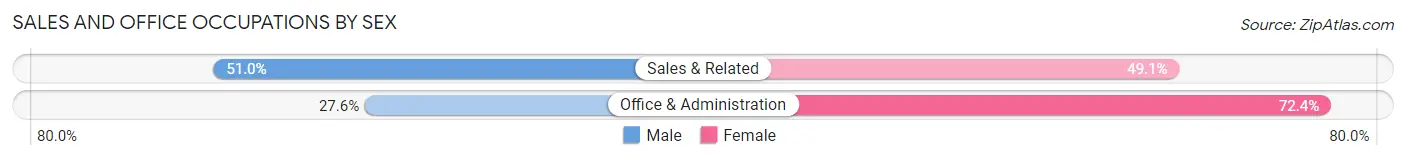
| Occupation | Male | Female |
| Sales & Related | 70,410 (50.9%) | 67,790 (49.0%) |
| Office & Administration | 46,763 (27.6%) | 122,477 (72.4%) |
| Total (Category) | 117,173 (38.1%) | 190,267 (61.9%) |
| Total (Overall) | 770,529 (54.5%) | 642,576 (45.5%) |
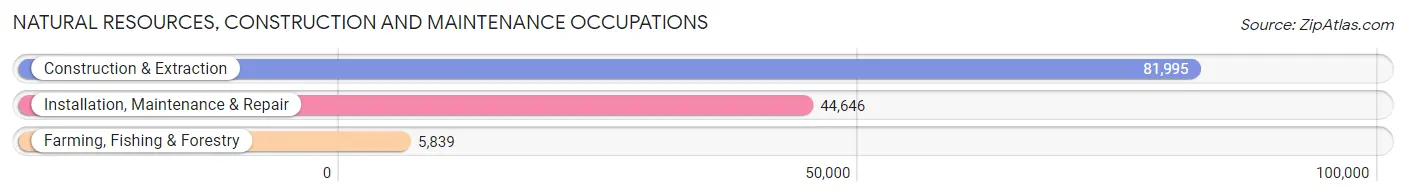
Natural Resources, Construction and Maintenance Occupations
The most common Natural Resources, Construction and Maintenance occupations in Area Code 909 are Construction & Extraction (81,995 | 5.8%), Installation, Maintenance & Repair (44,646 | 3.2%), and Farming, Fishing & Forestry (5,839 | 0.4%).
Natural Resources, Construction and Maintenance Occupations by Sex
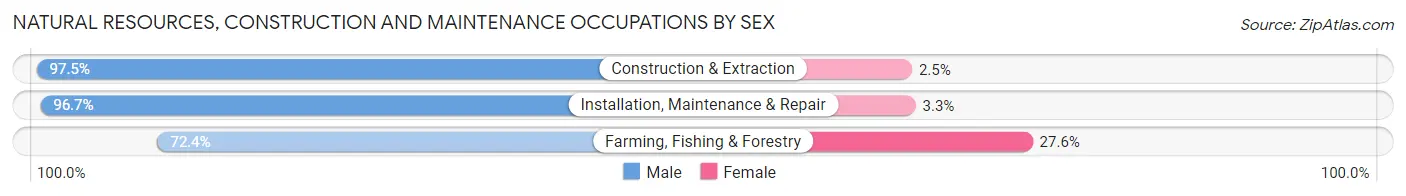
| Occupation | Male | Female |
| Farming, Fishing & Forestry | 4,226 (72.4%) | 1,613 (27.6%) |
| Construction & Extraction | 79,938 (97.5%) | 2,057 (2.5%) |
| Installation, Maintenance & Repair | 43,188 (96.7%) | 1,458 (3.3%) |
| Total (Category) | 127,352 (96.1%) | 5,128 (3.9%) |
| Total (Overall) | 770,529 (54.5%) | 642,576 (45.5%) |
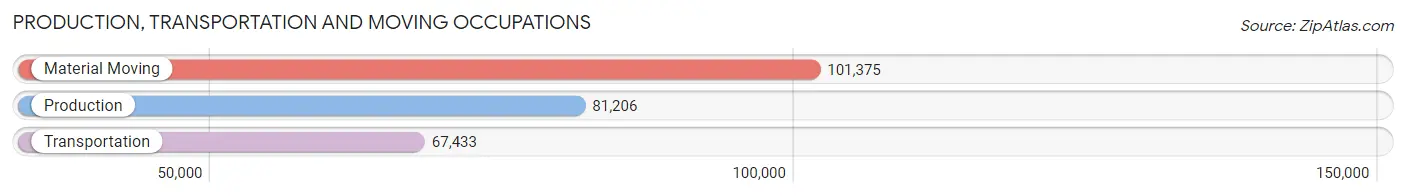
Production, Transportation and Moving Occupations
The most common Production, Transportation and Moving occupations in Area Code 909 are Material Moving (101,375 | 7.2%), Production (81,206 | 5.8%), and Transportation (67,433 | 4.8%).
Production, Transportation and Moving Occupations by Sex
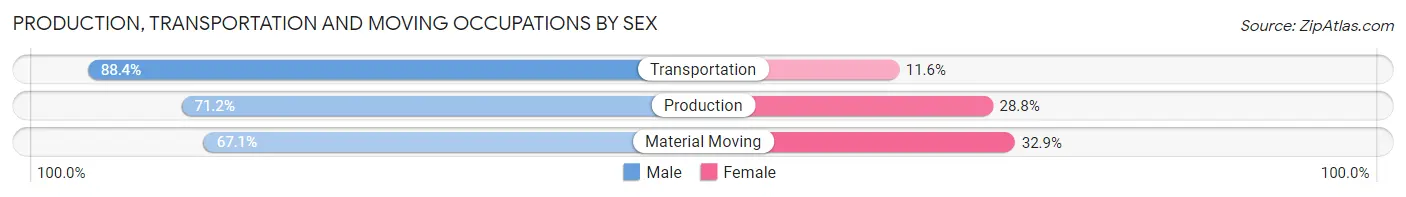
| Occupation | Male | Female |
| Production | 57,820 (71.2%) | 23,386 (28.8%) |
| Transportation | 59,601 (88.4%) | 7,832 (11.6%) |
| Material Moving | 68,029 (67.1%) | 33,346 (32.9%) |
| Total (Category) | 185,450 (74.2%) | 64,564 (25.8%) |
| Total (Overall) | 770,529 (54.5%) | 642,576 (45.5%) |
Employment Industries by Sex in Area Code 909
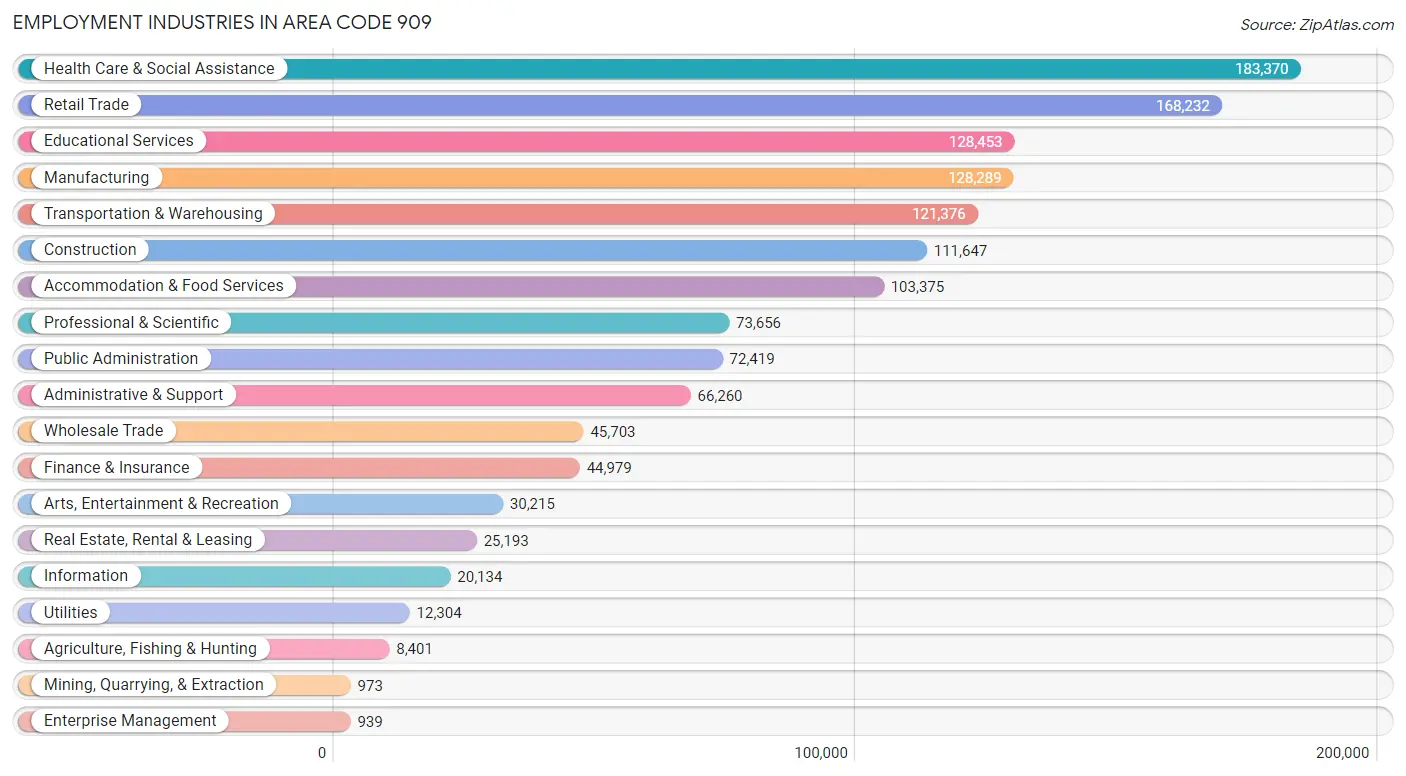
Employment Industries in Area Code 909
The major employment industries in Area Code 909 include Health Care & Social Assistance (183,370 | 13.0%), Retail Trade (168,232 | 11.9%), Educational Services (128,453 | 9.1%), Manufacturing (128,289 | 9.1%), and Transportation & Warehousing (121,376 | 8.6%).
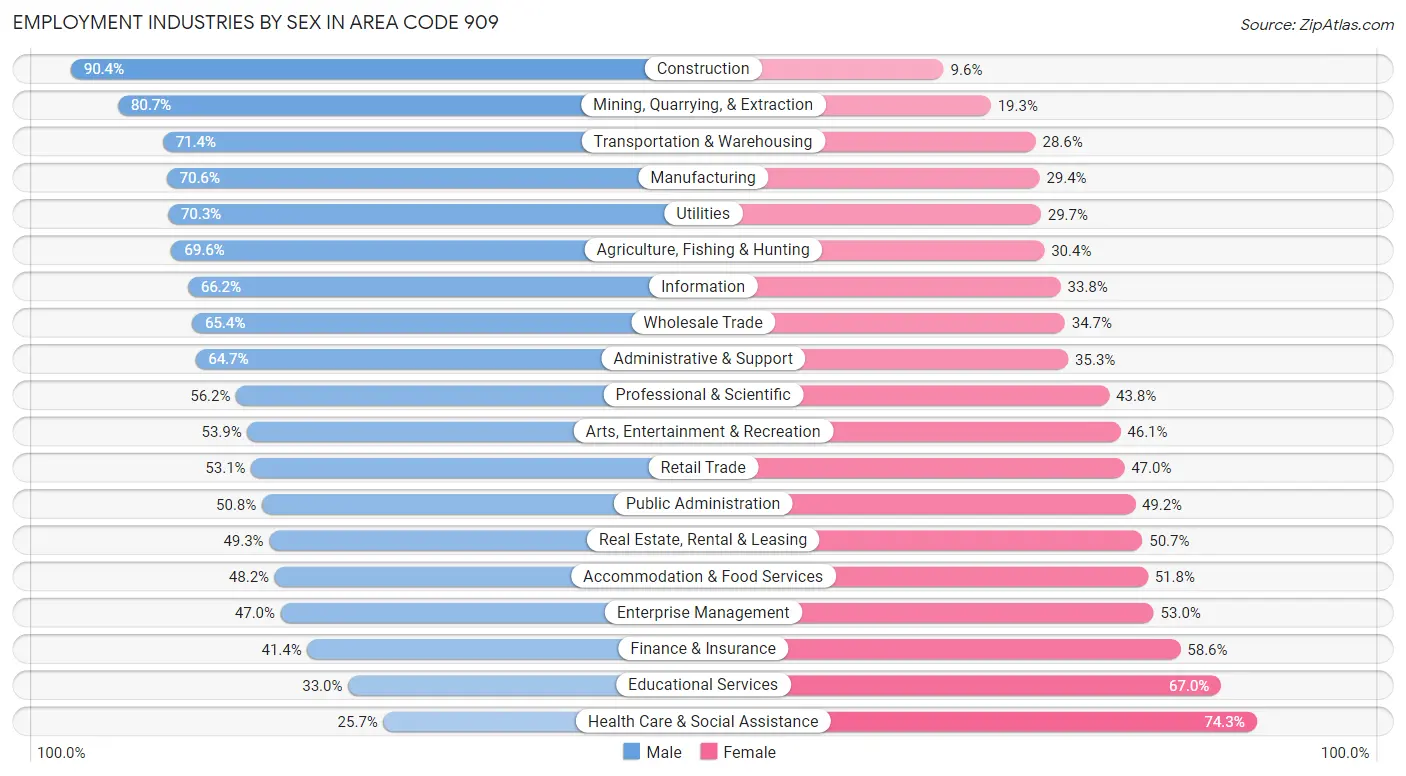
Employment Industries by Sex in Area Code 909
The Area Code 909 industries that see more men than women are Construction (90.4%), Mining, Quarrying, & Extraction (80.7%), and Transportation & Warehousing (71.4%), whereas the industries that tend to have a higher number of women are Health Care & Social Assistance (74.3%), Educational Services (67.0%), and Finance & Insurance (58.6%).
| Industry | Male | Female |
| Agriculture, Fishing & Hunting | 5,848 (69.6%) | 2,553 (30.4%) |
| Mining, Quarrying, & Extraction | 785 (80.7%) | 188 (19.3%) |
| Construction | 100,965 (90.4%) | 10,682 (9.6%) |
| Manufacturing | 90,568 (70.6%) | 37,721 (29.4%) |
| Wholesale Trade | 29,865 (65.3%) | 15,838 (34.6%) |
| Retail Trade | 89,240 (53.0%) | 78,992 (46.9%) |
| Transportation & Warehousing | 86,679 (71.4%) | 34,697 (28.6%) |
| Utilities | 8,652 (70.3%) | 3,652 (29.7%) |
| Information | 13,332 (66.2%) | 6,802 (33.8%) |
| Finance & Insurance | 18,635 (41.4%) | 26,344 (58.6%) |
| Real Estate, Rental & Leasing | 12,425 (49.3%) | 12,768 (50.7%) |
| Professional & Scientific | 41,378 (56.2%) | 32,278 (43.8%) |
| Enterprise Management | 441 (47.0%) | 498 (53.0%) |
| Administrative & Support | 42,845 (64.7%) | 23,415 (35.3%) |
| Educational Services | 42,395 (33.0%) | 86,058 (67.0%) |
| Health Care & Social Assistance | 47,096 (25.7%) | 136,274 (74.3%) |
| Arts, Entertainment & Recreation | 16,274 (53.9%) | 13,941 (46.1%) |
| Accommodation & Food Services | 49,815 (48.2%) | 53,560 (51.8%) |
| Public Administration | 36,815 (50.8%) | 35,604 (49.2%) |
| Total | 770,529 (54.5%) | 642,576 (45.5%) |
Education in Area Code 909
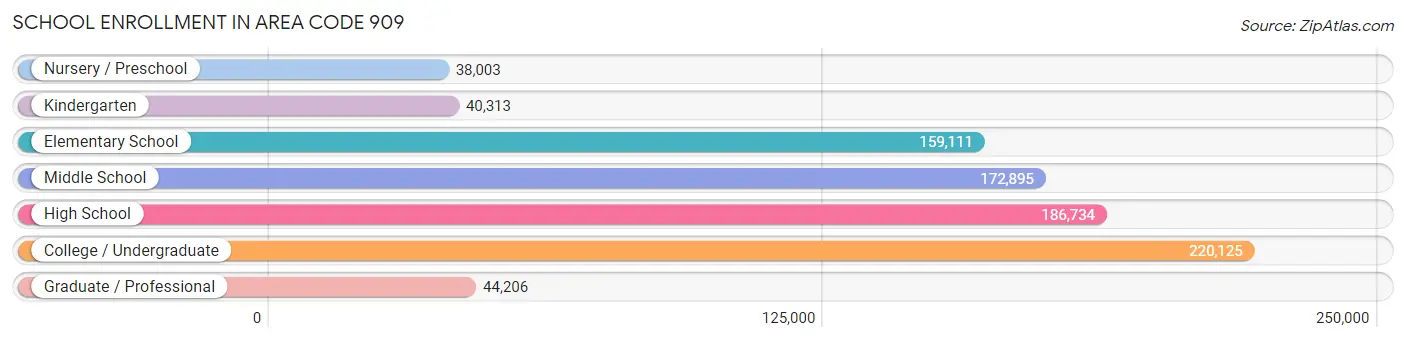
School Enrollment in Area Code 909
The most common levels of schooling among the 861,387 students in Area Code 909 are college / undergraduate (220,125 | 25.6%), high school (186,734 | 21.7%), and middle school (172,895 | 20.1%).
| School Level | # Students | % Students |
| Nursery / Preschool | 38,003 | 4.4% |
| Kindergarten | 40,313 | 4.7% |
| Elementary School | 159,111 | 18.5% |
| Middle School | 172,895 | 20.1% |
| High School | 186,734 | 21.7% |
| College / Undergraduate | 220,125 | 25.6% |
| Graduate / Professional | 44,206 | 5.1% |
| Total | 861,387 | 100.0% |
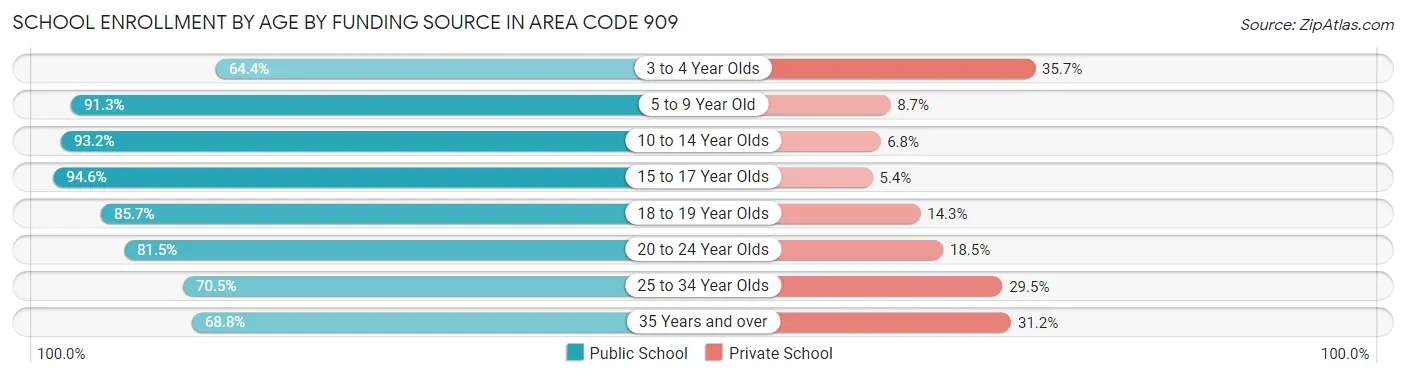
School Enrollment by Age by Funding Source in Area Code 909
Out of a total of 861,387 students who are enrolled in schools in Area Code 909, 113,528 (13.2%) attend a private institution, while the remaining 747,859 (86.8%) are enrolled in public schools. The age group of 3 to 4 year olds has the highest likelihood of being enrolled in private schools, with 10,631 (35.6% in the age bracket) enrolled. Conversely, the age group of 15 to 17 year olds has the lowest likelihood of being enrolled in a private school, with 123,476 (94.6% in the age bracket) attending a public institution.
| Age Bracket | Public School | Private School |
| 3 to 4 Year Olds | 19,192 (64.3%) | 10,631 (35.6%) |
| 5 to 9 Year Old | 173,651 (91.3%) | 16,514 (8.7%) |
| 10 to 14 Year Olds | 206,848 (93.2%) | 15,098 (6.8%) |
| 15 to 17 Year Olds | 123,476 (94.6%) | 7,009 (5.4%) |
| 18 to 19 Year Olds | 59,834 (85.7%) | 9,960 (14.3%) |
| 20 to 24 Year Olds | 82,877 (81.5%) | 18,821 (18.5%) |
| 25 to 34 Year Olds | 48,529 (70.5%) | 20,340 (29.5%) |
| 35 Years and over | 33,449 (68.8%) | 15,158 (31.2%) |
| Total | 747,859 (86.8%) | 113,528 (13.2%) |
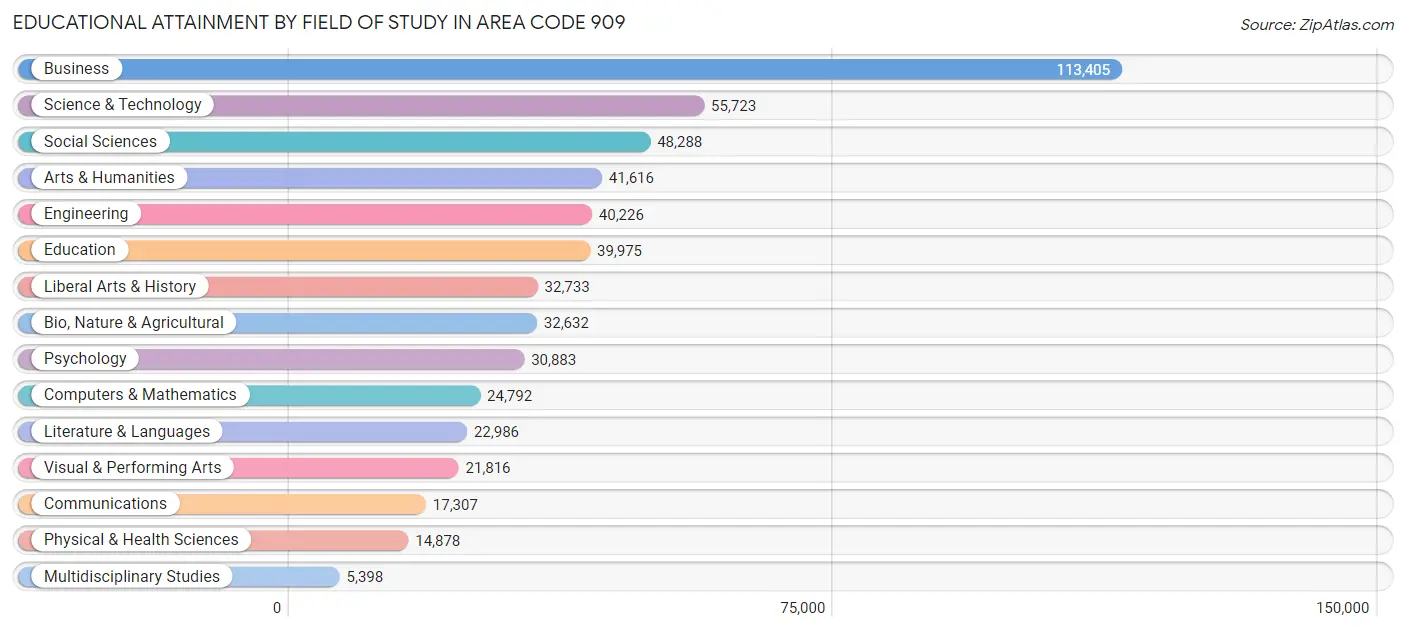
Educational Attainment by Field of Study in Area Code 909
Business (113,405 | 20.9%), science & technology (55,723 | 10.3%), social sciences (48,288 | 8.9%), arts & humanities (41,616 | 7.7%), and engineering (40,226 | 7.4%) are the most common fields of study among 542,658 individuals in Area Code 909 who have obtained a bachelor's degree or higher.
| Field of Study | # Graduates | % Graduates |
| Computers & Mathematics | 24,792 | 4.6% |
| Bio, Nature & Agricultural | 32,632 | 6.0% |
| Physical & Health Sciences | 14,878 | 2.7% |
| Psychology | 30,883 | 5.7% |
| Social Sciences | 48,288 | 8.9% |
| Engineering | 40,226 | 7.4% |
| Multidisciplinary Studies | 5,398 | 1.0% |
| Science & Technology | 55,723 | 10.3% |
| Business | 113,405 | 20.9% |
| Education | 39,975 | 7.4% |
| Literature & Languages | 22,986 | 4.2% |
| Liberal Arts & History | 32,733 | 6.0% |
| Visual & Performing Arts | 21,816 | 4.0% |
| Communications | 17,307 | 3.2% |
| Arts & Humanities | 41,616 | 7.7% |
| Total | 542,658 | 100.0% |
Transportation & Commute in Area Code 909
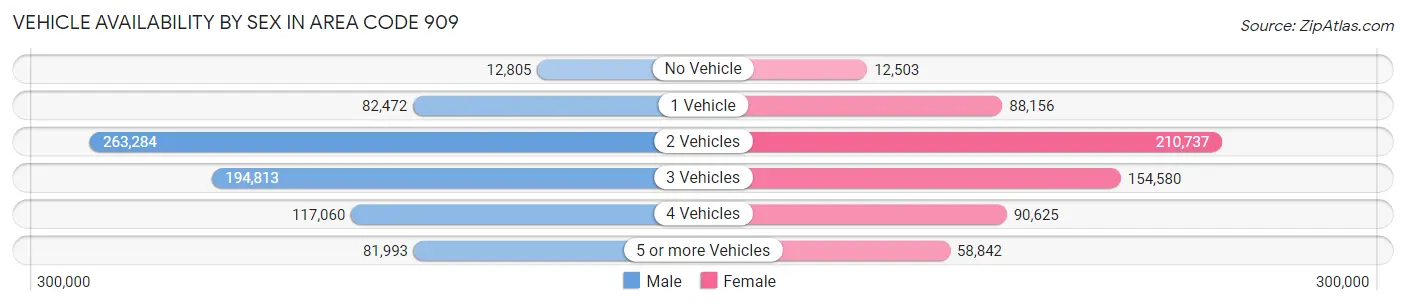
Vehicle Availability by Sex in Area Code 909
The most prevalent vehicle ownership categories in Area Code 909 are males with 2 vehicles (263,284, accounting for 35.0%) and females with 2 vehicles (210,737, making up 42.8%).
| Vehicles Available | Male | Female |
| No Vehicle | 12,805 (1.7%) | 12,503 (2.0%) |
| 1 Vehicle | 82,472 (11.0%) | 88,156 (14.3%) |
| 2 Vehicles | 263,284 (35.0%) | 210,737 (34.2%) |
| 3 Vehicles | 194,813 (25.9%) | 154,580 (25.1%) |
| 4 Vehicles | 117,060 (15.6%) | 90,625 (14.7%) |
| 5 or more Vehicles | 81,993 (10.9%) | 58,842 (9.6%) |
| Total | 752,427 (100.0%) | 615,443 (100.0%) |
Commute Time in Area Code 909
The most frequently occuring commute durations in Area Code 909 are 30 to 34 minutes (181,578 commuters, 14.5%), 15 to 19 minutes (172,419 commuters, 13.8%), and 20 to 24 minutes (172,402 commuters, 13.8%).
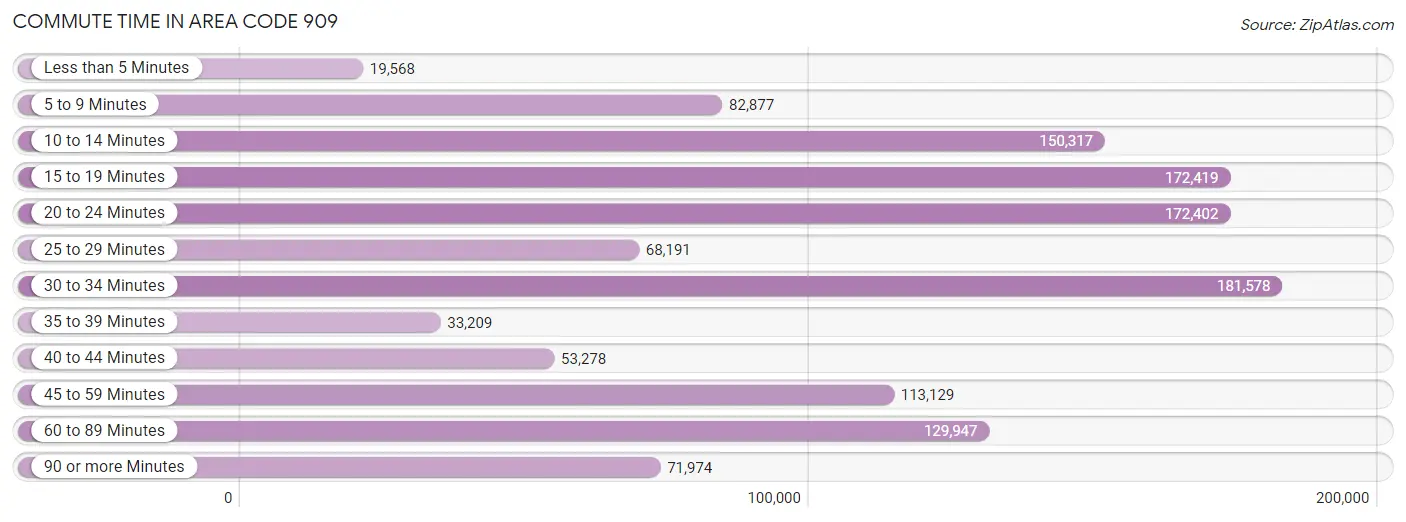
| Commute Time | # Commuters | % Commuters |
| Less than 5 Minutes | 19,568 | 1.6% |
| 5 to 9 Minutes | 82,877 | 6.6% |
| 10 to 14 Minutes | 150,317 | 12.0% |
| 15 to 19 Minutes | 172,419 | 13.8% |
| 20 to 24 Minutes | 172,402 | 13.8% |
| 25 to 29 Minutes | 68,191 | 5.5% |
| 30 to 34 Minutes | 181,578 | 14.5% |
| 35 to 39 Minutes | 33,209 | 2.7% |
| 40 to 44 Minutes | 53,278 | 4.3% |
| 45 to 59 Minutes | 113,129 | 9.1% |
| 60 to 89 Minutes | 129,947 | 10.4% |
| 90 or more Minutes | 71,974 | 5.8% |
Commute Time by Sex in Area Code 909
The most common commute times in Area Code 909 are 30 to 34 minutes (102,077 commuters, 14.7%) for males and 15 to 19 minutes (83,253 commuters, 15.0%) for females.
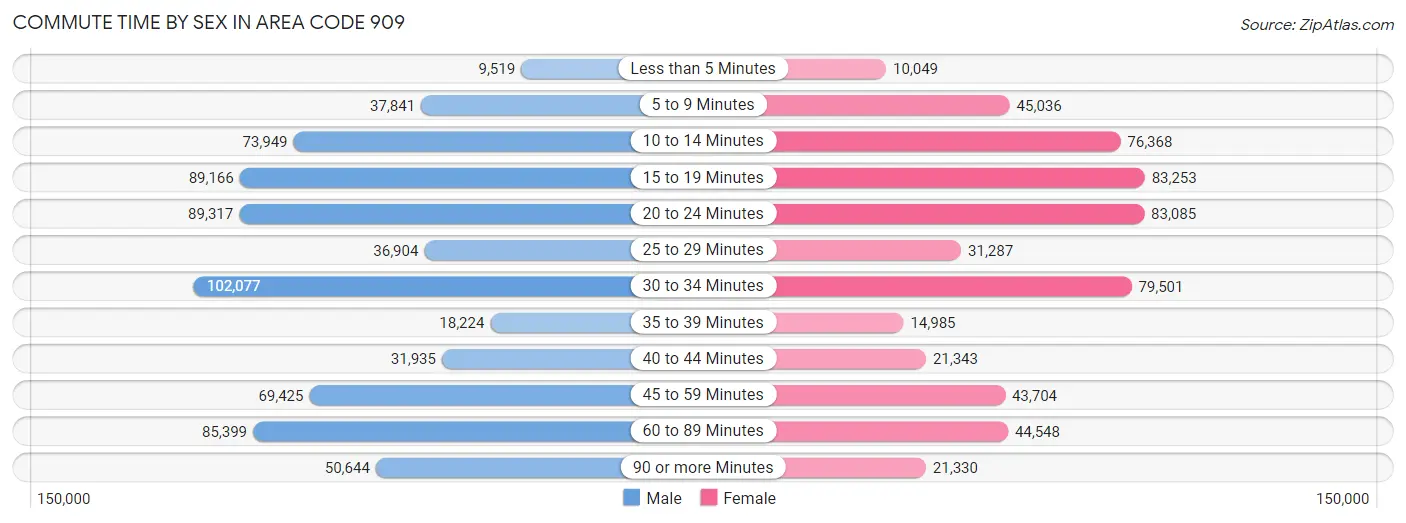
| Commute Time | Male | Female |
| Less than 5 Minutes | 9,519 (1.4%) | 10,049 (1.8%) |
| 5 to 9 Minutes | 37,841 (5.4%) | 45,036 (8.1%) |
| 10 to 14 Minutes | 73,949 (10.6%) | 76,368 (13.8%) |
| 15 to 19 Minutes | 89,166 (12.8%) | 83,253 (15.0%) |
| 20 to 24 Minutes | 89,317 (12.9%) | 83,085 (15.0%) |
| 25 to 29 Minutes | 36,904 (5.3%) | 31,287 (5.6%) |
| 30 to 34 Minutes | 102,077 (14.7%) | 79,501 (14.3%) |
| 35 to 39 Minutes | 18,224 (2.6%) | 14,985 (2.7%) |
| 40 to 44 Minutes | 31,935 (4.6%) | 21,343 (3.8%) |
| 45 to 59 Minutes | 69,425 (10.0%) | 43,704 (7.9%) |
| 60 to 89 Minutes | 85,399 (12.3%) | 44,548 (8.0%) |
| 90 or more Minutes | 50,644 (7.3%) | 21,330 (3.8%) |
Time of Departure to Work by Sex in Area Code 909
The most frequent times of departure to work in Area Code 909 are 12:00 AM to 4:59 AM (99,506, 14.3%) for males and 7:00 AM to 7:29 AM (79,529, 14.3%) for females.
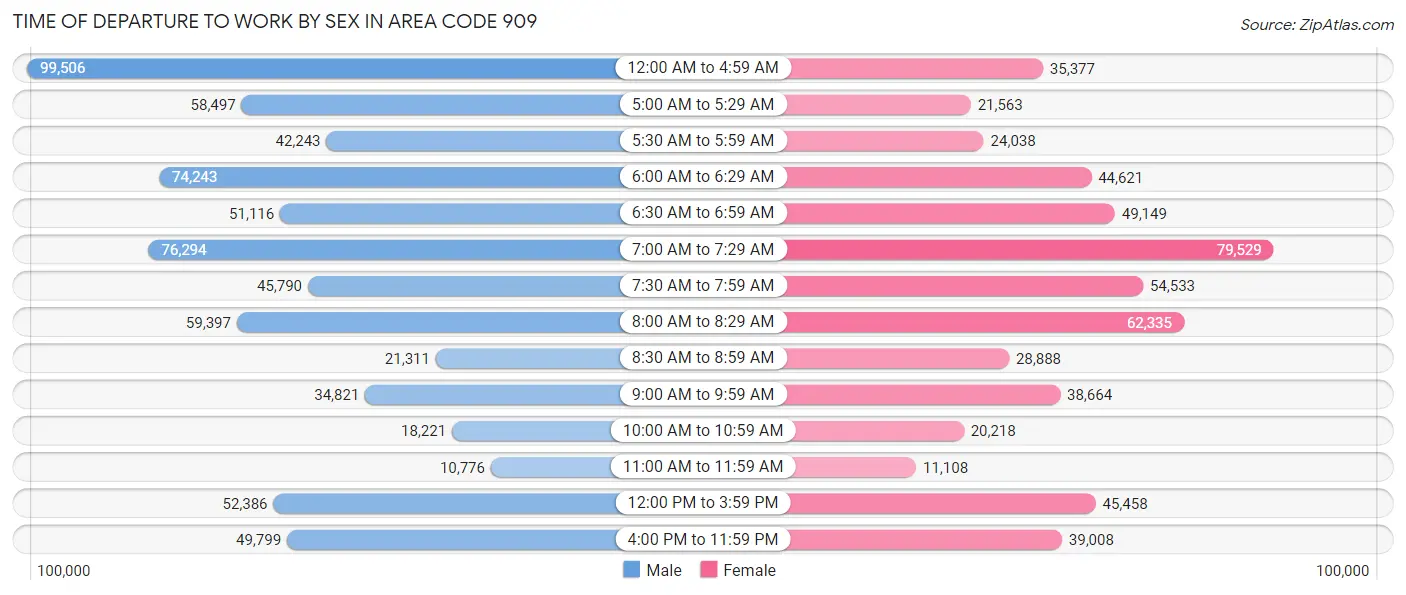
| Time of Departure | Male | Female |
| 12:00 AM to 4:59 AM | 99,506 (14.3%) | 35,377 (6.4%) |
| 5:00 AM to 5:29 AM | 58,497 (8.4%) | 21,563 (3.9%) |
| 5:30 AM to 5:59 AM | 42,243 (6.1%) | 24,038 (4.3%) |
| 6:00 AM to 6:29 AM | 74,243 (10.7%) | 44,621 (8.1%) |
| 6:30 AM to 6:59 AM | 51,116 (7.4%) | 49,149 (8.9%) |
| 7:00 AM to 7:29 AM | 76,294 (11.0%) | 79,529 (14.3%) |
| 7:30 AM to 7:59 AM | 45,790 (6.6%) | 54,533 (9.8%) |
| 8:00 AM to 8:29 AM | 59,397 (8.6%) | 62,335 (11.2%) |
| 8:30 AM to 8:59 AM | 21,311 (3.1%) | 28,888 (5.2%) |
| 9:00 AM to 9:59 AM | 34,821 (5.0%) | 38,664 (7.0%) |
| 10:00 AM to 10:59 AM | 18,221 (2.6%) | 20,218 (3.6%) |
| 11:00 AM to 11:59 AM | 10,776 (1.5%) | 11,108 (2.0%) |
| 12:00 PM to 3:59 PM | 52,386 (7.5%) | 45,458 (8.2%) |
| 4:00 PM to 11:59 PM | 49,799 (7.2%) | 39,008 (7.0%) |
| Total | 694,400 (100.0%) | 554,489 (100.0%) |
Housing Occupancy in Area Code 909
Occupancy by Ownership in Area Code 909
Of the total 908,771 dwellings in Area Code 909, owner-occupied units account for 556,736 (61.3%), while renter-occupied units make up 352,035 (38.7%).
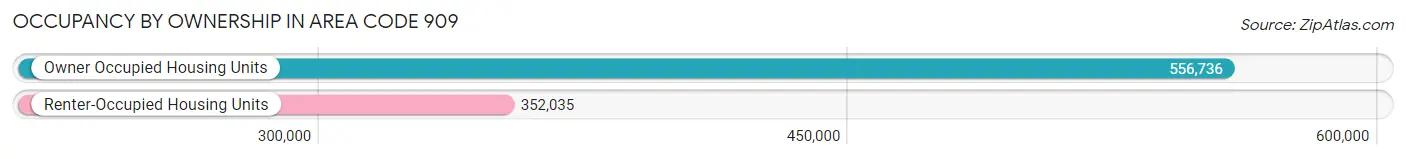
| Occupancy | # Housing Units | % Housing Units |
| Owner Occupied Housing Units | 556,736 | 61.3% |
| Renter-Occupied Housing Units | 352,035 | 38.7% |
| Total Occupied Housing Units | 908,771 | 100.0% |
Occupancy by Household Size in Area Code 909
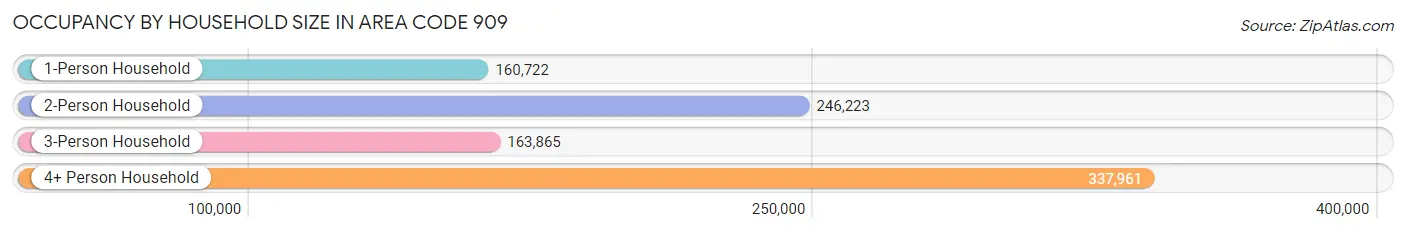
| Household Size | # Housing Units | % Housing Units |
| 1-Person Household | 160,722 | 17.7% |
| 2-Person Household | 246,223 | 27.1% |
| 3-Person Household | 163,865 | 18.0% |
| 4+ Person Household | 337,961 | 37.2% |
| Total Housing Units | 908,771 | 100.0% |
Occupancy by Ownership by Household Size in Area Code 909
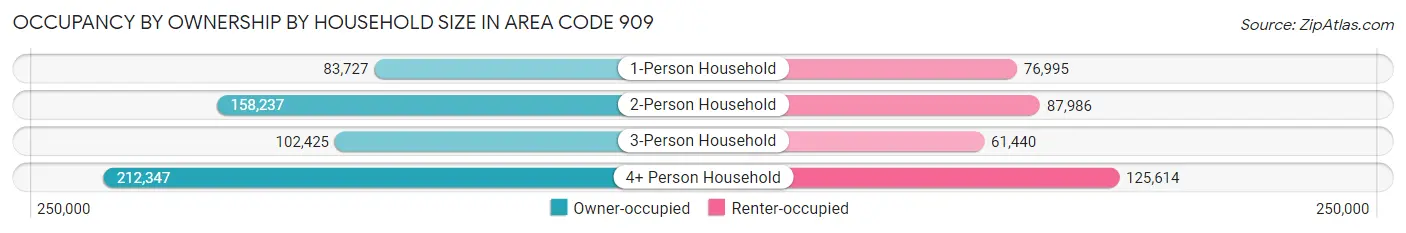
| Household Size | Owner-occupied | Renter-occupied |
| 1-Person Household | 83,727 (52.1%) | 76,995 (47.9%) |
| 2-Person Household | 158,237 (64.3%) | 87,986 (35.7%) |
| 3-Person Household | 102,425 (62.5%) | 61,440 (37.5%) |
| 4+ Person Household | 212,347 (62.8%) | 125,614 (37.2%) |
| Total Housing Units | 556,736 (61.3%) | 352,035 (38.7%) |
Occupancy by Educational Attainment in Area Code 909
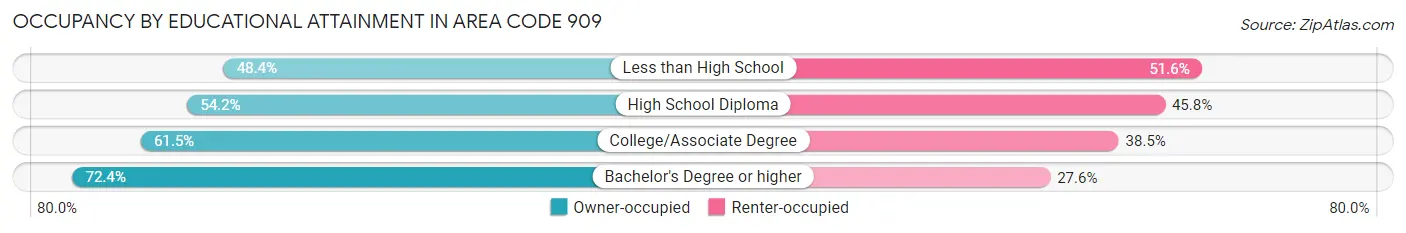
| Household Size | Owner-occupied | Renter-occupied |
| Less than High School | 64,708 (48.4%) | 68,960 (51.6%) |
| High School Diploma | 107,205 (54.2%) | 90,633 (45.8%) |
| College/Associate Degree | 187,560 (61.5%) | 117,200 (38.5%) |
| Bachelor's Degree or higher | 197,263 (72.4%) | 75,242 (27.6%) |
Occupancy by Age of Householder in Area Code 909
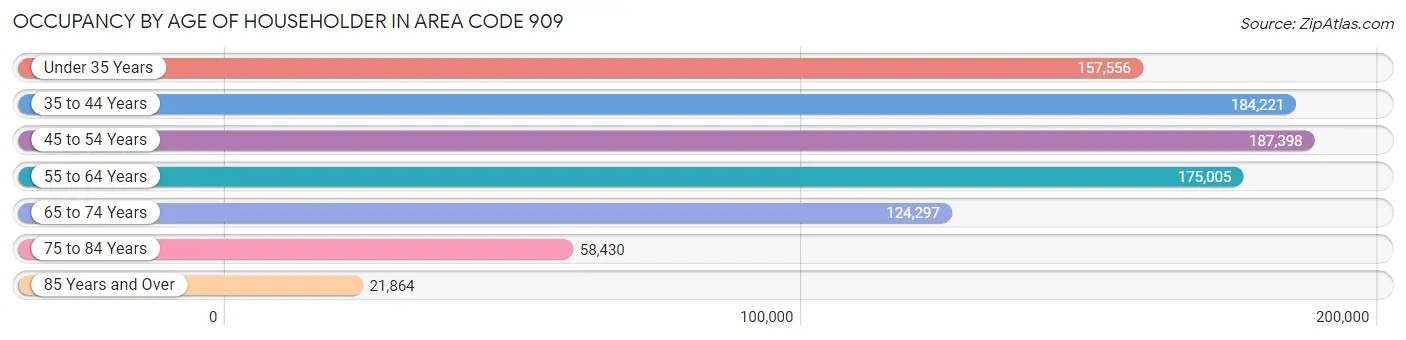
| Age Bracket | # Households | % Households |
| Under 35 Years | 157,556 | 17.3% |
| 35 to 44 Years | 184,221 | 20.3% |
| 45 to 54 Years | 187,398 | 20.6% |
| 55 to 64 Years | 175,005 | 19.3% |
| 65 to 74 Years | 124,297 | 13.7% |
| 75 to 84 Years | 58,430 | 6.4% |
| 85 Years and Over | 21,864 | 2.4% |
| Total | 908,771 | 100.0% |
Housing Finances in Area Code 909
Median Income by Occupancy in Area Code 909
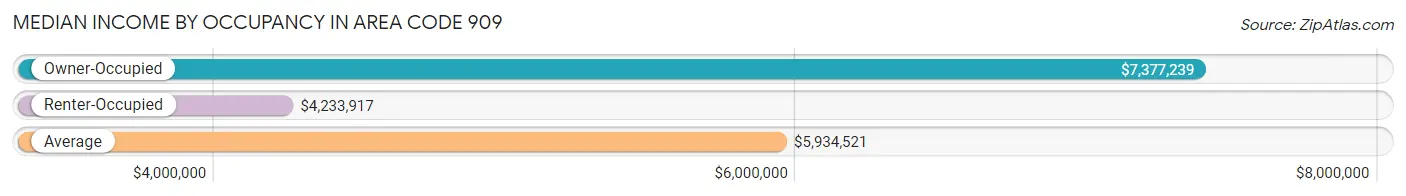
| Occupancy Type | # Households | Median Income |
| Owner-Occupied | 556,736 (61.3%) | $7,377,239 |
| Renter-Occupied | 352,035 (38.7%) | $4,233,917 |
| Average | 908,771 (100.0%) | $5,934,521 |
Occupancy by Householder Income Bracket in Area Code 909
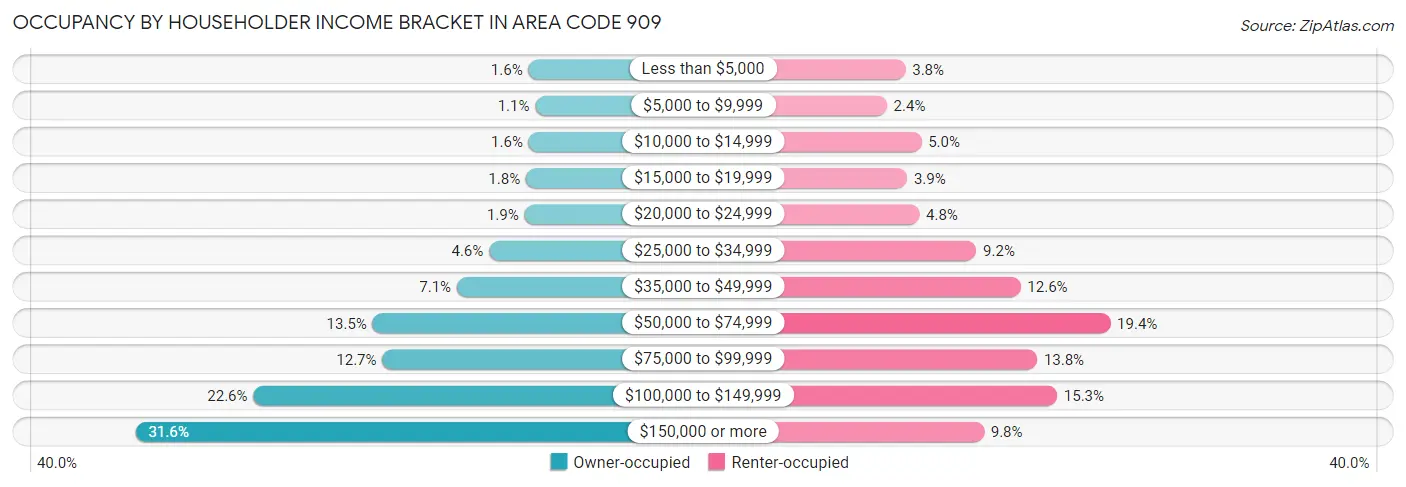
| Income Bracket | Owner-occupied | Renter-occupied |
| Less than $5,000 | 8,964 (1.6%) | 13,343 (3.8%) |
| $5,000 to $9,999 | 6,059 (1.1%) | 8,353 (2.4%) |
| $10,000 to $14,999 | 8,872 (1.6%) | 17,608 (5.0%) |
| $15,000 to $19,999 | 9,998 (1.8%) | 13,785 (3.9%) |
| $20,000 to $24,999 | 10,616 (1.9%) | 17,043 (4.8%) |
| $25,000 to $34,999 | 25,647 (4.6%) | 32,355 (9.2%) |
| $35,000 to $49,999 | 39,296 (7.1%) | 44,224 (12.6%) |
| $50,000 to $74,999 | 75,038 (13.5%) | 68,288 (19.4%) |
| $75,000 to $99,999 | 70,932 (12.7%) | 48,638 (13.8%) |
| $100,000 to $149,999 | 125,678 (22.6%) | 54,008 (15.3%) |
| $150,000 or more | 175,636 (31.6%) | 34,390 (9.8%) |
| Total | 556,736 (100.0%) | 352,035 (100.0%) |
Monthly Housing Cost Tiers in Area Code 909
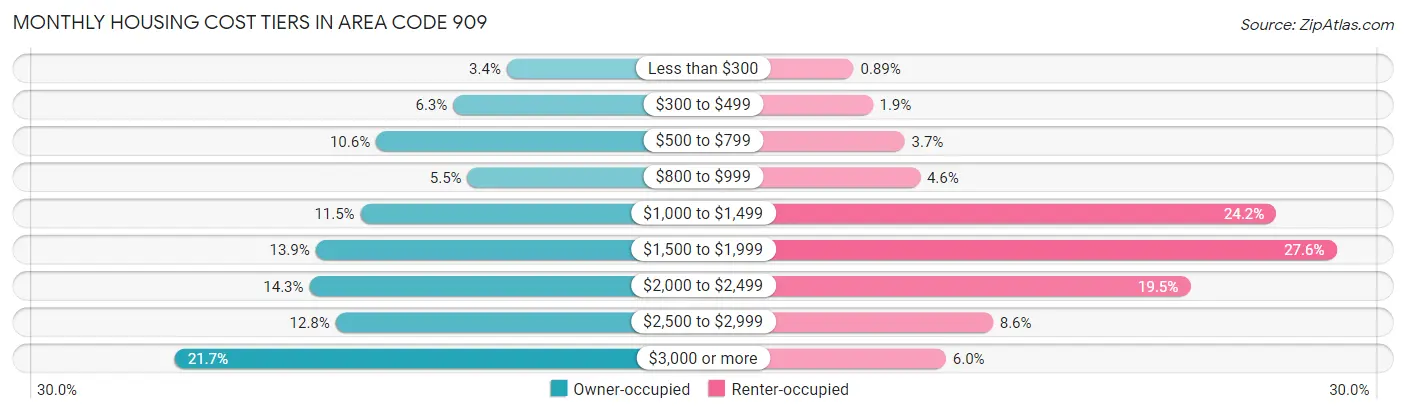
| Monthly Cost | Owner-occupied | Renter-occupied |
| Less than $300 | 18,763 (3.4%) | 3,145 (0.9%) |
| $300 to $499 | 35,219 (6.3%) | 6,832 (1.9%) |
| $500 to $799 | 58,970 (10.6%) | 13,059 (3.7%) |
| $800 to $999 | 30,866 (5.5%) | 16,037 (4.6%) |
| $1,000 to $1,499 | 63,746 (11.5%) | 85,293 (24.2%) |
| $1,500 to $1,999 | 77,563 (13.9%) | 96,975 (27.6%) |
| $2,000 to $2,499 | 79,452 (14.3%) | 68,580 (19.5%) |
| $2,500 to $2,999 | 71,363 (12.8%) | 30,217 (8.6%) |
| $3,000 or more | 120,794 (21.7%) | 21,088 (6.0%) |
| Total | 556,736 (100.0%) | 352,035 (100.0%) |
Physical Housing Characteristics in Area Code 909
Housing Structures in Area Code 909
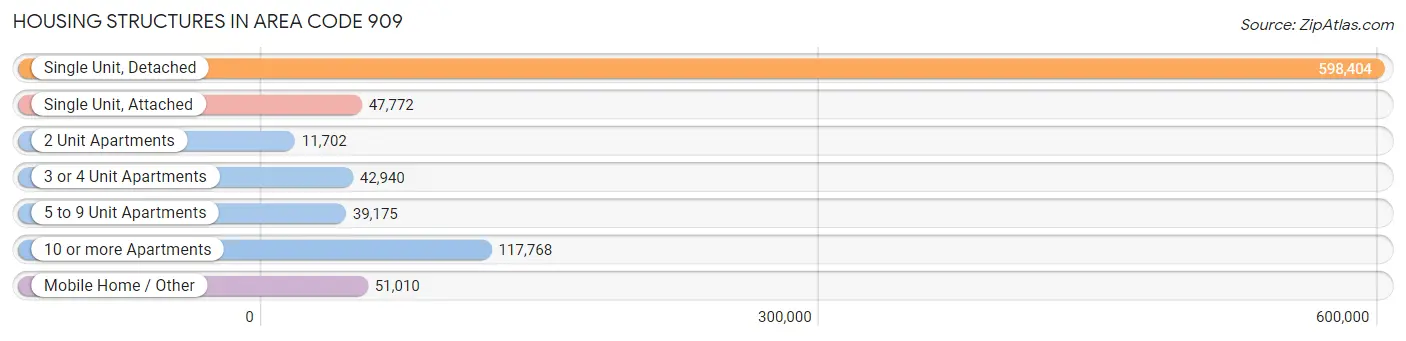
| Structure Type | # Housing Units | % Housing Units |
| Single Unit, Detached | 598,404 | 65.8% |
| Single Unit, Attached | 47,772 | 5.3% |
| 2 Unit Apartments | 11,702 | 1.3% |
| 3 or 4 Unit Apartments | 42,940 | 4.7% |
| 5 to 9 Unit Apartments | 39,175 | 4.3% |
| 10 or more Apartments | 117,768 | 13.0% |
| Mobile Home / Other | 51,010 | 5.6% |
| Total | 908,771 | 100.0% |
Housing Structures by Occupancy in Area Code 909
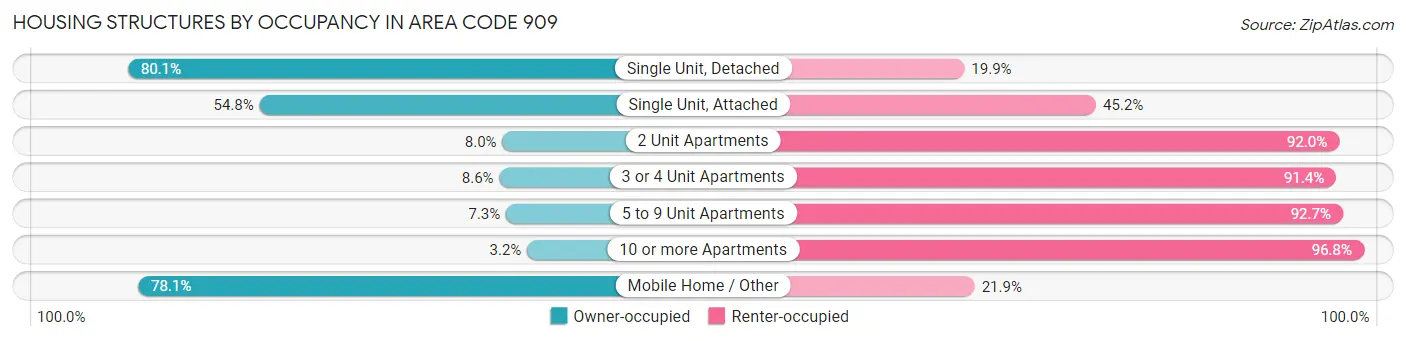
| Structure Type | Owner-occupied | Renter-occupied |
| Single Unit, Detached | 479,441 (80.1%) | 118,963 (19.9%) |
| Single Unit, Attached | 26,160 (54.8%) | 21,612 (45.2%) |
| 2 Unit Apartments | 936 (8.0%) | 10,766 (92.0%) |
| 3 or 4 Unit Apartments | 3,685 (8.6%) | 39,255 (91.4%) |
| 5 to 9 Unit Apartments | 2,854 (7.3%) | 36,321 (92.7%) |
| 10 or more Apartments | 3,801 (3.2%) | 113,967 (96.8%) |
| Mobile Home / Other | 39,859 (78.1%) | 11,151 (21.9%) |
| Total | 556,736 (61.3%) | 352,035 (38.7%) |
Housing Structures by Number of Rooms in Area Code 909
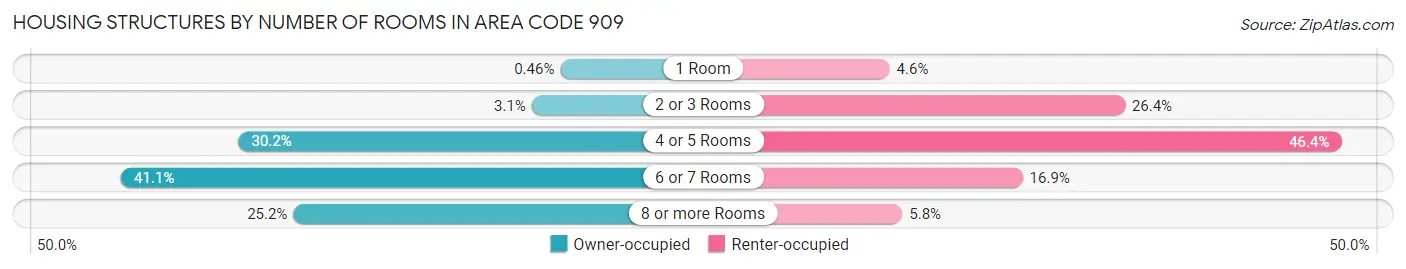
| Number of Rooms | Owner-occupied | Renter-occupied |
| 1 Room | 2,554 (0.5%) | 16,208 (4.6%) |
| 2 or 3 Rooms | 17,259 (3.1%) | 92,796 (26.4%) |
| 4 or 5 Rooms | 168,239 (30.2%) | 163,221 (46.4%) |
| 6 or 7 Rooms | 228,630 (41.1%) | 59,495 (16.9%) |
| 8 or more Rooms | 140,054 (25.2%) | 20,315 (5.8%) |
| Total | 556,736 (100.0%) | 352,035 (100.0%) |
Housing Structure by Heating Type in Area Code 909
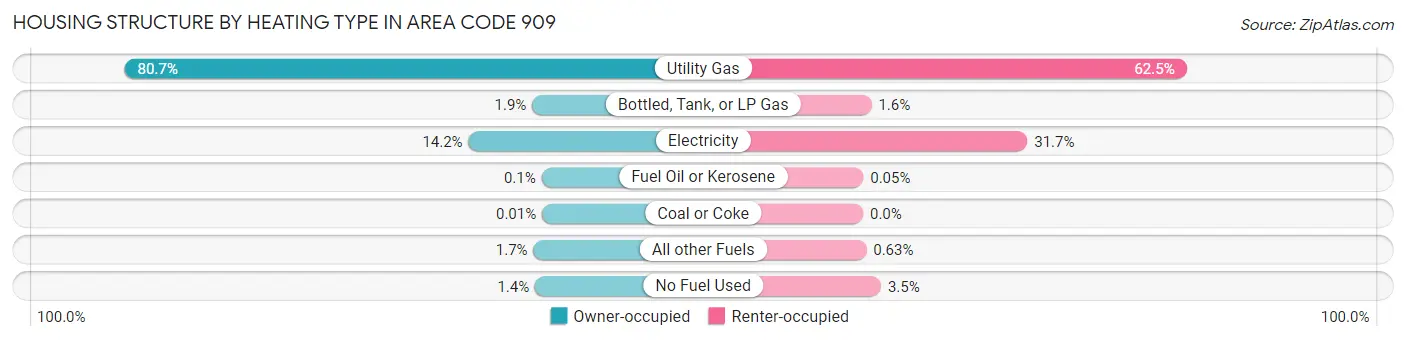
| Heating Type | Owner-occupied | Renter-occupied |
| Utility Gas | 449,192 (80.7%) | 219,996 (62.5%) |
| Bottled, Tank, or LP Gas | 10,710 (1.9%) | 5,719 (1.6%) |
| Electricity | 79,232 (14.2%) | 111,745 (31.7%) |
| Fuel Oil or Kerosene | 543 (0.1%) | 185 (0.1%) |
| Coal or Coke | 43 (0.0%) | 14 (0.0%) |
| All other Fuels | 9,365 (1.7%) | 2,201 (0.6%) |
| No Fuel Used | 7,651 (1.4%) | 12,175 (3.5%) |
| Total | 556,736 (100.0%) | 352,035 (100.0%) |
Household Vehicle Usage in Area Code 909
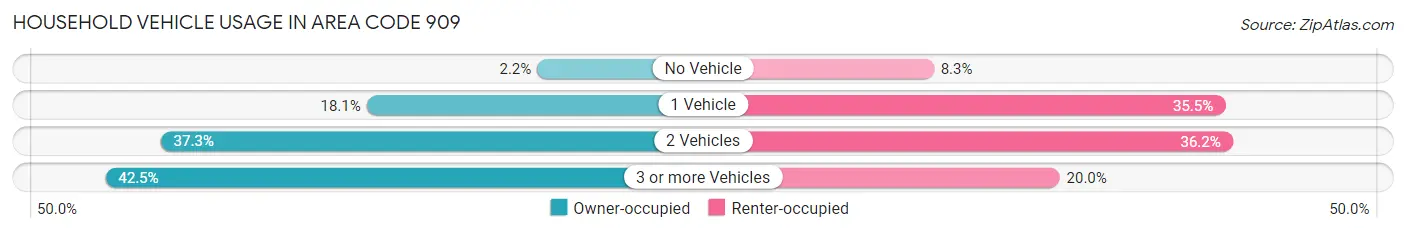
| Vehicles per Household | Owner-occupied | Renter-occupied |
| No Vehicle | 12,029 (2.2%) | 29,188 (8.3%) |
| 1 Vehicle | 100,656 (18.1%) | 124,903 (35.5%) |
| 2 Vehicles | 207,663 (37.3%) | 127,381 (36.2%) |
| 3 or more Vehicles | 236,388 (42.5%) | 70,563 (20.0%) |
| Total | 556,736 (100.0%) | 352,035 (100.0%) |
Real Estate & Mortgages in Area Code 909
Real Estate and Mortgage Overview in Area Code 909
| Characteristic | Without Mortgage | With Mortgage |
| Housing Units | 160,435 | 396,301 |
| Median Property Value | $32,753,199 | $37,464,800 |
| Median Household Income | $5,240,792 | $145,461 |
| Monthly Housing Costs | $45,336 | $120,112 |
| Real Estate Taxes | $204,619 | $7,043 |
Property Value by Mortgage Status in Area Code 909
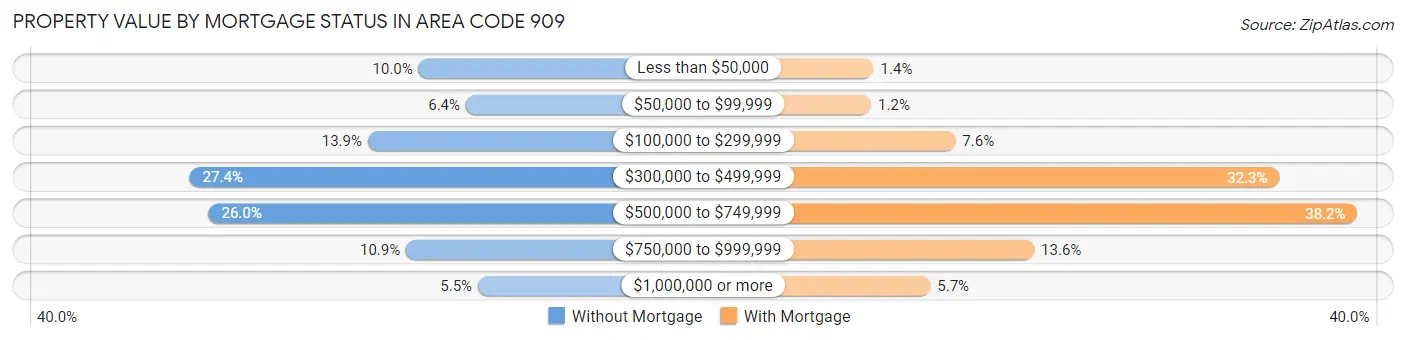
| Property Value | Without Mortgage | With Mortgage |
| Less than $50,000 | 16,016 (10.0%) | 5,465 (1.4%) |
| $50,000 to $99,999 | 10,228 (6.4%) | 4,732 (1.2%) |
| $100,000 to $299,999 | 22,215 (13.9%) | 30,165 (7.6%) |
| $300,000 to $499,999 | 43,988 (27.4%) | 127,910 (32.3%) |
| $500,000 to $749,999 | 41,685 (26.0%) | 151,513 (38.2%) |
| $750,000 to $999,999 | 17,544 (10.9%) | 53,940 (13.6%) |
| $1,000,000 or more | 8,759 (5.5%) | 22,576 (5.7%) |
| Total | 160,435 (100.0%) | 396,301 (100.0%) |
Household Income by Mortgage Status in Area Code 909
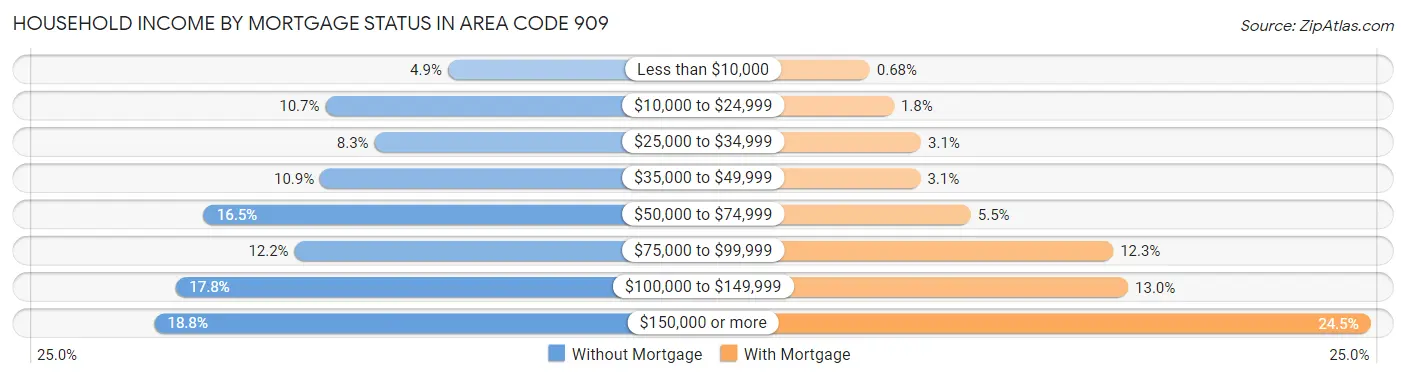
| Household Income | Without Mortgage | With Mortgage |
| Less than $10,000 | 7,789 (4.9%) | 2,696 (0.7%) |
| $10,000 to $24,999 | 17,139 (10.7%) | 7,234 (1.8%) |
| $25,000 to $34,999 | 13,382 (8.3%) | 12,347 (3.1%) |
| $35,000 to $49,999 | 17,539 (10.9%) | 12,265 (3.1%) |
| $50,000 to $74,999 | 26,405 (16.5%) | 21,757 (5.5%) |
| $75,000 to $99,999 | 19,499 (12.1%) | 48,633 (12.3%) |
| $100,000 to $149,999 | 28,507 (17.8%) | 51,433 (13.0%) |
| $150,000 or more | 30,175 (18.8%) | 97,171 (24.5%) |
| Total | 160,435 (100.0%) | 396,301 (100.0%) |
Property Value to Household Income Ratio in Area Code 909
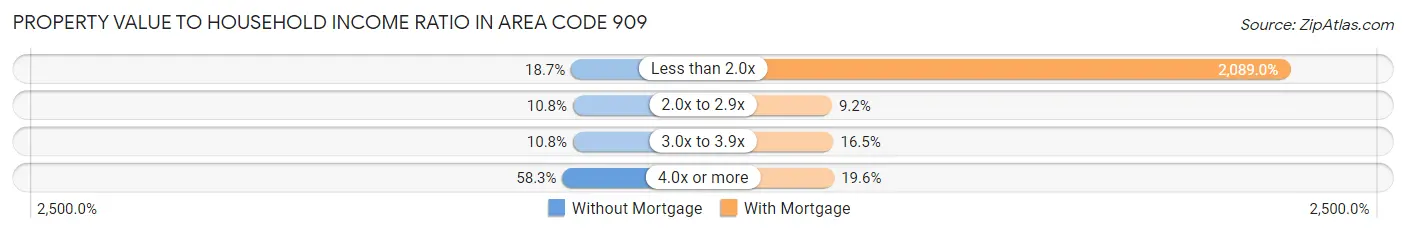
| Value-to-Income Ratio | Without Mortgage | With Mortgage |
| Less than 2.0x | 30,000 (18.7%) | 8,278,843 (2,089.0%) |
| 2.0x to 2.9x | 17,378 (10.8%) | 36,356 (9.2%) |
| 3.0x to 3.9x | 17,260 (10.8%) | 65,216 (16.5%) |
| 4.0x or more | 93,525 (58.3%) | 77,481 (19.6%) |
| Total | 160,435 (100.0%) | 396,301 (100.0%) |
Real Estate Taxes by Mortgage Status in Area Code 909
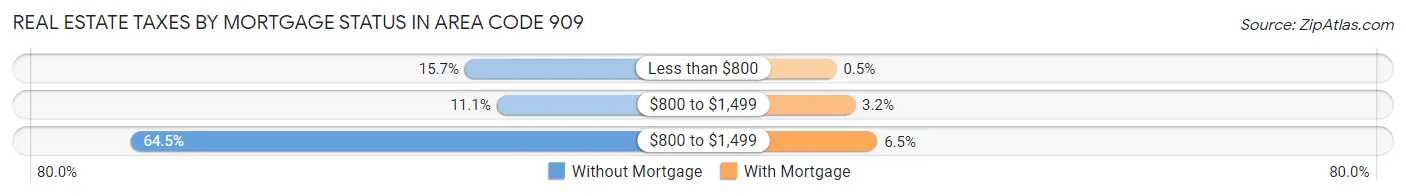
| Property Taxes | Without Mortgage | With Mortgage |
| Less than $800 | 25,153 (15.7%) | 1,964 (0.5%) |
| $800 to $1,499 | 17,733 (11.1%) | 12,801 (3.2%) |
| $800 to $1,499 | 103,518 (64.5%) | 25,552 (6.5%) |
| Total | 160,435 (100.0%) | 396,301 (100.0%) |
Health & Disability in Area Code 909
Health Insurance Coverage by Age in Area Code 909
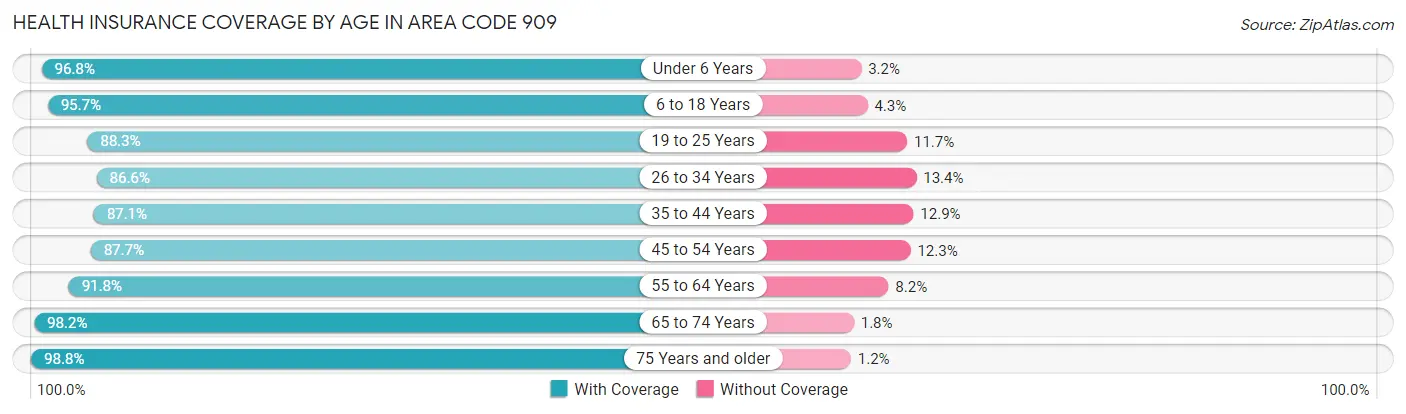
| Age Bracket | With Coverage | Without Coverage |
| Under 6 Years | 221,175 (96.8%) | 7,218 (3.2%) |
| 6 to 18 Years | 546,890 (95.7%) | 24,681 (4.3%) |
| 19 to 25 Years | 276,978 (88.3%) | 36,695 (11.7%) |
| 26 to 34 Years | 346,201 (86.6%) | 53,697 (13.4%) |
| 35 to 44 Years | 350,018 (87.1%) | 51,802 (12.9%) |
| 45 to 54 Years | 333,255 (87.7%) | 46,928 (12.3%) |
| 55 to 64 Years | 310,568 (91.8%) | 27,852 (8.2%) |
| 65 to 74 Years | 225,685 (98.2%) | 4,076 (1.8%) |
| 75 Years and older | 143,374 (98.8%) | 1,766 (1.2%) |
| Total | 2,754,144 (91.5%) | 254,715 (8.5%) |
Health Insurance Coverage by Citizenship Status in Area Code 909
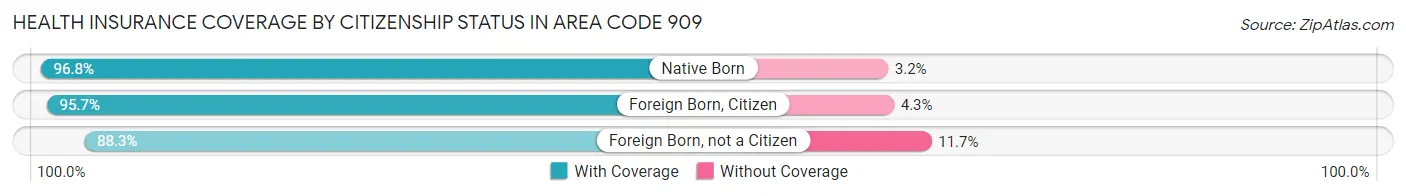
| Citizenship Status | With Coverage | Without Coverage |
| Native Born | 221,175 (96.8%) | 7,218 (3.2%) |
| Foreign Born, Citizen | 546,890 (95.7%) | 24,681 (4.3%) |
| Foreign Born, not a Citizen | 276,978 (88.3%) | 36,695 (11.7%) |
Health Insurance Coverage by Household Income in Area Code 909
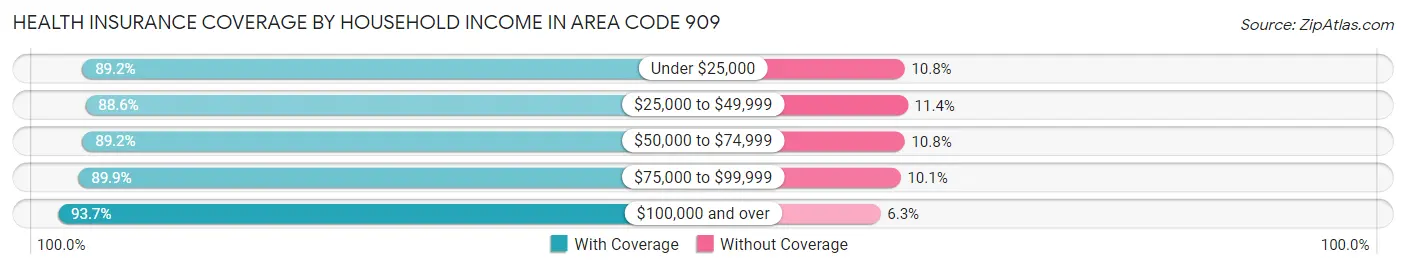
| Household Income | With Coverage | Without Coverage |
| Under $25,000 | 218,196 (89.2%) | 26,406 (10.8%) |
| $25,000 to $49,999 | 344,312 (88.6%) | 44,286 (11.4%) |
| $50,000 to $74,999 | 397,260 (89.2%) | 48,170 (10.8%) |
| $75,000 to $99,999 | 364,030 (89.9%) | 40,705 (10.1%) |
| $100,000 and over | 1,392,648 (93.7%) | 93,367 (6.3%) |
Public vs Private Health Insurance Coverage by Age in Area Code 909
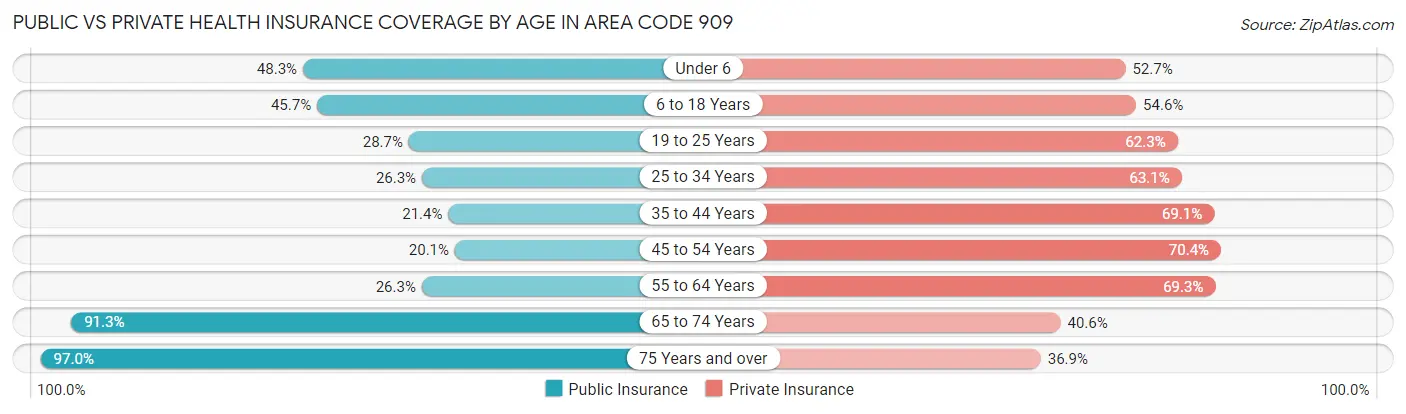
| Age Bracket | Public Insurance | Private Insurance |
| Under 6 | 110,416 (48.3%) | 120,274 (52.7%) |
| 6 to 18 Years | 261,359 (45.7%) | 312,292 (54.6%) |
| 19 to 25 Years | 89,970 (28.7%) | 195,414 (62.3%) |
| 25 to 34 Years | 104,989 (26.3%) | 252,191 (63.1%) |
| 35 to 44 Years | 85,778 (21.3%) | 277,596 (69.1%) |
| 45 to 54 Years | 76,562 (20.1%) | 267,498 (70.4%) |
| 55 to 64 Years | 88,964 (26.3%) | 234,542 (69.3%) |
| 65 to 74 Years | 209,862 (91.3%) | 93,275 (40.6%) |
| 75 Years and over | 140,805 (97.0%) | 53,609 (36.9%) |
| Total | 1,168,705 (38.8%) | 1,806,691 (60.1%) |
Disability Status by Sex by Age in Area Code 909
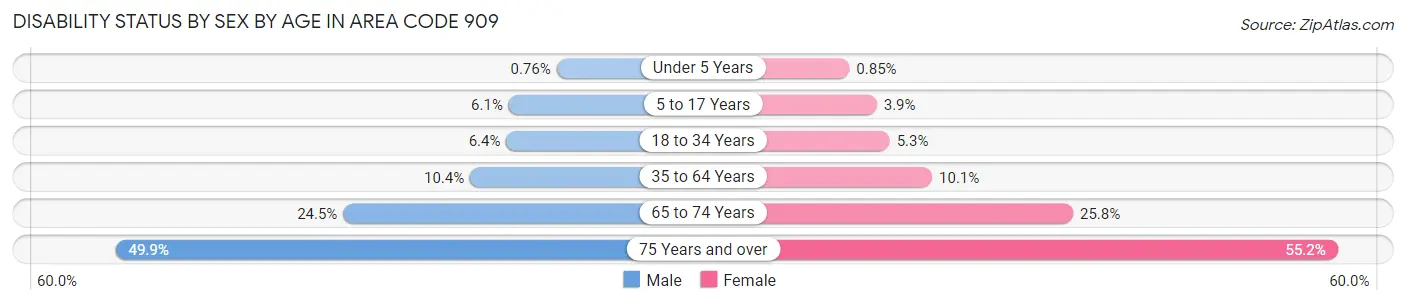
| Age Bracket | Male | Female |
| Under 5 Years | 728 (0.8%) | 780 (0.9%) |
| 5 to 17 Years | 17,416 (6.1%) | 10,740 (3.9%) |
| 18 to 34 Years | 24,577 (6.4%) | 20,103 (5.3%) |
| 35 to 64 Years | 57,624 (10.4%) | 56,940 (10.1%) |
| 65 to 74 Years | 26,310 (24.5%) | 31,536 (25.8%) |
| 75 Years and over | 29,392 (49.9%) | 47,592 (55.2%) |
Disability Class by Sex by Age in Area Code 909
Disability Class: Hearing Difficulty
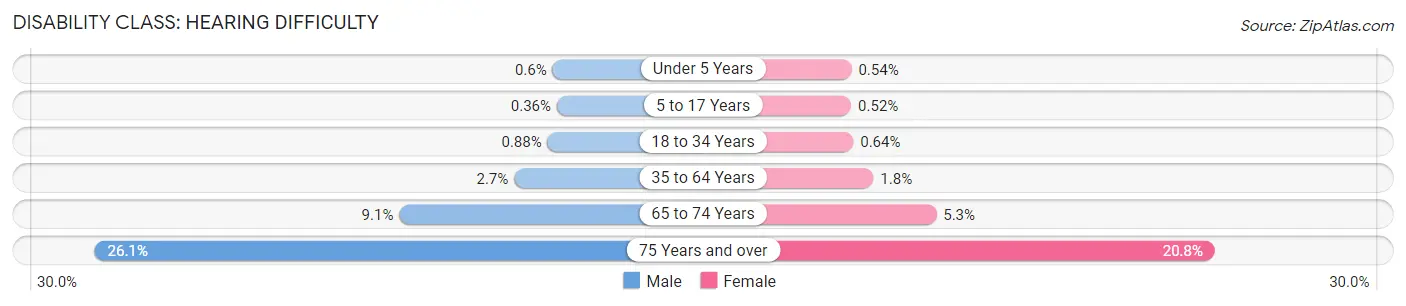
| Age Bracket | Male | Female |
| Under 5 Years | 572 (0.6%) | 498 (0.5%) |
| 5 to 17 Years | 1,026 (0.4%) | 1,432 (0.5%) |
| 18 to 34 Years | 3,401 (0.9%) | 2,403 (0.6%) |
| 35 to 64 Years | 15,205 (2.7%) | 9,960 (1.8%) |
| 65 to 74 Years | 9,803 (9.1%) | 6,447 (5.3%) |
| 75 Years and over | 15,384 (26.1%) | 17,901 (20.8%) |
Disability Class: Vision Difficulty
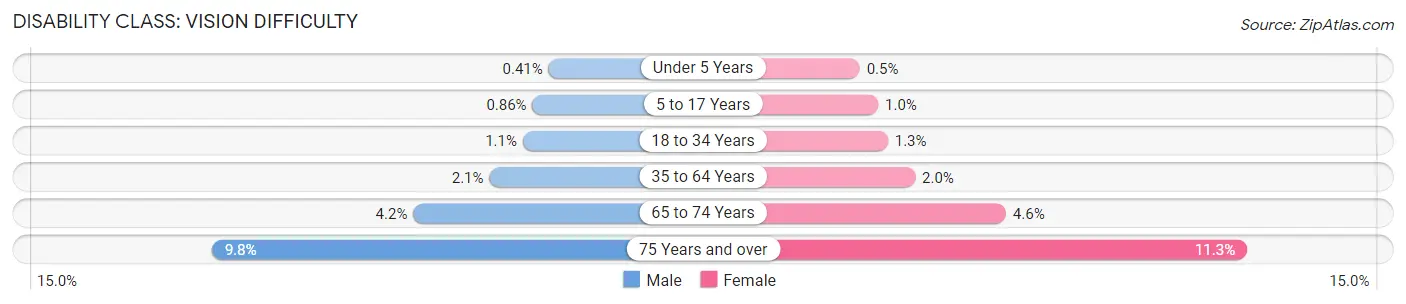
| Age Bracket | Male | Female |
| Under 5 Years | 395 (0.4%) | 459 (0.5%) |
| 5 to 17 Years | 2,453 (0.9%) | 2,772 (1.0%) |
| 18 to 34 Years | 4,375 (1.1%) | 4,833 (1.3%) |
| 35 to 64 Years | 11,434 (2.1%) | 11,558 (2.0%) |
| 65 to 74 Years | 4,484 (4.2%) | 5,598 (4.6%) |
| 75 Years and over | 5,771 (9.8%) | 9,725 (11.3%) |
Disability Class: Cognitive Difficulty
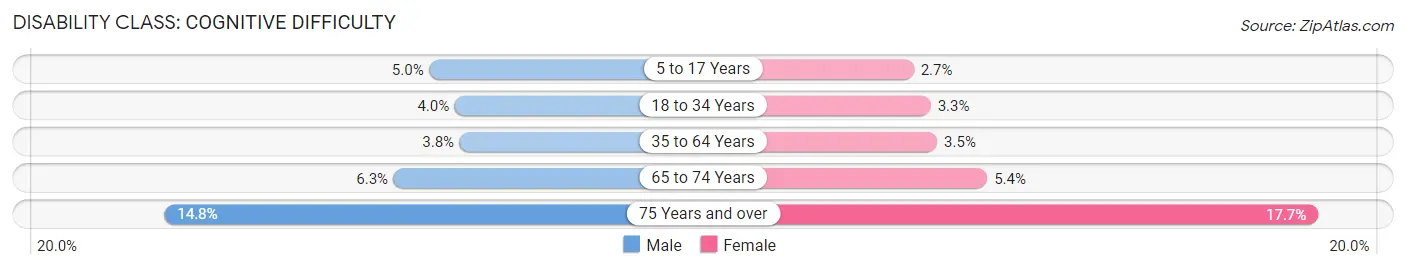
| Age Bracket | Male | Female |
| 5 to 17 Years | 14,232 (5.0%) | 7,370 (2.7%) |
| 18 to 34 Years | 15,550 (4.0%) | 12,438 (3.3%) |
| 35 to 64 Years | 21,294 (3.8%) | 20,026 (3.5%) |
| 65 to 74 Years | 6,751 (6.3%) | 6,614 (5.4%) |
| 75 Years and over | 8,727 (14.8%) | 15,243 (17.7%) |
Disability Class: Ambulatory Difficulty
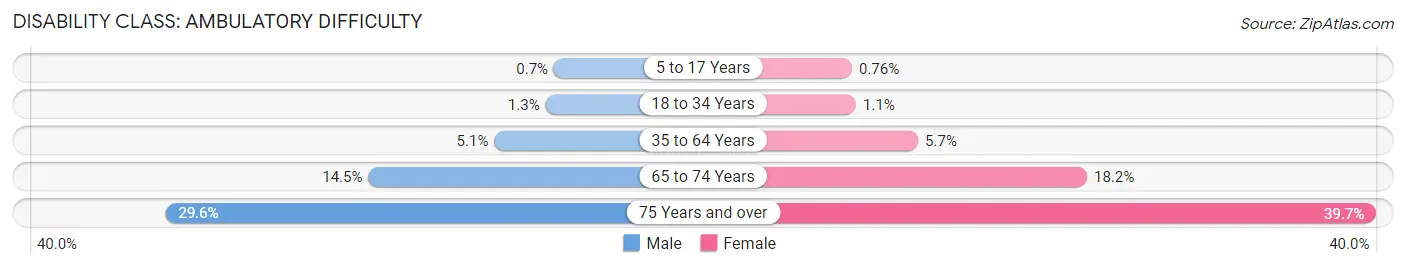
| Age Bracket | Male | Female |
| 5 to 17 Years | 2,009 (0.7%) | 2,087 (0.8%) |
| 18 to 34 Years | 5,107 (1.3%) | 3,978 (1.1%) |
| 35 to 64 Years | 28,452 (5.1%) | 32,077 (5.7%) |
| 65 to 74 Years | 15,533 (14.5%) | 22,302 (18.2%) |
| 75 Years and over | 17,413 (29.5%) | 34,195 (39.7%) |
Disability Class: Self-Care Difficulty
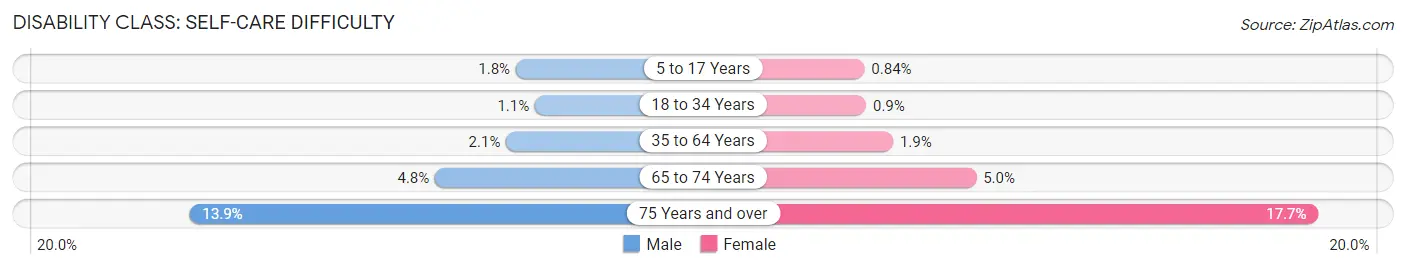
| Age Bracket | Male | Female |
| 5 to 17 Years | 5,036 (1.8%) | 2,308 (0.8%) |
| 18 to 34 Years | 4,064 (1.1%) | 3,408 (0.9%) |
| 35 to 64 Years | 11,765 (2.1%) | 10,749 (1.9%) |
| 65 to 74 Years | 5,111 (4.8%) | 6,111 (5.0%) |
| 75 Years and over | 8,181 (13.9%) | 15,251 (17.7%) |
Technology Access in Area Code 909
Computing Device Access in Area Code 909
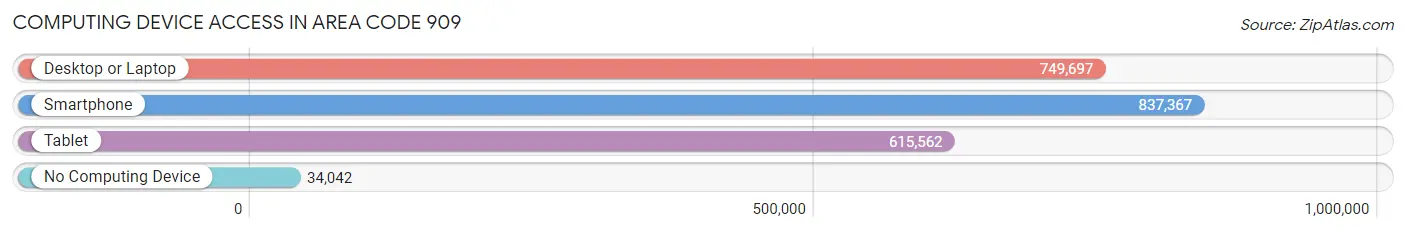
| Device Type | # Households | % Households |
| Desktop or Laptop | 749,697 | 82.5% |
| Smartphone | 837,367 | 92.1% |
| Tablet | 615,562 | 67.7% |
| No Computing Device | 34,042 | 3.7% |
| Total | 908,771 | 100.0% |
Internet Access in Area Code 909
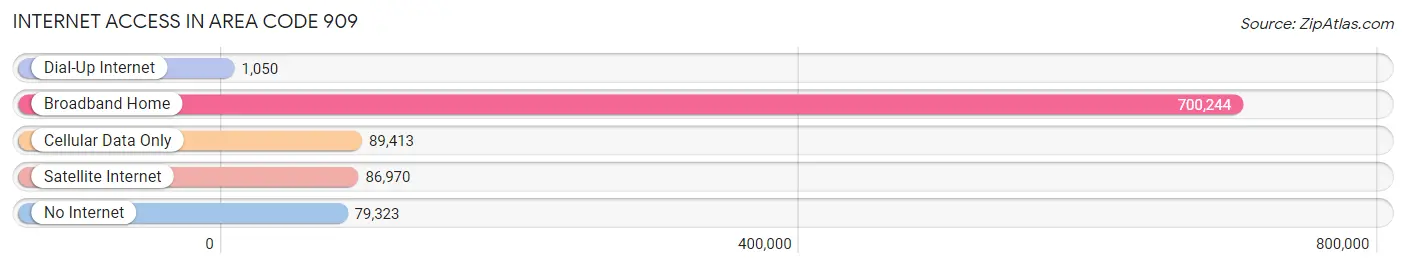
| Internet Type | # Households | % Households |
| Dial-Up Internet | 1,050 | 0.1% |
| Broadband Home | 700,244 | 77.0% |
| Cellular Data Only | 89,413 | 9.8% |
| Satellite Internet | 86,970 | 9.6% |
| No Internet | 79,323 | 8.7% |
| Total | 908,771 | 100.0% |
Area Code 909 Summary
Geography
Area code 909 is located in the Inland Empire region of Southern California. It covers the western portion of San Bernardino County and the eastern portion of Riverside County. It includes the cities of Ontario, Chino, Fontana, Rancho Cucamonga, and Upland.
Social
Area code 909 is home to a diverse population of people from all walks of life. The area is known for its vibrant nightlife, with a variety of bars, clubs, and restaurants. It is also home to a number of cultural attractions, including the Ontario Museum of History and Art, the San Bernardino County Museum, and the San Manuel Indian Bingo and Casino.
Economics
Area code 909 is a major economic hub in Southern California. It is home to a number of large corporations, including Amazon, Target, and Walmart. It is also home to Ontario International Airport, which serves as a major transportation hub for the region.
Demographics
Area code 909 is home to a population of over 2.5 million people. The population is diverse, with a large Hispanic population, as well as a significant African American and Asian population. The median household income is $60,000, and the median home value is $350,000.
Common Questions
What is Per Capita Income in Area Code 909?
Per Capita income in Area Code 909 is $34,344.
What is the Median Family Income in Area Code 909?
Median Family Income in Area Code 909 is $96,288.
What is the Median Household income in Area Code 909?
Median Household Income in Area Code 909 is $87,272.
What is Income or Wage Gap in Area Code 909?
Income or Wage Gap in Area Code 909 is 24.9%.
Women in Area Code 909 earn 75.1 cents for every dollar earned by a man.
What is Family Income Deficit in Area Code 909?
Family Income Deficit in Area Code 909 is $11,639.
Families that are below poverty line in Area Code 909 earn $11,639 less on average than the poverty threshold level.
What is Inequality or Gini Index in Area Code 909?
Inequality or Gini Index in Area Code 909 is 28.62.
What is the Total Population of Area Code 909?
Total Population of Area Code 909 is 3,038,297.
What is the Total Male Population of Area Code 909?
Total Male Population of Area Code 909 is 1,510,053.
What is the Total Female Population of Area Code 909?
Total Female Population of Area Code 909 is 1,528,244.
What is the Ratio of Males per 100 Females in Area Code 909?
There are 98.81 Males per 100 Females in Area Code 909.
What is the Ratio of Females per 100 Males in Area Code 909?
There are 101.20 Females per 100 Males in Area Code 909.
What is the Median Population Age in Area Code 909?
Median Population Age in Area Code 909 is 36.1 Years.
What is the Average Family Size in Area Code 909
Average Family Size in Area Code 909 is 3.6 People.
What is the Average Household Size in Area Code 909
Average Household Size in Area Code 909 is 3.2 People.
How Large is the Labor Force in Area Code 909?
There are 1,472,960 People in the Labor Forcein in Area Code 909.
What is the Percentage of People in the Labor Force in Area Code 909?
62.0% of People are in the Labor Force in Area Code 909.
What is the Unemployment Rate in Area Code 909?
Unemployment Rate in Area Code 909 is 6.6%.