Area Code 760 Map & Demographics
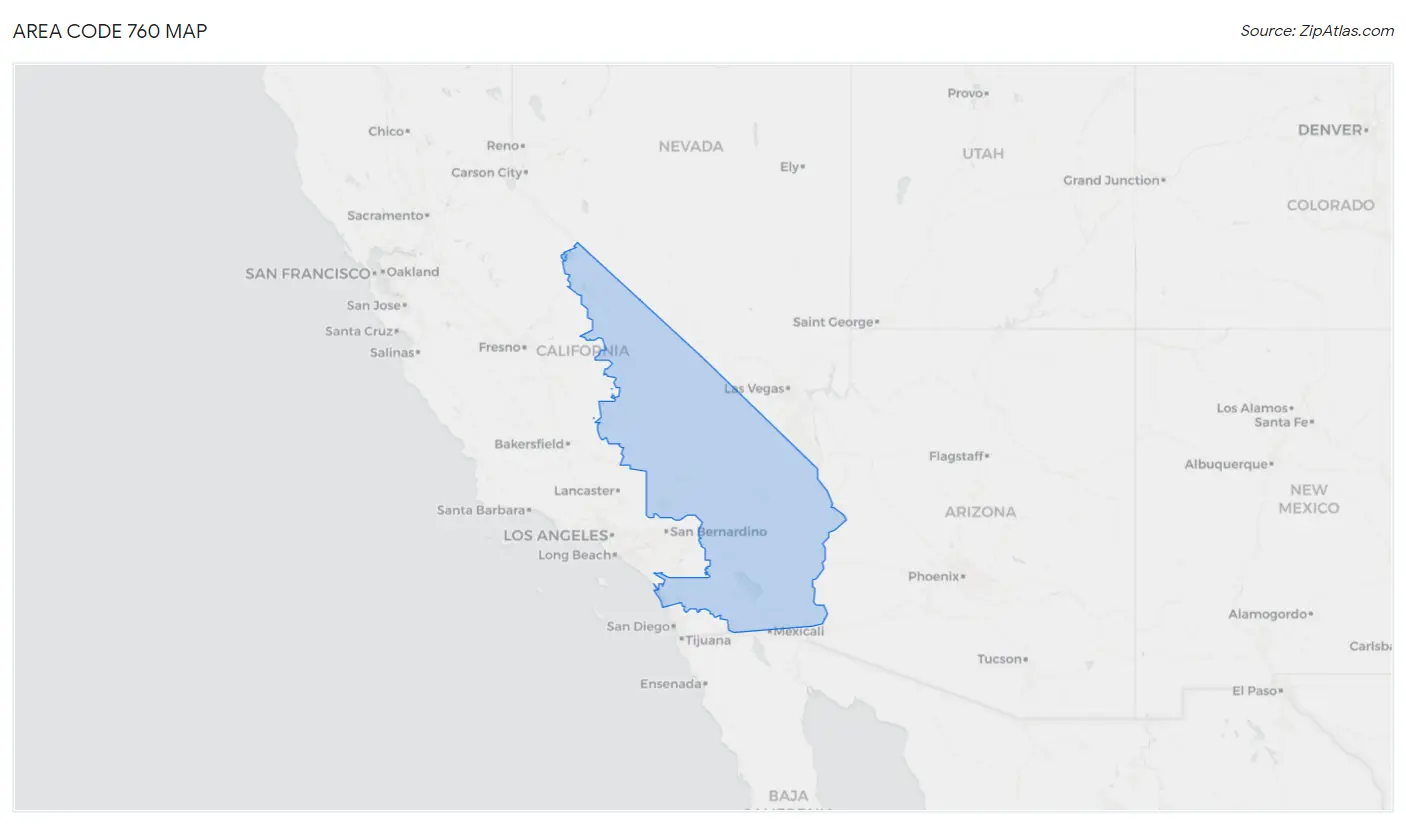
Area Code 760 Map
Area Code 760 Overview
$37,424
PER CAPITA INCOME
$88,461
AVG FAMILY INCOME
$73,092
AVG HOUSEHOLD INCOME
30.1%
WAGE / INCOME GAP [ % ]
69.9¢/ $1
WAGE / INCOME GAP [ $ ]
$11,095
FAMILY INCOME DEFICIT
53.37
INEQUALITY / GINI INDEX
2,474,685
TOTAL POPULATION
1,269,608
MALE POPULATION
1,205,077
FEMALE POPULATION
105.35
MALES / 100 FEMALES
94.92
FEMALES / 100 MALES
42.4
MEDIAN AGE
3.2
AVG FAMILY SIZE
2.6
AVG HOUSEHOLD SIZE
1,098,337
LABOR FORCE [ PEOPLE ]
55.8%
PERCENT IN LABOR FORCE
10.2%
UNEMPLOYMENT RATE
Nearby Area Codes
Income in Area Code 760
Income Overview in Area Code 760
Per Capita Income in Area Code 760 is $37,424, while median incomes of families and households are $88,461 and $73,092 respectively.
| Characteristic | Number | Measure |
| Per Capita Income | 2,474,685 | $37,424 |
| Median Family Income | 570,103 | $88,461 |
| Mean Family Income | 570,103 | $12,756,218 |
| Median Household Income | 852,937 | $73,092 |
| Mean Household Income | 852,937 | $11,132,254 |
| Income Deficit | 570,103 | $11,095 |
| Wage / Income Gap (%) | 2,474,685 | 30.10% |
| Wage / Income Gap ($) | 2,474,685 | 69.90¢ per $1 |
| Gini / Inequality Index | 2,474,685 | 53.37 |
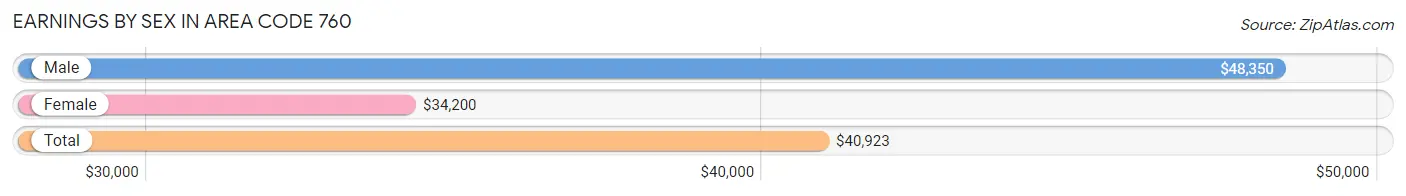
Earnings by Sex in Area Code 760
Average Earnings in Area Code 760 are $40,923, $48,350 for men and $34,200 for women, a difference of 29.3%.
| Sex | Number | Average Earnings |
| Male | 687,580 (56.2%) | $48,350 |
| Female | 535,004 (43.8%) | $34,200 |
| Total | 1,222,584 (100.0%) | $40,923 |
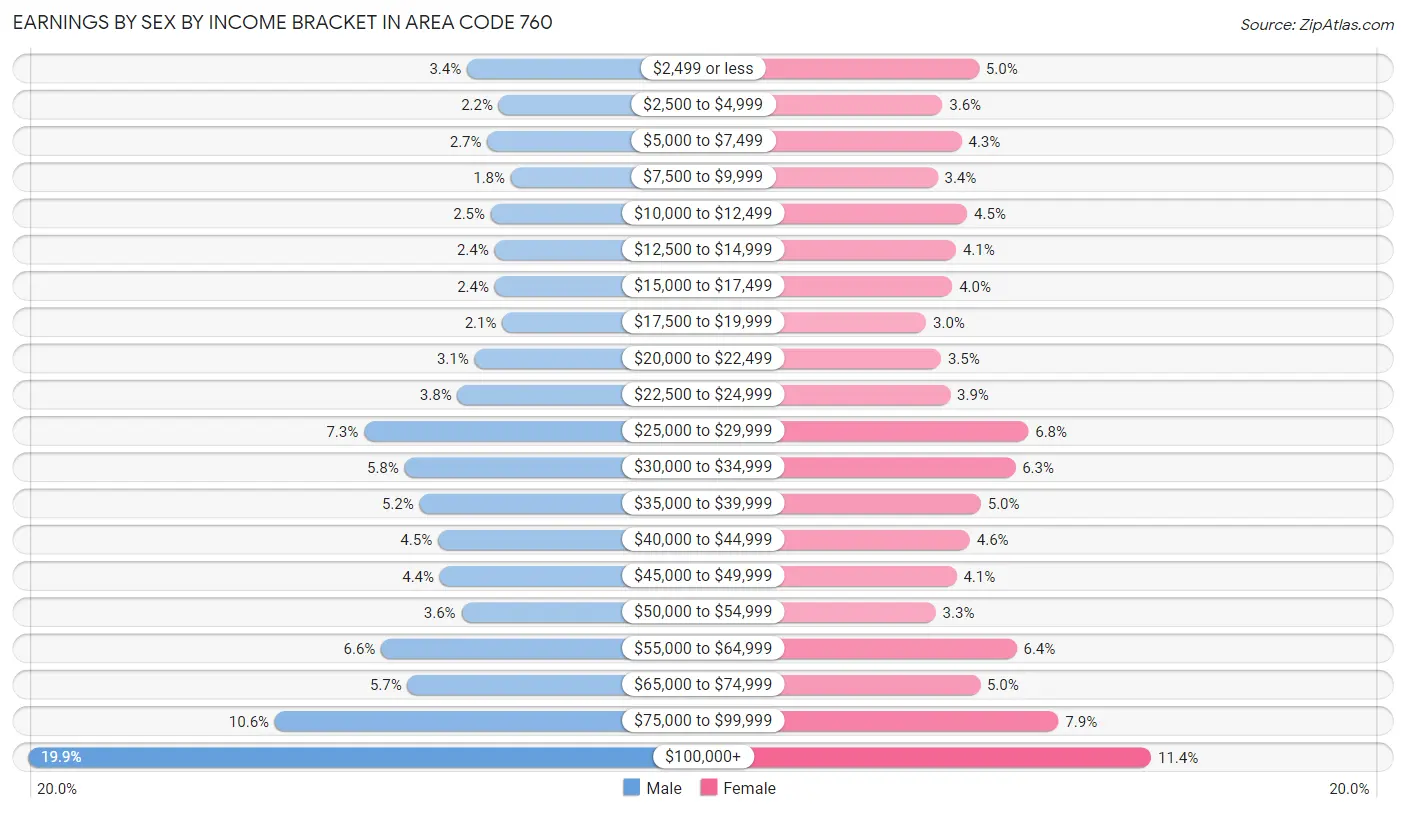
Earnings by Sex by Income Bracket in Area Code 760
The most common earnings brackets in Area Code 760 are $100,000+ for men (136,621 | 19.9%) and $100,000+ for women (61,000 | 11.4%).
| Income | Male | Female |
| $2,499 or less | 23,549 (3.4%) | 26,471 (5.0%) |
| $2,500 to $4,999 | 15,329 (2.2%) | 19,140 (3.6%) |
| $5,000 to $7,499 | 18,302 (2.7%) | 23,013 (4.3%) |
| $7,500 to $9,999 | 12,241 (1.8%) | 18,169 (3.4%) |
| $10,000 to $12,499 | 17,368 (2.5%) | 24,148 (4.5%) |
| $12,500 to $14,999 | 16,404 (2.4%) | 21,857 (4.1%) |
| $15,000 to $17,499 | 16,355 (2.4%) | 21,150 (4.0%) |
| $17,500 to $19,999 | 14,421 (2.1%) | 15,868 (3.0%) |
| $20,000 to $22,499 | 21,560 (3.1%) | 18,886 (3.5%) |
| $22,500 to $24,999 | 26,002 (3.8%) | 20,723 (3.9%) |
| $25,000 to $29,999 | 50,068 (7.3%) | 36,367 (6.8%) |
| $30,000 to $34,999 | 39,622 (5.8%) | 33,753 (6.3%) |
| $35,000 to $39,999 | 35,774 (5.2%) | 26,834 (5.0%) |
| $40,000 to $44,999 | 31,028 (4.5%) | 24,668 (4.6%) |
| $45,000 to $49,999 | 30,507 (4.4%) | 21,986 (4.1%) |
| $50,000 to $54,999 | 24,930 (3.6%) | 17,823 (3.3%) |
| $55,000 to $64,999 | 45,624 (6.6%) | 34,023 (6.4%) |
| $65,000 to $74,999 | 38,859 (5.7%) | 26,702 (5.0%) |
| $75,000 to $99,999 | 73,016 (10.6%) | 42,423 (7.9%) |
| $100,000+ | 136,621 (19.9%) | 61,000 (11.4%) |
| Total | 687,580 (100.0%) | 535,004 (100.0%) |
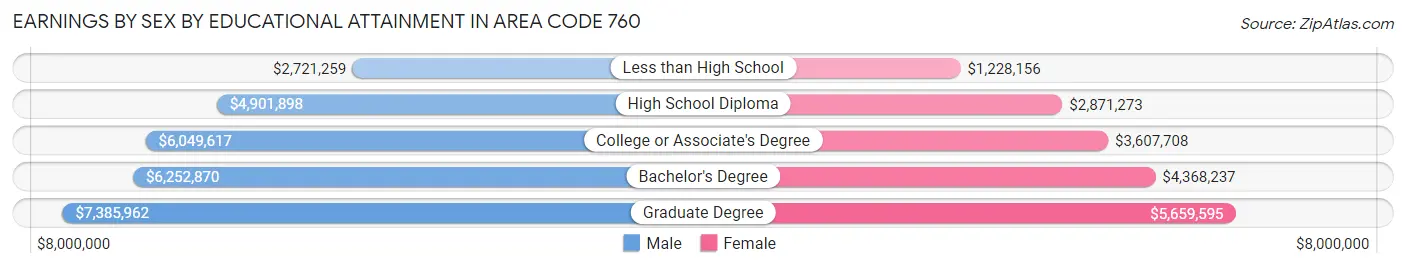
Earnings by Sex by Educational Attainment in Area Code 760
Average earnings in Area Code 760 are $6,125,729 for men and $4,211,876 for women, a difference of 31.2%. Men with an educational attainment of graduate degree enjoy the highest average annual earnings of $7,385,962, while those with less than high school education earn the least with $2,721,259. Women with an educational attainment of graduate degree earn the most with the average annual earnings of $5,659,595, while those with less than high school education have the smallest earnings of $1,228,156.
| Educational Attainment | Male Income | Female Income |
| Less than High School | $2,721,259 | $1,228,156 |
| High School Diploma | $4,901,898 | $2,871,273 |
| College or Associate's Degree | $6,049,617 | $3,607,708 |
| Bachelor's Degree | $6,252,870 | $4,368,237 |
| Graduate Degree | $7,385,962 | $5,659,595 |
| Total | $6,125,729 | $4,211,876 |
Family Income in Area Code 760
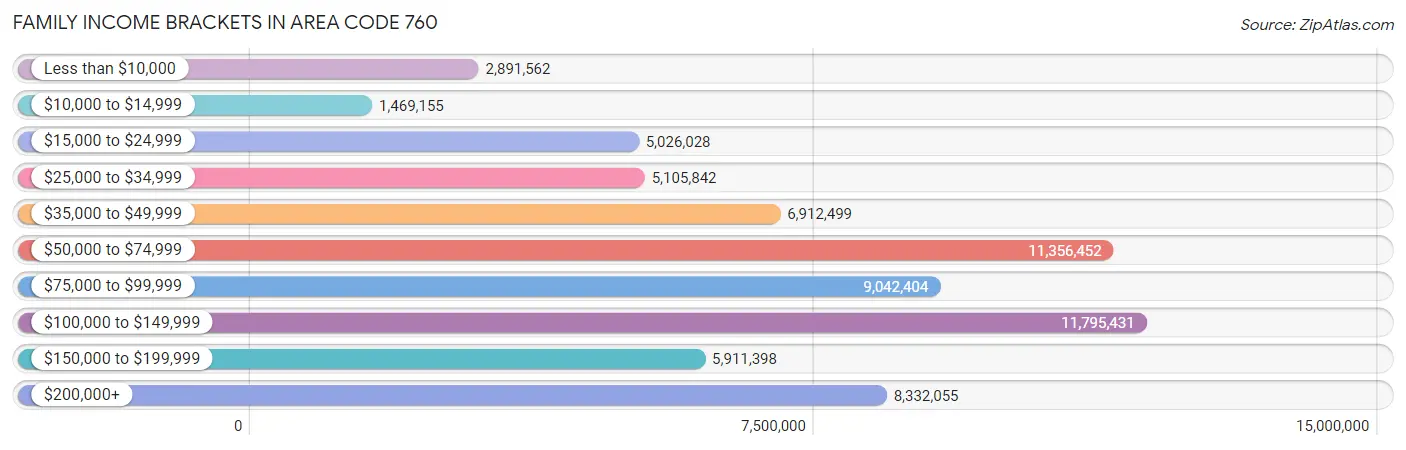
Family Income Brackets in Area Code 760
According to the Area Code 760 family income data, there are 11,795,431 families falling into the $100,000 to $149,999 income range, which is the most common income bracket and makes up 2,069.0% of all families. Conversely, the $10,000 to $14,999 income bracket is the least frequent group with only 1,469,155 families (257.7%) belonging to this category.
| Income Bracket | # Families | % Families |
| Less than $10,000 | 2,891,562 | 507.2% |
| $10,000 to $14,999 | 1,469,155 | 257.7% |
| $15,000 to $24,999 | 5,026,028 | 881.6% |
| $25,000 to $34,999 | 5,105,842 | 895.6% |
| $35,000 to $49,999 | 6,912,499 | 1,212.5% |
| $50,000 to $74,999 | 11,356,452 | 1,992.0% |
| $75,000 to $99,999 | 9,042,404 | 1,586.1% |
| $100,000 to $149,999 | 11,795,431 | 2,069.0% |
| $150,000 to $199,999 | 5,911,398 | 1,036.9% |
| $200,000+ | 8,332,055 | 1,461.5% |
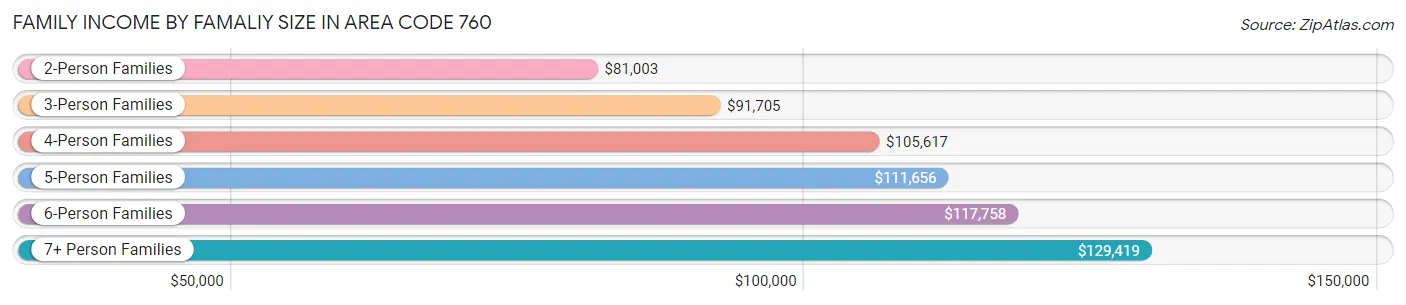
Family Income by Famaliy Size in Area Code 760
7+ person families (16,673 | 2.9%) account for the highest median family income in Area Code 760 with $129,419 per family, while 2-person families (246,423 | 43.2%) have the highest median income of $40,501 per family member.
| Income Bracket | # Families | Median Income |
| 2-Person Families | 246,423 (43.2%) | $81,003 |
| 3-Person Families | 119,939 (21.0%) | $91,705 |
| 4-Person Families | 106,639 (18.7%) | $105,617 |
| 5-Person Families | 56,059 (9.8%) | $111,656 |
| 6-Person Families | 24,370 (4.3%) | $117,758 |
| 7+ Person Families | 16,673 (2.9%) | $129,419 |
| Total | 570,103 (100.0%) | $88,461 |
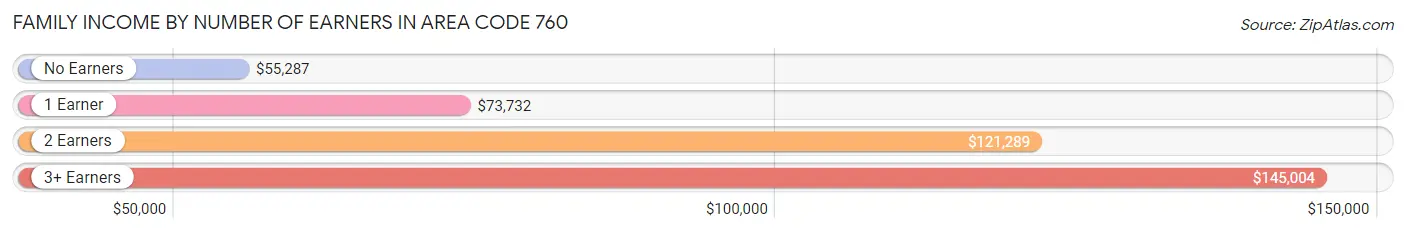
Family Income by Number of Earners in Area Code 760
The median family income in Area Code 760 is $88,461, with families comprising 3+ earners (71,476) having the highest median family income of $145,004, while families with no earners (94,646) have the lowest median family income of $55,287, accounting for 12.5% and 16.6% of families, respectively.
| Number of Earners | # Families | Median Income |
| No Earners | 94,646 (16.6%) | $55,287 |
| 1 Earner | 187,121 (32.8%) | $73,732 |
| 2 Earners | 216,860 (38.0%) | $121,289 |
| 3+ Earners | 71,476 (12.5%) | $145,004 |
| Total | 570,103 (100.0%) | $88,461 |
Household Income in Area Code 760
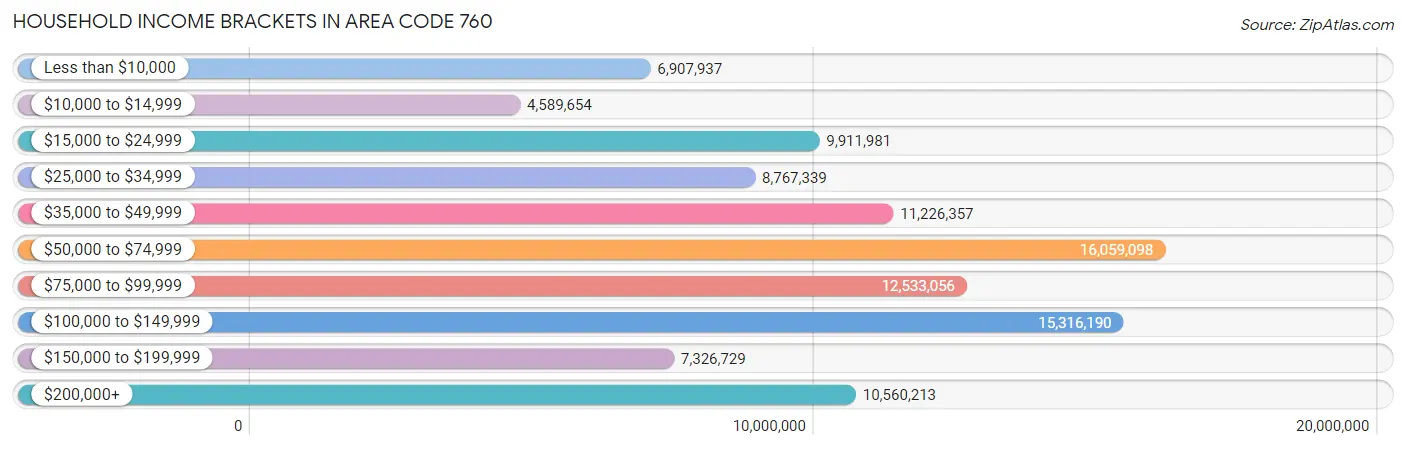
Household Income Brackets in Area Code 760
With 16,059,098 households falling in the category, the $50,000 to $74,999 income range is the most frequent in Area Code 760, accounting for 1,882.8% of all households. In contrast, only 4,589,654 households (538.1%) fall into the $10,000 to $14,999 income bracket, making it the least populous group.
| Income Bracket | # Households | % Households |
| Less than $10,000 | 6,907,937 | 809.9% |
| $10,000 to $14,999 | 4,589,654 | 538.1% |
| $15,000 to $24,999 | 9,911,981 | 1,162.1% |
| $25,000 to $34,999 | 8,767,339 | 1,027.9% |
| $35,000 to $49,999 | 11,226,357 | 1,316.2% |
| $50,000 to $74,999 | 16,059,098 | 1,882.8% |
| $75,000 to $99,999 | 12,533,056 | 1,469.4% |
| $100,000 to $149,999 | 15,316,190 | 1,795.7% |
| $150,000 to $199,999 | 7,326,729 | 859.0% |
| $200,000+ | 10,560,213 | 1,238.1% |
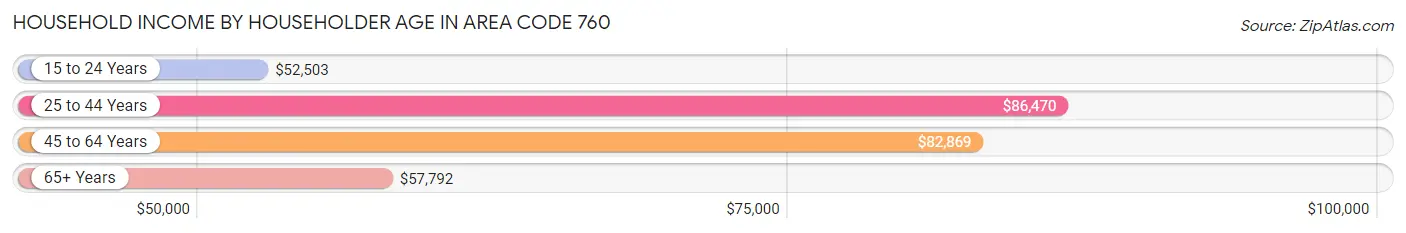
Household Income by Householder Age in Area Code 760
The median household income in Area Code 760 is $73,092, with the highest median household income of $86,470 found in the 25 to 44 years age bracket for the primary householder. A total of 286,342 households (33.6%) fall into this category. Meanwhile, the 15 to 24 years age bracket for the primary householder has the lowest median household income of $52,503, with 28,435 households (3.3%) in this group.
| Income Bracket | # Households | Median Income |
| 15 to 24 Years | 28,435 (3.3%) | $52,503 |
| 25 to 44 Years | 286,342 (33.6%) | $86,470 |
| 45 to 64 Years | 303,693 (35.6%) | $82,869 |
| 65+ Years | 234,467 (27.5%) | $57,792 |
| Total | 852,937 (100.0%) | $73,092 |
Poverty in Area Code 760
Income Below Poverty by Sex and Age in Area Code 760
With 12.4% poverty level for males and 15.1% for females among the residents of Area Code 760, under 5 year old males and 15 year old females are the most vulnerable to poverty, with 14,751 males (19.3%) and 3,574 females (21.2%) in their respective age groups living below the poverty level.
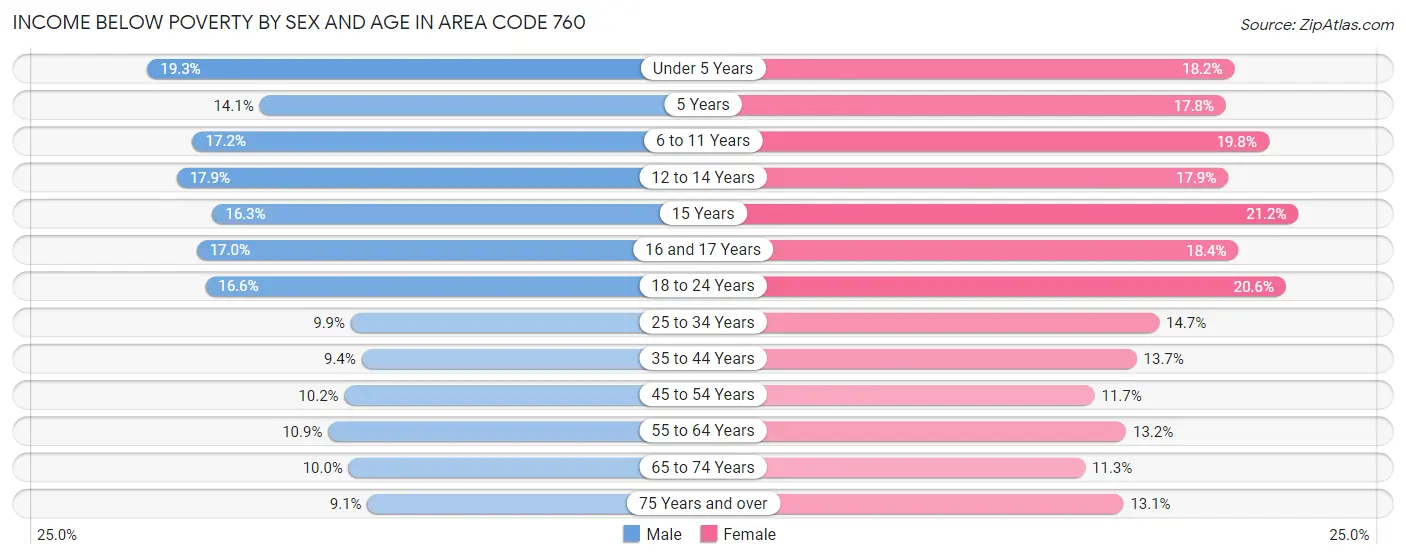
| Age Bracket | Male | Female |
| Under 5 Years | 14,751 (19.3%) | 13,181 (18.2%) |
| 5 Years | 1,986 (14.1%) | 2,684 (17.8%) |
| 6 to 11 Years | 16,300 (17.2%) | 18,387 (19.8%) |
| 12 to 14 Years | 9,356 (17.9%) | 8,343 (17.9%) |
| 15 Years | 2,738 (16.3%) | 3,574 (21.2%) |
| 16 and 17 Years | 5,514 (17.0%) | 5,424 (18.4%) |
| 18 to 24 Years | 18,767 (16.6%) | 21,875 (20.6%) |
| 25 to 34 Years | 17,669 (9.9%) | 24,845 (14.7%) |
| 35 to 44 Years | 15,261 (9.4%) | 20,840 (13.7%) |
| 45 to 54 Years | 14,148 (10.2%) | 16,092 (11.7%) |
| 55 to 64 Years | 16,158 (10.9%) | 19,431 (13.2%) |
| 65 to 74 Years | 10,788 (10.0%) | 13,130 (11.3%) |
| 75 Years and over | 6,649 (9.1%) | 12,048 (13.1%) |
| Total | 150,085 (12.4%) | 179,854 (15.1%) |
Income Above Poverty by Sex and Age in Area Code 760
According to the poverty statistics in Area Code 760, males aged 75 years and over and females aged 65 to 74 years are the age groups that are most secure financially, with 90.9% of males and 88.7% of females in these age groups living above the poverty line.
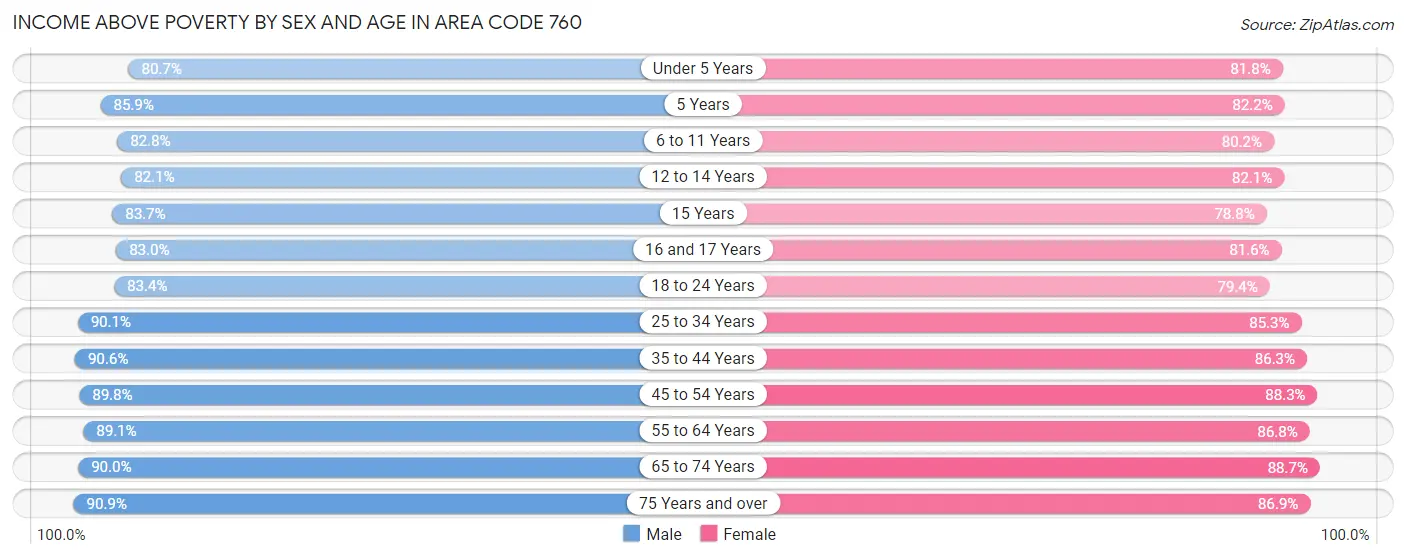
| Age Bracket | Male | Female |
| Under 5 Years | 61,698 (80.7%) | 59,184 (81.8%) |
| 5 Years | 12,103 (85.9%) | 12,374 (82.2%) |
| 6 to 11 Years | 78,484 (82.8%) | 74,436 (80.2%) |
| 12 to 14 Years | 42,799 (82.1%) | 38,201 (82.1%) |
| 15 Years | 14,075 (83.7%) | 13,301 (78.8%) |
| 16 and 17 Years | 26,910 (83.0%) | 24,056 (81.6%) |
| 18 to 24 Years | 94,253 (83.4%) | 84,304 (79.4%) |
| 25 to 34 Years | 161,564 (90.1%) | 143,980 (85.3%) |
| 35 to 44 Years | 147,856 (90.6%) | 131,504 (86.3%) |
| 45 to 54 Years | 125,042 (89.8%) | 121,082 (88.3%) |
| 55 to 64 Years | 131,998 (89.1%) | 127,885 (86.8%) |
| 65 to 74 Years | 97,555 (90.0%) | 103,164 (88.7%) |
| 75 Years and over | 66,522 (90.9%) | 80,107 (86.9%) |
| Total | 1,060,859 (87.6%) | 1,013,578 (84.9%) |
Income Below Poverty Among Married-Couple Families in Area Code 760
The poverty statistics for married-couple families in Area Code 760 show that 5.9% or 24,615 of the total 418,042 families live below the poverty line. Families with 5 or more children have the highest poverty rate of 29.2%, comprising of 971 families. On the other hand, families with no children have the lowest poverty rate of 4.2%, which includes 10,095 families.
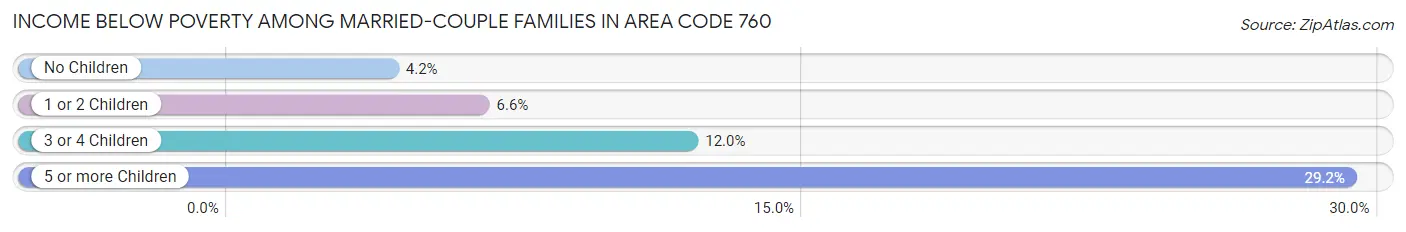
| Children | Above Poverty | Below Poverty |
| No Children | 230,226 (95.8%) | 10,095 (4.2%) |
| 1 or 2 Children | 127,047 (93.4%) | 8,932 (6.6%) |
| 3 or 4 Children | 33,801 (88.0%) | 4,617 (12.0%) |
| 5 or more Children | 2,353 (70.8%) | 971 (29.2%) |
| Total | 393,427 (94.1%) | 24,615 (5.9%) |
Income Below Poverty Among Single-Parent Households in Area Code 760
According to the poverty data in Area Code 760, 12.1% or 5,968 single-father households and 25.2% or 25,813 single-mother households are living below the poverty line. Among single-father households, those with 5 or more children have the highest poverty rate, with 147 households (28.9%) experiencing poverty. Likewise, among single-mother households, those with 5 or more children have the highest poverty rate, with 912 households (65.4%) falling below the poverty line.
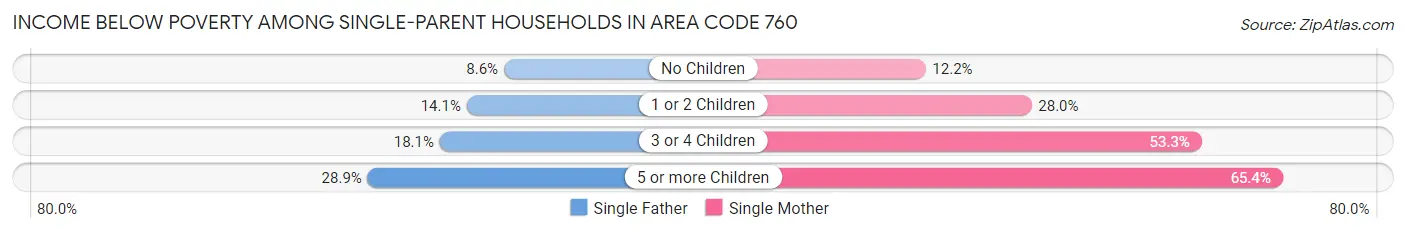
| Children | Single Father | Single Mother |
| No Children | 1,964 (8.6%) | 5,046 (12.2%) |
| 1 or 2 Children | 3,039 (14.1%) | 13,265 (28.0%) |
| 3 or 4 Children | 818 (18.1%) | 6,590 (53.3%) |
| 5 or more Children | 147 (28.9%) | 912 (65.4%) |
| Total | 5,968 (12.1%) | 25,813 (25.2%) |
Income Below Poverty Among Married-Couple vs Single-Parent Households in Area Code 760
The poverty data for Area Code 760 shows that 24,615 of the married-couple family households (5.9%) and 31,781 of the single-parent households (20.9%) are living below the poverty level. Within the married-couple family households, those with 5 or more children have the highest poverty rate, with 971 households (29.2%) falling below the poverty line. Among the single-parent households, those with 5 or more children have the highest poverty rate, with 1,059 household (55.6%) living below poverty.

| Children | Married-Couple Families | Single-Parent Households |
| No Children | 10,095 (4.2%) | 7,010 (10.9%) |
| 1 or 2 Children | 8,932 (6.6%) | 16,304 (23.6%) |
| 3 or 4 Children | 4,617 (12.0%) | 7,408 (43.9%) |
| 5 or more Children | 971 (29.2%) | 1,059 (55.6%) |
| Total | 24,615 (5.9%) | 31,781 (20.9%) |
Race in Area Code 760
The most populous races in Area Code 760 are White / Caucasian (1,392,494 | 56.3%), Hispanic or Latino (1,098,549 | 44.4%), and Two or more Races (430,246 | 17.4%).
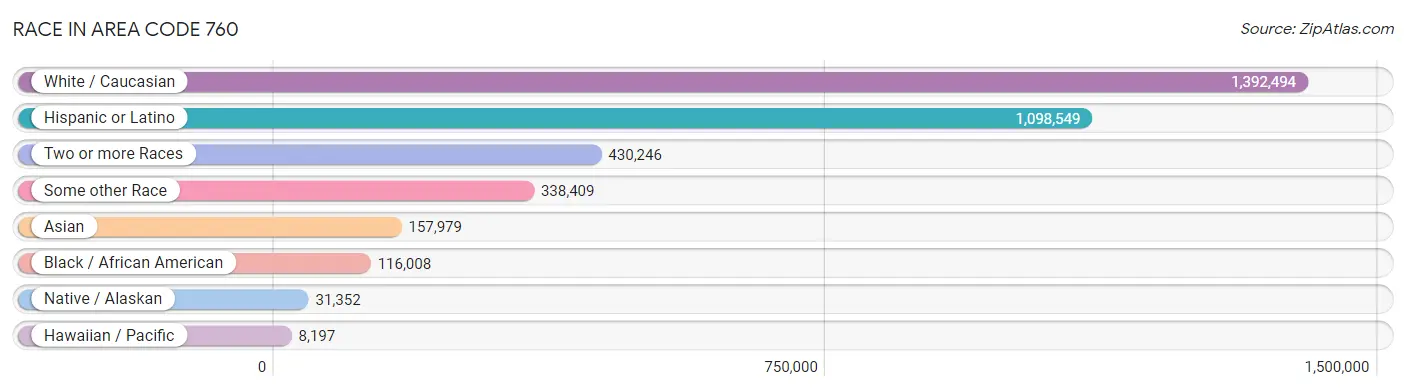
| Race | # Population | % Population |
| Asian | 157,979 | 6.4% |
| Black / African American | 116,008 | 4.7% |
| Hawaiian / Pacific | 8,197 | 0.3% |
| Hispanic or Latino | 1,098,549 | 44.4% |
| Native / Alaskan | 31,352 | 1.3% |
| White / Caucasian | 1,392,494 | 56.3% |
| Two or more Races | 430,246 | 17.4% |
| Some other Race | 338,409 | 13.7% |
| Total | 2,474,685 | 100.0% |
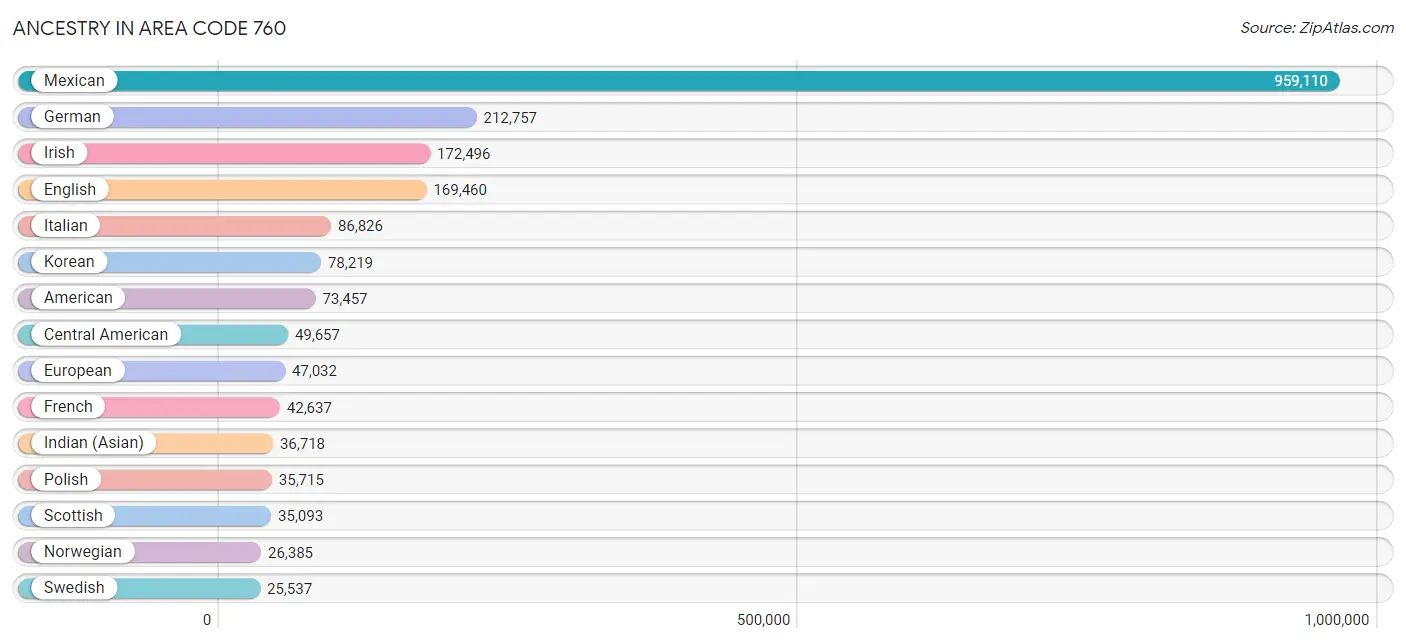
Ancestry in Area Code 760
The most populous ancestries reported in Area Code 760 are Mexican (959,110 | 38.8%), German (212,757 | 8.6%), Irish (172,496 | 7.0%), English (169,460 | 6.9%), and Italian (86,826 | 3.5%), together accounting for 64.7% of all Area Code 760 residents.
| Ancestry | # Population | % Population |
| Afghan | 1,087 | 0.0% |
| African | 11,625 | 0.5% |
| Alaska Native | 23 | 0.0% |
| Alaskan Athabascan | 31 | 0.0% |
| Albanian | 367 | 0.0% |
| Aleut | 36 | 0.0% |
| Alsatian | 93 | 0.0% |
| American | 73,457 | 3.0% |
| Apache | 2,122 | 0.1% |
| Arab | 13,005 | 0.5% |
| Arapaho | 8 | 0.0% |
| Argentinean | 2,168 | 0.1% |
| Armenian | 4,025 | 0.2% |
| Assyrian / Chaldean / Syriac | 675 | 0.0% |
| Australian | 1,039 | 0.0% |
| Austrian | 4,080 | 0.2% |
| Bangladeshi | 607 | 0.0% |
| Barbadian | 97 | 0.0% |
| Basque | 1,003 | 0.0% |
| Belgian | 1,889 | 0.1% |
| Belizean | 497 | 0.0% |
| Bhutanese | 19,562 | 0.8% |
| Blackfeet | 2,185 | 0.1% |
| Bolivian | 667 | 0.0% |
| Brazilian | 1,948 | 0.1% |
| British | 13,102 | 0.5% |
| British West Indian | 116 | 0.0% |
| Bulgarian | 1,287 | 0.1% |
| Burmese | 14,622 | 0.6% |
| Cajun | 128 | 0.0% |
| Cambodian | 135 | 0.0% |
| Canadian | 5,990 | 0.2% |
| Cape Verdean | 57 | 0.0% |
| Carpatho Rusyn | 5 | 0.0% |
| Celtic | 320 | 0.0% |
| Central American | 49,657 | 2.0% |
| Central American Indian | 4,646 | 0.2% |
| Cherokee | 8,330 | 0.3% |
| Cheyenne | 41 | 0.0% |
| Chickasaw | 326 | 0.0% |
| Chilean | 2,066 | 0.1% |
| Chinese | 222 | 0.0% |
| Chippewa | 551 | 0.0% |
| Choctaw | 1,671 | 0.1% |
| Colombian | 3,817 | 0.2% |
| Colville | 68 | 0.0% |
| Comanche | 215 | 0.0% |
| Costa Rican | 1,512 | 0.1% |
| Cree | 30 | 0.0% |
| Creek | 336 | 0.0% |
| Croatian | 2,764 | 0.1% |
| Crow | 70 | 0.0% |
| Cuban | 5,881 | 0.2% |
| Cypriot | 125 | 0.0% |
| Czech | 4,841 | 0.2% |
| Czechoslovakian | 1,725 | 0.1% |
| Danish | 10,763 | 0.4% |
| Delaware | 51 | 0.0% |
| Dominican | 2,006 | 0.1% |
| Dutch | 21,234 | 0.9% |
| Dutch West Indian | 40 | 0.0% |
| Eastern European | 6,082 | 0.3% |
| Ecuadorian | 2,157 | 0.1% |
| Egyptian | 2,162 | 0.1% |
| English | 169,460 | 6.9% |
| Estonian | 238 | 0.0% |
| Ethiopian | 953 | 0.0% |
| European | 47,032 | 1.9% |
| Fijian | 189 | 0.0% |
| Filipino | 2,655 | 0.1% |
| Finnish | 3,047 | 0.1% |
| French | 42,637 | 1.7% |
| French American Indian | 119 | 0.0% |
| French Canadian | 8,509 | 0.3% |
| German | 212,757 | 8.6% |
| German Russian | 35 | 0.0% |
| Ghanaian | 411 | 0.0% |
| Greek | 7,546 | 0.3% |
| Guamanian / Chamorro | 2,919 | 0.1% |
| Guatemalan | 19,619 | 0.8% |
| Guyanese | 337 | 0.0% |
| Haitian | 548 | 0.0% |
| Hmong | 32 | 0.0% |
| Honduran | 3,312 | 0.1% |
| Hopi | 37 | 0.0% |
| Houma | 21 | 0.0% |
| Hungarian | 8,103 | 0.3% |
| Icelander | 585 | 0.0% |
| Indian (Asian) | 36,718 | 1.5% |
| Indonesian | 474 | 0.0% |
| Inupiat | 343 | 0.0% |
| Iranian | 6,186 | 0.3% |
| Iraqi | 516 | 0.0% |
| Irish | 172,496 | 7.0% |
| Iroquois | 425 | 0.0% |
| Israeli | 933 | 0.0% |
| Italian | 86,826 | 3.5% |
| Jamaican | 3,207 | 0.1% |
| Japanese | 2,705 | 0.1% |
| Jordanian | 715 | 0.0% |
| Kenyan | 396 | 0.0% |
| Kiowa | 38 | 0.0% |
| Korean | 78,219 | 3.2% |
| Laotian | 1,982 | 0.1% |
| Latvian | 474 | 0.0% |
| Lebanese | 3,299 | 0.1% |
| Liberian | 64 | 0.0% |
| Lithuanian | 3,370 | 0.1% |
| Lumbee | 23 | 0.0% |
| Luxembourger | 165 | 0.0% |
| Macedonian | 158 | 0.0% |
| Malaysian | 3,178 | 0.1% |
| Maltese | 131 | 0.0% |
| Menominee | 2 | 0.0% |
| Mexican | 959,110 | 38.8% |
| Mexican American Indian | 11,180 | 0.4% |
| Mongolian | 231 | 0.0% |
| Moroccan | 493 | 0.0% |
| Native Hawaiian | 7,611 | 0.3% |
| Navajo | 2,289 | 0.1% |
| Nepalese | 7 | 0.0% |
| New Zealander | 261 | 0.0% |
| Nicaraguan | 3,163 | 0.1% |
| Nigerian | 1,680 | 0.1% |
| Northern European | 5,064 | 0.2% |
| Norwegian | 26,385 | 1.1% |
| Okinawan | 176 | 0.0% |
| Osage | 199 | 0.0% |
| Ottawa | 39 | 0.0% |
| Paiute | 1,234 | 0.1% |
| Pakistani | 3,554 | 0.1% |
| Palestinian | 1,012 | 0.0% |
| Panamanian | 2,471 | 0.1% |
| Paraguayan | 72 | 0.0% |
| Pennsylvania German | 302 | 0.0% |
| Peruvian | 5,198 | 0.2% |
| Pima | 290 | 0.0% |
| Polish | 35,715 | 1.4% |
| Portuguese | 8,926 | 0.4% |
| Potawatomi | 229 | 0.0% |
| Pueblo | 623 | 0.0% |
| Puerto Rican | 17,544 | 0.7% |
| Puget Sound Salish | 31 | 0.0% |
| Romanian | 2,835 | 0.1% |
| Russian | 17,324 | 0.7% |
| Salvadoran | 19,119 | 0.8% |
| Samoan | 5,429 | 0.2% |
| Scandinavian | 7,067 | 0.3% |
| Scotch-Irish | 13,491 | 0.5% |
| Scottish | 35,093 | 1.4% |
| Seminole | 251 | 0.0% |
| Senegalese | 6 | 0.0% |
| Serbian | 2,090 | 0.1% |
| Shoshone | 309 | 0.0% |
| Sierra Leonean | 90 | 0.0% |
| Sioux | 726 | 0.0% |
| Slavic | 638 | 0.0% |
| Slovak | 1,990 | 0.1% |
| Slovene | 627 | 0.0% |
| Somali | 129 | 0.0% |
| South African | 967 | 0.0% |
| South American | 17,692 | 0.7% |
| South American Indian | 480 | 0.0% |
| Soviet Union | 19 | 0.0% |
| Spaniard | 13,030 | 0.5% |
| Spanish | 8,594 | 0.4% |
| Spanish American | 495 | 0.0% |
| Spanish American Indian | 228 | 0.0% |
| Sri Lankan | 24,458 | 1.0% |
| Subsaharan African | 17,614 | 0.7% |
| Sudanese | 132 | 0.0% |
| Swedish | 25,537 | 1.0% |
| Swiss | 5,747 | 0.2% |
| Syrian | 1,508 | 0.1% |
| Taiwanese | 29 | 0.0% |
| Thai | 23,745 | 1.0% |
| Tlingit-Haida | 378 | 0.0% |
| Tohono O'Odham | 407 | 0.0% |
| Tongan | 486 | 0.0% |
| Trinidadian and Tobagonian | 604 | 0.0% |
| Tsimshian | 9 | 0.0% |
| Turkish | 1,179 | 0.1% |
| U.S. Virgin Islander | 48 | 0.0% |
| Ugandan | 279 | 0.0% |
| Ukrainian | 5,776 | 0.2% |
| Uruguayan | 191 | 0.0% |
| Ute | 9 | 0.0% |
| Venezuelan | 1,230 | 0.1% |
| Vietnamese | 168 | 0.0% |
| Welsh | 10,714 | 0.4% |
| West Indian | 604 | 0.0% |
| Yaqui | 1,925 | 0.1% |
| Yugoslavian | 1,458 | 0.1% |
| Yuman | 2,003 | 0.1% |
| Yup'ik | 18 | 0.0% |
| Zimbabwean | 60 | 0.0% | View All 196 Rows |
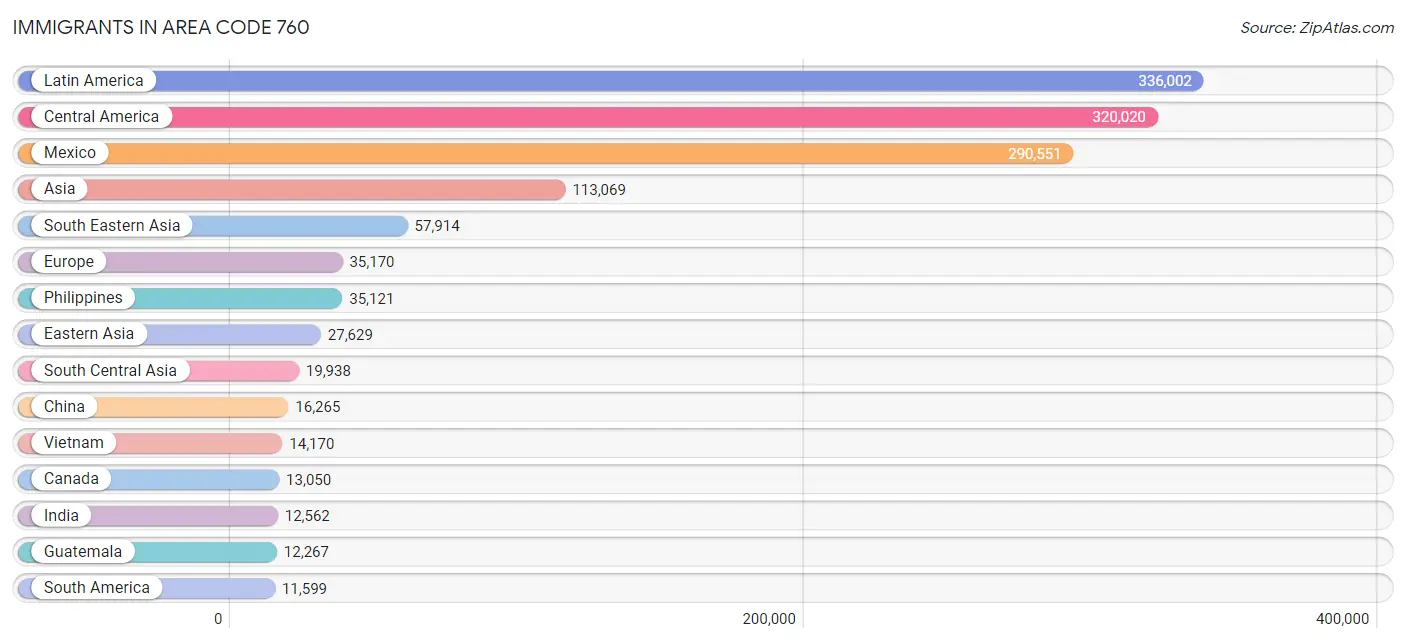
Immigrants in Area Code 760
The most numerous immigrant groups reported in Area Code 760 came from Latin America (336,002 | 13.6%), Central America (320,020 | 12.9%), Mexico (290,551 | 11.7%), Asia (113,069 | 4.6%), and South Eastern Asia (57,914 | 2.3%), together accounting for 45.2% of all Area Code 760 residents.
| Immigration Origin | # Population | % Population |
| Afghanistan | 994 | 0.0% |
| Africa | 8,561 | 0.4% |
| Albania | 171 | 0.0% |
| Argentina | 1,315 | 0.1% |
| Armenia | 273 | 0.0% |
| Asia | 113,069 | 4.6% |
| Australia | 1,174 | 0.1% |
| Austria | 425 | 0.0% |
| Azores | 51 | 0.0% |
| Bahamas | 14 | 0.0% |
| Bangladesh | 219 | 0.0% |
| Barbados | 30 | 0.0% |
| Belarus | 612 | 0.0% |
| Belgium | 282 | 0.0% |
| Belize | 516 | 0.0% |
| Bolivia | 274 | 0.0% |
| Bosnia and Herzegovina | 293 | 0.0% |
| Brazil | 1,984 | 0.1% |
| Bulgaria | 1,009 | 0.0% |
| Cambodia | 1,145 | 0.1% |
| Cameroon | 54 | 0.0% |
| Canada | 13,050 | 0.5% |
| Caribbean | 4,383 | 0.2% |
| Central America | 320,020 | 12.9% |
| Chile | 887 | 0.0% |
| China | 16,265 | 0.7% |
| Colombia | 2,298 | 0.1% |
| Congo | 121 | 0.0% |
| Costa Rica | 657 | 0.0% |
| Croatia | 261 | 0.0% |
| Cuba | 1,436 | 0.1% |
| Czechoslovakia | 278 | 0.0% |
| Denmark | 597 | 0.0% |
| Dominican Republic | 365 | 0.0% |
| Eastern Africa | 2,563 | 0.1% |
| Eastern Asia | 27,629 | 1.1% |
| Eastern Europe | 11,132 | 0.4% |
| Ecuador | 770 | 0.0% |
| Egypt | 1,343 | 0.1% |
| El Salvador | 11,163 | 0.4% |
| England | 3,888 | 0.2% |
| Eritrea | 62 | 0.0% |
| Ethiopia | 732 | 0.0% |
| Europe | 35,170 | 1.4% |
| Fiji | 347 | 0.0% |
| France | 2,485 | 0.1% |
| Germany | 5,111 | 0.2% |
| Ghana | 425 | 0.0% |
| Greece | 415 | 0.0% |
| Grenada | 11 | 0.0% |
| Guatemala | 12,267 | 0.5% |
| Guyana | 341 | 0.0% |
| Haiti | 428 | 0.0% |
| Honduras | 2,517 | 0.1% |
| Hong Kong | 1,887 | 0.1% |
| Hungary | 563 | 0.0% |
| India | 12,562 | 0.5% |
| Indonesia | 1,667 | 0.1% |
| Iran | 4,724 | 0.2% |
| Iraq | 1,105 | 0.0% |
| Ireland | 632 | 0.0% |
| Israel | 1,337 | 0.1% |
| Italy | 1,698 | 0.1% |
| Jamaica | 1,134 | 0.1% |
| Japan | 4,315 | 0.2% |
| Jordan | 702 | 0.0% |
| Kazakhstan | 380 | 0.0% |
| Kenya | 645 | 0.0% |
| Korea | 6,921 | 0.3% |
| Kuwait | 45 | 0.0% |
| Laos | 1,885 | 0.1% |
| Latin America | 336,002 | 13.6% |
| Latvia | 211 | 0.0% |
| Lebanon | 1,042 | 0.0% |
| Liberia | 95 | 0.0% |
| Lithuania | 293 | 0.0% |
| Malaysia | 750 | 0.0% |
| Mexico | 290,551 | 11.7% |
| Micronesia | 47 | 0.0% |
| Middle Africa | 400 | 0.0% |
| Moldova | 76 | 0.0% |
| Morocco | 418 | 0.0% |
| Nepal | 141 | 0.0% |
| Netherlands | 1,254 | 0.1% |
| Nicaragua | 1,481 | 0.1% |
| Nigeria | 1,020 | 0.0% |
| North Macedonia | 68 | 0.0% |
| Northern Africa | 2,404 | 0.1% |
| Northern Europe | 10,491 | 0.4% |
| Norway | 235 | 0.0% |
| Oceania | 3,040 | 0.1% |
| Pakistan | 438 | 0.0% |
| Panama | 753 | 0.0% |
| Peru | 2,885 | 0.1% |
| Philippines | 35,121 | 1.4% |
| Poland | 1,177 | 0.1% |
| Portugal | 326 | 0.0% |
| Romania | 1,139 | 0.1% |
| Russia | 2,066 | 0.1% |
| Saudi Arabia | 326 | 0.0% |
| Scotland | 774 | 0.0% |
| Senegal | 22 | 0.0% |
| Serbia | 634 | 0.0% |
| Sierra Leone | 88 | 0.0% |
| Singapore | 367 | 0.0% |
| Somalia | 8 | 0.0% |
| South Africa | 1,275 | 0.1% |
| South America | 11,599 | 0.5% |
| South Central Asia | 19,938 | 0.8% |
| South Eastern Asia | 57,914 | 2.3% |
| Southern Europe | 3,400 | 0.1% |
| Spain | 912 | 0.0% |
| Sri Lanka | 337 | 0.0% |
| Sudan | 401 | 0.0% |
| Sweden | 891 | 0.0% |
| Switzerland | 485 | 0.0% |
| Syria | 1,212 | 0.1% |
| Taiwan | 3,044 | 0.1% |
| Thailand | 2,418 | 0.1% |
| Trinidad and Tobago | 671 | 0.0% |
| Turkey | 692 | 0.0% |
| Uganda | 314 | 0.0% |
| Ukraine | 1,409 | 0.1% |
| Uruguay | 97 | 0.0% |
| Uzbekistan | 131 | 0.0% |
| Venezuela | 643 | 0.0% |
| Vietnam | 14,170 | 0.6% |
| West Indies | 15 | 0.0% |
| Western Africa | 1,760 | 0.1% |
| Western Asia | 7,293 | 0.3% |
| Western Europe | 10,049 | 0.4% |
| Zaire | 170 | 0.0% |
| Zimbabwe | 133 | 0.0% | View All 133 Rows |
Sex and Age in Area Code 760
Sex and Age in Area Code 760
The most populous age groups in Area Code 760 are 20 to 24 Years (102,714 | 8.1%) for men and 30 to 34 Years (86,597 | 7.2%) for women.
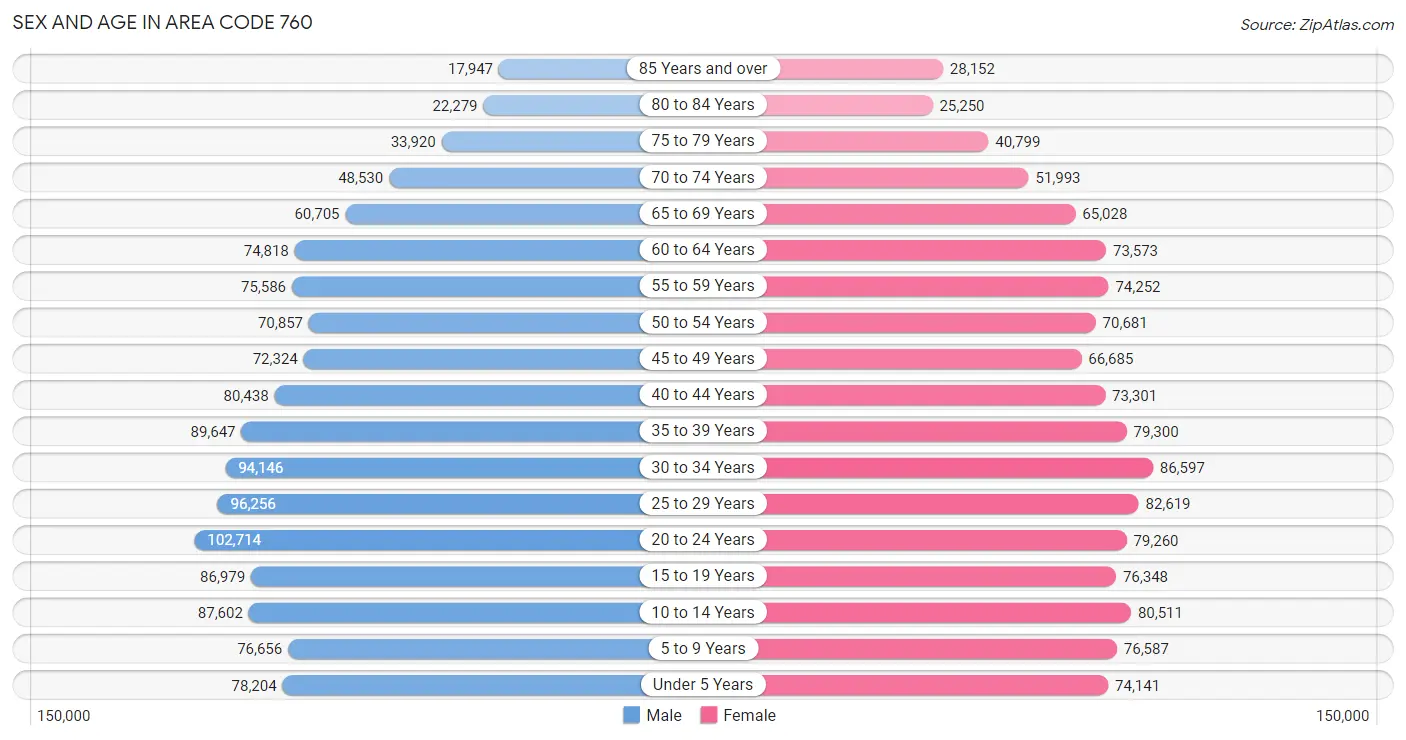
| Age Bracket | Male | Female |
| Under 5 Years | 78,204 (6.2%) | 74,141 (6.1%) |
| 5 to 9 Years | 76,656 (6.0%) | 76,587 (6.4%) |
| 10 to 14 Years | 87,602 (6.9%) | 80,511 (6.7%) |
| 15 to 19 Years | 86,979 (6.9%) | 76,348 (6.3%) |
| 20 to 24 Years | 102,714 (8.1%) | 79,260 (6.6%) |
| 25 to 29 Years | 96,256 (7.6%) | 82,619 (6.9%) |
| 30 to 34 Years | 94,146 (7.4%) | 86,597 (7.2%) |
| 35 to 39 Years | 89,647 (7.1%) | 79,300 (6.6%) |
| 40 to 44 Years | 80,438 (6.3%) | 73,301 (6.1%) |
| 45 to 49 Years | 72,324 (5.7%) | 66,685 (5.5%) |
| 50 to 54 Years | 70,857 (5.6%) | 70,681 (5.9%) |
| 55 to 59 Years | 75,586 (5.9%) | 74,252 (6.2%) |
| 60 to 64 Years | 74,818 (5.9%) | 73,573 (6.1%) |
| 65 to 69 Years | 60,705 (4.8%) | 65,028 (5.4%) |
| 70 to 74 Years | 48,530 (3.8%) | 51,993 (4.3%) |
| 75 to 79 Years | 33,920 (2.7%) | 40,799 (3.4%) |
| 80 to 84 Years | 22,279 (1.8%) | 25,250 (2.1%) |
| 85 Years and over | 17,947 (1.4%) | 28,152 (2.3%) |
| Total | 1,269,608 (100.0%) | 1,205,077 (100.0%) |
Families and Households in Area Code 760
Median Family Size in Area Code 760
The median family size in Area Code 760 is 3.25 persons per family, with single female/mother families (102,608 | 18.0%) accounting for the largest median family size of 3.3466 persons per family. On the other hand, single male/father families (49,453 | 8.7%) represent the smallest median family size with 3.17 persons per family.
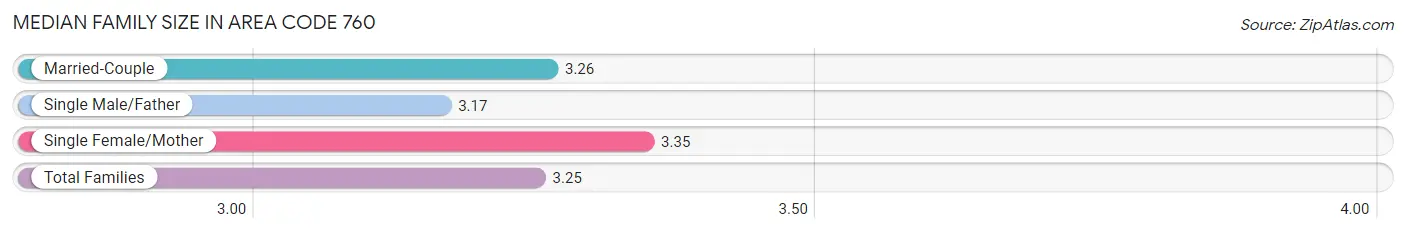
| Family Type | # Families | Family Size |
| Married-Couple | 418,042 (73.3%) | 3.26 |
| Single Male/Father | 49,453 (8.7%) | 3.17 |
| Single Female/Mother | 102,608 (18.0%) | 3.35 |
| Total Families | 570,103 (100.0%) | 3.25 |
Median Household Size in Area Code 760
The median household size in Area Code 760 is 2.65 persons per household, with single female/mother households (102,608 | 12.0%) accounting for the largest median household size of 3.59071 persons per household. non-family households (282,834 | 33.2%) represent the smallest median household size with 1.31 persons per household.
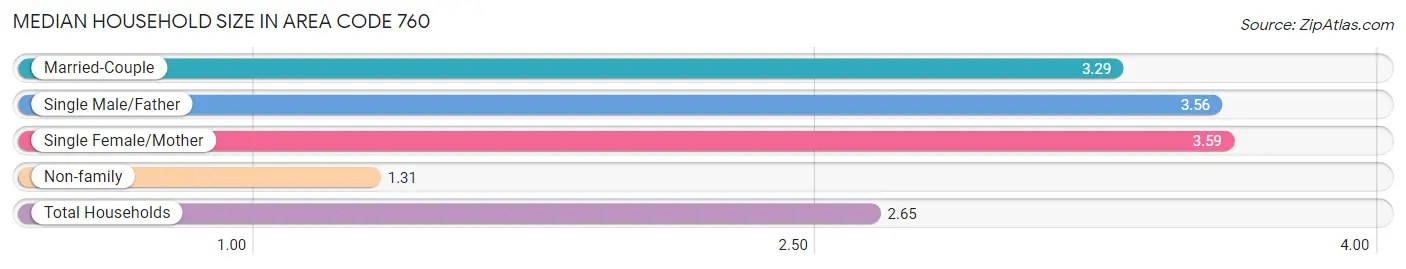
| Household Type | # Households | Household Size |
| Married-Couple | 418,042 (49.0%) | 3.29 |
| Single Male/Father | 49,453 (5.8%) | 3.56 |
| Single Female/Mother | 102,608 (12.0%) | 3.59 |
| Non-family | 282,834 (33.2%) | 1.31 |
| Total Households | 852,937 (100.0%) | 2.65 |
Household Size by Marriage Status in Area Code 760
Out of a total of 852,937 households in Area Code 760, 570,103 (66.8%) are family households, while 282,834 (33.2%) are nonfamily households. The most numerous type of family households are 2-person households, comprising 227,677, and the most common type of nonfamily households are 1-person households, comprising 217,591.

| Household Size | Family Households | Nonfamily Households |
| 1-Person Households | - | 217,591 (25.5%) |
| 2-Person Households | 227,677 (26.7%) | 53,484 (6.3%) |
| 3-Person Households | 121,629 (14.3%) | 7,031 (0.8%) |
| 4-Person Households | 111,445 (13.1%) | 2,944 (0.4%) |
| 5-Person Households | 61,959 (7.3%) | 1,101 (0.1%) |
| 6-Person Households | 26,924 (3.2%) | 417 (0.1%) |
| 7+ Person Households | 20,469 (2.4%) | 266 (0.0%) |
| Total | 570,103 (66.8%) | 282,834 (33.2%) |
Female Fertility in Area Code 760
Fertility by Age in Area Code 760
Average fertility rate in Area Code 760 is 68.7 births per 1,000 women. Women in the age bracket of 20 to 34 years have the highest fertility rate with 116.1 births per 1,000 women. Women in the age bracket of 20 to 34 years acount for 71.7% of all women with births.
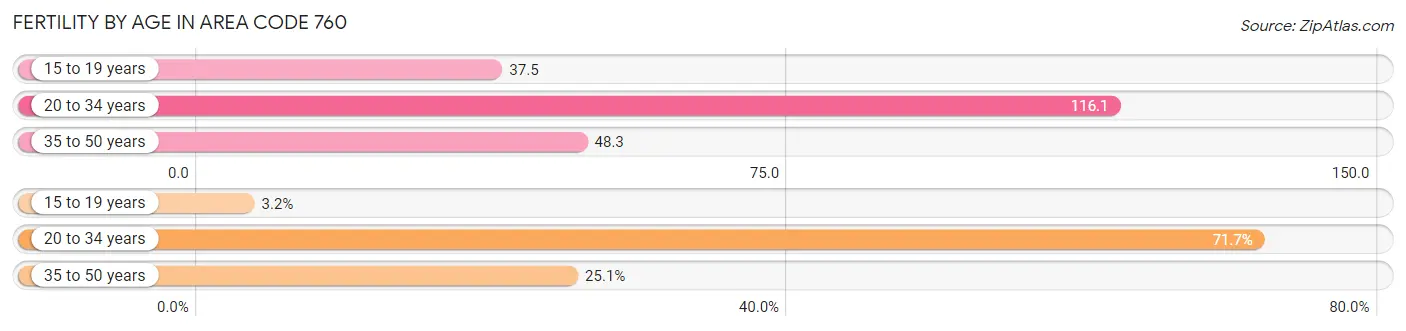
| Age Bracket | Women with Births | Births / 1,000 Women |
| 15 to 19 years | 975 (3.2%) | 37.5 |
| 20 to 34 years | 22,106 (71.7%) | 116.1 |
| 35 to 50 years | 7,745 (25.1%) | 48.3 |
| Total | 30,826 (100.0%) | 68.7 |
Fertility by Age by Marriage Status in Area Code 760
57.6% of women with births (30,826) in Area Code 760 are married. The highest percentage of unmarried women with births falls into 15 to 19 years age bracket with 94.6% of them unmarried at the time of birth, while the lowest percentage of unmarried women with births belong to 35 to 50 years age bracket with 32.6% of them unmarried.
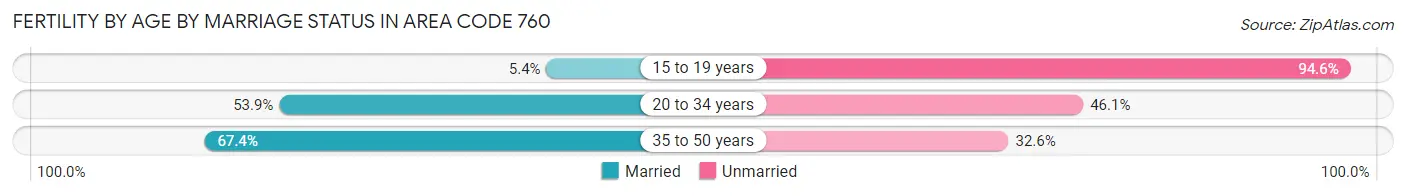
| Age Bracket | Married | Unmarried |
| 15 to 19 years | 53 (5.4%) | 922 (94.6%) |
| 20 to 34 years | 11,909 (53.9%) | 10,197 (46.1%) |
| 35 to 50 years | 5,220 (67.4%) | 2,525 (32.6%) |
| Total | 17,769 (57.6%) | 13,057 (42.4%) |
Fertility by Education in Area Code 760
Average fertility rate in Area Code 760 is 68.7 births per 1,000 women. Women with the education attainment of high school diploma have the highest fertility rate of 111.4 births per 1,000 women, while women with the education attainment of less than high school have the lowest fertility at 53.3 births per 1,000 women. Women with the education attainment of college or associate's degree represent 35.8% of all women with births.
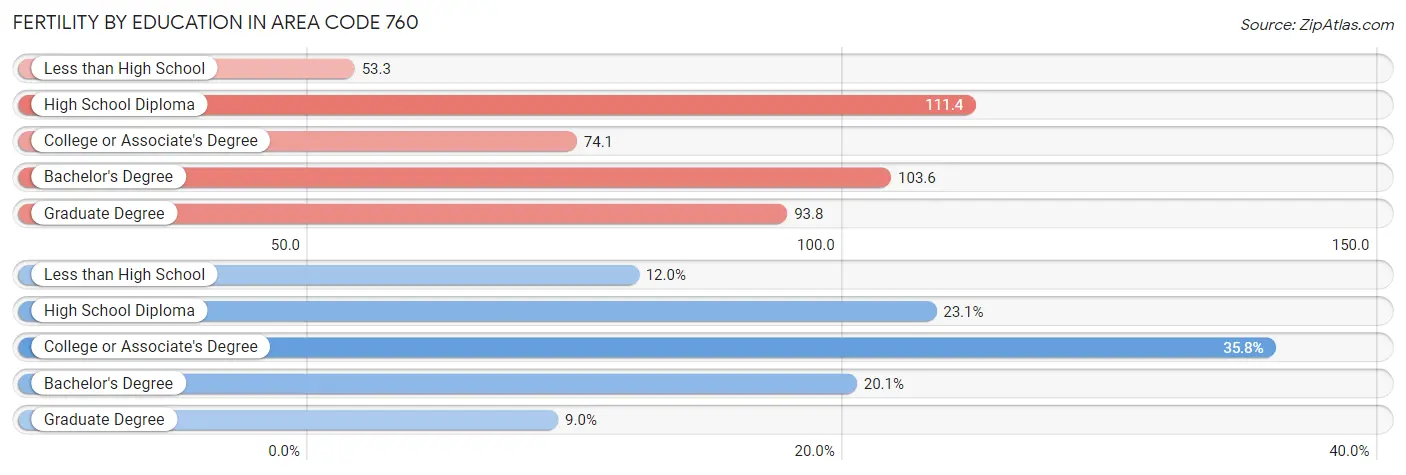
| Educational Attainment | Women with Births | Births / 1,000 Women |
| Less than High School | 3,691 (12.0%) | 53.3 |
| High School Diploma | 7,128 (23.1%) | 111.4 |
| College or Associate's Degree | 11,042 (35.8%) | 74.1 |
| Bachelor's Degree | 6,207 (20.1%) | 103.6 |
| Graduate Degree | 2,758 (8.9%) | 93.8 |
| Total | 30,826 (100.0%) | 68.7 |
Fertility by Education by Marriage Status in Area Code 760
42.4% of women with births in Area Code 760 are unmarried. Women with the educational attainment of graduate degree are most likely to be married with 69.4% of them married at childbirth, while women with the educational attainment of less than high school are least likely to be married with 67.6% of them unmarried at childbirth.
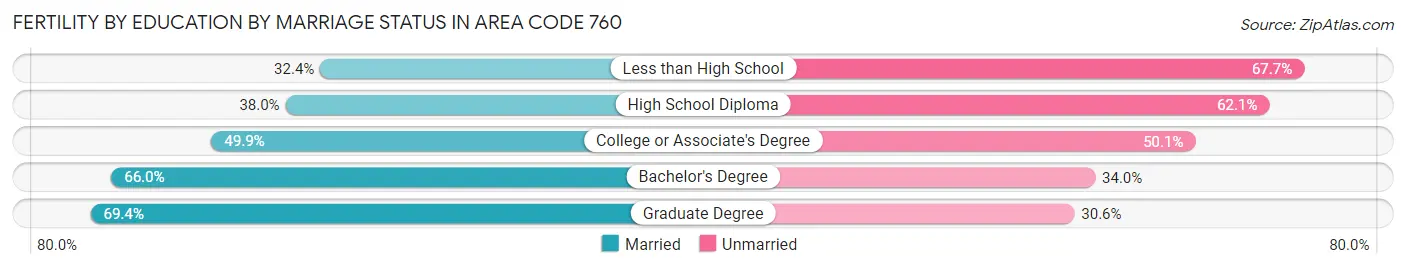
| Educational Attainment | Married | Unmarried |
| Less than High School | 1,194 (32.4%) | 2,497 (67.6%) |
| High School Diploma | 2,705 (38.0%) | 4,423 (62.1%) |
| College or Associate's Degree | 5,508 (49.9%) | 5,534 (50.1%) |
| Bachelor's Degree | 4,098 (66.0%) | 2,109 (34.0%) |
| Graduate Degree | 1,913 (69.4%) | 845 (30.6%) |
| Total | 17,769 (57.6%) | 13,057 (42.4%) |
Employment Characteristics in Area Code 760
Employment by Class of Employer in Area Code 760
Among the 1,092,102 employed individuals in Area Code 760, private company employees (694,870 | 63.6%), self-employed (not incorporated) (84,799 | 7.8%), and federal government employees (84,751 | 7.8%) make up the most common classes of employment.
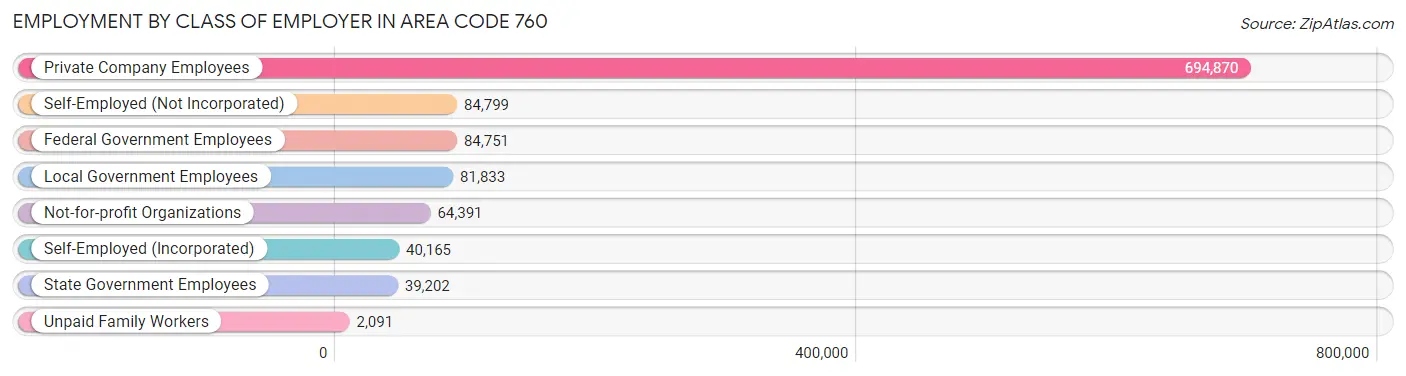
| Employer Class | # Employees | % Employees |
| Private Company Employees | 694,870 | 63.6% |
| Self-Employed (Incorporated) | 40,165 | 3.7% |
| Self-Employed (Not Incorporated) | 84,799 | 7.8% |
| Not-for-profit Organizations | 64,391 | 5.9% |
| Local Government Employees | 81,833 | 7.5% |
| State Government Employees | 39,202 | 3.6% |
| Federal Government Employees | 84,751 | 7.8% |
| Unpaid Family Workers | 2,091 | 0.2% |
| Total | 1,092,102 | 100.0% |
Employment Status by Age in Area Code 760
According to the labor force statistics for Area Code 760, out of the total population over 16 years of age (1,967,265), 55.8% or 1,098,324 individuals are in the labor force, with 10.2% or 112,139 of them unemployed. The age group with the highest labor force participation rate is 35 to 44 years, with 78.4% or 252,986 individuals in the labor force. Within the labor force, the 16 to 19 years age range has the highest percentage of unemployed individuals, with 2,381.5% or 1,153,480 of them being unemployed.
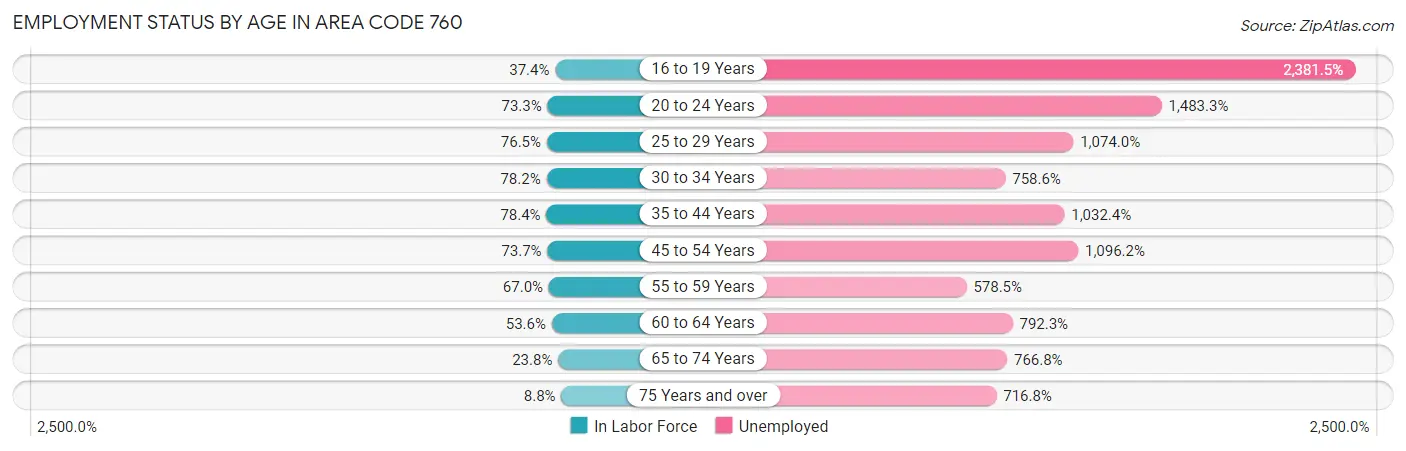
| Age Bracket | In Labor Force | Unemployed |
| 16 to 19 Years | 48,434 (37.4%) | 1,153,480 (2,381.5%) |
| 20 to 24 Years | 133,437 (73.3%) | 1,979,345 (1,483.3%) |
| 25 to 29 Years | 136,853 (76.5%) | 1,469,844 (1,074.0%) |
| 30 to 34 Years | 141,361 (78.2%) | 1,072,349 (758.6%) |
| 35 to 44 Years | 252,983 (78.4%) | 2,611,827 (1,032.4%) |
| 45 to 54 Years | 206,880 (73.7%) | 2,267,764 (1,096.2%) |
| 55 to 59 Years | 100,421 (67.0%) | 580,935 (578.5%) |
| 60 to 64 Years | 79,536 (53.6%) | 630,180 (792.3%) |
| 65 to 74 Years | 53,828 (23.8%) | 412,738 (766.8%) |
| 75 Years and over | 14,852 (8.8%) | 106,430 (716.8%) |
| Total | 1,098,337 (55.8%) | 112,125 (10.2%) |
Employment Status by Educational Attainment in Area Code 760
According to labor force statistics for Area Code 760, 71.3% of individuals (898,772) out of the total population between 25 and 64 years of age (1,261,080) are in the labor force, with 984.7% or 8,850,208 of them being unemployed. The group with the highest labor force participation rate are those with the educational attainment of bachelor's degree or higher, with 82.3% or 312,050 individuals in the labor force. Within the labor force, individuals with less than high school education have the highest percentage of unemployment, with 1,170.3% or 1,353,253 of them being unemployed.
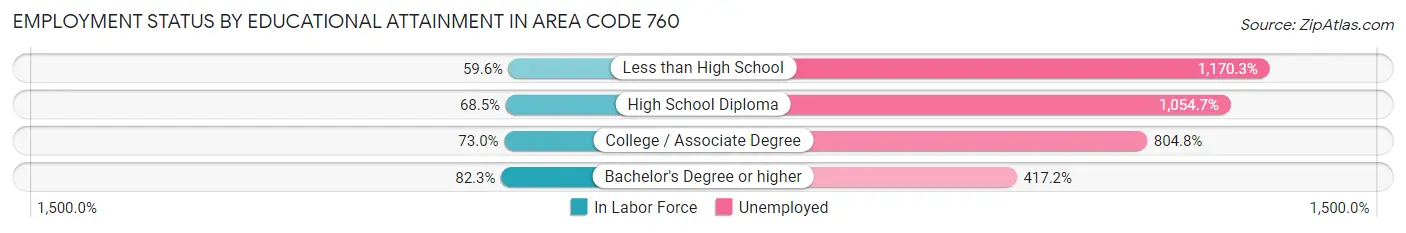
| Educational Attainment | In Labor Force | Unemployed |
| Less than High School | 115,626 (59.6%) | 2,271,330 (1,170.3%) |
| High School Diploma | 202,769 (68.5%) | 3,121,480 (1,054.7%) |
| College / Associate Degree | 286,345 (73.0%) | 3,155,315 (804.8%) |
| Bachelor's Degree or higher | 312,041 (82.3%) | 1,581,096 (417.2%) |
| Total | 898,812 (71.3%) | 12,417,855 (984.7%) |
Employment Occupations by Sex in Area Code 760
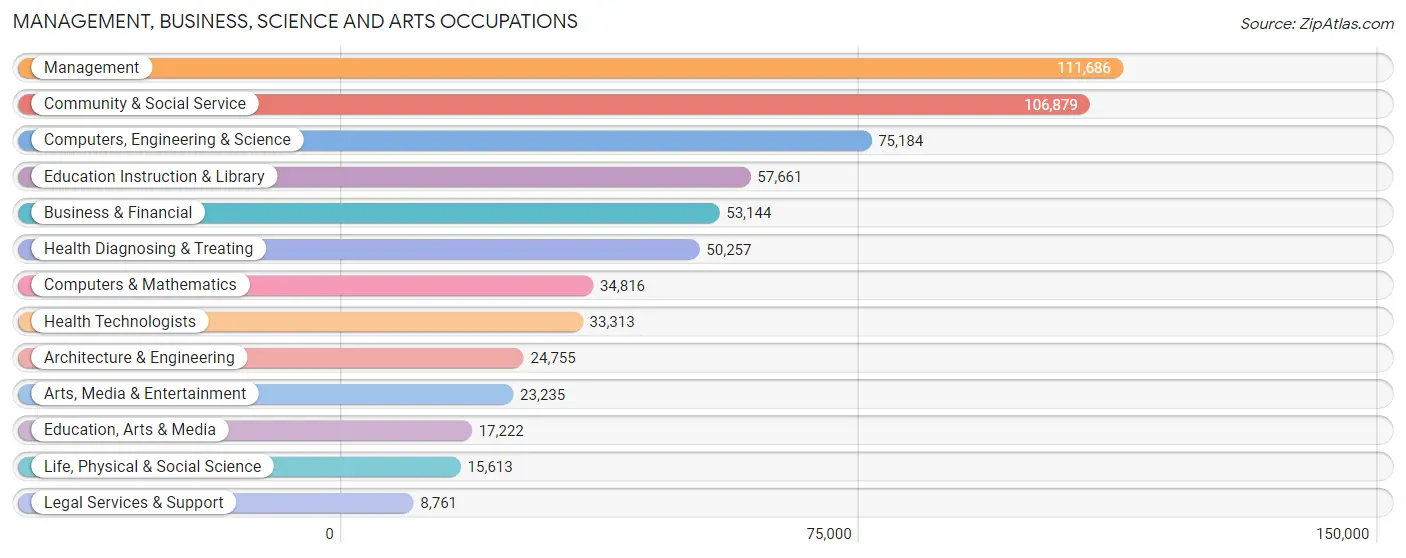
Management, Business, Science and Arts Occupations
The most common Management, Business, Science and Arts occupations in Area Code 760 are Management (111,686 | 10.5%), Community & Social Service (106,879 | 10.0%), Computers, Engineering & Science (75,184 | 7.1%), Education Instruction & Library (57,661 | 5.4%), and Business & Financial (53,144 | 5.0%).
Management, Business, Science and Arts Occupations by Sex
Within the Management, Business, Science and Arts occupations in Area Code 760, the most male-oriented occupations are Architecture & Engineering (84.7%), Computers & Mathematics (77.3%), and Computers, Engineering & Science (74.3%), while the most female-oriented occupations are Health Technologists (71.0%), Health Diagnosing & Treating (70.6%), and Education Instruction & Library (70.1%).
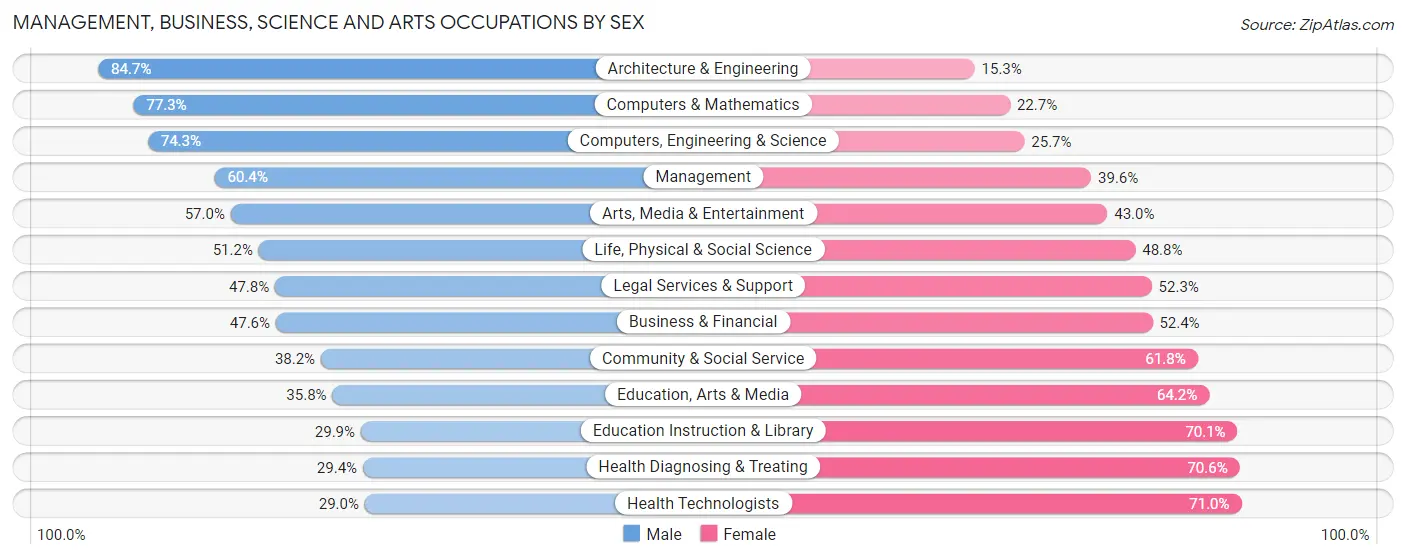
| Occupation | Male | Female |
| Management | 67,439 (60.4%) | 44,247 (39.6%) |
| Business & Financial | 25,287 (47.6%) | 27,857 (52.4%) |
| Computers, Engineering & Science | 55,862 (74.3%) | 19,322 (25.7%) |
| Computers & Mathematics | 26,912 (77.3%) | 7,904 (22.7%) |
| Architecture & Engineering | 20,962 (84.7%) | 3,793 (15.3%) |
| Life, Physical & Social Science | 7,988 (51.2%) | 7,625 (48.8%) |
| Community & Social Service | 40,809 (38.2%) | 66,070 (61.8%) |
| Education, Arts & Media | 6,163 (35.8%) | 11,059 (64.2%) |
| Legal Services & Support | 4,183 (47.7%) | 4,578 (52.2%) |
| Education Instruction & Library | 17,219 (29.9%) | 40,442 (70.1%) |
| Arts, Media & Entertainment | 13,244 (57.0%) | 9,991 (43.0%) |
| Health Diagnosing & Treating | 14,790 (29.4%) | 35,467 (70.6%) |
| Health Technologists | 9,675 (29.0%) | 23,638 (71.0%) |
| Total (Category) | 204,187 (51.4%) | 192,963 (48.6%) |
| Total (Overall) | 586,659 (55.1%) | 477,989 (44.9%) |
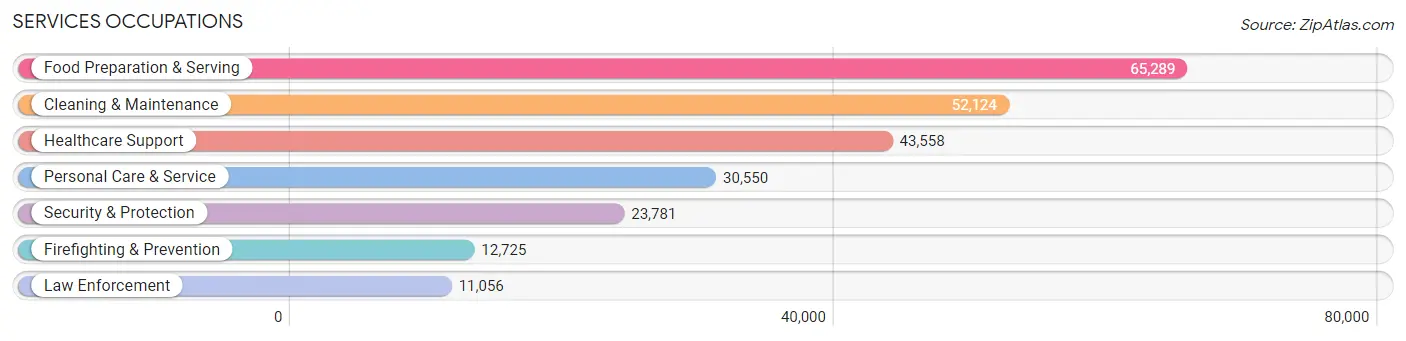
Services Occupations
The most common Services occupations in Area Code 760 are Food Preparation & Serving (65,289 | 6.1%), Cleaning & Maintenance (52,124 | 4.9%), Healthcare Support (43,558 | 4.1%), Personal Care & Service (30,550 | 2.9%), and Security & Protection (23,781 | 2.2%).
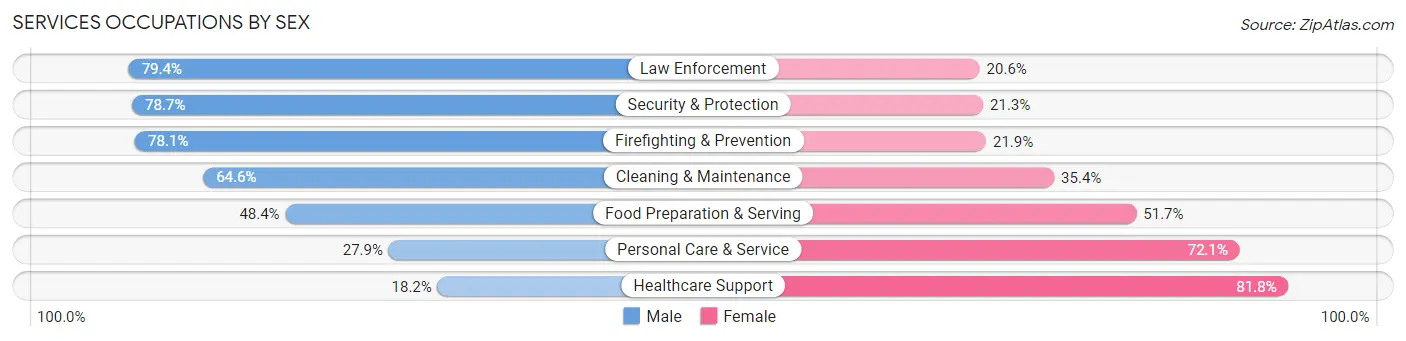
Services Occupations by Sex
Within the Services occupations in Area Code 760, the most male-oriented occupations are Law Enforcement (79.4%), Security & Protection (78.7%), and Firefighting & Prevention (78.1%), while the most female-oriented occupations are Healthcare Support (81.8%), Personal Care & Service (72.1%), and Food Preparation & Serving (51.6%).
| Occupation | Male | Female |
| Healthcare Support | 7,937 (18.2%) | 35,621 (81.8%) |
| Security & Protection | 18,716 (78.7%) | 5,065 (21.3%) |
| Firefighting & Prevention | 9,940 (78.1%) | 2,785 (21.9%) |
| Law Enforcement | 8,776 (79.4%) | 2,280 (20.6%) |
| Food Preparation & Serving | 31,566 (48.3%) | 33,723 (51.6%) |
| Cleaning & Maintenance | 33,687 (64.6%) | 18,437 (35.4%) |
| Personal Care & Service | 8,516 (27.9%) | 22,034 (72.1%) |
| Total (Category) | 100,422 (46.6%) | 114,880 (53.4%) |
| Total (Overall) | 586,659 (55.1%) | 477,989 (44.9%) |
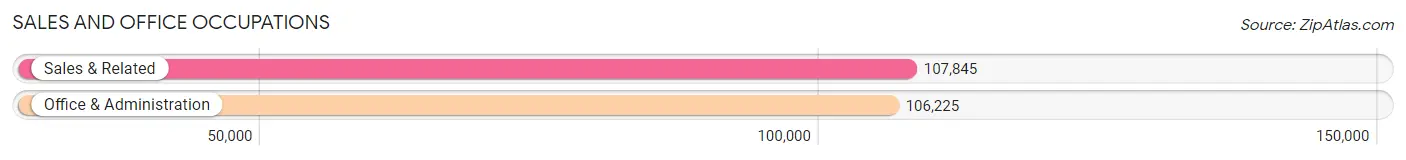
Sales and Office Occupations
The most common Sales and Office occupations in Area Code 760 are Sales & Related (107,845 | 10.1%), and Office & Administration (106,225 | 10.0%).
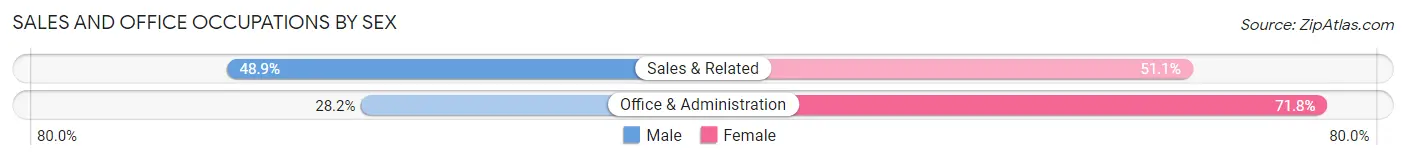
Sales and Office Occupations by Sex
| Occupation | Male | Female |
| Sales & Related | 52,761 (48.9%) | 55,084 (51.1%) |
| Office & Administration | 29,957 (28.2%) | 76,268 (71.8%) |
| Total (Category) | 82,718 (38.6%) | 131,352 (61.4%) |
| Total (Overall) | 586,659 (55.1%) | 477,989 (44.9%) |
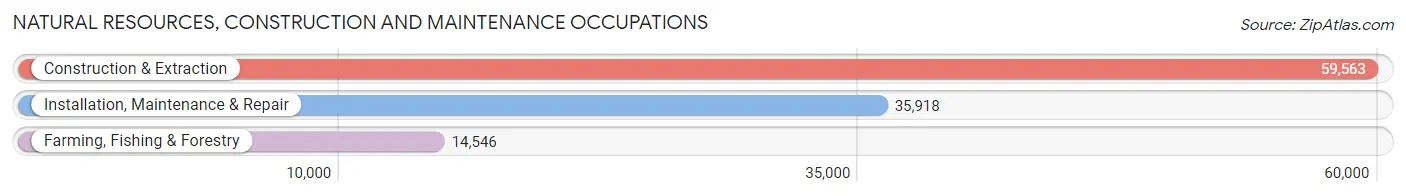
Natural Resources, Construction and Maintenance Occupations
The most common Natural Resources, Construction and Maintenance occupations in Area Code 760 are Construction & Extraction (59,563 | 5.6%), Installation, Maintenance & Repair (35,918 | 3.4%), and Farming, Fishing & Forestry (14,546 | 1.4%).
Natural Resources, Construction and Maintenance Occupations by Sex
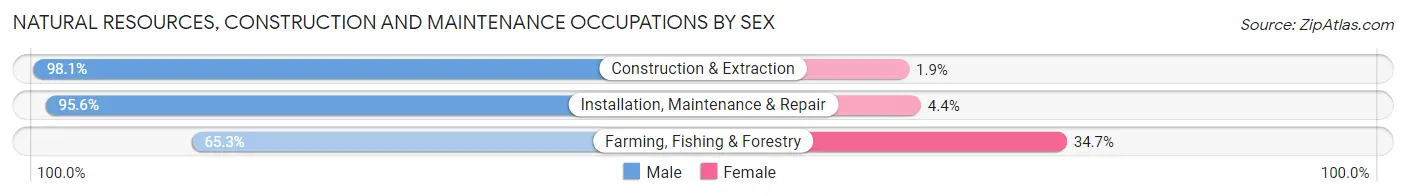
| Occupation | Male | Female |
| Farming, Fishing & Forestry | 9,495 (65.3%) | 5,051 (34.7%) |
| Construction & Extraction | 58,426 (98.1%) | 1,137 (1.9%) |
| Installation, Maintenance & Repair | 34,348 (95.6%) | 1,570 (4.4%) |
| Total (Category) | 102,269 (92.9%) | 7,758 (7.0%) |
| Total (Overall) | 586,659 (55.1%) | 477,989 (44.9%) |
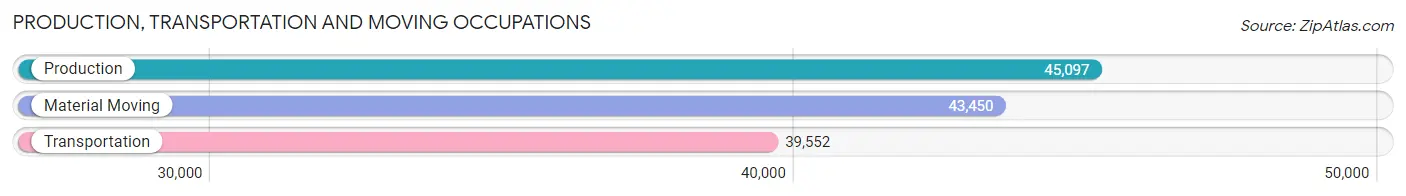
Production, Transportation and Moving Occupations
The most common Production, Transportation and Moving occupations in Area Code 760 are Production (45,097 | 4.2%), Material Moving (43,450 | 4.1%), and Transportation (39,552 | 3.7%).
Production, Transportation and Moving Occupations by Sex
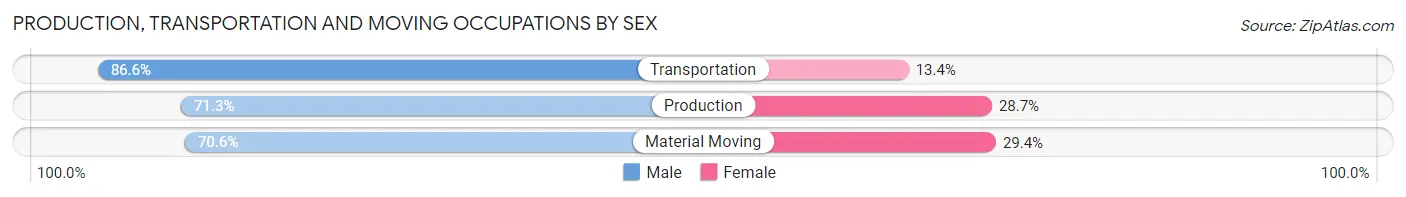
| Occupation | Male | Female |
| Production | 32,155 (71.3%) | 12,942 (28.7%) |
| Transportation | 34,244 (86.6%) | 5,308 (13.4%) |
| Material Moving | 30,664 (70.6%) | 12,786 (29.4%) |
| Total (Category) | 97,063 (75.8%) | 31,036 (24.2%) |
| Total (Overall) | 586,659 (55.1%) | 477,989 (44.9%) |
Employment Industries by Sex in Area Code 760
Employment Industries in Area Code 760
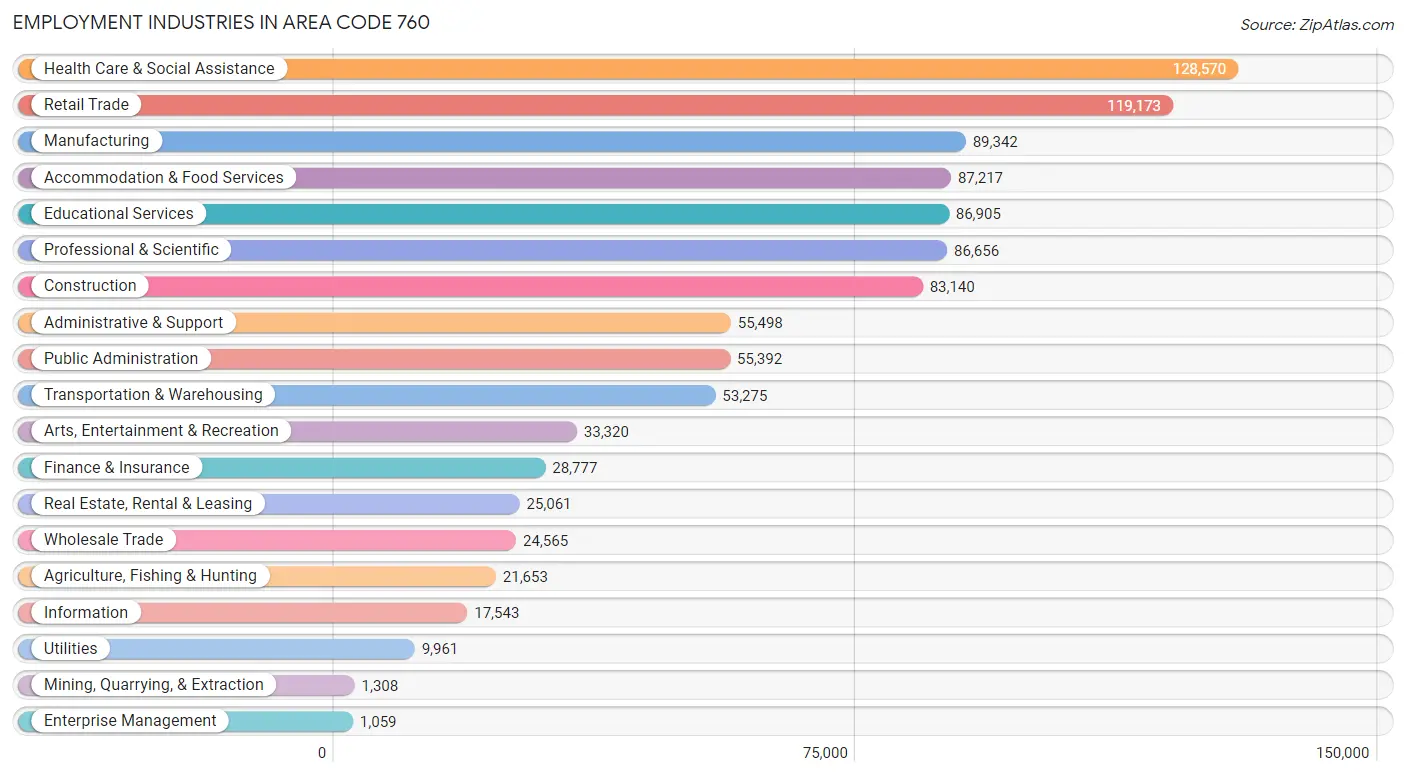
The major employment industries in Area Code 760 include Health Care & Social Assistance (128,570 | 12.1%), Retail Trade (119,173 | 11.2%), Manufacturing (89,342 | 8.4%), Accommodation & Food Services (87,217 | 8.2%), and Educational Services (86,905 | 8.2%).
Employment Industries by Sex in Area Code 760
The Area Code 760 industries that see more men than women are Mining, Quarrying, & Extraction (93.6%), Construction (90.2%), and Utilities (78.1%), whereas the industries that tend to have a higher number of women are Health Care & Social Assistance (75.3%), Educational Services (68.2%), and Enterprise Management (60.6%).
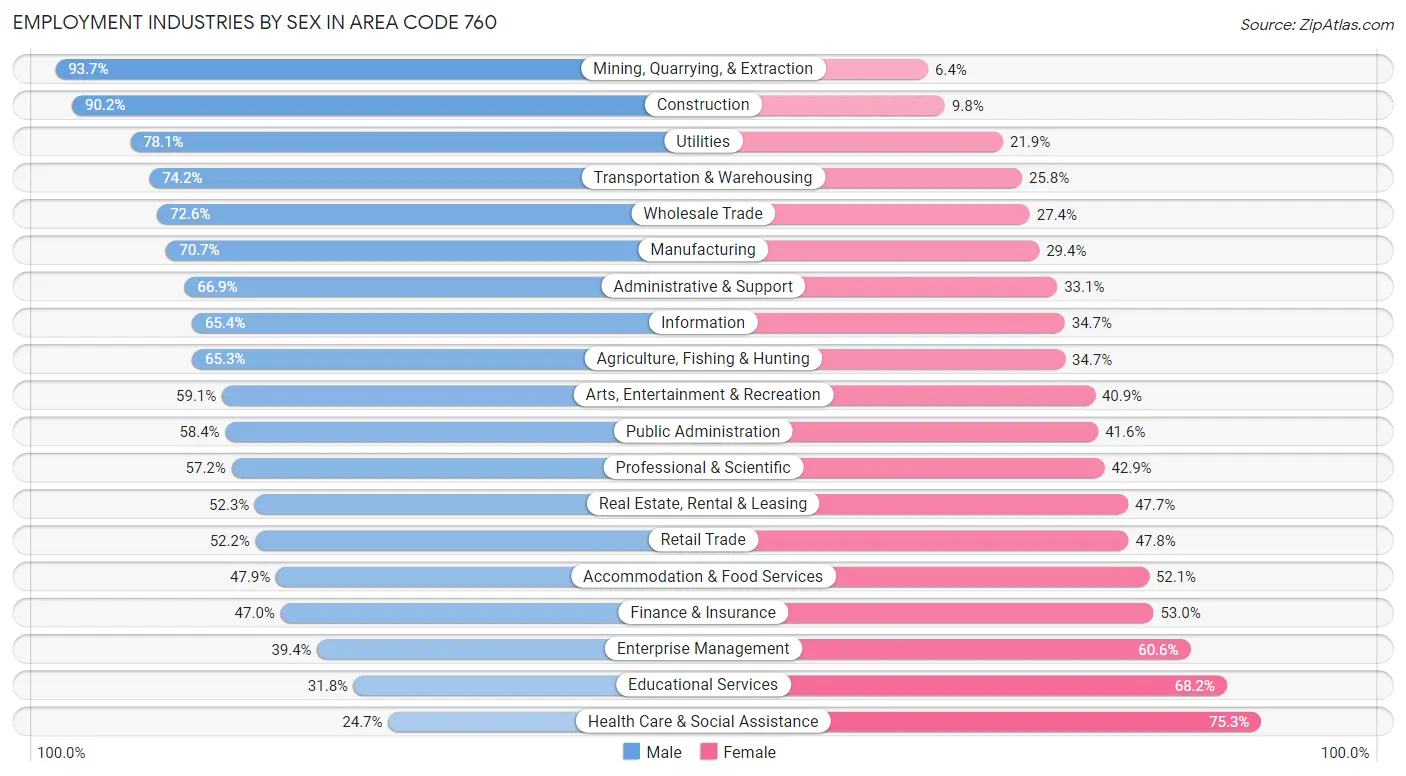
| Industry | Male | Female |
| Agriculture, Fishing & Hunting | 14,142 (65.3%) | 7,511 (34.7%) |
| Mining, Quarrying, & Extraction | 1,225 (93.6%) | 83 (6.4%) |
| Construction | 74,964 (90.2%) | 8,176 (9.8%) |
| Manufacturing | 63,120 (70.7%) | 26,222 (29.3%) |
| Wholesale Trade | 17,831 (72.6%) | 6,734 (27.4%) |
| Retail Trade | 62,171 (52.2%) | 57,002 (47.8%) |
| Transportation & Warehousing | 39,529 (74.2%) | 13,746 (25.8%) |
| Utilities | 7,784 (78.1%) | 2,177 (21.9%) |
| Information | 11,465 (65.3%) | 6,078 (34.6%) |
| Finance & Insurance | 13,524 (47.0%) | 15,253 (53.0%) |
| Real Estate, Rental & Leasing | 13,103 (52.3%) | 11,958 (47.7%) |
| Professional & Scientific | 49,521 (57.2%) | 37,135 (42.8%) |
| Enterprise Management | 417 (39.4%) | 642 (60.6%) |
| Administrative & Support | 37,142 (66.9%) | 18,356 (33.1%) |
| Educational Services | 27,673 (31.8%) | 59,232 (68.2%) |
| Health Care & Social Assistance | 31,766 (24.7%) | 96,804 (75.3%) |
| Arts, Entertainment & Recreation | 19,700 (59.1%) | 13,620 (40.9%) |
| Accommodation & Food Services | 41,812 (47.9%) | 45,405 (52.1%) |
| Public Administration | 32,365 (58.4%) | 23,027 (41.6%) |
| Total | 586,659 (55.1%) | 477,989 (44.9%) |
Education in Area Code 760
School Enrollment in Area Code 760
The most common levels of schooling among the 616,081 students in Area Code 760 are college / undergraduate (144,097 | 23.4%), high school (133,585 | 21.7%), and middle school (130,065 | 21.1%).
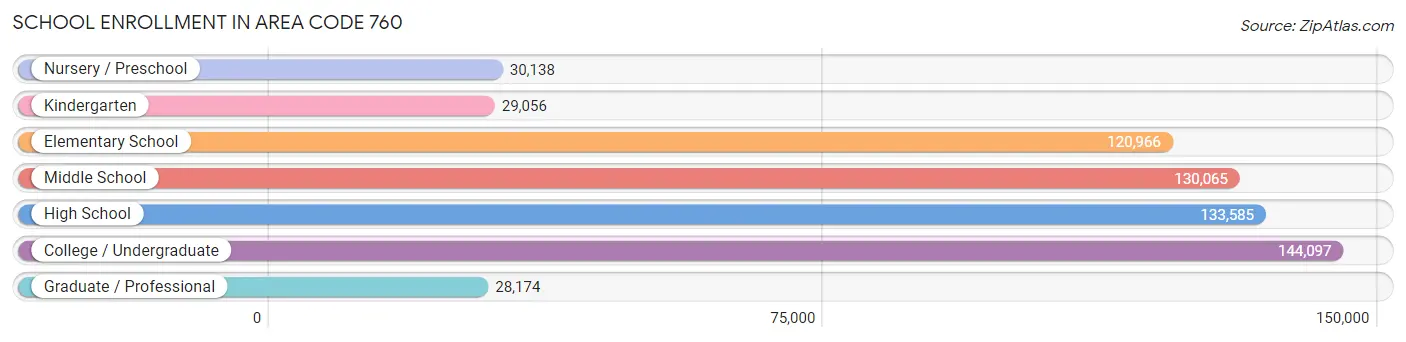
| School Level | # Students | % Students |
| Nursery / Preschool | 30,138 | 4.9% |
| Kindergarten | 29,056 | 4.7% |
| Elementary School | 120,966 | 19.6% |
| Middle School | 130,065 | 21.1% |
| High School | 133,585 | 21.7% |
| College / Undergraduate | 144,097 | 23.4% |
| Graduate / Professional | 28,174 | 4.6% |
| Total | 616,081 | 100.0% |
School Enrollment by Age by Funding Source in Area Code 760
Out of a total of 616,081 students who are enrolled in schools in Area Code 760, 70,687 (11.5%) attend a private institution, while the remaining 545,394 (88.5%) are enrolled in public schools. The age group of 3 to 4 year olds has the highest likelihood of being enrolled in private schools, with 8,849 (37.7% in the age bracket) enrolled. Conversely, the age group of 15 to 17 year olds has the lowest likelihood of being enrolled in a private school, with 86,772 (94.1% in the age bracket) attending a public institution.
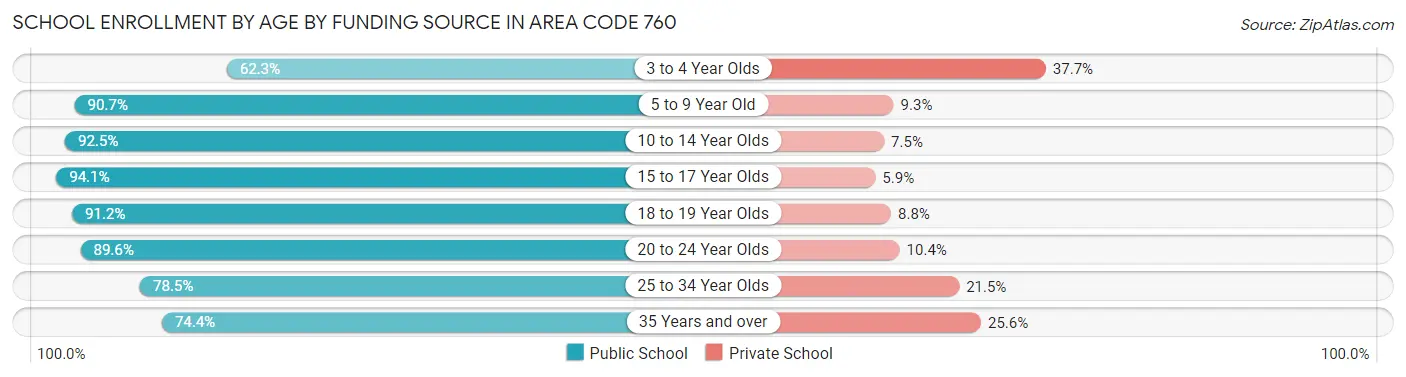
| Age Bracket | Public School | Private School |
| 3 to 4 Year Olds | 14,644 (62.3%) | 8,849 (37.7%) |
| 5 to 9 Year Old | 129,849 (90.7%) | 13,335 (9.3%) |
| 10 to 14 Year Olds | 152,256 (92.5%) | 12,415 (7.5%) |
| 15 to 17 Year Olds | 86,772 (94.1%) | 5,455 (5.9%) |
| 18 to 19 Year Olds | 38,430 (91.2%) | 3,725 (8.8%) |
| 20 to 24 Year Olds | 57,577 (89.6%) | 6,705 (10.4%) |
| 25 to 34 Year Olds | 36,119 (78.5%) | 9,906 (21.5%) |
| 35 Years and over | 29,798 (74.4%) | 10,246 (25.6%) |
| Total | 545,394 (88.5%) | 70,687 (11.5%) |
Educational Attainment by Field of Study in Area Code 760
Business (99,276 | 18.4%), social sciences (50,587 | 9.4%), engineering (46,866 | 8.7%), science & technology (44,762 | 8.3%), and education (42,389 | 7.9%) are the most common fields of study among 539,585 individuals in Area Code 760 who have obtained a bachelor's degree or higher.
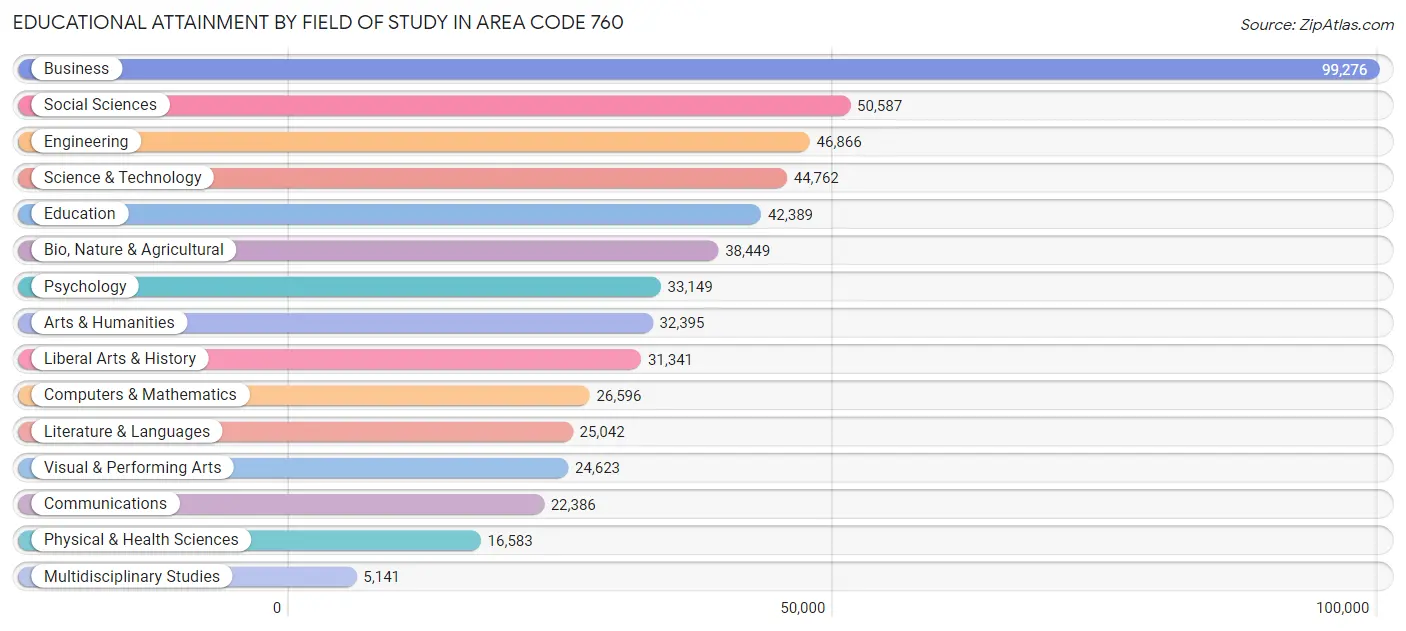
| Field of Study | # Graduates | % Graduates |
| Computers & Mathematics | 26,596 | 4.9% |
| Bio, Nature & Agricultural | 38,449 | 7.1% |
| Physical & Health Sciences | 16,583 | 3.1% |
| Psychology | 33,149 | 6.1% |
| Social Sciences | 50,587 | 9.4% |
| Engineering | 46,866 | 8.7% |
| Multidisciplinary Studies | 5,141 | 0.9% |
| Science & Technology | 44,762 | 8.3% |
| Business | 99,276 | 18.4% |
| Education | 42,389 | 7.9% |
| Literature & Languages | 25,042 | 4.6% |
| Liberal Arts & History | 31,341 | 5.8% |
| Visual & Performing Arts | 24,623 | 4.6% |
| Communications | 22,386 | 4.2% |
| Arts & Humanities | 32,395 | 6.0% |
| Total | 539,585 | 100.0% |
Transportation & Commute in Area Code 760
Vehicle Availability by Sex in Area Code 760
The most prevalent vehicle ownership categories in Area Code 760 are males with 2 vehicles (237,225, accounting for 39.8%) and females with 2 vehicles (182,096, making up 50.9%).
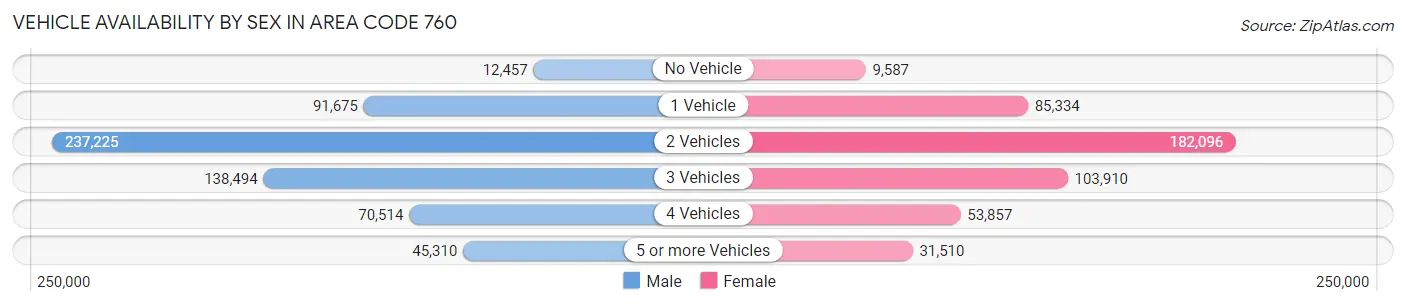
| Vehicles Available | Male | Female |
| No Vehicle | 12,457 (2.1%) | 9,587 (2.1%) |
| 1 Vehicle | 91,675 (15.4%) | 85,334 (18.3%) |
| 2 Vehicles | 237,225 (39.8%) | 182,096 (39.1%) |
| 3 Vehicles | 138,494 (23.3%) | 103,910 (22.3%) |
| 4 Vehicles | 70,514 (11.8%) | 53,857 (11.6%) |
| 5 or more Vehicles | 45,310 (7.6%) | 31,510 (6.8%) |
| Total | 595,675 (100.0%) | 466,294 (100.0%) |
Commute Time in Area Code 760
The most frequently occuring commute durations in Area Code 760 are 15 to 19 minutes (152,737 commuters, 16.0%), 20 to 24 minutes (140,457 commuters, 14.7%), and 10 to 14 minutes (133,963 commuters, 14.0%).
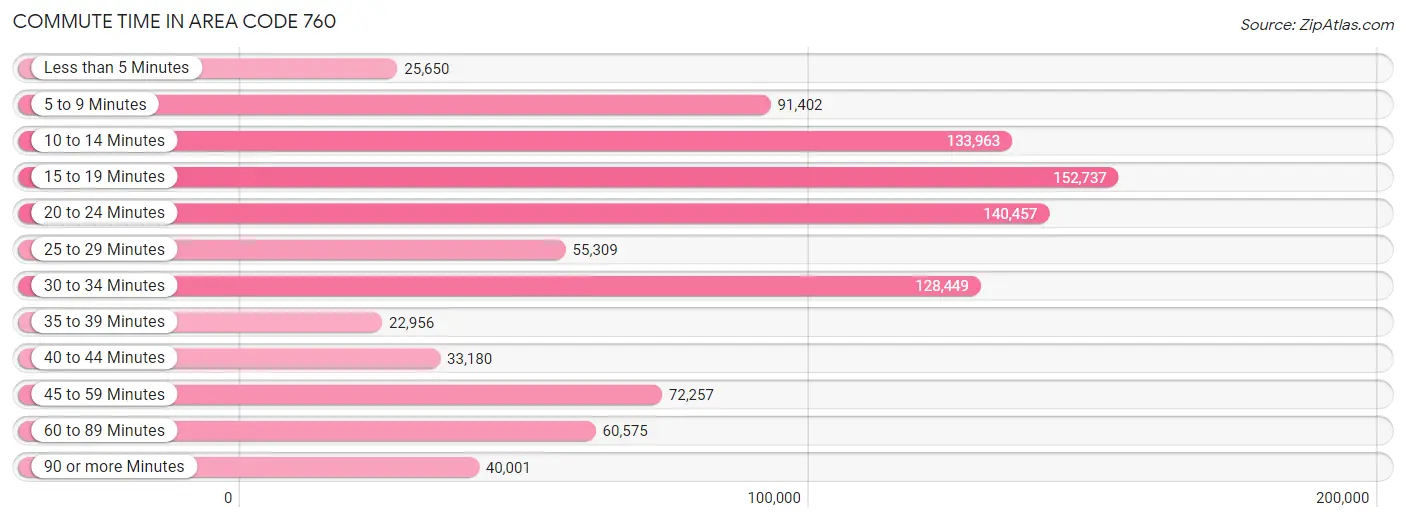
| Commute Time | # Commuters | % Commuters |
| Less than 5 Minutes | 25,650 | 2.7% |
| 5 to 9 Minutes | 91,402 | 9.6% |
| 10 to 14 Minutes | 133,963 | 14.0% |
| 15 to 19 Minutes | 152,737 | 16.0% |
| 20 to 24 Minutes | 140,457 | 14.7% |
| 25 to 29 Minutes | 55,309 | 5.8% |
| 30 to 34 Minutes | 128,449 | 13.4% |
| 35 to 39 Minutes | 22,956 | 2.4% |
| 40 to 44 Minutes | 33,180 | 3.5% |
| 45 to 59 Minutes | 72,257 | 7.5% |
| 60 to 89 Minutes | 60,575 | 6.3% |
| 90 or more Minutes | 40,001 | 4.2% |
Commute Time by Sex in Area Code 760
The most common commute times in Area Code 760 are 15 to 19 minutes (81,264 commuters, 14.7%) for males and 15 to 19 minutes (71,473 commuters, 17.7%) for females.
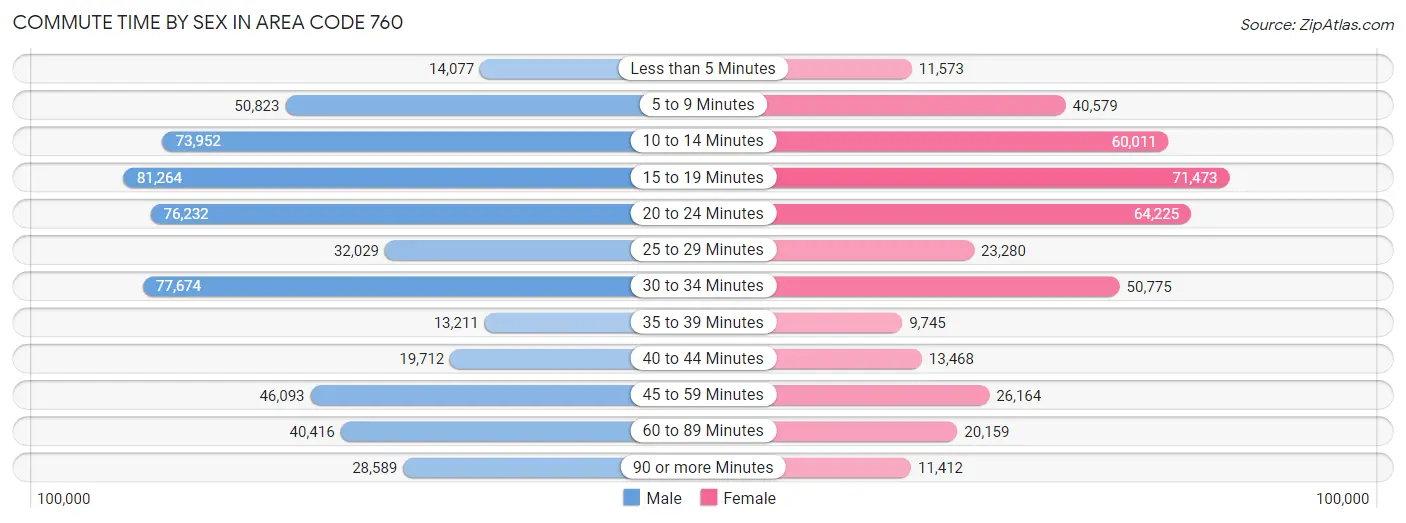
| Commute Time | Male | Female |
| Less than 5 Minutes | 14,077 (2.5%) | 11,573 (2.9%) |
| 5 to 9 Minutes | 50,823 (9.2%) | 40,579 (10.1%) |
| 10 to 14 Minutes | 73,952 (13.4%) | 60,011 (14.9%) |
| 15 to 19 Minutes | 81,264 (14.7%) | 71,473 (17.7%) |
| 20 to 24 Minutes | 76,232 (13.8%) | 64,225 (15.9%) |
| 25 to 29 Minutes | 32,029 (5.8%) | 23,280 (5.8%) |
| 30 to 34 Minutes | 77,674 (14.0%) | 50,775 (12.6%) |
| 35 to 39 Minutes | 13,211 (2.4%) | 9,745 (2.4%) |
| 40 to 44 Minutes | 19,712 (3.6%) | 13,468 (3.3%) |
| 45 to 59 Minutes | 46,093 (8.3%) | 26,164 (6.5%) |
| 60 to 89 Minutes | 40,416 (7.3%) | 20,159 (5.0%) |
| 90 or more Minutes | 28,589 (5.2%) | 11,412 (2.8%) |
Time of Departure to Work by Sex in Area Code 760
The most frequent times of departure to work in Area Code 760 are 7:00 AM to 7:29 AM (74,216, 13.4%) for males and 7:00 AM to 7:29 AM (60,585, 15.0%) for females.
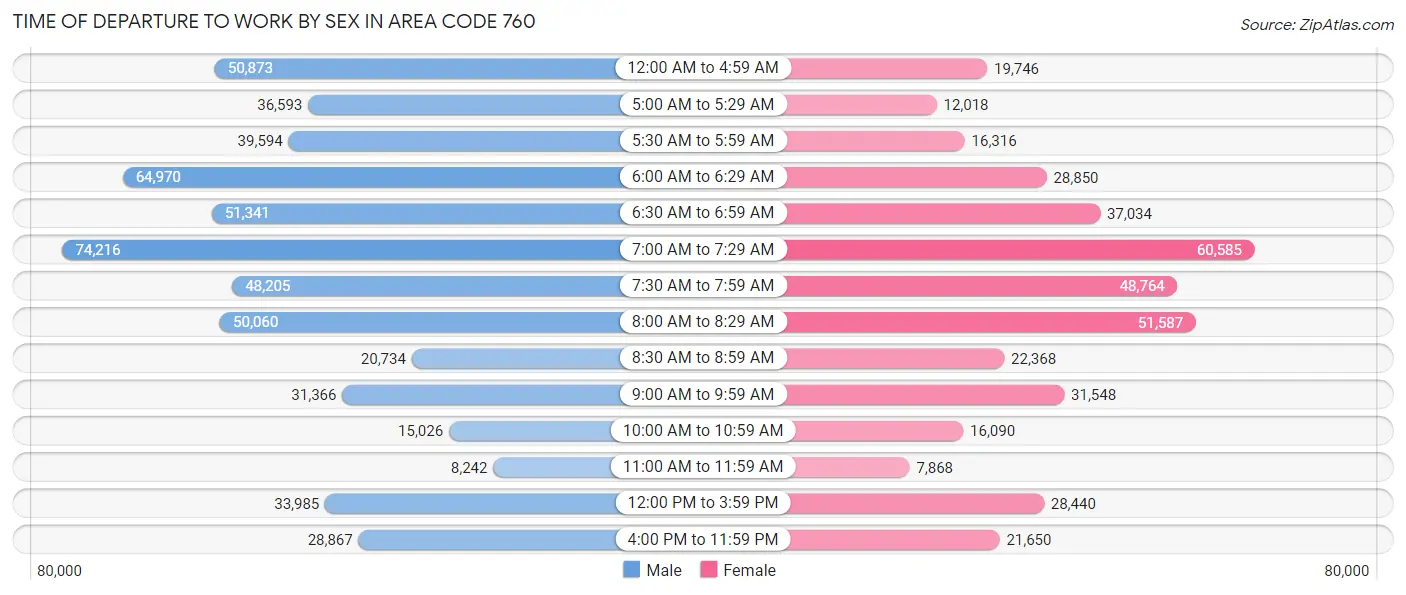
| Time of Departure | Male | Female |
| 12:00 AM to 4:59 AM | 50,873 (9.2%) | 19,746 (4.9%) |
| 5:00 AM to 5:29 AM | 36,593 (6.6%) | 12,018 (3.0%) |
| 5:30 AM to 5:59 AM | 39,594 (7.1%) | 16,316 (4.1%) |
| 6:00 AM to 6:29 AM | 64,970 (11.7%) | 28,850 (7.2%) |
| 6:30 AM to 6:59 AM | 51,341 (9.3%) | 37,034 (9.2%) |
| 7:00 AM to 7:29 AM | 74,216 (13.4%) | 60,585 (15.0%) |
| 7:30 AM to 7:59 AM | 48,205 (8.7%) | 48,764 (12.1%) |
| 8:00 AM to 8:29 AM | 50,060 (9.0%) | 51,587 (12.8%) |
| 8:30 AM to 8:59 AM | 20,734 (3.7%) | 22,368 (5.6%) |
| 9:00 AM to 9:59 AM | 31,366 (5.7%) | 31,548 (7.8%) |
| 10:00 AM to 10:59 AM | 15,026 (2.7%) | 16,090 (4.0%) |
| 11:00 AM to 11:59 AM | 8,242 (1.5%) | 7,868 (1.9%) |
| 12:00 PM to 3:59 PM | 33,985 (6.1%) | 28,440 (7.1%) |
| 4:00 PM to 11:59 PM | 28,867 (5.2%) | 21,650 (5.4%) |
| Total | 554,072 (100.0%) | 402,864 (100.0%) |
Housing Occupancy in Area Code 760
Occupancy by Ownership in Area Code 760
Of the total 852,937 dwellings in Area Code 760, owner-occupied units account for 513,142 (60.2%), while renter-occupied units make up 339,795 (39.8%).
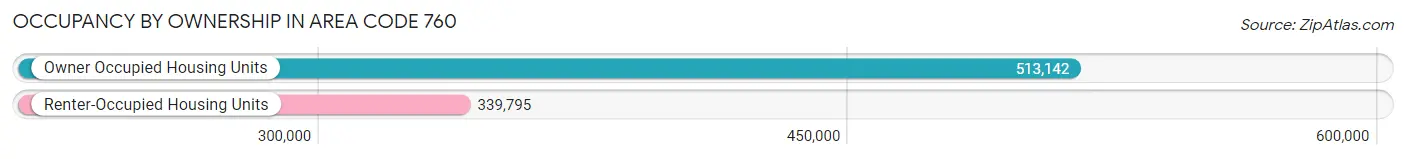
| Occupancy | # Housing Units | % Housing Units |
| Owner Occupied Housing Units | 513,142 | 60.2% |
| Renter-Occupied Housing Units | 339,795 | 39.8% |
| Total Occupied Housing Units | 852,937 | 100.0% |
Occupancy by Household Size in Area Code 760
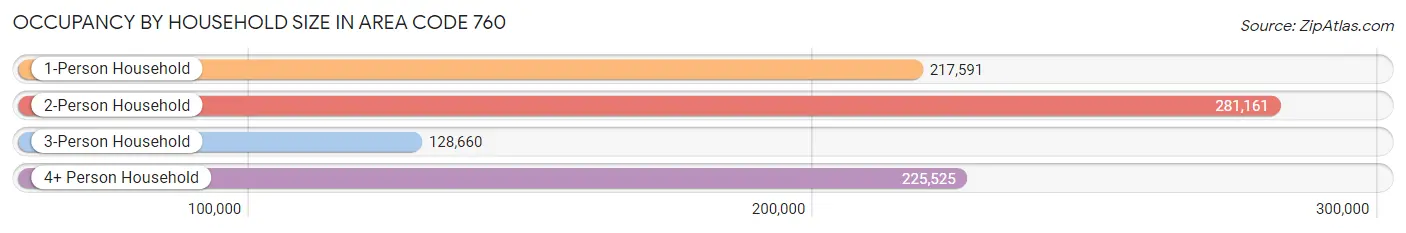
| Household Size | # Housing Units | % Housing Units |
| 1-Person Household | 217,591 | 25.5% |
| 2-Person Household | 281,161 | 33.0% |
| 3-Person Household | 128,660 | 15.1% |
| 4+ Person Household | 225,525 | 26.4% |
| Total Housing Units | 852,937 | 100.0% |
Occupancy by Ownership by Household Size in Area Code 760
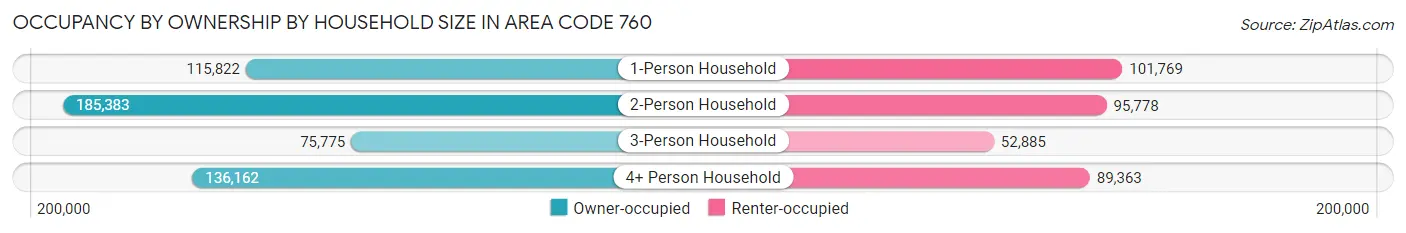
| Household Size | Owner-occupied | Renter-occupied |
| 1-Person Household | 115,822 (53.2%) | 101,769 (46.8%) |
| 2-Person Household | 185,383 (65.9%) | 95,778 (34.1%) |
| 3-Person Household | 75,775 (58.9%) | 52,885 (41.1%) |
| 4+ Person Household | 136,162 (60.4%) | 89,363 (39.6%) |
| Total Housing Units | 513,142 (60.2%) | 339,795 (39.8%) |
Occupancy by Educational Attainment in Area Code 760
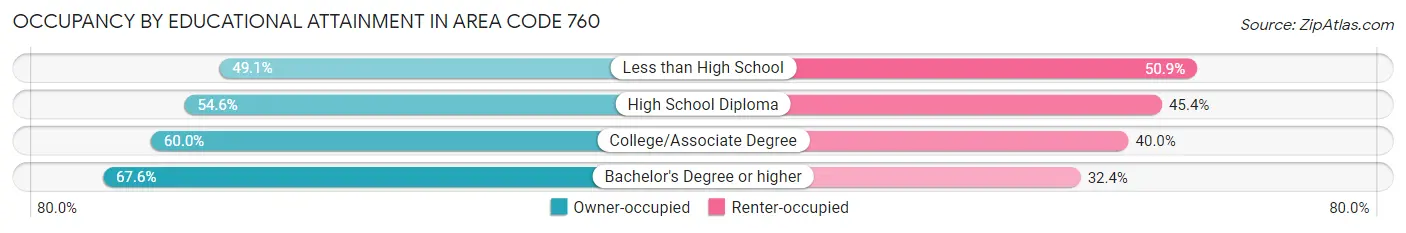
| Household Size | Owner-occupied | Renter-occupied |
| Less than High School | 53,700 (49.1%) | 55,656 (50.9%) |
| High School Diploma | 91,029 (54.6%) | 75,578 (45.4%) |
| College/Associate Degree | 168,706 (60.0%) | 112,678 (40.0%) |
| Bachelor's Degree or higher | 199,707 (67.6%) | 95,883 (32.4%) |
Occupancy by Age of Householder in Area Code 760
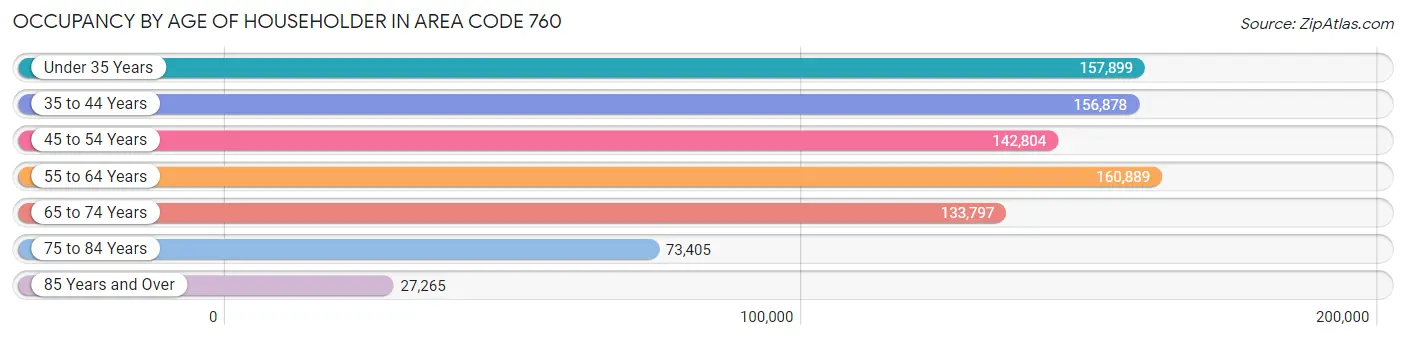
| Age Bracket | # Households | % Households |
| Under 35 Years | 157,899 | 18.5% |
| 35 to 44 Years | 156,878 | 18.4% |
| 45 to 54 Years | 142,804 | 16.7% |
| 55 to 64 Years | 160,889 | 18.9% |
| 65 to 74 Years | 133,797 | 15.7% |
| 75 to 84 Years | 73,405 | 8.6% |
| 85 Years and Over | 27,265 | 3.2% |
| Total | 852,937 | 100.0% |
Housing Finances in Area Code 760
Median Income by Occupancy in Area Code 760
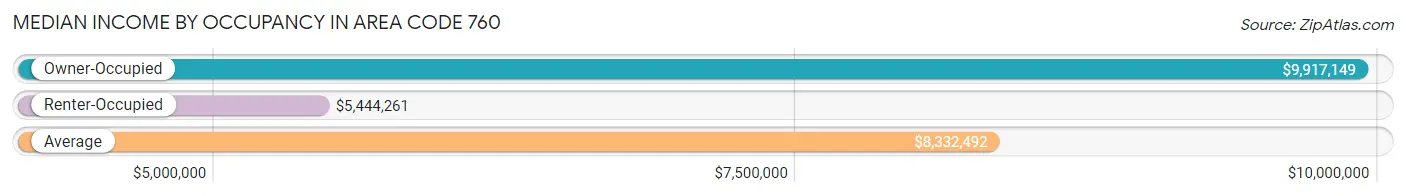
| Occupancy Type | # Households | Median Income |
| Owner-Occupied | 513,142 (60.2%) | $9,917,149 |
| Renter-Occupied | 339,795 (39.8%) | $5,444,261 |
| Average | 852,937 (100.0%) | $8,332,492 |
Occupancy by Householder Income Bracket in Area Code 760
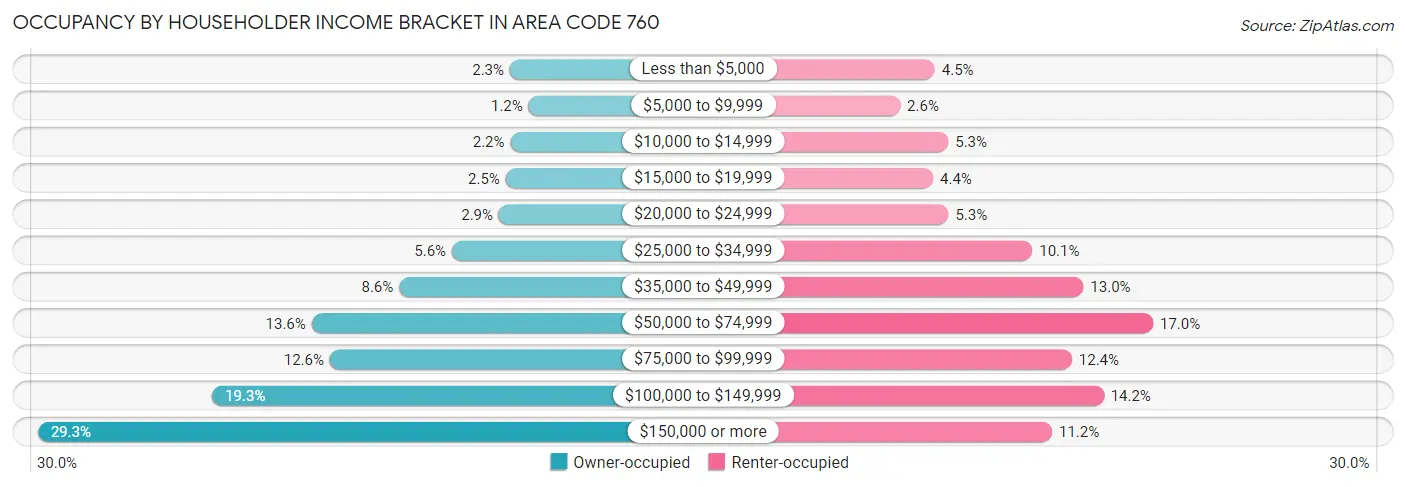
| Income Bracket | Owner-occupied | Renter-occupied |
| Less than $5,000 | 11,624 (2.3%) | 15,405 (4.5%) |
| $5,000 to $9,999 | 6,166 (1.2%) | 8,655 (2.5%) |
| $10,000 to $14,999 | 11,508 (2.2%) | 17,993 (5.3%) |
| $15,000 to $19,999 | 12,865 (2.5%) | 15,058 (4.4%) |
| $20,000 to $24,999 | 14,887 (2.9%) | 18,044 (5.3%) |
| $25,000 to $34,999 | 28,640 (5.6%) | 34,320 (10.1%) |
| $35,000 to $49,999 | 44,127 (8.6%) | 44,228 (13.0%) |
| $50,000 to $74,999 | 69,796 (13.6%) | 57,749 (17.0%) |
| $75,000 to $99,999 | 64,436 (12.6%) | 42,008 (12.4%) |
| $100,000 to $149,999 | 98,982 (19.3%) | 48,172 (14.2%) |
| $150,000 or more | 150,111 (29.2%) | 38,163 (11.2%) |
| Total | 513,142 (100.0%) | 339,795 (100.0%) |
Monthly Housing Cost Tiers in Area Code 760
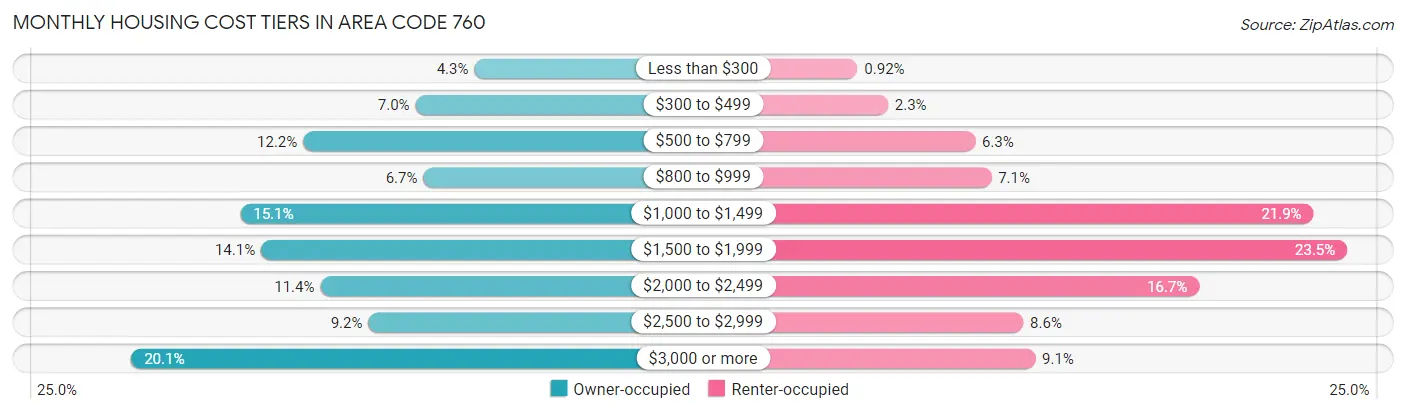
| Monthly Cost | Owner-occupied | Renter-occupied |
| Less than $300 | 22,070 (4.3%) | 3,125 (0.9%) |
| $300 to $499 | 35,990 (7.0%) | 7,899 (2.3%) |
| $500 to $799 | 62,486 (12.2%) | 21,494 (6.3%) |
| $800 to $999 | 34,139 (6.7%) | 24,058 (7.1%) |
| $1,000 to $1,499 | 77,349 (15.1%) | 74,439 (21.9%) |
| $1,500 to $1,999 | 72,436 (14.1%) | 79,732 (23.5%) |
| $2,000 to $2,499 | 58,462 (11.4%) | 56,561 (16.7%) |
| $2,500 to $2,999 | 47,116 (9.2%) | 29,054 (8.6%) |
| $3,000 or more | 103,094 (20.1%) | 30,918 (9.1%) |
| Total | 513,142 (100.0%) | 339,795 (100.0%) |
Physical Housing Characteristics in Area Code 760
Housing Structures in Area Code 760
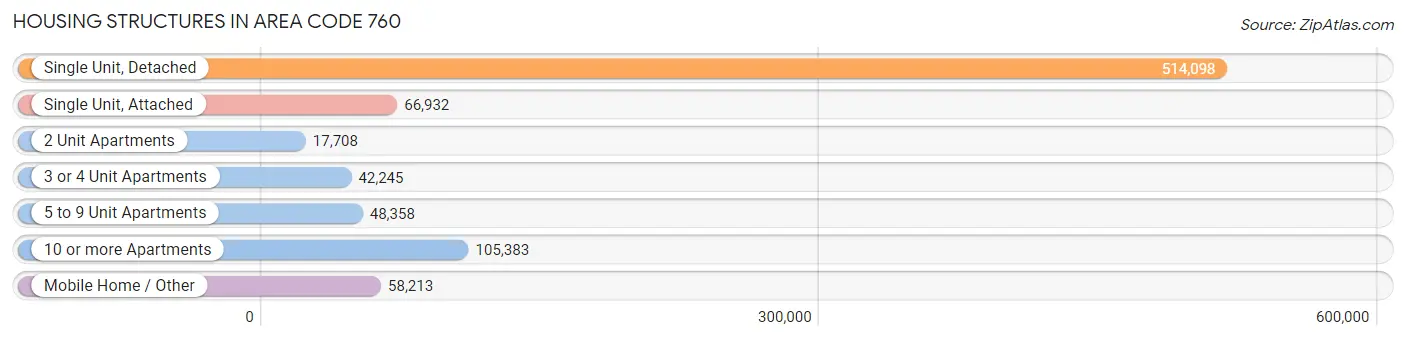
| Structure Type | # Housing Units | % Housing Units |
| Single Unit, Detached | 514,098 | 60.3% |
| Single Unit, Attached | 66,932 | 7.9% |
| 2 Unit Apartments | 17,708 | 2.1% |
| 3 or 4 Unit Apartments | 42,245 | 5.0% |
| 5 to 9 Unit Apartments | 48,358 | 5.7% |
| 10 or more Apartments | 105,383 | 12.4% |
| Mobile Home / Other | 58,213 | 6.8% |
| Total | 852,937 | 100.0% |
Housing Structures by Occupancy in Area Code 760
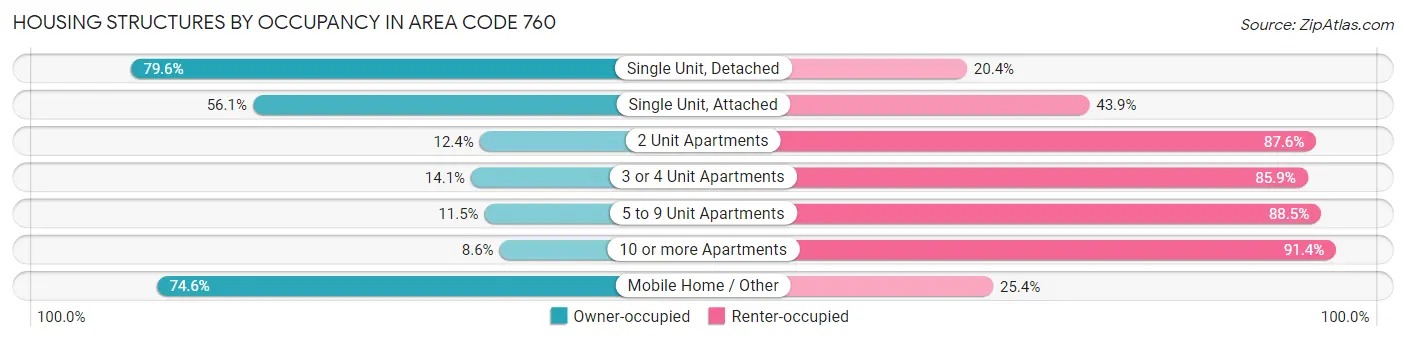
| Structure Type | Owner-occupied | Renter-occupied |
| Single Unit, Detached | 409,450 (79.6%) | 104,648 (20.4%) |
| Single Unit, Attached | 37,531 (56.1%) | 29,401 (43.9%) |
| 2 Unit Apartments | 2,198 (12.4%) | 15,510 (87.6%) |
| 3 or 4 Unit Apartments | 5,942 (14.1%) | 36,303 (85.9%) |
| 5 to 9 Unit Apartments | 5,546 (11.5%) | 42,812 (88.5%) |
| 10 or more Apartments | 9,044 (8.6%) | 96,339 (91.4%) |
| Mobile Home / Other | 43,431 (74.6%) | 14,782 (25.4%) |
| Total | 513,142 (60.2%) | 339,795 (39.8%) |
Housing Structures by Number of Rooms in Area Code 760
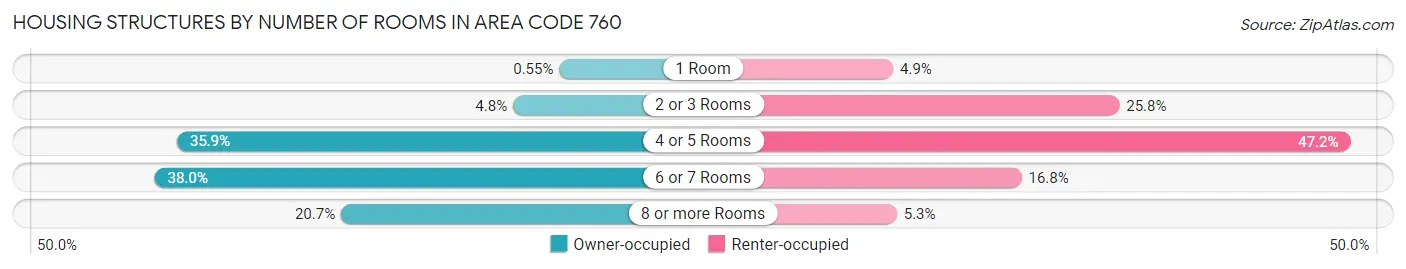
| Number of Rooms | Owner-occupied | Renter-occupied |
| 1 Room | 2,804 (0.5%) | 16,702 (4.9%) |
| 2 or 3 Rooms | 24,773 (4.8%) | 87,794 (25.8%) |
| 4 or 5 Rooms | 184,299 (35.9%) | 160,370 (47.2%) |
| 6 or 7 Rooms | 194,866 (38.0%) | 57,070 (16.8%) |
| 8 or more Rooms | 106,400 (20.7%) | 17,859 (5.3%) |
| Total | 513,142 (100.0%) | 339,795 (100.0%) |
Housing Structure by Heating Type in Area Code 760
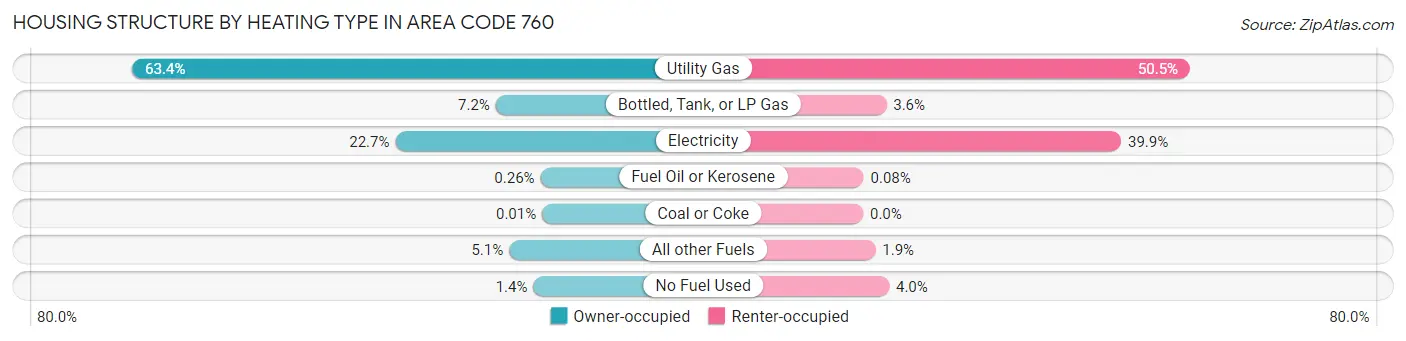
| Heating Type | Owner-occupied | Renter-occupied |
| Utility Gas | 325,290 (63.4%) | 171,693 (50.5%) |
| Bottled, Tank, or LP Gas | 36,844 (7.2%) | 12,184 (3.6%) |
| Electricity | 116,435 (22.7%) | 135,508 (39.9%) |
| Fuel Oil or Kerosene | 1,314 (0.3%) | 287 (0.1%) |
| Coal or Coke | 56 (0.0%) | 6 (0.0%) |
| All other Fuels | 26,233 (5.1%) | 6,442 (1.9%) |
| No Fuel Used | 6,970 (1.4%) | 13,675 (4.0%) |
| Total | 513,142 (100.0%) | 339,795 (100.0%) |
Household Vehicle Usage in Area Code 760
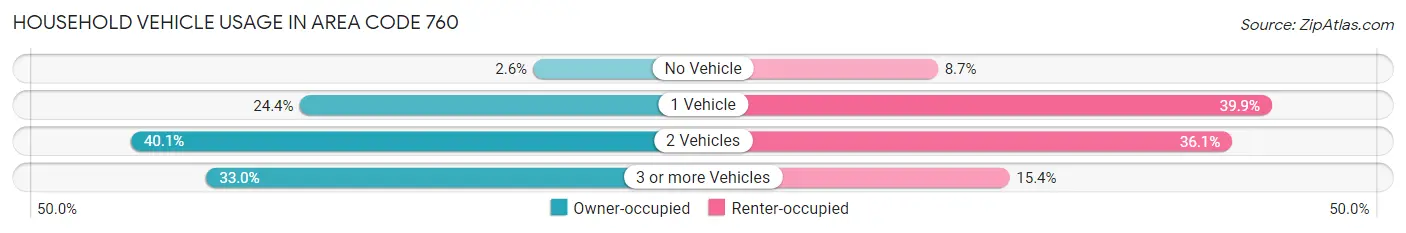
| Vehicles per Household | Owner-occupied | Renter-occupied |
| No Vehicle | 13,094 (2.5%) | 29,431 (8.7%) |
| 1 Vehicle | 124,957 (24.3%) | 135,407 (39.9%) |
| 2 Vehicles | 205,616 (40.1%) | 122,811 (36.1%) |
| 3 or more Vehicles | 169,475 (33.0%) | 52,146 (15.3%) |
| Total | 513,142 (100.0%) | 339,795 (100.0%) |
Real Estate & Mortgages in Area Code 760
Real Estate and Mortgage Overview in Area Code 760
| Characteristic | Without Mortgage | With Mortgage |
| Housing Units | 180,626 | 332,516 |
| Median Property Value | $42,296,200 | $51,112,900 |
| Median Household Income | $7,094,441 | $116,758 |
| Monthly Housing Costs | $70,267 | $101,309 |
| Real Estate Taxes | $287,731 | $7,111 |
Property Value by Mortgage Status in Area Code 760
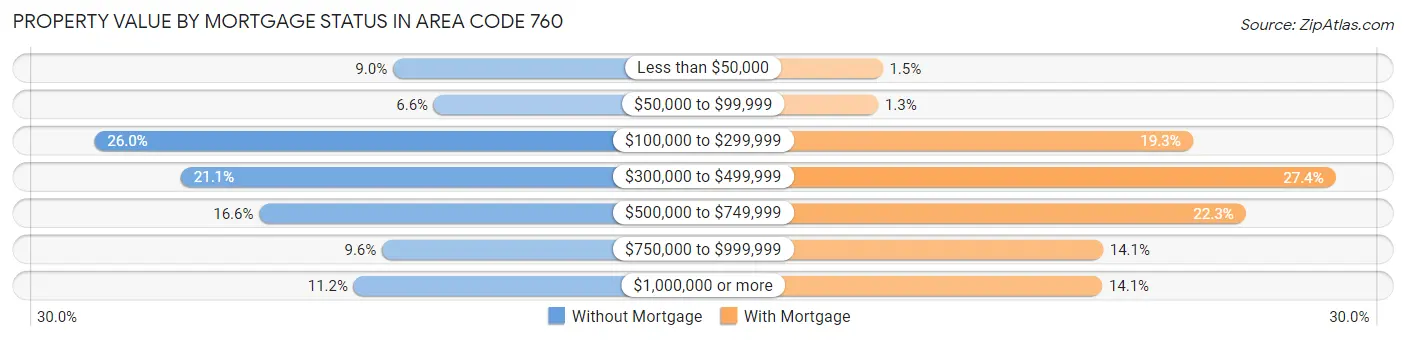
| Property Value | Without Mortgage | With Mortgage |
| Less than $50,000 | 16,168 (8.9%) | 5,120 (1.5%) |
| $50,000 to $99,999 | 11,945 (6.6%) | 4,248 (1.3%) |
| $100,000 to $299,999 | 46,984 (26.0%) | 64,032 (19.3%) |
| $300,000 to $499,999 | 38,052 (21.1%) | 91,207 (27.4%) |
| $500,000 to $749,999 | 29,966 (16.6%) | 74,127 (22.3%) |
| $750,000 to $999,999 | 17,293 (9.6%) | 46,979 (14.1%) |
| $1,000,000 or more | 20,218 (11.2%) | 46,803 (14.1%) |
| Total | 180,626 (100.0%) | 332,516 (100.0%) |
Household Income by Mortgage Status in Area Code 760
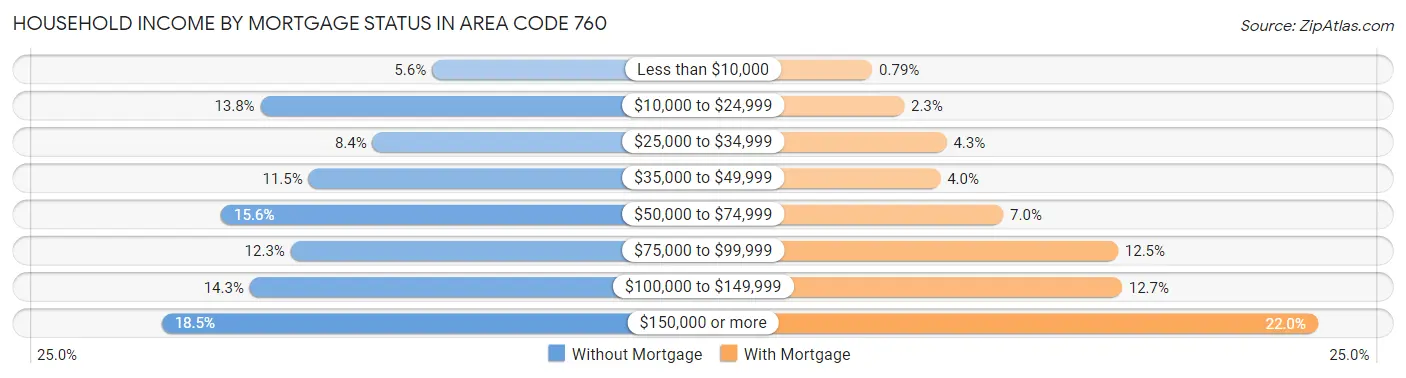
| Household Income | Without Mortgage | With Mortgage |
| Less than $10,000 | 10,114 (5.6%) | 2,618 (0.8%) |
| $10,000 to $24,999 | 24,876 (13.8%) | 7,676 (2.3%) |
| $25,000 to $34,999 | 15,235 (8.4%) | 14,384 (4.3%) |
| $35,000 to $49,999 | 20,739 (11.5%) | 13,405 (4.0%) |
| $50,000 to $74,999 | 28,252 (15.6%) | 23,388 (7.0%) |
| $75,000 to $99,999 | 22,270 (12.3%) | 41,544 (12.5%) |
| $100,000 to $149,999 | 25,787 (14.3%) | 42,166 (12.7%) |
| $150,000 or more | 33,353 (18.5%) | 73,195 (22.0%) |
| Total | 180,626 (100.0%) | 332,516 (100.0%) |
Property Value to Household Income Ratio in Area Code 760
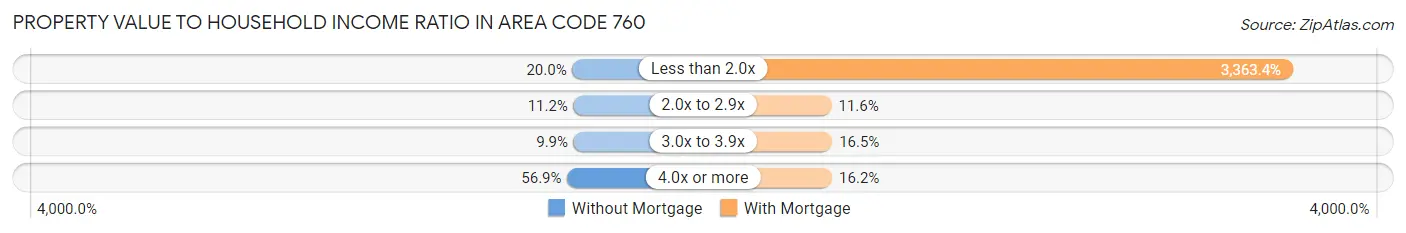
| Value-to-Income Ratio | Without Mortgage | With Mortgage |
| Less than 2.0x | 36,131 (20.0%) | 11,183,847 (3,363.4%) |
| 2.0x to 2.9x | 20,167 (11.2%) | 38,647 (11.6%) |
| 3.0x to 3.9x | 17,933 (9.9%) | 54,918 (16.5%) |
| 4.0x or more | 102,821 (56.9%) | 53,917 (16.2%) |
| Total | 180,626 (100.0%) | 332,516 (100.0%) |
Real Estate Taxes by Mortgage Status in Area Code 760
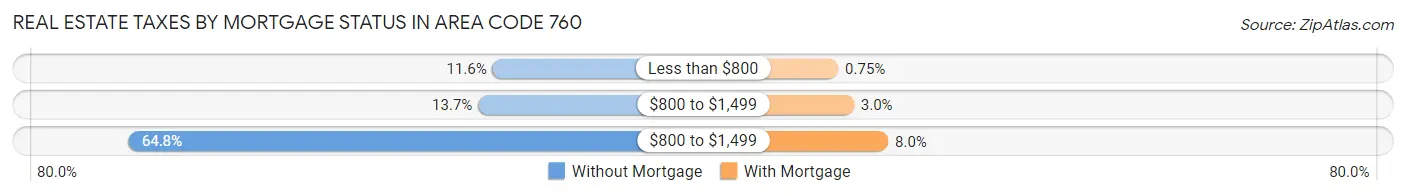
| Property Taxes | Without Mortgage | With Mortgage |
| Less than $800 | 20,994 (11.6%) | 2,499 (0.7%) |
| $800 to $1,499 | 24,799 (13.7%) | 10,093 (3.0%) |
| $800 to $1,499 | 116,973 (64.8%) | 26,722 (8.0%) |
| Total | 180,626 (100.0%) | 332,516 (100.0%) |
Health & Disability in Area Code 760
Health Insurance Coverage by Age in Area Code 760
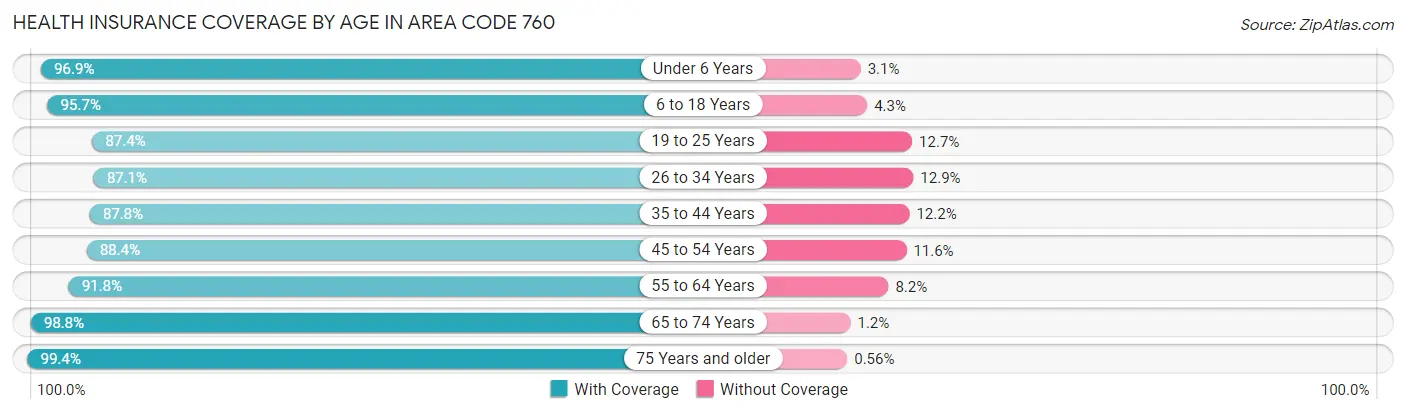
| Age Bracket | With Coverage | Without Coverage |
| Under 6 Years | 176,318 (96.9%) | 5,565 (3.1%) |
| 6 to 18 Years | 401,801 (95.7%) | 17,929 (4.3%) |
| 19 to 25 Years | 187,457 (87.4%) | 27,142 (12.7%) |
| 26 to 34 Years | 264,427 (87.1%) | 39,142 (12.9%) |
| 35 to 44 Years | 272,886 (87.8%) | 37,785 (12.2%) |
| 45 to 54 Years | 243,283 (88.4%) | 31,882 (11.6%) |
| 55 to 64 Years | 271,121 (91.8%) | 24,341 (8.2%) |
| 65 to 74 Years | 222,037 (98.8%) | 2,600 (1.2%) |
| 75 Years and older | 164,404 (99.4%) | 922 (0.6%) |
| Total | 2,203,734 (92.2%) | 187,308 (7.8%) |
Health Insurance Coverage by Citizenship Status in Area Code 760
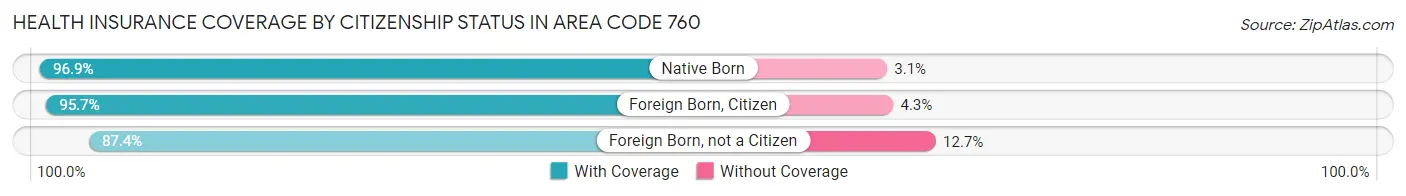
| Citizenship Status | With Coverage | Without Coverage |
| Native Born | 176,318 (96.9%) | 5,565 (3.1%) |
| Foreign Born, Citizen | 401,801 (95.7%) | 17,929 (4.3%) |
| Foreign Born, not a Citizen | 187,457 (87.4%) | 27,142 (12.7%) |
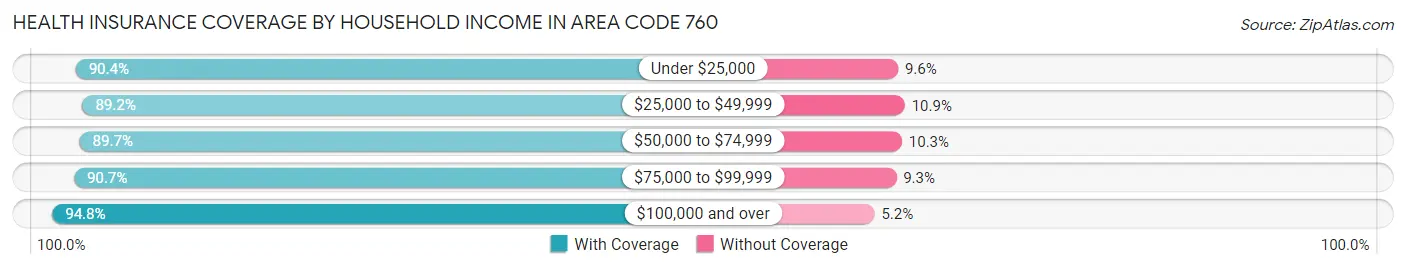
Health Insurance Coverage by Household Income in Area Code 760
| Household Income | With Coverage | Without Coverage |
| Under $25,000 | 227,983 (90.4%) | 24,170 (9.6%) |
| $25,000 to $49,999 | 336,729 (89.1%) | 40,997 (10.8%) |
| $50,000 to $74,999 | 314,244 (89.7%) | 36,154 (10.3%) |
| $75,000 to $99,999 | 282,804 (90.7%) | 28,873 (9.3%) |
| $100,000 and over | 1,027,618 (94.8%) | 56,264 (5.2%) |
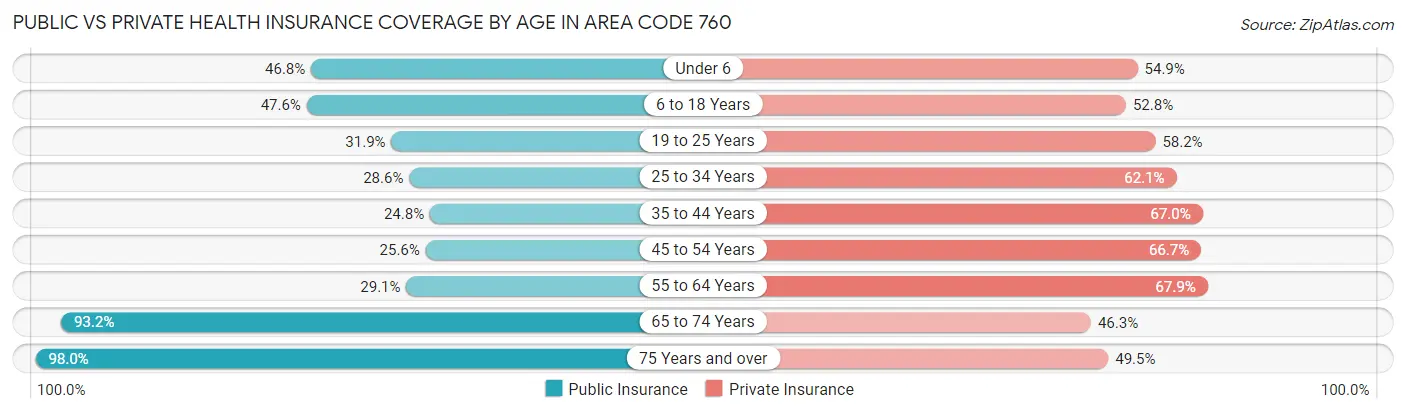
Public vs Private Health Insurance Coverage by Age in Area Code 760
| Age Bracket | Public Insurance | Private Insurance |
| Under 6 | 85,166 (46.8%) | 99,865 (54.9%) |
| 6 to 18 Years | 199,975 (47.6%) | 221,408 (52.7%) |
| 19 to 25 Years | 68,492 (31.9%) | 124,930 (58.2%) |
| 25 to 34 Years | 86,847 (28.6%) | 188,514 (62.1%) |
| 35 to 44 Years | 76,886 (24.7%) | 207,985 (66.9%) |
| 45 to 54 Years | 70,353 (25.6%) | 183,516 (66.7%) |
| 55 to 64 Years | 86,102 (29.1%) | 200,624 (67.9%) |
| 65 to 74 Years | 209,453 (93.2%) | 103,905 (46.3%) |
| 75 Years and over | 161,987 (98.0%) | 81,778 (49.5%) |
| Total | 1,045,261 (43.7%) | 1,412,525 (59.1%) |
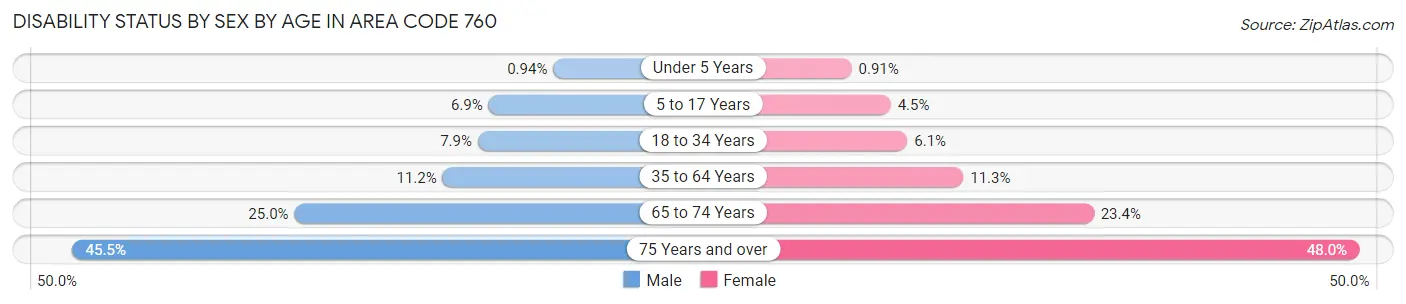
Disability Status by Sex by Age in Area Code 760
| Age Bracket | Male | Female |
| Under 5 Years | 739 (0.9%) | 678 (0.9%) |
| 5 to 17 Years | 14,802 (6.9%) | 9,246 (4.5%) |
| 18 to 34 Years | 21,964 (7.9%) | 16,636 (6.1%) |
| 35 to 64 Years | 49,890 (11.2%) | 49,219 (11.3%) |
| 65 to 74 Years | 27,037 (25.0%) | 27,195 (23.4%) |
| 75 Years and over | 33,323 (45.5%) | 44,224 (48.0%) |
Disability Class by Sex by Age in Area Code 760
Disability Class: Hearing Difficulty

| Age Bracket | Male | Female |
| Under 5 Years | 536 (0.7%) | 565 (0.8%) |
| 5 to 17 Years | 1,781 (0.8%) | 1,409 (0.7%) |
| 18 to 34 Years | 3,046 (1.1%) | 1,630 (0.6%) |
| 35 to 64 Years | 13,143 (2.9%) | 8,048 (1.8%) |
| 65 to 74 Years | 12,045 (11.1%) | 5,789 (5.0%) |
| 75 Years and over | 18,414 (25.2%) | 17,415 (18.9%) |
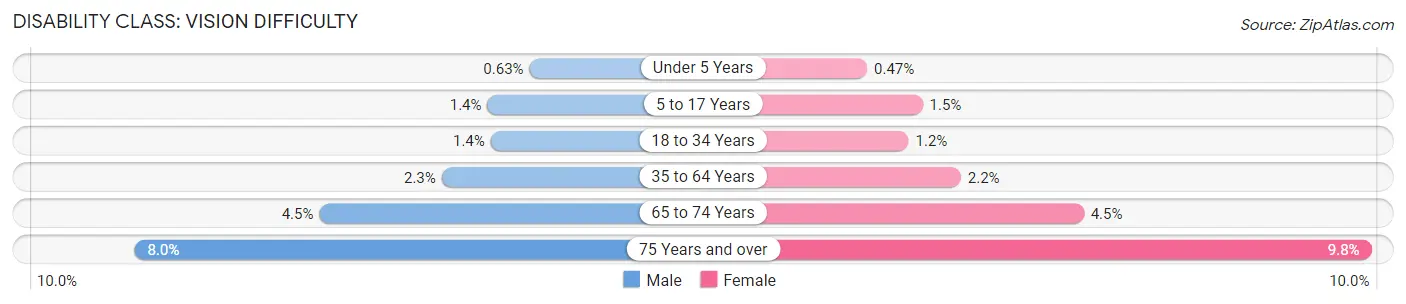
Disability Class: Vision Difficulty
| Age Bracket | Male | Female |
| Under 5 Years | 496 (0.6%) | 346 (0.5%) |
| 5 to 17 Years | 3,001 (1.4%) | 3,051 (1.5%) |
| 18 to 34 Years | 3,739 (1.3%) | 3,390 (1.2%) |
| 35 to 64 Years | 10,055 (2.3%) | 9,636 (2.2%) |
| 65 to 74 Years | 4,905 (4.5%) | 5,226 (4.5%) |
| 75 Years and over | 5,824 (8.0%) | 9,063 (9.8%) |
Disability Class: Cognitive Difficulty
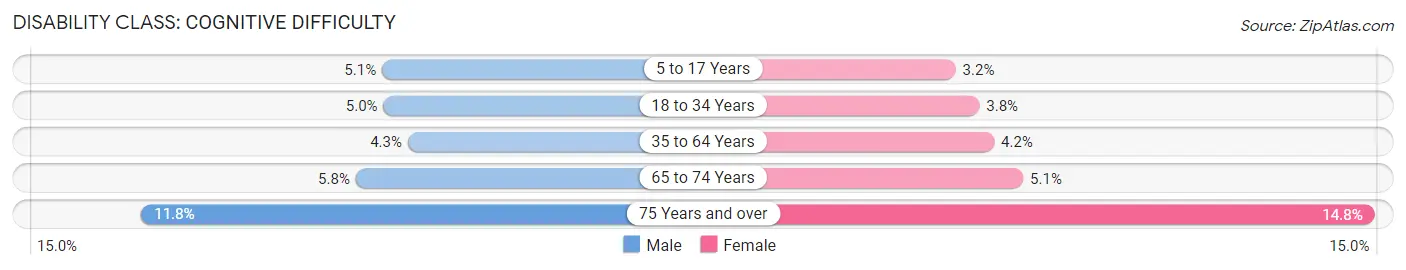
| Age Bracket | Male | Female |
| 5 to 17 Years | 10,787 (5.1%) | 6,453 (3.2%) |
| 18 to 34 Years | 13,872 (5.0%) | 10,488 (3.8%) |
| 35 to 64 Years | 19,275 (4.3%) | 18,494 (4.2%) |
| 65 to 74 Years | 6,266 (5.8%) | 5,876 (5.1%) |
| 75 Years and over | 8,600 (11.7%) | 13,668 (14.8%) |
Disability Class: Ambulatory Difficulty
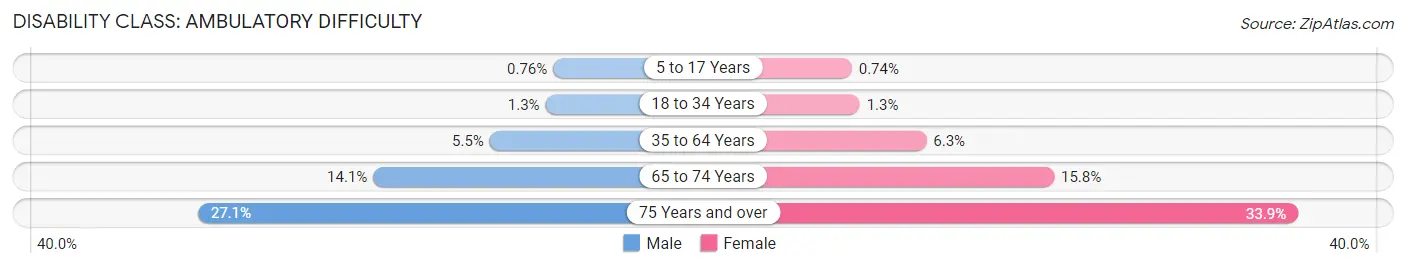
| Age Bracket | Male | Female |
| 5 to 17 Years | 1,615 (0.8%) | 1,504 (0.7%) |
| 18 to 34 Years | 3,681 (1.3%) | 3,636 (1.3%) |
| 35 to 64 Years | 24,324 (5.5%) | 27,413 (6.3%) |
| 65 to 74 Years | 15,300 (14.1%) | 18,333 (15.8%) |
| 75 Years and over | 19,857 (27.1%) | 31,211 (33.9%) |
Disability Class: Self-Care Difficulty
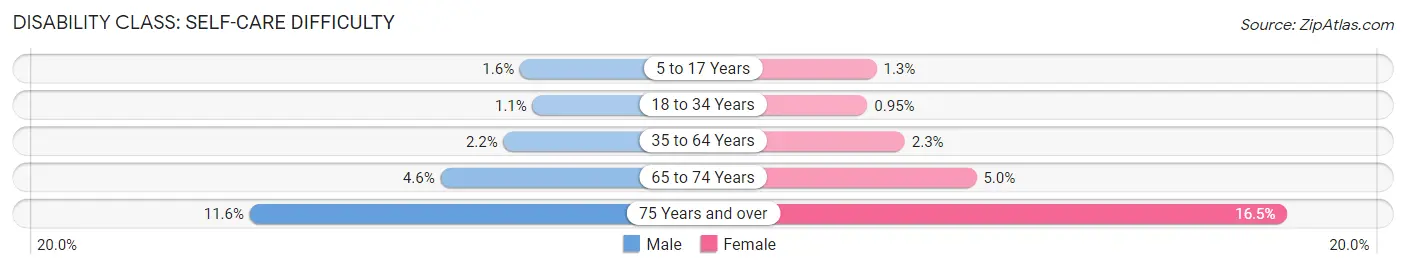
| Age Bracket | Male | Female |
| 5 to 17 Years | 3,433 (1.6%) | 2,620 (1.3%) |
| 18 to 34 Years | 3,164 (1.1%) | 2,600 (0.9%) |
| 35 to 64 Years | 9,888 (2.2%) | 10,191 (2.3%) |
| 65 to 74 Years | 4,939 (4.6%) | 5,811 (5.0%) |
| 75 Years and over | 8,516 (11.6%) | 15,239 (16.5%) |
Technology Access in Area Code 760
Computing Device Access in Area Code 760
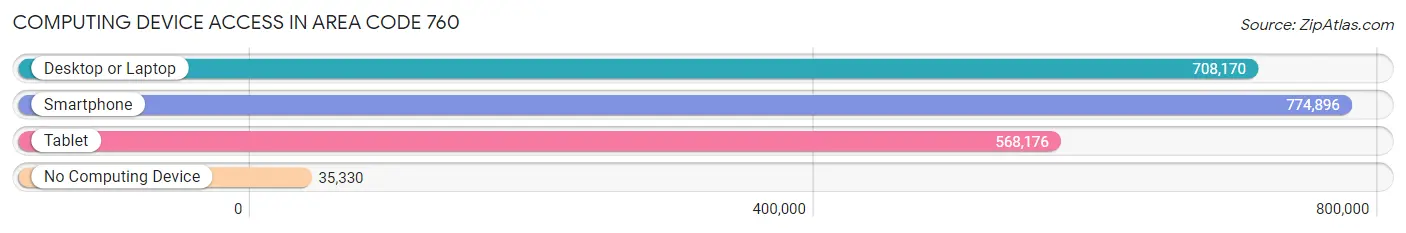
| Device Type | # Households | % Households |
| Desktop or Laptop | 708,170 | 83.0% |
| Smartphone | 774,896 | 90.8% |
| Tablet | 568,176 | 66.6% |
| No Computing Device | 35,330 | 4.1% |
| Total | 852,937 | 100.0% |
Internet Access in Area Code 760
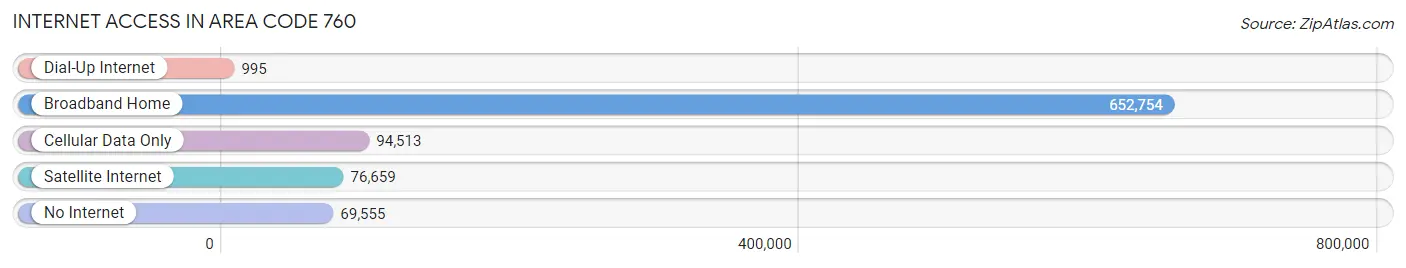
| Internet Type | # Households | % Households |
| Dial-Up Internet | 995 | 0.1% |
| Broadband Home | 652,754 | 76.5% |
| Cellular Data Only | 94,513 | 11.1% |
| Satellite Internet | 76,659 | 9.0% |
| No Internet | 69,555 | 8.2% |
| Total | 852,937 | 100.0% |
Area Code 760 Summary
Geography
Area code 760 is a telephone area code in the North American Numbering Plan (NANP) for the state of California. It serves the inland and desert areas of San Diego County, Imperial County, and the eastern part of Riverside County. It was created in 1997 in a split from area code 619.
Social
Area code 760 is home to a diverse population of people from all walks of life. The area is known for its beautiful desert landscapes, outdoor recreation, and vibrant cultural scene. The area is also home to a number of military bases, including the Marine Corps Air Station Miramar and the Naval Air Station North Island.
Economics
Area code 760 is home to a number of major industries, including tourism, agriculture, and technology. The area is also home to a number of major corporations, including Qualcomm, Intuit, and Sony. The area is also home to a number of universities, including the University of California, San Diego, San Diego State University, and the University of San Diego.
Demographics
Area code 760 is home to a population of over 1.7 million people. The area is predominantly white, with a large Hispanic population. The median household income is around $60,000, and the median home value is around $400,000. The area is also home to a large number of military personnel and their families.
Common Questions
What is Per Capita Income in Area Code 760?
Per Capita income in Area Code 760 is $37,424.
What is the Median Family Income in Area Code 760?
Median Family Income in Area Code 760 is $88,461.
What is the Median Household income in Area Code 760?
Median Household Income in Area Code 760 is $73,092.
What is Income or Wage Gap in Area Code 760?
Income or Wage Gap in Area Code 760 is 30.1%.
Women in Area Code 760 earn 69.9 cents for every dollar earned by a man.
What is Family Income Deficit in Area Code 760?
Family Income Deficit in Area Code 760 is $11,095.
Families that are below poverty line in Area Code 760 earn $11,095 less on average than the poverty threshold level.
What is Inequality or Gini Index in Area Code 760?
Inequality or Gini Index in Area Code 760 is 53.37.
What is the Total Population of Area Code 760?
Total Population of Area Code 760 is 2,474,685.
What is the Total Male Population of Area Code 760?
Total Male Population of Area Code 760 is 1,269,608.
What is the Total Female Population of Area Code 760?
Total Female Population of Area Code 760 is 1,205,077.
What is the Ratio of Males per 100 Females in Area Code 760?
There are 105.35 Males per 100 Females in Area Code 760.
What is the Ratio of Females per 100 Males in Area Code 760?
There are 94.92 Females per 100 Males in Area Code 760.
What is the Median Population Age in Area Code 760?
Median Population Age in Area Code 760 is 42.4 Years.
What is the Average Family Size in Area Code 760
Average Family Size in Area Code 760 is 3.2 People.
What is the Average Household Size in Area Code 760
Average Household Size in Area Code 760 is 2.6 People.
How Large is the Labor Force in Area Code 760?
There are 1,098,337 People in the Labor Forcein in Area Code 760.
What is the Percentage of People in the Labor Force in Area Code 760?
55.8% of People are in the Labor Force in Area Code 760.
What is the Unemployment Rate in Area Code 760?
Unemployment Rate in Area Code 760 is 10.2%.