Area Code 951 Map & Demographics
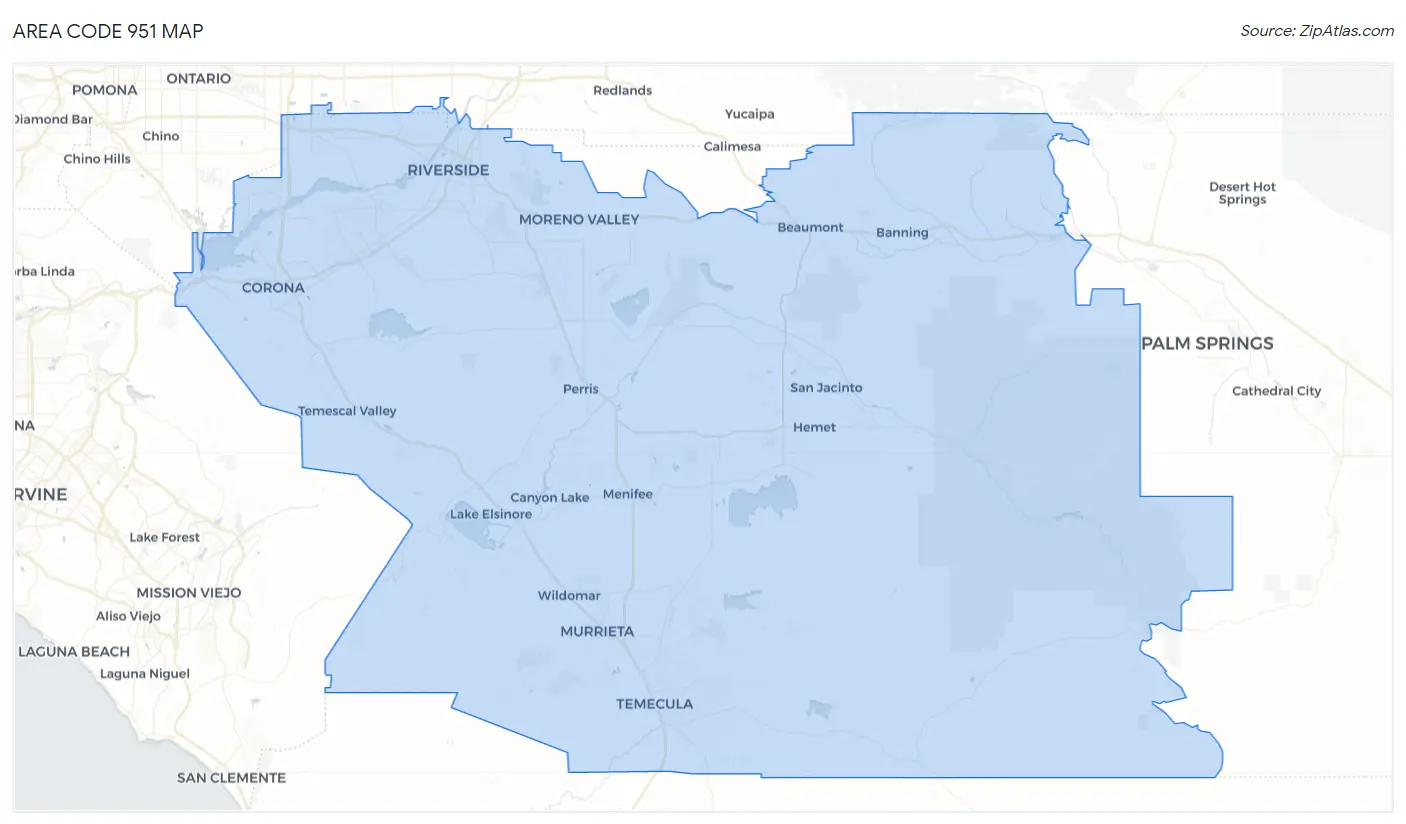
Area Code 951 Map
Area Code 951 Overview
$33,404
PER CAPITA INCOME
$91,567
AVG FAMILY INCOME
$84,109
AVG HOUSEHOLD INCOME
29.3%
WAGE / INCOME GAP [ % ]
70.7¢/ $1
WAGE / INCOME GAP [ $ ]
$11,661
FAMILY INCOME DEFICIT
19.75
INEQUALITY / GINI INDEX
1,908,948
TOTAL POPULATION
951,828
MALE POPULATION
957,120
FEMALE POPULATION
99.45
MALES / 100 FEMALES
100.56
FEMALES / 100 MALES
35.8
MEDIAN AGE
3.7
AVG FAMILY SIZE
3.3
AVG HOUSEHOLD SIZE
893,648
LABOR FORCE [ PEOPLE ]
60.5%
PERCENT IN LABOR FORCE
7.0%
UNEMPLOYMENT RATE
Income in Area Code 951
Income Overview in Area Code 951
Per Capita Income in Area Code 951 is $33,404, while median incomes of families and households are $91,567 and $84,109 respectively.
| Characteristic | Number | Measure |
| Per Capita Income | 1,908,948 | $33,404 |
| Median Family Income | 432,454 | $91,567 |
| Mean Family Income | 432,454 | $5,298,859 |
| Median Household Income | 554,117 | $84,109 |
| Mean Household Income | 554,117 | $4,948,968 |
| Income Deficit | 432,454 | $11,661 |
| Wage / Income Gap (%) | 1,908,948 | 29.30% |
| Wage / Income Gap ($) | 1,908,948 | 70.70¢ per $1 |
| Gini / Inequality Index | 1,908,948 | 19.75 |
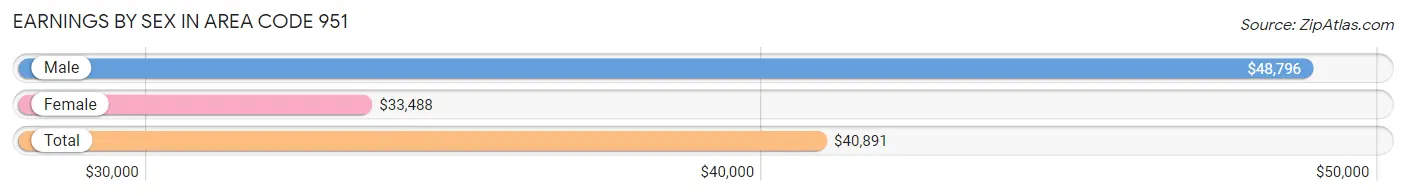
Earnings by Sex in Area Code 951
Average Earnings in Area Code 951 are $40,891, $48,796 for men and $33,488 for women, a difference of 31.4%.
| Sex | Number | Average Earnings |
| Male | 512,901 (55.3%) | $48,796 |
| Female | 415,148 (44.7%) | $33,488 |
| Total | 928,049 (100.0%) | $40,891 |
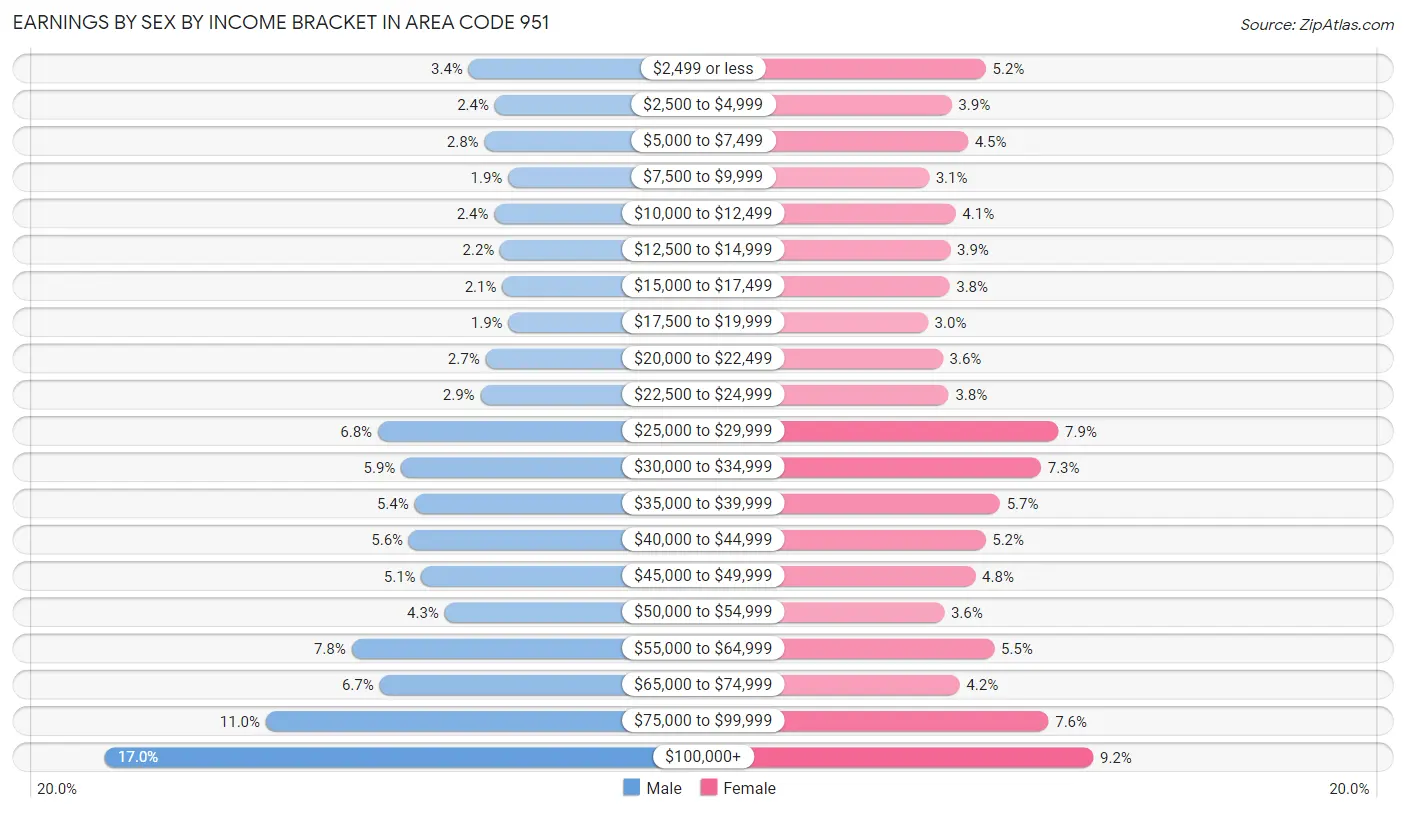
Earnings by Sex by Income Bracket in Area Code 951
The most common earnings brackets in Area Code 951 are $100,000+ for men (87,129 | 17.0%) and $100,000+ for women (38,323 | 9.2%).
| Income | Male | Female |
| $2,499 or less | 17,234 (3.4%) | 21,592 (5.2%) |
| $2,500 to $4,999 | 12,227 (2.4%) | 16,263 (3.9%) |
| $5,000 to $7,499 | 14,187 (2.8%) | 18,810 (4.5%) |
| $7,500 to $9,999 | 9,631 (1.9%) | 12,735 (3.1%) |
| $10,000 to $12,499 | 12,320 (2.4%) | 16,894 (4.1%) |
| $12,500 to $14,999 | 11,188 (2.2%) | 16,069 (3.9%) |
| $15,000 to $17,499 | 10,778 (2.1%) | 15,924 (3.8%) |
| $17,500 to $19,999 | 9,574 (1.9%) | 12,568 (3.0%) |
| $20,000 to $22,499 | 14,009 (2.7%) | 14,914 (3.6%) |
| $22,500 to $24,999 | 14,961 (2.9%) | 15,823 (3.8%) |
| $25,000 to $29,999 | 34,680 (6.8%) | 32,874 (7.9%) |
| $30,000 to $34,999 | 30,200 (5.9%) | 30,188 (7.3%) |
| $35,000 to $39,999 | 27,630 (5.4%) | 23,776 (5.7%) |
| $40,000 to $44,999 | 28,700 (5.6%) | 21,565 (5.2%) |
| $45,000 to $49,999 | 26,289 (5.1%) | 19,949 (4.8%) |
| $50,000 to $54,999 | 21,838 (4.3%) | 15,122 (3.6%) |
| $55,000 to $64,999 | 39,742 (7.7%) | 22,905 (5.5%) |
| $65,000 to $74,999 | 34,360 (6.7%) | 17,523 (4.2%) |
| $75,000 to $99,999 | 56,224 (11.0%) | 31,331 (7.5%) |
| $100,000+ | 87,129 (17.0%) | 38,323 (9.2%) |
| Total | 512,901 (100.0%) | 415,148 (100.0%) |
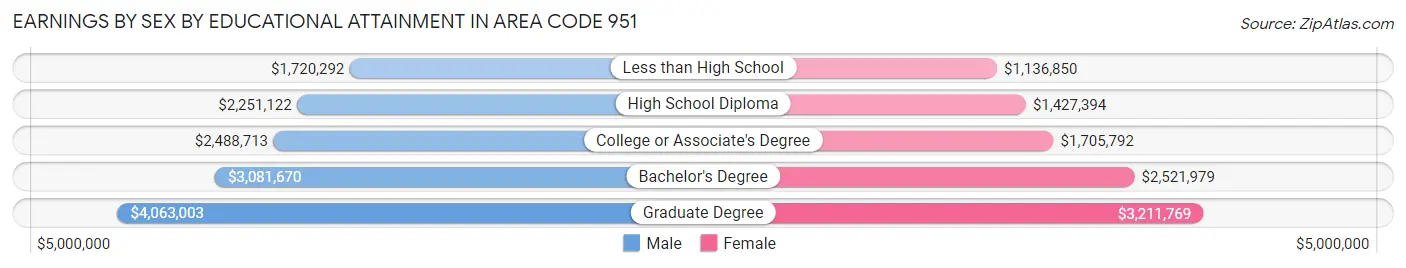
Earnings by Sex by Educational Attainment in Area Code 951
Average earnings in Area Code 951 are $2,598,011 for men and $1,804,594 for women, a difference of 30.5%. Men with an educational attainment of graduate degree enjoy the highest average annual earnings of $4,063,003, while those with less than high school education earn the least with $1,720,292. Women with an educational attainment of graduate degree earn the most with the average annual earnings of $3,211,769, while those with less than high school education have the smallest earnings of $1,136,850.
| Educational Attainment | Male Income | Female Income |
| Less than High School | $1,720,292 | $1,136,850 |
| High School Diploma | $2,251,122 | $1,427,394 |
| College or Associate's Degree | $2,488,713 | $1,705,792 |
| Bachelor's Degree | $3,081,670 | $2,521,979 |
| Graduate Degree | $4,063,003 | $3,211,769 |
| Total | $2,598,011 | $1,804,594 |
Family Income in Area Code 951
Family Income Brackets in Area Code 951
According to the Area Code 951 family income data, there are 4,232,860 families falling into the $100,000 to $149,999 income range, which is the most common income bracket and makes up 978.8% of all families. Conversely, the $10,000 to $14,999 income bracket is the least frequent group with only 323,043 families (74.7%) belonging to this category.
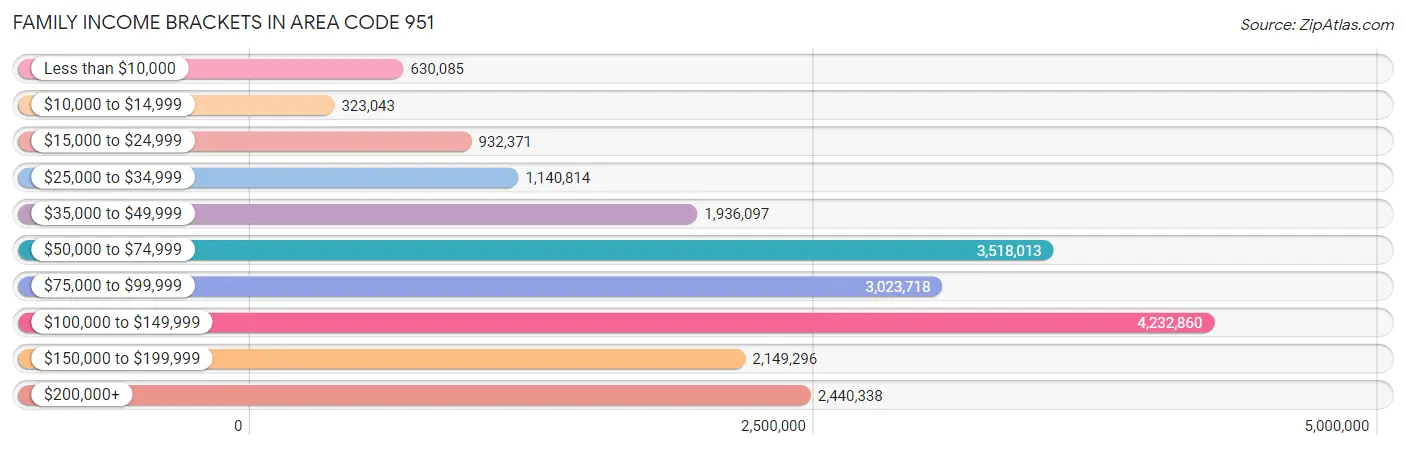
| Income Bracket | # Families | % Families |
| Less than $10,000 | 630,085 | 145.7% |
| $10,000 to $14,999 | 323,043 | 74.7% |
| $15,000 to $24,999 | 932,371 | 215.6% |
| $25,000 to $34,999 | 1,140,814 | 263.8% |
| $35,000 to $49,999 | 1,936,097 | 447.7% |
| $50,000 to $74,999 | 3,518,013 | 813.5% |
| $75,000 to $99,999 | 3,023,718 | 699.2% |
| $100,000 to $149,999 | 4,232,860 | 978.8% |
| $150,000 to $199,999 | 2,149,296 | 497.0% |
| $200,000+ | 2,440,338 | 564.3% |
Family Income by Famaliy Size in Area Code 951
7+ person families (21,970 | 5.1%) account for the highest median family income in Area Code 951 with $122,441 per family, while 2-person families (140,379 | 32.5%) have the highest median income of $39,556 per family member.
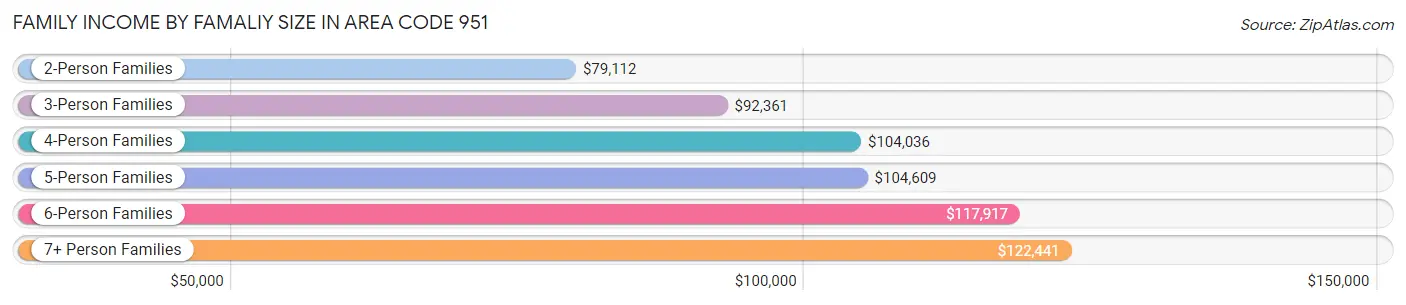
| Income Bracket | # Families | Median Income |
| 2-Person Families | 140,379 (32.5%) | $79,112 |
| 3-Person Families | 91,567 (21.2%) | $92,361 |
| 4-Person Families | 94,396 (21.8%) | $104,036 |
| 5-Person Families | 57,486 (13.3%) | $104,609 |
| 6-Person Families | 26,656 (6.2%) | $117,917 |
| 7+ Person Families | 21,970 (5.1%) | $122,441 |
| Total | 432,454 (100.0%) | $91,567 |
Family Income by Number of Earners in Area Code 951
The median family income in Area Code 951 is $91,567, with families comprising 3+ earners (76,936) having the highest median family income of $142,877, while families with no earners (52,841) have the lowest median family income of $46,821, accounting for 17.8% and 12.2% of families, respectively.
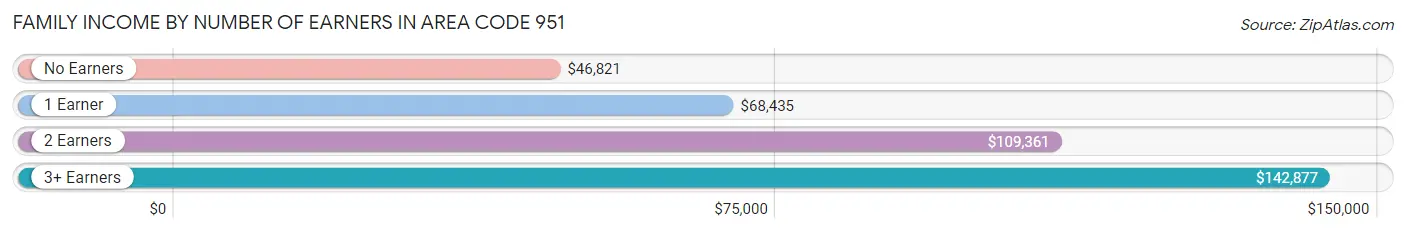
| Number of Earners | # Families | Median Income |
| No Earners | 52,841 (12.2%) | $46,821 |
| 1 Earner | 141,537 (32.7%) | $68,435 |
| 2 Earners | 161,140 (37.3%) | $109,361 |
| 3+ Earners | 76,936 (17.8%) | $142,877 |
| Total | 432,454 (100.0%) | $91,567 |
Household Income in Area Code 951
Household Income Brackets in Area Code 951
With 5,055,764 households falling in the category, the $100,000 to $149,999 income range is the most frequent in Area Code 951, accounting for 912.4% of all households. In contrast, only 786,846 households (142.0%) fall into the $10,000 to $14,999 income bracket, making it the least populous group.
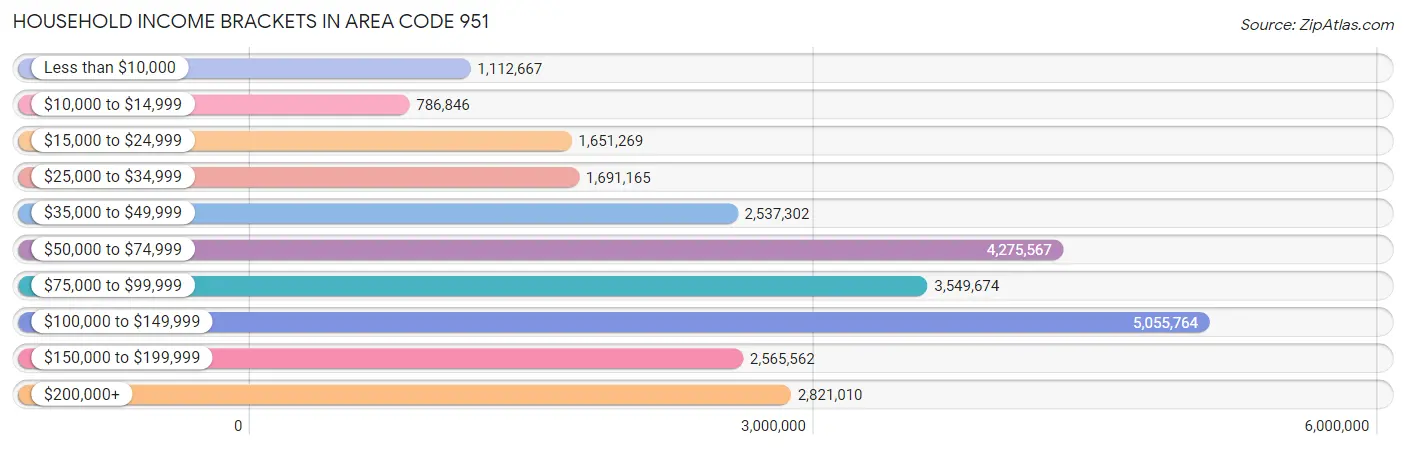
| Income Bracket | # Households | % Households |
| Less than $10,000 | 1,112,667 | 200.8% |
| $10,000 to $14,999 | 786,846 | 142.0% |
| $15,000 to $24,999 | 1,651,269 | 298.0% |
| $25,000 to $34,999 | 1,691,165 | 305.2% |
| $35,000 to $49,999 | 2,537,302 | 457.9% |
| $50,000 to $74,999 | 4,275,567 | 771.6% |
| $75,000 to $99,999 | 3,549,674 | 640.6% |
| $100,000 to $149,999 | 5,055,764 | 912.4% |
| $150,000 to $199,999 | 2,565,562 | 463.0% |
| $200,000+ | 2,821,010 | 509.1% |
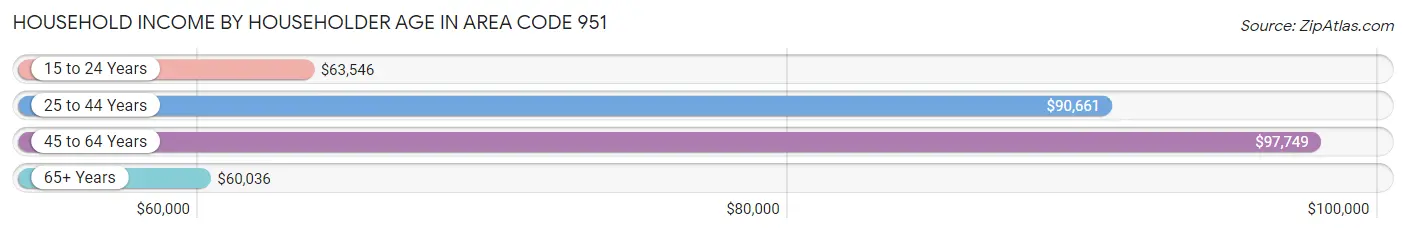
Household Income by Householder Age in Area Code 951
The median household income in Area Code 951 is $84,109, with the highest median household income of $97,749 found in the 45 to 64 years age bracket for the primary householder. A total of 218,322 households (39.4%) fall into this category. Meanwhile, the 65+ years age bracket for the primary householder has the lowest median household income of $60,036, with 126,251 households (22.8%) in this group.
| Income Bracket | # Households | Median Income |
| 15 to 24 Years | 12,546 (2.3%) | $63,546 |
| 25 to 44 Years | 196,998 (35.5%) | $90,661 |
| 45 to 64 Years | 218,322 (39.4%) | $97,749 |
| 65+ Years | 126,251 (22.8%) | $60,036 |
| Total | 554,117 (100.0%) | $84,109 |
Poverty in Area Code 951
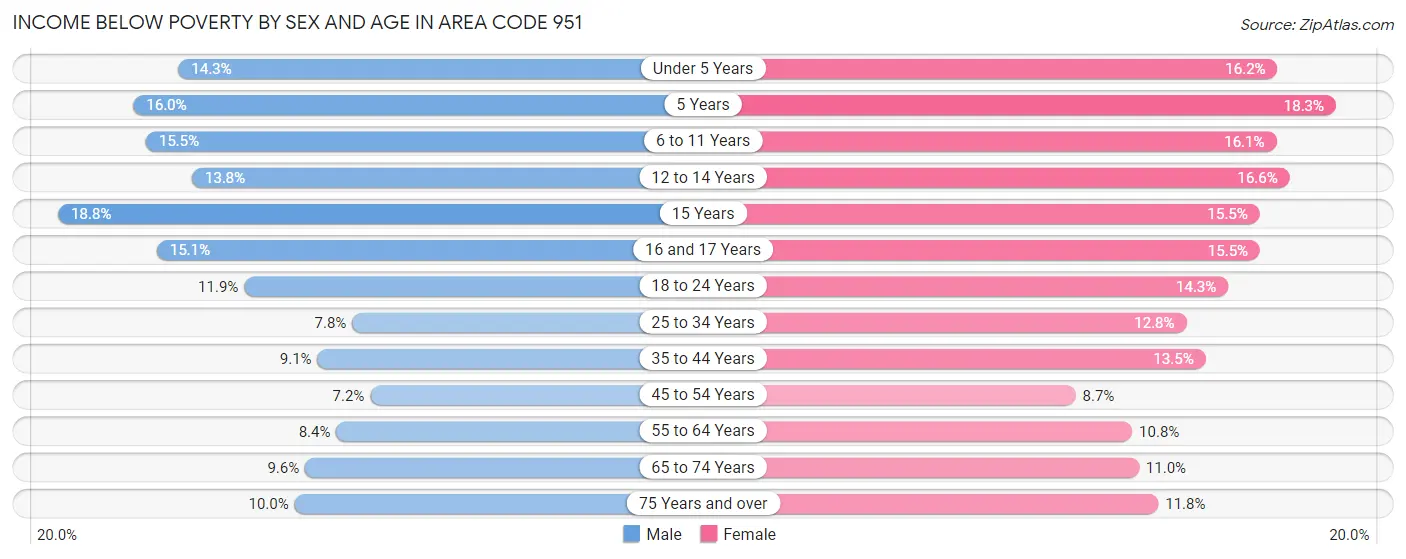
Income Below Poverty by Sex and Age in Area Code 951
With 10.5% poverty level for males and 13.0% for females among the residents of Area Code 951, 15 year old males and 5 year old females are the most vulnerable to poverty, with 2,732 males (18.8%) and 2,301 females (18.3%) in their respective age groups living below the poverty level.
| Age Bracket | Male | Female |
| Under 5 Years | 8,580 (14.3%) | 9,272 (16.2%) |
| 5 Years | 2,094 (16.0%) | 2,301 (18.3%) |
| 6 to 11 Years | 12,745 (15.5%) | 12,871 (16.1%) |
| 12 to 14 Years | 6,340 (13.8%) | 7,356 (16.6%) |
| 15 Years | 2,732 (18.8%) | 2,268 (15.5%) |
| 16 and 17 Years | 4,598 (15.1%) | 4,561 (15.5%) |
| 18 to 24 Years | 11,781 (11.8%) | 13,158 (14.3%) |
| 25 to 34 Years | 11,221 (7.8%) | 17,565 (12.8%) |
| 35 to 44 Years | 11,527 (9.1%) | 17,068 (13.5%) |
| 45 to 54 Years | 8,329 (7.2%) | 10,073 (8.7%) |
| 55 to 64 Years | 8,660 (8.4%) | 11,312 (10.8%) |
| 65 to 74 Years | 6,239 (9.6%) | 8,188 (11.0%) |
| 75 Years and over | 3,895 (10.0%) | 6,483 (11.7%) |
| Total | 98,741 (10.5%) | 122,476 (13.0%) |
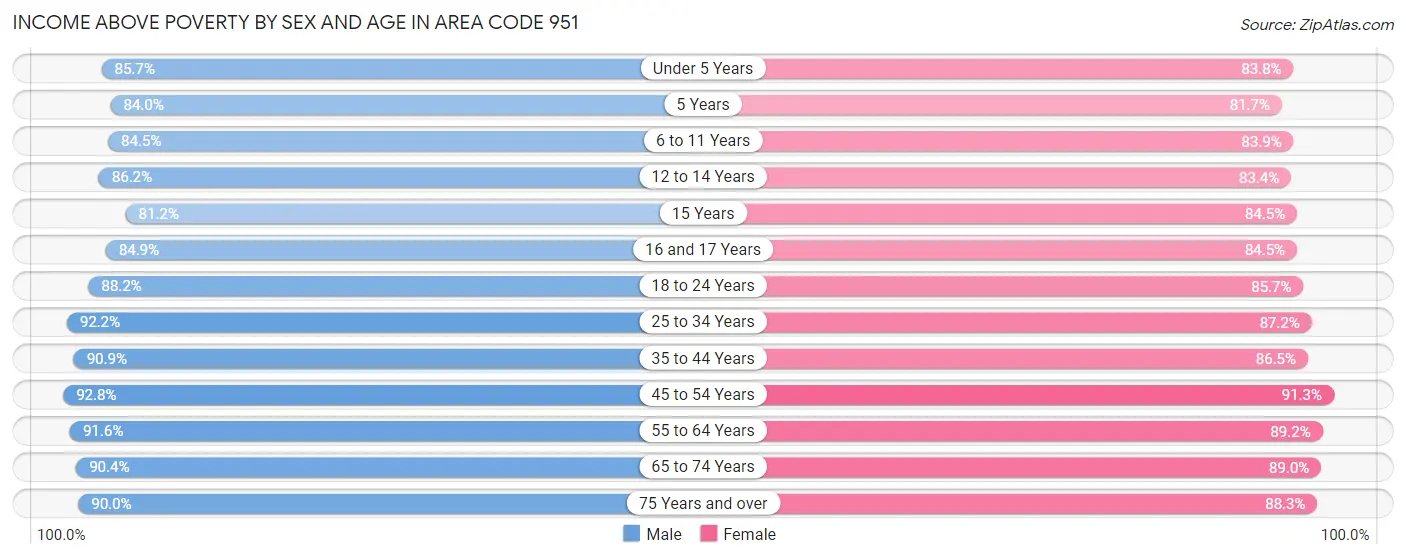
Income Above Poverty by Sex and Age in Area Code 951
According to the poverty statistics in Area Code 951, males aged 45 to 54 years and females aged 45 to 54 years are the age groups that are most secure financially, with 92.8% of males and 91.3% of females in these age groups living above the poverty line.
| Age Bracket | Male | Female |
| Under 5 Years | 51,446 (85.7%) | 48,084 (83.8%) |
| 5 Years | 11,029 (84.0%) | 10,245 (81.7%) |
| 6 to 11 Years | 69,485 (84.5%) | 66,904 (83.9%) |
| 12 to 14 Years | 39,644 (86.2%) | 36,916 (83.4%) |
| 15 Years | 11,830 (81.2%) | 12,351 (84.5%) |
| 16 and 17 Years | 25,881 (84.9%) | 24,836 (84.5%) |
| 18 to 24 Years | 87,667 (88.1%) | 78,577 (85.7%) |
| 25 to 34 Years | 131,863 (92.2%) | 119,743 (87.2%) |
| 35 to 44 Years | 114,779 (90.9%) | 109,365 (86.5%) |
| 45 to 54 Years | 107,788 (92.8%) | 105,939 (91.3%) |
| 55 to 64 Years | 94,022 (91.6%) | 93,644 (89.2%) |
| 65 to 74 Years | 58,832 (90.4%) | 66,063 (89.0%) |
| 75 Years and over | 35,130 (90.0%) | 48,683 (88.2%) |
| Total | 839,396 (89.5%) | 821,350 (87.0%) |
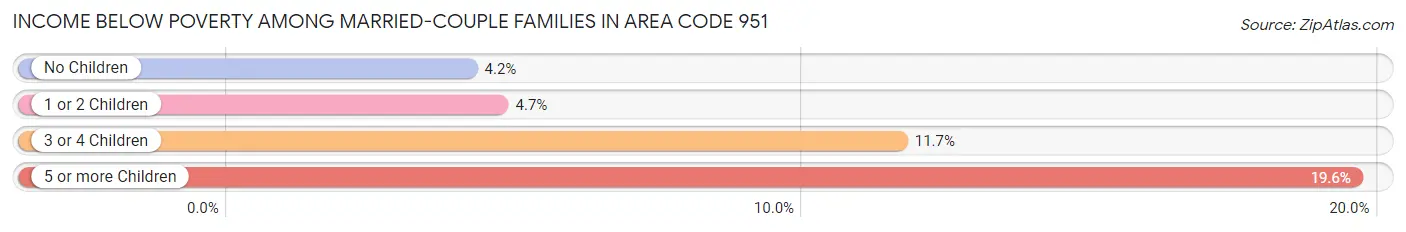
Income Below Poverty Among Married-Couple Families in Area Code 951
The poverty statistics for married-couple families in Area Code 951 show that 5.5% or 16,834 of the total 308,523 families live below the poverty line. Families with 5 or more children have the highest poverty rate of 19.6%, comprising of 619 families. On the other hand, families with no children have the lowest poverty rate of 4.2%, which includes 6,282 families.
| Children | Above Poverty | Below Poverty |
| No Children | 144,323 (95.8%) | 6,282 (4.2%) |
| 1 or 2 Children | 111,142 (95.3%) | 5,488 (4.7%) |
| 3 or 4 Children | 33,682 (88.3%) | 4,445 (11.7%) |
| 5 or more Children | 2,542 (80.4%) | 619 (19.6%) |
| Total | 291,689 (94.5%) | 16,834 (5.5%) |
Income Below Poverty Among Single-Parent Households in Area Code 951
According to the poverty data in Area Code 951, 11.1% or 4,386 single-father households and 21.6% or 18,212 single-mother households are living below the poverty line. Among single-father households, those with 3 or 4 children have the highest poverty rate, with 968 households (22.0%) experiencing poverty. Likewise, among single-mother households, those with 5 or more children have the highest poverty rate, with 718 households (65.2%) falling below the poverty line.
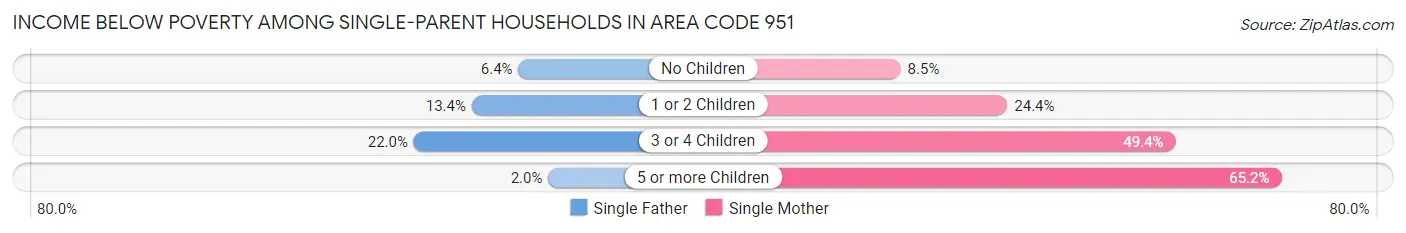
| Children | Single Father | Single Mother |
| No Children | 1,149 (6.4%) | 2,920 (8.5%) |
| 1 or 2 Children | 2,261 (13.4%) | 9,297 (24.4%) |
| 3 or 4 Children | 968 (22.0%) | 5,277 (49.4%) |
| 5 or more Children | 8 (2.0%) | 718 (65.2%) |
| Total | 4,386 (11.1%) | 18,212 (21.6%) |
Income Below Poverty Among Married-Couple vs Single-Parent Households in Area Code 951
The poverty data for Area Code 951 shows that 16,834 of the married-couple family households (5.5%) and 22,598 of the single-parent households (18.2%) are living below the poverty level. Within the married-couple family households, those with 5 or more children have the highest poverty rate, with 619 households (19.6%) falling below the poverty line. Among the single-parent households, those with 5 or more children have the highest poverty rate, with 726 household (48.2%) living below poverty.
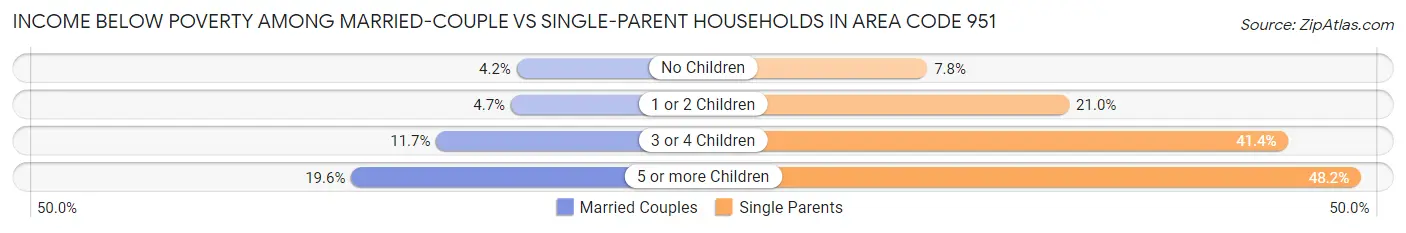
| Children | Married-Couple Families | Single-Parent Households |
| No Children | 6,282 (4.2%) | 4,069 (7.8%) |
| 1 or 2 Children | 5,488 (4.7%) | 11,558 (21.0%) |
| 3 or 4 Children | 4,445 (11.7%) | 6,245 (41.4%) |
| 5 or more Children | 619 (19.6%) | 726 (48.2%) |
| Total | 16,834 (5.5%) | 22,598 (18.2%) |
Race in Area Code 951
The most populous races in Area Code 951 are Hispanic or Latino (1,029,774 | 53.9%), White / Caucasian (848,176 | 44.4%), and Some other Race (500,459 | 26.2%).
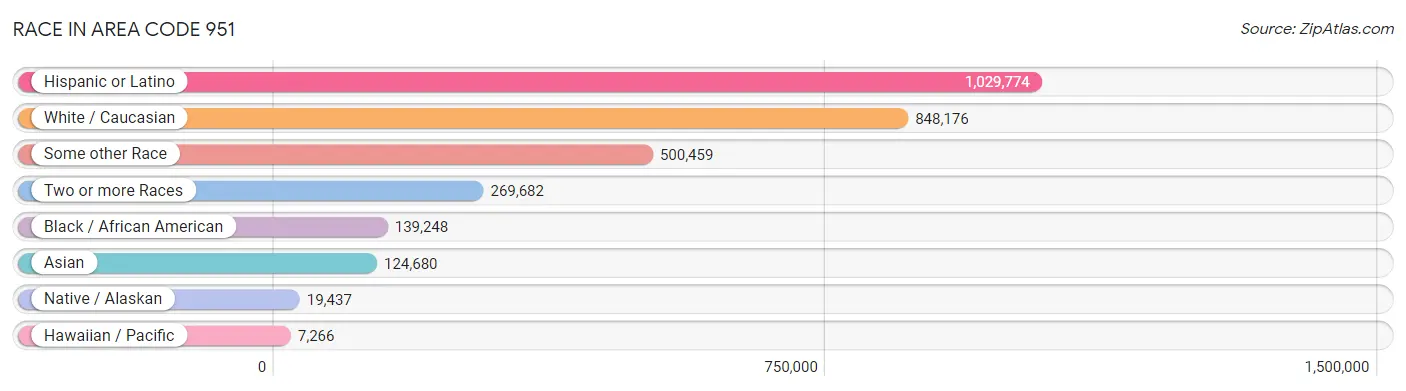
| Race | # Population | % Population |
| Asian | 124,680 | 6.5% |
| Black / African American | 139,248 | 7.3% |
| Hawaiian / Pacific | 7,266 | 0.4% |
| Hispanic or Latino | 1,029,774 | 53.9% |
| Native / Alaskan | 19,437 | 1.0% |
| White / Caucasian | 848,176 | 44.4% |
| Two or more Races | 269,682 | 14.1% |
| Some other Race | 500,459 | 26.2% |
| Total | 1,908,948 | 100.0% |
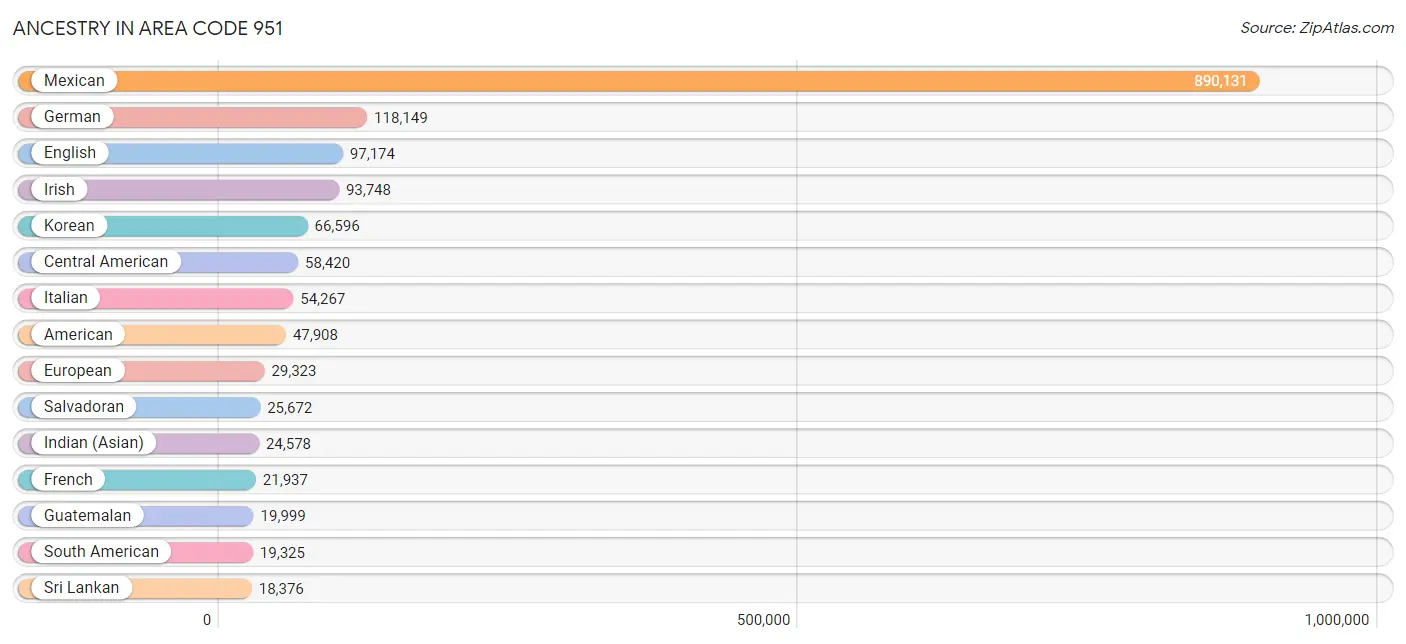
Ancestry in Area Code 951
The most populous ancestries reported in Area Code 951 are Mexican (890,131 | 46.6%), German (118,149 | 6.2%), English (97,174 | 5.1%), Irish (93,748 | 4.9%), and Korean (66,596 | 3.5%), together accounting for 66.3% of all Area Code 951 residents.
| Ancestry | # Population | % Population |
| Afghan | 2,089 | 0.1% |
| African | 6,618 | 0.4% |
| Alaska Native | 7 | 0.0% |
| Alaskan Athabascan | 6 | 0.0% |
| Albanian | 13 | 0.0% |
| Aleut | 68 | 0.0% |
| American | 47,908 | 2.5% |
| Apache | 1,892 | 0.1% |
| Arab | 14,969 | 0.8% |
| Arapaho | 38 | 0.0% |
| Argentinean | 1,953 | 0.1% |
| Armenian | 1,469 | 0.1% |
| Assyrian / Chaldean / Syriac | 165 | 0.0% |
| Australian | 405 | 0.0% |
| Austrian | 1,581 | 0.1% |
| Bahamian | 7 | 0.0% |
| Bangladeshi | 1,186 | 0.1% |
| Barbadian | 84 | 0.0% |
| Basque | 513 | 0.0% |
| Belgian | 525 | 0.0% |
| Belizean | 770 | 0.0% |
| Bermudan | 46 | 0.0% |
| Bhutanese | 10,066 | 0.5% |
| Blackfeet | 930 | 0.1% |
| Bolivian | 745 | 0.0% |
| Brazilian | 706 | 0.0% |
| British | 7,395 | 0.4% |
| British West Indian | 176 | 0.0% |
| Bulgarian | 170 | 0.0% |
| Burmese | 12,110 | 0.6% |
| Cajun | 135 | 0.0% |
| Cambodian | 149 | 0.0% |
| Canadian | 2,953 | 0.2% |
| Cape Verdean | 55 | 0.0% |
| Celtic | 62 | 0.0% |
| Central American | 58,420 | 3.1% |
| Central American Indian | 2,794 | 0.2% |
| Cherokee | 4,551 | 0.2% |
| Cheyenne | 129 | 0.0% |
| Chickasaw | 243 | 0.0% |
| Chilean | 551 | 0.0% |
| Chinese | 9 | 0.0% |
| Chippewa | 1,186 | 0.1% |
| Choctaw | 1,200 | 0.1% |
| Colombian | 7,183 | 0.4% |
| Comanche | 153 | 0.0% |
| Costa Rican | 1,440 | 0.1% |
| Cree | 54 | 0.0% |
| Creek | 321 | 0.0% |
| Croatian | 1,827 | 0.1% |
| Cuban | 7,940 | 0.4% |
| Czech | 3,275 | 0.2% |
| Czechoslovakian | 1,054 | 0.1% |
| Danish | 4,473 | 0.2% |
| Delaware | 59 | 0.0% |
| Dominican | 1,698 | 0.1% |
| Dutch | 11,108 | 0.6% |
| Dutch West Indian | 13 | 0.0% |
| Eastern European | 2,616 | 0.1% |
| Ecuadorian | 1,786 | 0.1% |
| Egyptian | 3,035 | 0.2% |
| English | 97,174 | 5.1% |
| Estonian | 24 | 0.0% |
| Ethiopian | 187 | 0.0% |
| European | 29,323 | 1.5% |
| Fijian | 89 | 0.0% |
| Filipino | 1,968 | 0.1% |
| Finnish | 1,605 | 0.1% |
| French | 21,937 | 1.1% |
| French American Indian | 345 | 0.0% |
| French Canadian | 4,534 | 0.2% |
| German | 118,149 | 6.2% |
| German Russian | 37 | 0.0% |
| Ghanaian | 743 | 0.0% |
| Greek | 2,951 | 0.2% |
| Guamanian / Chamorro | 2,118 | 0.1% |
| Guatemalan | 19,999 | 1.1% |
| Guyanese | 209 | 0.0% |
| Haitian | 1,028 | 0.1% |
| Honduran | 4,164 | 0.2% |
| Hopi | 59 | 0.0% |
| Hungarian | 3,860 | 0.2% |
| Icelander | 146 | 0.0% |
| Indian (Asian) | 24,578 | 1.3% |
| Indonesian | 346 | 0.0% |
| Inupiat | 32 | 0.0% |
| Iranian | 2,652 | 0.1% |
| Iraqi | 857 | 0.0% |
| Irish | 93,748 | 4.9% |
| Iroquois | 555 | 0.0% |
| Israeli | 135 | 0.0% |
| Italian | 54,267 | 2.8% |
| Jamaican | 2,038 | 0.1% |
| Japanese | 4,085 | 0.2% |
| Jordanian | 1,021 | 0.1% |
| Kenyan | 328 | 0.0% |
| Kiowa | 49 | 0.0% |
| Korean | 66,596 | 3.5% |
| Laotian | 3,068 | 0.2% |
| Latvian | 203 | 0.0% |
| Lebanese | 2,896 | 0.2% |
| Liberian | 120 | 0.0% |
| Lithuanian | 980 | 0.1% |
| Lumbee | 194 | 0.0% |
| Luxembourger | 34 | 0.0% |
| Malaysian | 1,951 | 0.1% |
| Maltese | 268 | 0.0% |
| Mexican | 890,131 | 46.6% |
| Mexican American Indian | 10,228 | 0.5% |
| Mongolian | 129 | 0.0% |
| Moroccan | 53 | 0.0% |
| Native Hawaiian | 4,334 | 0.2% |
| Navajo | 1,649 | 0.1% |
| Nepalese | 27 | 0.0% |
| New Zealander | 8 | 0.0% |
| Nicaraguan | 5,122 | 0.3% |
| Nigerian | 3,943 | 0.2% |
| Northern European | 1,723 | 0.1% |
| Norwegian | 14,677 | 0.8% |
| Okinawan | 7 | 0.0% |
| Osage | 115 | 0.0% |
| Ottawa | 2 | 0.0% |
| Paiute | 244 | 0.0% |
| Pakistani | 2,122 | 0.1% |
| Palestinian | 1,404 | 0.1% |
| Panamanian | 1,741 | 0.1% |
| Paraguayan | 295 | 0.0% |
| Pennsylvania German | 240 | 0.0% |
| Peruvian | 5,024 | 0.3% |
| Pima | 240 | 0.0% |
| Polish | 14,721 | 0.8% |
| Portuguese | 6,057 | 0.3% |
| Potawatomi | 139 | 0.0% |
| Pueblo | 1,151 | 0.1% |
| Puerto Rican | 15,250 | 0.8% |
| Puget Sound Salish | 11 | 0.0% |
| Romanian | 1,841 | 0.1% |
| Russian | 6,157 | 0.3% |
| Salvadoran | 25,672 | 1.3% |
| Samoan | 3,570 | 0.2% |
| Scandinavian | 5,251 | 0.3% |
| Scotch-Irish | 7,802 | 0.4% |
| Scottish | 18,370 | 1.0% |
| Seminole | 155 | 0.0% |
| Senegalese | 17 | 0.0% |
| Serbian | 544 | 0.0% |
| Shoshone | 65 | 0.0% |
| Sierra Leonean | 9 | 0.0% |
| Sioux | 376 | 0.0% |
| Slavic | 277 | 0.0% |
| Slovak | 1,037 | 0.1% |
| Slovene | 325 | 0.0% |
| Somali | 80 | 0.0% |
| South African | 312 | 0.0% |
| South American | 19,325 | 1.0% |
| South American Indian | 123 | 0.0% |
| Spaniard | 8,996 | 0.5% |
| Spanish | 7,689 | 0.4% |
| Spanish American | 541 | 0.0% |
| Spanish American Indian | 295 | 0.0% |
| Sri Lankan | 18,376 | 1.0% |
| Subsaharan African | 12,660 | 0.7% |
| Sudanese | 100 | 0.0% |
| Swedish | 12,308 | 0.6% |
| Swiss | 1,800 | 0.1% |
| Syrian | 1,600 | 0.1% |
| Thai | 12,307 | 0.6% |
| Tlingit-Haida | 31 | 0.0% |
| Tohono O'Odham | 239 | 0.0% |
| Tongan | 2,238 | 0.1% |
| Trinidadian and Tobagonian | 252 | 0.0% |
| Turkish | 591 | 0.0% |
| Ugandan | 14 | 0.0% |
| Ukrainian | 1,354 | 0.1% |
| Uruguayan | 254 | 0.0% |
| Ute | 32 | 0.0% |
| Venezuelan | 1,201 | 0.1% |
| Vietnamese | 387 | 0.0% |
| Welsh | 6,425 | 0.3% |
| West Indian | 667 | 0.0% |
| Yakama | 24 | 0.0% |
| Yaqui | 1,124 | 0.1% |
| Yugoslavian | 481 | 0.0% |
| Yuman | 390 | 0.0% |
| Yup'ik | 46 | 0.0% |
| Zimbabwean | 36 | 0.0% | View All 186 Rows |
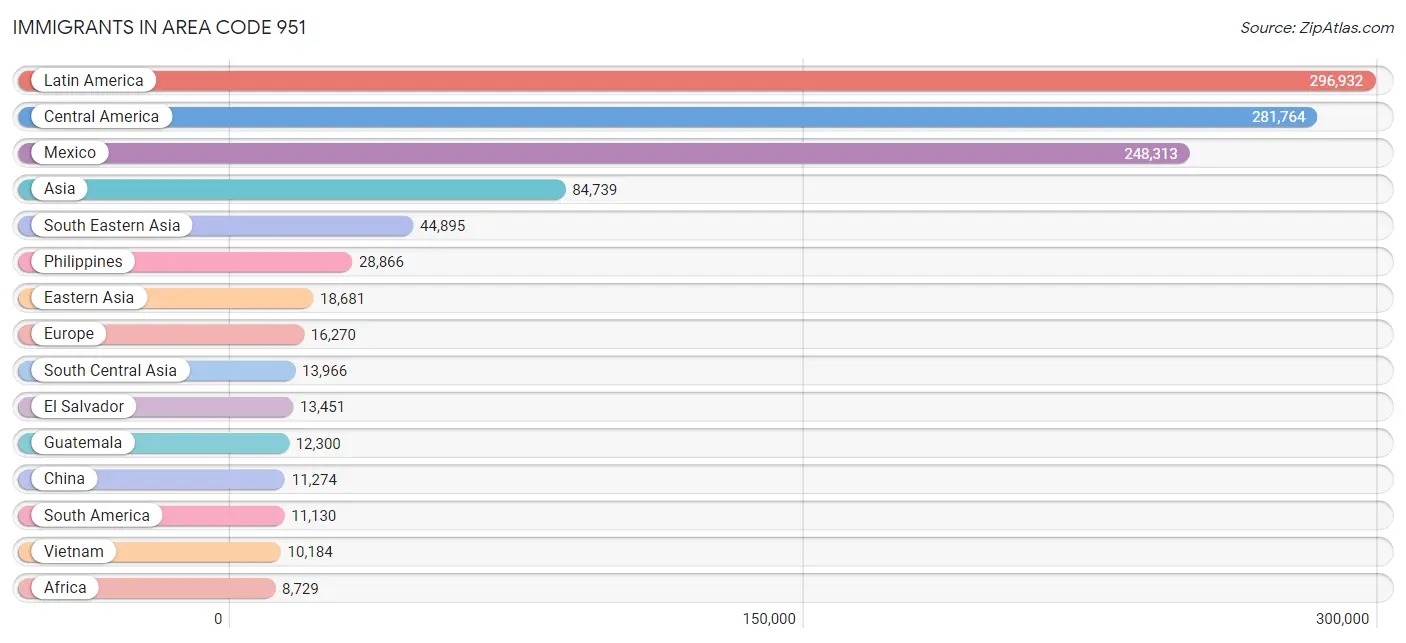
Immigrants in Area Code 951
The most numerous immigrant groups reported in Area Code 951 came from Latin America (296,932 | 15.5%), Central America (281,764 | 14.8%), Mexico (248,313 | 13.0%), Asia (84,739 | 4.4%), and South Eastern Asia (44,895 | 2.4%), together accounting for 50.1% of all Area Code 951 residents.
| Immigration Origin | # Population | % Population |
| Afghanistan | 1,691 | 0.1% |
| Africa | 8,729 | 0.5% |
| Albania | 14 | 0.0% |
| Argentina | 1,104 | 0.1% |
| Armenia | 227 | 0.0% |
| Asia | 84,739 | 4.4% |
| Australia | 456 | 0.0% |
| Austria | 150 | 0.0% |
| Azores | 30 | 0.0% |
| Bahamas | 58 | 0.0% |
| Bangladesh | 650 | 0.0% |
| Barbados | 58 | 0.0% |
| Belarus | 169 | 0.0% |
| Belgium | 92 | 0.0% |
| Belize | 601 | 0.0% |
| Bolivia | 229 | 0.0% |
| Bosnia and Herzegovina | 11 | 0.0% |
| Brazil | 864 | 0.1% |
| Bulgaria | 187 | 0.0% |
| Cambodia | 1,532 | 0.1% |
| Cameroon | 42 | 0.0% |
| Canada | 3,351 | 0.2% |
| Caribbean | 4,038 | 0.2% |
| Central America | 281,764 | 14.8% |
| Chile | 304 | 0.0% |
| China | 11,274 | 0.6% |
| Colombia | 3,266 | 0.2% |
| Congo | 4 | 0.0% |
| Costa Rica | 690 | 0.0% |
| Croatia | 183 | 0.0% |
| Cuba | 2,047 | 0.1% |
| Czechoslovakia | 345 | 0.0% |
| Denmark | 378 | 0.0% |
| Dominican Republic | 298 | 0.0% |
| Eastern Africa | 1,163 | 0.1% |
| Eastern Asia | 18,681 | 1.0% |
| Eastern Europe | 4,506 | 0.2% |
| Ecuador | 971 | 0.1% |
| Egypt | 2,382 | 0.1% |
| El Salvador | 13,451 | 0.7% |
| England | 3,170 | 0.2% |
| Eritrea | 32 | 0.0% |
| Ethiopia | 155 | 0.0% |
| Europe | 16,270 | 0.9% |
| Fiji | 499 | 0.0% |
| France | 453 | 0.0% |
| Germany | 2,361 | 0.1% |
| Ghana | 614 | 0.0% |
| Greece | 301 | 0.0% |
| Grenada | 42 | 0.0% |
| Guatemala | 12,300 | 0.6% |
| Guyana | 270 | 0.0% |
| Haiti | 418 | 0.0% |
| Honduras | 2,571 | 0.1% |
| Hong Kong | 596 | 0.0% |
| Hungary | 349 | 0.0% |
| India | 6,214 | 0.3% |
| Indonesia | 1,359 | 0.1% |
| Iran | 2,324 | 0.1% |
| Iraq | 1,502 | 0.1% |
| Ireland | 356 | 0.0% |
| Israel | 300 | 0.0% |
| Italy | 652 | 0.0% |
| Jamaica | 714 | 0.0% |
| Japan | 1,581 | 0.1% |
| Jordan | 934 | 0.1% |
| Kazakhstan | 55 | 0.0% |
| Kenya | 585 | 0.0% |
| Korea | 5,805 | 0.3% |
| Kuwait | 219 | 0.0% |
| Laos | 853 | 0.0% |
| Latin America | 296,932 | 15.5% |
| Latvia | 53 | 0.0% |
| Lebanon | 1,358 | 0.1% |
| Liberia | 99 | 0.0% |
| Lithuania | 72 | 0.0% |
| Malaysia | 174 | 0.0% |
| Mexico | 248,313 | 13.0% |
| Micronesia | 7 | 0.0% |
| Middle Africa | 138 | 0.0% |
| Moldova | 19 | 0.0% |
| Morocco | 70 | 0.0% |
| Nepal | 176 | 0.0% |
| Netherlands | 534 | 0.0% |
| Nicaragua | 3,111 | 0.2% |
| Nigeria | 3,214 | 0.2% |
| North Macedonia | 7 | 0.0% |
| Northern Africa | 2,556 | 0.1% |
| Northern Europe | 6,261 | 0.3% |
| Norway | 81 | 0.0% |
| Oceania | 1,897 | 0.1% |
| Pakistan | 2,178 | 0.1% |
| Panama | 672 | 0.0% |
| Peru | 3,242 | 0.2% |
| Philippines | 28,866 | 1.5% |
| Poland | 792 | 0.0% |
| Portugal | 333 | 0.0% |
| Romania | 786 | 0.0% |
| Russia | 764 | 0.0% |
| Saudi Arabia | 326 | 0.0% |
| Scotland | 491 | 0.0% |
| Serbia | 76 | 0.0% |
| Sierra Leone | 170 | 0.0% |
| Singapore | 88 | 0.0% |
| Somalia | 34 | 0.0% |
| South Africa | 355 | 0.0% |
| South America | 11,130 | 0.6% |
| South Central Asia | 13,966 | 0.7% |
| South Eastern Asia | 44,895 | 2.4% |
| Southern Europe | 1,849 | 0.1% |
| Spain | 537 | 0.0% |
| Sri Lanka | 623 | 0.0% |
| St. Vincent and the Grenadines | 36 | 0.0% |
| Sudan | 55 | 0.0% |
| Sweden | 323 | 0.0% |
| Switzerland | 59 | 0.0% |
| Syria | 1,430 | 0.1% |
| Taiwan | 2,164 | 0.1% |
| Thailand | 1,375 | 0.1% |
| Trinidad and Tobago | 284 | 0.0% |
| Turkey | 315 | 0.0% |
| Uganda | 136 | 0.0% |
| Ukraine | 499 | 0.0% |
| Uruguay | 121 | 0.0% |
| Uzbekistan | 25 | 0.0% |
| Venezuela | 553 | 0.0% |
| Vietnam | 10,184 | 0.5% |
| West Indies | 12 | 0.0% |
| Western Africa | 4,144 | 0.2% |
| Western Asia | 6,882 | 0.4% |
| Western Europe | 3,654 | 0.2% |
| Yemen | 25 | 0.0% |
| Zaire | 16 | 0.0% |
| Zimbabwe | 54 | 0.0% | View All 134 Rows |
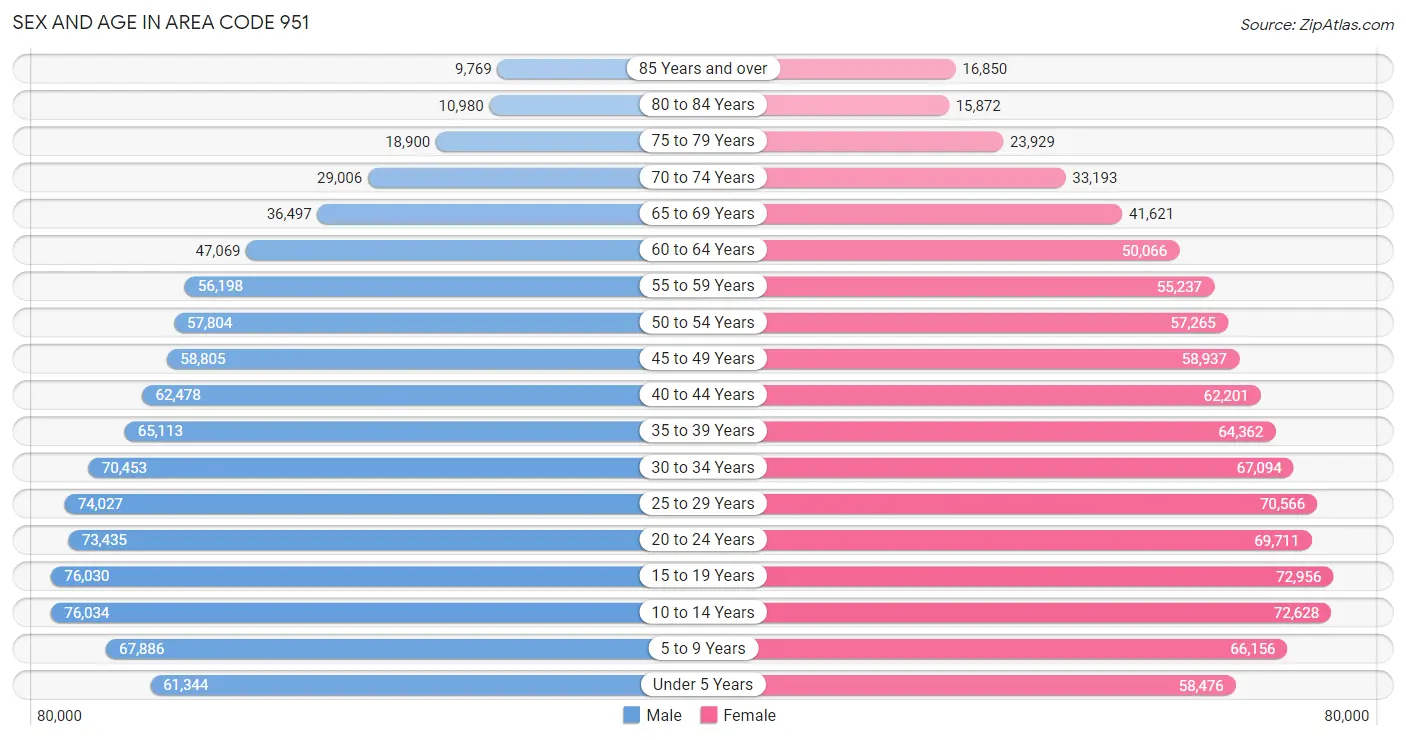
Sex and Age in Area Code 951
Sex and Age in Area Code 951
The most populous age groups in Area Code 951 are 10 to 14 Years (76,034 | 8.0%) for men and 15 to 19 Years (72,956 | 7.6%) for women.
| Age Bracket | Male | Female |
| Under 5 Years | 61,344 (6.4%) | 58,476 (6.1%) |
| 5 to 9 Years | 67,886 (7.1%) | 66,156 (6.9%) |
| 10 to 14 Years | 76,034 (8.0%) | 72,628 (7.6%) |
| 15 to 19 Years | 76,030 (8.0%) | 72,956 (7.6%) |
| 20 to 24 Years | 73,435 (7.7%) | 69,711 (7.3%) |
| 25 to 29 Years | 74,027 (7.8%) | 70,566 (7.4%) |
| 30 to 34 Years | 70,453 (7.4%) | 67,094 (7.0%) |
| 35 to 39 Years | 65,113 (6.8%) | 64,362 (6.7%) |
| 40 to 44 Years | 62,478 (6.6%) | 62,201 (6.5%) |
| 45 to 49 Years | 58,805 (6.2%) | 58,937 (6.2%) |
| 50 to 54 Years | 57,804 (6.1%) | 57,265 (6.0%) |
| 55 to 59 Years | 56,198 (5.9%) | 55,237 (5.8%) |
| 60 to 64 Years | 47,069 (5.0%) | 50,066 (5.2%) |
| 65 to 69 Years | 36,497 (3.8%) | 41,621 (4.3%) |
| 70 to 74 Years | 29,006 (3.0%) | 33,193 (3.5%) |
| 75 to 79 Years | 18,900 (2.0%) | 23,929 (2.5%) |
| 80 to 84 Years | 10,980 (1.1%) | 15,872 (1.7%) |
| 85 Years and over | 9,769 (1.0%) | 16,850 (1.8%) |
| Total | 951,828 (100.0%) | 957,120 (100.0%) |
Families and Households in Area Code 951
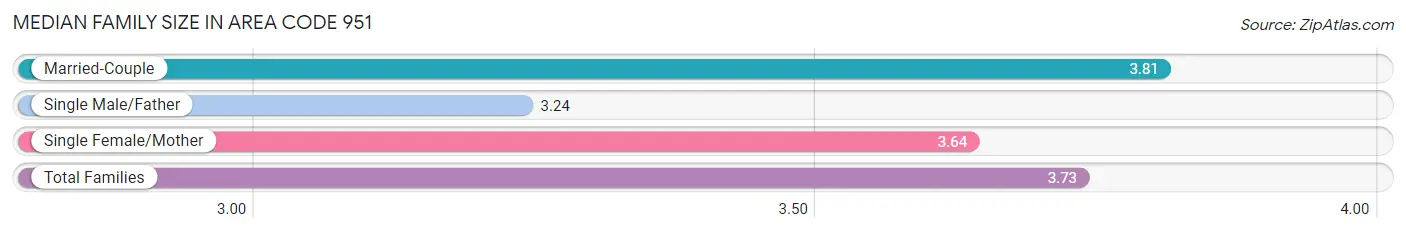
Median Family Size in Area Code 951
The median family size in Area Code 951 is 3.73 persons per family, with married-couple families (308,523 | 71.3%) accounting for the largest median family size of 3.80702 persons per family. On the other hand, single male/father families (39,662 | 9.2%) represent the smallest median family size with 3.24 persons per family.
| Family Type | # Families | Family Size |
| Married-Couple | 308,523 (71.3%) | 3.81 |
| Single Male/Father | 39,662 (9.2%) | 3.24 |
| Single Female/Mother | 84,269 (19.5%) | 3.64 |
| Total Families | 432,454 (100.0%) | 3.73 |
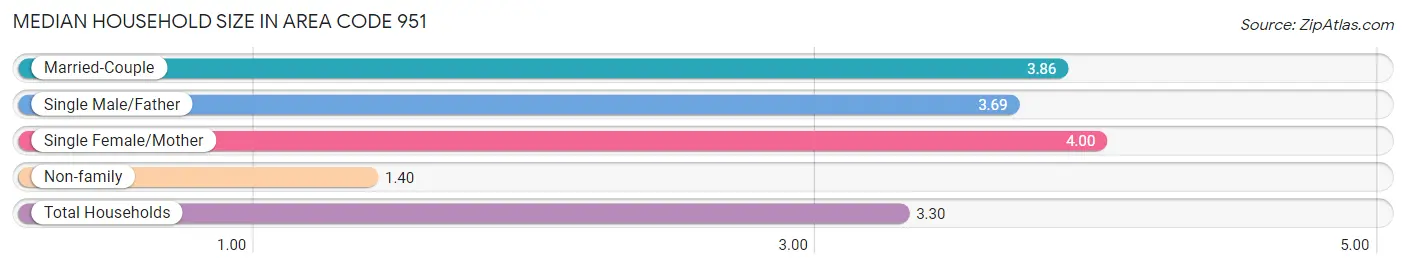
Median Household Size in Area Code 951
The median household size in Area Code 951 is 3.30 persons per household, with single female/mother households (84,269 | 15.2%) accounting for the largest median household size of 4.00255 persons per household. non-family households (121,663 | 22.0%) represent the smallest median household size with 1.40 persons per household.
| Household Type | # Households | Household Size |
| Married-Couple | 308,523 (55.7%) | 3.86 |
| Single Male/Father | 39,662 (7.2%) | 3.69 |
| Single Female/Mother | 84,269 (15.2%) | 4.00 |
| Non-family | 121,663 (22.0%) | 1.40 |
| Total Households | 554,117 (100.0%) | 3.30 |
Household Size by Marriage Status in Area Code 951
Out of a total of 554,117 households in Area Code 951, 432,454 (78.0%) are family households, while 121,663 (22.0%) are nonfamily households. The most numerous type of family households are 2-person households, comprising 126,471, and the most common type of nonfamily households are 1-person households, comprising 92,159.
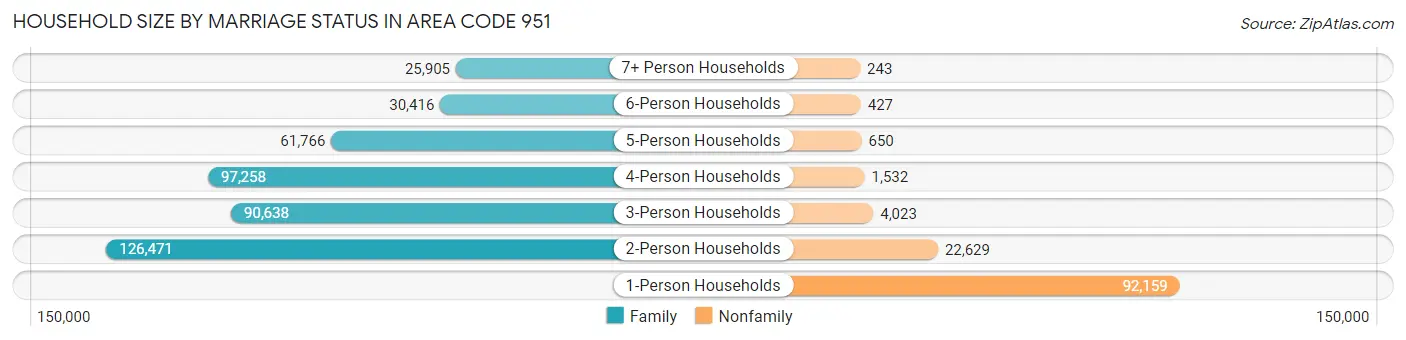
| Household Size | Family Households | Nonfamily Households |
| 1-Person Households | - | 92,159 (16.6%) |
| 2-Person Households | 126,471 (22.8%) | 22,629 (4.1%) |
| 3-Person Households | 90,638 (16.4%) | 4,023 (0.7%) |
| 4-Person Households | 97,258 (17.5%) | 1,532 (0.3%) |
| 5-Person Households | 61,766 (11.2%) | 650 (0.1%) |
| 6-Person Households | 30,416 (5.5%) | 427 (0.1%) |
| 7+ Person Households | 25,905 (4.7%) | 243 (0.0%) |
| Total | 432,454 (78.0%) | 121,663 (22.0%) |
Female Fertility in Area Code 951
Fertility by Age in Area Code 951
Average fertility rate in Area Code 951 is 50.2 births per 1,000 women. Women in the age bracket of 20 to 34 years have the highest fertility rate with 82.6 births per 1,000 women. Women in the age bracket of 20 to 34 years acount for 70.9% of all women with births.
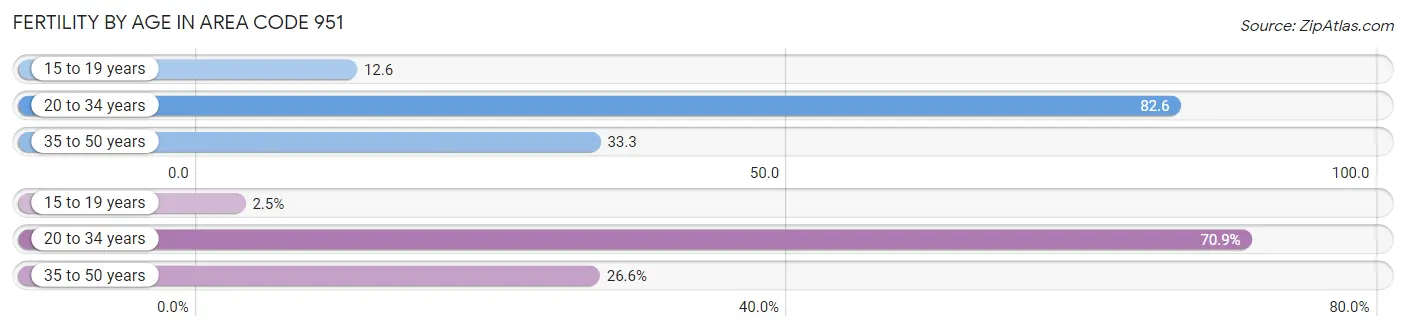
| Age Bracket | Women with Births | Births / 1,000 Women |
| 15 to 19 years | 612 (2.5%) | 12.6 |
| 20 to 34 years | 17,101 (70.9%) | 82.6 |
| 35 to 50 years | 6,415 (26.6%) | 33.3 |
| Total | 24,128 (100.0%) | 50.2 |
Fertility by Age by Marriage Status in Area Code 951
66.2% of women with births (24,128) in Area Code 951 are married. The highest percentage of unmarried women with births falls into 15 to 19 years age bracket with 94.0% of them unmarried at the time of birth, while the lowest percentage of unmarried women with births belong to 35 to 50 years age bracket with 30.9% of them unmarried.
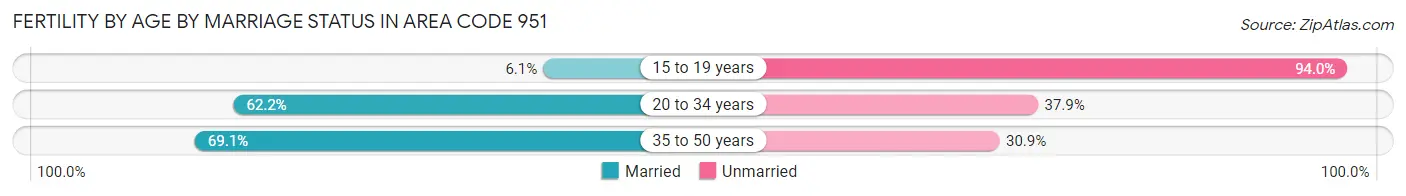
| Age Bracket | Married | Unmarried |
| 15 to 19 years | 37 (6.0%) | 575 (94.0%) |
| 20 to 34 years | 10,629 (62.2%) | 6,472 (37.9%) |
| 35 to 50 years | 4,435 (69.1%) | 1,980 (30.9%) |
| Total | 15,969 (66.2%) | 8,159 (33.8%) |
Fertility by Education in Area Code 951
Average fertility rate in Area Code 951 is 50.2 births per 1,000 women. Women with the education attainment of graduate degree have the highest fertility rate of 82.8 births per 1,000 women, while women with the education attainment of less than high school have the lowest fertility at 42.6 births per 1,000 women. Women with the education attainment of college or associate's degree represent 35.8% of all women with births.
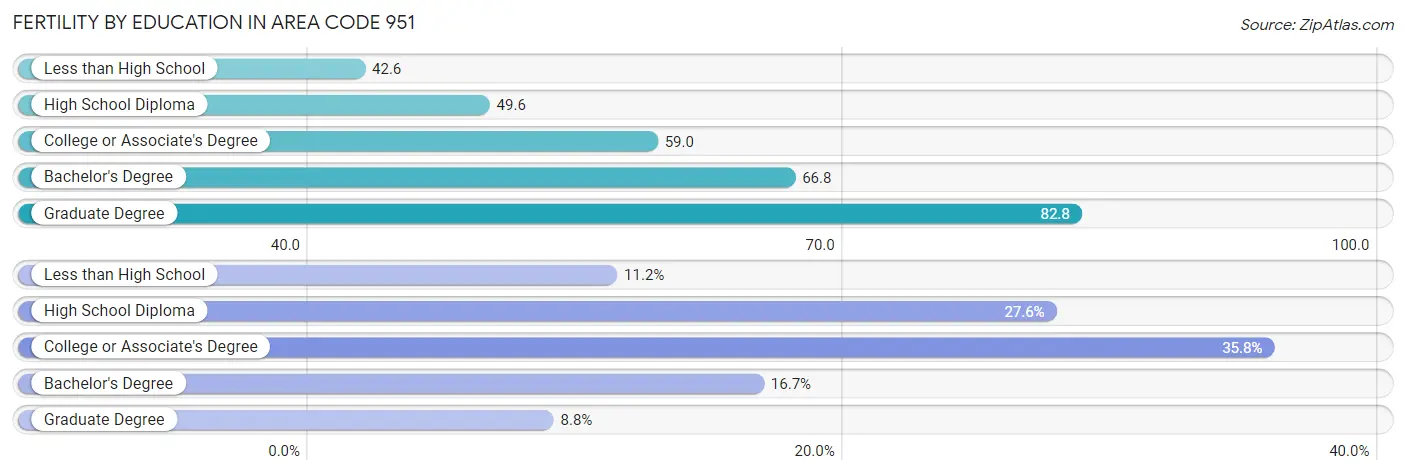
| Educational Attainment | Women with Births | Births / 1,000 Women |
| Less than High School | 2,692 (11.2%) | 42.6 |
| High School Diploma | 6,663 (27.6%) | 49.6 |
| College or Associate's Degree | 8,634 (35.8%) | 59.0 |
| Bachelor's Degree | 4,020 (16.7%) | 66.8 |
| Graduate Degree | 2,119 (8.8%) | 82.8 |
| Total | 24,128 (100.0%) | 50.2 |
Fertility by Education by Marriage Status in Area Code 951
33.8% of women with births in Area Code 951 are unmarried. Women with the educational attainment of bachelor's degree are most likely to be married with 71.2% of them married at childbirth, while women with the educational attainment of less than high school are least likely to be married with 55.3% of them unmarried at childbirth.
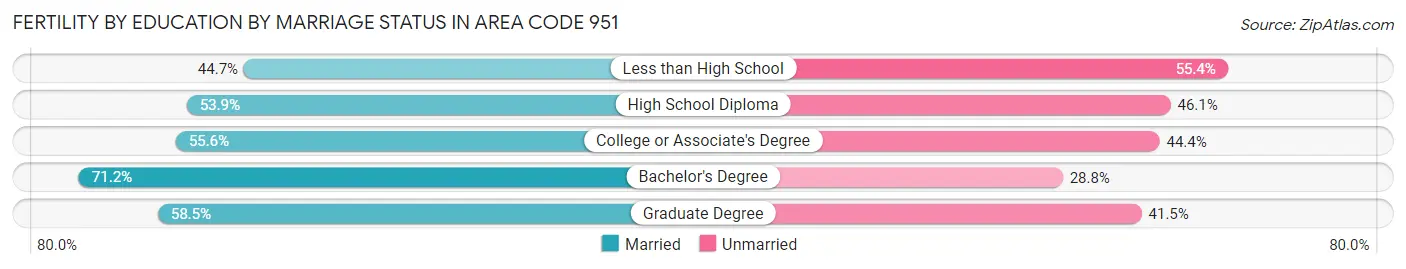
| Educational Attainment | Married | Unmarried |
| Less than High School | 1,202 (44.7%) | 1,490 (55.3%) |
| High School Diploma | 3,589 (53.9%) | 3,074 (46.1%) |
| College or Associate's Degree | 4,803 (55.6%) | 3,831 (44.4%) |
| Bachelor's Degree | 2,864 (71.2%) | 1,156 (28.8%) |
| Graduate Degree | 1,240 (58.5%) | 879 (41.5%) |
| Total | 15,969 (66.2%) | 8,159 (33.8%) |
Employment Characteristics in Area Code 951
Employment by Class of Employer in Area Code 951
Among the 830,693 employed individuals in Area Code 951, private company employees (581,190 | 70.0%), local government employees (75,923 | 9.1%), and self-employed (not incorporated) (48,179 | 5.8%) make up the most common classes of employment.
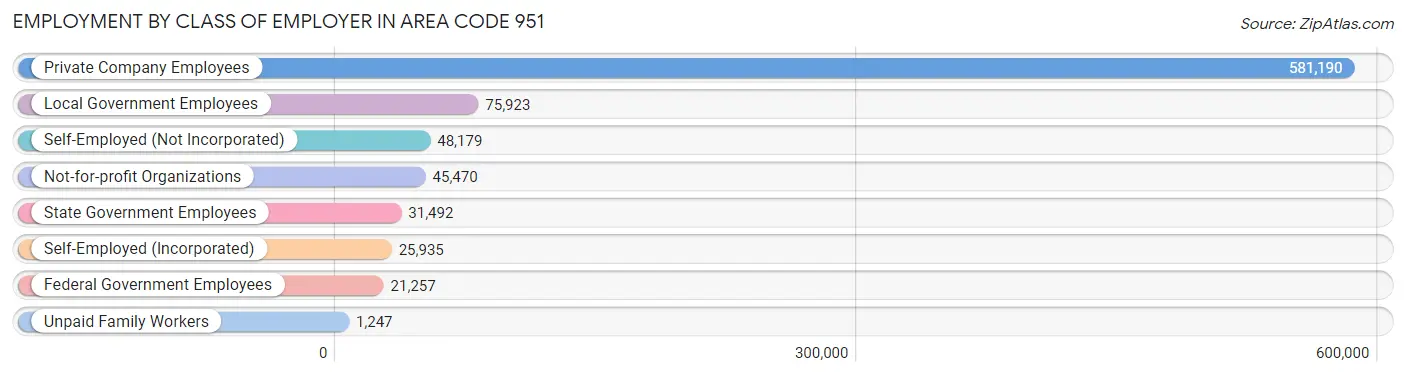
| Employer Class | # Employees | % Employees |
| Private Company Employees | 581,190 | 70.0% |
| Self-Employed (Incorporated) | 25,935 | 3.1% |
| Self-Employed (Not Incorporated) | 48,179 | 5.8% |
| Not-for-profit Organizations | 45,470 | 5.5% |
| Local Government Employees | 75,923 | 9.1% |
| State Government Employees | 31,492 | 3.8% |
| Federal Government Employees | 21,257 | 2.6% |
| Unpaid Family Workers | 1,247 | 0.2% |
| Total | 830,693 | 100.0% |
Employment Status by Age in Area Code 951
According to the labor force statistics for Area Code 951, out of the total population over 16 years of age (1,477,208), 60.5% or 893,711 individuals are in the labor force, with 7.0% or 62,292 of them unemployed. The age group with the highest labor force participation rate is 30 to 34 years, with 80.4% or 110,629 individuals in the labor force. Within the labor force, the 16 to 19 years age range has the highest percentage of unemployed individuals, with 1,004.4% or 409,012 of them being unemployed.
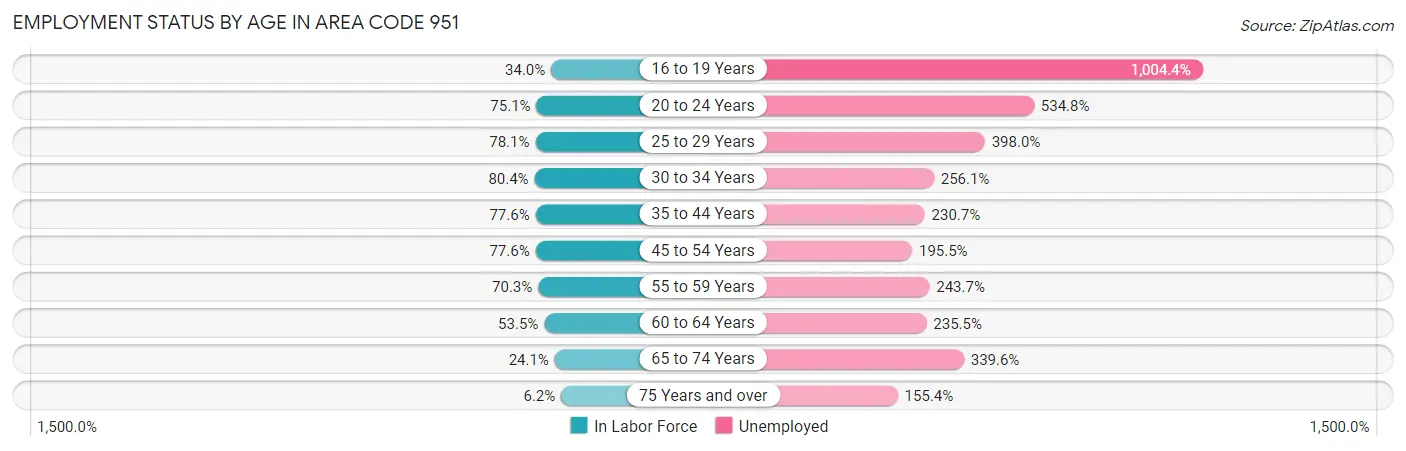
| Age Bracket | In Labor Force | Unemployed |
| 16 to 19 Years | 40,716 (34.0%) | 409,012 (1,004.4%) |
| 20 to 24 Years | 107,428 (75.0%) | 574,541 (534.8%) |
| 25 to 29 Years | 112,933 (78.1%) | 449,449 (398.0%) |
| 30 to 34 Years | 110,630 (80.4%) | 283,321 (256.1%) |
| 35 to 44 Years | 197,099 (77.5%) | 454,700 (230.7%) |
| 45 to 54 Years | 180,642 (77.6%) | 353,147 (195.5%) |
| 55 to 59 Years | 78,353 (70.3%) | 190,939 (243.7%) |
| 60 to 64 Years | 51,936 (53.5%) | 122,314 (235.5%) |
| 65 to 74 Years | 33,847 (24.1%) | 114,934 (339.6%) |
| 75 Years and over | 6,001 (6.2%) | 9,322 (155.4%) |
| Total | 893,648 (60.5%) | 62,288 (7.0%) |
Employment Status by Educational Attainment in Area Code 951
According to labor force statistics for Area Code 951, 74.0% of individuals (723,871) out of the total population between 25 and 64 years of age (977,675) are in the labor force, with 253.3% or 1,833,565 of them being unemployed. The group with the highest labor force participation rate are those with the educational attainment of bachelor's degree or higher, with 82.9% or 176,086 individuals in the labor force. Within the labor force, individuals with less than high school education have the highest percentage of unemployment, with 298.7% or 323,868 of them being unemployed.
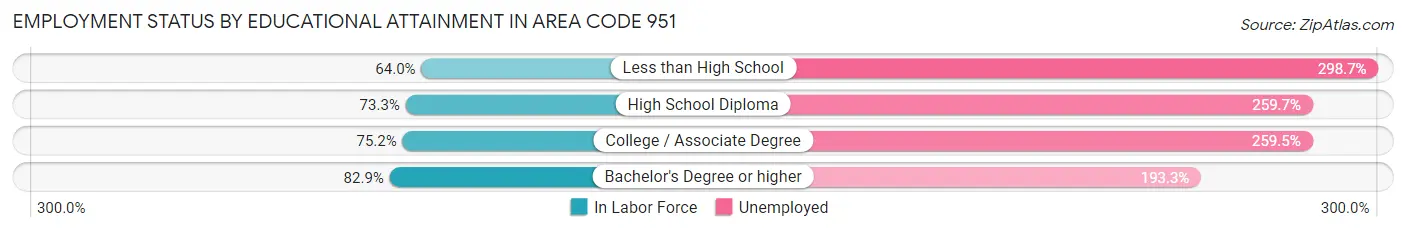
| Educational Attainment | In Labor Force | Unemployed |
| Less than High School | 108,430 (64.0%) | 506,201 (298.7%) |
| High School Diploma | 201,556 (73.3%) | 713,736 (259.7%) |
| College / Associate Degree | 241,305 (75.2%) | 832,647 (259.5%) |
| Bachelor's Degree or higher | 176,089 (82.9%) | 410,782 (193.3%) |
| Total | 723,833 (74.0%) | 2,476,451 (253.3%) |
Employment Occupations by Sex in Area Code 951
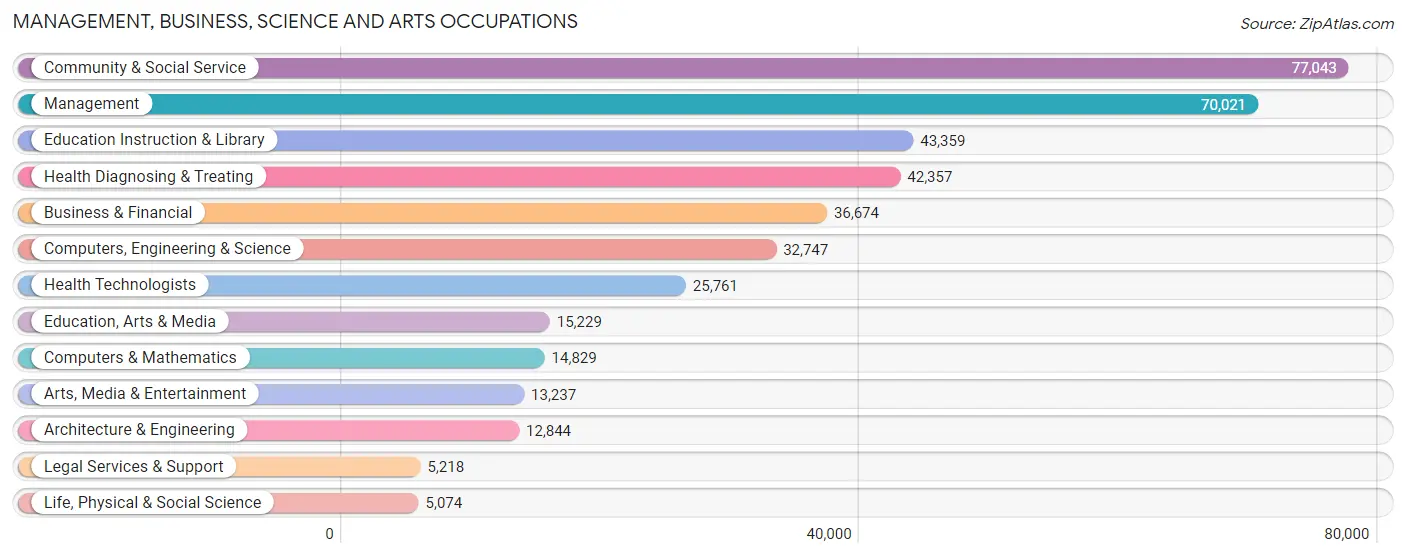
Management, Business, Science and Arts Occupations
The most common Management, Business, Science and Arts occupations in Area Code 951 are Community & Social Service (77,043 | 9.1%), Management (70,021 | 8.2%), Education Instruction & Library (43,359 | 5.1%), Health Diagnosing & Treating (42,357 | 5.0%), and Business & Financial (36,674 | 4.3%).
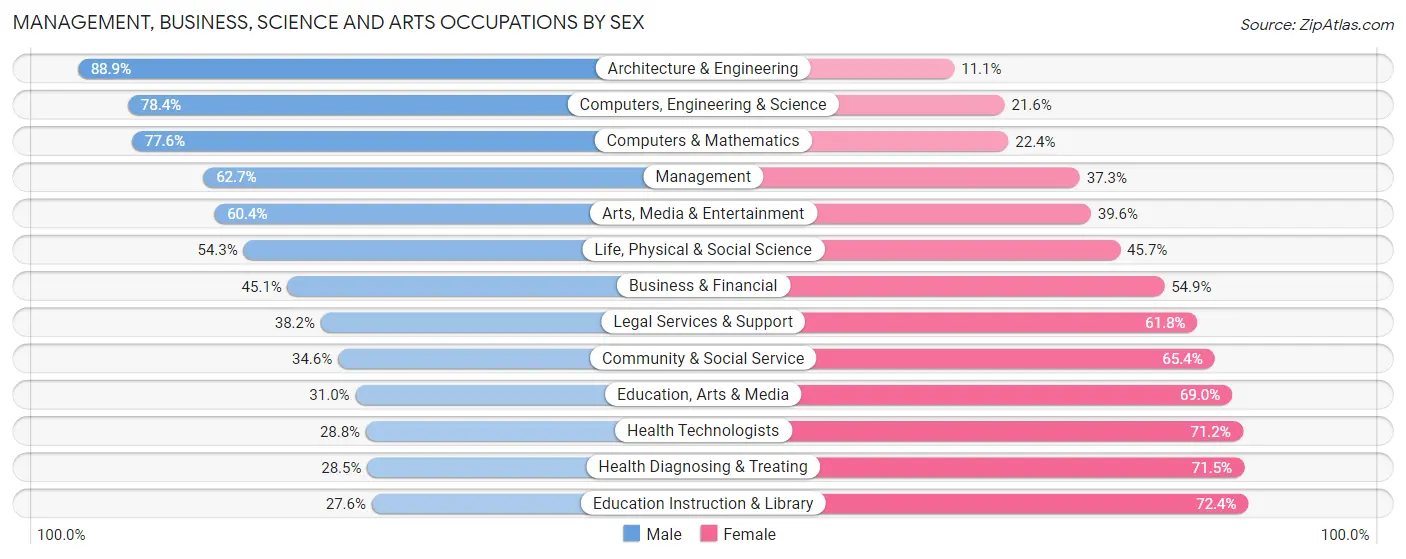
Management, Business, Science and Arts Occupations by Sex
Within the Management, Business, Science and Arts occupations in Area Code 951, the most male-oriented occupations are Architecture & Engineering (88.9%), Computers, Engineering & Science (78.4%), and Computers & Mathematics (77.6%), while the most female-oriented occupations are Education Instruction & Library (72.4%), Health Diagnosing & Treating (71.5%), and Health Technologists (71.2%).
| Occupation | Male | Female |
| Management | 43,924 (62.7%) | 26,097 (37.3%) |
| Business & Financial | 16,549 (45.1%) | 20,125 (54.9%) |
| Computers, Engineering & Science | 25,688 (78.4%) | 7,059 (21.6%) |
| Computers & Mathematics | 11,513 (77.6%) | 3,316 (22.4%) |
| Architecture & Engineering | 11,419 (88.9%) | 1,425 (11.1%) |
| Life, Physical & Social Science | 2,756 (54.3%) | 2,318 (45.7%) |
| Community & Social Service | 26,673 (34.6%) | 50,370 (65.4%) |
| Education, Arts & Media | 4,719 (31.0%) | 10,510 (69.0%) |
| Legal Services & Support | 1,994 (38.2%) | 3,224 (61.8%) |
| Education Instruction & Library | 11,960 (27.6%) | 31,399 (72.4%) |
| Arts, Media & Entertainment | 8,000 (60.4%) | 5,237 (39.6%) |
| Health Diagnosing & Treating | 12,078 (28.5%) | 30,279 (71.5%) |
| Health Technologists | 7,417 (28.8%) | 18,344 (71.2%) |
| Total (Category) | 124,912 (48.3%) | 133,930 (51.7%) |
| Total (Overall) | 472,626 (55.5%) | 378,181 (44.5%) |
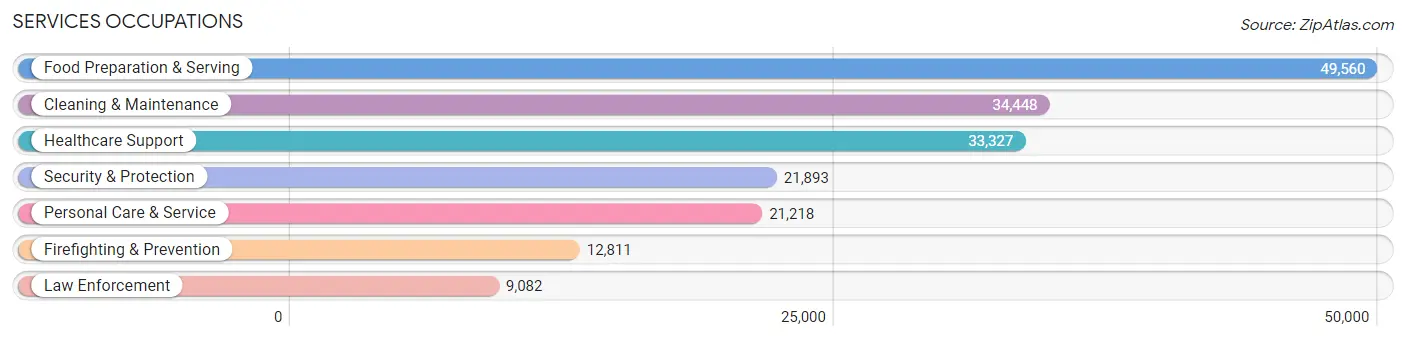
Services Occupations
The most common Services occupations in Area Code 951 are Food Preparation & Serving (49,560 | 5.8%), Cleaning & Maintenance (34,448 | 4.1%), Healthcare Support (33,327 | 3.9%), Security & Protection (21,893 | 2.6%), and Personal Care & Service (21,218 | 2.5%).
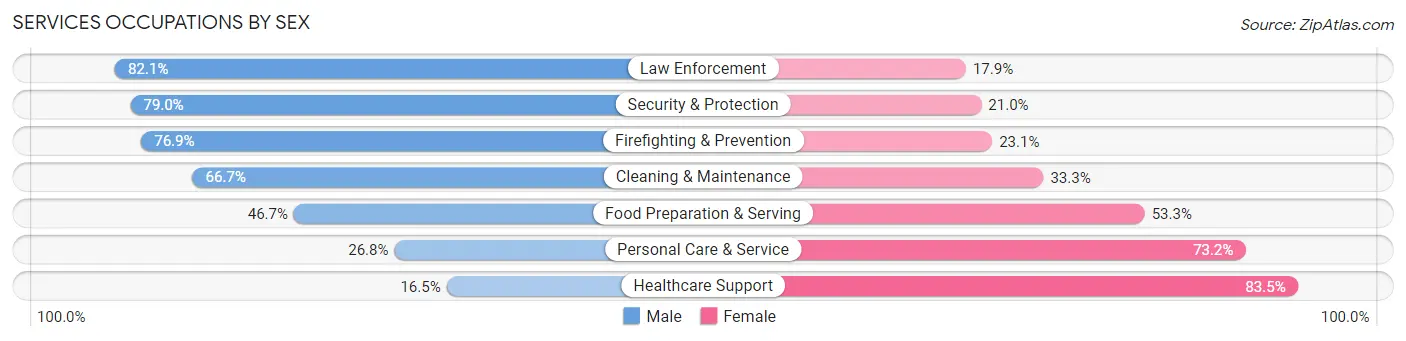
Services Occupations by Sex
Within the Services occupations in Area Code 951, the most male-oriented occupations are Law Enforcement (82.1%), Security & Protection (79.0%), and Firefighting & Prevention (76.9%), while the most female-oriented occupations are Healthcare Support (83.5%), Personal Care & Service (73.2%), and Food Preparation & Serving (53.3%).
| Occupation | Male | Female |
| Healthcare Support | 5,486 (16.5%) | 27,841 (83.5%) |
| Security & Protection | 17,305 (79.0%) | 4,588 (21.0%) |
| Firefighting & Prevention | 9,850 (76.9%) | 2,961 (23.1%) |
| Law Enforcement | 7,455 (82.1%) | 1,627 (17.9%) |
| Food Preparation & Serving | 23,140 (46.7%) | 26,420 (53.3%) |
| Cleaning & Maintenance | 22,991 (66.7%) | 11,457 (33.3%) |
| Personal Care & Service | 5,687 (26.8%) | 15,531 (73.2%) |
| Total (Category) | 74,609 (46.5%) | 85,837 (53.5%) |
| Total (Overall) | 472,626 (55.5%) | 378,181 (44.5%) |
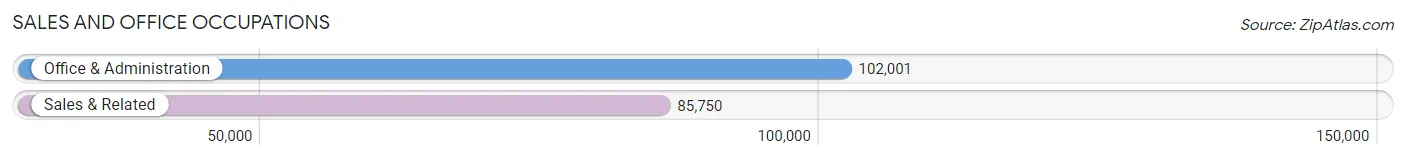
Sales and Office Occupations
The most common Sales and Office occupations in Area Code 951 are Office & Administration (102,001 | 12.0%), and Sales & Related (85,750 | 10.1%).
Sales and Office Occupations by Sex
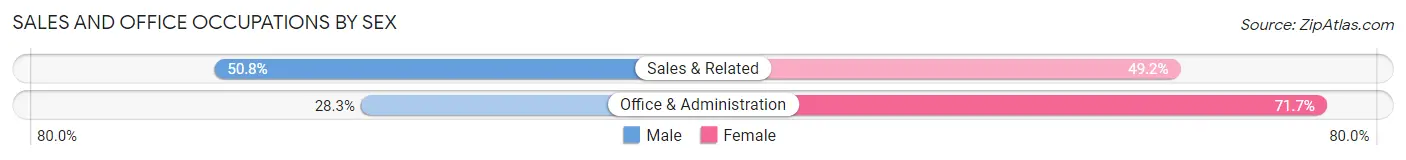
| Occupation | Male | Female |
| Sales & Related | 43,560 (50.8%) | 42,190 (49.2%) |
| Office & Administration | 28,853 (28.3%) | 73,148 (71.7%) |
| Total (Category) | 72,413 (38.6%) | 115,338 (61.4%) |
| Total (Overall) | 472,626 (55.5%) | 378,181 (44.5%) |
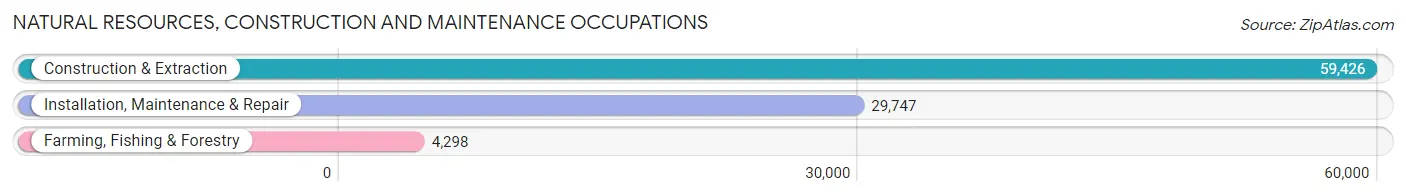
Natural Resources, Construction and Maintenance Occupations
The most common Natural Resources, Construction and Maintenance occupations in Area Code 951 are Construction & Extraction (59,426 | 7.0%), Installation, Maintenance & Repair (29,747 | 3.5%), and Farming, Fishing & Forestry (4,298 | 0.5%).
Natural Resources, Construction and Maintenance Occupations by Sex
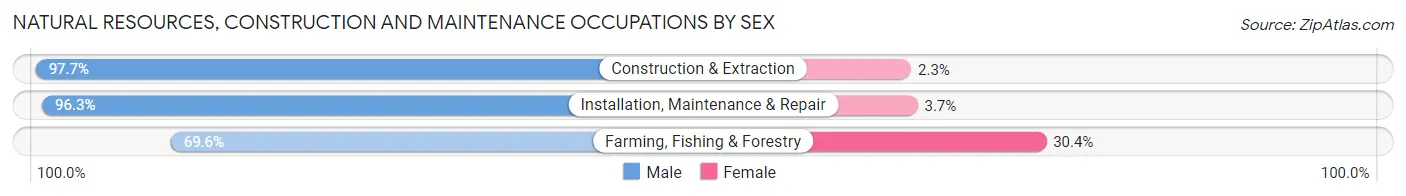
| Occupation | Male | Female |
| Farming, Fishing & Forestry | 2,990 (69.6%) | 1,308 (30.4%) |
| Construction & Extraction | 58,046 (97.7%) | 1,380 (2.3%) |
| Installation, Maintenance & Repair | 28,657 (96.3%) | 1,090 (3.7%) |
| Total (Category) | 89,693 (96.0%) | 3,778 (4.0%) |
| Total (Overall) | 472,626 (55.5%) | 378,181 (44.5%) |
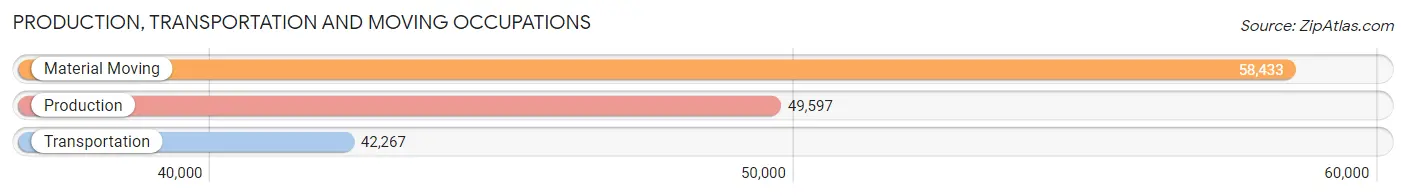
Production, Transportation and Moving Occupations
The most common Production, Transportation and Moving occupations in Area Code 951 are Material Moving (58,433 | 6.9%), Production (49,597 | 5.8%), and Transportation (42,267 | 5.0%).
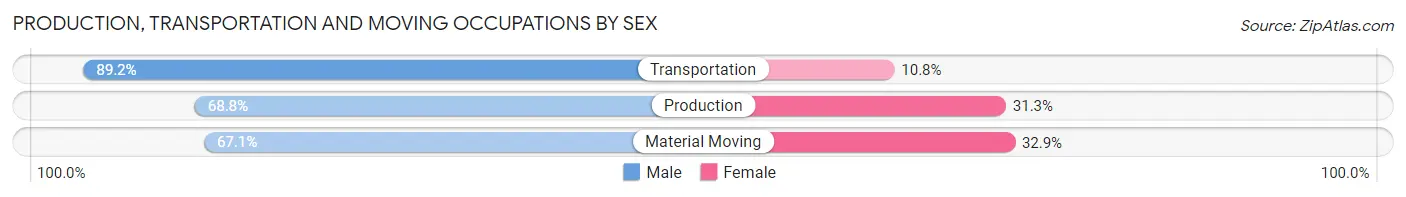
Production, Transportation and Moving Occupations by Sex
| Occupation | Male | Female |
| Production | 34,097 (68.8%) | 15,500 (31.2%) |
| Transportation | 37,707 (89.2%) | 4,560 (10.8%) |
| Material Moving | 39,195 (67.1%) | 19,238 (32.9%) |
| Total (Category) | 110,999 (73.9%) | 39,298 (26.2%) |
| Total (Overall) | 472,626 (55.5%) | 378,181 (44.5%) |
Employment Industries by Sex in Area Code 951
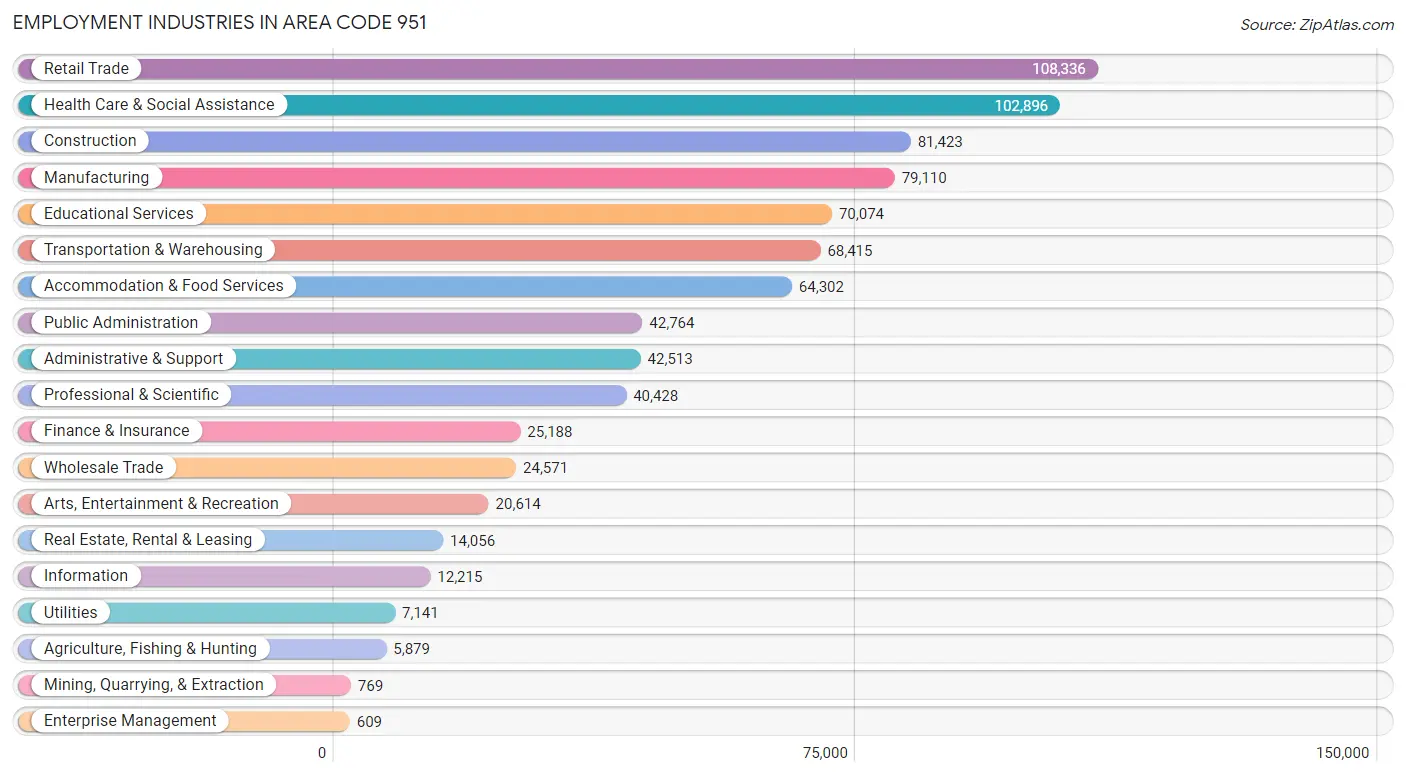
Employment Industries in Area Code 951
The major employment industries in Area Code 951 include Retail Trade (108,336 | 12.7%), Health Care & Social Assistance (102,896 | 12.1%), Construction (81,423 | 9.6%), Manufacturing (79,110 | 9.3%), and Educational Services (70,074 | 8.2%).
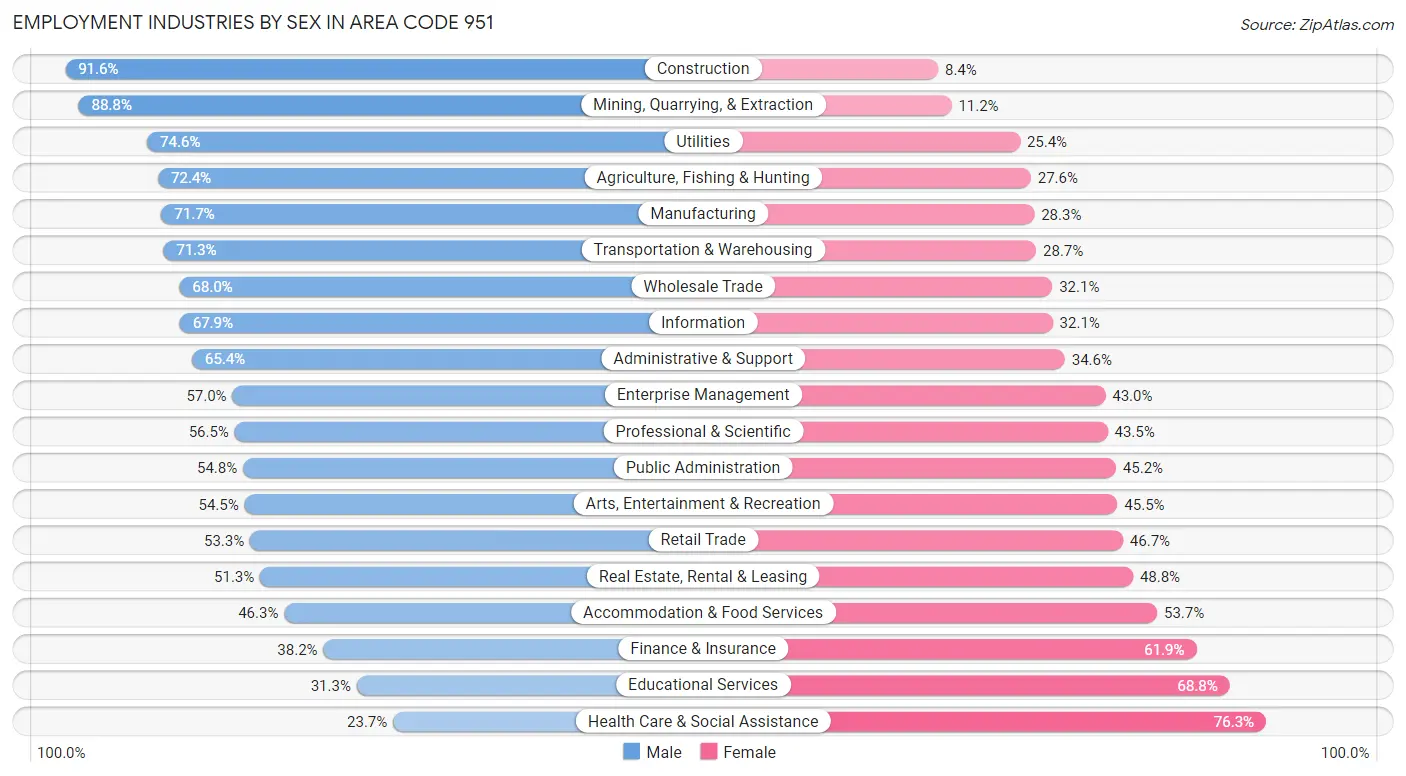
Employment Industries by Sex in Area Code 951
The Area Code 951 industries that see more men than women are Construction (91.6%), Mining, Quarrying, & Extraction (88.8%), and Utilities (74.6%), whereas the industries that tend to have a higher number of women are Health Care & Social Assistance (76.3%), Educational Services (68.8%), and Finance & Insurance (61.9%).
| Industry | Male | Female |
| Agriculture, Fishing & Hunting | 4,256 (72.4%) | 1,623 (27.6%) |
| Mining, Quarrying, & Extraction | 683 (88.8%) | 86 (11.2%) |
| Construction | 74,576 (91.6%) | 6,847 (8.4%) |
| Manufacturing | 56,703 (71.7%) | 22,407 (28.3%) |
| Wholesale Trade | 16,695 (67.9%) | 7,876 (32.1%) |
| Retail Trade | 57,773 (53.3%) | 50,563 (46.7%) |
| Transportation & Warehousing | 48,776 (71.3%) | 19,639 (28.7%) |
| Utilities | 5,330 (74.6%) | 1,811 (25.4%) |
| Information | 8,290 (67.9%) | 3,925 (32.1%) |
| Finance & Insurance | 9,608 (38.2%) | 15,580 (61.9%) |
| Real Estate, Rental & Leasing | 7,204 (51.2%) | 6,852 (48.7%) |
| Professional & Scientific | 22,845 (56.5%) | 17,583 (43.5%) |
| Enterprise Management | 347 (57.0%) | 262 (43.0%) |
| Administrative & Support | 27,788 (65.4%) | 14,725 (34.6%) |
| Educational Services | 21,897 (31.2%) | 48,177 (68.8%) |
| Health Care & Social Assistance | 24,421 (23.7%) | 78,475 (76.3%) |
| Arts, Entertainment & Recreation | 11,229 (54.5%) | 9,385 (45.5%) |
| Accommodation & Food Services | 29,747 (46.3%) | 34,555 (53.7%) |
| Public Administration | 23,428 (54.8%) | 19,336 (45.2%) |
| Total | 472,626 (55.5%) | 378,181 (44.5%) |
Education in Area Code 951
School Enrollment in Area Code 951
The most common levels of schooling among the 540,976 students in Area Code 951 are college / undergraduate (127,965 | 23.6%), high school (124,779 | 23.1%), and middle school (113,303 | 20.9%).
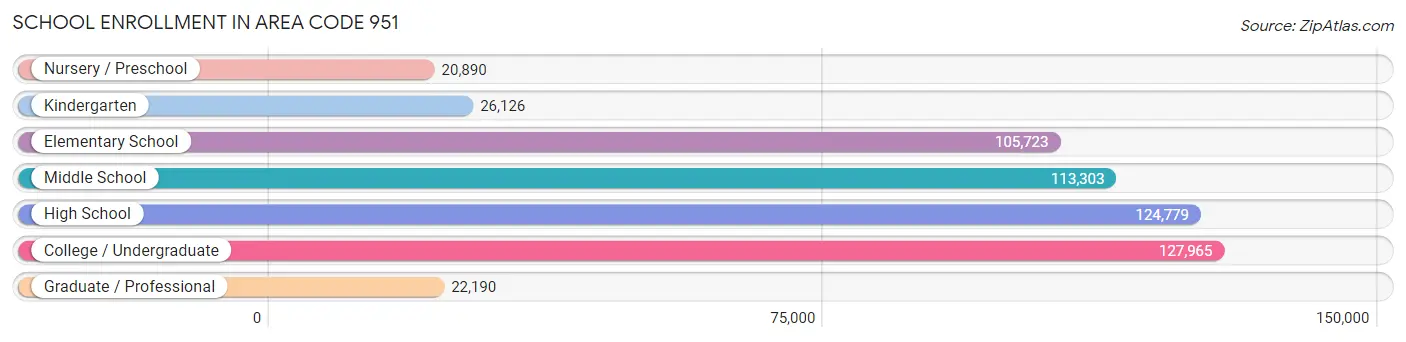
| School Level | # Students | % Students |
| Nursery / Preschool | 20,890 | 3.9% |
| Kindergarten | 26,126 | 4.8% |
| Elementary School | 105,723 | 19.5% |
| Middle School | 113,303 | 20.9% |
| High School | 124,779 | 23.1% |
| College / Undergraduate | 127,965 | 23.6% |
| Graduate / Professional | 22,190 | 4.1% |
| Total | 540,976 | 100.0% |
School Enrollment by Age by Funding Source in Area Code 951
Out of a total of 540,976 students who are enrolled in schools in Area Code 951, 62,387 (11.5%) attend a private institution, while the remaining 478,589 (88.5%) are enrolled in public schools. The age group of 3 to 4 year olds has the highest likelihood of being enrolled in private schools, with 5,677 (36.8% in the age bracket) enrolled. Conversely, the age group of 15 to 17 year olds has the lowest likelihood of being enrolled in a private school, with 82,965 (95.1% in the age bracket) attending a public institution.
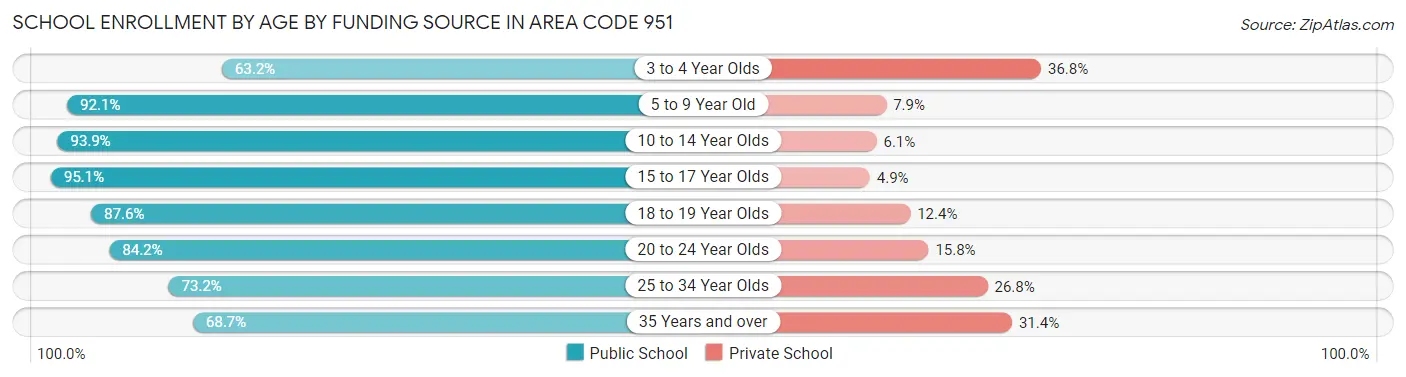
| Age Bracket | Public School | Private School |
| 3 to 4 Year Olds | 9,766 (63.2%) | 5,677 (36.8%) |
| 5 to 9 Year Old | 115,664 (92.1%) | 9,945 (7.9%) |
| 10 to 14 Year Olds | 136,912 (93.9%) | 8,933 (6.1%) |
| 15 to 17 Year Olds | 82,965 (95.1%) | 4,254 (4.9%) |
| 18 to 19 Year Olds | 35,875 (87.6%) | 5,076 (12.4%) |
| 20 to 24 Year Olds | 49,573 (84.2%) | 9,293 (15.8%) |
| 25 to 34 Year Olds | 29,142 (73.2%) | 10,671 (26.8%) |
| 35 Years and over | 18,693 (68.6%) | 8,537 (31.4%) |
| Total | 478,589 (88.5%) | 62,387 (11.5%) |
Educational Attainment by Field of Study in Area Code 951
Business (57,269 | 20.7%), science & technology (28,387 | 10.3%), social sciences (24,288 | 8.8%), arts & humanities (22,613 | 8.2%), and education (22,095 | 8.0%) are the most common fields of study among 276,203 individuals in Area Code 951 who have obtained a bachelor's degree or higher.
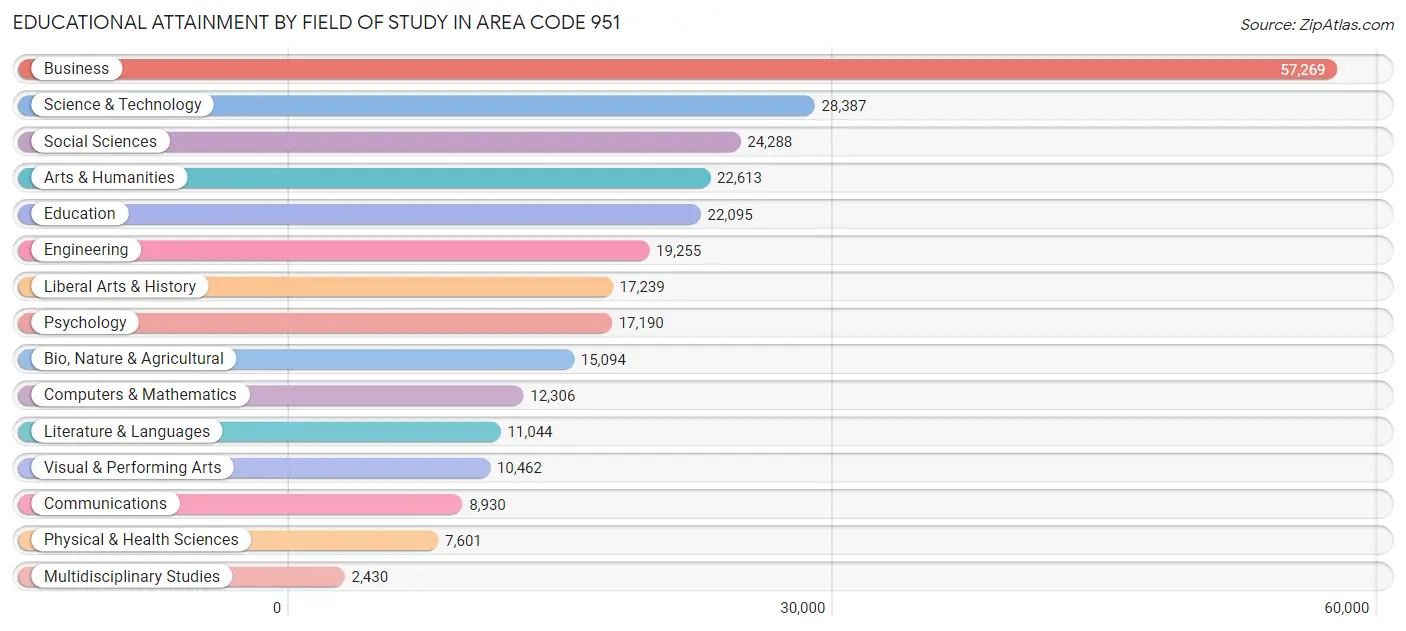
| Field of Study | # Graduates | % Graduates |
| Computers & Mathematics | 12,306 | 4.5% |
| Bio, Nature & Agricultural | 15,094 | 5.5% |
| Physical & Health Sciences | 7,601 | 2.8% |
| Psychology | 17,190 | 6.2% |
| Social Sciences | 24,288 | 8.8% |
| Engineering | 19,255 | 7.0% |
| Multidisciplinary Studies | 2,430 | 0.9% |
| Science & Technology | 28,387 | 10.3% |
| Business | 57,269 | 20.7% |
| Education | 22,095 | 8.0% |
| Literature & Languages | 11,044 | 4.0% |
| Liberal Arts & History | 17,239 | 6.2% |
| Visual & Performing Arts | 10,462 | 3.8% |
| Communications | 8,930 | 3.2% |
| Arts & Humanities | 22,613 | 8.2% |
| Total | 276,203 | 100.0% |
Transportation & Commute in Area Code 951
Vehicle Availability by Sex in Area Code 951
The most prevalent vehicle ownership categories in Area Code 951 are males with 2 vehicles (153,761, accounting for 33.2%) and females with 2 vehicles (118,383, making up 42.5%).
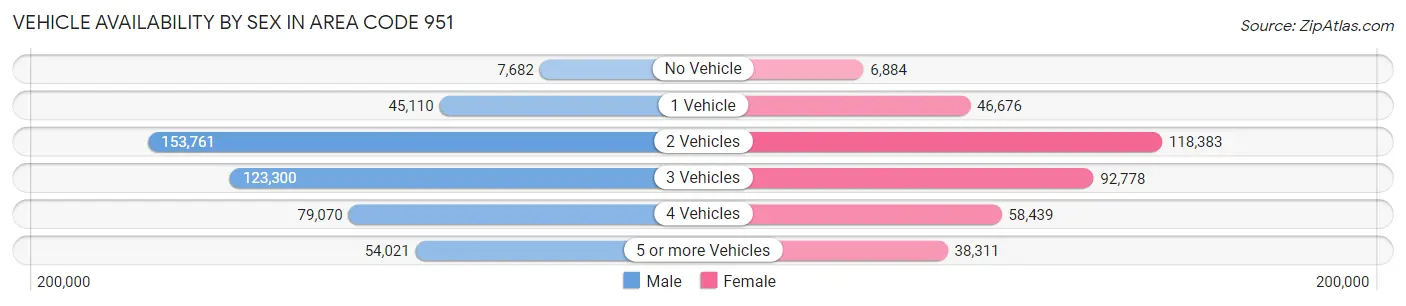
| Vehicles Available | Male | Female |
| No Vehicle | 7,682 (1.7%) | 6,884 (1.9%) |
| 1 Vehicle | 45,110 (9.7%) | 46,676 (12.9%) |
| 2 Vehicles | 153,761 (33.2%) | 118,383 (32.8%) |
| 3 Vehicles | 123,300 (26.6%) | 92,778 (25.7%) |
| 4 Vehicles | 79,070 (17.1%) | 58,439 (16.2%) |
| 5 or more Vehicles | 54,021 (11.7%) | 38,311 (10.6%) |
| Total | 462,944 (100.0%) | 361,471 (100.0%) |
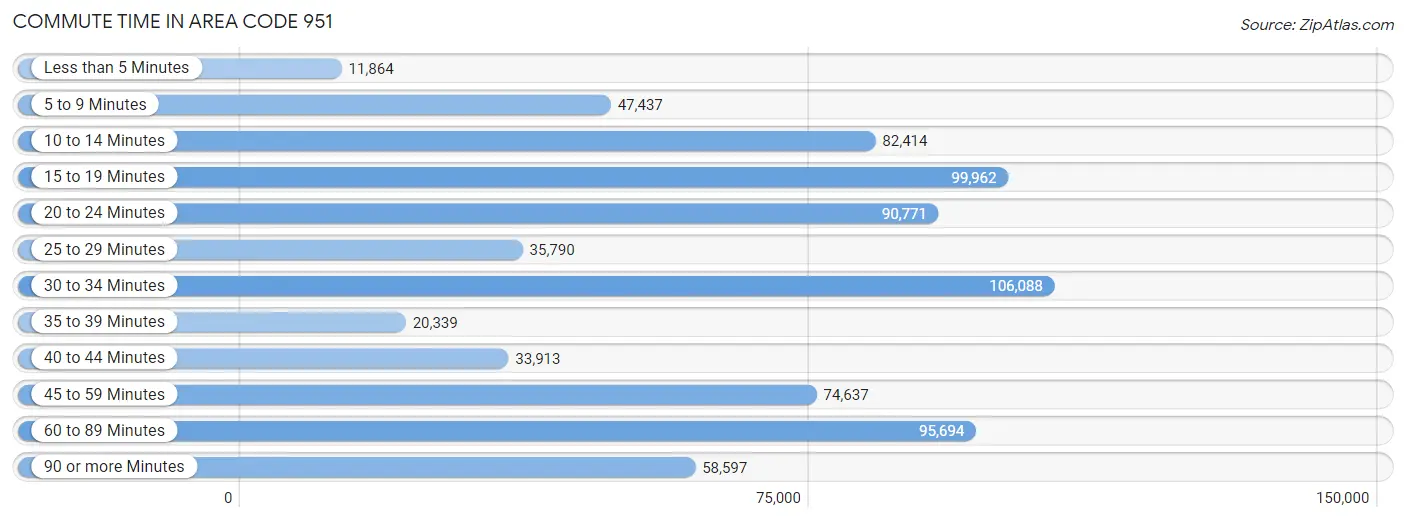
Commute Time in Area Code 951
The most frequently occuring commute durations in Area Code 951 are 30 to 34 minutes (106,088 commuters, 14.0%), 15 to 19 minutes (99,962 commuters, 13.2%), and 60 to 89 minutes (95,694 commuters, 12.6%).
| Commute Time | # Commuters | % Commuters |
| Less than 5 Minutes | 11,864 | 1.6% |
| 5 to 9 Minutes | 47,437 | 6.3% |
| 10 to 14 Minutes | 82,414 | 10.9% |
| 15 to 19 Minutes | 99,962 | 13.2% |
| 20 to 24 Minutes | 90,771 | 12.0% |
| 25 to 29 Minutes | 35,790 | 4.7% |
| 30 to 34 Minutes | 106,088 | 14.0% |
| 35 to 39 Minutes | 20,339 | 2.7% |
| 40 to 44 Minutes | 33,913 | 4.5% |
| 45 to 59 Minutes | 74,637 | 9.9% |
| 60 to 89 Minutes | 95,694 | 12.6% |
| 90 or more Minutes | 58,597 | 7.7% |
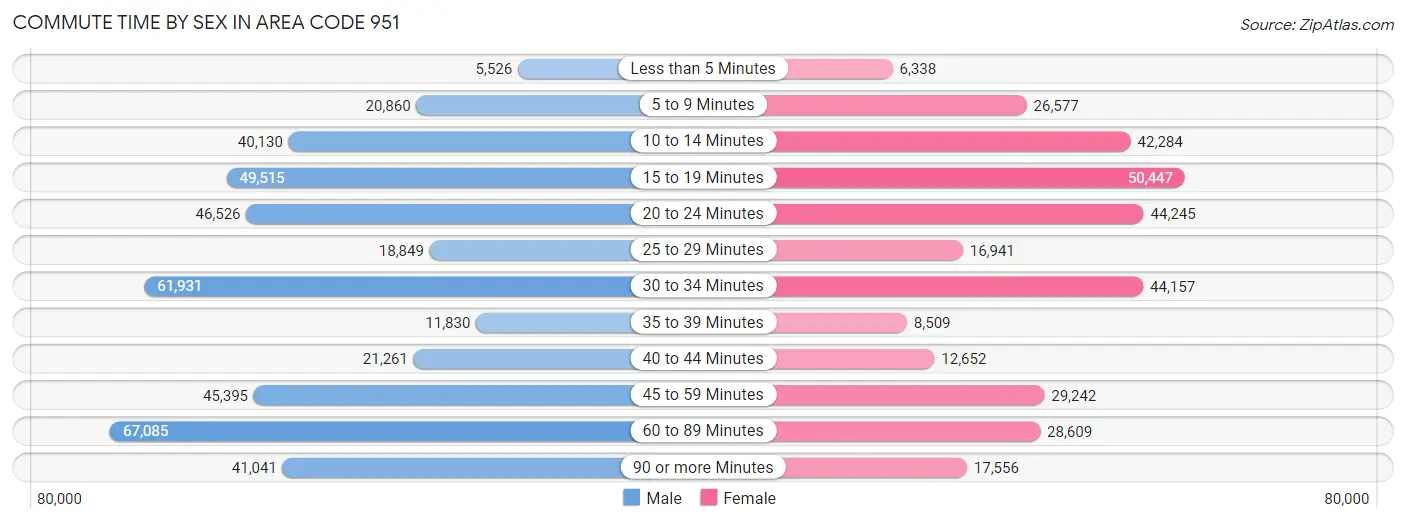
Commute Time by Sex in Area Code 951
The most common commute times in Area Code 951 are 60 to 89 minutes (67,085 commuters, 15.6%) for males and 15 to 19 minutes (50,447 commuters, 15.4%) for females.
| Commute Time | Male | Female |
| Less than 5 Minutes | 5,526 (1.3%) | 6,338 (1.9%) |
| 5 to 9 Minutes | 20,860 (4.9%) | 26,577 (8.1%) |
| 10 to 14 Minutes | 40,130 (9.3%) | 42,284 (12.9%) |
| 15 to 19 Minutes | 49,515 (11.5%) | 50,447 (15.4%) |
| 20 to 24 Minutes | 46,526 (10.8%) | 44,245 (13.5%) |
| 25 to 29 Minutes | 18,849 (4.4%) | 16,941 (5.2%) |
| 30 to 34 Minutes | 61,931 (14.4%) | 44,157 (13.5%) |
| 35 to 39 Minutes | 11,830 (2.8%) | 8,509 (2.6%) |
| 40 to 44 Minutes | 21,261 (5.0%) | 12,652 (3.9%) |
| 45 to 59 Minutes | 45,395 (10.6%) | 29,242 (8.9%) |
| 60 to 89 Minutes | 67,085 (15.6%) | 28,609 (8.7%) |
| 90 or more Minutes | 41,041 (9.6%) | 17,556 (5.4%) |
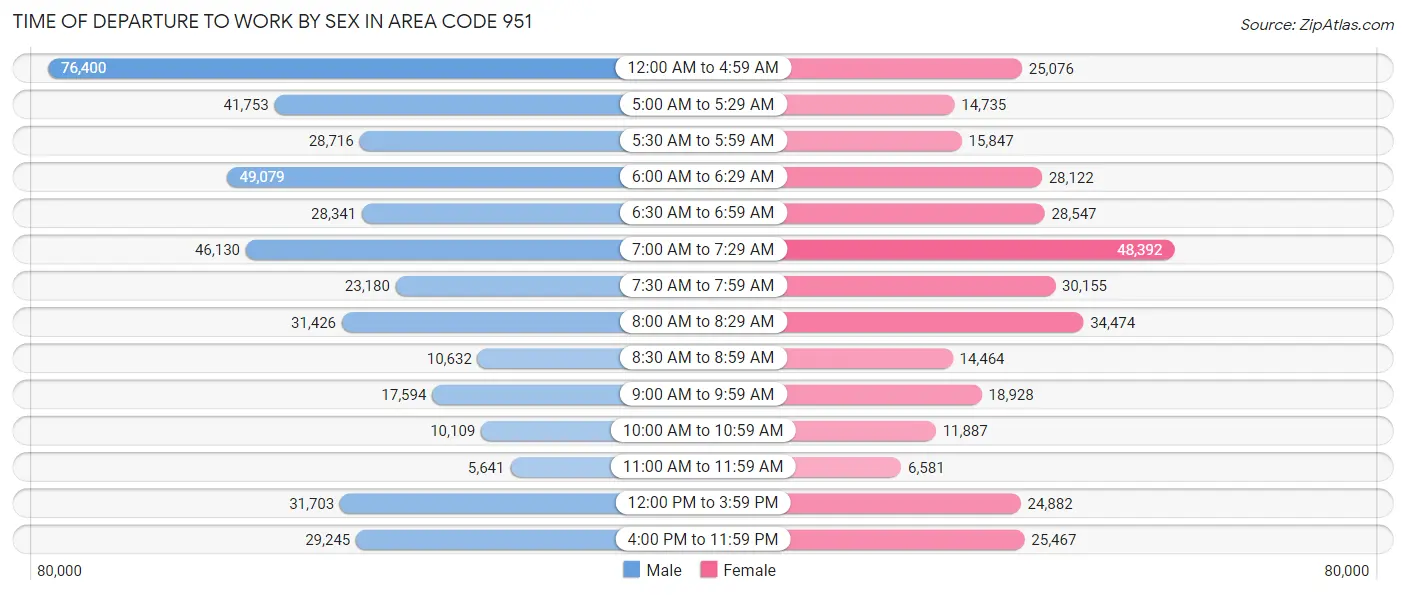
Time of Departure to Work by Sex in Area Code 951
The most frequent times of departure to work in Area Code 951 are 12:00 AM to 4:59 AM (76,400, 17.8%) for males and 7:00 AM to 7:29 AM (48,392, 14.8%) for females.
| Time of Departure | Male | Female |
| 12:00 AM to 4:59 AM | 76,400 (17.8%) | 25,076 (7.7%) |
| 5:00 AM to 5:29 AM | 41,753 (9.7%) | 14,735 (4.5%) |
| 5:30 AM to 5:59 AM | 28,716 (6.7%) | 15,847 (4.8%) |
| 6:00 AM to 6:29 AM | 49,079 (11.4%) | 28,122 (8.6%) |
| 6:30 AM to 6:59 AM | 28,341 (6.6%) | 28,547 (8.7%) |
| 7:00 AM to 7:29 AM | 46,130 (10.7%) | 48,392 (14.8%) |
| 7:30 AM to 7:59 AM | 23,180 (5.4%) | 30,155 (9.2%) |
| 8:00 AM to 8:29 AM | 31,426 (7.3%) | 34,474 (10.5%) |
| 8:30 AM to 8:59 AM | 10,632 (2.5%) | 14,464 (4.4%) |
| 9:00 AM to 9:59 AM | 17,594 (4.1%) | 18,928 (5.8%) |
| 10:00 AM to 10:59 AM | 10,109 (2.4%) | 11,887 (3.6%) |
| 11:00 AM to 11:59 AM | 5,641 (1.3%) | 6,581 (2.0%) |
| 12:00 PM to 3:59 PM | 31,703 (7.4%) | 24,882 (7.6%) |
| 4:00 PM to 11:59 PM | 29,245 (6.8%) | 25,467 (7.8%) |
| Total | 429,949 (100.0%) | 327,557 (100.0%) |
Housing Occupancy in Area Code 951
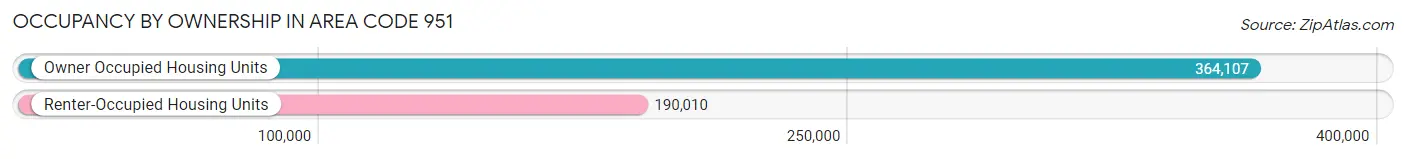
Occupancy by Ownership in Area Code 951
Of the total 554,117 dwellings in Area Code 951, owner-occupied units account for 364,107 (65.7%), while renter-occupied units make up 190,010 (34.3%).
| Occupancy | # Housing Units | % Housing Units |
| Owner Occupied Housing Units | 364,107 | 65.7% |
| Renter-Occupied Housing Units | 190,010 | 34.3% |
| Total Occupied Housing Units | 554,117 | 100.0% |
Occupancy by Household Size in Area Code 951
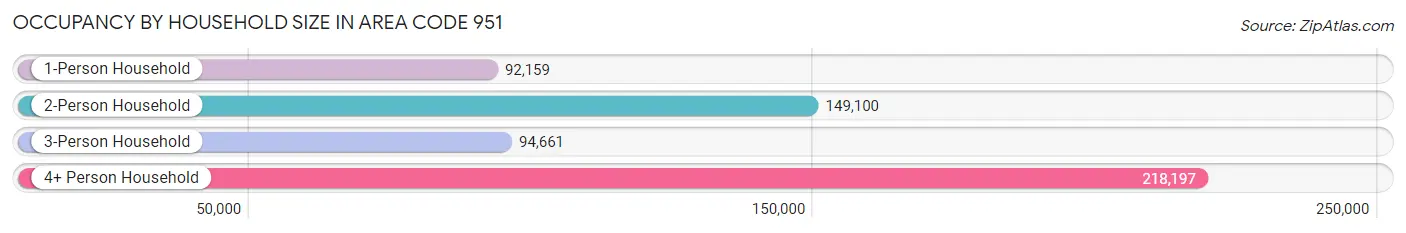
| Household Size | # Housing Units | % Housing Units |
| 1-Person Household | 92,159 | 16.6% |
| 2-Person Household | 149,100 | 26.9% |
| 3-Person Household | 94,661 | 17.1% |
| 4+ Person Household | 218,197 | 39.4% |
| Total Housing Units | 554,117 | 100.0% |
Occupancy by Ownership by Household Size in Area Code 951
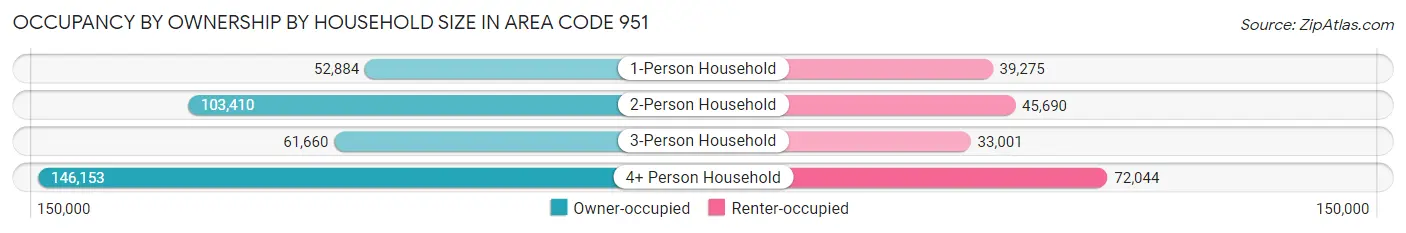
| Household Size | Owner-occupied | Renter-occupied |
| 1-Person Household | 52,884 (57.4%) | 39,275 (42.6%) |
| 2-Person Household | 103,410 (69.4%) | 45,690 (30.6%) |
| 3-Person Household | 61,660 (65.1%) | 33,001 (34.9%) |
| 4+ Person Household | 146,153 (67.0%) | 72,044 (33.0%) |
| Total Housing Units | 364,107 (65.7%) | 190,010 (34.3%) |
Occupancy by Educational Attainment in Area Code 951
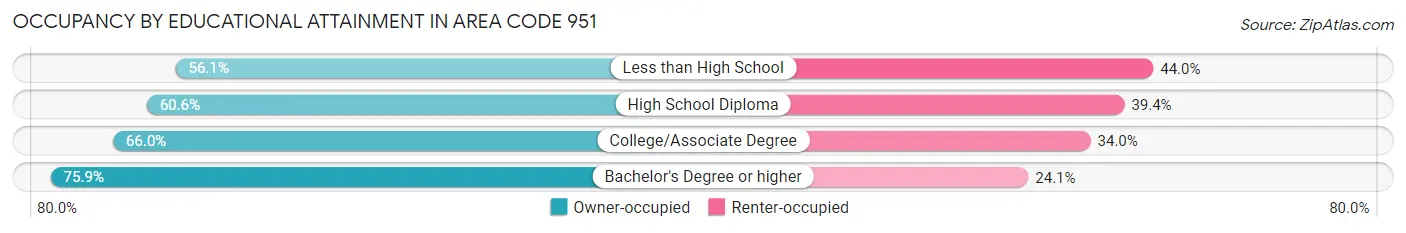
| Household Size | Owner-occupied | Renter-occupied |
| Less than High School | 47,219 (56.0%) | 37,022 (44.0%) |
| High School Diploma | 78,519 (60.6%) | 51,000 (39.4%) |
| College/Associate Degree | 132,560 (66.0%) | 68,326 (34.0%) |
| Bachelor's Degree or higher | 105,809 (75.9%) | 33,662 (24.1%) |
Occupancy by Age of Householder in Area Code 951
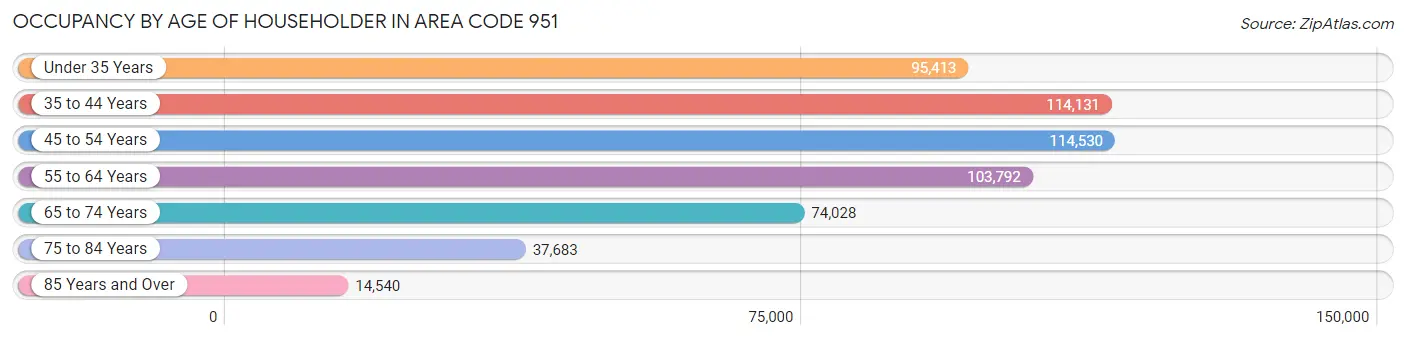
| Age Bracket | # Households | % Households |
| Under 35 Years | 95,413 | 17.2% |
| 35 to 44 Years | 114,131 | 20.6% |
| 45 to 54 Years | 114,530 | 20.7% |
| 55 to 64 Years | 103,792 | 18.7% |
| 65 to 74 Years | 74,028 | 13.4% |
| 75 to 84 Years | 37,683 | 6.8% |
| 85 Years and Over | 14,540 | 2.6% |
| Total | 554,117 | 100.0% |
Housing Finances in Area Code 951
Median Income by Occupancy in Area Code 951
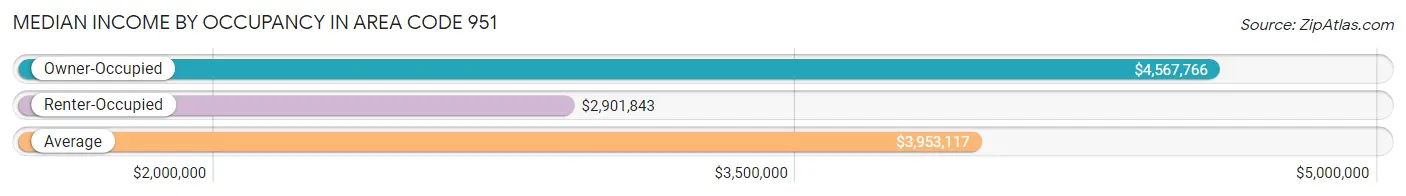
| Occupancy Type | # Households | Median Income |
| Owner-Occupied | 364,107 (65.7%) | $4,567,766 |
| Renter-Occupied | 190,010 (34.3%) | $2,901,843 |
| Average | 554,117 (100.0%) | $3,953,117 |
Occupancy by Householder Income Bracket in Area Code 951
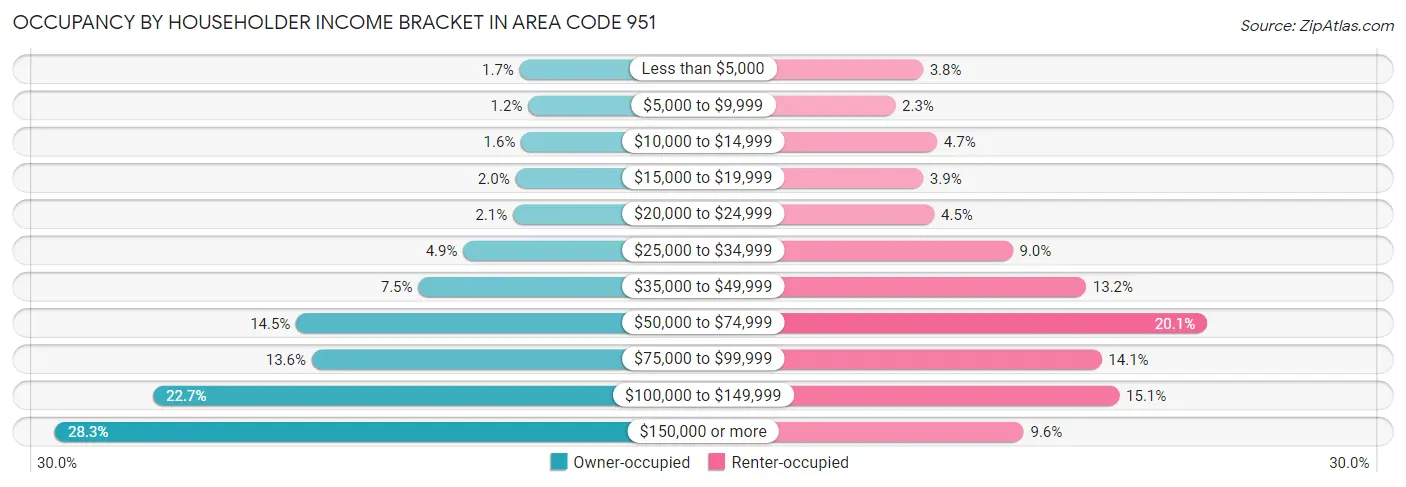
| Income Bracket | Owner-occupied | Renter-occupied |
| Less than $5,000 | 6,239 (1.7%) | 7,295 (3.8%) |
| $5,000 to $9,999 | 4,424 (1.2%) | 4,298 (2.3%) |
| $10,000 to $14,999 | 5,903 (1.6%) | 8,836 (4.6%) |
| $15,000 to $19,999 | 7,090 (1.9%) | 7,316 (3.8%) |
| $20,000 to $24,999 | 7,627 (2.1%) | 8,522 (4.5%) |
| $25,000 to $34,999 | 17,933 (4.9%) | 17,036 (9.0%) |
| $35,000 to $49,999 | 27,301 (7.5%) | 25,000 (13.2%) |
| $50,000 to $74,999 | 52,726 (14.5%) | 38,149 (20.1%) |
| $75,000 to $99,999 | 49,465 (13.6%) | 26,704 (14.1%) |
| $100,000 to $149,999 | 82,489 (22.7%) | 28,619 (15.1%) |
| $150,000 or more | 102,910 (28.3%) | 18,235 (9.6%) |
| Total | 364,107 (100.0%) | 190,010 (100.0%) |
Monthly Housing Cost Tiers in Area Code 951
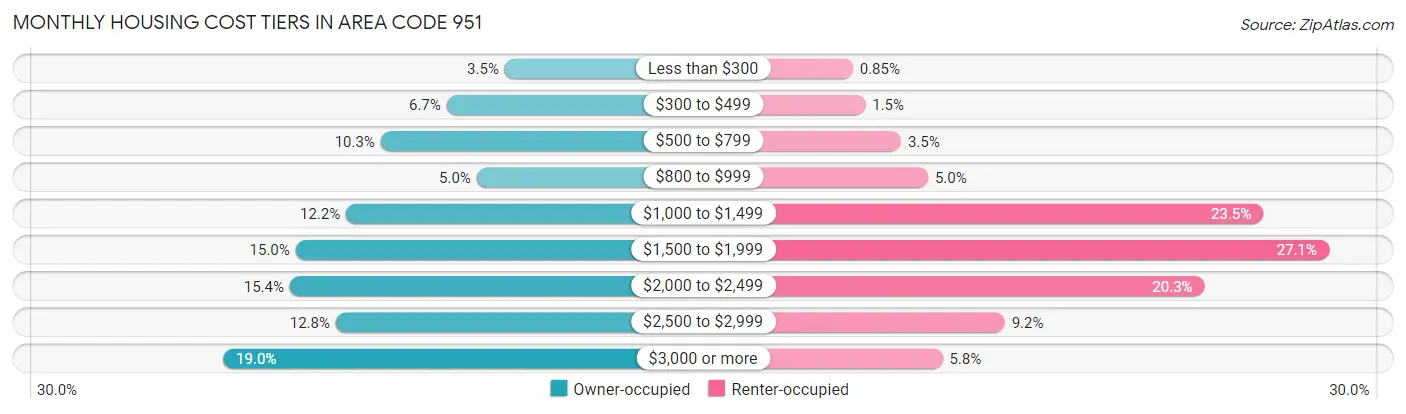
| Monthly Cost | Owner-occupied | Renter-occupied |
| Less than $300 | 12,672 (3.5%) | 1,615 (0.9%) |
| $300 to $499 | 24,363 (6.7%) | 2,931 (1.5%) |
| $500 to $799 | 37,618 (10.3%) | 6,660 (3.5%) |
| $800 to $999 | 18,331 (5.0%) | 9,493 (5.0%) |
| $1,000 to $1,499 | 44,570 (12.2%) | 44,677 (23.5%) |
| $1,500 to $1,999 | 54,742 (15.0%) | 51,578 (27.1%) |
| $2,000 to $2,499 | 55,899 (15.3%) | 38,519 (20.3%) |
| $2,500 to $2,999 | 46,624 (12.8%) | 17,563 (9.2%) |
| $3,000 or more | 69,288 (19.0%) | 11,014 (5.8%) |
| Total | 364,107 (100.0%) | 190,010 (100.0%) |
Physical Housing Characteristics in Area Code 951
Housing Structures in Area Code 951
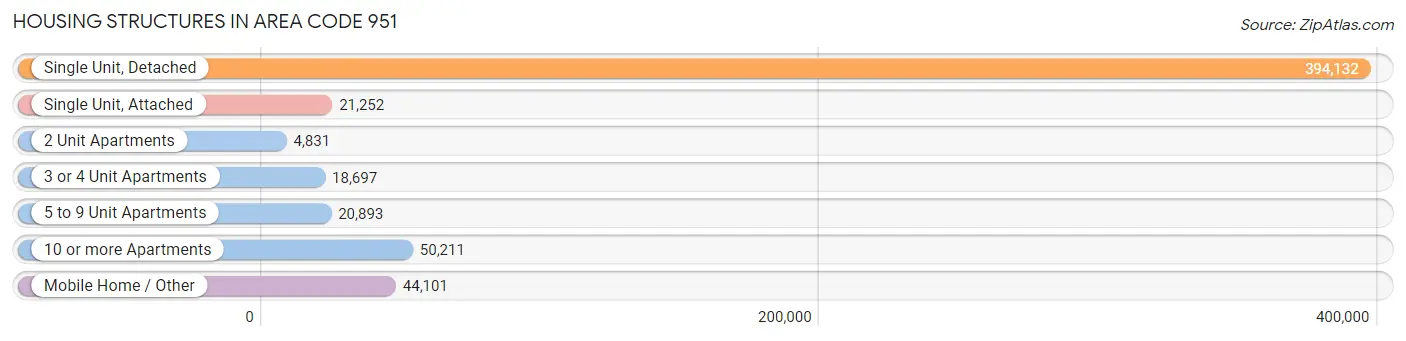
| Structure Type | # Housing Units | % Housing Units |
| Single Unit, Detached | 394,132 | 71.1% |
| Single Unit, Attached | 21,252 | 3.8% |
| 2 Unit Apartments | 4,831 | 0.9% |
| 3 or 4 Unit Apartments | 18,697 | 3.4% |
| 5 to 9 Unit Apartments | 20,893 | 3.8% |
| 10 or more Apartments | 50,211 | 9.1% |
| Mobile Home / Other | 44,101 | 8.0% |
| Total | 554,117 | 100.0% |
Housing Structures by Occupancy in Area Code 951
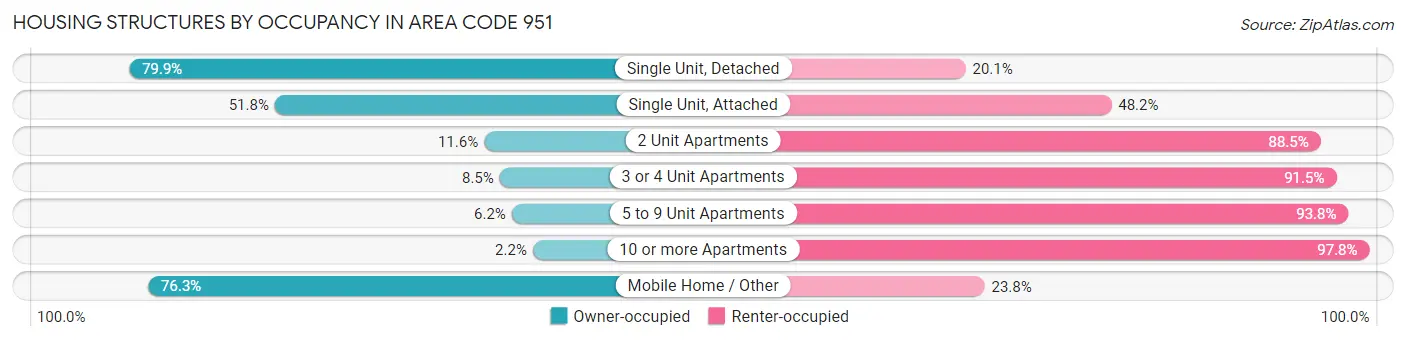
| Structure Type | Owner-occupied | Renter-occupied |
| Single Unit, Detached | 314,919 (79.9%) | 79,213 (20.1%) |
| Single Unit, Attached | 11,018 (51.8%) | 10,234 (48.2%) |
| 2 Unit Apartments | 558 (11.6%) | 4,273 (88.4%) |
| 3 or 4 Unit Apartments | 1,597 (8.5%) | 17,100 (91.5%) |
| 5 to 9 Unit Apartments | 1,299 (6.2%) | 19,594 (93.8%) |
| 10 or more Apartments | 1,087 (2.2%) | 49,124 (97.8%) |
| Mobile Home / Other | 33,629 (76.2%) | 10,472 (23.7%) |
| Total | 364,107 (65.7%) | 190,010 (34.3%) |
Housing Structures by Number of Rooms in Area Code 951
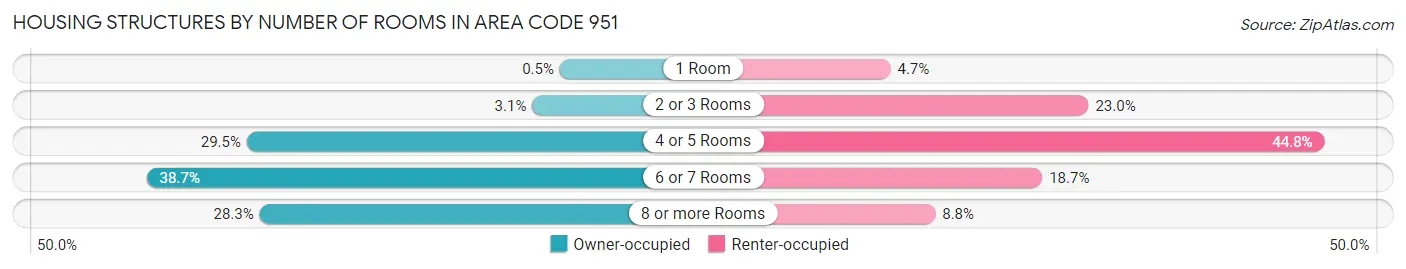
| Number of Rooms | Owner-occupied | Renter-occupied |
| 1 Room | 1,821 (0.5%) | 8,885 (4.7%) |
| 2 or 3 Rooms | 11,121 (3.0%) | 43,677 (23.0%) |
| 4 or 5 Rooms | 107,238 (29.4%) | 85,142 (44.8%) |
| 6 or 7 Rooms | 140,981 (38.7%) | 35,542 (18.7%) |
| 8 or more Rooms | 102,946 (28.3%) | 16,764 (8.8%) |
| Total | 364,107 (100.0%) | 190,010 (100.0%) |
Housing Structure by Heating Type in Area Code 951
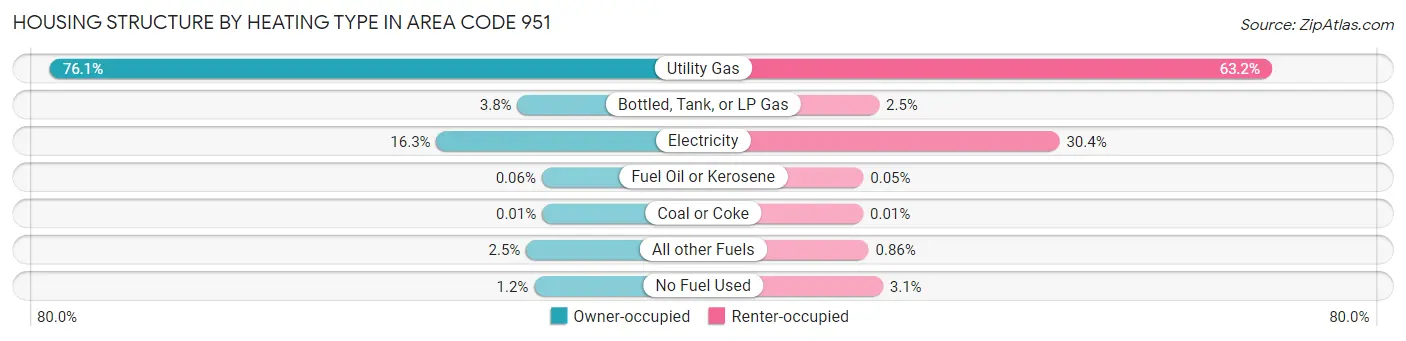
| Heating Type | Owner-occupied | Renter-occupied |
| Utility Gas | 277,100 (76.1%) | 120,048 (63.2%) |
| Bottled, Tank, or LP Gas | 13,890 (3.8%) | 4,711 (2.5%) |
| Electricity | 59,482 (16.3%) | 57,699 (30.4%) |
| Fuel Oil or Kerosene | 211 (0.1%) | 90 (0.1%) |
| Coal or Coke | 23 (0.0%) | 28 (0.0%) |
| All other Fuels | 8,945 (2.5%) | 1,626 (0.9%) |
| No Fuel Used | 4,456 (1.2%) | 5,808 (3.1%) |
| Total | 364,107 (100.0%) | 190,010 (100.0%) |
Household Vehicle Usage in Area Code 951
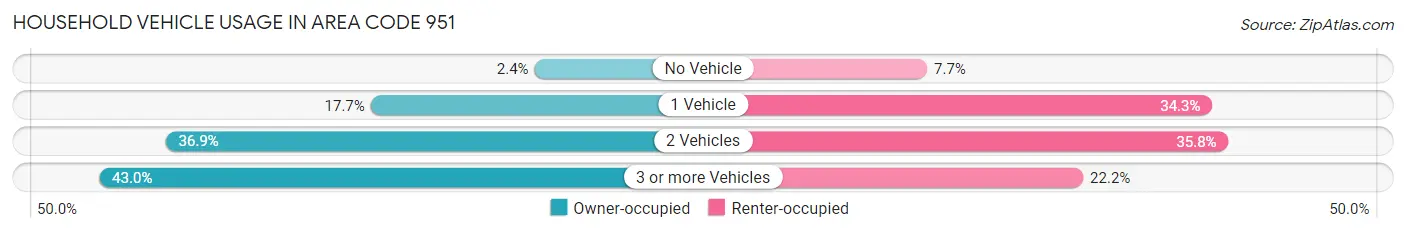
| Vehicles per Household | Owner-occupied | Renter-occupied |
| No Vehicle | 8,793 (2.4%) | 14,583 (7.7%) |
| 1 Vehicle | 64,447 (17.7%) | 65,155 (34.3%) |
| 2 Vehicles | 134,161 (36.8%) | 68,016 (35.8%) |
| 3 or more Vehicles | 156,706 (43.0%) | 42,256 (22.2%) |
| Total | 364,107 (100.0%) | 190,010 (100.0%) |
Real Estate & Mortgages in Area Code 951
Real Estate and Mortgage Overview in Area Code 951
| Characteristic | Without Mortgage | With Mortgage |
| Housing Units | 99,781 | 264,326 |
| Median Property Value | $19,059,699 | $21,877,600 |
| Median Household Income | $3,337,950 | $86,713 |
| Monthly Housing Costs | $29,835 | $68,779 |
| Real Estate Taxes | $129,468 | $5,100 |
Property Value by Mortgage Status in Area Code 951
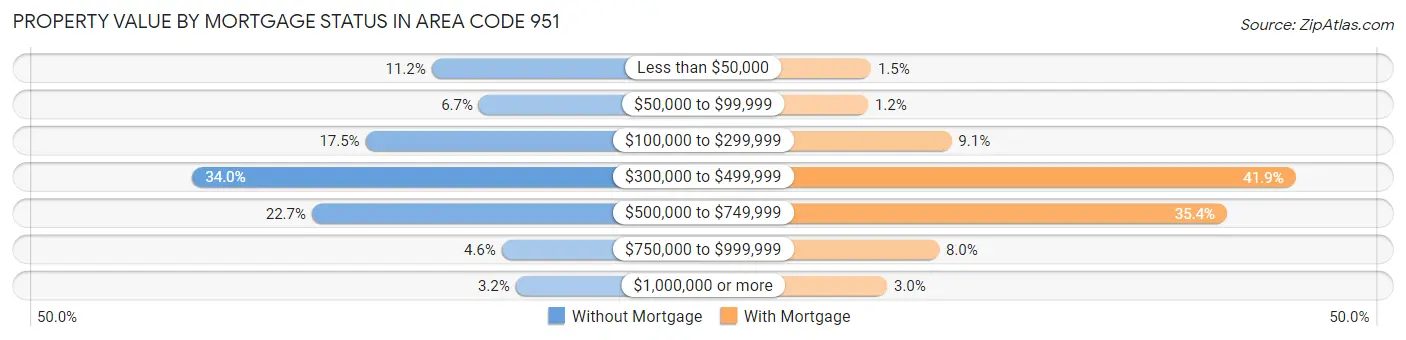
| Property Value | Without Mortgage | With Mortgage |
| Less than $50,000 | 11,212 (11.2%) | 3,898 (1.5%) |
| $50,000 to $99,999 | 6,726 (6.7%) | 3,110 (1.2%) |
| $100,000 to $299,999 | 17,503 (17.5%) | 24,123 (9.1%) |
| $300,000 to $499,999 | 33,946 (34.0%) | 110,763 (41.9%) |
| $500,000 to $749,999 | 22,604 (22.7%) | 93,483 (35.4%) |
| $750,000 to $999,999 | 4,557 (4.6%) | 21,013 (8.0%) |
| $1,000,000 or more | 3,233 (3.2%) | 7,936 (3.0%) |
| Total | 99,781 (100.0%) | 264,326 (100.0%) |
Household Income by Mortgage Status in Area Code 951
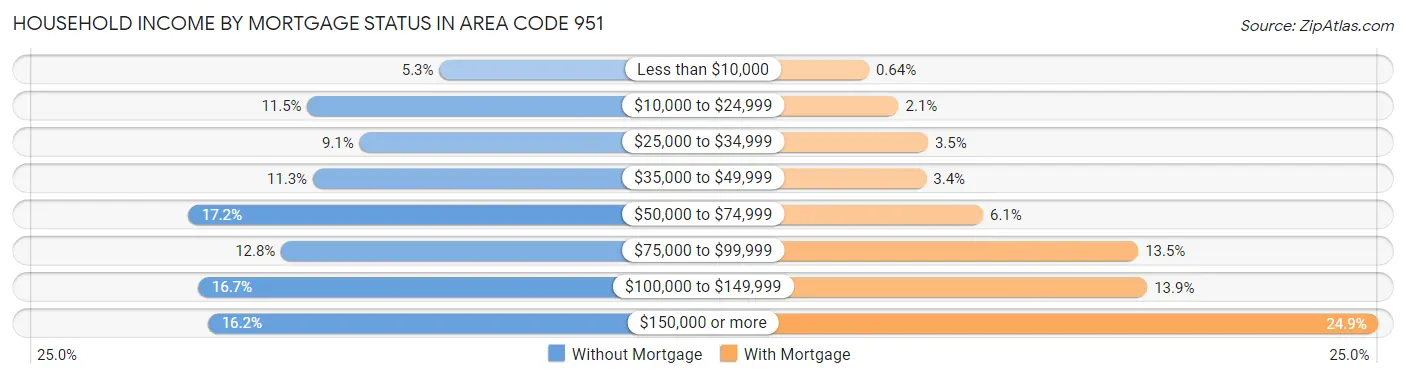
| Household Income | Without Mortgage | With Mortgage |
| Less than $10,000 | 5,243 (5.2%) | 1,682 (0.6%) |
| $10,000 to $24,999 | 11,506 (11.5%) | 5,420 (2.1%) |
| $25,000 to $34,999 | 9,032 (9.0%) | 9,114 (3.5%) |
| $35,000 to $49,999 | 11,248 (11.3%) | 8,901 (3.4%) |
| $50,000 to $74,999 | 17,142 (17.2%) | 16,053 (6.1%) |
| $75,000 to $99,999 | 12,752 (12.8%) | 35,584 (13.5%) |
| $100,000 to $149,999 | 16,661 (16.7%) | 36,713 (13.9%) |
| $150,000 or more | 16,197 (16.2%) | 65,828 (24.9%) |
| Total | 99,781 (100.0%) | 264,326 (100.0%) |
Property Value to Household Income Ratio in Area Code 951
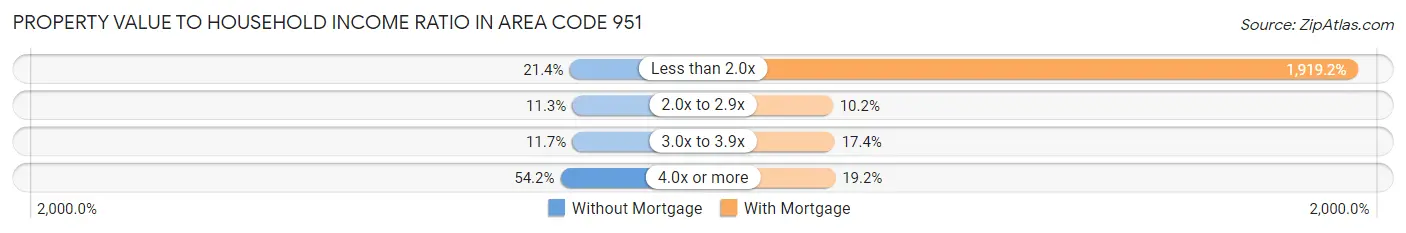
| Value-to-Income Ratio | Without Mortgage | With Mortgage |
| Less than 2.0x | 21,331 (21.4%) | 5,072,982 (1,919.2%) |
| 2.0x to 2.9x | 11,262 (11.3%) | 26,837 (10.2%) |
| 3.0x to 3.9x | 11,700 (11.7%) | 45,945 (17.4%) |
| 4.0x or more | 54,068 (54.2%) | 50,612 (19.2%) |
| Total | 99,781 (100.0%) | 264,326 (100.0%) |
Real Estate Taxes by Mortgage Status in Area Code 951
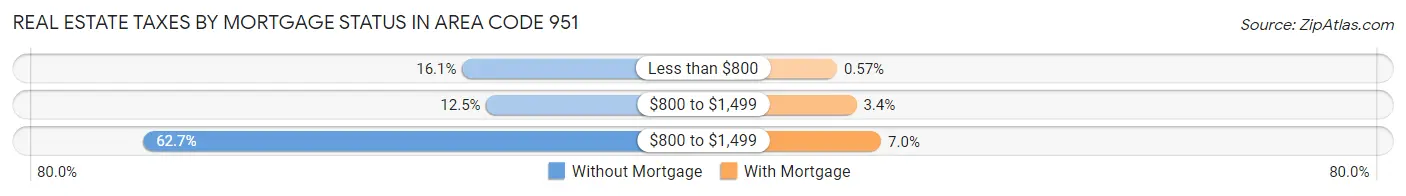
| Property Taxes | Without Mortgage | With Mortgage |
| Less than $800 | 16,017 (16.1%) | 1,499 (0.6%) |
| $800 to $1,499 | 12,488 (12.5%) | 9,048 (3.4%) |
| $800 to $1,499 | 62,519 (62.7%) | 18,576 (7.0%) |
| Total | 99,781 (100.0%) | 264,326 (100.0%) |
Health & Disability in Area Code 951
Health Insurance Coverage by Age in Area Code 951
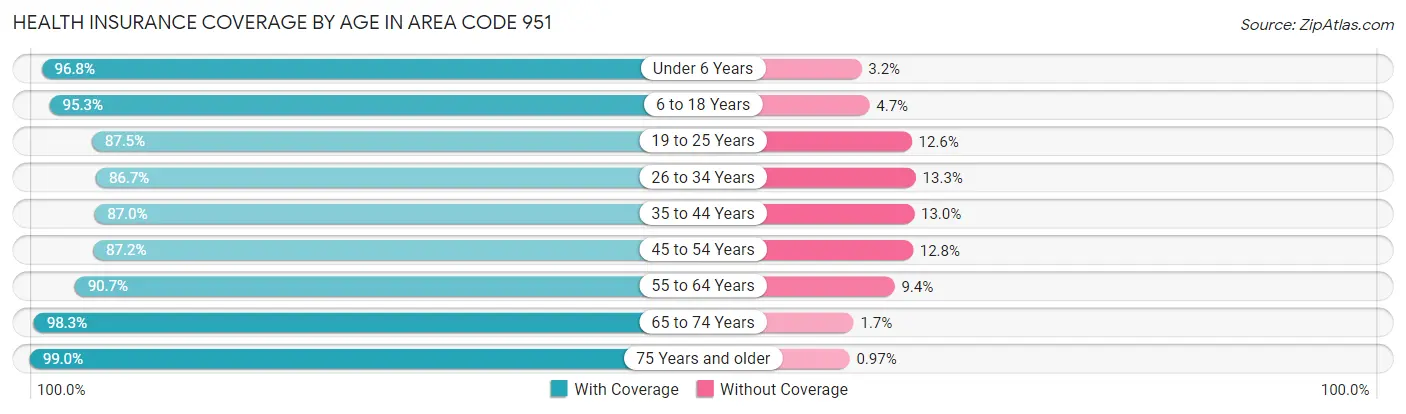
| Age Bracket | With Coverage | Without Coverage |
| Under 6 Years | 141,246 (96.8%) | 4,633 (3.2%) |
| 6 to 18 Years | 360,309 (95.3%) | 17,633 (4.7%) |
| 19 to 25 Years | 174,507 (87.5%) | 25,044 (12.6%) |
| 26 to 34 Years | 215,135 (86.7%) | 33,024 (13.3%) |
| 35 to 44 Years | 218,483 (87.0%) | 32,647 (13.0%) |
| 45 to 54 Years | 202,212 (87.2%) | 29,596 (12.8%) |
| 55 to 64 Years | 188,195 (90.6%) | 19,418 (9.3%) |
| 65 to 74 Years | 136,920 (98.3%) | 2,402 (1.7%) |
| 75 Years and older | 93,276 (99.0%) | 915 (1.0%) |
| Total | 1,730,283 (91.3%) | 165,312 (8.7%) |
Health Insurance Coverage by Citizenship Status in Area Code 951
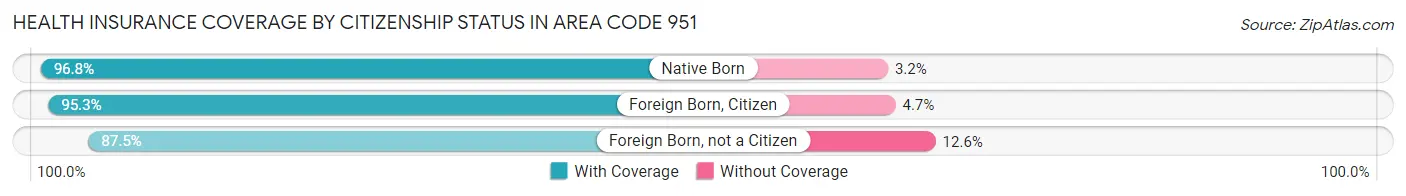
| Citizenship Status | With Coverage | Without Coverage |
| Native Born | 141,246 (96.8%) | 4,633 (3.2%) |
| Foreign Born, Citizen | 360,309 (95.3%) | 17,633 (4.7%) |
| Foreign Born, not a Citizen | 174,507 (87.5%) | 25,044 (12.6%) |
Health Insurance Coverage by Household Income in Area Code 951
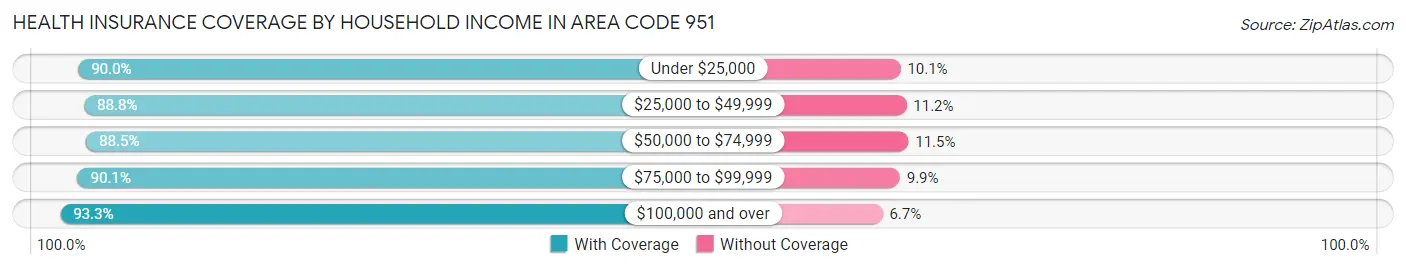
| Household Income | With Coverage | Without Coverage |
| Under $25,000 | 132,356 (89.9%) | 14,789 (10.1%) |
| $25,000 to $49,999 | 216,916 (88.8%) | 27,243 (11.2%) |
| $50,000 to $74,999 | 264,117 (88.5%) | 34,379 (11.5%) |
| $75,000 to $99,999 | 241,513 (90.1%) | 26,635 (9.9%) |
| $100,000 and over | 857,002 (93.3%) | 61,381 (6.7%) |
Public vs Private Health Insurance Coverage by Age in Area Code 951
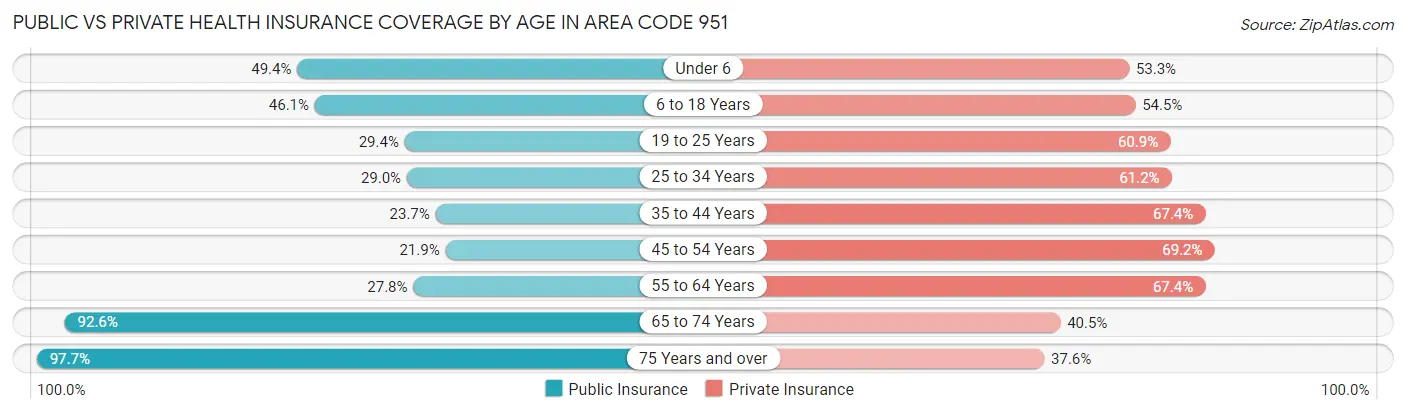
| Age Bracket | Public Insurance | Private Insurance |
| Under 6 | 72,042 (49.4%) | 77,749 (53.3%) |
| 6 to 18 Years | 174,316 (46.1%) | 205,812 (54.5%) |
| 19 to 25 Years | 58,749 (29.4%) | 121,588 (60.9%) |
| 25 to 34 Years | 72,050 (29.0%) | 151,816 (61.2%) |
| 35 to 44 Years | 59,547 (23.7%) | 169,325 (67.4%) |
| 45 to 54 Years | 50,723 (21.9%) | 160,301 (69.2%) |
| 55 to 64 Years | 57,795 (27.8%) | 139,954 (67.4%) |
| 65 to 74 Years | 128,975 (92.6%) | 56,483 (40.5%) |
| 75 Years and over | 92,058 (97.7%) | 35,371 (37.6%) |
| Total | 766,255 (40.4%) | 1,118,399 (59.0%) |
Disability Status by Sex by Age in Area Code 951
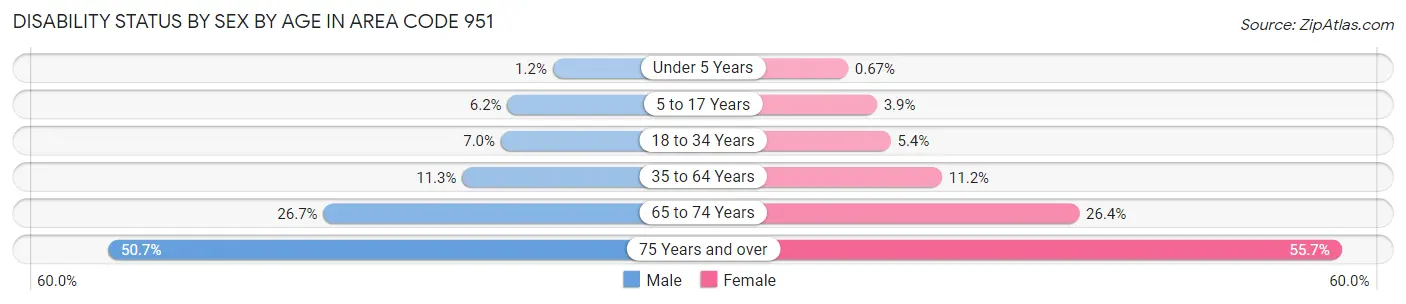
| Age Bracket | Male | Female |
| Under 5 Years | 721 (1.2%) | 391 (0.7%) |
| 5 to 17 Years | 11,770 (6.2%) | 7,104 (3.9%) |
| 18 to 34 Years | 17,008 (7.0%) | 12,790 (5.4%) |
| 35 to 64 Years | 38,622 (11.3%) | 38,742 (11.2%) |
| 65 to 74 Years | 17,386 (26.7%) | 19,622 (26.4%) |
| 75 Years and over | 19,785 (50.7%) | 30,708 (55.7%) |
Disability Class by Sex by Age in Area Code 951
Disability Class: Hearing Difficulty
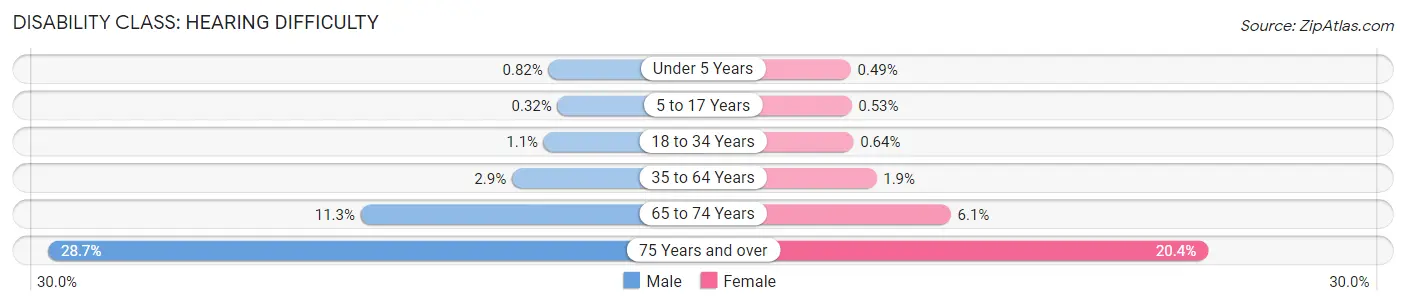
| Age Bracket | Male | Female |
| Under 5 Years | 504 (0.8%) | 288 (0.5%) |
| 5 to 17 Years | 597 (0.3%) | 964 (0.5%) |
| 18 to 34 Years | 2,638 (1.1%) | 1,496 (0.6%) |
| 35 to 64 Years | 9,815 (2.9%) | 6,653 (1.9%) |
| 65 to 74 Years | 7,339 (11.3%) | 4,500 (6.1%) |
| 75 Years and over | 11,198 (28.7%) | 11,251 (20.4%) |
Disability Class: Vision Difficulty
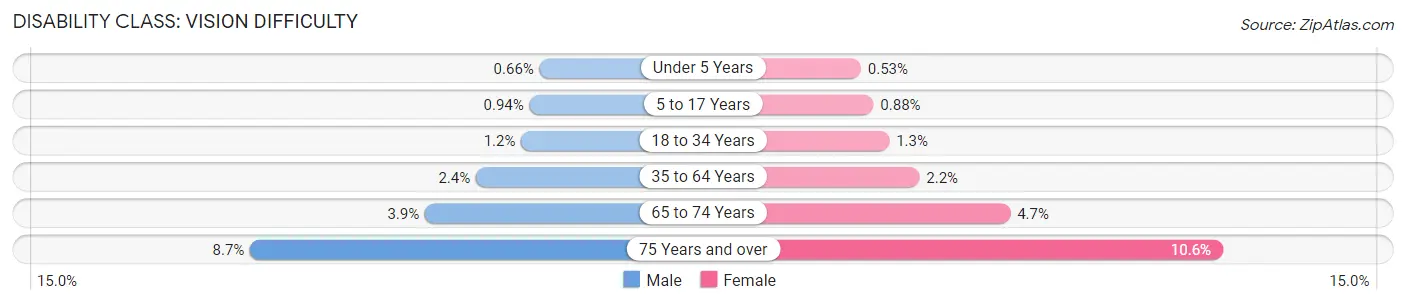
| Age Bracket | Male | Female |
| Under 5 Years | 405 (0.7%) | 308 (0.5%) |
| 5 to 17 Years | 1,784 (0.9%) | 1,605 (0.9%) |
| 18 to 34 Years | 2,850 (1.2%) | 3,116 (1.3%) |
| 35 to 64 Years | 8,356 (2.4%) | 7,515 (2.2%) |
| 65 to 74 Years | 2,502 (3.8%) | 3,482 (4.7%) |
| 75 Years and over | 3,402 (8.7%) | 5,854 (10.6%) |
Disability Class: Cognitive Difficulty
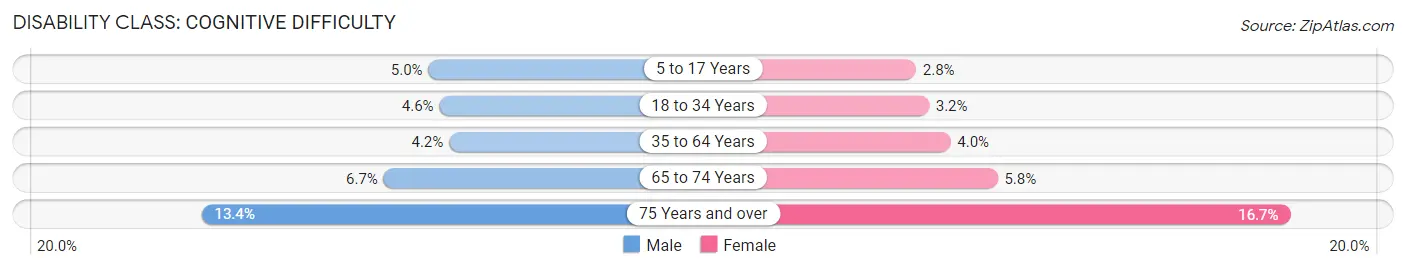
| Age Bracket | Male | Female |
| 5 to 17 Years | 9,479 (5.0%) | 5,037 (2.8%) |
| 18 to 34 Years | 11,235 (4.6%) | 7,603 (3.2%) |
| 35 to 64 Years | 14,546 (4.2%) | 13,982 (4.0%) |
| 65 to 74 Years | 4,342 (6.7%) | 4,294 (5.8%) |
| 75 Years and over | 5,241 (13.4%) | 9,185 (16.7%) |
Disability Class: Ambulatory Difficulty
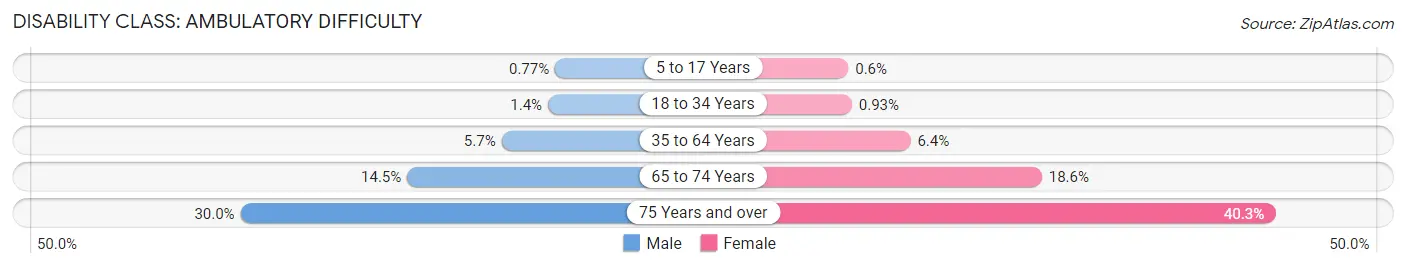
| Age Bracket | Male | Female |
| 5 to 17 Years | 1,461 (0.8%) | 1,088 (0.6%) |
| 18 to 34 Years | 3,497 (1.4%) | 2,199 (0.9%) |
| 35 to 64 Years | 19,692 (5.7%) | 22,109 (6.4%) |
| 65 to 74 Years | 9,437 (14.5%) | 13,784 (18.6%) |
| 75 Years and over | 11,694 (30.0%) | 22,231 (40.3%) |
Disability Class: Self-Care Difficulty
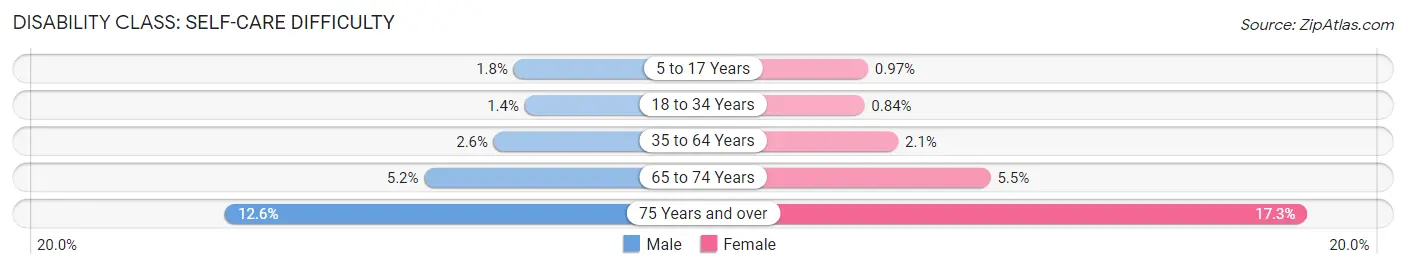
| Age Bracket | Male | Female |
| 5 to 17 Years | 3,475 (1.8%) | 1,775 (1.0%) |
| 18 to 34 Years | 3,497 (1.4%) | 1,985 (0.8%) |
| 35 to 64 Years | 8,858 (2.6%) | 7,270 (2.1%) |
| 65 to 74 Years | 3,357 (5.2%) | 4,095 (5.5%) |
| 75 Years and over | 4,901 (12.6%) | 9,534 (17.3%) |
Technology Access in Area Code 951
Computing Device Access in Area Code 951
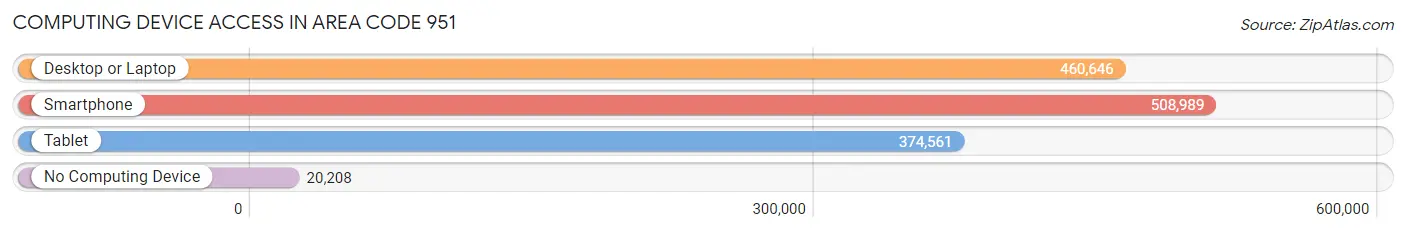
| Device Type | # Households | % Households |
| Desktop or Laptop | 460,646 | 83.1% |
| Smartphone | 508,989 | 91.9% |
| Tablet | 374,561 | 67.6% |
| No Computing Device | 20,208 | 3.6% |
| Total | 554,117 | 100.0% |
Internet Access in Area Code 951
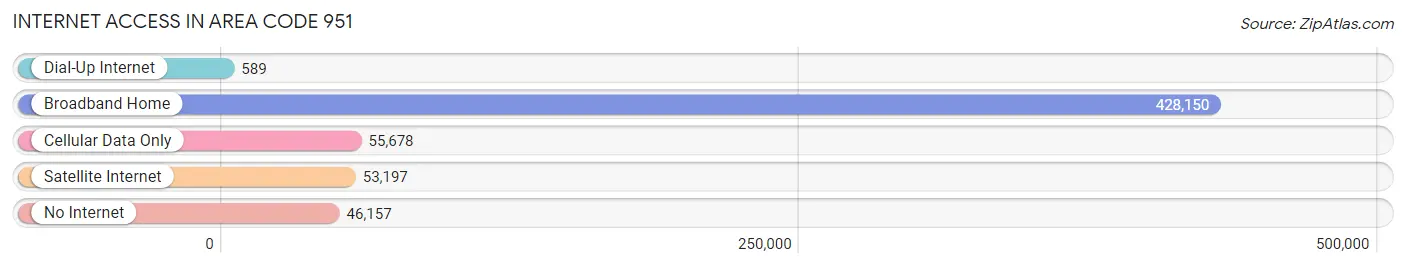
| Internet Type | # Households | % Households |
| Dial-Up Internet | 589 | 0.1% |
| Broadband Home | 428,150 | 77.3% |
| Cellular Data Only | 55,678 | 10.1% |
| Satellite Internet | 53,197 | 9.6% |
| No Internet | 46,157 | 8.3% |
| Total | 554,117 | 100.0% |
Area Code 951 Summary
Geography
Area code 951 is located in the Inland Empire region of Southern California. It covers the cities of Riverside, Moreno Valley, Temecula, Murrieta, and Corona. It also covers parts of San Bernardino and Orange counties.
Social
Area code 951 is home to a diverse population of people from all walks of life. The area is known for its vibrant culture, with a variety of restaurants, shops, and entertainment venues. It is also home to a number of universities and colleges, making it a great place for students to live and learn.
Economics
Area code 951 is a major economic hub in Southern California. It is home to a number of large companies, including Amazon, Walmart, and Target. The area is also home to a number of smaller businesses, such as restaurants, retail stores, and service providers.
Demographics
Area code 951 is home to a diverse population of people from all walks of life. According to the U.S. Census Bureau, the population of the area is approximately 1.7 million people. The median age is 33.7 years, and the median household income is $63,845. The area is also home to a large Hispanic population, with nearly 40% of the population identifying as Hispanic or Latino.
Common Questions
What is Per Capita Income in Area Code 951?
Per Capita income in Area Code 951 is $33,404.
What is the Median Family Income in Area Code 951?
Median Family Income in Area Code 951 is $91,567.
What is the Median Household income in Area Code 951?
Median Household Income in Area Code 951 is $84,109.
What is Income or Wage Gap in Area Code 951?
Income or Wage Gap in Area Code 951 is 29.3%.
Women in Area Code 951 earn 70.7 cents for every dollar earned by a man.
What is Family Income Deficit in Area Code 951?
Family Income Deficit in Area Code 951 is $11,661.
Families that are below poverty line in Area Code 951 earn $11,661 less on average than the poverty threshold level.
What is Inequality or Gini Index in Area Code 951?
Inequality or Gini Index in Area Code 951 is 19.75.
What is the Total Population of Area Code 951?
Total Population of Area Code 951 is 1,908,948.
What is the Total Male Population of Area Code 951?
Total Male Population of Area Code 951 is 951,828.
What is the Total Female Population of Area Code 951?
Total Female Population of Area Code 951 is 957,120.
What is the Ratio of Males per 100 Females in Area Code 951?
There are 99.45 Males per 100 Females in Area Code 951.
What is the Ratio of Females per 100 Males in Area Code 951?
There are 100.56 Females per 100 Males in Area Code 951.
What is the Median Population Age in Area Code 951?
Median Population Age in Area Code 951 is 35.8 Years.
What is the Average Family Size in Area Code 951
Average Family Size in Area Code 951 is 3.7 People.
What is the Average Household Size in Area Code 951
Average Household Size in Area Code 951 is 3.3 People.
How Large is the Labor Force in Area Code 951?
There are 893,648 People in the Labor Forcein in Area Code 951.
What is the Percentage of People in the Labor Force in Area Code 951?
60.5% of People are in the Labor Force in Area Code 951.
What is the Unemployment Rate in Area Code 951?
Unemployment Rate in Area Code 951 is 7.0%.