Area Code 707 Map & Demographics
Area Code 707 Map
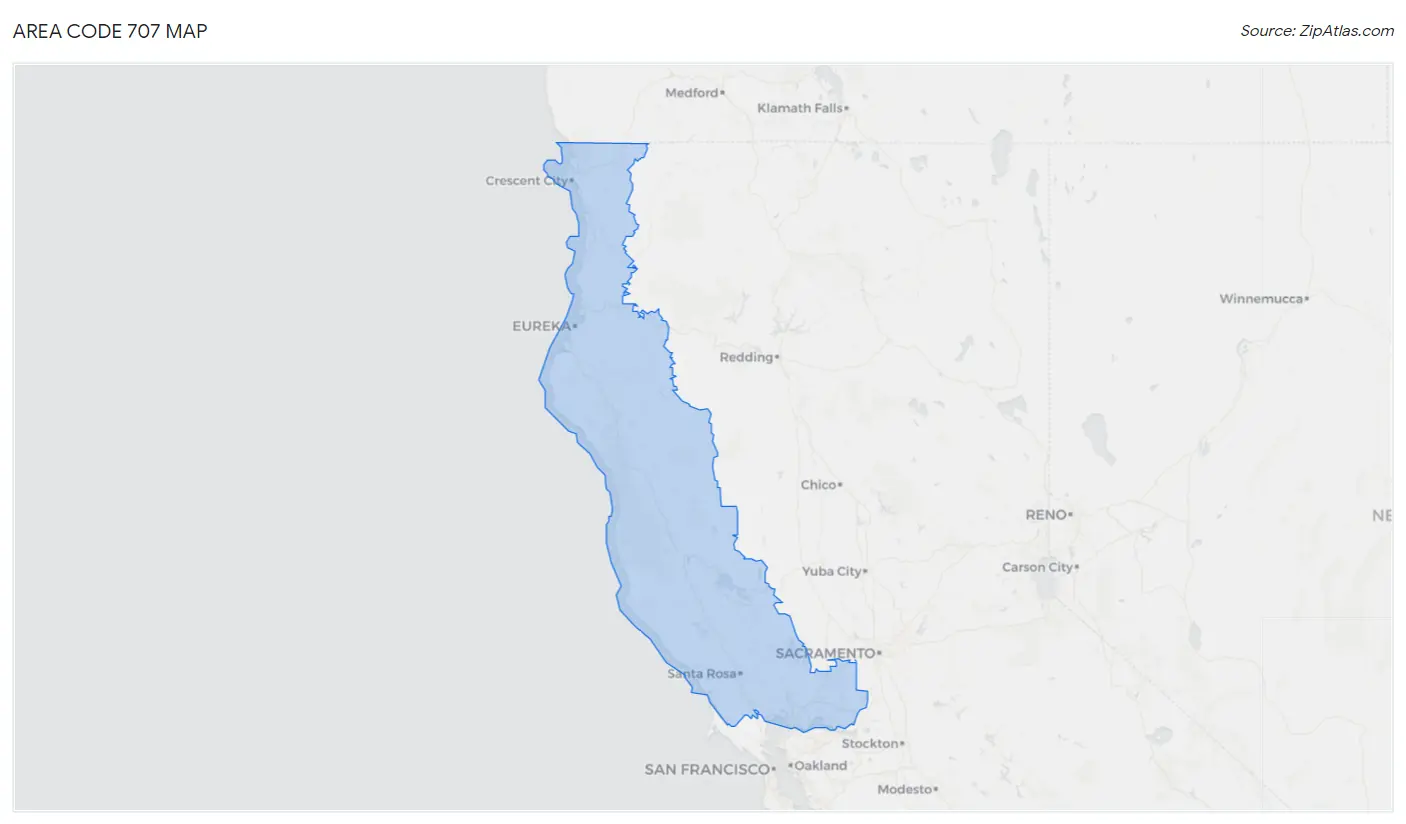
Area Code 707 Overview
$47,233
PER CAPITA INCOME
$109,266
AVG FAMILY INCOME
$85,018
AVG HOUSEHOLD INCOME
26.9%
WAGE / INCOME GAP [ % ]
73.1¢/ $1
WAGE / INCOME GAP [ $ ]
$10,967
FAMILY INCOME DEFICIT
58.21
INEQUALITY / GINI INDEX
1,459,048
TOTAL POPULATION
724,336
MALE POPULATION
734,712
FEMALE POPULATION
98.59
MALES / 100 FEMALES
101.43
FEMALES / 100 MALES
46.2
MEDIAN AGE
3.0
AVG FAMILY SIZE
2.5
AVG HOUSEHOLD SIZE
693,732
LABOR FORCE [ PEOPLE ]
57.8%
PERCENT IN LABOR FORCE
9.2%
UNEMPLOYMENT RATE
Income in Area Code 707
Income Overview in Area Code 707
Per Capita Income in Area Code 707 is $47,233, while median incomes of families and households are $109,266 and $85,018 respectively.
| Characteristic | Number | Measure |
| Per Capita Income | 1,459,048 | $47,233 |
| Median Family Income | 350,854 | $109,266 |
| Mean Family Income | 350,854 | $17,221,147 |
| Median Household Income | 546,956 | $85,018 |
| Mean Household Income | 546,956 | $14,543,595 |
| Income Deficit | 350,854 | $10,967 |
| Wage / Income Gap (%) | 1,459,048 | 26.95% |
| Wage / Income Gap ($) | 1,459,048 | 73.06¢ per $1 |
| Gini / Inequality Index | 1,459,048 | 58.21 |
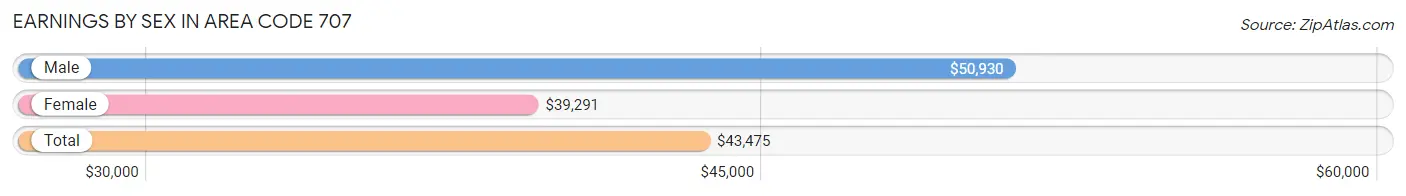
Earnings by Sex in Area Code 707
Average Earnings in Area Code 707 are $43,475, $50,930 for men and $39,291 for women, a difference of 22.9%.
| Sex | Number | Average Earnings |
| Male | 406,473 (52.8%) | $50,930 |
| Female | 363,955 (47.2%) | $39,291 |
| Total | 770,428 (100.0%) | $43,475 |
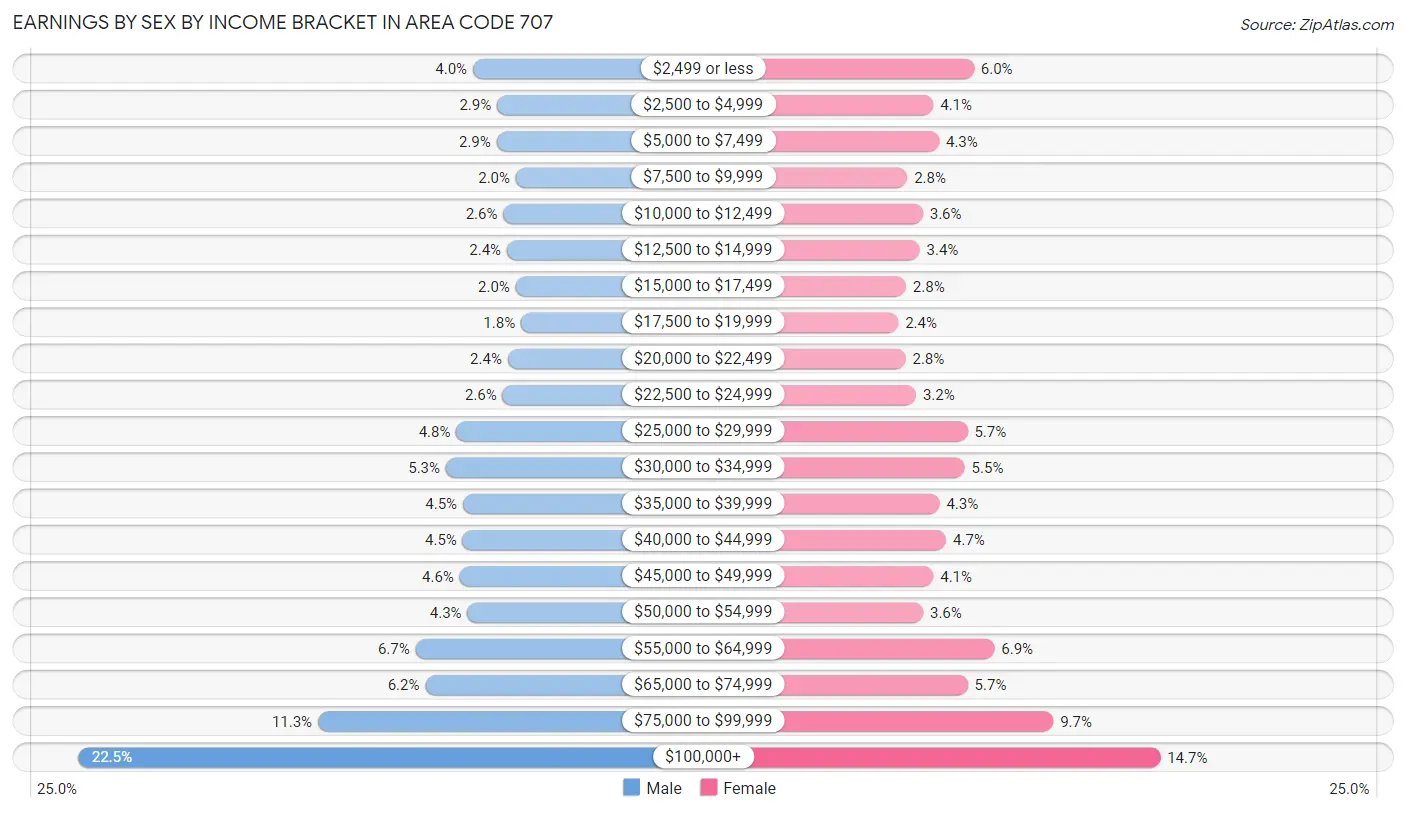
Earnings by Sex by Income Bracket in Area Code 707
The most common earnings brackets in Area Code 707 are $100,000+ for men (91,280 | 22.5%) and $100,000+ for women (53,435 | 14.7%).
| Income | Male | Female |
| $2,499 or less | 16,275 (4.0%) | 21,640 (5.9%) |
| $2,500 to $4,999 | 11,682 (2.9%) | 14,726 (4.1%) |
| $5,000 to $7,499 | 11,751 (2.9%) | 15,736 (4.3%) |
| $7,500 to $9,999 | 8,108 (2.0%) | 10,311 (2.8%) |
| $10,000 to $12,499 | 10,471 (2.6%) | 12,964 (3.6%) |
| $12,500 to $14,999 | 9,812 (2.4%) | 12,397 (3.4%) |
| $15,000 to $17,499 | 8,127 (2.0%) | 10,095 (2.8%) |
| $17,500 to $19,999 | 7,112 (1.8%) | 8,787 (2.4%) |
| $20,000 to $22,499 | 9,648 (2.4%) | 9,998 (2.8%) |
| $22,500 to $24,999 | 10,606 (2.6%) | 11,796 (3.2%) |
| $25,000 to $29,999 | 19,447 (4.8%) | 20,554 (5.7%) |
| $30,000 to $34,999 | 21,415 (5.3%) | 20,082 (5.5%) |
| $35,000 to $39,999 | 18,168 (4.5%) | 15,809 (4.3%) |
| $40,000 to $44,999 | 18,194 (4.5%) | 16,907 (4.6%) |
| $45,000 to $49,999 | 18,799 (4.6%) | 14,743 (4.1%) |
| $50,000 to $54,999 | 17,308 (4.3%) | 13,001 (3.6%) |
| $55,000 to $64,999 | 27,182 (6.7%) | 25,157 (6.9%) |
| $65,000 to $74,999 | 25,310 (6.2%) | 20,611 (5.7%) |
| $75,000 to $99,999 | 45,778 (11.3%) | 35,206 (9.7%) |
| $100,000+ | 91,280 (22.5%) | 53,435 (14.7%) |
| Total | 406,473 (100.0%) | 363,955 (100.0%) |
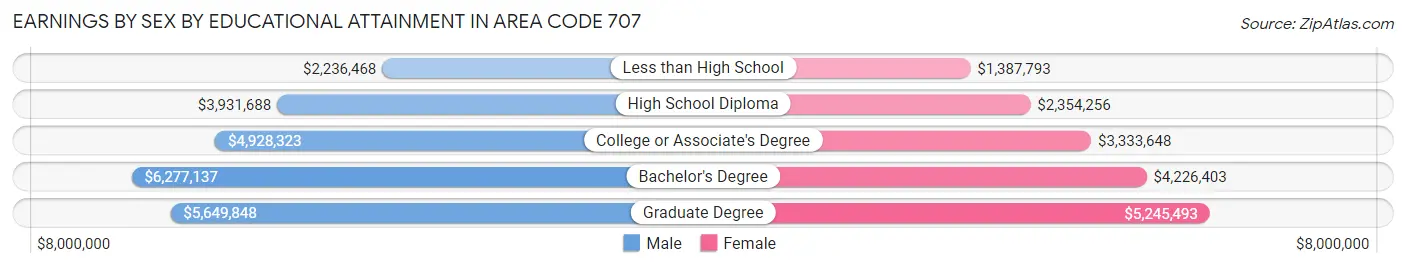
Earnings by Sex by Educational Attainment in Area Code 707
Average earnings in Area Code 707 are $5,970,879 for men and $4,585,897 for women, a difference of 23.2%. Men with an educational attainment of bachelor's degree enjoy the highest average annual earnings of $6,277,137, while those with less than high school education earn the least with $2,236,468. Women with an educational attainment of graduate degree earn the most with the average annual earnings of $5,245,493, while those with less than high school education have the smallest earnings of $1,387,793.
| Educational Attainment | Male Income | Female Income |
| Less than High School | $2,236,468 | $1,387,793 |
| High School Diploma | $3,931,688 | $2,354,256 |
| College or Associate's Degree | $4,928,323 | $3,333,648 |
| Bachelor's Degree | $6,277,137 | $4,226,403 |
| Graduate Degree | $5,649,848 | $5,245,493 |
| Total | $5,970,879 | $4,585,897 |
Family Income in Area Code 707
Family Income Brackets in Area Code 707
According to the Area Code 707 family income data, there are 8,413,128 families falling into the $100,000 to $149,999 income range, which is the most common income bracket and makes up 2,397.9% of all families. Conversely, the $10,000 to $14,999 income bracket is the least frequent group with only 1,079,227 families (307.6%) belonging to this category.
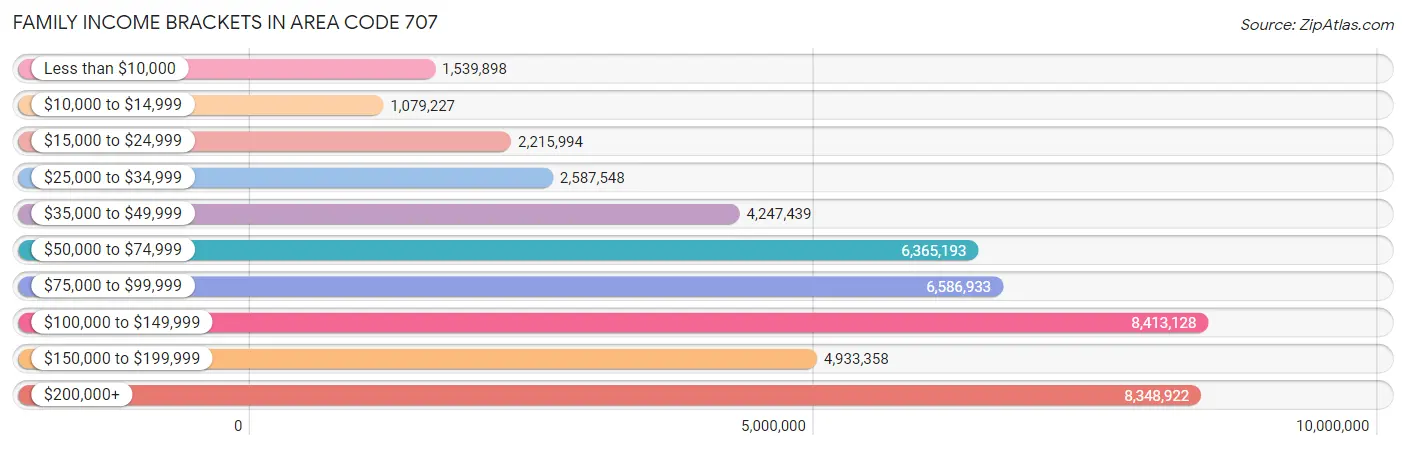
| Income Bracket | # Families | % Families |
| Less than $10,000 | 1,539,898 | 438.9% |
| $10,000 to $14,999 | 1,079,227 | 307.6% |
| $15,000 to $24,999 | 2,215,994 | 631.6% |
| $25,000 to $34,999 | 2,587,548 | 737.5% |
| $35,000 to $49,999 | 4,247,439 | 1,210.6% |
| $50,000 to $74,999 | 6,365,193 | 1,814.2% |
| $75,000 to $99,999 | 6,586,933 | 1,877.4% |
| $100,000 to $149,999 | 8,413,128 | 2,397.9% |
| $150,000 to $199,999 | 4,933,358 | 1,406.1% |
| $200,000+ | 8,348,922 | 2,379.6% |
Family Income by Famaliy Size in Area Code 707
7+ person families (6,189 | 1.8%) account for the highest median family income in Area Code 707 with $157,403 per family, while 2-person families (164,732 | 46.9%) have the highest median income of $50,082 per family member.
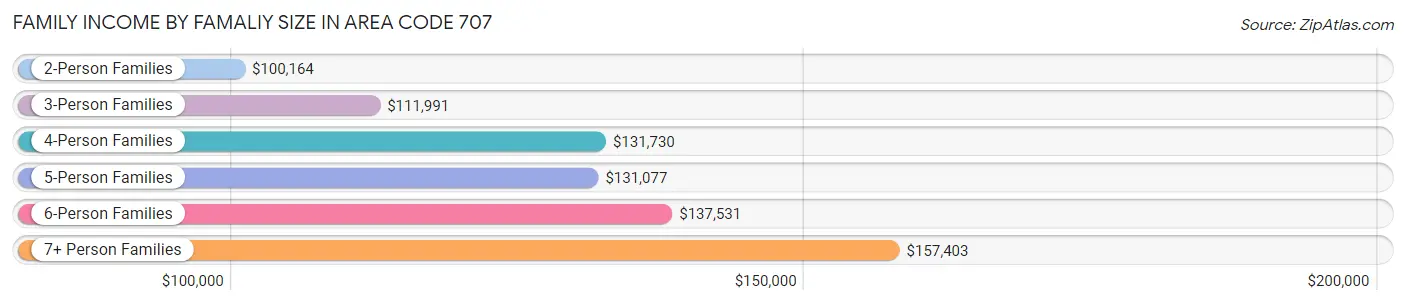
| Income Bracket | # Families | Median Income |
| 2-Person Families | 164,732 (46.9%) | $100,164 |
| 3-Person Families | 75,838 (21.6%) | $111,991 |
| 4-Person Families | 64,517 (18.4%) | $131,730 |
| 5-Person Families | 29,191 (8.3%) | $131,077 |
| 6-Person Families | 10,387 (3.0%) | $137,531 |
| 7+ Person Families | 6,189 (1.8%) | $157,403 |
| Total | 350,854 (100.0%) | $109,266 |
Family Income by Number of Earners in Area Code 707
The median family income in Area Code 707 is $109,266, with families comprising 3+ earners (46,565) having the highest median family income of $160,956, while families with no earners (54,358) have the lowest median family income of $67,557, accounting for 13.3% and 15.5% of families, respectively.
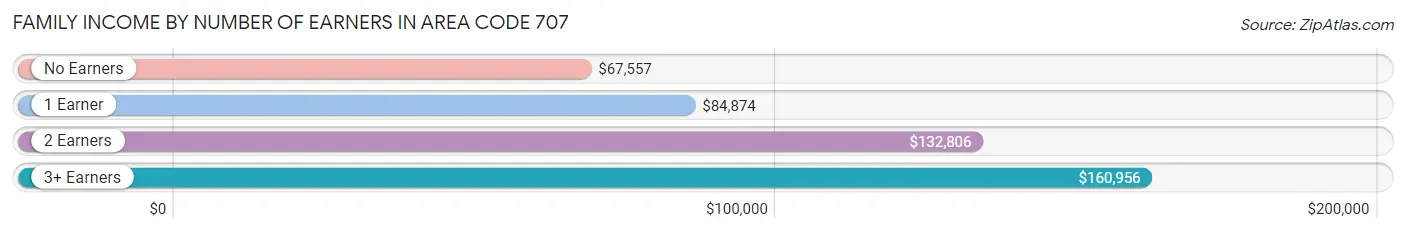
| Number of Earners | # Families | Median Income |
| No Earners | 54,358 (15.5%) | $67,557 |
| 1 Earner | 109,590 (31.2%) | $84,874 |
| 2 Earners | 140,341 (40.0%) | $132,806 |
| 3+ Earners | 46,565 (13.3%) | $160,956 |
| Total | 350,854 (100.0%) | $109,266 |
Household Income in Area Code 707
Household Income Brackets in Area Code 707
With 11,383,795 households falling in the category, the $100,000 to $149,999 income range is the most frequent in Area Code 707, accounting for 2,081.3% of all households. In contrast, only 3,525,131 households (644.5%) fall into the $10,000 to $14,999 income bracket, making it the least populous group.
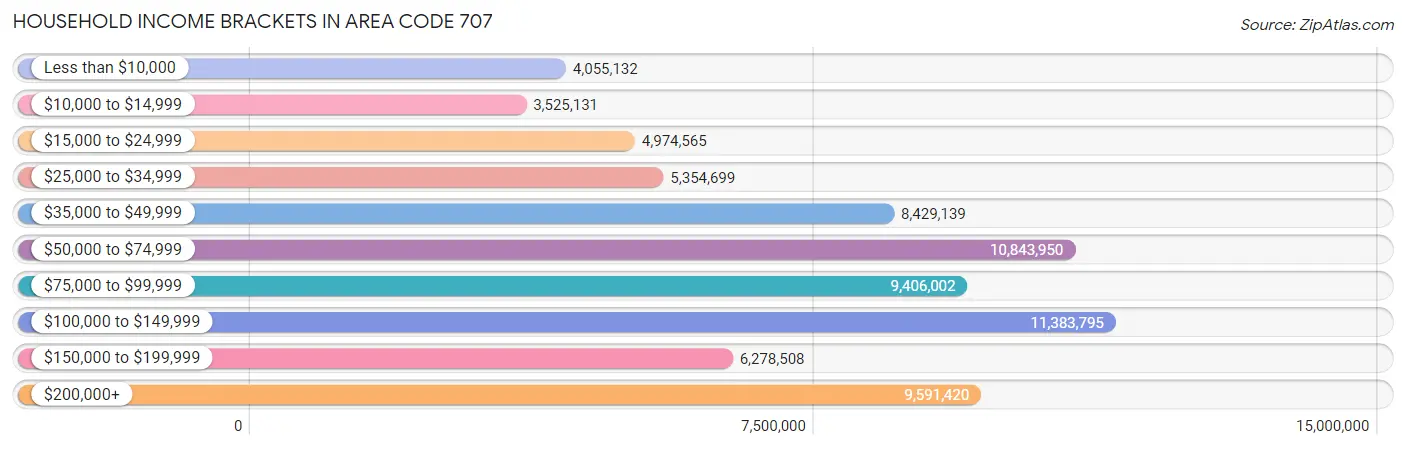
| Income Bracket | # Households | % Households |
| Less than $10,000 | 4,055,132 | 741.4% |
| $10,000 to $14,999 | 3,525,131 | 644.5% |
| $15,000 to $24,999 | 4,974,565 | 909.5% |
| $25,000 to $34,999 | 5,354,699 | 979.0% |
| $35,000 to $49,999 | 8,429,139 | 1,541.1% |
| $50,000 to $74,999 | 10,843,950 | 1,982.6% |
| $75,000 to $99,999 | 9,406,002 | 1,719.7% |
| $100,000 to $149,999 | 11,383,795 | 2,081.3% |
| $150,000 to $199,999 | 6,278,508 | 1,147.9% |
| $200,000+ | 9,591,420 | 1,753.6% |
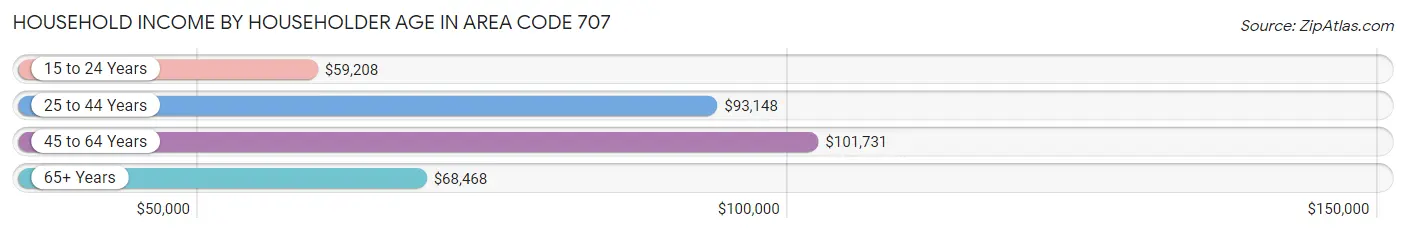
Household Income by Householder Age in Area Code 707
The median household income in Area Code 707 is $85,018, with the highest median household income of $101,731 found in the 45 to 64 years age bracket for the primary householder. A total of 197,245 households (36.1%) fall into this category. Meanwhile, the 15 to 24 years age bracket for the primary householder has the lowest median household income of $59,208, with 14,556 households (2.7%) in this group.
| Income Bracket | # Households | Median Income |
| 15 to 24 Years | 14,556 (2.7%) | $59,208 |
| 25 to 44 Years | 159,275 (29.1%) | $93,148 |
| 45 to 64 Years | 197,245 (36.1%) | $101,731 |
| 65+ Years | 175,880 (32.2%) | $68,468 |
| Total | 546,956 (100.0%) | $85,018 |
Poverty in Area Code 707
Income Below Poverty by Sex and Age in Area Code 707
With 9.9% poverty level for males and 11.2% for females among the residents of Area Code 707, 15 year old males and 18 to 24 year old females are the most vulnerable to poverty, with 1,198 males (14.5%) and 10,156 females (17.8%) in their respective age groups living below the poverty level.
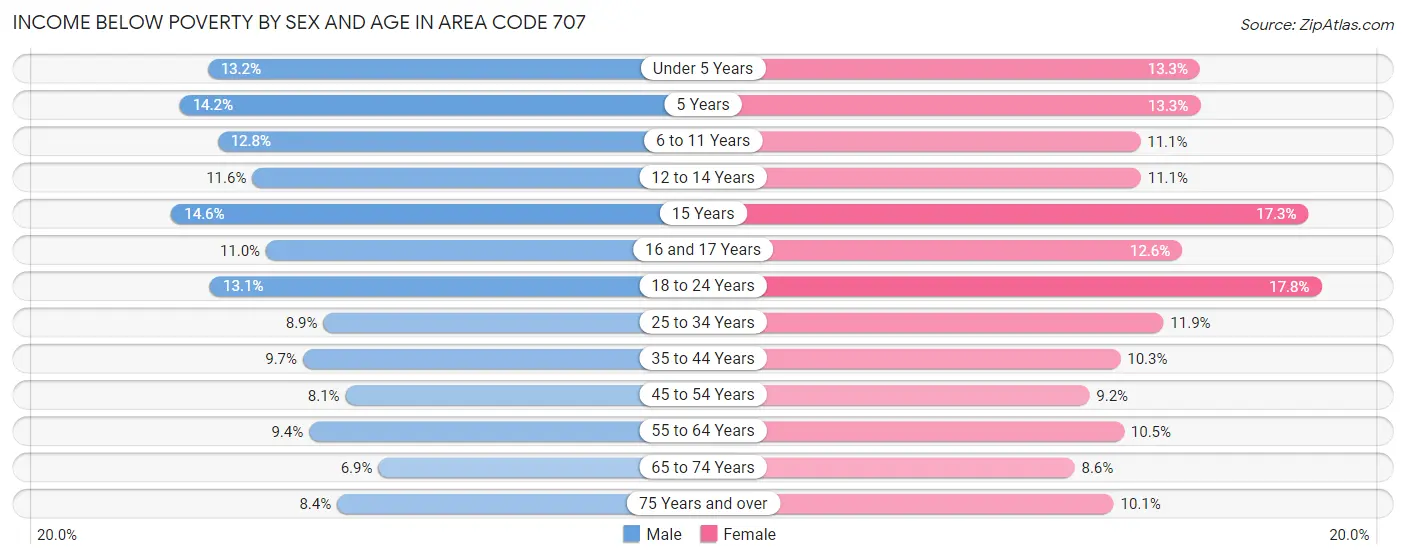
| Age Bracket | Male | Female |
| Under 5 Years | 4,920 (13.2%) | 4,810 (13.3%) |
| 5 Years | 1,176 (14.2%) | 951 (13.3%) |
| 6 to 11 Years | 6,362 (12.8%) | 5,245 (11.1%) |
| 12 to 14 Years | 2,948 (11.6%) | 2,864 (11.1%) |
| 15 Years | 1,198 (14.5%) | 1,542 (17.3%) |
| 16 and 17 Years | 2,059 (11.0%) | 2,070 (12.6%) |
| 18 to 24 Years | 7,855 (13.1%) | 10,156 (17.8%) |
| 25 to 34 Years | 8,369 (8.9%) | 10,798 (11.9%) |
| 35 to 44 Years | 9,060 (9.7%) | 9,445 (10.3%) |
| 45 to 54 Years | 7,136 (8.1%) | 7,988 (9.2%) |
| 55 to 64 Years | 8,904 (9.4%) | 10,629 (10.5%) |
| 65 to 74 Years | 5,536 (6.9%) | 7,894 (8.6%) |
| 75 Years and over | 3,994 (8.4%) | 6,554 (10.1%) |
| Total | 69,517 (9.9%) | 80,946 (11.2%) |
Income Above Poverty by Sex and Age in Area Code 707
According to the poverty statistics in Area Code 707, males aged 65 to 74 years and females aged 65 to 74 years are the age groups that are most secure financially, with 93.1% of males and 91.4% of females in these age groups living above the poverty line.
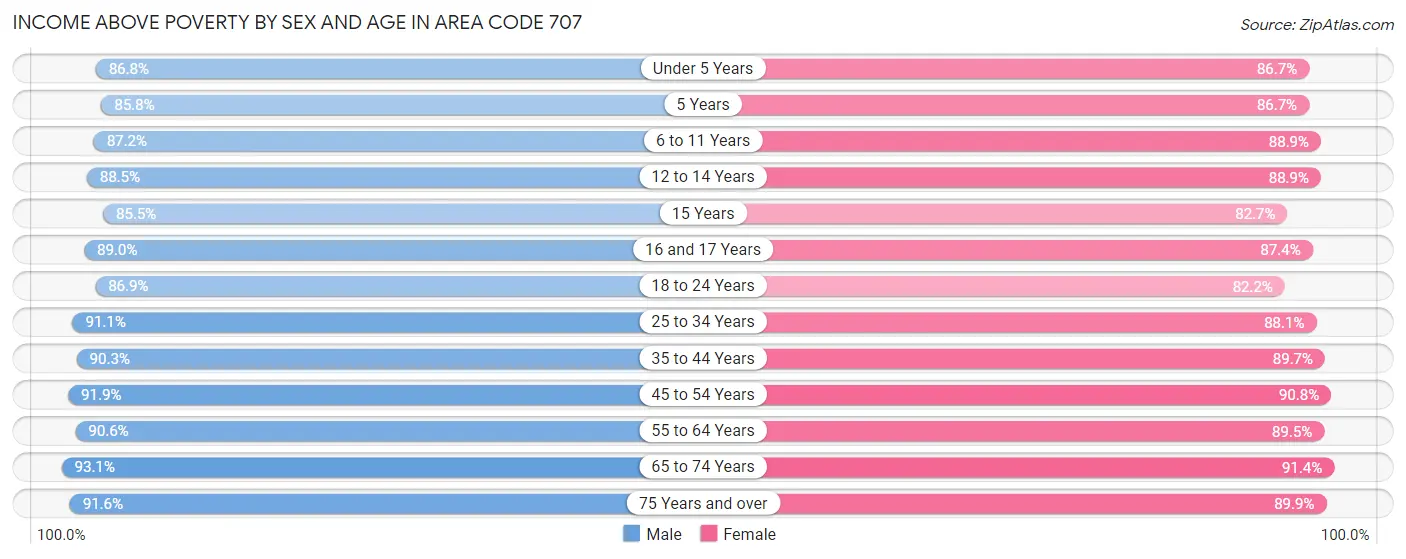
| Age Bracket | Male | Female |
| Under 5 Years | 32,354 (86.8%) | 31,370 (86.7%) |
| 5 Years | 7,085 (85.8%) | 6,199 (86.7%) |
| 6 to 11 Years | 43,244 (87.2%) | 42,081 (88.9%) |
| 12 to 14 Years | 22,568 (88.4%) | 22,929 (88.9%) |
| 15 Years | 7,033 (85.5%) | 7,363 (82.7%) |
| 16 and 17 Years | 16,589 (89.0%) | 14,319 (87.4%) |
| 18 to 24 Years | 52,069 (86.9%) | 46,892 (82.2%) |
| 25 to 34 Years | 85,538 (91.1%) | 79,663 (88.1%) |
| 35 to 44 Years | 84,587 (90.3%) | 81,865 (89.7%) |
| 45 to 54 Years | 81,089 (91.9%) | 78,964 (90.8%) |
| 55 to 64 Years | 85,385 (90.6%) | 90,868 (89.5%) |
| 65 to 74 Years | 74,989 (93.1%) | 83,507 (91.4%) |
| 75 Years and over | 43,576 (91.6%) | 58,406 (89.9%) |
| Total | 636,106 (90.1%) | 644,426 (88.8%) |
Income Below Poverty Among Married-Couple Families in Area Code 707
The poverty statistics for married-couple families in Area Code 707 show that 3.4% or 8,915 of the total 259,876 families live below the poverty line. Families with 5 or more children have the highest poverty rate of 17.8%, comprising of 183 families. On the other hand, families with no children have the lowest poverty rate of 2.8%, which includes 4,360 families.
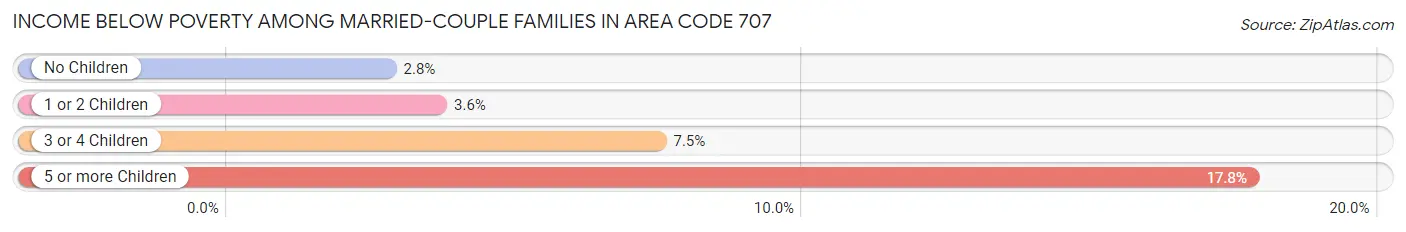
| Children | Above Poverty | Below Poverty |
| No Children | 153,679 (97.2%) | 4,360 (2.8%) |
| 1 or 2 Children | 79,486 (96.4%) | 3,006 (3.6%) |
| 3 or 4 Children | 16,949 (92.5%) | 1,366 (7.5%) |
| 5 or more Children | 847 (82.2%) | 183 (17.8%) |
| Total | 250,961 (96.6%) | 8,915 (3.4%) |
Income Below Poverty Among Single-Parent Households in Area Code 707
According to the poverty data in Area Code 707, 11.8% or 3,634 single-father households and 17.1% or 10,323 single-mother households are living below the poverty line. Among single-father households, those with 3 or 4 children have the highest poverty rate, with 880 households (32.3%) experiencing poverty. Likewise, among single-mother households, those with 5 or more children have the highest poverty rate, with 191 households (54.6%) falling below the poverty line.
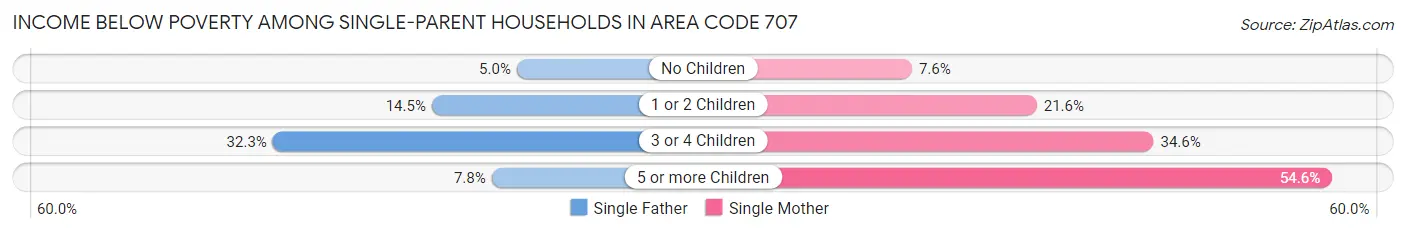
| Children | Single Father | Single Mother |
| No Children | 681 (5.0%) | 1,964 (7.6%) |
| 1 or 2 Children | 2,068 (14.5%) | 6,088 (21.6%) |
| 3 or 4 Children | 880 (32.3%) | 2,080 (34.6%) |
| 5 or more Children | 5 (7.8%) | 191 (54.6%) |
| Total | 3,634 (11.8%) | 10,323 (17.1%) |
Income Below Poverty Among Married-Couple vs Single-Parent Households in Area Code 707
The poverty data for Area Code 707 shows that 8,915 of the married-couple family households (3.4%) and 13,957 of the single-parent households (15.3%) are living below the poverty level. Within the married-couple family households, those with 5 or more children have the highest poverty rate, with 183 households (17.8%) falling below the poverty line. Among the single-parent households, those with 5 or more children have the highest poverty rate, with 196 household (47.3%) living below poverty.
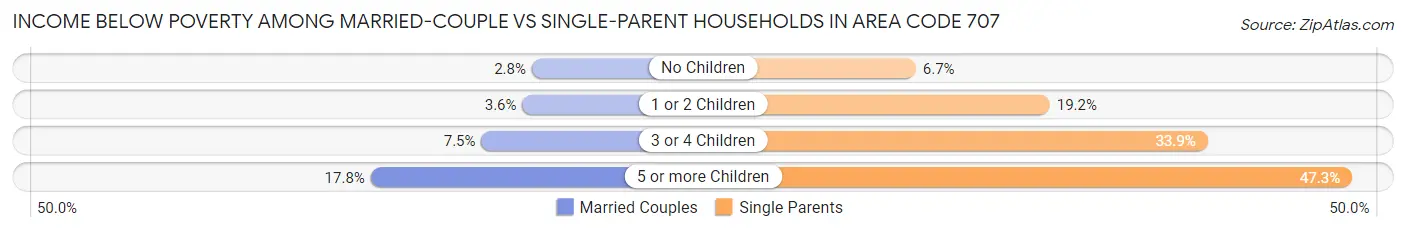
| Children | Married-Couple Families | Single-Parent Households |
| No Children | 4,360 (2.8%) | 2,645 (6.7%) |
| 1 or 2 Children | 3,006 (3.6%) | 8,156 (19.2%) |
| 3 or 4 Children | 1,366 (7.5%) | 2,960 (33.9%) |
| 5 or more Children | 183 (17.8%) | 196 (47.3%) |
| Total | 8,915 (3.4%) | 13,957 (15.3%) |
Race in Area Code 707
The most populous races in Area Code 707 are White / Caucasian (904,861 | 62.0%), Hispanic or Latino (379,422 | 26.0%), and Two or more Races (167,228 | 11.5%).
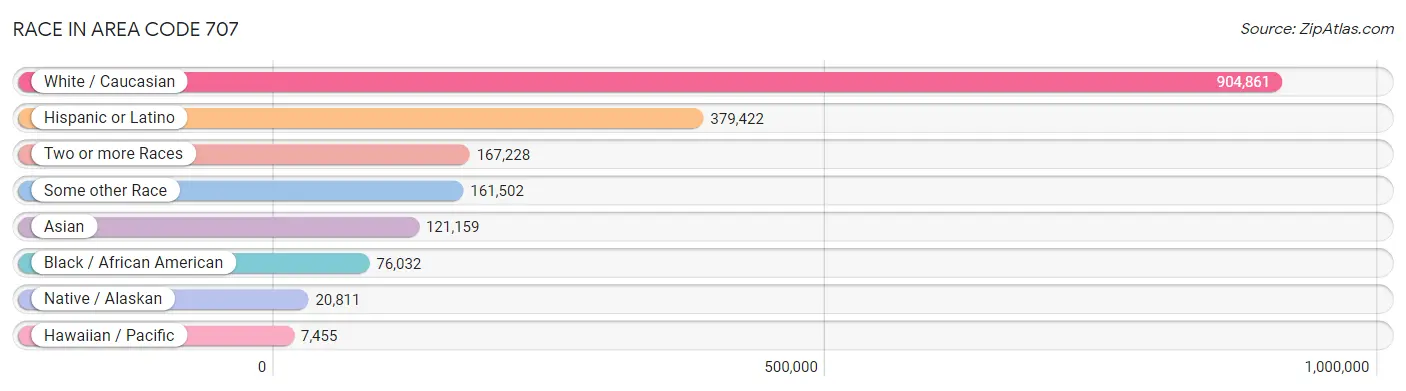
| Race | # Population | % Population |
| Asian | 121,159 | 8.3% |
| Black / African American | 76,032 | 5.2% |
| Hawaiian / Pacific | 7,455 | 0.5% |
| Hispanic or Latino | 379,422 | 26.0% |
| Native / Alaskan | 20,811 | 1.4% |
| White / Caucasian | 904,861 | 62.0% |
| Two or more Races | 167,228 | 11.5% |
| Some other Race | 161,502 | 11.1% |
| Total | 1,459,048 | 100.0% |
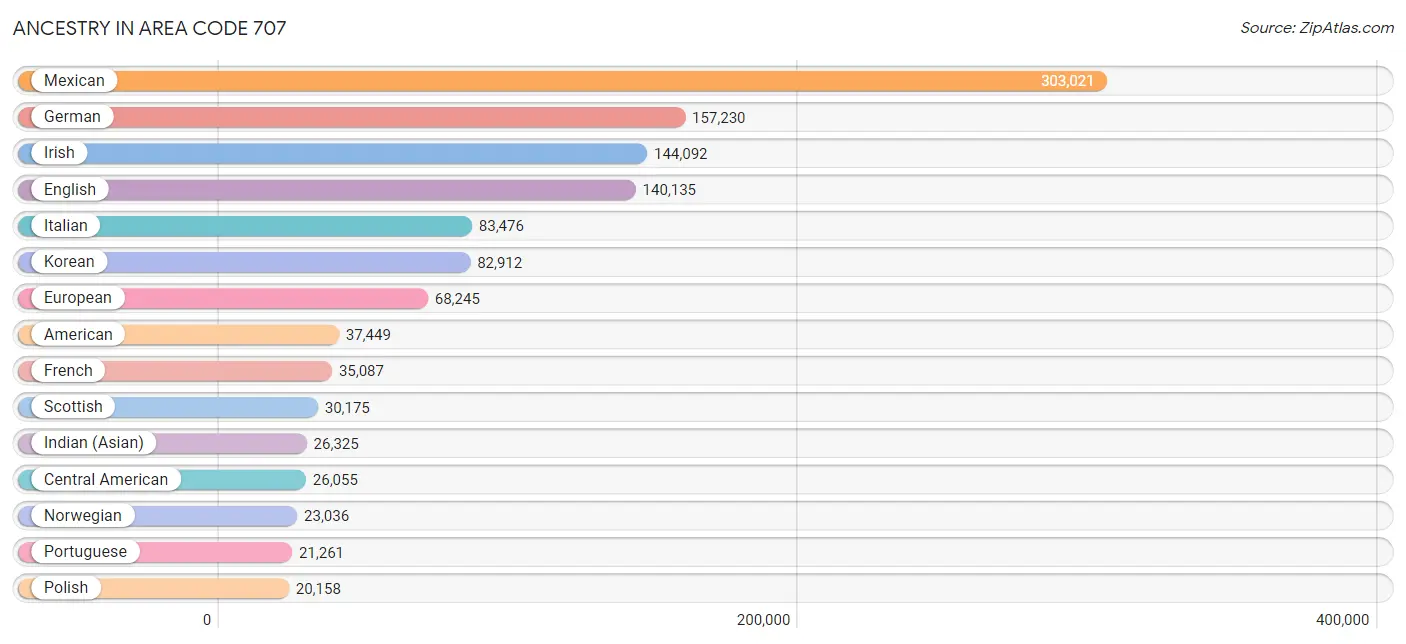
Ancestry in Area Code 707
The most populous ancestries reported in Area Code 707 are Mexican (303,021 | 20.8%), German (157,230 | 10.8%), Irish (144,092 | 9.9%), English (140,135 | 9.6%), and Italian (83,476 | 5.7%), together accounting for 56.8% of all Area Code 707 residents.
| Ancestry | # Population | % Population |
| Afghan | 604 | 0.0% |
| African | 10,032 | 0.7% |
| Alaska Native | 140 | 0.0% |
| Alaskan Athabascan | 28 | 0.0% |
| Albanian | 65 | 0.0% |
| Aleut | 222 | 0.0% |
| Alsatian | 16 | 0.0% |
| American | 37,449 | 2.6% |
| Apache | 1,540 | 0.1% |
| Arab | 6,003 | 0.4% |
| Argentinean | 1,073 | 0.1% |
| Armenian | 2,001 | 0.1% |
| Assyrian / Chaldean / Syriac | 521 | 0.0% |
| Australian | 641 | 0.0% |
| Austrian | 3,266 | 0.2% |
| Bangladeshi | 2,223 | 0.2% |
| Basque | 1,471 | 0.1% |
| Belgian | 1,474 | 0.1% |
| Belizean | 204 | 0.0% |
| Bermudan | 30 | 0.0% |
| Bhutanese | 14,060 | 1.0% |
| Blackfeet | 1,603 | 0.1% |
| Bolivian | 261 | 0.0% |
| Brazilian | 1,109 | 0.1% |
| British | 10,322 | 0.7% |
| British West Indian | 81 | 0.0% |
| Bulgarian | 559 | 0.0% |
| Burmese | 8,313 | 0.6% |
| Cajun | 113 | 0.0% |
| Cambodian | 325 | 0.0% |
| Canadian | 3,247 | 0.2% |
| Cape Verdean | 265 | 0.0% |
| Carpatho Rusyn | 10 | 0.0% |
| Celtic | 286 | 0.0% |
| Central American | 26,055 | 1.8% |
| Central American Indian | 2,666 | 0.2% |
| Cherokee | 6,114 | 0.4% |
| Cheyenne | 176 | 0.0% |
| Chickasaw | 398 | 0.0% |
| Chilean | 1,160 | 0.1% |
| Chinese | 274 | 0.0% |
| Chippewa | 825 | 0.1% |
| Choctaw | 1,768 | 0.1% |
| Colombian | 2,422 | 0.2% |
| Colville | 9 | 0.0% |
| Comanche | 209 | 0.0% |
| Costa Rican | 607 | 0.0% |
| Cree | 135 | 0.0% |
| Creek | 533 | 0.0% |
| Croatian | 1,731 | 0.1% |
| Crow | 17 | 0.0% |
| Cuban | 2,512 | 0.2% |
| Cypriot | 14 | 0.0% |
| Czech | 3,818 | 0.3% |
| Czechoslovakian | 957 | 0.1% |
| Danish | 12,229 | 0.8% |
| Delaware | 313 | 0.0% |
| Dominican | 688 | 0.1% |
| Dutch | 14,187 | 1.0% |
| Dutch West Indian | 128 | 0.0% |
| Eastern European | 5,561 | 0.4% |
| Ecuadorian | 693 | 0.1% |
| Egyptian | 834 | 0.1% |
| English | 140,135 | 9.6% |
| Estonian | 181 | 0.0% |
| Ethiopian | 806 | 0.1% |
| European | 68,245 | 4.7% |
| Fijian | 21 | 0.0% |
| Filipino | 1,240 | 0.1% |
| Finnish | 4,405 | 0.3% |
| French | 35,087 | 2.4% |
| French American Indian | 79 | 0.0% |
| French Canadian | 5,156 | 0.4% |
| German | 157,230 | 10.8% |
| German Russian | 109 | 0.0% |
| Ghanaian | 300 | 0.0% |
| Greek | 5,716 | 0.4% |
| Guamanian / Chamorro | 3,628 | 0.3% |
| Guatemalan | 6,321 | 0.4% |
| Guyanese | 67 | 0.0% |
| Haitian | 636 | 0.0% |
| Honduran | 1,121 | 0.1% |
| Hopi | 88 | 0.0% |
| Hungarian | 3,662 | 0.3% |
| Icelander | 379 | 0.0% |
| Indian (Asian) | 26,325 | 1.8% |
| Indonesian | 443 | 0.0% |
| Inupiat | 82 | 0.0% |
| Iranian | 2,794 | 0.2% |
| Iraqi | 102 | 0.0% |
| Irish | 144,092 | 9.9% |
| Iroquois | 698 | 0.1% |
| Israeli | 475 | 0.0% |
| Italian | 83,476 | 5.7% |
| Jamaican | 1,306 | 0.1% |
| Japanese | 1,601 | 0.1% |
| Jordanian | 588 | 0.0% |
| Kenyan | 416 | 0.0% |
| Kiowa | 14 | 0.0% |
| Korean | 82,912 | 5.7% |
| Laotian | 1,116 | 0.1% |
| Latvian | 728 | 0.1% |
| Lebanese | 1,536 | 0.1% |
| Liberian | 102 | 0.0% |
| Lithuanian | 2,048 | 0.1% |
| Lumbee | 14 | 0.0% |
| Luxembourger | 112 | 0.0% |
| Macedonian | 98 | 0.0% |
| Malaysian | 2,744 | 0.2% |
| Maltese | 767 | 0.1% |
| Mexican | 303,021 | 20.8% |
| Mexican American Indian | 5,855 | 0.4% |
| Mongolian | 213 | 0.0% |
| Moroccan | 176 | 0.0% |
| Native Hawaiian | 5,751 | 0.4% |
| Navajo | 955 | 0.1% |
| Nepalese | 295 | 0.0% |
| New Zealander | 203 | 0.0% |
| Nicaraguan | 3,849 | 0.3% |
| Nigerian | 933 | 0.1% |
| Northern European | 6,590 | 0.4% |
| Norwegian | 23,036 | 1.6% |
| Okinawan | 29 | 0.0% |
| Osage | 344 | 0.0% |
| Ottawa | 155 | 0.0% |
| Paiute | 342 | 0.0% |
| Pakistani | 2,247 | 0.2% |
| Palestinian | 1,218 | 0.1% |
| Panamanian | 746 | 0.1% |
| Paraguayan | 9 | 0.0% |
| Pennsylvania German | 560 | 0.0% |
| Peruvian | 3,129 | 0.2% |
| Pima | 116 | 0.0% |
| Polish | 20,158 | 1.4% |
| Portuguese | 21,261 | 1.5% |
| Potawatomi | 125 | 0.0% |
| Pueblo | 769 | 0.1% |
| Puerto Rican | 9,286 | 0.6% |
| Puget Sound Salish | 9 | 0.0% |
| Romanian | 1,359 | 0.1% |
| Russian | 13,739 | 0.9% |
| Salvadoran | 13,273 | 0.9% |
| Samoan | 2,774 | 0.2% |
| Scandinavian | 6,589 | 0.4% |
| Scotch-Irish | 14,004 | 1.0% |
| Scottish | 30,175 | 2.1% |
| Seminole | 214 | 0.0% |
| Senegalese | 9 | 0.0% |
| Serbian | 669 | 0.1% |
| Shoshone | 315 | 0.0% |
| Sierra Leonean | 41 | 0.0% |
| Sioux | 834 | 0.1% |
| Slavic | 617 | 0.0% |
| Slovak | 1,126 | 0.1% |
| Slovene | 323 | 0.0% |
| Somali | 21 | 0.0% |
| South African | 339 | 0.0% |
| South American | 9,859 | 0.7% |
| South American Indian | 238 | 0.0% |
| Soviet Union | 34 | 0.0% |
| Spaniard | 9,089 | 0.6% |
| Spanish | 8,654 | 0.6% |
| Spanish American | 209 | 0.0% |
| Spanish American Indian | 101 | 0.0% |
| Sri Lankan | 9,303 | 0.6% |
| Subsaharan African | 14,089 | 1.0% |
| Sudanese | 31 | 0.0% |
| Swedish | 19,131 | 1.3% |
| Swiss | 7,562 | 0.5% |
| Syrian | 422 | 0.0% |
| Taiwanese | 143 | 0.0% |
| Thai | 12,799 | 0.9% |
| Tlingit-Haida | 161 | 0.0% |
| Tohono O'Odham | 172 | 0.0% |
| Tongan | 569 | 0.0% |
| Trinidadian and Tobagonian | 110 | 0.0% |
| Tsimshian | 23 | 0.0% |
| Turkish | 508 | 0.0% |
| Ugandan | 376 | 0.0% |
| Ukrainian | 3,458 | 0.2% |
| Uruguayan | 307 | 0.0% |
| Ute | 58 | 0.0% |
| Venezuelan | 585 | 0.0% |
| Vietnamese | 57 | 0.0% |
| Welsh | 9,769 | 0.7% |
| West Indian | 505 | 0.0% |
| Yaqui | 638 | 0.0% |
| Yugoslavian | 1,002 | 0.1% |
| Yuman | 30 | 0.0% |
| Yup'ik | 65 | 0.0% |
| Zimbabwean | 11 | 0.0% | View All 191 Rows |
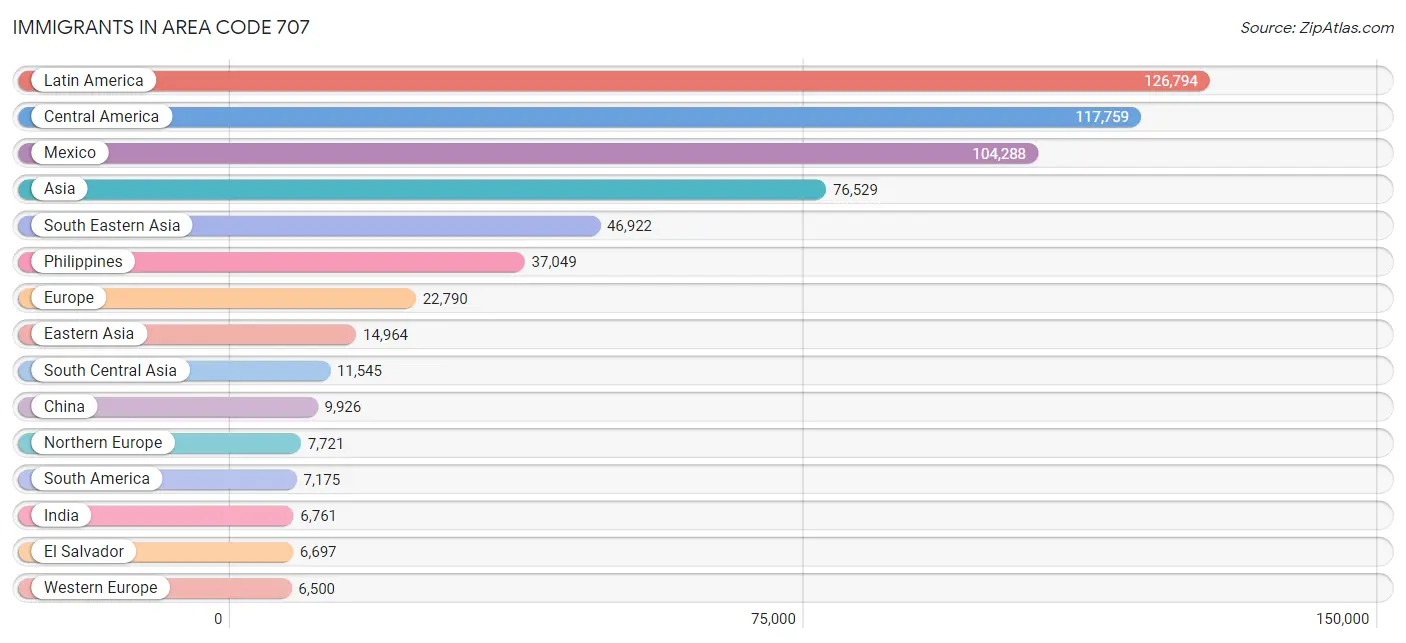
Immigrants in Area Code 707
The most numerous immigrant groups reported in Area Code 707 came from Latin America (126,794 | 8.7%), Central America (117,759 | 8.1%), Mexico (104,288 | 7.1%), Asia (76,529 | 5.2%), and South Eastern Asia (46,922 | 3.2%), together accounting for 32.4% of all Area Code 707 residents.
| Immigration Origin | # Population | % Population |
| Afghanistan | 680 | 0.1% |
| Africa | 4,578 | 0.3% |
| Argentina | 862 | 0.1% |
| Armenia | 224 | 0.0% |
| Asia | 76,529 | 5.2% |
| Australia | 749 | 0.1% |
| Austria | 298 | 0.0% |
| Azores | 329 | 0.0% |
| Bangladesh | 37 | 0.0% |
| Barbados | 10 | 0.0% |
| Belarus | 156 | 0.0% |
| Belgium | 126 | 0.0% |
| Belize | 9 | 0.0% |
| Bolivia | 91 | 0.0% |
| Bosnia and Herzegovina | 60 | 0.0% |
| Brazil | 1,709 | 0.1% |
| Bulgaria | 372 | 0.0% |
| Cabo Verde | 52 | 0.0% |
| Cambodia | 1,012 | 0.1% |
| Cameroon | 65 | 0.0% |
| Canada | 4,996 | 0.3% |
| Caribbean | 1,860 | 0.1% |
| Central America | 117,759 | 8.1% |
| Chile | 408 | 0.0% |
| China | 9,926 | 0.7% |
| Colombia | 1,068 | 0.1% |
| Congo | 34 | 0.0% |
| Costa Rica | 450 | 0.0% |
| Croatia | 69 | 0.0% |
| Cuba | 801 | 0.1% |
| Czechoslovakia | 279 | 0.0% |
| Denmark | 418 | 0.0% |
| Dominica | 23 | 0.0% |
| Dominican Republic | 229 | 0.0% |
| Eastern Africa | 1,661 | 0.1% |
| Eastern Asia | 14,964 | 1.0% |
| Eastern Europe | 5,462 | 0.4% |
| Ecuador | 411 | 0.0% |
| Egypt | 349 | 0.0% |
| El Salvador | 6,697 | 0.5% |
| England | 2,484 | 0.2% |
| Eritrea | 212 | 0.0% |
| Ethiopia | 314 | 0.0% |
| Europe | 22,790 | 1.6% |
| Fiji | 1,978 | 0.1% |
| France | 1,219 | 0.1% |
| Germany | 3,474 | 0.2% |
| Ghana | 261 | 0.0% |
| Greece | 358 | 0.0% |
| Guatemala | 3,713 | 0.3% |
| Guyana | 20 | 0.0% |
| Haiti | 269 | 0.0% |
| Honduras | 560 | 0.0% |
| Hong Kong | 1,107 | 0.1% |
| Hungary | 401 | 0.0% |
| India | 6,761 | 0.5% |
| Indonesia | 557 | 0.0% |
| Iran | 2,242 | 0.2% |
| Iraq | 230 | 0.0% |
| Ireland | 828 | 0.1% |
| Israel | 383 | 0.0% |
| Italy | 1,122 | 0.1% |
| Jamaica | 412 | 0.0% |
| Japan | 1,746 | 0.1% |
| Jordan | 721 | 0.1% |
| Kazakhstan | 144 | 0.0% |
| Kenya | 519 | 0.0% |
| Korea | 3,103 | 0.2% |
| Kuwait | 86 | 0.0% |
| Laos | 1,225 | 0.1% |
| Latin America | 126,794 | 8.7% |
| Latvia | 42 | 0.0% |
| Lebanon | 290 | 0.0% |
| Liberia | 103 | 0.0% |
| Lithuania | 127 | 0.0% |
| Malaysia | 282 | 0.0% |
| Mexico | 104,288 | 7.1% |
| Micronesia | 80 | 0.0% |
| Middle Africa | 228 | 0.0% |
| Moldova | 129 | 0.0% |
| Morocco | 181 | 0.0% |
| Nepal | 885 | 0.1% |
| Netherlands | 786 | 0.1% |
| Nicaragua | 1,531 | 0.1% |
| Nigeria | 491 | 0.0% |
| North Macedonia | 39 | 0.0% |
| Northern Africa | 836 | 0.1% |
| Northern Europe | 7,721 | 0.5% |
| Norway | 257 | 0.0% |
| Oceania | 3,695 | 0.3% |
| Pakistan | 570 | 0.0% |
| Panama | 483 | 0.0% |
| Peru | 1,970 | 0.1% |
| Philippines | 37,049 | 2.5% |
| Poland | 550 | 0.0% |
| Portugal | 1,040 | 0.1% |
| Romania | 420 | 0.0% |
| Russia | 1,468 | 0.1% |
| Saudi Arabia | 81 | 0.0% |
| Scotland | 467 | 0.0% |
| Senegal | 9 | 0.0% |
| Serbia | 16 | 0.0% |
| Sierra Leone | 151 | 0.0% |
| Singapore | 87 | 0.0% |
| Somalia | 57 | 0.0% |
| South Africa | 426 | 0.0% |
| South America | 7,175 | 0.5% |
| South Central Asia | 11,545 | 0.8% |
| South Eastern Asia | 46,922 | 3.2% |
| Southern Europe | 3,079 | 0.2% |
| Spain | 519 | 0.0% |
| Sri Lanka | 110 | 0.0% |
| Sudan | 18 | 0.0% |
| Sweden | 354 | 0.0% |
| Switzerland | 589 | 0.0% |
| Syria | 97 | 0.0% |
| Taiwan | 2,027 | 0.1% |
| Thailand | 1,970 | 0.1% |
| Trinidad and Tobago | 31 | 0.0% |
| Turkey | 294 | 0.0% |
| Uganda | 305 | 0.0% |
| Ukraine | 896 | 0.1% |
| Uruguay | 291 | 0.0% |
| Uzbekistan | 77 | 0.0% |
| Venezuela | 284 | 0.0% |
| Vietnam | 4,372 | 0.3% |
| West Indies | 38 | 0.0% |
| Western Africa | 1,252 | 0.1% |
| Western Asia | 2,806 | 0.2% |
| Western Europe | 6,500 | 0.4% |
| Yemen | 188 | 0.0% |
| Zimbabwe | 70 | 0.0% | View All 132 Rows |
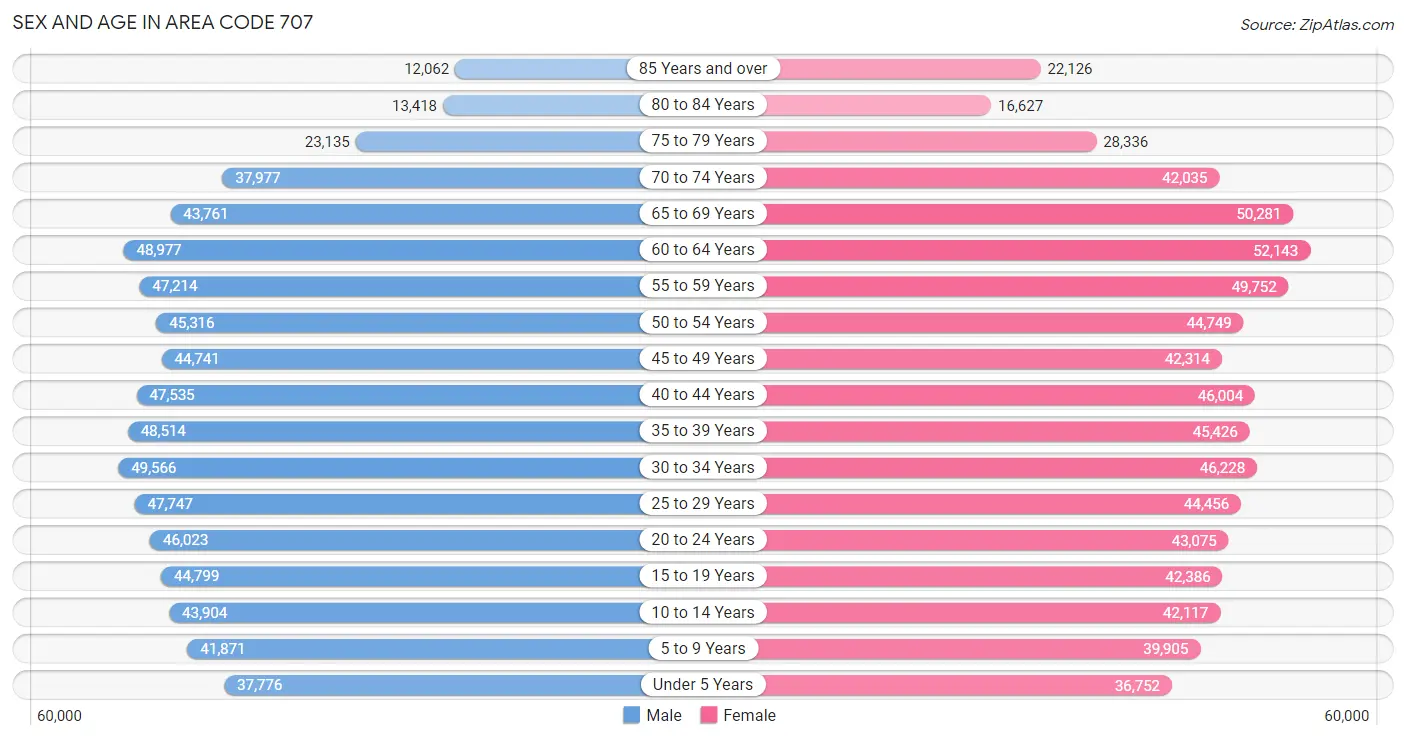
Sex and Age in Area Code 707
Sex and Age in Area Code 707
The most populous age groups in Area Code 707 are 30 to 34 Years (49,566 | 6.8%) for men and 60 to 64 Years (52,143 | 7.1%) for women.
| Age Bracket | Male | Female |
| Under 5 Years | 37,776 (5.2%) | 36,752 (5.0%) |
| 5 to 9 Years | 41,871 (5.8%) | 39,905 (5.4%) |
| 10 to 14 Years | 43,904 (6.1%) | 42,117 (5.7%) |
| 15 to 19 Years | 44,799 (6.2%) | 42,386 (5.8%) |
| 20 to 24 Years | 46,023 (6.4%) | 43,075 (5.9%) |
| 25 to 29 Years | 47,747 (6.6%) | 44,456 (6.0%) |
| 30 to 34 Years | 49,566 (6.8%) | 46,228 (6.3%) |
| 35 to 39 Years | 48,514 (6.7%) | 45,426 (6.2%) |
| 40 to 44 Years | 47,535 (6.6%) | 46,004 (6.3%) |
| 45 to 49 Years | 44,741 (6.2%) | 42,314 (5.8%) |
| 50 to 54 Years | 45,316 (6.3%) | 44,749 (6.1%) |
| 55 to 59 Years | 47,214 (6.5%) | 49,752 (6.8%) |
| 60 to 64 Years | 48,977 (6.8%) | 52,143 (7.1%) |
| 65 to 69 Years | 43,761 (6.0%) | 50,281 (6.8%) |
| 70 to 74 Years | 37,977 (5.2%) | 42,035 (5.7%) |
| 75 to 79 Years | 23,135 (3.2%) | 28,336 (3.9%) |
| 80 to 84 Years | 13,418 (1.8%) | 16,627 (2.3%) |
| 85 Years and over | 12,062 (1.7%) | 22,126 (3.0%) |
| Total | 724,336 (100.0%) | 734,712 (100.0%) |
Families and Households in Area Code 707
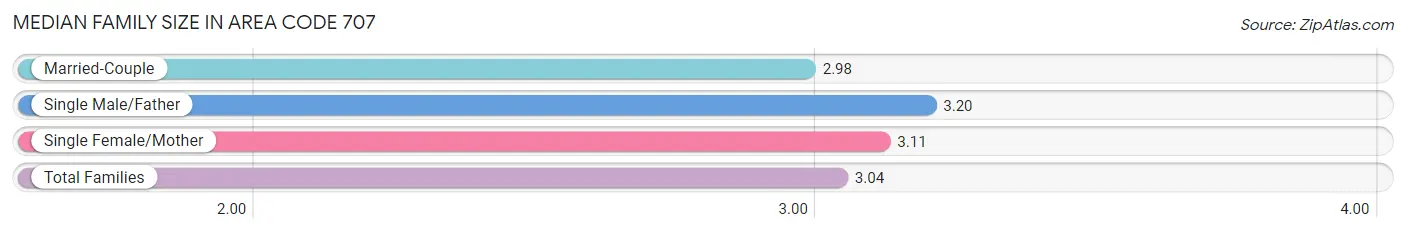
Median Family Size in Area Code 707
The median family size in Area Code 707 is 3.04 persons per family, with single male/father families (30,657 | 8.7%) accounting for the largest median family size of 3.19654 persons per family. On the other hand, married-couple families (259,876 | 74.1%) represent the smallest median family size with 2.98 persons per family.
| Family Type | # Families | Family Size |
| Married-Couple | 259,876 (74.1%) | 2.98 |
| Single Male/Father | 30,657 (8.7%) | 3.20 |
| Single Female/Mother | 60,321 (17.2%) | 3.11 |
| Total Families | 350,854 (100.0%) | 3.04 |
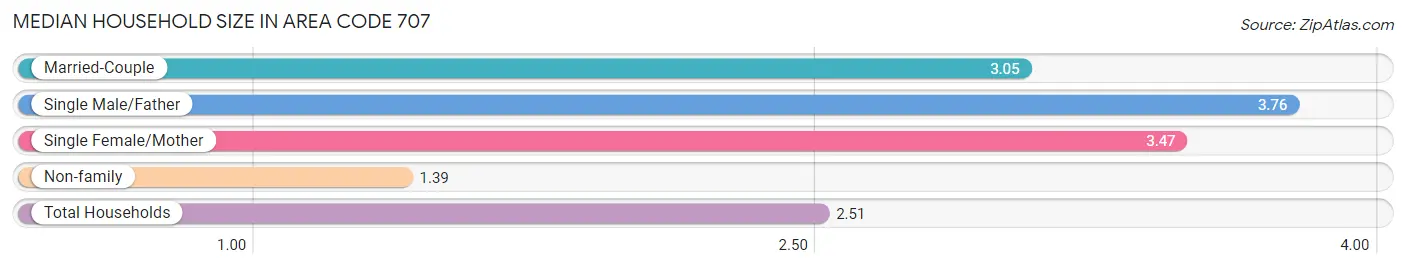
Median Household Size in Area Code 707
The median household size in Area Code 707 is 2.51 persons per household, with single male/father households (30,657 | 5.6%) accounting for the largest median household size of 3.76495 persons per household. non-family households (196,102 | 35.8%) represent the smallest median household size with 1.39 persons per household.
| Household Type | # Households | Household Size |
| Married-Couple | 259,876 (47.5%) | 3.05 |
| Single Male/Father | 30,657 (5.6%) | 3.76 |
| Single Female/Mother | 60,321 (11.0%) | 3.47 |
| Non-family | 196,102 (35.8%) | 1.39 |
| Total Households | 546,956 (100.0%) | 2.51 |
Household Size by Marriage Status in Area Code 707
Out of a total of 546,956 households in Area Code 707, 350,854 (64.1%) are family households, while 196,102 (35.8%) are nonfamily households. The most numerous type of family households are 2-person households, comprising 149,782, and the most common type of nonfamily households are 1-person households, comprising 149,990.
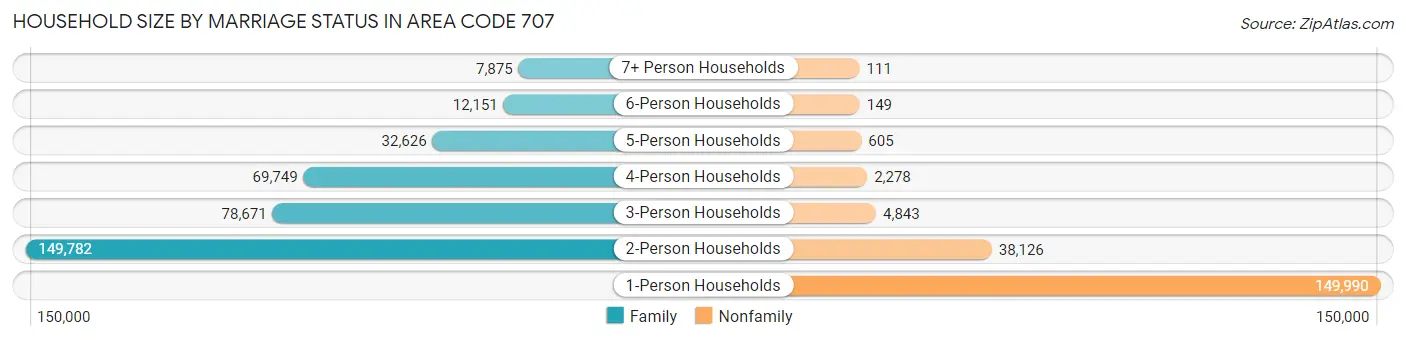
| Household Size | Family Households | Nonfamily Households |
| 1-Person Households | - | 149,990 (27.4%) |
| 2-Person Households | 149,782 (27.4%) | 38,126 (7.0%) |
| 3-Person Households | 78,671 (14.4%) | 4,843 (0.9%) |
| 4-Person Households | 69,749 (12.8%) | 2,278 (0.4%) |
| 5-Person Households | 32,626 (6.0%) | 605 (0.1%) |
| 6-Person Households | 12,151 (2.2%) | 149 (0.0%) |
| 7+ Person Households | 7,875 (1.4%) | 111 (0.0%) |
| Total | 350,854 (64.1%) | 196,102 (35.8%) |
Female Fertility in Area Code 707
Fertility by Age in Area Code 707
Average fertility rate in Area Code 707 is 71.9 births per 1,000 women. Women in the age bracket of 20 to 34 years have the highest fertility rate with 103.1 births per 1,000 women. Women in the age bracket of 20 to 34 years acount for 62.2% of all women with births.
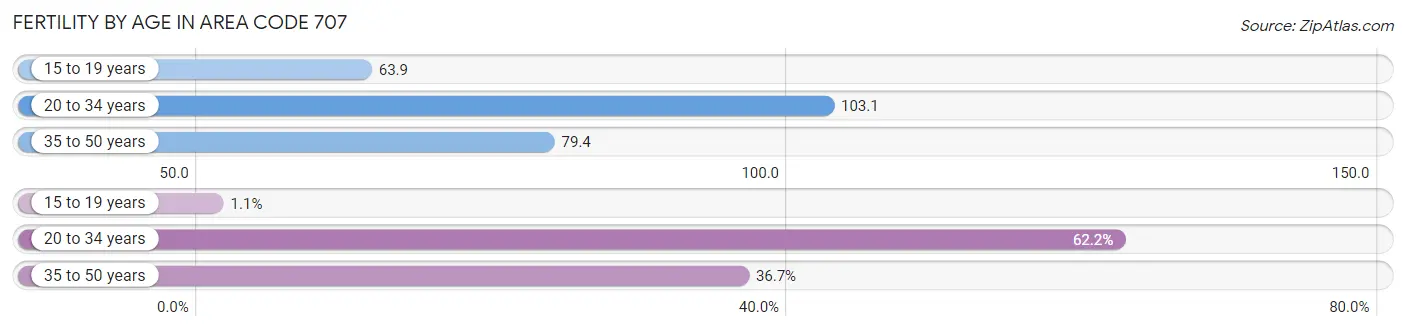
| Age Bracket | Women with Births | Births / 1,000 Women |
| 15 to 19 years | 169 (1.1%) | 63.9 |
| 20 to 34 years | 9,883 (62.2%) | 103.1 |
| 35 to 50 years | 5,830 (36.7%) | 79.4 |
| Total | 15,882 (100.0%) | 71.9 |
Fertility by Age by Marriage Status in Area Code 707
58.1% of women with births (15,882) in Area Code 707 are married. The highest percentage of unmarried women with births falls into 15 to 19 years age bracket with 100.0% of them unmarried at the time of birth, while the lowest percentage of unmarried women with births belong to 35 to 50 years age bracket with 48.8% of them unmarried.
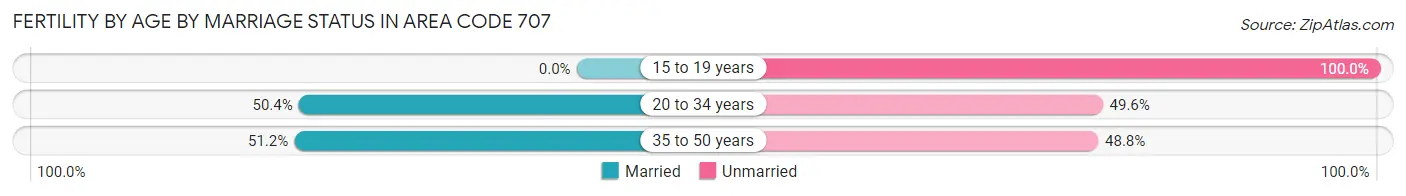
| Age Bracket | Married | Unmarried |
| 15 to 19 years | 0 (0.0%) | 169 (100.0%) |
| 20 to 34 years | 4,977 (50.4%) | 4,906 (49.6%) |
| 35 to 50 years | 2,984 (51.2%) | 2,846 (48.8%) |
| Total | 9,221 (58.1%) | 6,661 (41.9%) |
Fertility by Education in Area Code 707
Average fertility rate in Area Code 707 is 71.9 births per 1,000 women. Women with the education attainment of less than high school have the highest fertility rate of 136.1 births per 1,000 women, while women with the education attainment of college or associate's degree have the lowest fertility at 78.4 births per 1,000 women. Women with the education attainment of college or associate's degree represent 35.7% of all women with births.
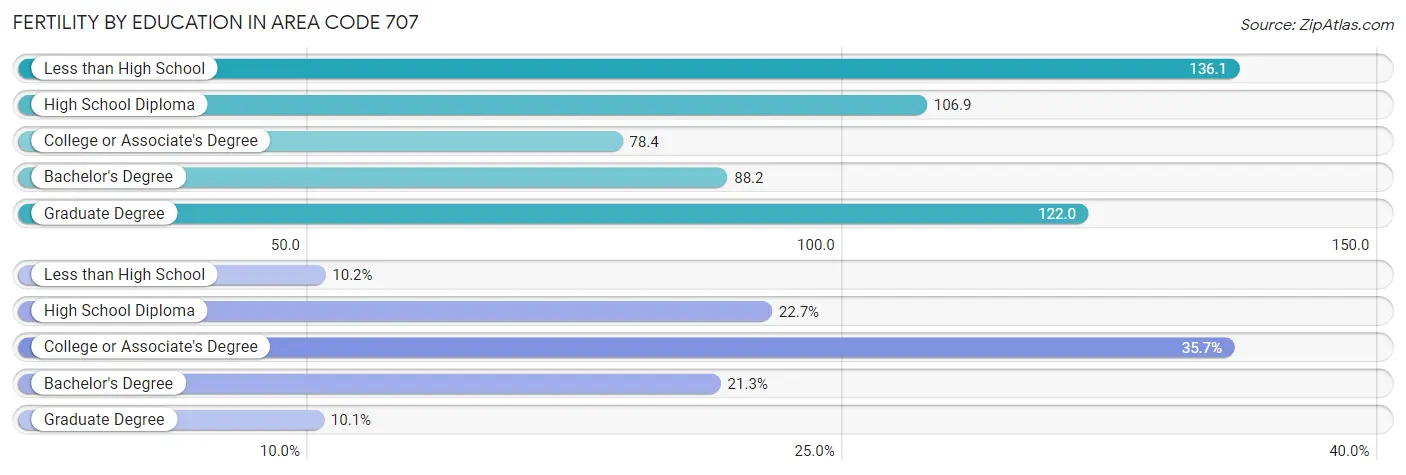
| Educational Attainment | Women with Births | Births / 1,000 Women |
| Less than High School | 1,615 (10.2%) | 136.1 |
| High School Diploma | 3,609 (22.7%) | 106.9 |
| College or Associate's Degree | 5,670 (35.7%) | 78.4 |
| Bachelor's Degree | 3,379 (21.3%) | 88.2 |
| Graduate Degree | 1,609 (10.1%) | 122.0 |
| Total | 15,882 (100.0%) | 71.9 |
Fertility by Education by Marriage Status in Area Code 707
41.9% of women with births in Area Code 707 are unmarried. Women with the educational attainment of bachelor's degree are most likely to be married with 68.5% of them married at childbirth, while women with the educational attainment of less than high school are least likely to be married with 77.3% of them unmarried at childbirth.
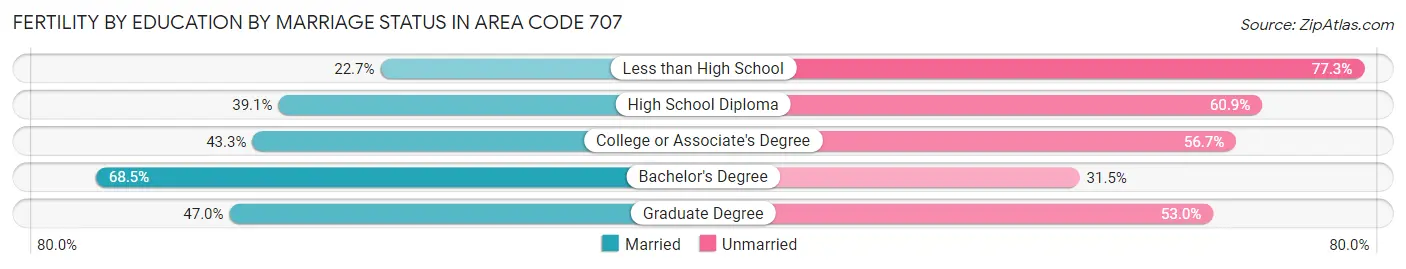
| Educational Attainment | Married | Unmarried |
| Less than High School | 366 (22.7%) | 1,249 (77.3%) |
| High School Diploma | 1,411 (39.1%) | 2,198 (60.9%) |
| College or Associate's Degree | 2,455 (43.3%) | 3,215 (56.7%) |
| Bachelor's Degree | 2,315 (68.5%) | 1,064 (31.5%) |
| Graduate Degree | 756 (47.0%) | 853 (53.0%) |
| Total | 9,221 (58.1%) | 6,661 (41.9%) |
Employment Characteristics in Area Code 707
Employment by Class of Employer in Area Code 707
Among the 675,961 employed individuals in Area Code 707, private company employees (418,749 | 62.0%), local government employees (62,815 | 9.3%), and self-employed (not incorporated) (61,272 | 9.1%) make up the most common classes of employment.
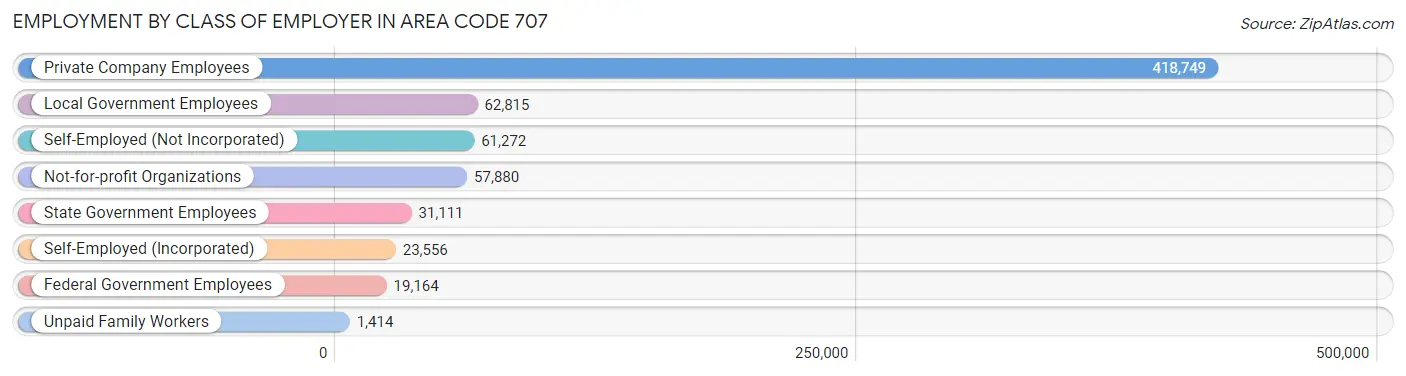
| Employer Class | # Employees | % Employees |
| Private Company Employees | 418,749 | 62.0% |
| Self-Employed (Incorporated) | 23,556 | 3.5% |
| Self-Employed (Not Incorporated) | 61,272 | 9.1% |
| Not-for-profit Organizations | 57,880 | 8.6% |
| Local Government Employees | 62,815 | 9.3% |
| State Government Employees | 31,111 | 4.6% |
| Federal Government Employees | 19,164 | 2.8% |
| Unpaid Family Workers | 1,414 | 0.2% |
| Total | 675,961 | 100.0% |
Employment Status by Age in Area Code 707
According to the labor force statistics for Area Code 707, out of the total population over 16 years of age (1,199,516), 57.8% or 693,680 individuals are in the labor force, with 9.2% or 63,749 of them unemployed. The age group with the highest labor force participation rate is 30 to 34 years, with 82.4% or 78,906 individuals in the labor force. Within the labor force, the 16 to 19 years age range has the highest percentage of unemployed individuals, with 1,910.8% or 641,551 of them being unemployed.
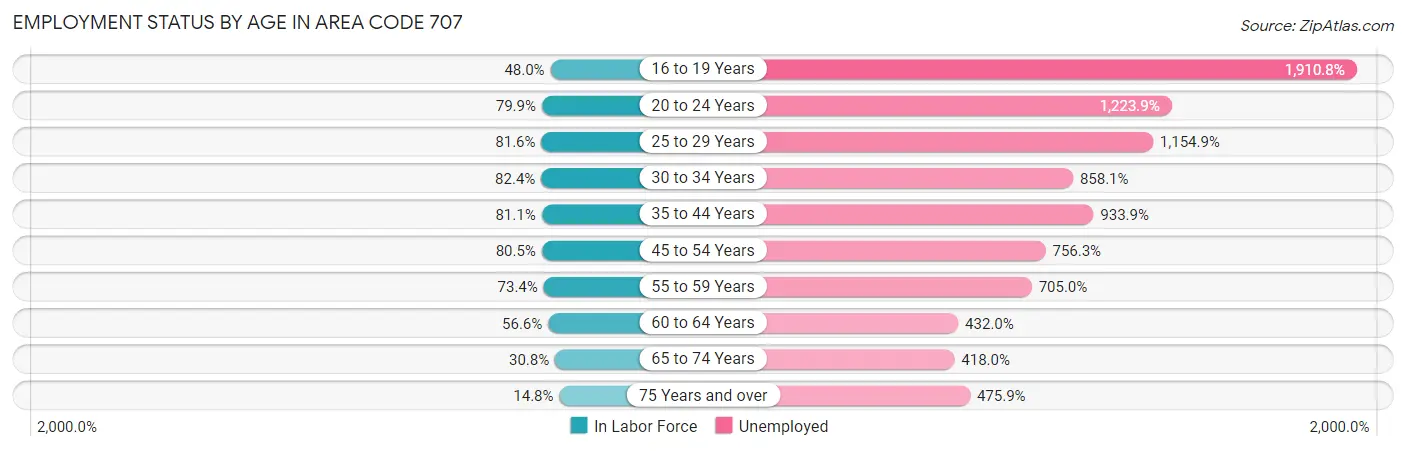
| Age Bracket | In Labor Force | Unemployed |
| 16 to 19 Years | 33,578 (48.0%) | 641,551 (1,910.8%) |
| 20 to 24 Years | 71,199 (79.9%) | 871,392 (1,223.9%) |
| 25 to 29 Years | 75,211 (81.6%) | 868,600 (1,154.9%) |
| 30 to 34 Years | 78,906 (82.4%) | 677,092 (858.1%) |
| 35 to 44 Years | 152,088 (81.1%) | 1,420,303 (933.9%) |
| 45 to 54 Years | 142,542 (80.5%) | 1,078,075 (756.3%) |
| 55 to 59 Years | 71,122 (73.4%) | 501,431 (705.0%) |
| 60 to 64 Years | 57,189 (56.6%) | 247,074 (432.0%) |
| 65 to 74 Years | 53,678 (30.8%) | 224,374 (418.0%) |
| 75 Years and over | 17,170 (14.8%) | 81,712 (475.9%) |
| Total | 693,732 (57.8%) | 63,735 (9.2%) |
Employment Status by Educational Attainment in Area Code 707
According to labor force statistics for Area Code 707, 75.0% of individuals (562,636) out of the total population between 25 and 64 years of age (750,682) are in the labor force, with 964.2% or 5,424,936 of them being unemployed. The group with the highest labor force participation rate are those with the educational attainment of bachelor's degree or higher, with 81.8% or 198,994 individuals in the labor force. Within the labor force, individuals with high school diploma education have the highest percentage of unemployment, with 1,154.6% or 1,347,603 of them being unemployed.
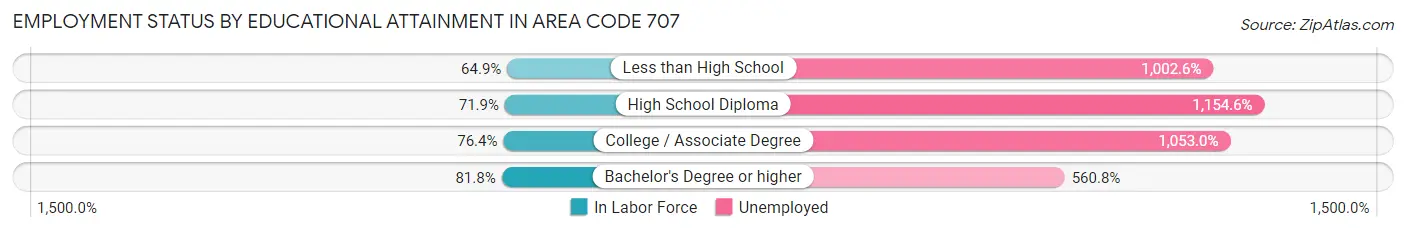
| Educational Attainment | In Labor Force | Unemployed |
| Less than High School | 57,685 (64.8%) | 891,833 (1,002.6%) |
| High School Diploma | 116,724 (71.9%) | 1,873,500 (1,154.6%) |
| College / Associate Degree | 195,815 (76.4%) | 2,699,007 (1,053.0%) |
| Bachelor's Degree or higher | 198,986 (81.8%) | 1,363,585 (560.8%) |
| Total | 562,631 (75.0%) | 7,238,076 (964.2%) |
Employment Occupations by Sex in Area Code 707
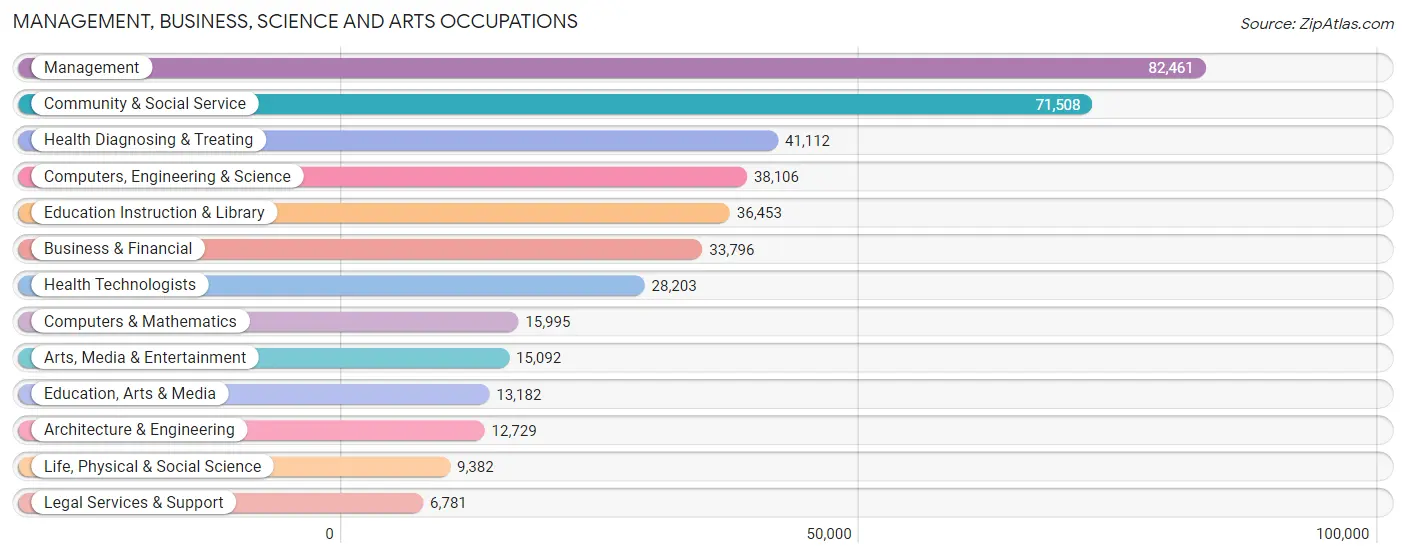
Management, Business, Science and Arts Occupations
The most common Management, Business, Science and Arts occupations in Area Code 707 are Management (82,461 | 11.9%), Community & Social Service (71,508 | 10.3%), Health Diagnosing & Treating (41,112 | 5.9%), Computers, Engineering & Science (38,106 | 5.5%), and Education Instruction & Library (36,453 | 5.3%).
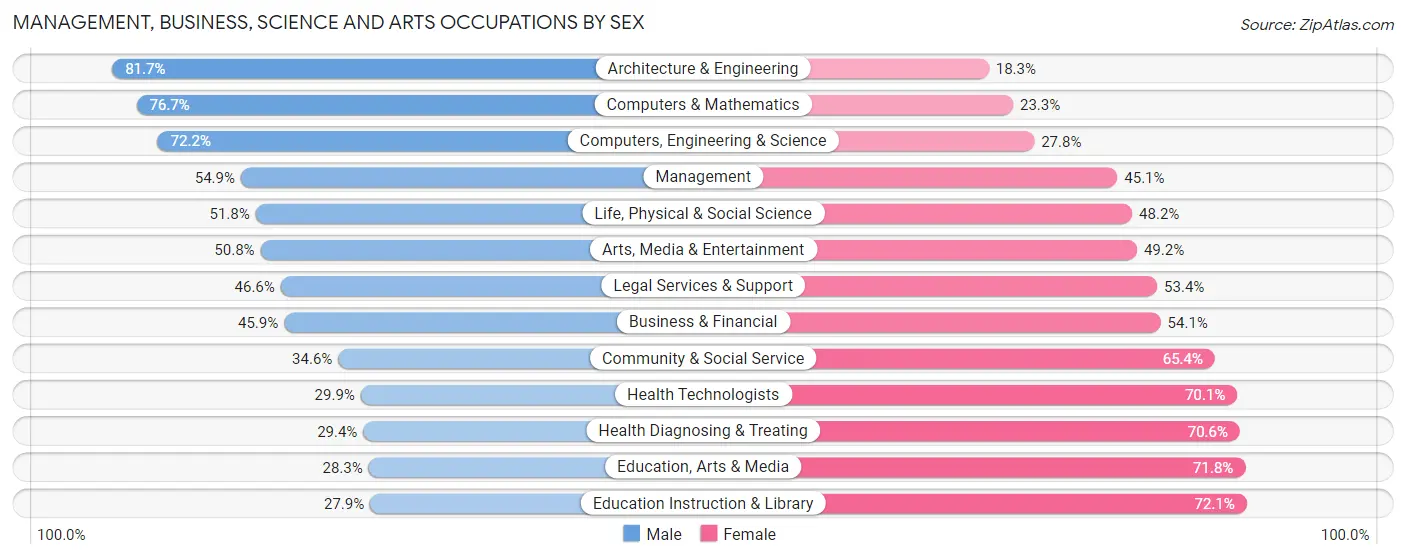
Management, Business, Science and Arts Occupations by Sex
Within the Management, Business, Science and Arts occupations in Area Code 707, the most male-oriented occupations are Architecture & Engineering (81.7%), Computers & Mathematics (76.7%), and Computers, Engineering & Science (72.2%), while the most female-oriented occupations are Education Instruction & Library (72.1%), Education, Arts & Media (71.8%), and Health Diagnosing & Treating (70.6%).
| Occupation | Male | Female |
| Management | 45,268 (54.9%) | 37,193 (45.1%) |
| Business & Financial | 15,502 (45.9%) | 18,294 (54.1%) |
| Computers, Engineering & Science | 27,526 (72.2%) | 10,580 (27.8%) |
| Computers & Mathematics | 12,262 (76.7%) | 3,733 (23.3%) |
| Architecture & Engineering | 10,402 (81.7%) | 2,327 (18.3%) |
| Life, Physical & Social Science | 4,862 (51.8%) | 4,520 (48.2%) |
| Community & Social Service | 24,736 (34.6%) | 46,772 (65.4%) |
| Education, Arts & Media | 3,724 (28.2%) | 9,458 (71.8%) |
| Legal Services & Support | 3,160 (46.6%) | 3,621 (53.4%) |
| Education Instruction & Library | 10,184 (27.9%) | 26,269 (72.1%) |
| Arts, Media & Entertainment | 7,668 (50.8%) | 7,424 (49.2%) |
| Health Diagnosing & Treating | 12,074 (29.4%) | 29,038 (70.6%) |
| Health Technologists | 8,434 (29.9%) | 19,769 (70.1%) |
| Total (Category) | 125,106 (46.9%) | 141,877 (53.1%) |
| Total (Overall) | 363,262 (52.6%) | 327,471 (47.4%) |
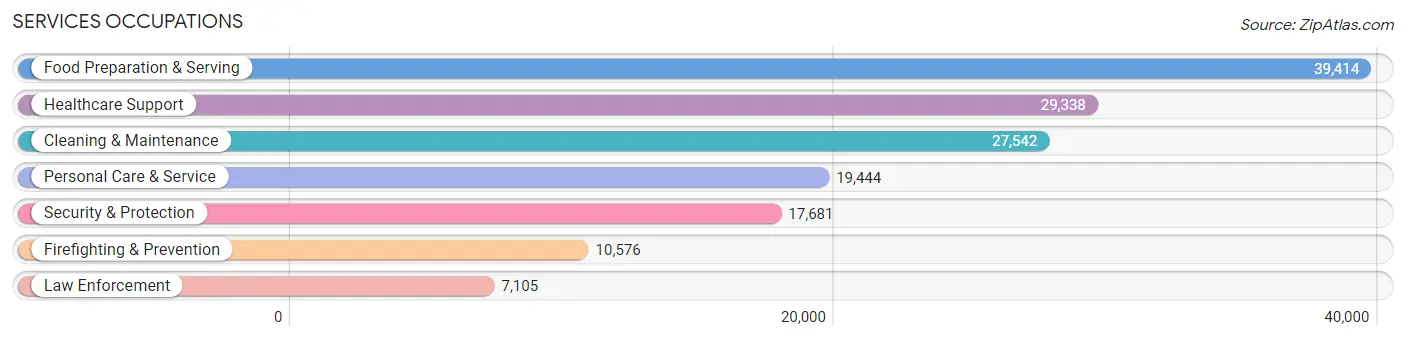
Services Occupations
The most common Services occupations in Area Code 707 are Food Preparation & Serving (39,414 | 5.7%), Healthcare Support (29,338 | 4.3%), Cleaning & Maintenance (27,542 | 4.0%), Personal Care & Service (19,444 | 2.8%), and Security & Protection (17,681 | 2.6%).
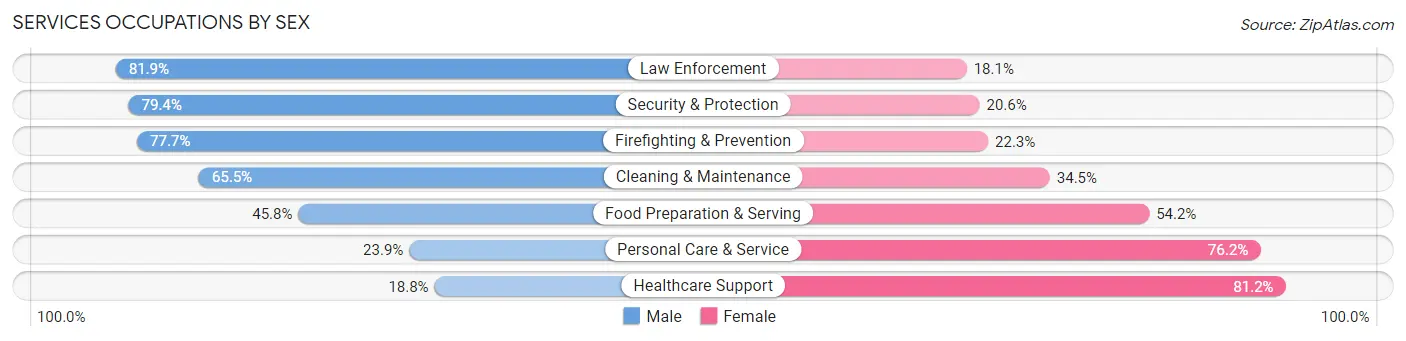
Services Occupations by Sex
Within the Services occupations in Area Code 707, the most male-oriented occupations are Law Enforcement (81.9%), Security & Protection (79.4%), and Firefighting & Prevention (77.7%), while the most female-oriented occupations are Healthcare Support (81.2%), Personal Care & Service (76.1%), and Food Preparation & Serving (54.2%).
| Occupation | Male | Female |
| Healthcare Support | 5,528 (18.8%) | 23,810 (81.2%) |
| Security & Protection | 14,041 (79.4%) | 3,640 (20.6%) |
| Firefighting & Prevention | 8,219 (77.7%) | 2,357 (22.3%) |
| Law Enforcement | 5,822 (81.9%) | 1,283 (18.1%) |
| Food Preparation & Serving | 18,054 (45.8%) | 21,360 (54.2%) |
| Cleaning & Maintenance | 18,034 (65.5%) | 9,508 (34.5%) |
| Personal Care & Service | 4,637 (23.8%) | 14,807 (76.1%) |
| Total (Category) | 60,294 (45.2%) | 73,125 (54.8%) |
| Total (Overall) | 363,262 (52.6%) | 327,471 (47.4%) |
Sales and Office Occupations
The most common Sales and Office occupations in Area Code 707 are Office & Administration (73,892 | 10.7%), and Sales & Related (68,691 | 9.9%).
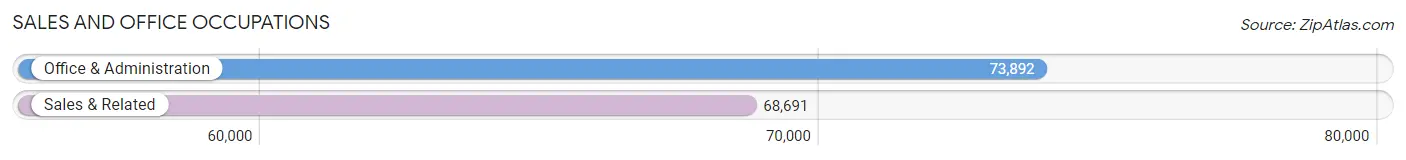
Sales and Office Occupations by Sex
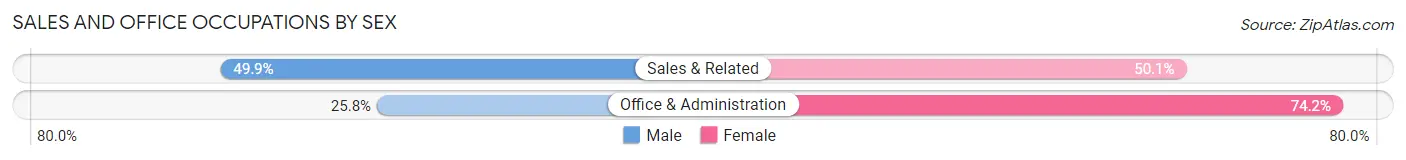
| Occupation | Male | Female |
| Sales & Related | 34,262 (49.9%) | 34,429 (50.1%) |
| Office & Administration | 19,064 (25.8%) | 54,828 (74.2%) |
| Total (Category) | 53,326 (37.4%) | 89,257 (62.6%) |
| Total (Overall) | 363,262 (52.6%) | 327,471 (47.4%) |
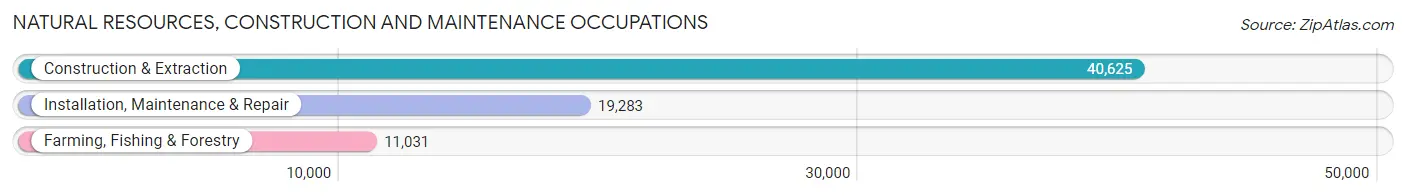
Natural Resources, Construction and Maintenance Occupations
The most common Natural Resources, Construction and Maintenance occupations in Area Code 707 are Construction & Extraction (40,625 | 5.9%), Installation, Maintenance & Repair (19,283 | 2.8%), and Farming, Fishing & Forestry (11,031 | 1.6%).
Natural Resources, Construction and Maintenance Occupations by Sex
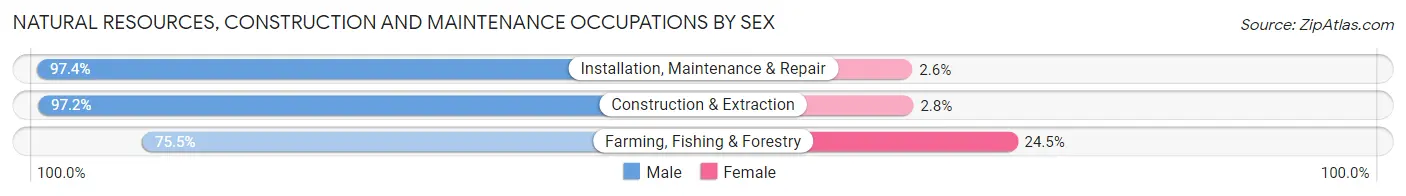
| Occupation | Male | Female |
| Farming, Fishing & Forestry | 8,332 (75.5%) | 2,699 (24.5%) |
| Construction & Extraction | 39,479 (97.2%) | 1,146 (2.8%) |
| Installation, Maintenance & Repair | 18,781 (97.4%) | 502 (2.6%) |
| Total (Category) | 66,592 (93.9%) | 4,347 (6.1%) |
| Total (Overall) | 363,262 (52.6%) | 327,471 (47.4%) |
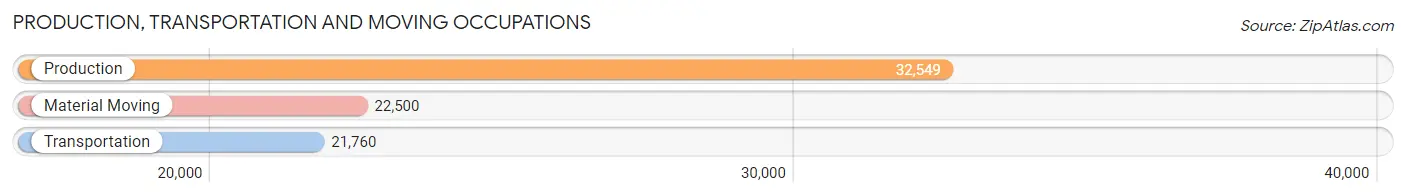
Production, Transportation and Moving Occupations
The most common Production, Transportation and Moving occupations in Area Code 707 are Production (32,549 | 4.7%), Material Moving (22,500 | 3.3%), and Transportation (21,760 | 3.2%).
Production, Transportation and Moving Occupations by Sex
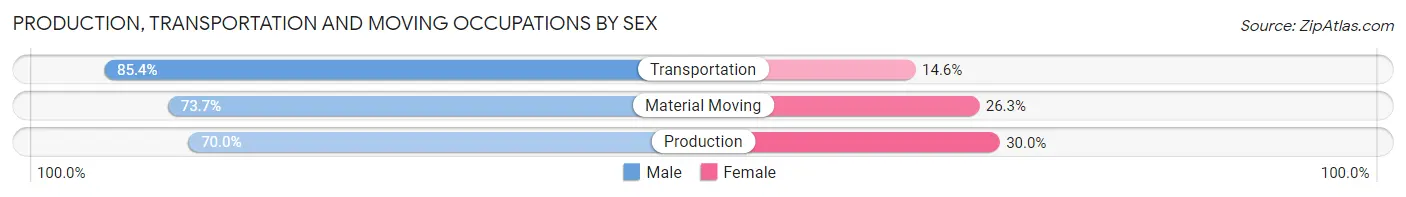
| Occupation | Male | Female |
| Production | 22,774 (70.0%) | 9,775 (30.0%) |
| Transportation | 18,583 (85.4%) | 3,177 (14.6%) |
| Material Moving | 16,587 (73.7%) | 5,913 (26.3%) |
| Total (Category) | 57,944 (75.4%) | 18,865 (24.6%) |
| Total (Overall) | 363,262 (52.6%) | 327,471 (47.4%) |
Employment Industries by Sex in Area Code 707
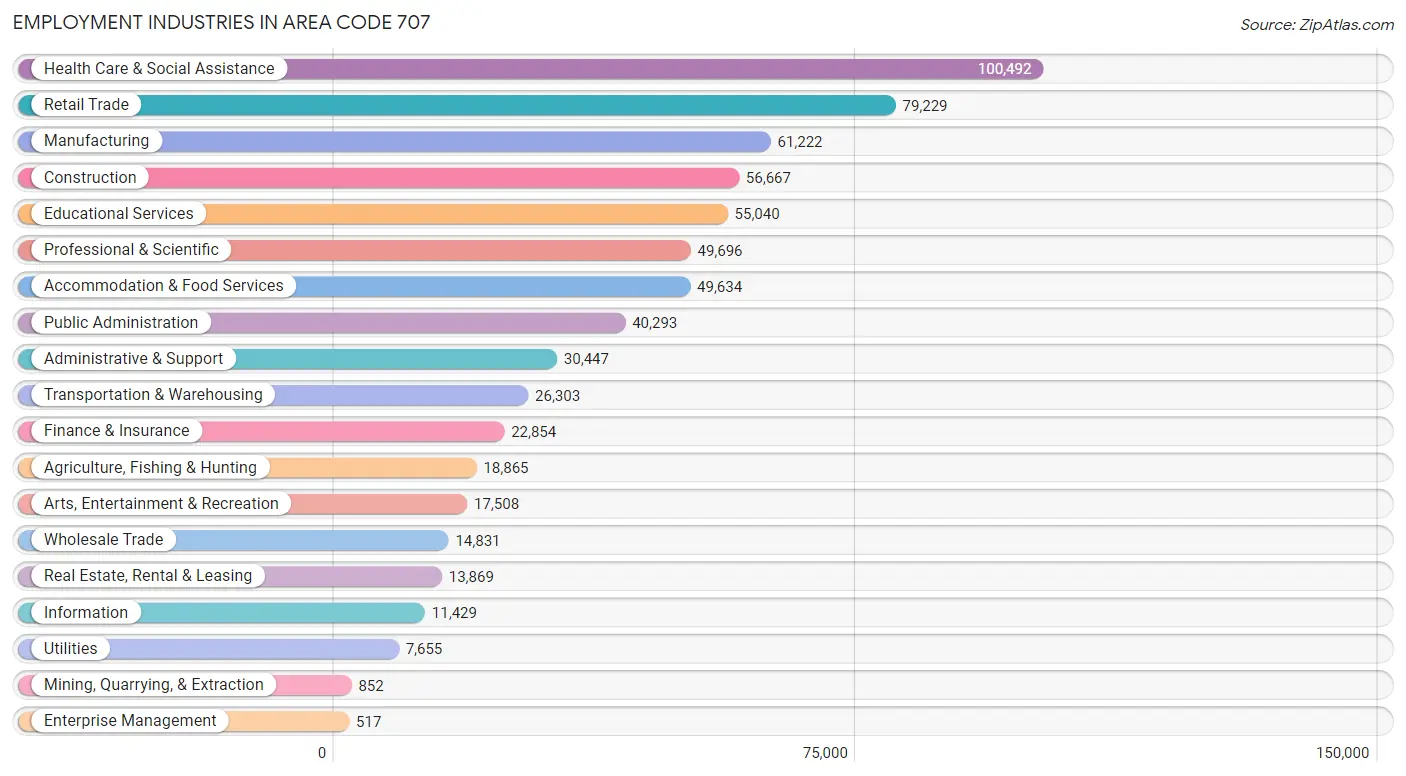
Employment Industries in Area Code 707
The major employment industries in Area Code 707 include Health Care & Social Assistance (100,492 | 14.5%), Retail Trade (79,229 | 11.5%), Manufacturing (61,222 | 8.9%), Construction (56,667 | 8.2%), and Educational Services (55,040 | 8.0%).
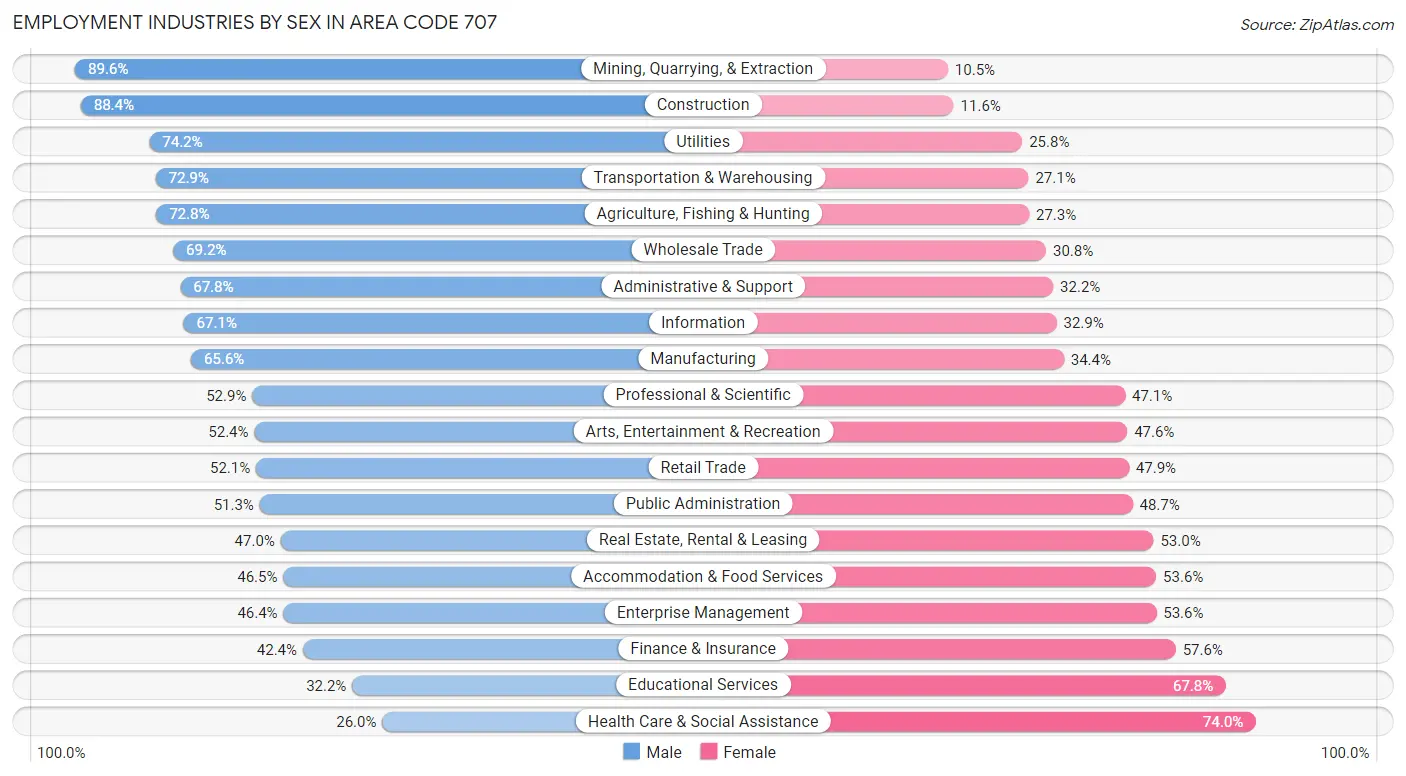
Employment Industries by Sex in Area Code 707
The Area Code 707 industries that see more men than women are Mining, Quarrying, & Extraction (89.5%), Construction (88.4%), and Utilities (74.2%), whereas the industries that tend to have a higher number of women are Health Care & Social Assistance (74.0%), Educational Services (67.8%), and Finance & Insurance (57.6%).
| Industry | Male | Female |
| Agriculture, Fishing & Hunting | 13,724 (72.8%) | 5,141 (27.3%) |
| Mining, Quarrying, & Extraction | 763 (89.5%) | 89 (10.4%) |
| Construction | 50,069 (88.4%) | 6,598 (11.6%) |
| Manufacturing | 40,137 (65.6%) | 21,085 (34.4%) |
| Wholesale Trade | 10,269 (69.2%) | 4,562 (30.8%) |
| Retail Trade | 41,271 (52.1%) | 37,958 (47.9%) |
| Transportation & Warehousing | 19,167 (72.9%) | 7,136 (27.1%) |
| Utilities | 5,678 (74.2%) | 1,977 (25.8%) |
| Information | 7,666 (67.1%) | 3,763 (32.9%) |
| Finance & Insurance | 9,691 (42.4%) | 13,163 (57.6%) |
| Real Estate, Rental & Leasing | 6,519 (47.0%) | 7,350 (53.0%) |
| Professional & Scientific | 26,278 (52.9%) | 23,418 (47.1%) |
| Enterprise Management | 240 (46.4%) | 277 (53.6%) |
| Administrative & Support | 20,631 (67.8%) | 9,816 (32.2%) |
| Educational Services | 17,715 (32.2%) | 37,325 (67.8%) |
| Health Care & Social Assistance | 26,083 (26.0%) | 74,409 (74.0%) |
| Arts, Entertainment & Recreation | 9,182 (52.4%) | 8,326 (47.6%) |
| Accommodation & Food Services | 23,056 (46.5%) | 26,578 (53.5%) |
| Public Administration | 20,685 (51.3%) | 19,608 (48.7%) |
| Total | 363,262 (52.6%) | 327,471 (47.4%) |
Education in Area Code 707
School Enrollment in Area Code 707
The most common levels of schooling among the 333,086 students in Area Code 707 are college / undergraduate (80,077 | 24.0%), high school (73,345 | 22.0%), and middle school (65,745 | 19.7%).
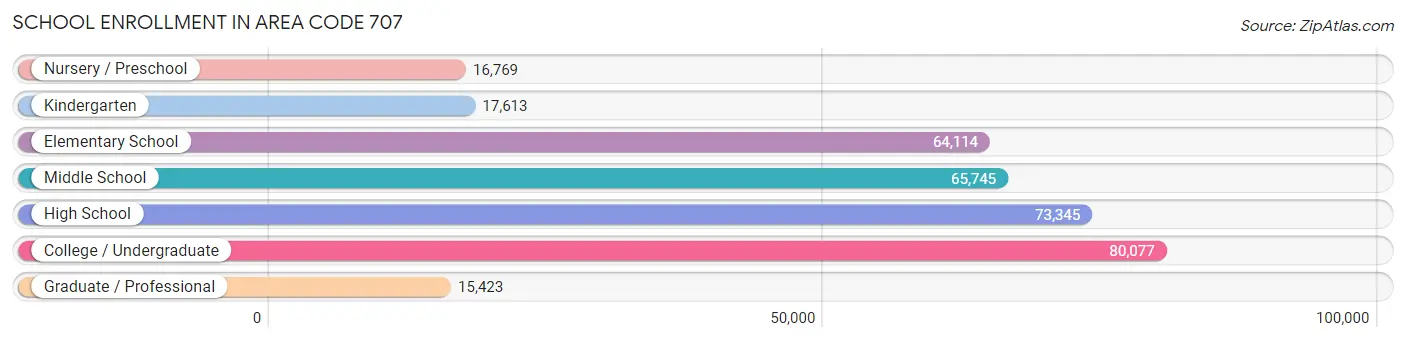
| School Level | # Students | % Students |
| Nursery / Preschool | 16,769 | 5.0% |
| Kindergarten | 17,613 | 5.3% |
| Elementary School | 64,114 | 19.3% |
| Middle School | 65,745 | 19.7% |
| High School | 73,345 | 22.0% |
| College / Undergraduate | 80,077 | 24.0% |
| Graduate / Professional | 15,423 | 4.6% |
| Total | 333,086 | 100.0% |
School Enrollment by Age by Funding Source in Area Code 707
Out of a total of 333,086 students who are enrolled in schools in Area Code 707, 43,278 (13.0%) attend a private institution, while the remaining 289,808 (87.0%) are enrolled in public schools. The age group of 3 to 4 year olds has the highest likelihood of being enrolled in private schools, with 6,858 (49.4% in the age bracket) enrolled. Conversely, the age group of 15 to 17 year olds has the lowest likelihood of being enrolled in a private school, with 46,791 (92.2% in the age bracket) attending a public institution.
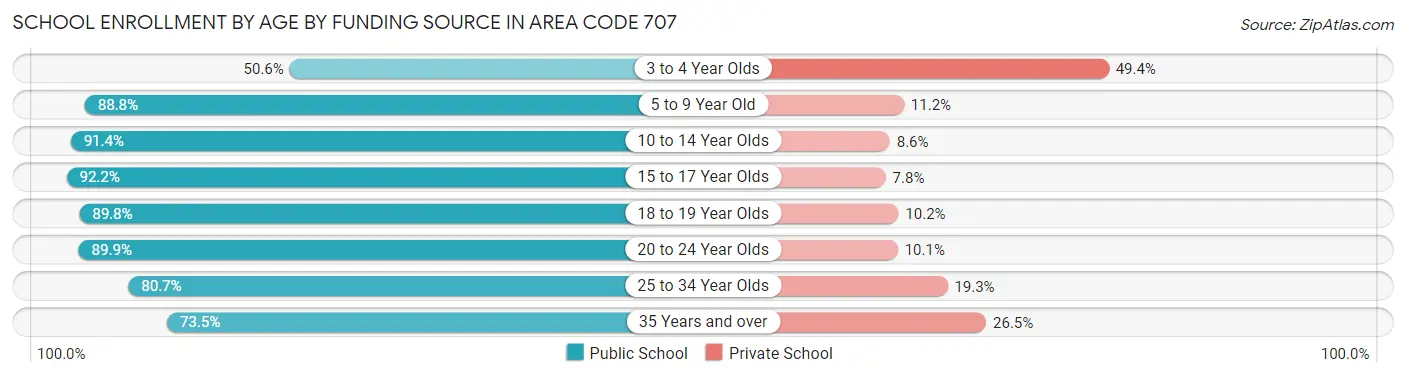
| Age Bracket | Public School | Private School |
| 3 to 4 Year Olds | 7,036 (50.6%) | 6,858 (49.4%) |
| 5 to 9 Year Old | 68,512 (88.8%) | 8,661 (11.2%) |
| 10 to 14 Year Olds | 76,885 (91.4%) | 7,227 (8.6%) |
| 15 to 17 Year Olds | 46,791 (92.2%) | 3,971 (7.8%) |
| 18 to 19 Year Olds | 22,228 (89.8%) | 2,526 (10.2%) |
| 20 to 24 Year Olds | 33,491 (89.9%) | 3,752 (10.1%) |
| 25 to 34 Year Olds | 18,939 (80.7%) | 4,538 (19.3%) |
| 35 Years and over | 15,921 (73.5%) | 5,750 (26.5%) |
| Total | 289,808 (87.0%) | 43,278 (13.0%) |
Educational Attainment by Field of Study in Area Code 707
Business (60,063 | 15.8%), social sciences (41,900 | 11.0%), science & technology (35,680 | 9.4%), bio, nature & agricultural (34,296 | 9.0%), and liberal arts & history (25,309 | 6.7%) are the most common fields of study among 380,824 individuals in Area Code 707 who have obtained a bachelor's degree or higher.
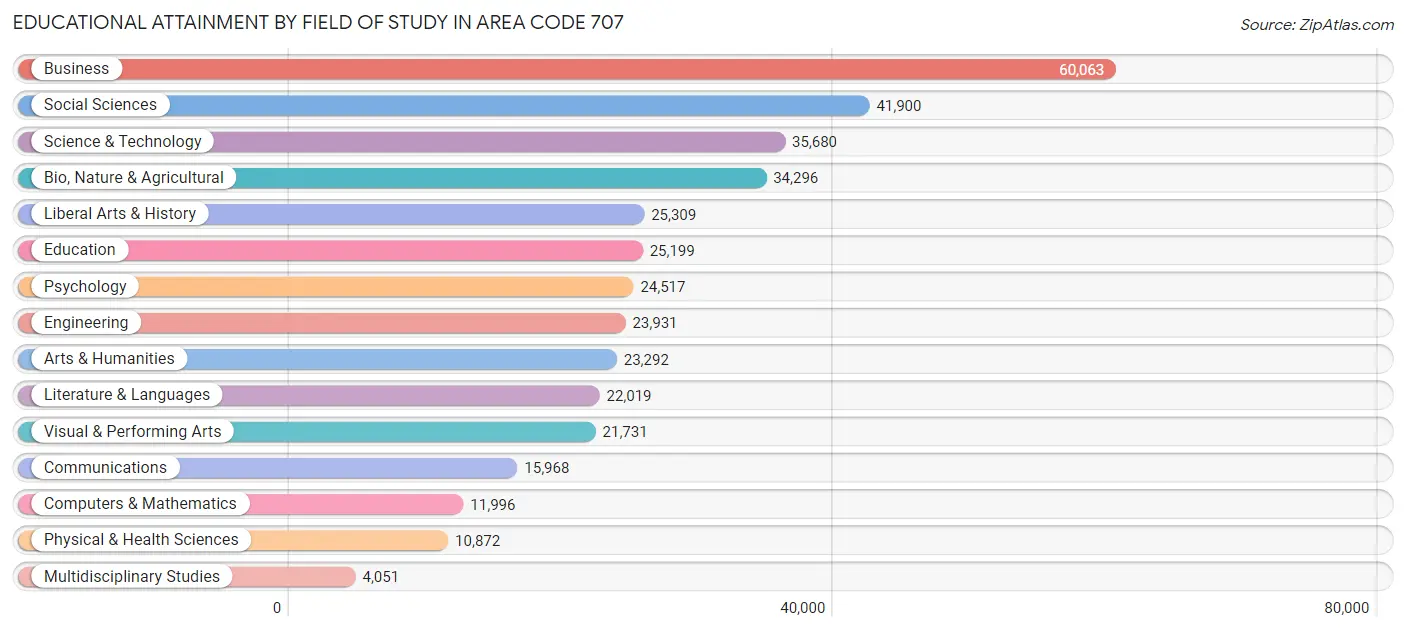
| Field of Study | # Graduates | % Graduates |
| Computers & Mathematics | 11,996 | 3.2% |
| Bio, Nature & Agricultural | 34,296 | 9.0% |
| Physical & Health Sciences | 10,872 | 2.9% |
| Psychology | 24,517 | 6.4% |
| Social Sciences | 41,900 | 11.0% |
| Engineering | 23,931 | 6.3% |
| Multidisciplinary Studies | 4,051 | 1.1% |
| Science & Technology | 35,680 | 9.4% |
| Business | 60,063 | 15.8% |
| Education | 25,199 | 6.6% |
| Literature & Languages | 22,019 | 5.8% |
| Liberal Arts & History | 25,309 | 6.7% |
| Visual & Performing Arts | 21,731 | 5.7% |
| Communications | 15,968 | 4.2% |
| Arts & Humanities | 23,292 | 6.1% |
| Total | 380,824 | 100.0% |
Transportation & Commute in Area Code 707
Vehicle Availability by Sex in Area Code 707
The most prevalent vehicle ownership categories in Area Code 707 are males with 2 vehicles (133,877, accounting for 37.7%) and females with 2 vehicles (114,142, making up 42.4%).
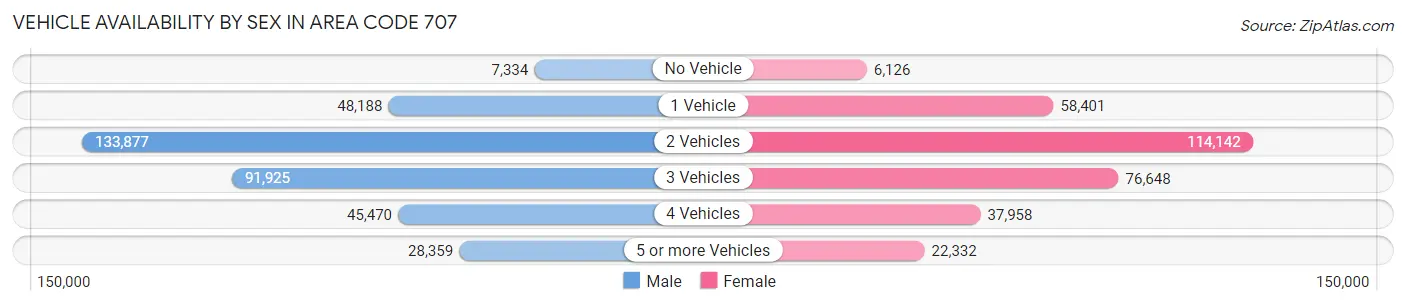
| Vehicles Available | Male | Female |
| No Vehicle | 7,334 (2.1%) | 6,126 (1.9%) |
| 1 Vehicle | 48,188 (13.6%) | 58,401 (18.5%) |
| 2 Vehicles | 133,877 (37.7%) | 114,142 (36.2%) |
| 3 Vehicles | 91,925 (25.9%) | 76,648 (24.3%) |
| 4 Vehicles | 45,470 (12.8%) | 37,958 (12.0%) |
| 5 or more Vehicles | 28,359 (8.0%) | 22,332 (7.1%) |
| Total | 355,153 (100.0%) | 315,607 (100.0%) |
Commute Time in Area Code 707
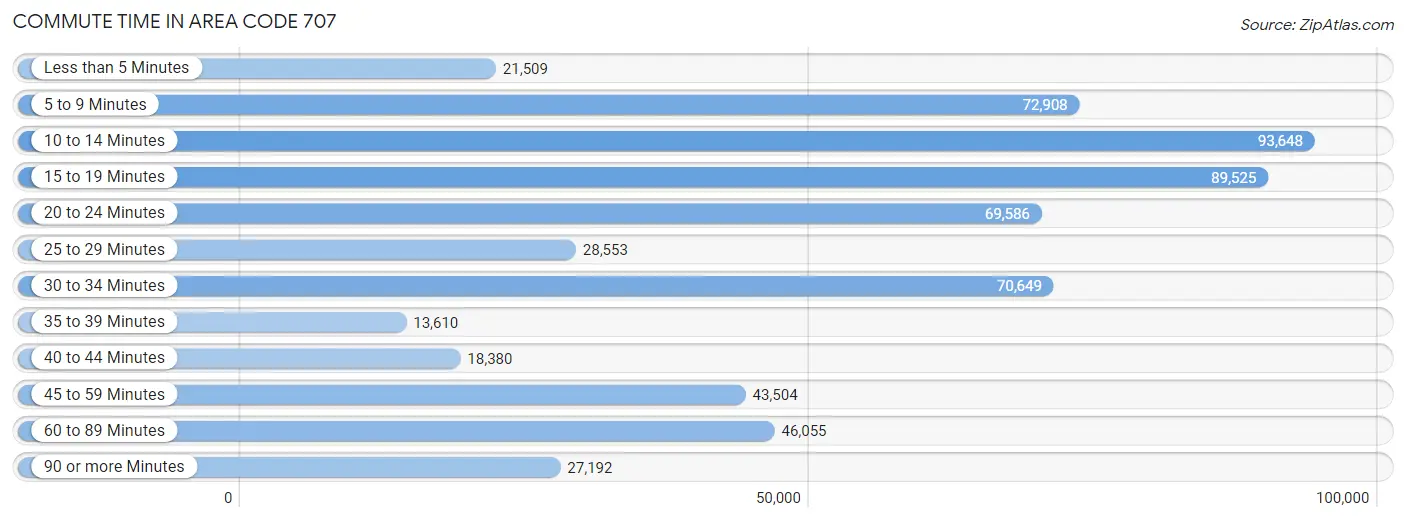
The most frequently occuring commute durations in Area Code 707 are 10 to 14 minutes (93,648 commuters, 15.7%), 15 to 19 minutes (89,525 commuters, 15.0%), and 5 to 9 minutes (72,908 commuters, 12.2%).
| Commute Time | # Commuters | % Commuters |
| Less than 5 Minutes | 21,509 | 3.6% |
| 5 to 9 Minutes | 72,908 | 12.2% |
| 10 to 14 Minutes | 93,648 | 15.7% |
| 15 to 19 Minutes | 89,525 | 15.0% |
| 20 to 24 Minutes | 69,586 | 11.7% |
| 25 to 29 Minutes | 28,553 | 4.8% |
| 30 to 34 Minutes | 70,649 | 11.9% |
| 35 to 39 Minutes | 13,610 | 2.3% |
| 40 to 44 Minutes | 18,380 | 3.1% |
| 45 to 59 Minutes | 43,504 | 7.3% |
| 60 to 89 Minutes | 46,055 | 7.7% |
| 90 or more Minutes | 27,192 | 4.6% |
Commute Time by Sex in Area Code 707
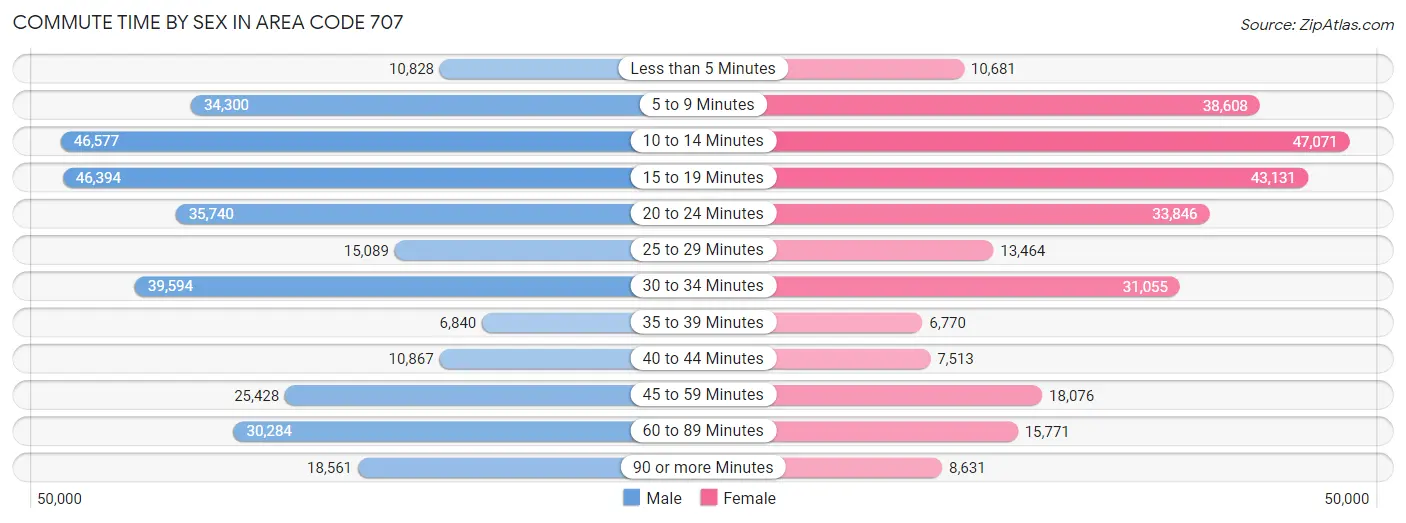
The most common commute times in Area Code 707 are 10 to 14 minutes (46,577 commuters, 14.5%) for males and 10 to 14 minutes (47,071 commuters, 17.1%) for females.
| Commute Time | Male | Female |
| Less than 5 Minutes | 10,828 (3.4%) | 10,681 (3.9%) |
| 5 to 9 Minutes | 34,300 (10.7%) | 38,608 (14.1%) |
| 10 to 14 Minutes | 46,577 (14.5%) | 47,071 (17.1%) |
| 15 to 19 Minutes | 46,394 (14.5%) | 43,131 (15.7%) |
| 20 to 24 Minutes | 35,740 (11.2%) | 33,846 (12.3%) |
| 25 to 29 Minutes | 15,089 (4.7%) | 13,464 (4.9%) |
| 30 to 34 Minutes | 39,594 (12.3%) | 31,055 (11.3%) |
| 35 to 39 Minutes | 6,840 (2.1%) | 6,770 (2.5%) |
| 40 to 44 Minutes | 10,867 (3.4%) | 7,513 (2.7%) |
| 45 to 59 Minutes | 25,428 (7.9%) | 18,076 (6.6%) |
| 60 to 89 Minutes | 30,284 (9.5%) | 15,771 (5.7%) |
| 90 or more Minutes | 18,561 (5.8%) | 8,631 (3.1%) |
Time of Departure to Work by Sex in Area Code 707
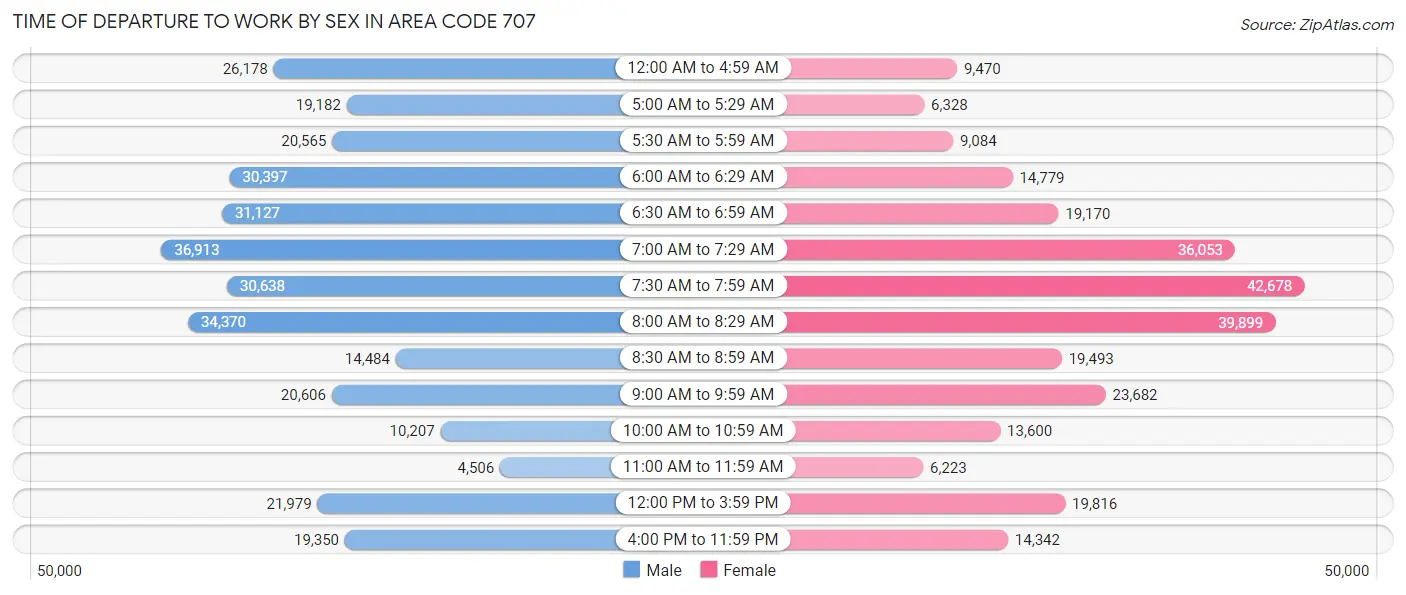
The most frequent times of departure to work in Area Code 707 are 7:00 AM to 7:29 AM (36,913, 11.5%) for males and 7:30 AM to 7:59 AM (42,678, 15.5%) for females.
| Time of Departure | Male | Female |
| 12:00 AM to 4:59 AM | 26,178 (8.2%) | 9,470 (3.5%) |
| 5:00 AM to 5:29 AM | 19,182 (6.0%) | 6,328 (2.3%) |
| 5:30 AM to 5:59 AM | 20,565 (6.4%) | 9,084 (3.3%) |
| 6:00 AM to 6:29 AM | 30,397 (9.5%) | 14,779 (5.4%) |
| 6:30 AM to 6:59 AM | 31,127 (9.7%) | 19,170 (7.0%) |
| 7:00 AM to 7:29 AM | 36,913 (11.5%) | 36,053 (13.1%) |
| 7:30 AM to 7:59 AM | 30,638 (9.6%) | 42,678 (15.5%) |
| 8:00 AM to 8:29 AM | 34,370 (10.7%) | 39,899 (14.5%) |
| 8:30 AM to 8:59 AM | 14,484 (4.5%) | 19,493 (7.1%) |
| 9:00 AM to 9:59 AM | 20,606 (6.4%) | 23,682 (8.6%) |
| 10:00 AM to 10:59 AM | 10,207 (3.2%) | 13,600 (5.0%) |
| 11:00 AM to 11:59 AM | 4,506 (1.4%) | 6,223 (2.3%) |
| 12:00 PM to 3:59 PM | 21,979 (6.9%) | 19,816 (7.2%) |
| 4:00 PM to 11:59 PM | 19,350 (6.0%) | 14,342 (5.2%) |
| Total | 320,502 (100.0%) | 274,617 (100.0%) |
Housing Occupancy in Area Code 707
Occupancy by Ownership in Area Code 707
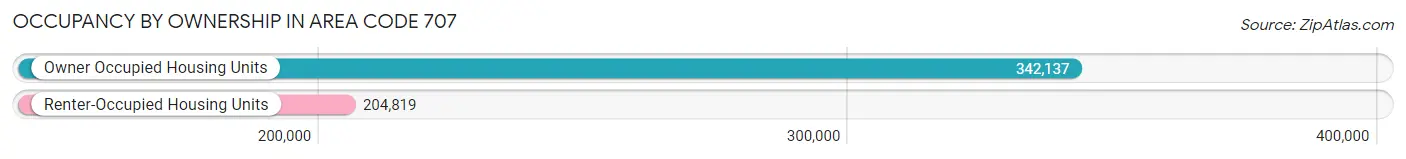
Of the total 546,956 dwellings in Area Code 707, owner-occupied units account for 342,137 (62.5%), while renter-occupied units make up 204,819 (37.4%).
| Occupancy | # Housing Units | % Housing Units |
| Owner Occupied Housing Units | 342,137 | 62.5% |
| Renter-Occupied Housing Units | 204,819 | 37.4% |
| Total Occupied Housing Units | 546,956 | 100.0% |
Occupancy by Household Size in Area Code 707
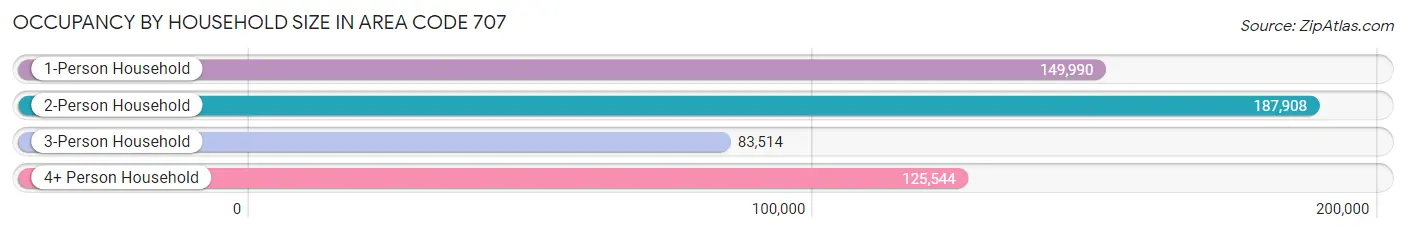
| Household Size | # Housing Units | % Housing Units |
| 1-Person Household | 149,990 | 27.4% |
| 2-Person Household | 187,908 | 34.4% |
| 3-Person Household | 83,514 | 15.3% |
| 4+ Person Household | 125,544 | 23.0% |
| Total Housing Units | 546,956 | 100.0% |
Occupancy by Ownership by Household Size in Area Code 707
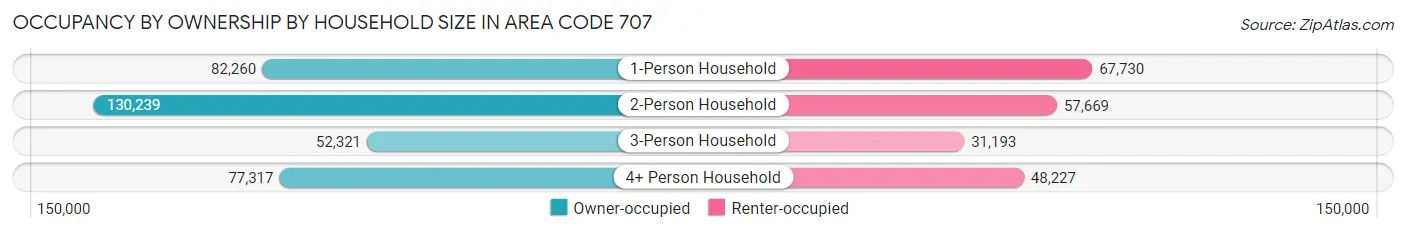
| Household Size | Owner-occupied | Renter-occupied |
| 1-Person Household | 82,260 (54.8%) | 67,730 (45.2%) |
| 2-Person Household | 130,239 (69.3%) | 57,669 (30.7%) |
| 3-Person Household | 52,321 (62.6%) | 31,193 (37.3%) |
| 4+ Person Household | 77,317 (61.6%) | 48,227 (38.4%) |
| Total Housing Units | 342,137 (62.5%) | 204,819 (37.4%) |
Occupancy by Educational Attainment in Area Code 707
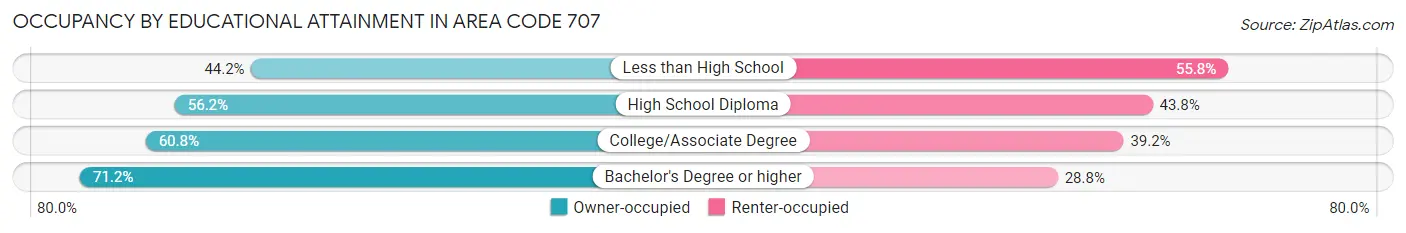
| Household Size | Owner-occupied | Renter-occupied |
| Less than High School | 19,927 (44.2%) | 25,182 (55.8%) |
| High School Diploma | 52,708 (56.2%) | 41,142 (43.8%) |
| College/Associate Degree | 122,477 (60.8%) | 79,037 (39.2%) |
| Bachelor's Degree or higher | 147,025 (71.2%) | 59,458 (28.8%) |
Occupancy by Age of Householder in Area Code 707
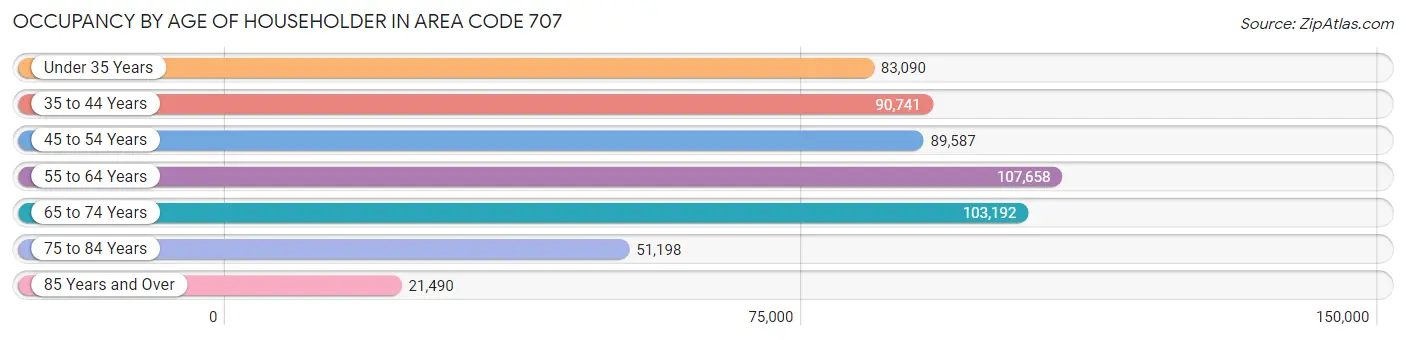
| Age Bracket | # Households | % Households |
| Under 35 Years | 83,090 | 15.2% |
| 35 to 44 Years | 90,741 | 16.6% |
| 45 to 54 Years | 89,587 | 16.4% |
| 55 to 64 Years | 107,658 | 19.7% |
| 65 to 74 Years | 103,192 | 18.9% |
| 75 to 84 Years | 51,198 | 9.4% |
| 85 Years and Over | 21,490 | 3.9% |
| Total | 546,956 | 100.0% |
Housing Finances in Area Code 707
Median Income by Occupancy in Area Code 707
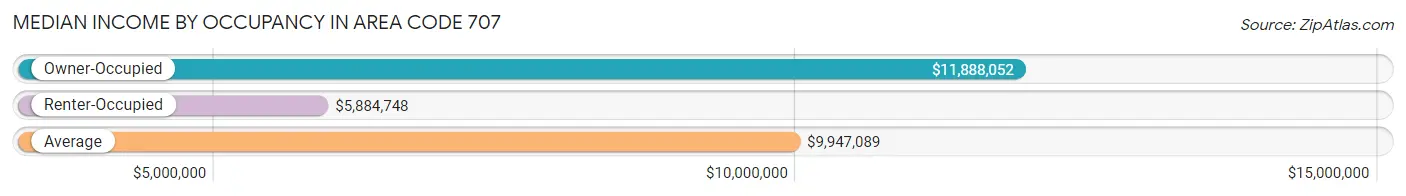
| Occupancy Type | # Households | Median Income |
| Owner-Occupied | 342,137 (62.5%) | $11,888,052 |
| Renter-Occupied | 204,819 (37.4%) | $5,884,748 |
| Average | 546,956 (100.0%) | $9,947,089 |
Occupancy by Householder Income Bracket in Area Code 707
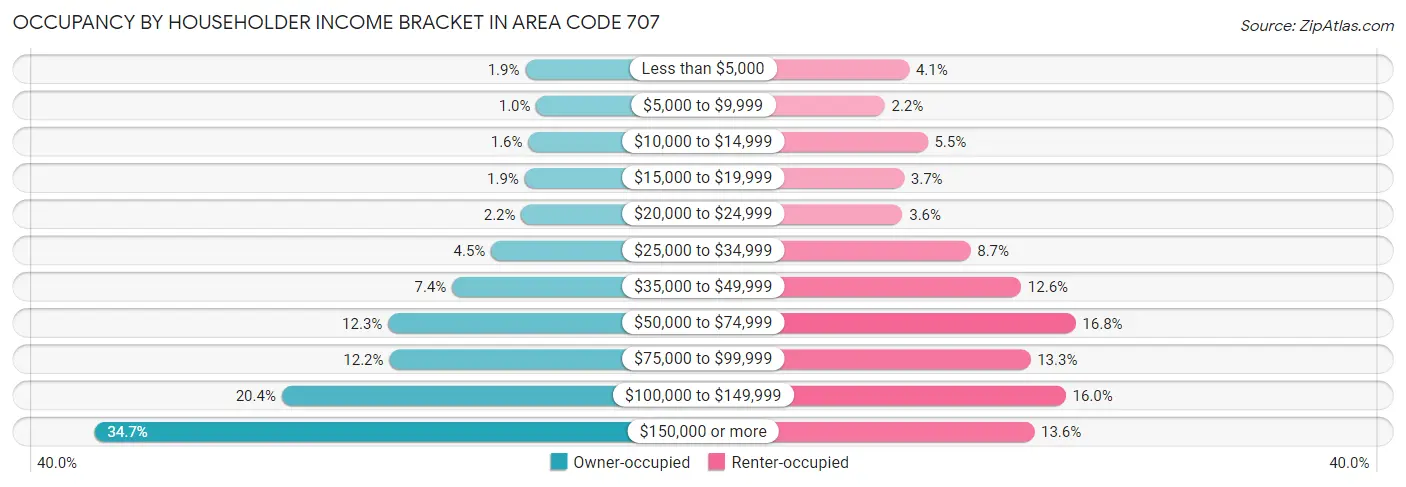
| Income Bracket | Owner-occupied | Renter-occupied |
| Less than $5,000 | 6,337 (1.8%) | 8,342 (4.1%) |
| $5,000 to $9,999 | 3,447 (1.0%) | 4,528 (2.2%) |
| $10,000 to $14,999 | 5,538 (1.6%) | 11,230 (5.5%) |
| $15,000 to $19,999 | 6,513 (1.9%) | 7,533 (3.7%) |
| $20,000 to $24,999 | 7,347 (2.1%) | 7,285 (3.6%) |
| $25,000 to $34,999 | 15,231 (4.4%) | 17,901 (8.7%) |
| $35,000 to $49,999 | 25,407 (7.4%) | 25,799 (12.6%) |
| $50,000 to $74,999 | 42,077 (12.3%) | 34,303 (16.8%) |
| $75,000 to $99,999 | 41,765 (12.2%) | 27,270 (13.3%) |
| $100,000 to $149,999 | 69,829 (20.4%) | 32,773 (16.0%) |
| $150,000 or more | 118,646 (34.7%) | 27,855 (13.6%) |
| Total | 342,137 (100.0%) | 204,819 (100.0%) |
Monthly Housing Cost Tiers in Area Code 707
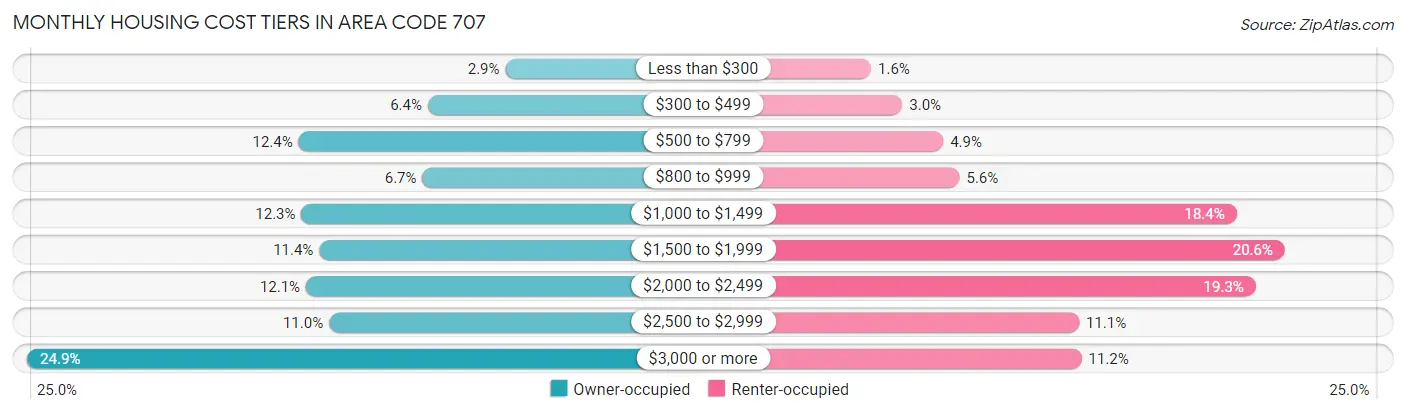
| Monthly Cost | Owner-occupied | Renter-occupied |
| Less than $300 | 9,836 (2.9%) | 3,167 (1.5%) |
| $300 to $499 | 22,017 (6.4%) | 6,129 (3.0%) |
| $500 to $799 | 42,374 (12.4%) | 9,981 (4.9%) |
| $800 to $999 | 22,901 (6.7%) | 11,508 (5.6%) |
| $1,000 to $1,499 | 41,953 (12.3%) | 37,635 (18.4%) |
| $1,500 to $1,999 | 39,140 (11.4%) | 42,181 (20.6%) |
| $2,000 to $2,499 | 41,220 (12.0%) | 39,426 (19.3%) |
| $2,500 to $2,999 | 37,588 (11.0%) | 22,781 (11.1%) |
| $3,000 or more | 85,108 (24.9%) | 23,017 (11.2%) |
| Total | 342,137 (100.0%) | 204,819 (100.0%) |
Physical Housing Characteristics in Area Code 707
Housing Structures in Area Code 707
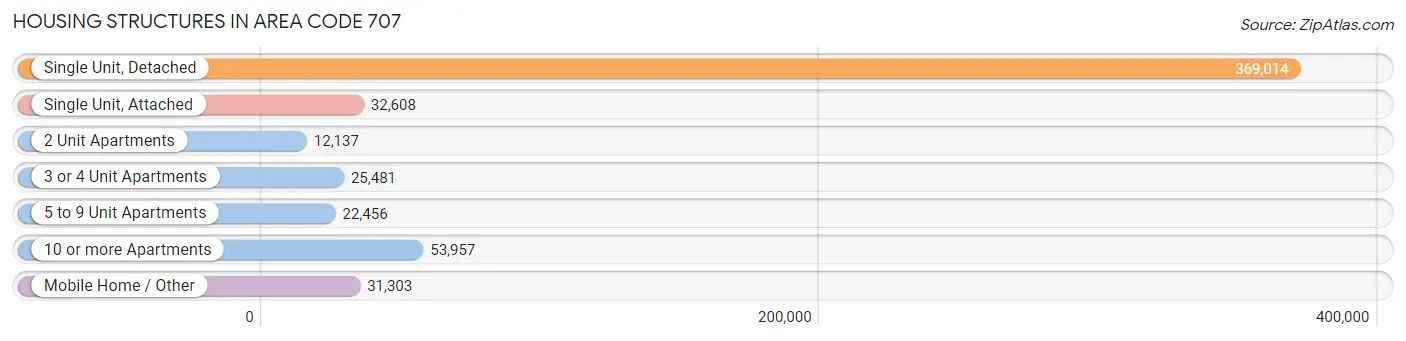
| Structure Type | # Housing Units | % Housing Units |
| Single Unit, Detached | 369,014 | 67.5% |
| Single Unit, Attached | 32,608 | 6.0% |
| 2 Unit Apartments | 12,137 | 2.2% |
| 3 or 4 Unit Apartments | 25,481 | 4.7% |
| 5 to 9 Unit Apartments | 22,456 | 4.1% |
| 10 or more Apartments | 53,957 | 9.9% |
| Mobile Home / Other | 31,303 | 5.7% |
| Total | 546,956 | 100.0% |
Housing Structures by Occupancy in Area Code 707
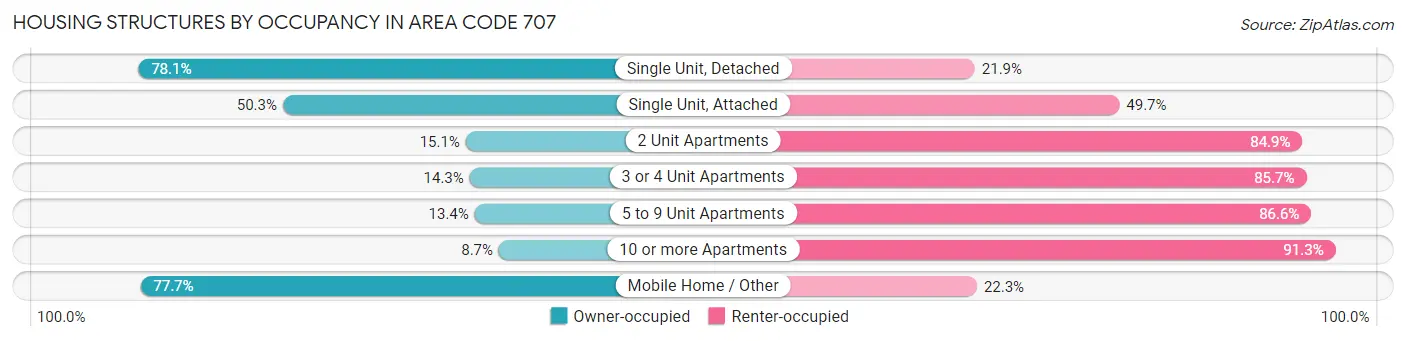
| Structure Type | Owner-occupied | Renter-occupied |
| Single Unit, Detached | 288,248 (78.1%) | 80,766 (21.9%) |
| Single Unit, Attached | 16,400 (50.3%) | 16,208 (49.7%) |
| 2 Unit Apartments | 1,829 (15.1%) | 10,308 (84.9%) |
| 3 or 4 Unit Apartments | 3,650 (14.3%) | 21,831 (85.7%) |
| 5 to 9 Unit Apartments | 3,000 (13.4%) | 19,456 (86.6%) |
| 10 or more Apartments | 4,683 (8.7%) | 49,274 (91.3%) |
| Mobile Home / Other | 24,327 (77.7%) | 6,976 (22.3%) |
| Total | 342,137 (62.5%) | 204,819 (37.4%) |
Housing Structures by Number of Rooms in Area Code 707
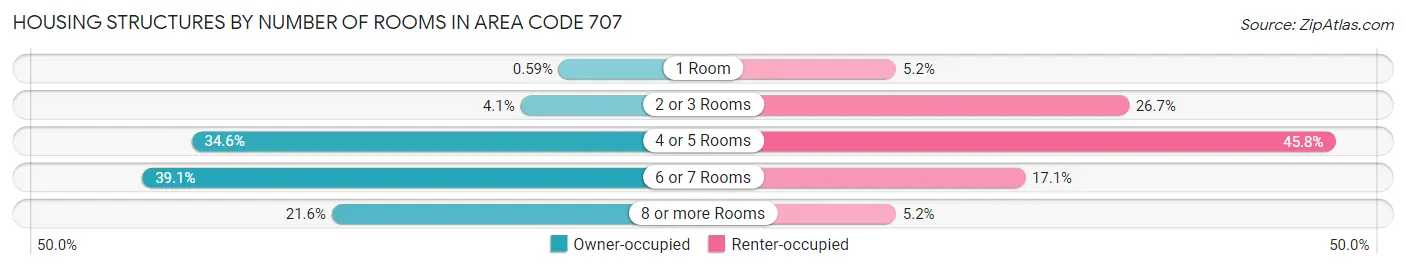
| Number of Rooms | Owner-occupied | Renter-occupied |
| 1 Room | 2,011 (0.6%) | 10,644 (5.2%) |
| 2 or 3 Rooms | 14,175 (4.1%) | 54,700 (26.7%) |
| 4 or 5 Rooms | 118,247 (34.6%) | 93,847 (45.8%) |
| 6 or 7 Rooms | 133,829 (39.1%) | 35,046 (17.1%) |
| 8 or more Rooms | 73,875 (21.6%) | 10,582 (5.2%) |
| Total | 342,137 (100.0%) | 204,819 (100.0%) |
Housing Structure by Heating Type in Area Code 707
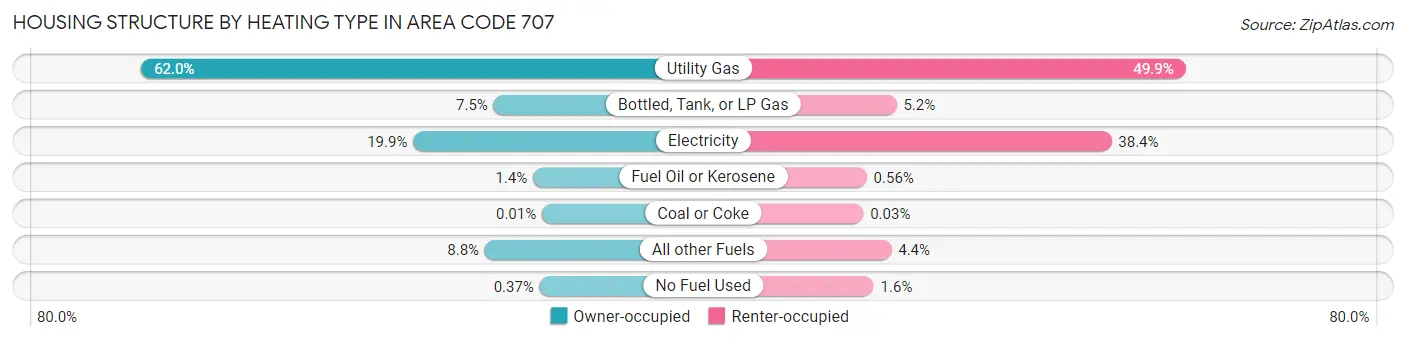
| Heating Type | Owner-occupied | Renter-occupied |
| Utility Gas | 212,022 (62.0%) | 102,111 (49.8%) |
| Bottled, Tank, or LP Gas | 25,627 (7.5%) | 10,599 (5.2%) |
| Electricity | 68,144 (19.9%) | 78,624 (38.4%) |
| Fuel Oil or Kerosene | 4,804 (1.4%) | 1,146 (0.6%) |
| Coal or Coke | 38 (0.0%) | 52 (0.0%) |
| All other Fuels | 30,253 (8.8%) | 8,923 (4.4%) |
| No Fuel Used | 1,249 (0.4%) | 3,364 (1.6%) |
| Total | 342,137 (100.0%) | 204,819 (100.0%) |
Household Vehicle Usage in Area Code 707
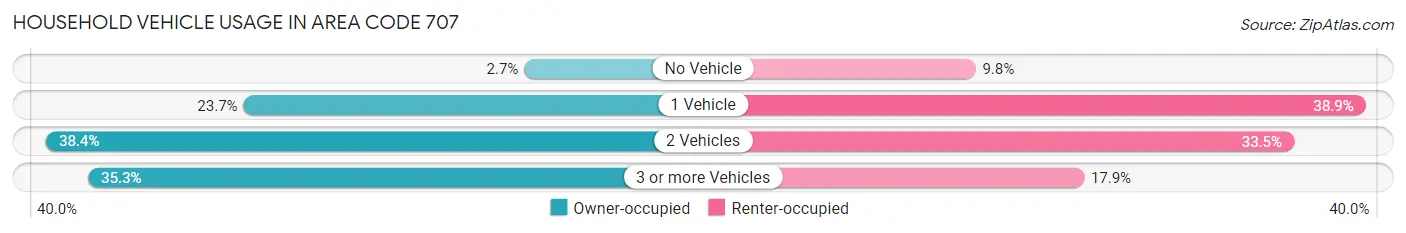
| Vehicles per Household | Owner-occupied | Renter-occupied |
| No Vehicle | 9,220 (2.7%) | 19,965 (9.8%) |
| 1 Vehicle | 80,955 (23.7%) | 79,629 (38.9%) |
| 2 Vehicles | 131,360 (38.4%) | 68,661 (33.5%) |
| 3 or more Vehicles | 120,602 (35.2%) | 36,564 (17.8%) |
| Total | 342,137 (100.0%) | 204,819 (100.0%) |
Real Estate & Mortgages in Area Code 707
Real Estate and Mortgage Overview in Area Code 707
| Characteristic | Without Mortgage | With Mortgage |
| Housing Units | 122,119 | 220,018 |
| Median Property Value | $63,777,302 | $70,625,701 |
| Median Household Income | $8,225,971 | $91,557 |
| Monthly Housing Costs | $82,938 | $83,753 |
| Real Estate Taxes | $381,894 | $4,117 |
Property Value by Mortgage Status in Area Code 707
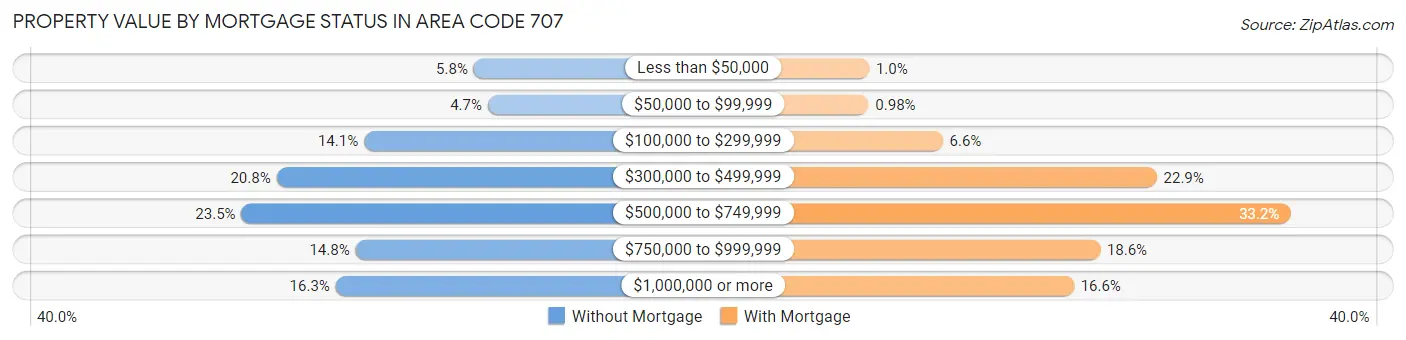
| Property Value | Without Mortgage | With Mortgage |
| Less than $50,000 | 7,054 (5.8%) | 2,254 (1.0%) |
| $50,000 to $99,999 | 5,750 (4.7%) | 2,159 (1.0%) |
| $100,000 to $299,999 | 17,263 (14.1%) | 14,583 (6.6%) |
| $300,000 to $499,999 | 25,419 (20.8%) | 50,475 (22.9%) |
| $500,000 to $749,999 | 28,673 (23.5%) | 73,015 (33.2%) |
| $750,000 to $999,999 | 18,059 (14.8%) | 40,966 (18.6%) |
| $1,000,000 or more | 19,901 (16.3%) | 36,566 (16.6%) |
| Total | 122,119 (100.0%) | 220,018 (100.0%) |
Household Income by Mortgage Status in Area Code 707
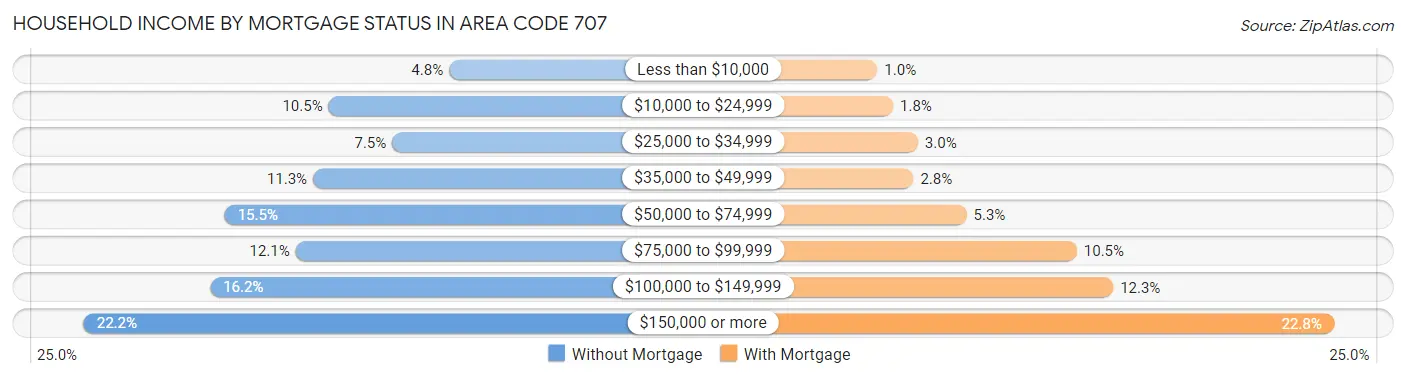
| Household Income | Without Mortgage | With Mortgage |
| Less than $10,000 | 5,852 (4.8%) | 2,279 (1.0%) |
| $10,000 to $24,999 | 12,854 (10.5%) | 3,932 (1.8%) |
| $25,000 to $34,999 | 9,163 (7.5%) | 6,544 (3.0%) |
| $35,000 to $49,999 | 13,765 (11.3%) | 6,068 (2.8%) |
| $50,000 to $74,999 | 18,887 (15.5%) | 11,642 (5.3%) |
| $75,000 to $99,999 | 14,775 (12.1%) | 23,190 (10.5%) |
| $100,000 to $149,999 | 19,734 (16.2%) | 26,990 (12.3%) |
| $150,000 or more | 27,089 (22.2%) | 50,095 (22.8%) |
| Total | 122,119 (100.0%) | 220,018 (100.0%) |
Property Value to Household Income Ratio in Area Code 707
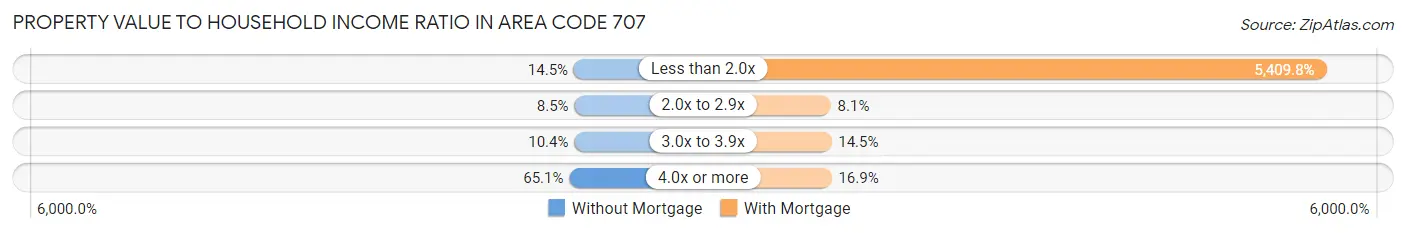
| Value-to-Income Ratio | Without Mortgage | With Mortgage |
| Less than 2.0x | 17,643 (14.4%) | 11,902,515 (5,409.8%) |
| 2.0x to 2.9x | 10,383 (8.5%) | 17,863 (8.1%) |
| 3.0x to 3.9x | 12,737 (10.4%) | 31,975 (14.5%) |
| 4.0x or more | 79,505 (65.1%) | 37,233 (16.9%) |
| Total | 122,119 (100.0%) | 220,018 (100.0%) |
Real Estate Taxes by Mortgage Status in Area Code 707
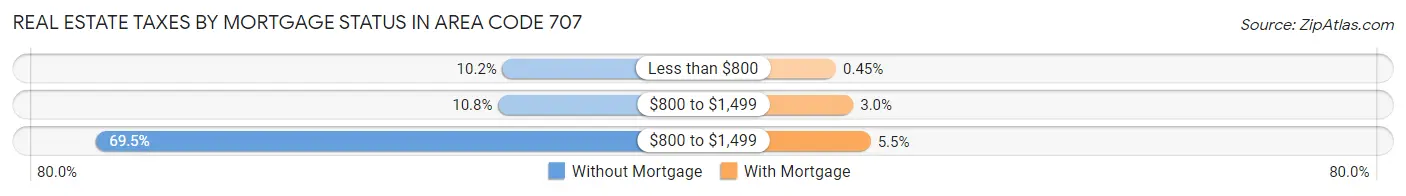
| Property Taxes | Without Mortgage | With Mortgage |
| Less than $800 | 12,391 (10.2%) | 998 (0.4%) |
| $800 to $1,499 | 13,179 (10.8%) | 6,503 (3.0%) |
| $800 to $1,499 | 84,879 (69.5%) | 12,094 (5.5%) |
| Total | 122,119 (100.0%) | 220,018 (100.0%) |
Health & Disability in Area Code 707
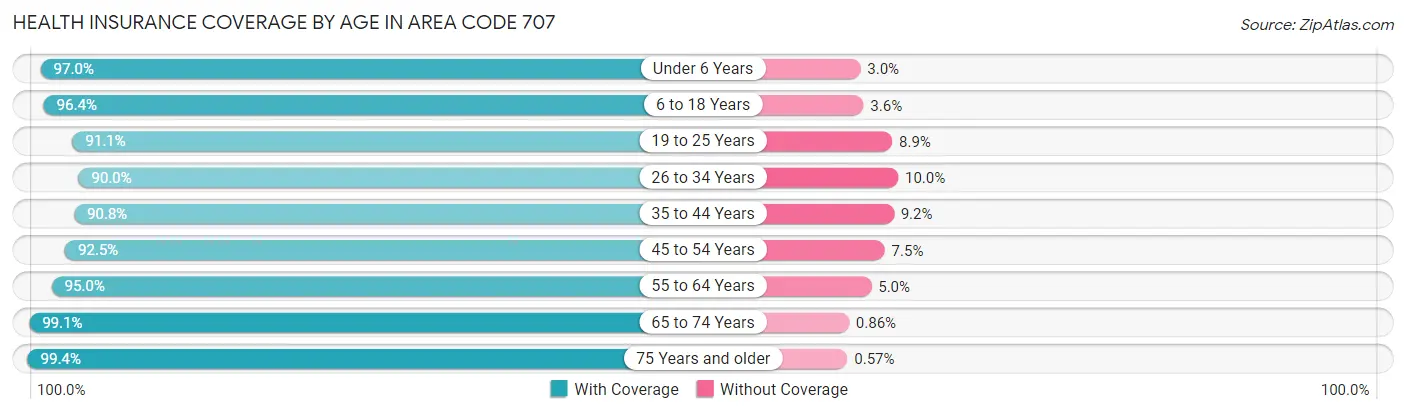
Health Insurance Coverage by Age in Area Code 707
| Age Bracket | With Coverage | Without Coverage |
| Under 6 Years | 87,466 (97.0%) | 2,698 (3.0%) |
| 6 to 18 Years | 215,198 (96.4%) | 7,939 (3.6%) |
| 19 to 25 Years | 109,163 (91.1%) | 10,679 (8.9%) |
| 26 to 34 Years | 148,107 (90.0%) | 16,503 (10.0%) |
| 35 to 44 Years | 166,894 (90.8%) | 16,940 (9.2%) |
| 45 to 54 Years | 161,654 (92.5%) | 13,157 (7.5%) |
| 55 to 64 Years | 185,951 (95.0%) | 9,839 (5.0%) |
| 65 to 74 Years | 170,442 (99.1%) | 1,484 (0.9%) |
| 75 Years and older | 111,886 (99.4%) | 644 (0.6%) |
| Total | 1,356,761 (94.4%) | 79,883 (5.6%) |
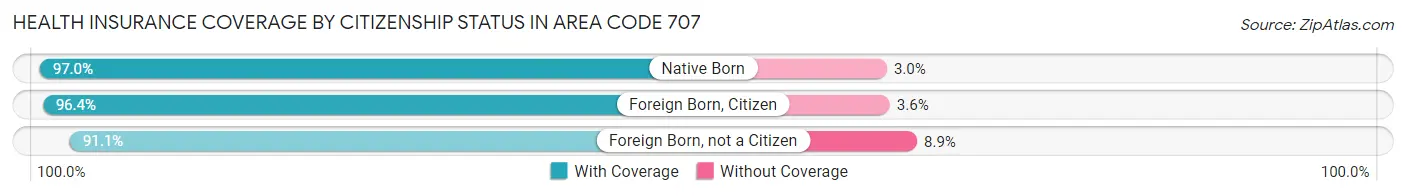
Health Insurance Coverage by Citizenship Status in Area Code 707
| Citizenship Status | With Coverage | Without Coverage |
| Native Born | 87,466 (97.0%) | 2,698 (3.0%) |
| Foreign Born, Citizen | 215,198 (96.4%) | 7,939 (3.6%) |
| Foreign Born, not a Citizen | 109,163 (91.1%) | 10,679 (8.9%) |
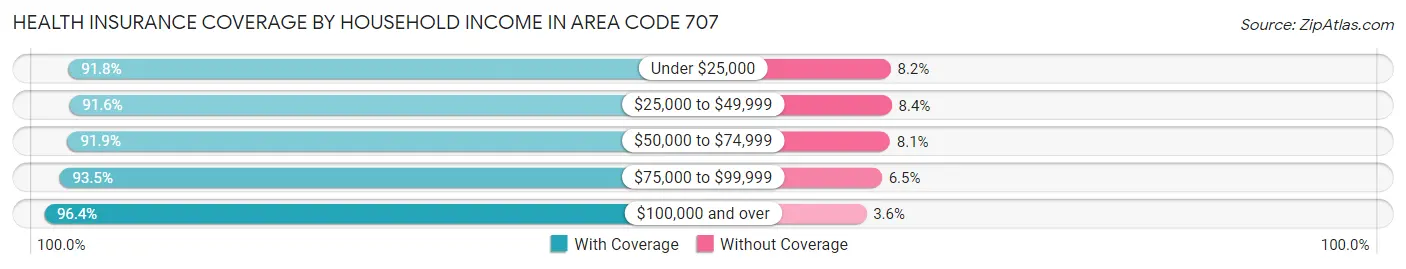
Health Insurance Coverage by Household Income in Area Code 707
| Household Income | With Coverage | Without Coverage |
| Under $25,000 | 103,075 (91.8%) | 9,199 (8.2%) |
| $25,000 to $49,999 | 162,918 (91.6%) | 14,937 (8.4%) |
| $50,000 to $74,999 | 169,082 (91.9%) | 14,824 (8.1%) |
| $75,000 to $99,999 | 171,904 (93.5%) | 12,037 (6.5%) |
| $100,000 and over | 733,119 (96.4%) | 27,603 (3.6%) |
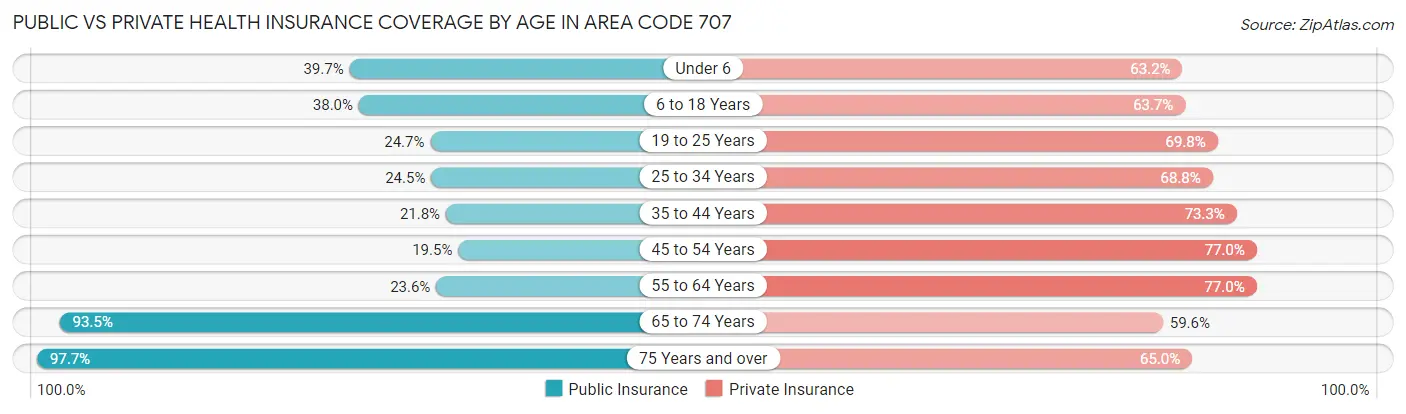
Public vs Private Health Insurance Coverage by Age in Area Code 707
| Age Bracket | Public Insurance | Private Insurance |
| Under 6 | 35,795 (39.7%) | 57,001 (63.2%) |
| 6 to 18 Years | 84,694 (38.0%) | 142,202 (63.7%) |
| 19 to 25 Years | 29,592 (24.7%) | 83,595 (69.8%) |
| 25 to 34 Years | 40,370 (24.5%) | 113,288 (68.8%) |
| 35 to 44 Years | 40,056 (21.8%) | 134,737 (73.3%) |
| 45 to 54 Years | 34,111 (19.5%) | 134,641 (77.0%) |
| 55 to 64 Years | 46,209 (23.6%) | 150,727 (77.0%) |
| 65 to 74 Years | 160,790 (93.5%) | 102,425 (59.6%) |
| 75 Years and over | 109,951 (97.7%) | 73,158 (65.0%) |
| Total | 581,568 (40.5%) | 991,774 (69.0%) |
Disability Status by Sex by Age in Area Code 707
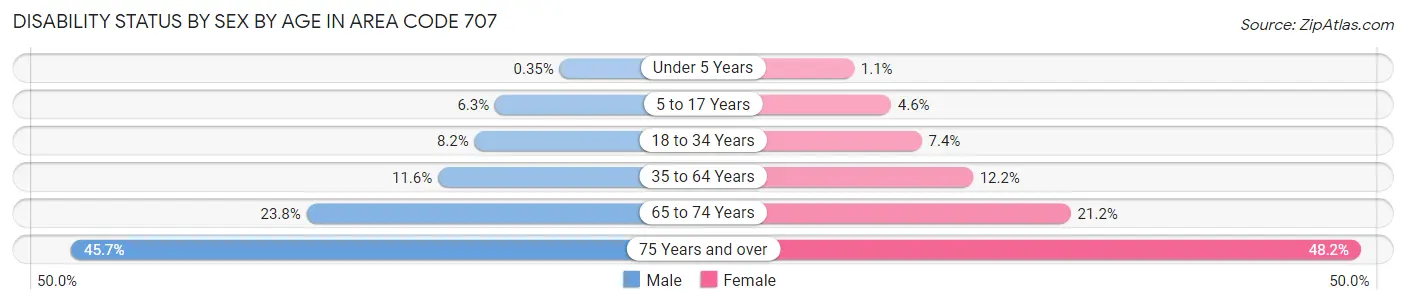
| Age Bracket | Male | Female |
| Under 5 Years | 134 (0.4%) | 412 (1.1%) |
| 5 to 17 Years | 7,148 (6.3%) | 4,880 (4.5%) |
| 18 to 34 Years | 12,642 (8.2%) | 11,105 (7.4%) |
| 35 to 64 Years | 31,974 (11.6%) | 33,961 (12.1%) |
| 65 to 74 Years | 19,189 (23.8%) | 19,418 (21.2%) |
| 75 Years and over | 21,728 (45.7%) | 31,291 (48.2%) |
Disability Class by Sex by Age in Area Code 707
Disability Class: Hearing Difficulty
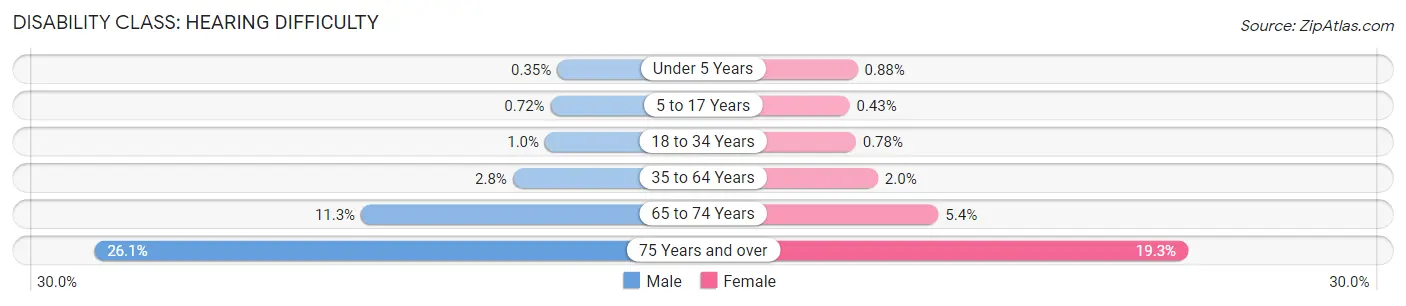
| Age Bracket | Male | Female |
| Under 5 Years | 134 (0.4%) | 324 (0.9%) |
| 5 to 17 Years | 814 (0.7%) | 463 (0.4%) |
| 18 to 34 Years | 1,584 (1.0%) | 1,173 (0.8%) |
| 35 to 64 Years | 7,753 (2.8%) | 5,609 (2.0%) |
| 65 to 74 Years | 9,073 (11.3%) | 4,917 (5.4%) |
| 75 Years and over | 12,425 (26.1%) | 12,516 (19.3%) |
Disability Class: Vision Difficulty
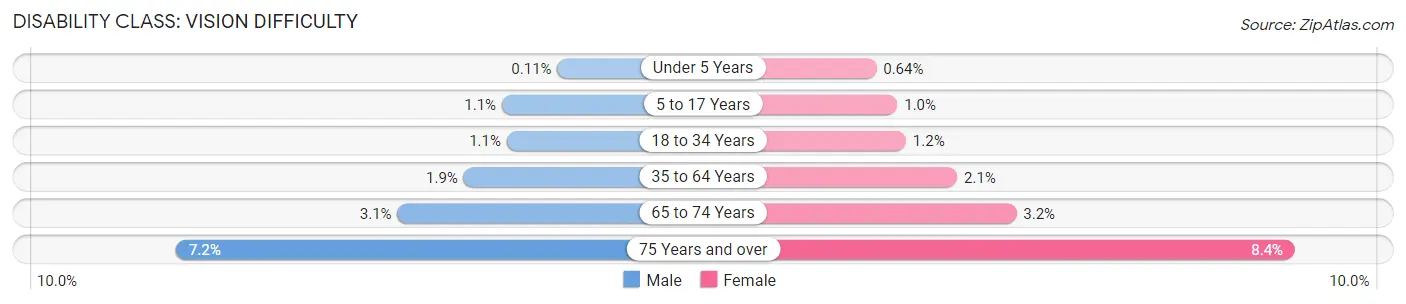
| Age Bracket | Male | Female |
| Under 5 Years | 42 (0.1%) | 235 (0.6%) |
| 5 to 17 Years | 1,285 (1.1%) | 1,103 (1.0%) |
| 18 to 34 Years | 1,604 (1.1%) | 1,776 (1.2%) |
| 35 to 64 Years | 5,093 (1.8%) | 5,975 (2.1%) |
| 65 to 74 Years | 2,479 (3.1%) | 2,958 (3.2%) |
| 75 Years and over | 3,420 (7.2%) | 5,465 (8.4%) |
Disability Class: Cognitive Difficulty
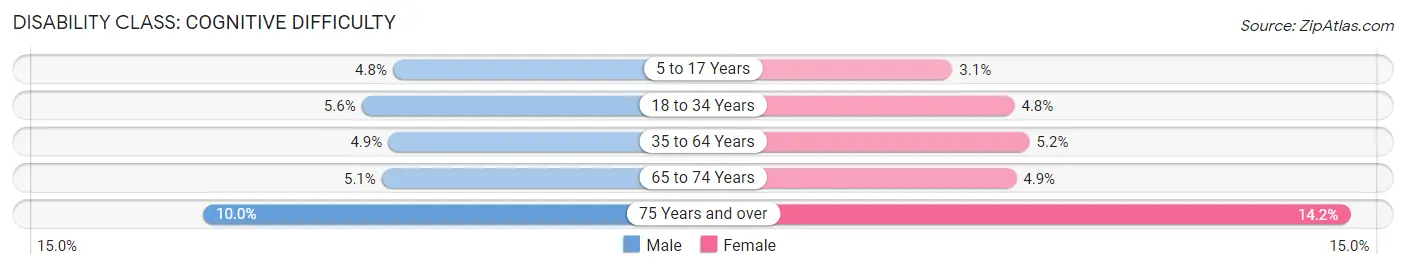
| Age Bracket | Male | Female |
| 5 to 17 Years | 5,353 (4.8%) | 3,302 (3.1%) |
| 18 to 34 Years | 8,625 (5.6%) | 7,204 (4.8%) |
| 35 to 64 Years | 13,430 (4.9%) | 14,616 (5.2%) |
| 65 to 74 Years | 4,076 (5.1%) | 4,441 (4.9%) |
| 75 Years and over | 4,772 (10.0%) | 9,189 (14.1%) |
Disability Class: Ambulatory Difficulty
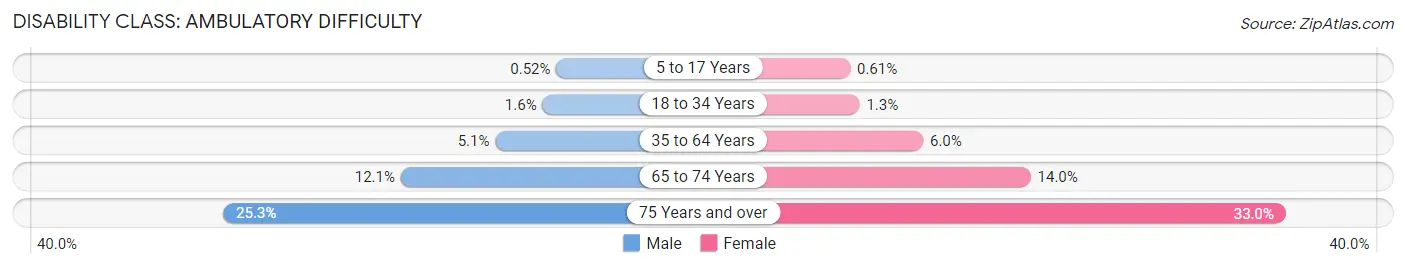
| Age Bracket | Male | Female |
| 5 to 17 Years | 586 (0.5%) | 660 (0.6%) |
| 18 to 34 Years | 2,376 (1.5%) | 1,962 (1.3%) |
| 35 to 64 Years | 13,892 (5.1%) | 16,856 (6.0%) |
| 65 to 74 Years | 9,722 (12.1%) | 12,812 (14.0%) |
| 75 Years and over | 12,017 (25.3%) | 21,413 (33.0%) |
Disability Class: Self-Care Difficulty
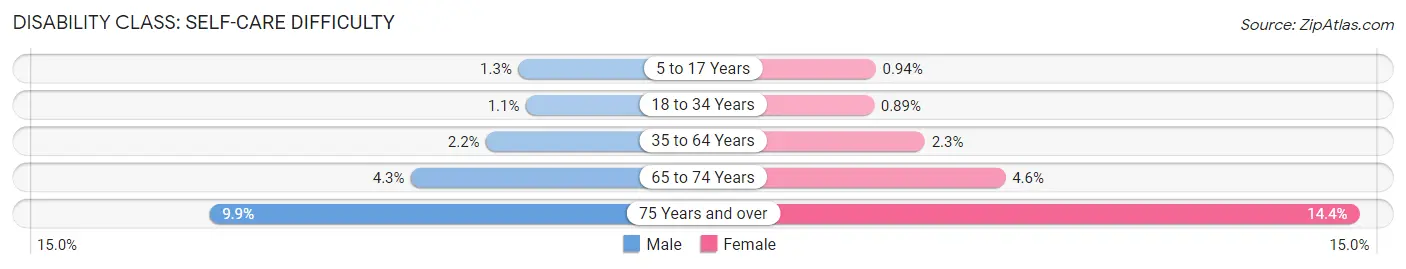
| Age Bracket | Male | Female |
| 5 to 17 Years | 1,427 (1.3%) | 1,008 (0.9%) |
| 18 to 34 Years | 1,619 (1.1%) | 1,332 (0.9%) |
| 35 to 64 Years | 5,970 (2.2%) | 6,450 (2.3%) |
| 65 to 74 Years | 3,431 (4.3%) | 4,156 (4.5%) |
| 75 Years and over | 4,690 (9.9%) | 9,363 (14.4%) |
Technology Access in Area Code 707
Computing Device Access in Area Code 707
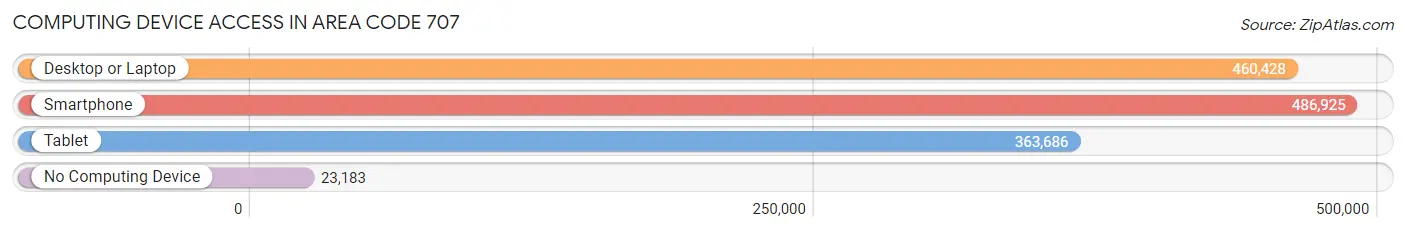
| Device Type | # Households | % Households |
| Desktop or Laptop | 460,428 | 84.2% |
| Smartphone | 486,925 | 89.0% |
| Tablet | 363,686 | 66.5% |
| No Computing Device | 23,183 | 4.2% |
| Total | 546,956 | 100.0% |
Internet Access in Area Code 707
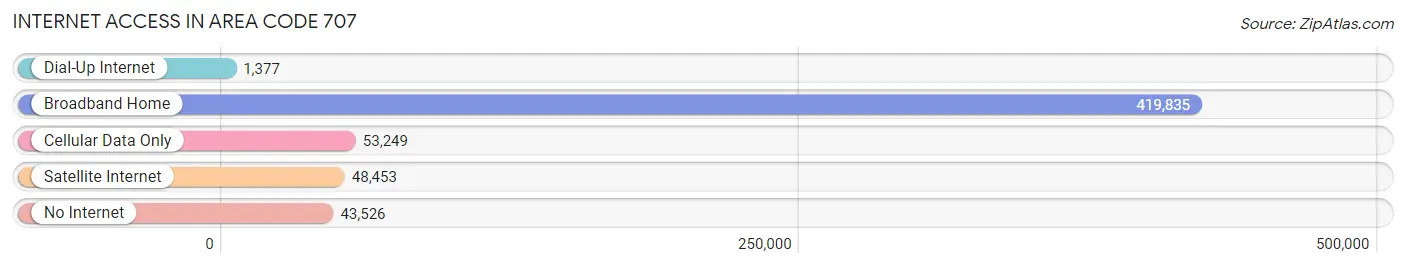
| Internet Type | # Households | % Households |
| Dial-Up Internet | 1,377 | 0.3% |
| Broadband Home | 419,835 | 76.8% |
| Cellular Data Only | 53,249 | 9.7% |
| Satellite Internet | 48,453 | 8.9% |
| No Internet | 43,526 | 8.0% |
| Total | 546,956 | 100.0% |
Area Code 707 Summary
Geography
Area code 707 is located in the northern part of California, covering the northern coast of the state from the Oregon border to the San Francisco Bay Area. It includes the cities of Eureka, Santa Rosa, Vallejo, Napa, and Fairfield.
Social
Area code 707 is home to a diverse population of people from all walks of life. The area is known for its vibrant arts and culture scene, with a variety of music, theater, and art venues. The area is also home to a number of wineries and vineyards, making it a popular destination for wine lovers.
Economics
Area code 707 is an important economic hub for the state of California. It is home to a number of major corporations, including the headquarters of the world-renowned wine company, Gallo. The area is also home to a number of tech companies, such as Apple, Google, and Oracle.
Demographics
Area code 707 is home to a diverse population of people from all walks of life. The population is predominantly white, with a significant Hispanic population. The median household income is slightly higher than the national average, and the unemployment rate is lower than the national average.
Common Questions
What is Per Capita Income in Area Code 707?
Per Capita income in Area Code 707 is $47,233.
What is the Median Family Income in Area Code 707?
Median Family Income in Area Code 707 is $109,266.
What is the Median Household income in Area Code 707?
Median Household Income in Area Code 707 is $85,018.
What is Income or Wage Gap in Area Code 707?
Income or Wage Gap in Area Code 707 is 26.9%.
Women in Area Code 707 earn 73.1 cents for every dollar earned by a man.
What is Family Income Deficit in Area Code 707?
Family Income Deficit in Area Code 707 is $10,967.
Families that are below poverty line in Area Code 707 earn $10,967 less on average than the poverty threshold level.
What is Inequality or Gini Index in Area Code 707?
Inequality or Gini Index in Area Code 707 is 58.21.
What is the Total Population of Area Code 707?
Total Population of Area Code 707 is 1,459,048.
What is the Total Male Population of Area Code 707?
Total Male Population of Area Code 707 is 724,336.
What is the Total Female Population of Area Code 707?
Total Female Population of Area Code 707 is 734,712.
What is the Ratio of Males per 100 Females in Area Code 707?
There are 98.59 Males per 100 Females in Area Code 707.
What is the Ratio of Females per 100 Males in Area Code 707?
There are 101.43 Females per 100 Males in Area Code 707.
What is the Median Population Age in Area Code 707?
Median Population Age in Area Code 707 is 46.2 Years.
What is the Average Family Size in Area Code 707
Average Family Size in Area Code 707 is 3.0 People.
What is the Average Household Size in Area Code 707
Average Household Size in Area Code 707 is 2.5 People.
How Large is the Labor Force in Area Code 707?
There are 693,732 People in the Labor Forcein in Area Code 707.
What is the Percentage of People in the Labor Force in Area Code 707?
57.8% of People are in the Labor Force in Area Code 707.
What is the Unemployment Rate in Area Code 707?
Unemployment Rate in Area Code 707 is 9.2%.