Area Code 626 Map & Demographics
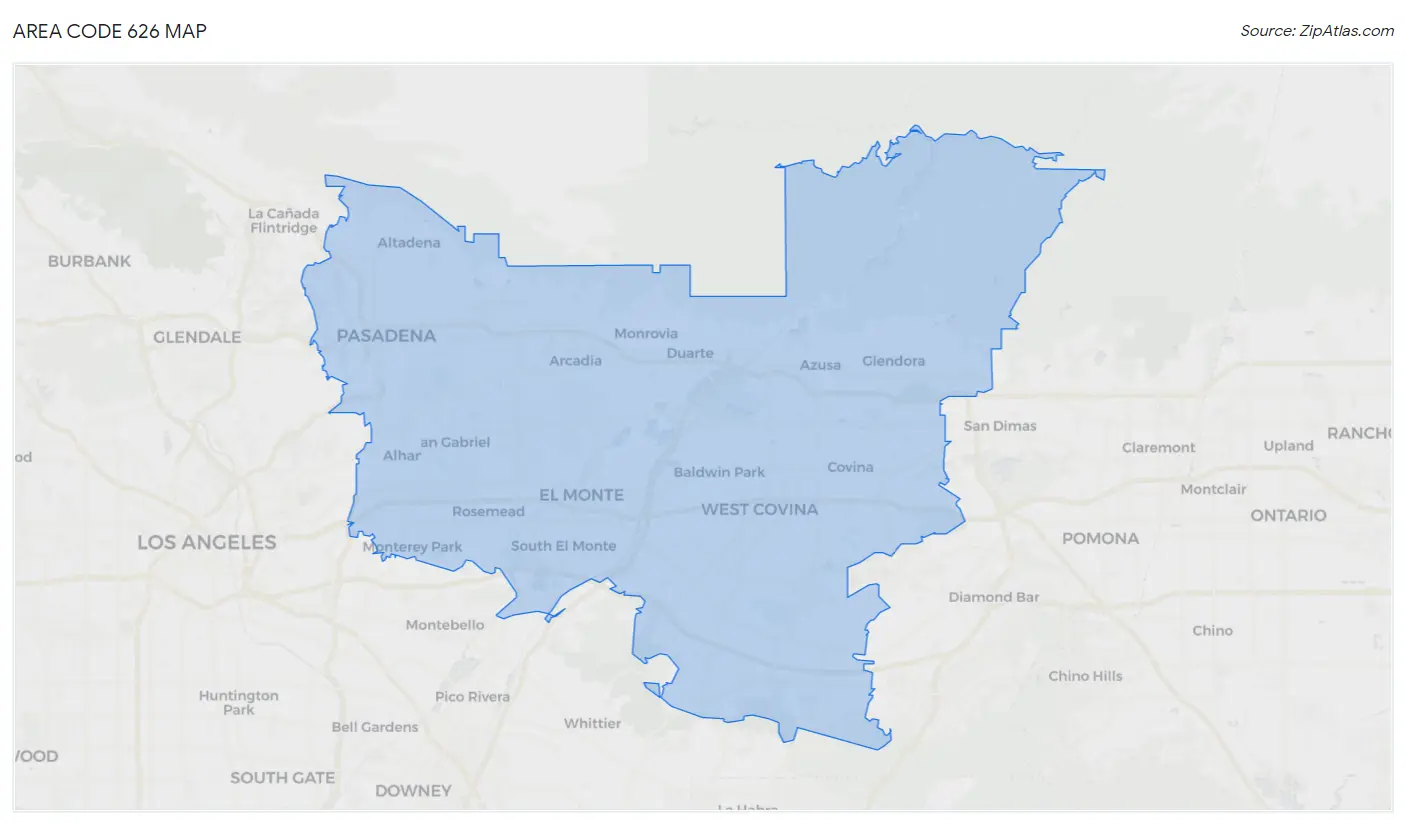
Area Code 626 Map
Area Code 626 Overview
$43,197
PER CAPITA INCOME
$105,793
AVG FAMILY INCOME
$91,086
AVG HOUSEHOLD INCOME
23.3%
WAGE / INCOME GAP [ % ]
76.7¢/ $1
WAGE / INCOME GAP [ $ ]
$10,418
FAMILY INCOME DEFICIT
24.26
INEQUALITY / GINI INDEX
1,914,659
TOTAL POPULATION
951,928
MALE POPULATION
962,731
FEMALE POPULATION
98.88
MALES / 100 FEMALES
101.13
FEMALES / 100 MALES
39.3
MEDIAN AGE
3.5
AVG FAMILY SIZE
3.0
AVG HOUSEHOLD SIZE
1,003,654
LABOR FORCE [ PEOPLE ]
63.7%
PERCENT IN LABOR FORCE
7.0%
UNEMPLOYMENT RATE
Income in Area Code 626
Income Overview in Area Code 626
Per Capita Income in Area Code 626 is $43,197, while median incomes of families and households are $105,793 and $91,086 respectively.
| Characteristic | Number | Measure |
| Per Capita Income | 1,914,659 | $43,197 |
| Median Family Income | 432,932 | $105,793 |
| Mean Family Income | 432,932 | $7,322,894 |
| Median Household Income | 617,622 | $91,086 |
| Mean Household Income | 617,622 | $6,480,949 |
| Income Deficit | 432,932 | $10,418 |
| Wage / Income Gap (%) | 1,914,659 | 23.29% |
| Wage / Income Gap ($) | 1,914,659 | 76.71¢ per $1 |
| Gini / Inequality Index | 1,914,659 | 24.26 |
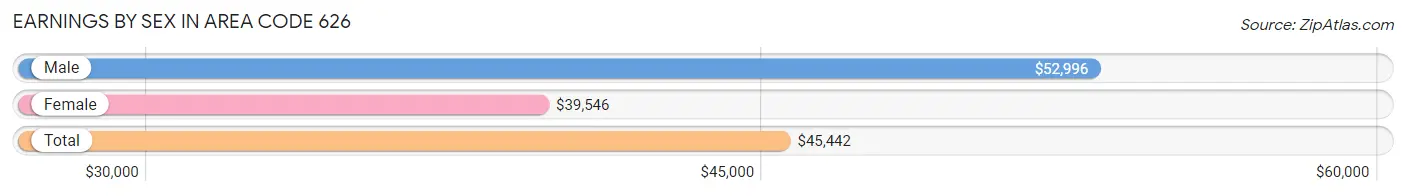
Earnings by Sex in Area Code 626
Average Earnings in Area Code 626 are $45,442, $52,996 for men and $39,546 for women, a difference of 25.4%.
| Sex | Number | Average Earnings |
| Male | 557,267 (54.0%) | $52,996 |
| Female | 474,391 (46.0%) | $39,546 |
| Total | 1,031,658 (100.0%) | $45,442 |
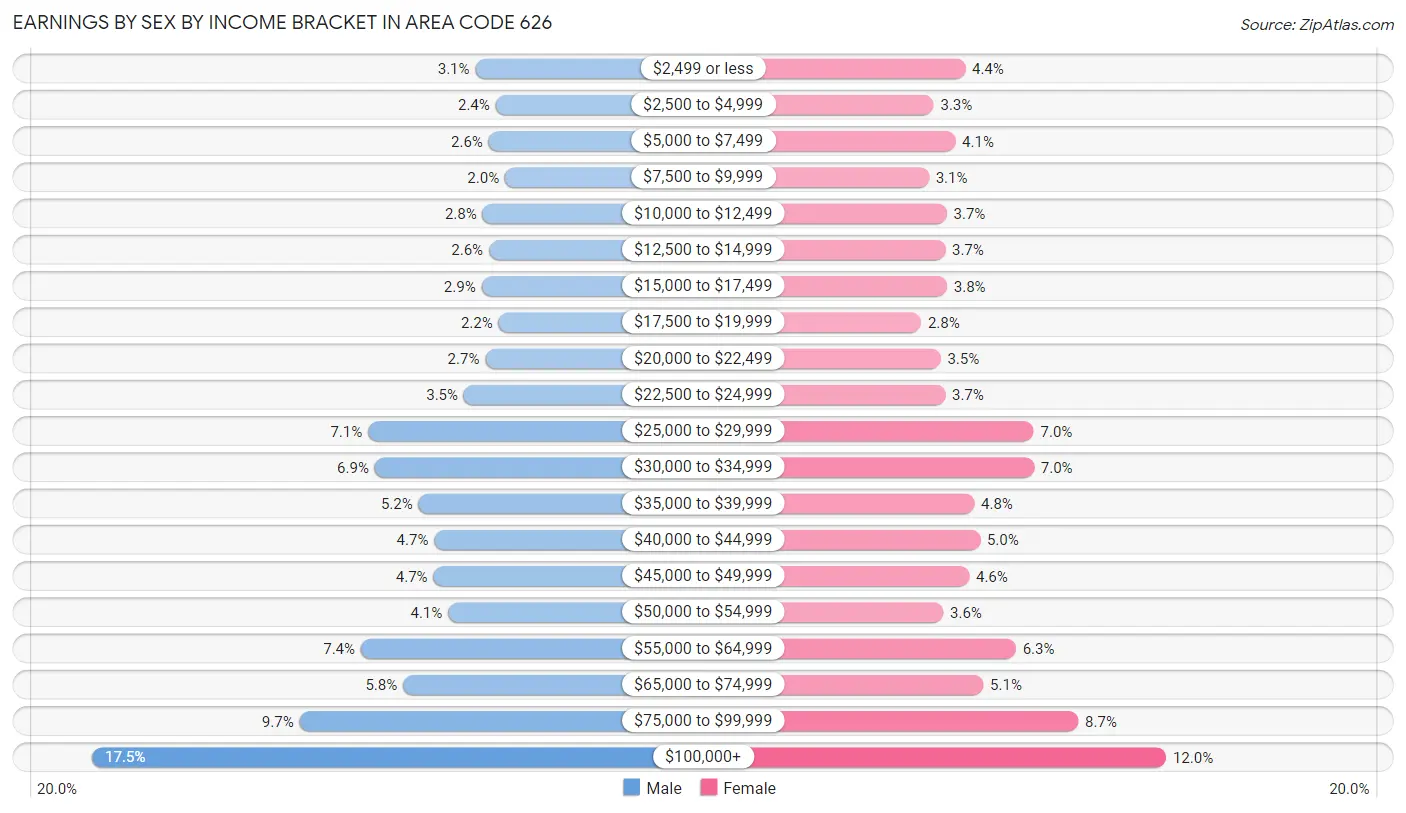
Earnings by Sex by Income Bracket in Area Code 626
The most common earnings brackets in Area Code 626 are $100,000+ for men (97,377 | 17.5%) and $100,000+ for women (56,730 | 12.0%).
| Income | Male | Female |
| $2,499 or less | 17,330 (3.1%) | 21,023 (4.4%) |
| $2,500 to $4,999 | 13,106 (2.4%) | 15,433 (3.3%) |
| $5,000 to $7,499 | 14,543 (2.6%) | 19,268 (4.1%) |
| $7,500 to $9,999 | 11,159 (2.0%) | 14,572 (3.1%) |
| $10,000 to $12,499 | 15,801 (2.8%) | 17,726 (3.7%) |
| $12,500 to $14,999 | 14,491 (2.6%) | 17,470 (3.7%) |
| $15,000 to $17,499 | 16,023 (2.9%) | 17,807 (3.7%) |
| $17,500 to $19,999 | 12,487 (2.2%) | 13,192 (2.8%) |
| $20,000 to $22,499 | 15,275 (2.7%) | 16,645 (3.5%) |
| $22,500 to $24,999 | 19,738 (3.5%) | 17,475 (3.7%) |
| $25,000 to $29,999 | 39,733 (7.1%) | 33,195 (7.0%) |
| $30,000 to $34,999 | 38,329 (6.9%) | 33,260 (7.0%) |
| $35,000 to $39,999 | 29,186 (5.2%) | 22,616 (4.8%) |
| $40,000 to $44,999 | 25,939 (4.6%) | 23,685 (5.0%) |
| $45,000 to $49,999 | 26,067 (4.7%) | 21,750 (4.6%) |
| $50,000 to $54,999 | 23,008 (4.1%) | 17,149 (3.6%) |
| $55,000 to $64,999 | 41,223 (7.4%) | 30,020 (6.3%) |
| $65,000 to $74,999 | 32,407 (5.8%) | 24,227 (5.1%) |
| $75,000 to $99,999 | 54,045 (9.7%) | 41,148 (8.7%) |
| $100,000+ | 97,377 (17.5%) | 56,730 (12.0%) |
| Total | 557,267 (100.0%) | 474,391 (100.0%) |
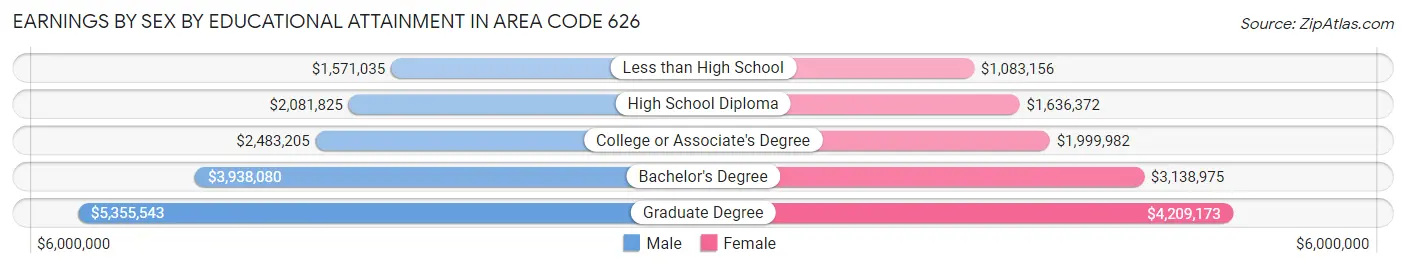
Earnings by Sex by Educational Attainment in Area Code 626
Average earnings in Area Code 626 are $3,093,255 for men and $2,432,582 for women, a difference of 21.4%. Men with an educational attainment of graduate degree enjoy the highest average annual earnings of $5,355,543, while those with less than high school education earn the least with $1,571,035. Women with an educational attainment of graduate degree earn the most with the average annual earnings of $4,209,173, while those with less than high school education have the smallest earnings of $1,083,156.
| Educational Attainment | Male Income | Female Income |
| Less than High School | $1,571,035 | $1,083,156 |
| High School Diploma | $2,081,825 | $1,636,372 |
| College or Associate's Degree | $2,483,205 | $1,999,982 |
| Bachelor's Degree | $3,938,080 | $3,138,975 |
| Graduate Degree | $5,355,543 | $4,209,173 |
| Total | $3,093,255 | $2,432,582 |
Family Income in Area Code 626
Family Income Brackets in Area Code 626
According to the Area Code 626 family income data, there are 4,431,492 families falling into the $100,000 to $149,999 income range, which is the most common income bracket and makes up 1,023.6% of all families. Conversely, the $10,000 to $14,999 income bracket is the least frequent group with only 328,595 families (75.9%) belonging to this category.
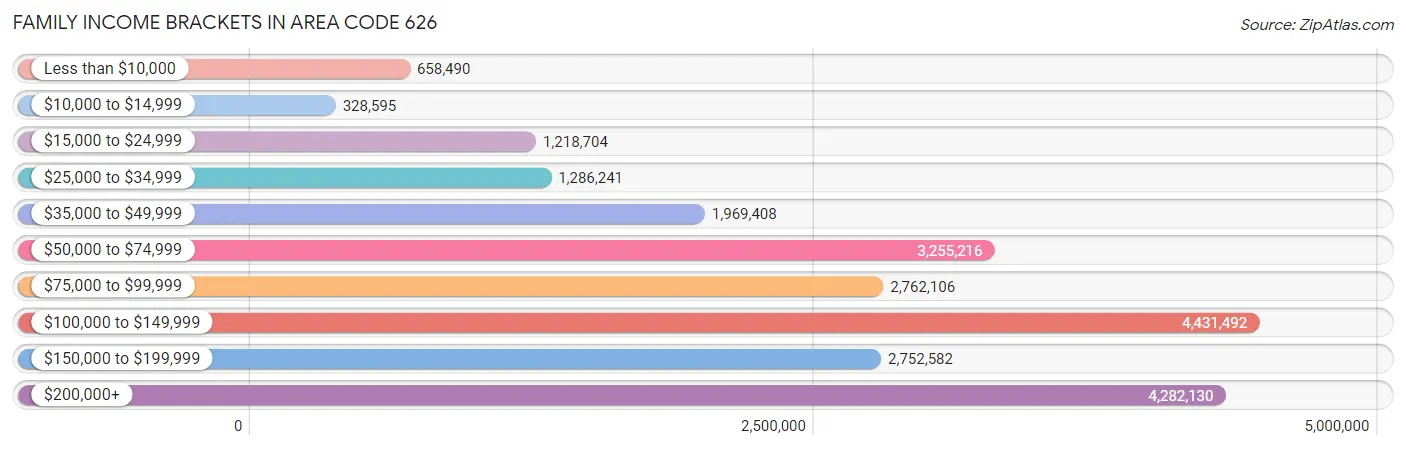
| Income Bracket | # Families | % Families |
| Less than $10,000 | 658,490 | 152.1% |
| $10,000 to $14,999 | 328,595 | 75.9% |
| $15,000 to $24,999 | 1,218,704 | 281.5% |
| $25,000 to $34,999 | 1,286,241 | 297.1% |
| $35,000 to $49,999 | 1,969,408 | 454.9% |
| $50,000 to $74,999 | 3,255,216 | 751.9% |
| $75,000 to $99,999 | 2,762,106 | 638.0% |
| $100,000 to $149,999 | 4,431,492 | 1,023.6% |
| $150,000 to $199,999 | 2,752,582 | 635.8% |
| $200,000+ | 4,282,130 | 989.1% |
Family Income by Famaliy Size in Area Code 626
7+ person families (16,985 | 3.9%) account for the highest median family income in Area Code 626 with $146,936 per family, while 2-person families (154,523 | 35.7%) have the highest median income of $43,786 per family member.
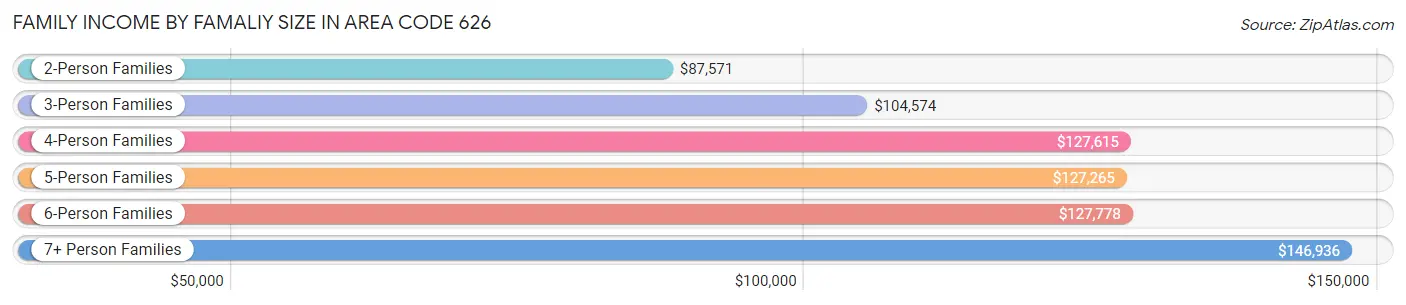
| Income Bracket | # Families | Median Income |
| 2-Person Families | 154,523 (35.7%) | $87,571 |
| 3-Person Families | 102,575 (23.7%) | $104,574 |
| 4-Person Families | 89,878 (20.8%) | $127,615 |
| 5-Person Families | 47,410 (11.0%) | $127,265 |
| 6-Person Families | 21,561 (5.0%) | $127,778 |
| 7+ Person Families | 16,985 (3.9%) | $146,936 |
| Total | 432,932 (100.0%) | $105,793 |
Family Income by Number of Earners in Area Code 626
The median family income in Area Code 626 is $105,793, with families comprising 3+ earners (84,490) having the highest median family income of $148,539, while families with no earners (47,024) have the lowest median family income of $43,792, accounting for 19.5% and 10.9% of families, respectively.
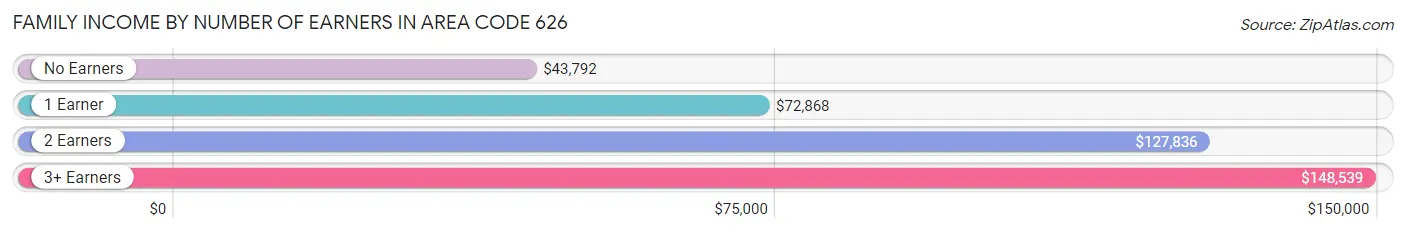
| Number of Earners | # Families | Median Income |
| No Earners | 47,024 (10.9%) | $43,792 |
| 1 Earner | 130,002 (30.0%) | $72,868 |
| 2 Earners | 171,416 (39.6%) | $127,836 |
| 3+ Earners | 84,490 (19.5%) | $148,539 |
| Total | 432,932 (100.0%) | $105,793 |
Household Income in Area Code 626
Household Income Brackets in Area Code 626
With 5,977,346 households falling in the category, the $100,000 to $149,999 income range is the most frequent in Area Code 626, accounting for 967.8% of all households. In contrast, only 1,650,286 households (267.2%) fall into the less than $10,000 income bracket, making it the least populous group.
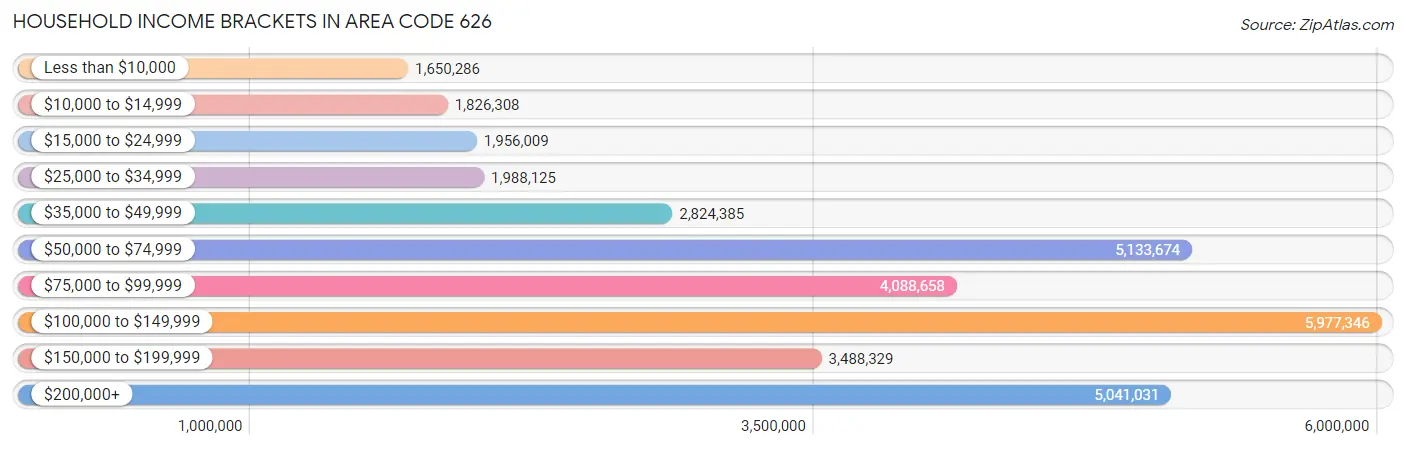
| Income Bracket | # Households | % Households |
| Less than $10,000 | 1,650,286 | 267.2% |
| $10,000 to $14,999 | 1,826,308 | 295.7% |
| $15,000 to $24,999 | 1,956,009 | 316.7% |
| $25,000 to $34,999 | 1,988,125 | 321.9% |
| $35,000 to $49,999 | 2,824,385 | 457.3% |
| $50,000 to $74,999 | 5,133,674 | 831.2% |
| $75,000 to $99,999 | 4,088,658 | 662.0% |
| $100,000 to $149,999 | 5,977,346 | 967.8% |
| $150,000 to $199,999 | 3,488,329 | 564.8% |
| $200,000+ | 5,041,031 | 816.2% |
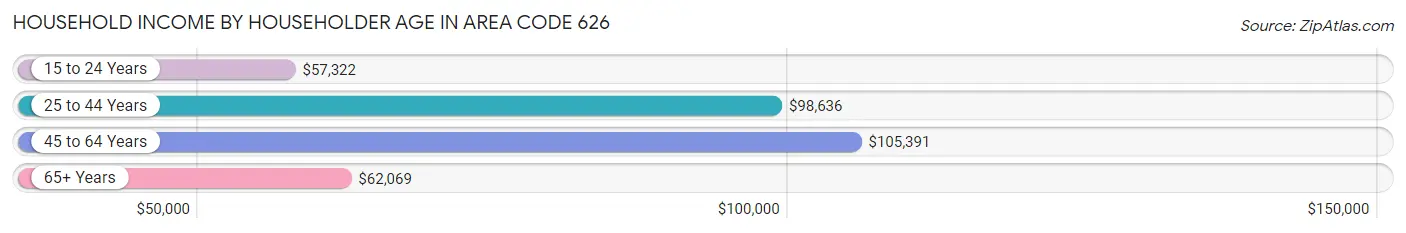
Household Income by Householder Age in Area Code 626
The median household income in Area Code 626 is $91,086, with the highest median household income of $105,391 found in the 45 to 64 years age bracket for the primary householder. A total of 243,984 households (39.5%) fall into this category. Meanwhile, the 15 to 24 years age bracket for the primary householder has the lowest median household income of $57,322, with 15,222 households (2.5%) in this group.
| Income Bracket | # Households | Median Income |
| 15 to 24 Years | 15,222 (2.5%) | $57,322 |
| 25 to 44 Years | 209,945 (34.0%) | $98,636 |
| 45 to 64 Years | 243,984 (39.5%) | $105,391 |
| 65+ Years | 148,471 (24.0%) | $62,069 |
| Total | 617,622 (100.0%) | $91,086 |
Poverty in Area Code 626
Income Below Poverty by Sex and Age in Area Code 626
With 11.4% poverty level for males and 13.4% for females among the residents of Area Code 626, 15 year old males and 15 year old females are the most vulnerable to poverty, with 2,407 males (20.6%) and 2,066 females (18.0%) in their respective age groups living below the poverty level.
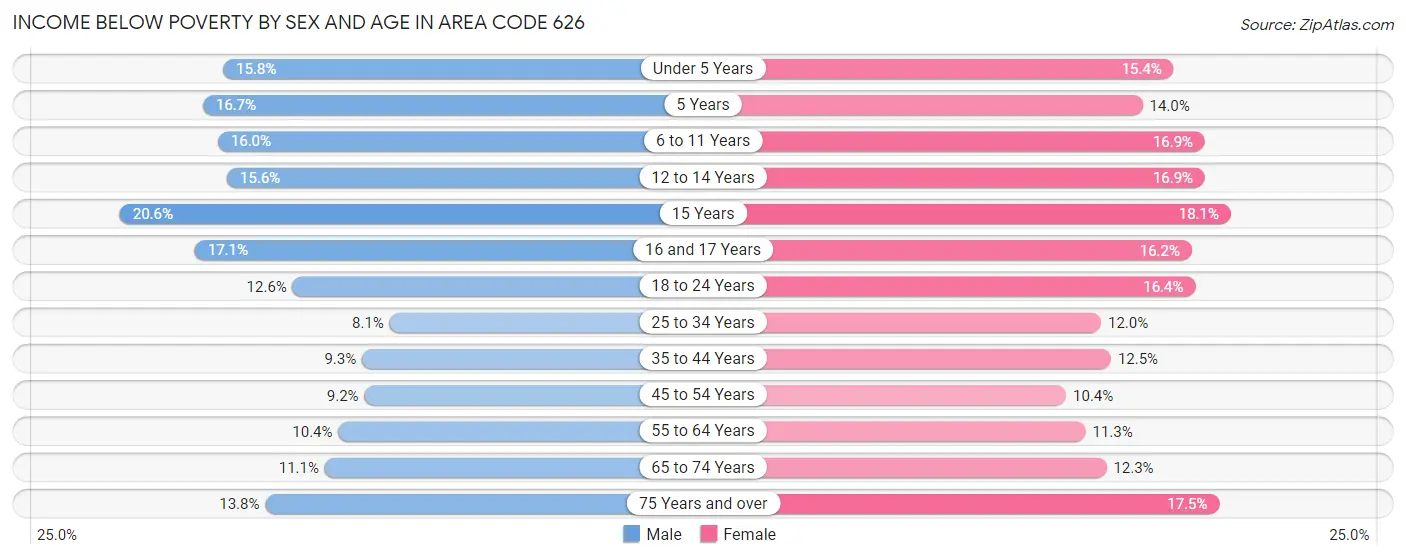
| Age Bracket | Male | Female |
| Under 5 Years | 7,869 (15.8%) | 7,320 (15.4%) |
| 5 Years | 1,792 (16.7%) | 1,316 (14.0%) |
| 6 to 11 Years | 10,083 (16.0%) | 10,171 (16.9%) |
| 12 to 14 Years | 5,529 (15.6%) | 5,767 (16.9%) |
| 15 Years | 2,407 (20.6%) | 2,066 (18.0%) |
| 16 and 17 Years | 4,045 (17.1%) | 3,533 (16.2%) |
| 18 to 24 Years | 10,952 (12.6%) | 13,399 (16.4%) |
| 25 to 34 Years | 12,432 (8.1%) | 16,861 (12.0%) |
| 35 to 44 Years | 12,680 (9.3%) | 16,108 (12.5%) |
| 45 to 54 Years | 11,833 (9.2%) | 13,457 (10.4%) |
| 55 to 64 Years | 12,110 (10.4%) | 13,770 (11.3%) |
| 65 to 74 Years | 8,326 (11.1%) | 10,809 (12.3%) |
| 75 Years and over | 6,672 (13.8%) | 12,674 (17.5%) |
| Total | 106,730 (11.4%) | 127,251 (13.4%) |
Income Above Poverty by Sex and Age in Area Code 626
According to the poverty statistics in Area Code 626, males aged 25 to 34 years and females aged 45 to 54 years are the age groups that are most secure financially, with 91.9% of males and 89.6% of females in these age groups living above the poverty line.
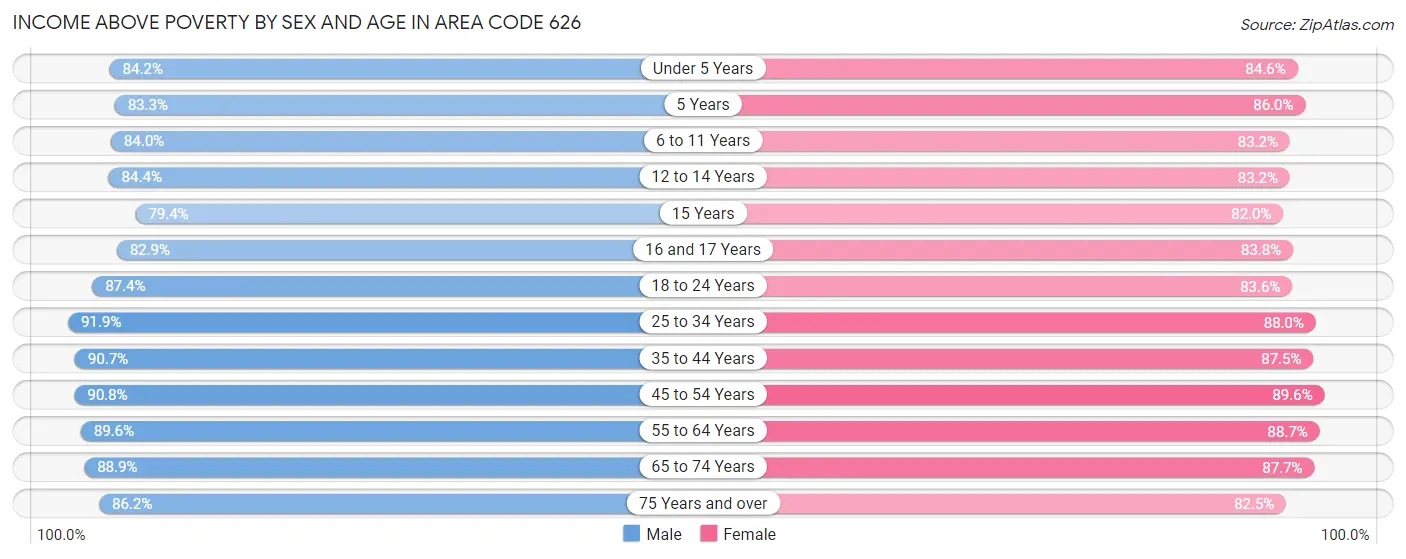
| Age Bracket | Male | Female |
| Under 5 Years | 41,970 (84.2%) | 40,203 (84.6%) |
| 5 Years | 8,922 (83.3%) | 8,112 (86.0%) |
| 6 to 11 Years | 52,799 (84.0%) | 50,181 (83.2%) |
| 12 to 14 Years | 29,889 (84.4%) | 28,464 (83.2%) |
| 15 Years | 9,287 (79.4%) | 9,379 (82.0%) |
| 16 and 17 Years | 19,607 (82.9%) | 18,218 (83.8%) |
| 18 to 24 Years | 76,237 (87.4%) | 68,278 (83.6%) |
| 25 to 34 Years | 141,871 (91.9%) | 123,240 (88.0%) |
| 35 to 44 Years | 123,114 (90.7%) | 112,869 (87.5%) |
| 45 to 54 Years | 116,350 (90.8%) | 115,851 (89.6%) |
| 55 to 64 Years | 103,843 (89.6%) | 107,946 (88.7%) |
| 65 to 74 Years | 66,866 (88.9%) | 77,221 (87.7%) |
| 75 Years and over | 41,564 (86.2%) | 59,666 (82.5%) |
| Total | 832,319 (88.6%) | 819,628 (86.6%) |
Income Below Poverty Among Married-Couple Families in Area Code 626
The poverty statistics for married-couple families in Area Code 626 show that 6.1% or 17,874 of the total 292,607 families live below the poverty line. Families with 5 or more children have the highest poverty rate of 24.7%, comprising of 299 families. On the other hand, families with no children have the lowest poverty rate of 4.7%, which includes 7,749 families.
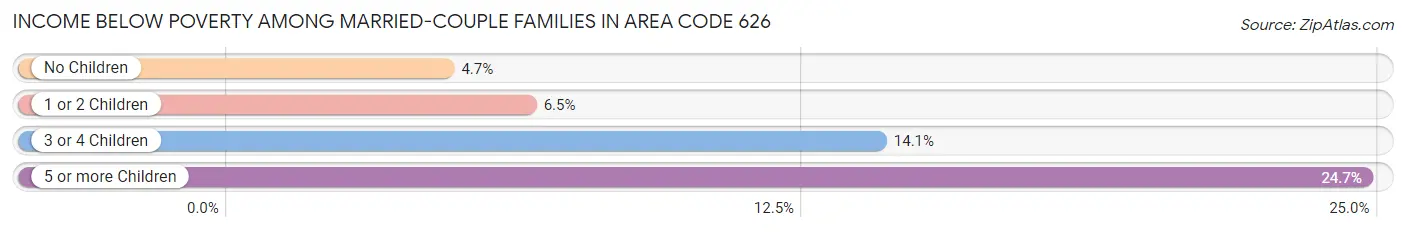
| Children | Above Poverty | Below Poverty |
| No Children | 156,855 (95.3%) | 7,749 (4.7%) |
| 1 or 2 Children | 99,157 (93.5%) | 6,898 (6.5%) |
| 3 or 4 Children | 17,810 (85.9%) | 2,928 (14.1%) |
| 5 or more Children | 911 (75.3%) | 299 (24.7%) |
| Total | 274,733 (93.9%) | 17,874 (6.1%) |
Income Below Poverty Among Single-Parent Households in Area Code 626
According to the poverty data in Area Code 626, 11.9% or 5,663 single-father households and 16.9% or 15,723 single-mother households are living below the poverty line. Among single-father households, those with 5 or more children have the highest poverty rate, with 117 households (45.0%) experiencing poverty. Likewise, among single-mother households, those with 5 or more children have the highest poverty rate, with 408 households (54.5%) falling below the poverty line.
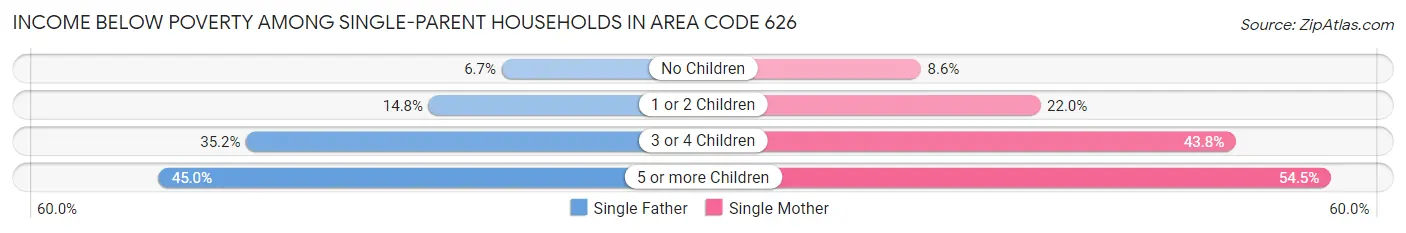
| Children | Single Father | Single Mother |
| No Children | 1,744 (6.7%) | 4,143 (8.6%) |
| 1 or 2 Children | 2,622 (14.8%) | 8,135 (22.0%) |
| 3 or 4 Children | 1,180 (35.2%) | 3,037 (43.8%) |
| 5 or more Children | 117 (45.0%) | 408 (54.5%) |
| Total | 5,663 (11.9%) | 15,723 (16.9%) |
Income Below Poverty Among Married-Couple vs Single-Parent Households in Area Code 626
The poverty data for Area Code 626 shows that 17,874 of the married-couple family households (6.1%) and 21,386 of the single-parent households (15.2%) are living below the poverty level. Within the married-couple family households, those with 5 or more children have the highest poverty rate, with 299 households (24.7%) falling below the poverty line. Among the single-parent households, those with 5 or more children have the highest poverty rate, with 525 household (52.0%) living below poverty.
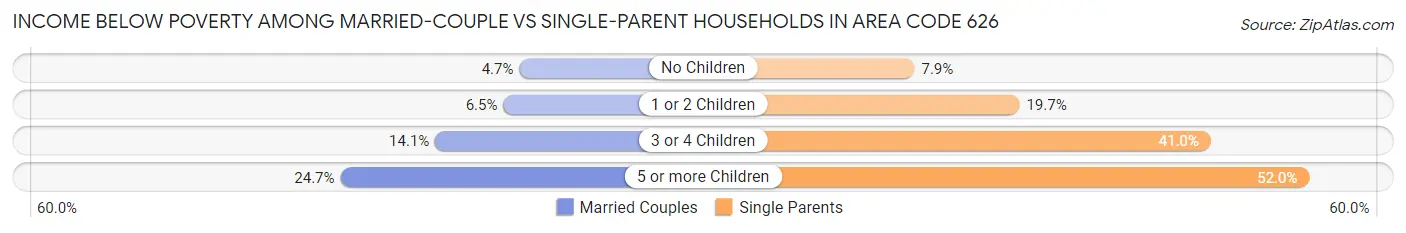
| Children | Married-Couple Families | Single-Parent Households |
| No Children | 7,749 (4.7%) | 5,887 (7.9%) |
| 1 or 2 Children | 6,898 (6.5%) | 10,757 (19.7%) |
| 3 or 4 Children | 2,928 (14.1%) | 4,217 (41.0%) |
| 5 or more Children | 299 (24.7%) | 525 (52.0%) |
| Total | 17,874 (6.1%) | 21,386 (15.2%) |
Race in Area Code 626
The most populous races in Area Code 626 are Hispanic or Latino (979,556 | 51.2%), White / Caucasian (626,026 | 32.7%), and Asian (487,287 | 25.5%).
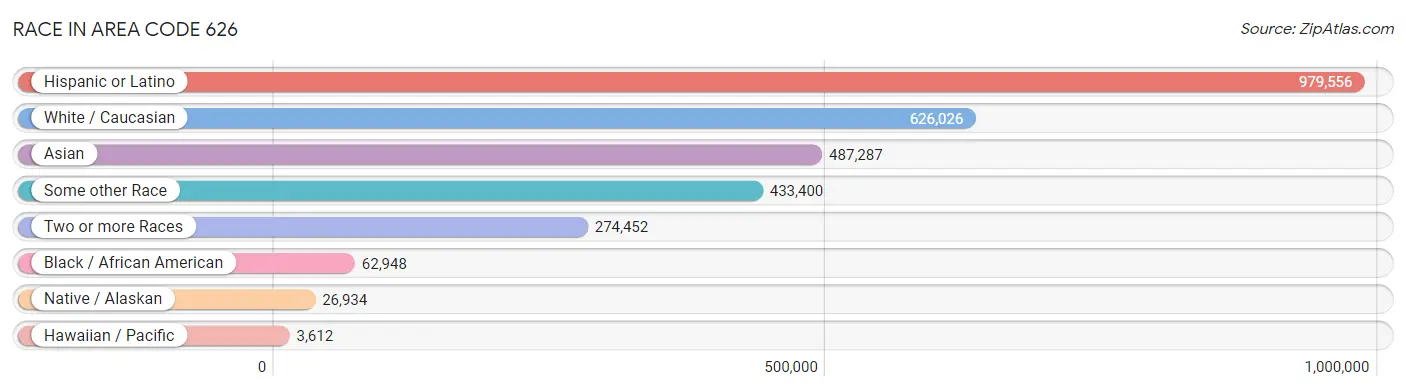
| Race | # Population | % Population |
| Asian | 487,287 | 25.5% |
| Black / African American | 62,948 | 3.3% |
| Hawaiian / Pacific | 3,612 | 0.2% |
| Hispanic or Latino | 979,556 | 51.2% |
| Native / Alaskan | 26,934 | 1.4% |
| White / Caucasian | 626,026 | 32.7% |
| Two or more Races | 274,452 | 14.3% |
| Some other Race | 433,400 | 22.6% |
| Total | 1,914,659 | 100.0% |
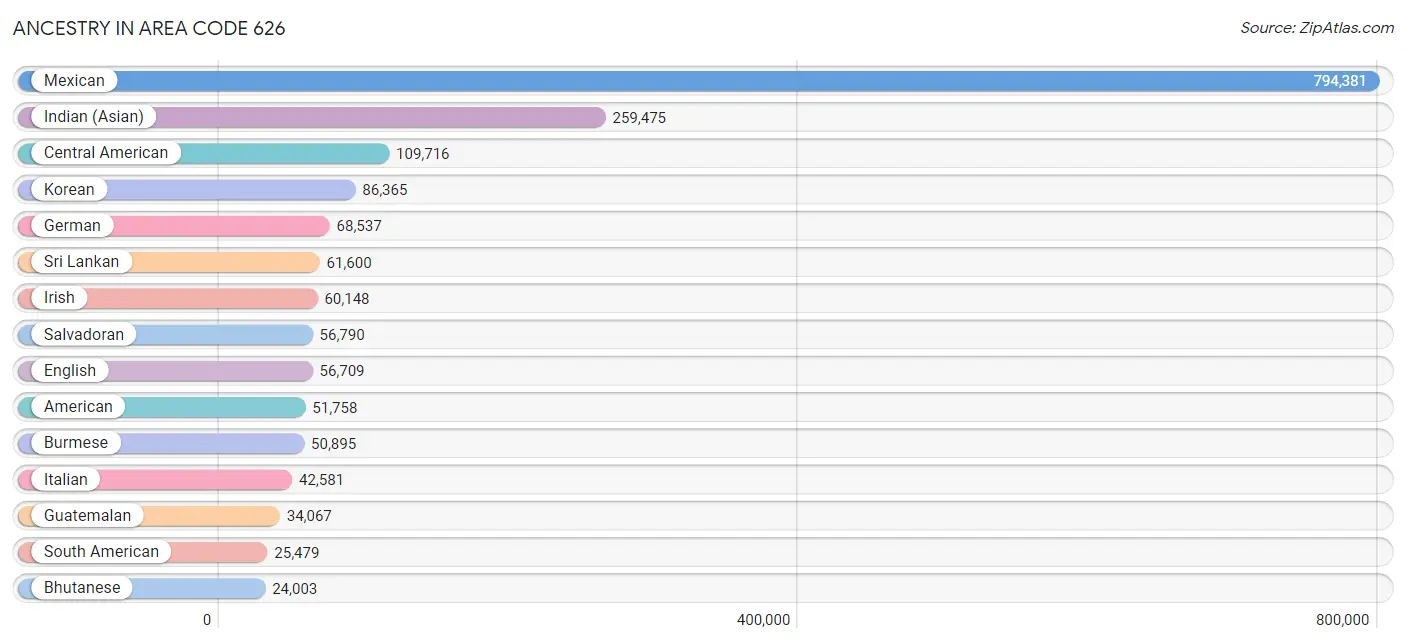
Ancestry in Area Code 626
The most populous ancestries reported in Area Code 626 are Mexican (794,381 | 41.5%), Indian (Asian) (259,475 | 13.6%), Central American (109,716 | 5.7%), Korean (86,365 | 4.5%), and German (68,537 | 3.6%), together accounting for 68.9% of all Area Code 626 residents.
| Ancestry | # Population | % Population |
| Afghan | 641 | 0.0% |
| African | 3,922 | 0.2% |
| Alaska Native | 56 | 0.0% |
| Albanian | 462 | 0.0% |
| Alsatian | 13 | 0.0% |
| American | 51,758 | 2.7% |
| Apache | 1,449 | 0.1% |
| Arab | 13,564 | 0.7% |
| Arapaho | 14 | 0.0% |
| Argentinean | 3,280 | 0.2% |
| Armenian | 20,074 | 1.1% |
| Assyrian / Chaldean / Syriac | 306 | 0.0% |
| Australian | 610 | 0.0% |
| Austrian | 1,519 | 0.1% |
| Bahamian | 64 | 0.0% |
| Bangladeshi | 346 | 0.0% |
| Barbadian | 69 | 0.0% |
| Basque | 592 | 0.0% |
| Belgian | 460 | 0.0% |
| Belizean | 693 | 0.0% |
| Bhutanese | 24,003 | 1.3% |
| Blackfeet | 562 | 0.0% |
| Bolivian | 1,304 | 0.1% |
| Brazilian | 1,256 | 0.1% |
| British | 5,780 | 0.3% |
| British West Indian | 109 | 0.0% |
| Bulgarian | 207 | 0.0% |
| Burmese | 50,895 | 2.7% |
| Cajun | 175 | 0.0% |
| Cambodian | 988 | 0.1% |
| Canadian | 2,019 | 0.1% |
| Cape Verdean | 106 | 0.0% |
| Celtic | 44 | 0.0% |
| Central American | 109,716 | 5.7% |
| Central American Indian | 5,633 | 0.3% |
| Cherokee | 2,501 | 0.1% |
| Cheyenne | 41 | 0.0% |
| Chickasaw | 198 | 0.0% |
| Chilean | 1,654 | 0.1% |
| Chinese | 177 | 0.0% |
| Chippewa | 464 | 0.0% |
| Choctaw | 610 | 0.0% |
| Colombian | 6,530 | 0.3% |
| Colville | 33 | 0.0% |
| Comanche | 184 | 0.0% |
| Costa Rican | 3,063 | 0.2% |
| Creek | 98 | 0.0% |
| Croatian | 1,216 | 0.1% |
| Cuban | 7,734 | 0.4% |
| Cypriot | 11 | 0.0% |
| Czech | 1,855 | 0.1% |
| Czechoslovakian | 726 | 0.0% |
| Danish | 3,278 | 0.2% |
| Delaware | 32 | 0.0% |
| Dominican | 1,238 | 0.1% |
| Dutch | 7,323 | 0.4% |
| Dutch West Indian | 57 | 0.0% |
| Eastern European | 3,537 | 0.2% |
| Ecuadorian | 4,144 | 0.2% |
| Egyptian | 3,410 | 0.2% |
| English | 56,709 | 3.0% |
| Estonian | 320 | 0.0% |
| Ethiopian | 574 | 0.0% |
| European | 14,417 | 0.7% |
| Filipino | 16,502 | 0.9% |
| Finnish | 1,264 | 0.1% |
| French | 16,641 | 0.9% |
| French American Indian | 165 | 0.0% |
| French Canadian | 2,343 | 0.1% |
| German | 68,537 | 3.6% |
| Ghanaian | 341 | 0.0% |
| Greek | 4,850 | 0.3% |
| Guamanian / Chamorro | 658 | 0.0% |
| Guatemalan | 34,067 | 1.8% |
| Guyanese | 231 | 0.0% |
| Haitian | 357 | 0.0% |
| Honduran | 6,940 | 0.4% |
| Hopi | 193 | 0.0% |
| Hungarian | 3,066 | 0.2% |
| Icelander | 195 | 0.0% |
| Indian (Asian) | 259,475 | 13.6% |
| Indonesian | 3,894 | 0.2% |
| Inupiat | 36 | 0.0% |
| Iranian | 4,570 | 0.2% |
| Iraqi | 408 | 0.0% |
| Irish | 60,148 | 3.1% |
| Iroquois | 176 | 0.0% |
| Israeli | 453 | 0.0% |
| Italian | 42,581 | 2.2% |
| Jamaican | 1,074 | 0.1% |
| Japanese | 5,903 | 0.3% |
| Jordanian | 894 | 0.1% |
| Kenyan | 133 | 0.0% |
| Kiowa | 27 | 0.0% |
| Korean | 86,365 | 4.5% |
| Laotian | 4,529 | 0.2% |
| Latvian | 286 | 0.0% |
| Lebanese | 3,662 | 0.2% |
| Liberian | 24 | 0.0% |
| Lithuanian | 997 | 0.1% |
| Lumbee | 11 | 0.0% |
| Luxembourger | 21 | 0.0% |
| Macedonian | 39 | 0.0% |
| Malaysian | 1,589 | 0.1% |
| Maltese | 119 | 0.0% |
| Mexican | 794,381 | 41.5% |
| Mexican American Indian | 17,492 | 0.9% |
| Mongolian | 552 | 0.0% |
| Moroccan | 181 | 0.0% |
| Native Hawaiian | 1,892 | 0.1% |
| Navajo | 1,901 | 0.1% |
| Nepalese | 15 | 0.0% |
| New Zealander | 74 | 0.0% |
| Nicaraguan | 6,404 | 0.3% |
| Nigerian | 1,645 | 0.1% |
| Northern European | 1,866 | 0.1% |
| Norwegian | 8,319 | 0.4% |
| Okinawan | 268 | 0.0% |
| Osage | 113 | 0.0% |
| Ottawa | 39 | 0.0% |
| Paiute | 27 | 0.0% |
| Pakistani | 5,895 | 0.3% |
| Palestinian | 1,053 | 0.1% |
| Panamanian | 1,093 | 0.1% |
| Paraguayan | 147 | 0.0% |
| Pennsylvania German | 96 | 0.0% |
| Peruvian | 6,742 | 0.4% |
| Pima | 61 | 0.0% |
| Polish | 11,197 | 0.6% |
| Portuguese | 3,234 | 0.2% |
| Potawatomi | 61 | 0.0% |
| Pueblo | 350 | 0.0% |
| Puerto Rican | 8,623 | 0.4% |
| Puget Sound Salish | 61 | 0.0% |
| Romanian | 1,875 | 0.1% |
| Russian | 7,565 | 0.4% |
| Salvadoran | 56,790 | 3.0% |
| Samoan | 1,485 | 0.1% |
| Scandinavian | 2,511 | 0.1% |
| Scotch-Irish | 5,174 | 0.3% |
| Scottish | 12,117 | 0.6% |
| Seminole | 72 | 0.0% |
| Senegalese | 8 | 0.0% |
| Serbian | 472 | 0.0% |
| Shoshone | 11 | 0.0% |
| Sioux | 266 | 0.0% |
| Slavic | 299 | 0.0% |
| Slovak | 781 | 0.0% |
| Slovene | 148 | 0.0% |
| South African | 236 | 0.0% |
| South American | 25,479 | 1.3% |
| South American Indian | 542 | 0.0% |
| Soviet Union | 3 | 0.0% |
| Spaniard | 7,000 | 0.4% |
| Spanish | 5,404 | 0.3% |
| Spanish American | 295 | 0.0% |
| Spanish American Indian | 6,876 | 0.4% |
| Sri Lankan | 61,600 | 3.2% |
| Subsaharan African | 8,110 | 0.4% |
| Sudanese | 239 | 0.0% |
| Swedish | 7,697 | 0.4% |
| Swiss | 2,349 | 0.1% |
| Syrian | 2,267 | 0.1% |
| Taiwanese | 46 | 0.0% |
| Thai | 17,401 | 0.9% |
| Tlingit-Haida | 34 | 0.0% |
| Tohono O'Odham | 372 | 0.0% |
| Tongan | 554 | 0.0% |
| Trinidadian and Tobagonian | 177 | 0.0% |
| Turkish | 566 | 0.0% |
| Ugandan | 49 | 0.0% |
| Ukrainian | 2,566 | 0.1% |
| Uruguayan | 200 | 0.0% |
| Ute | 43 | 0.0% |
| Venezuelan | 1,059 | 0.1% |
| Vietnamese | 1,732 | 0.1% |
| Welsh | 3,573 | 0.2% |
| West Indian | 473 | 0.0% |
| Yaqui | 916 | 0.1% |
| Yugoslavian | 400 | 0.0% |
| Yuman | 92 | 0.0% |
| Zimbabwean | 5 | 0.0% | View All 182 Rows |
Immigrants in Area Code 626
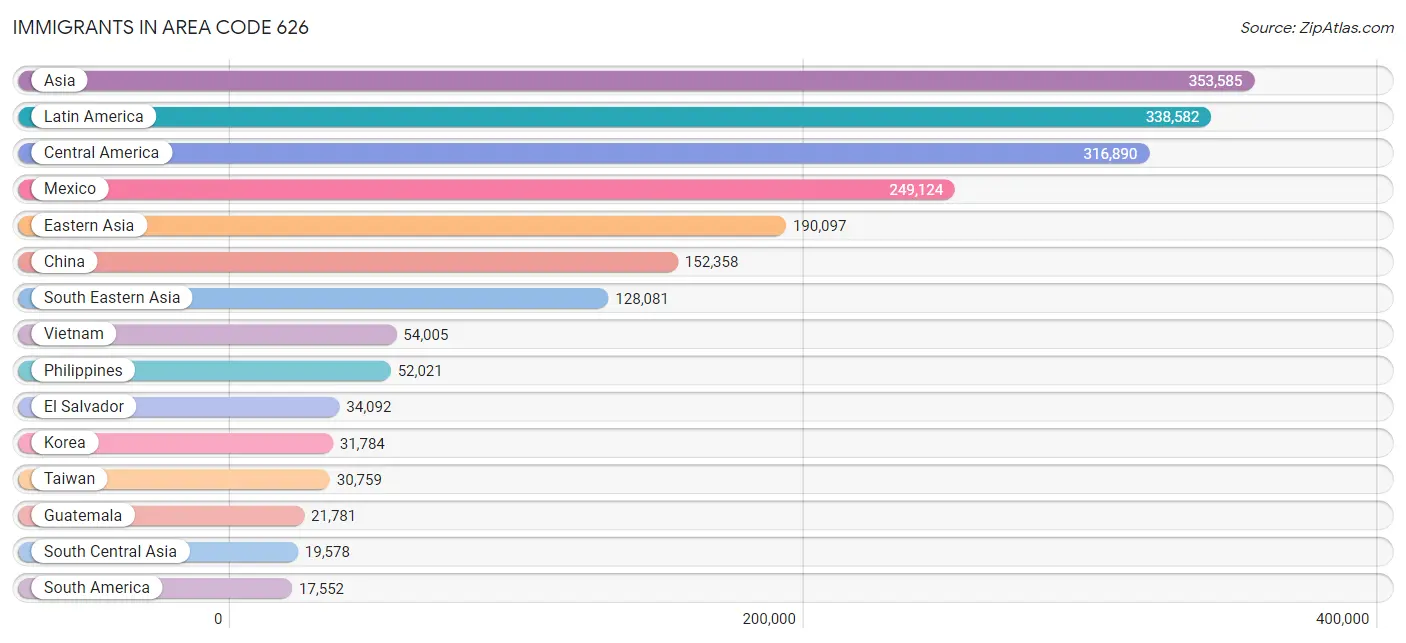
The most numerous immigrant groups reported in Area Code 626 came from Asia (353,585 | 18.5%), Latin America (338,582 | 17.7%), Central America (316,890 | 16.6%), Mexico (249,124 | 13.0%), and Eastern Asia (190,097 | 9.9%), together accounting for 75.6% of all Area Code 626 residents.
| Immigration Origin | # Population | % Population |
| Afghanistan | 321 | 0.0% |
| Africa | 6,517 | 0.3% |
| Albania | 130 | 0.0% |
| Argentina | 2,332 | 0.1% |
| Armenia | 5,576 | 0.3% |
| Asia | 353,585 | 18.5% |
| Australia | 908 | 0.1% |
| Austria | 297 | 0.0% |
| Azores | 6 | 0.0% |
| Bahamas | 12 | 0.0% |
| Bangladesh | 1,813 | 0.1% |
| Barbados | 17 | 0.0% |
| Belarus | 189 | 0.0% |
| Belgium | 177 | 0.0% |
| Belize | 565 | 0.0% |
| Bolivia | 798 | 0.0% |
| Bosnia and Herzegovina | 120 | 0.0% |
| Brazil | 1,368 | 0.1% |
| Bulgaria | 239 | 0.0% |
| Cambodia | 4,552 | 0.2% |
| Cameroon | 134 | 0.0% |
| Canada | 3,398 | 0.2% |
| Caribbean | 4,140 | 0.2% |
| Central America | 316,890 | 16.6% |
| Chile | 876 | 0.1% |
| China | 152,358 | 8.0% |
| Colombia | 3,630 | 0.2% |
| Congo | 14 | 0.0% |
| Costa Rica | 1,442 | 0.1% |
| Croatia | 269 | 0.0% |
| Cuba | 2,494 | 0.1% |
| Czechoslovakia | 391 | 0.0% |
| Denmark | 152 | 0.0% |
| Dominica | 166 | 0.0% |
| Dominican Republic | 518 | 0.0% |
| Eastern Africa | 1,219 | 0.1% |
| Eastern Asia | 190,097 | 9.9% |
| Eastern Europe | 5,573 | 0.3% |
| Ecuador | 2,284 | 0.1% |
| Egypt | 1,896 | 0.1% |
| El Salvador | 34,092 | 1.8% |
| England | 1,744 | 0.1% |
| Eritrea | 98 | 0.0% |
| Ethiopia | 517 | 0.0% |
| Europe | 17,419 | 0.9% |
| Fiji | 801 | 0.0% |
| France | 1,130 | 0.1% |
| Germany | 1,828 | 0.1% |
| Ghana | 326 | 0.0% |
| Greece | 449 | 0.0% |
| Grenada | 28 | 0.0% |
| Guatemala | 21,781 | 1.1% |
| Guyana | 331 | 0.0% |
| Haiti | 194 | 0.0% |
| Honduras | 4,874 | 0.3% |
| Hong Kong | 14,802 | 0.8% |
| Hungary | 244 | 0.0% |
| India | 8,756 | 0.5% |
| Indonesia | 4,530 | 0.2% |
| Iran | 5,828 | 0.3% |
| Iraq | 503 | 0.0% |
| Ireland | 328 | 0.0% |
| Israel | 512 | 0.0% |
| Italy | 1,085 | 0.1% |
| Jamaica | 411 | 0.0% |
| Japan | 5,307 | 0.3% |
| Jordan | 1,102 | 0.1% |
| Kazakhstan | 98 | 0.0% |
| Kenya | 253 | 0.0% |
| Korea | 31,784 | 1.7% |
| Kuwait | 378 | 0.0% |
| Laos | 1,299 | 0.1% |
| Latin America | 338,582 | 17.7% |
| Latvia | 108 | 0.0% |
| Lebanon | 3,122 | 0.2% |
| Liberia | 43 | 0.0% |
| Lithuania | 49 | 0.0% |
| Malaysia | 1,862 | 0.1% |
| Mexico | 249,124 | 13.0% |
| Micronesia | 251 | 0.0% |
| Middle Africa | 314 | 0.0% |
| Moldova | 47 | 0.0% |
| Morocco | 249 | 0.0% |
| Nepal | 1,265 | 0.1% |
| Netherlands | 754 | 0.0% |
| Nicaragua | 4,174 | 0.2% |
| Nigeria | 1,321 | 0.1% |
| Northern Africa | 2,462 | 0.1% |
| Northern Europe | 4,698 | 0.3% |
| Norway | 89 | 0.0% |
| Oceania | 2,563 | 0.1% |
| Pakistan | 884 | 0.1% |
| Panama | 496 | 0.0% |
| Peru | 4,455 | 0.2% |
| Philippines | 52,021 | 2.7% |
| Poland | 561 | 0.0% |
| Portugal | 103 | 0.0% |
| Romania | 700 | 0.0% |
| Russia | 1,461 | 0.1% |
| Saudi Arabia | 235 | 0.0% |
| Scotland | 280 | 0.0% |
| Serbia | 56 | 0.0% |
| Sierra Leone | 12 | 0.0% |
| Singapore | 718 | 0.0% |
| South Africa | 369 | 0.0% |
| South America | 17,552 | 0.9% |
| South Central Asia | 19,578 | 1.0% |
| South Eastern Asia | 128,081 | 6.7% |
| Southern Europe | 2,508 | 0.1% |
| Spain | 848 | 0.0% |
| Sri Lanka | 508 | 0.0% |
| Sudan | 161 | 0.0% |
| Sweden | 443 | 0.0% |
| Switzerland | 321 | 0.0% |
| Syria | 3,136 | 0.2% |
| Taiwan | 30,759 | 1.6% |
| Thailand | 4,046 | 0.2% |
| Trinidad and Tobago | 181 | 0.0% |
| Turkey | 338 | 0.0% |
| Uganda | 196 | 0.0% |
| Ukraine | 611 | 0.0% |
| Uruguay | 64 | 0.0% |
| Uzbekistan | 55 | 0.0% |
| Venezuela | 1,096 | 0.1% |
| Vietnam | 54,005 | 2.8% |
| West Indies | 17 | 0.0% |
| Western Africa | 1,778 | 0.1% |
| Western Asia | 15,470 | 0.8% |
| Western Europe | 4,518 | 0.2% |
| Zaire | 126 | 0.0% |
| Zimbabwe | 5 | 0.0% | View All 131 Rows |
Sex and Age in Area Code 626
Sex and Age in Area Code 626
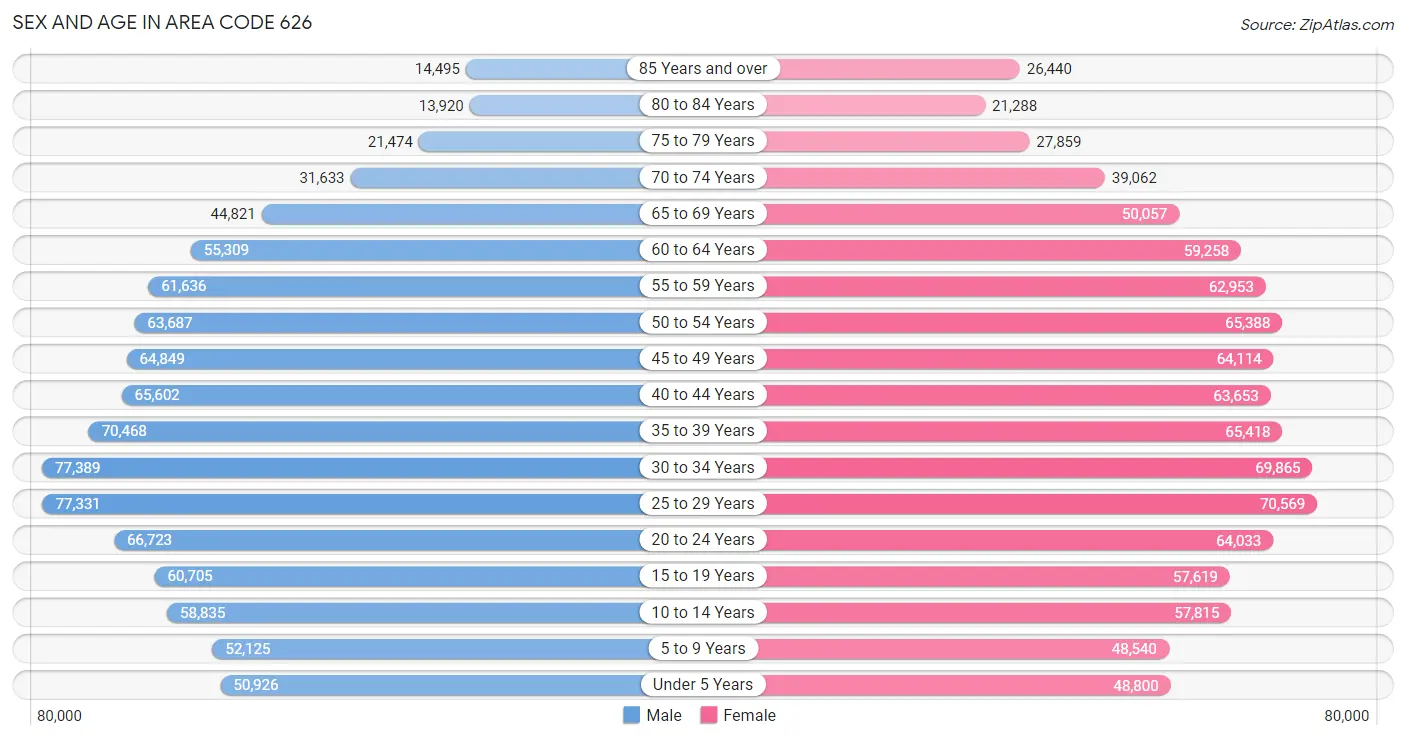
The most populous age groups in Area Code 626 are 30 to 34 Years (77,389 | 8.1%) for men and 25 to 29 Years (70,569 | 7.3%) for women.
| Age Bracket | Male | Female |
| Under 5 Years | 50,926 (5.3%) | 48,800 (5.1%) |
| 5 to 9 Years | 52,125 (5.5%) | 48,540 (5.0%) |
| 10 to 14 Years | 58,835 (6.2%) | 57,815 (6.0%) |
| 15 to 19 Years | 60,705 (6.4%) | 57,619 (6.0%) |
| 20 to 24 Years | 66,723 (7.0%) | 64,033 (6.7%) |
| 25 to 29 Years | 77,331 (8.1%) | 70,569 (7.3%) |
| 30 to 34 Years | 77,389 (8.1%) | 69,865 (7.3%) |
| 35 to 39 Years | 70,468 (7.4%) | 65,418 (6.8%) |
| 40 to 44 Years | 65,602 (6.9%) | 63,653 (6.6%) |
| 45 to 49 Years | 64,849 (6.8%) | 64,114 (6.7%) |
| 50 to 54 Years | 63,687 (6.7%) | 65,388 (6.8%) |
| 55 to 59 Years | 61,636 (6.5%) | 62,953 (6.5%) |
| 60 to 64 Years | 55,309 (5.8%) | 59,258 (6.2%) |
| 65 to 69 Years | 44,821 (4.7%) | 50,057 (5.2%) |
| 70 to 74 Years | 31,633 (3.3%) | 39,062 (4.1%) |
| 75 to 79 Years | 21,474 (2.3%) | 27,859 (2.9%) |
| 80 to 84 Years | 13,920 (1.5%) | 21,288 (2.2%) |
| 85 Years and over | 14,495 (1.5%) | 26,440 (2.8%) |
| Total | 951,928 (100.0%) | 962,731 (100.0%) |
Families and Households in Area Code 626
Median Family Size in Area Code 626
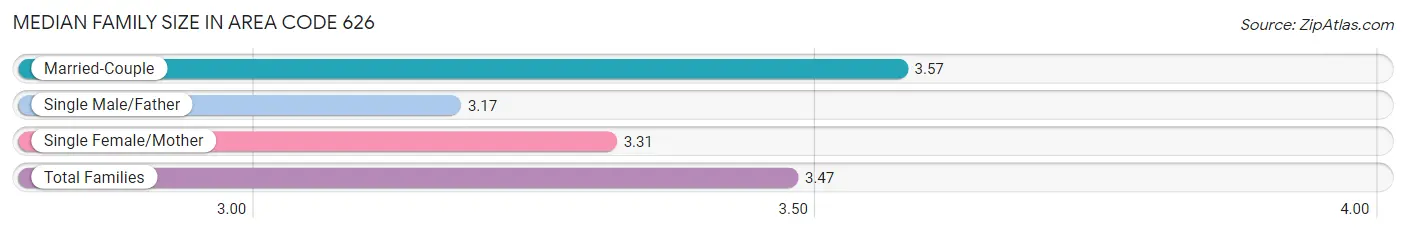
The median family size in Area Code 626 is 3.47 persons per family, with married-couple families (292,607 | 67.6%) accounting for the largest median family size of 3.57264 persons per family. On the other hand, single male/father families (47,428 | 11.0%) represent the smallest median family size with 3.17 persons per family.
| Family Type | # Families | Family Size |
| Married-Couple | 292,607 (67.6%) | 3.57 |
| Single Male/Father | 47,428 (11.0%) | 3.17 |
| Single Female/Mother | 92,897 (21.5%) | 3.31 |
| Total Families | 432,932 (100.0%) | 3.47 |
Median Household Size in Area Code 626
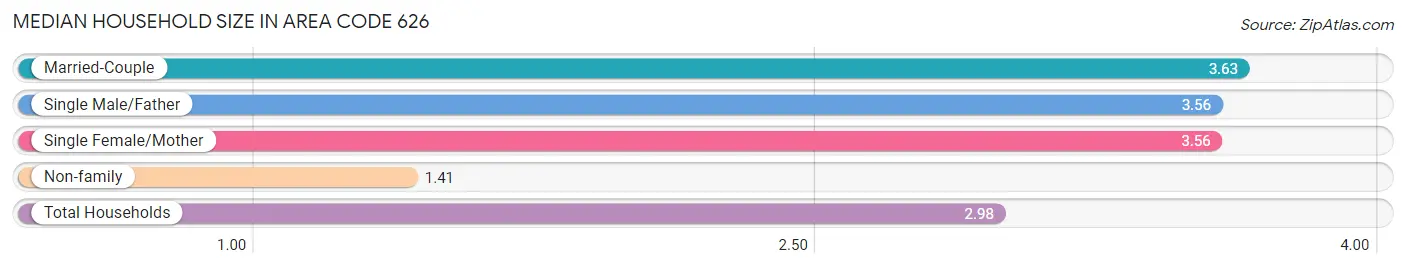
The median household size in Area Code 626 is 2.98 persons per household, with married-couple households (292,607 | 47.4%) accounting for the largest median household size of 3.6332 persons per household. non-family households (184,690 | 29.9%) represent the smallest median household size with 1.41 persons per household.
| Household Type | # Households | Household Size |
| Married-Couple | 292,607 (47.4%) | 3.63 |
| Single Male/Father | 47,428 (7.7%) | 3.56 |
| Single Female/Mother | 92,897 (15.0%) | 3.56 |
| Non-family | 184,690 (29.9%) | 1.41 |
| Total Households | 617,622 (100.0%) | 2.98 |
Household Size by Marriage Status in Area Code 626
Out of a total of 617,622 households in Area Code 626, 432,932 (70.1%) are family households, while 184,690 (29.9%) are nonfamily households. The most numerous type of family households are 2-person households, comprising 138,999, and the most common type of nonfamily households are 1-person households, comprising 139,119.
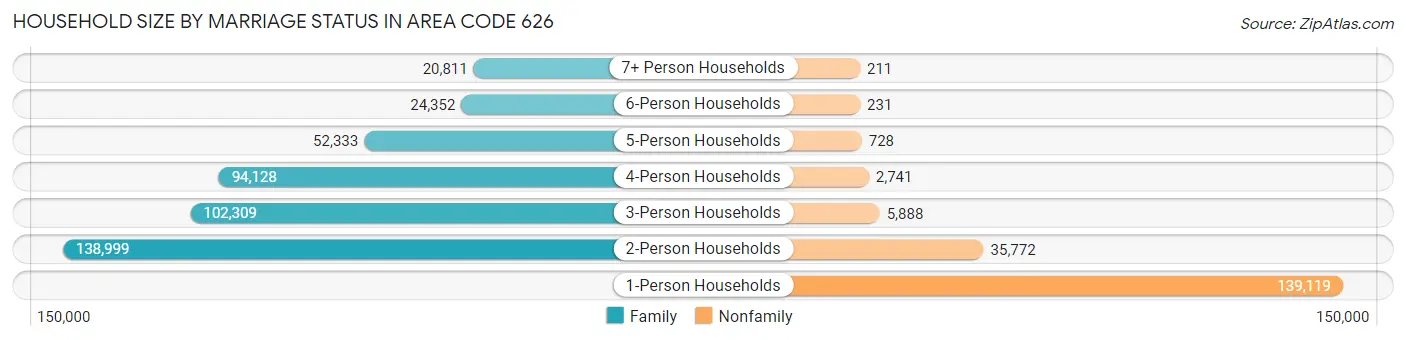
| Household Size | Family Households | Nonfamily Households |
| 1-Person Households | - | 139,119 (22.5%) |
| 2-Person Households | 138,999 (22.5%) | 35,772 (5.8%) |
| 3-Person Households | 102,309 (16.6%) | 5,888 (0.9%) |
| 4-Person Households | 94,128 (15.2%) | 2,741 (0.4%) |
| 5-Person Households | 52,333 (8.5%) | 728 (0.1%) |
| 6-Person Households | 24,352 (3.9%) | 231 (0.0%) |
| 7+ Person Households | 20,811 (3.4%) | 211 (0.0%) |
| Total | 432,932 (70.1%) | 184,690 (29.9%) |
Female Fertility in Area Code 626
Fertility by Age in Area Code 626
Average fertility rate in Area Code 626 is 38.9 births per 1,000 women. Women in the age bracket of 20 to 34 years have the highest fertility rate with 56.7 births per 1,000 women. Women in the age bracket of 20 to 34 years acount for 61.5% of all women with births.
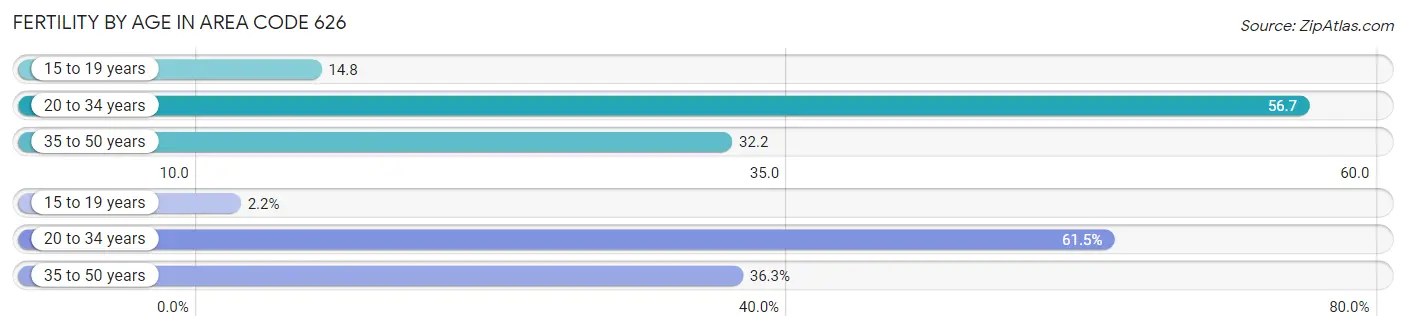
| Age Bracket | Women with Births | Births / 1,000 Women |
| 15 to 19 years | 416 (2.2%) | 14.8 |
| 20 to 34 years | 11,548 (61.5%) | 56.7 |
| 35 to 50 years | 6,815 (36.3%) | 32.2 |
| Total | 18,779 (100.0%) | 38.9 |
Fertility by Age by Marriage Status in Area Code 626
69.7% of women with births (18,779) in Area Code 626 are married. The highest percentage of unmarried women with births falls into 15 to 19 years age bracket with 88.7% of them unmarried at the time of birth, while the lowest percentage of unmarried women with births belong to 35 to 50 years age bracket with 25.3% of them unmarried.
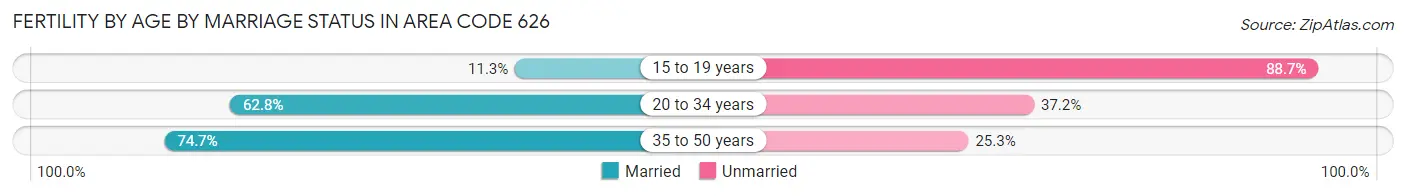
| Age Bracket | Married | Unmarried |
| 15 to 19 years | 47 (11.3%) | 369 (88.7%) |
| 20 to 34 years | 7,250 (62.8%) | 4,298 (37.2%) |
| 35 to 50 years | 5,089 (74.7%) | 1,726 (25.3%) |
| Total | 13,098 (69.8%) | 5,681 (30.2%) |
Fertility by Education in Area Code 626
Average fertility rate in Area Code 626 is 38.9 births per 1,000 women. Women with the education attainment of graduate degree have the highest fertility rate of 57.2 births per 1,000 women, while women with the education attainment of less than high school have the lowest fertility at 28.1 births per 1,000 women. Women with the education attainment of college or associate's degree represent 26.0% of all women with births.
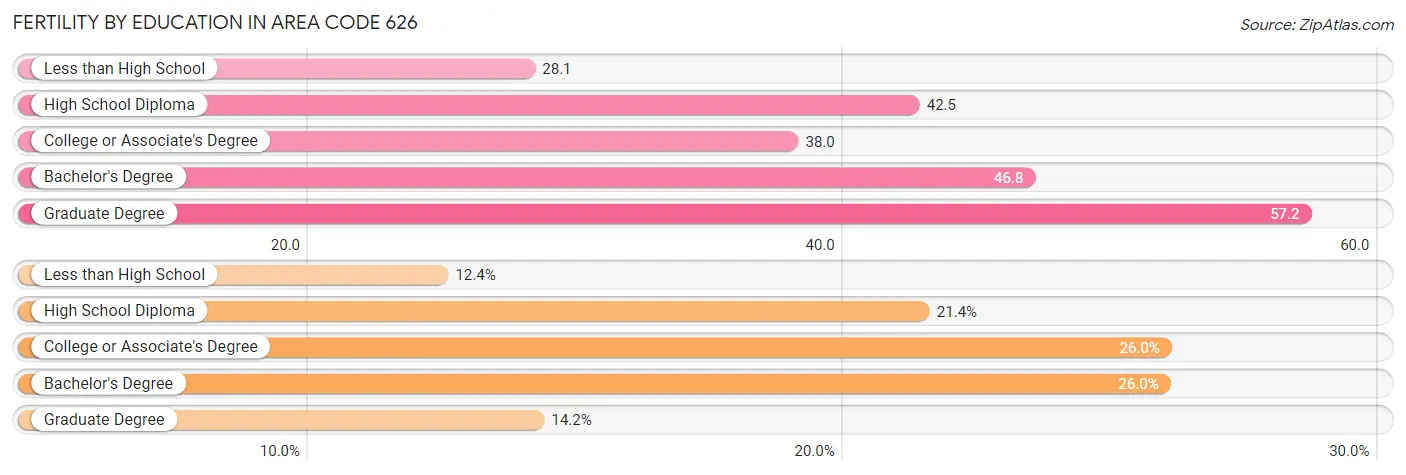
| Educational Attainment | Women with Births | Births / 1,000 Women |
| Less than High School | 2,332 (12.4%) | 28.1 |
| High School Diploma | 4,027 (21.4%) | 42.5 |
| College or Associate's Degree | 4,876 (26.0%) | 38.0 |
| Bachelor's Degree | 4,873 (26.0%) | 46.8 |
| Graduate Degree | 2,671 (14.2%) | 57.2 |
| Total | 18,779 (100.0%) | 38.9 |
Fertility by Education by Marriage Status in Area Code 626
30.2% of women with births in Area Code 626 are unmarried. Women with the educational attainment of bachelor's degree are most likely to be married with 73.5% of them married at childbirth, while women with the educational attainment of high school diploma are least likely to be married with 55.7% of them unmarried at childbirth.
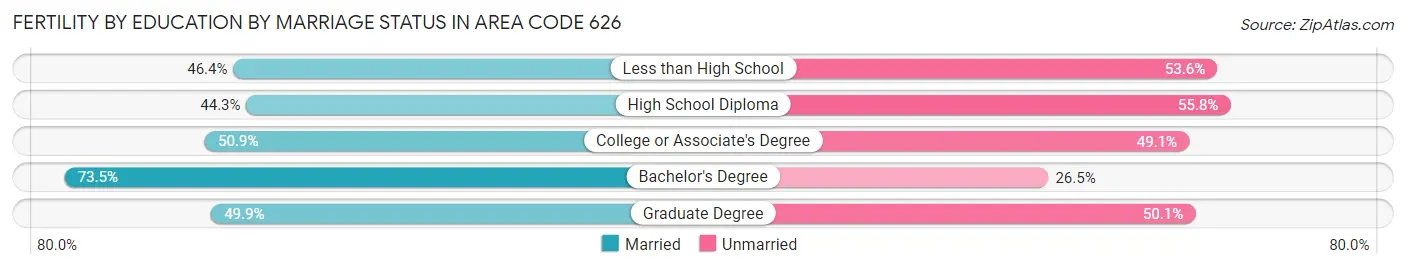
| Educational Attainment | Married | Unmarried |
| Less than High School | 1,081 (46.4%) | 1,251 (53.6%) |
| High School Diploma | 1,782 (44.3%) | 2,245 (55.7%) |
| College or Associate's Degree | 2,482 (50.9%) | 2,394 (49.1%) |
| Bachelor's Degree | 3,583 (73.5%) | 1,290 (26.5%) |
| Graduate Degree | 1,333 (49.9%) | 1,338 (50.1%) |
| Total | 13,098 (69.8%) | 5,681 (30.2%) |
Employment Characteristics in Area Code 626
Employment by Class of Employer in Area Code 626
Among the 923,470 employed individuals in Area Code 626, private company employees (617,018 | 66.8%), local government employees (79,880 | 8.6%), and not-for-profit organizations (73,588 | 8.0%) make up the most common classes of employment.
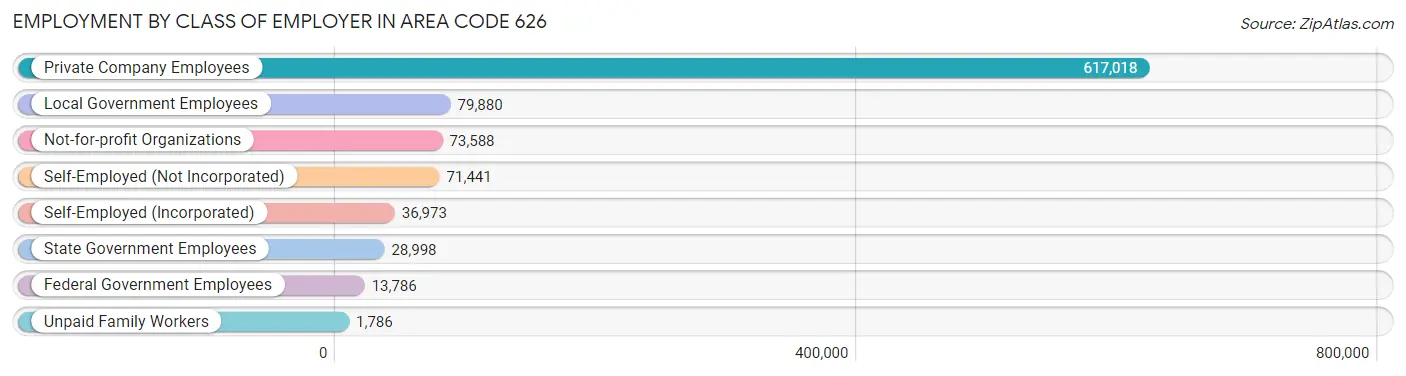
| Employer Class | # Employees | % Employees |
| Private Company Employees | 617,018 | 66.8% |
| Self-Employed (Incorporated) | 36,973 | 4.0% |
| Self-Employed (Not Incorporated) | 71,441 | 7.7% |
| Not-for-profit Organizations | 73,588 | 8.0% |
| Local Government Employees | 79,880 | 8.6% |
| State Government Employees | 28,998 | 3.1% |
| Federal Government Employees | 13,786 | 1.5% |
| Unpaid Family Workers | 1,786 | 0.2% |
| Total | 923,470 | 100.0% |
Employment Status by Age in Area Code 626
According to the labor force statistics for Area Code 626, out of the total population over 16 years of age (1,574,427), 63.7% or 1,003,697 individuals are in the labor force, with 7.0% or 70,359 of them unemployed. The age group with the highest labor force participation rate is 35 to 44 years, with 84.2% or 223,143 individuals in the labor force. Within the labor force, the 16 to 19 years age range has the highest percentage of unemployed individuals, with 986.6% or 243,848 of them being unemployed.
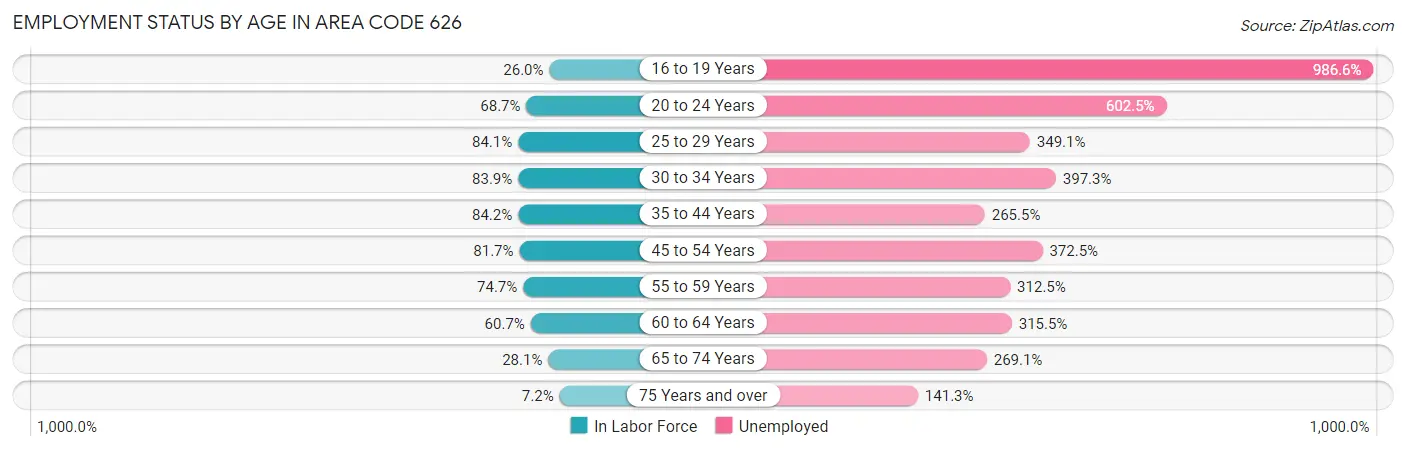
| Age Bracket | In Labor Force | Unemployed |
| 16 to 19 Years | 24,719 (26.0%) | 243,848 (986.6%) |
| 20 to 24 Years | 89,820 (68.7%) | 541,141 (602.5%) |
| 25 to 29 Years | 124,332 (84.1%) | 434,019 (349.1%) |
| 30 to 34 Years | 123,601 (83.9%) | 491,083 (397.3%) |
| 35 to 44 Years | 223,152 (84.2%) | 592,445 (265.5%) |
| 45 to 54 Years | 210,827 (81.7%) | 785,293 (372.5%) |
| 55 to 59 Years | 93,061 (74.7%) | 290,800 (312.5%) |
| 60 to 64 Years | 69,527 (60.7%) | 219,370 (315.5%) |
| 65 to 74 Years | 46,507 (28.1%) | 125,156 (269.1%) |
| 75 Years and over | 9,051 (7.2%) | 12,783 (141.3%) |
| Total | 1,003,654 (63.7%) | 70,368 (7.0%) |
Employment Status by Educational Attainment in Area Code 626
According to labor force statistics for Area Code 626, 79.6% of individuals (841,655) out of the total population between 25 and 64 years of age (1,057,489) are in the labor force, with 334.2% or 2,812,811 of them being unemployed. The group with the highest labor force participation rate are those with the educational attainment of bachelor's degree or higher, with 86.7% or 318,093 individuals in the labor force. Within the labor force, individuals with less than high school education have the highest percentage of unemployment, with 415.0% or 507,350 of them being unemployed.
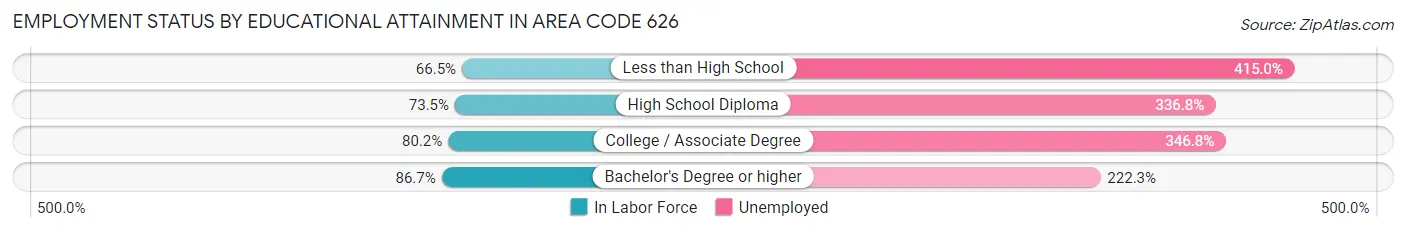
| Educational Attainment | In Labor Force | Unemployed |
| Less than High School | 122,258 (66.5%) | 763,048 (415.0%) |
| High School Diploma | 173,258 (73.5%) | 794,104 (336.8%) |
| College / Associate Degree | 217,167 (80.2%) | 939,519 (346.8%) |
| Bachelor's Degree or higher | 318,103 (86.7%) | 815,690 (222.3%) |
| Total | 841,607 (79.6%) | 3,534,128 (334.2%) |
Employment Occupations by Sex in Area Code 626
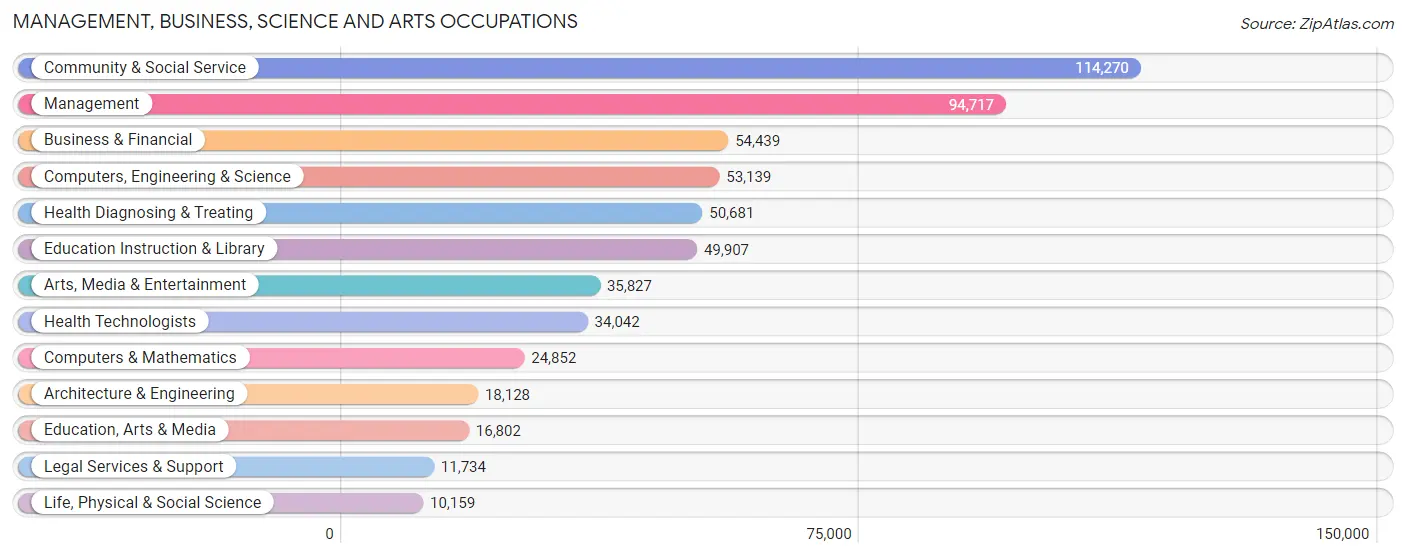
Management, Business, Science and Arts Occupations
The most common Management, Business, Science and Arts occupations in Area Code 626 are Community & Social Service (114,270 | 12.0%), Management (94,717 | 10.0%), Business & Financial (54,439 | 5.7%), Computers, Engineering & Science (53,139 | 5.6%), and Health Diagnosing & Treating (50,681 | 5.3%).
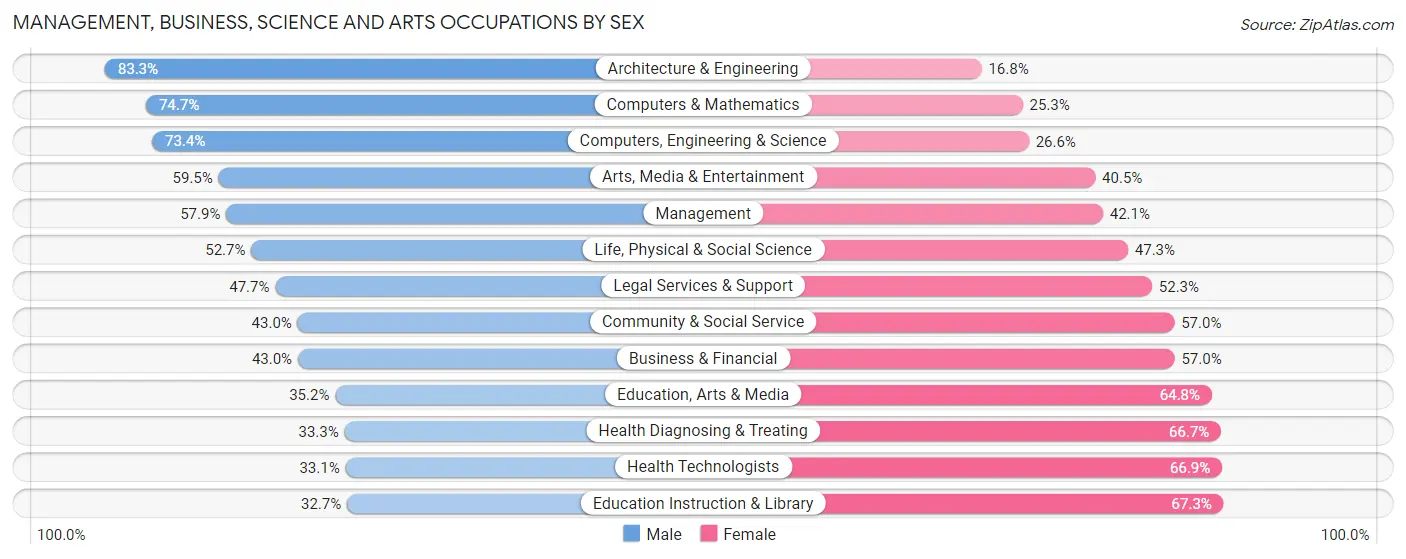
Management, Business, Science and Arts Occupations by Sex
Within the Management, Business, Science and Arts occupations in Area Code 626, the most male-oriented occupations are Architecture & Engineering (83.3%), Computers & Mathematics (74.7%), and Computers, Engineering & Science (73.4%), while the most female-oriented occupations are Education Instruction & Library (67.3%), Health Technologists (66.9%), and Health Diagnosing & Treating (66.7%).
| Occupation | Male | Female |
| Management | 54,881 (57.9%) | 39,836 (42.1%) |
| Business & Financial | 23,397 (43.0%) | 31,042 (57.0%) |
| Computers, Engineering & Science | 39,002 (73.4%) | 14,137 (26.6%) |
| Computers & Mathematics | 18,556 (74.7%) | 6,296 (25.3%) |
| Architecture & Engineering | 15,091 (83.3%) | 3,037 (16.8%) |
| Life, Physical & Social Science | 5,355 (52.7%) | 4,804 (47.3%) |
| Community & Social Service | 49,183 (43.0%) | 65,087 (57.0%) |
| Education, Arts & Media | 5,915 (35.2%) | 10,887 (64.8%) |
| Legal Services & Support | 5,597 (47.7%) | 6,137 (52.3%) |
| Education Instruction & Library | 16,342 (32.7%) | 33,565 (67.3%) |
| Arts, Media & Entertainment | 21,329 (59.5%) | 14,498 (40.5%) |
| Health Diagnosing & Treating | 16,856 (33.3%) | 33,825 (66.7%) |
| Health Technologists | 11,254 (33.1%) | 22,788 (66.9%) |
| Total (Category) | 183,319 (49.9%) | 183,927 (50.1%) |
| Total (Overall) | 514,802 (54.2%) | 434,436 (45.8%) |
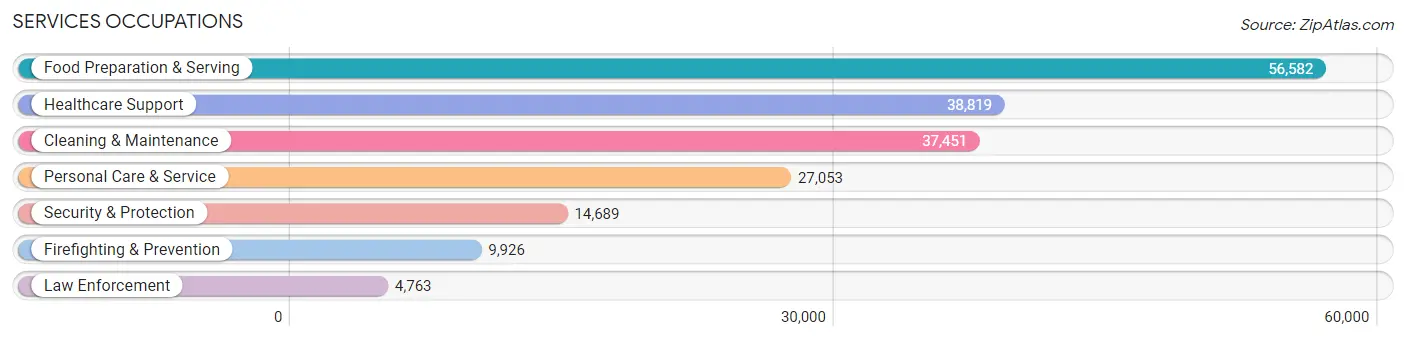
Services Occupations
The most common Services occupations in Area Code 626 are Food Preparation & Serving (56,582 | 6.0%), Healthcare Support (38,819 | 4.1%), Cleaning & Maintenance (37,451 | 4.0%), Personal Care & Service (27,053 | 2.9%), and Security & Protection (14,689 | 1.5%).
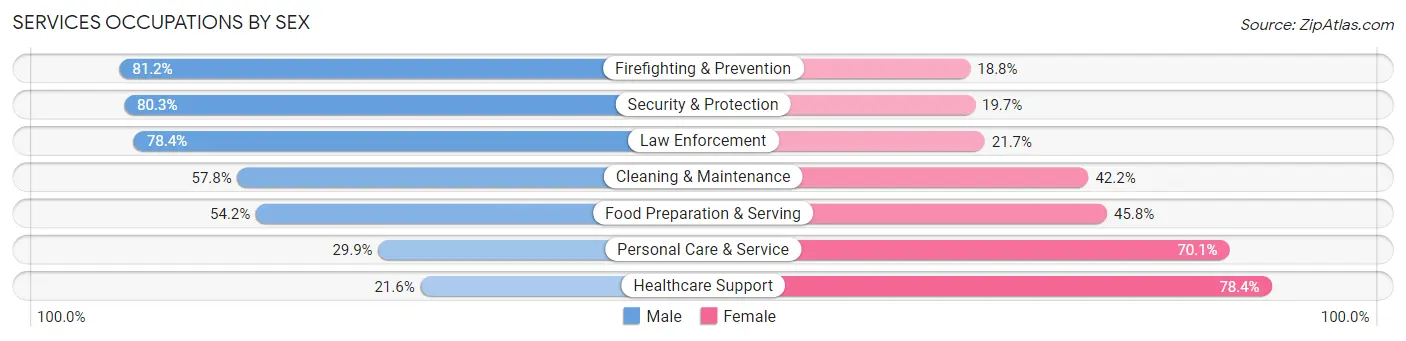
Services Occupations by Sex
Within the Services occupations in Area Code 626, the most male-oriented occupations are Firefighting & Prevention (81.2%), Security & Protection (80.3%), and Law Enforcement (78.3%), while the most female-oriented occupations are Healthcare Support (78.4%), Personal Care & Service (70.1%), and Food Preparation & Serving (45.8%).
| Occupation | Male | Female |
| Healthcare Support | 8,389 (21.6%) | 30,430 (78.4%) |
| Security & Protection | 11,795 (80.3%) | 2,894 (19.7%) |
| Firefighting & Prevention | 8,063 (81.2%) | 1,863 (18.8%) |
| Law Enforcement | 3,732 (78.3%) | 1,031 (21.6%) |
| Food Preparation & Serving | 30,645 (54.2%) | 25,937 (45.8%) |
| Cleaning & Maintenance | 21,657 (57.8%) | 15,794 (42.2%) |
| Personal Care & Service | 8,096 (29.9%) | 18,957 (70.1%) |
| Total (Category) | 80,582 (46.2%) | 94,012 (53.8%) |
| Total (Overall) | 514,802 (54.2%) | 434,436 (45.8%) |
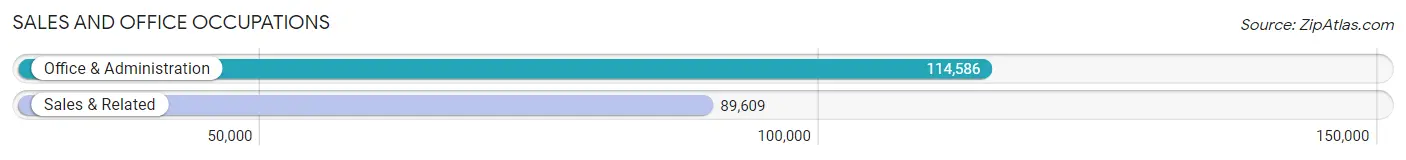
Sales and Office Occupations
The most common Sales and Office occupations in Area Code 626 are Office & Administration (114,586 | 12.1%), and Sales & Related (89,609 | 9.4%).
Sales and Office Occupations by Sex
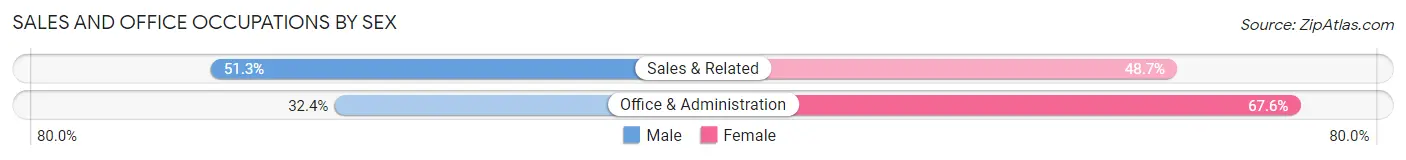
| Occupation | Male | Female |
| Sales & Related | 45,993 (51.3%) | 43,616 (48.7%) |
| Office & Administration | 37,091 (32.4%) | 77,495 (67.6%) |
| Total (Category) | 83,084 (40.7%) | 121,111 (59.3%) |
| Total (Overall) | 514,802 (54.2%) | 434,436 (45.8%) |
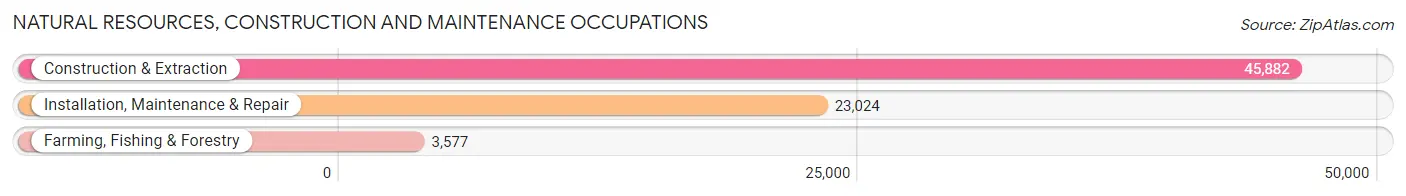
Natural Resources, Construction and Maintenance Occupations
The most common Natural Resources, Construction and Maintenance occupations in Area Code 626 are Construction & Extraction (45,882 | 4.8%), Installation, Maintenance & Repair (23,024 | 2.4%), and Farming, Fishing & Forestry (3,577 | 0.4%).
Natural Resources, Construction and Maintenance Occupations by Sex
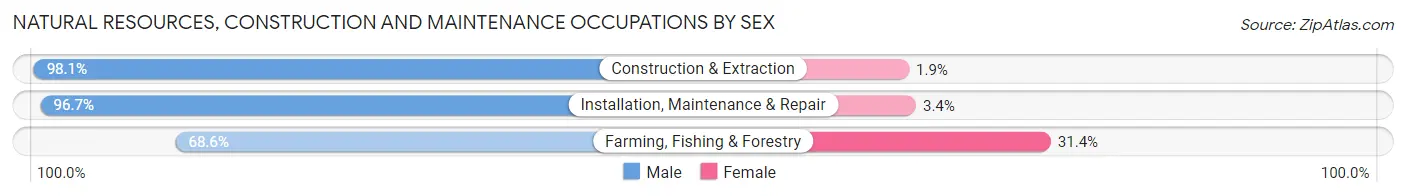
| Occupation | Male | Female |
| Farming, Fishing & Forestry | 2,453 (68.6%) | 1,124 (31.4%) |
| Construction & Extraction | 45,007 (98.1%) | 875 (1.9%) |
| Installation, Maintenance & Repair | 22,253 (96.7%) | 771 (3.4%) |
| Total (Category) | 69,713 (96.2%) | 2,770 (3.8%) |
| Total (Overall) | 514,802 (54.2%) | 434,436 (45.8%) |
Production, Transportation and Moving Occupations
The most common Production, Transportation and Moving occupations in Area Code 626 are Production (55,294 | 5.8%), Material Moving (39,401 | 4.2%), and Transportation (36,025 | 3.8%).
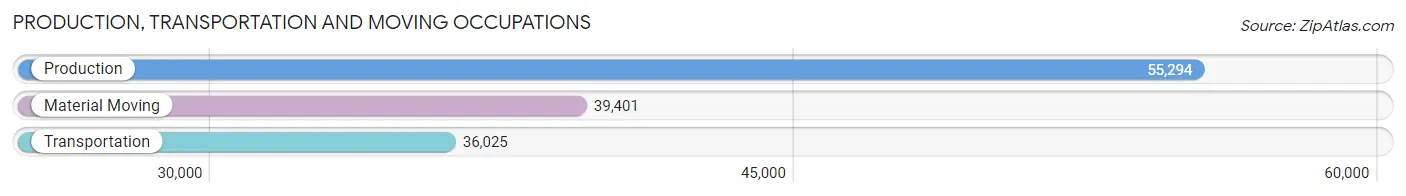
Production, Transportation and Moving Occupations by Sex
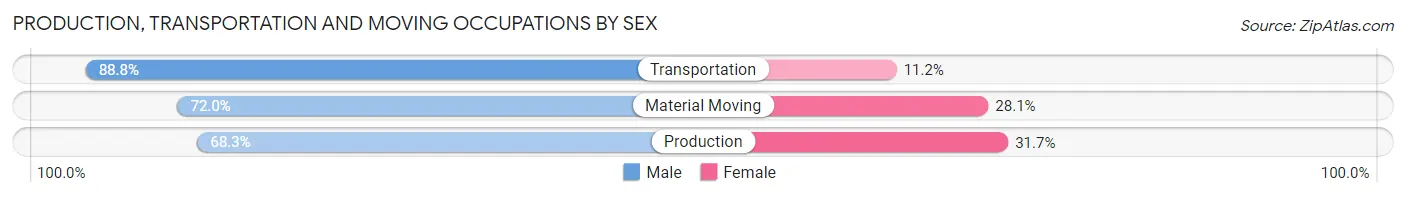
| Occupation | Male | Female |
| Production | 37,771 (68.3%) | 17,523 (31.7%) |
| Transportation | 31,983 (88.8%) | 4,042 (11.2%) |
| Material Moving | 28,350 (72.0%) | 11,051 (28.1%) |
| Total (Category) | 98,104 (75.0%) | 32,616 (24.9%) |
| Total (Overall) | 514,802 (54.2%) | 434,436 (45.8%) |
Employment Industries by Sex in Area Code 626
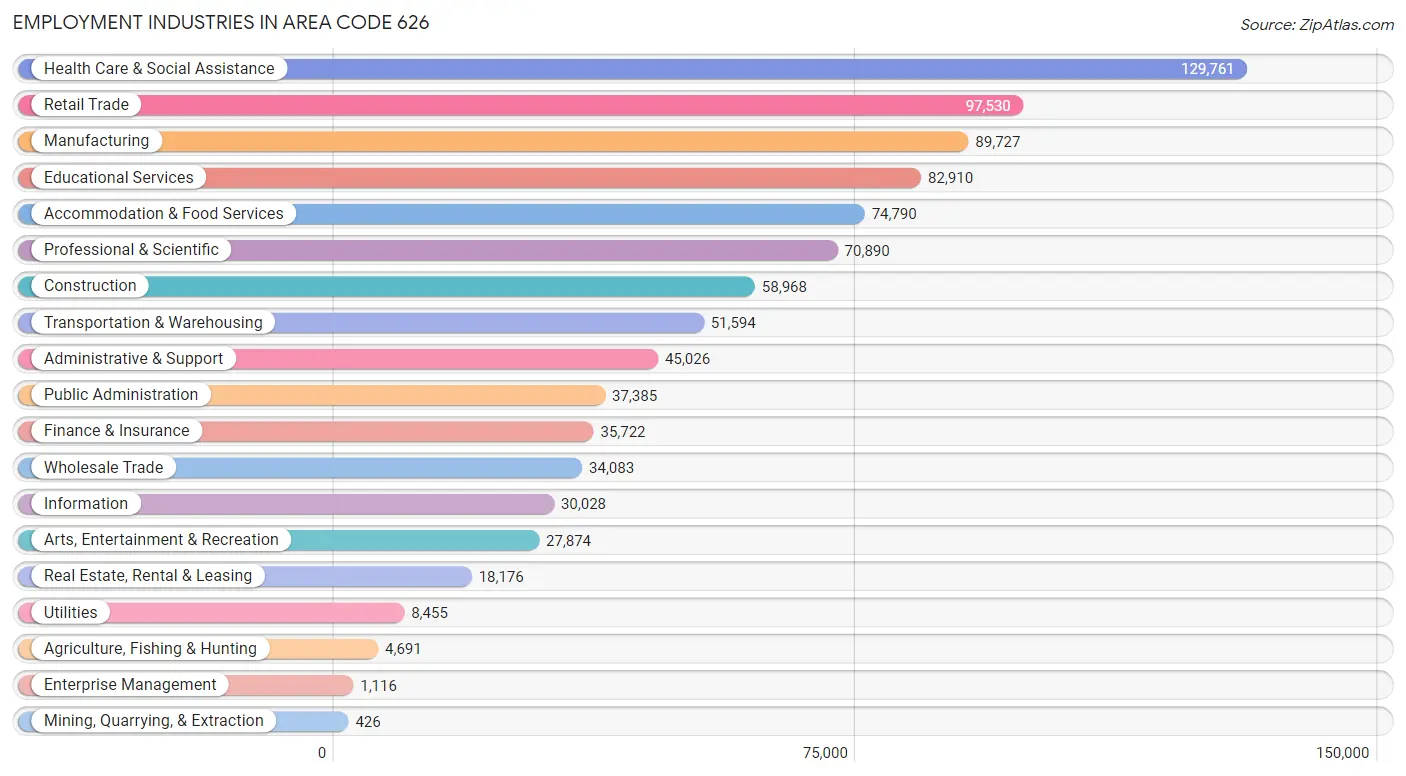
Employment Industries in Area Code 626
The major employment industries in Area Code 626 include Health Care & Social Assistance (129,761 | 13.7%), Retail Trade (97,530 | 10.3%), Manufacturing (89,727 | 9.5%), Educational Services (82,910 | 8.7%), and Accommodation & Food Services (74,790 | 7.9%).
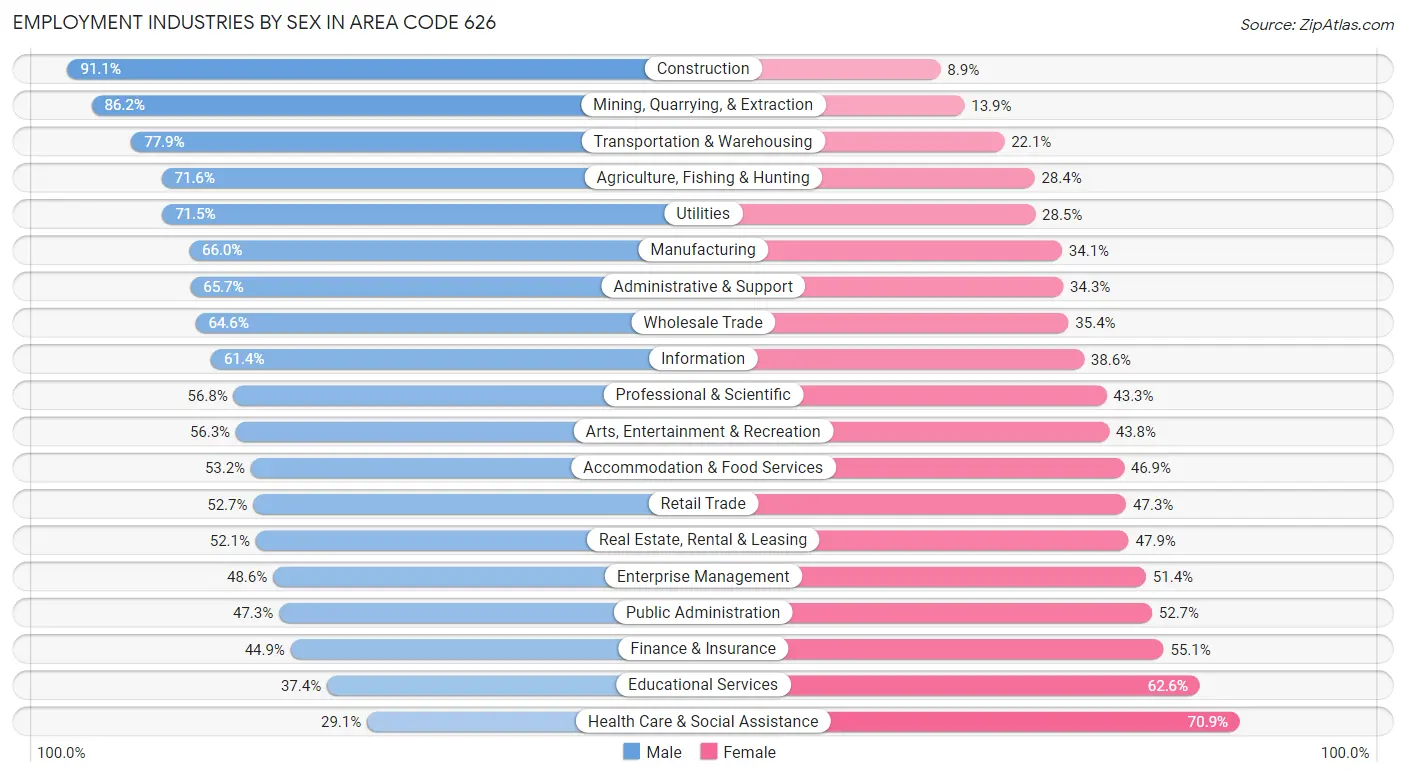
Employment Industries by Sex in Area Code 626
The Area Code 626 industries that see more men than women are Construction (91.1%), Mining, Quarrying, & Extraction (86.2%), and Transportation & Warehousing (77.9%), whereas the industries that tend to have a higher number of women are Health Care & Social Assistance (70.9%), Educational Services (62.6%), and Finance & Insurance (55.1%).
| Industry | Male | Female |
| Agriculture, Fishing & Hunting | 3,360 (71.6%) | 1,331 (28.4%) |
| Mining, Quarrying, & Extraction | 367 (86.2%) | 59 (13.9%) |
| Construction | 53,721 (91.1%) | 5,247 (8.9%) |
| Manufacturing | 59,172 (65.9%) | 30,555 (34.1%) |
| Wholesale Trade | 22,021 (64.6%) | 12,062 (35.4%) |
| Retail Trade | 51,358 (52.7%) | 46,172 (47.3%) |
| Transportation & Warehousing | 40,194 (77.9%) | 11,400 (22.1%) |
| Utilities | 6,045 (71.5%) | 2,410 (28.5%) |
| Information | 18,436 (61.4%) | 11,592 (38.6%) |
| Finance & Insurance | 16,045 (44.9%) | 19,677 (55.1%) |
| Real Estate, Rental & Leasing | 9,477 (52.1%) | 8,699 (47.9%) |
| Professional & Scientific | 40,232 (56.8%) | 30,658 (43.2%) |
| Enterprise Management | 542 (48.6%) | 574 (51.4%) |
| Administrative & Support | 29,578 (65.7%) | 15,448 (34.3%) |
| Educational Services | 31,018 (37.4%) | 51,892 (62.6%) |
| Health Care & Social Assistance | 37,785 (29.1%) | 91,976 (70.9%) |
| Arts, Entertainment & Recreation | 15,678 (56.2%) | 12,196 (43.8%) |
| Accommodation & Food Services | 39,750 (53.1%) | 35,040 (46.9%) |
| Public Administration | 17,693 (47.3%) | 19,692 (52.7%) |
| Total | 514,802 (54.2%) | 434,436 (45.8%) |
Education in Area Code 626
School Enrollment in Area Code 626
The most common levels of schooling among the 474,069 students in Area Code 626 are college / undergraduate (131,021 | 27.6%), high school (96,404 | 20.3%), and middle school (88,681 | 18.7%).
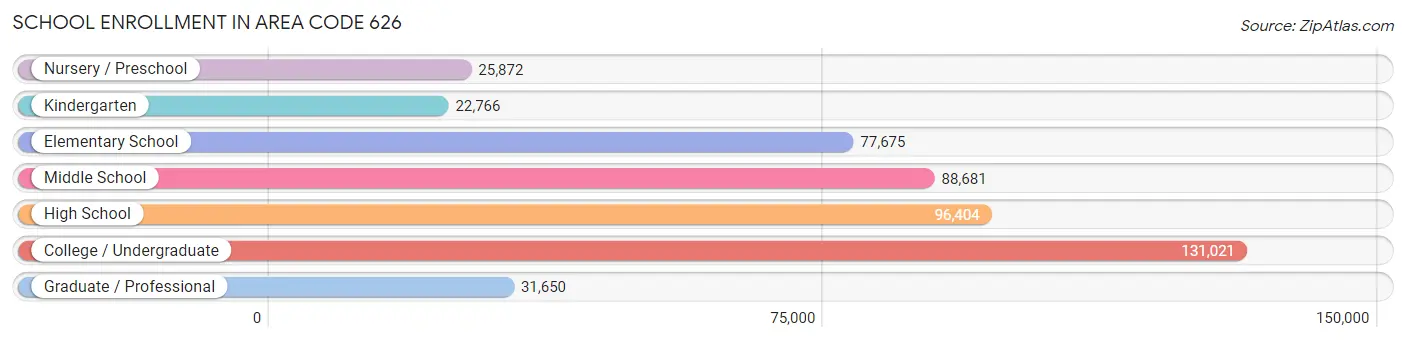
| School Level | # Students | % Students |
| Nursery / Preschool | 25,872 | 5.5% |
| Kindergarten | 22,766 | 4.8% |
| Elementary School | 77,675 | 16.4% |
| Middle School | 88,681 | 18.7% |
| High School | 96,404 | 20.3% |
| College / Undergraduate | 131,021 | 27.6% |
| Graduate / Professional | 31,650 | 6.7% |
| Total | 474,069 | 100.0% |
School Enrollment by Age by Funding Source in Area Code 626
Out of a total of 474,069 students who are enrolled in schools in Area Code 626, 77,561 (16.4%) attend a private institution, while the remaining 396,508 (83.6%) are enrolled in public schools. The age group of 3 to 4 year olds has the highest likelihood of being enrolled in private schools, with 8,625 (40.5% in the age bracket) enrolled. Conversely, the age group of 15 to 17 year olds has the lowest likelihood of being enrolled in a private school, with 61,378 (91.7% in the age bracket) attending a public institution.
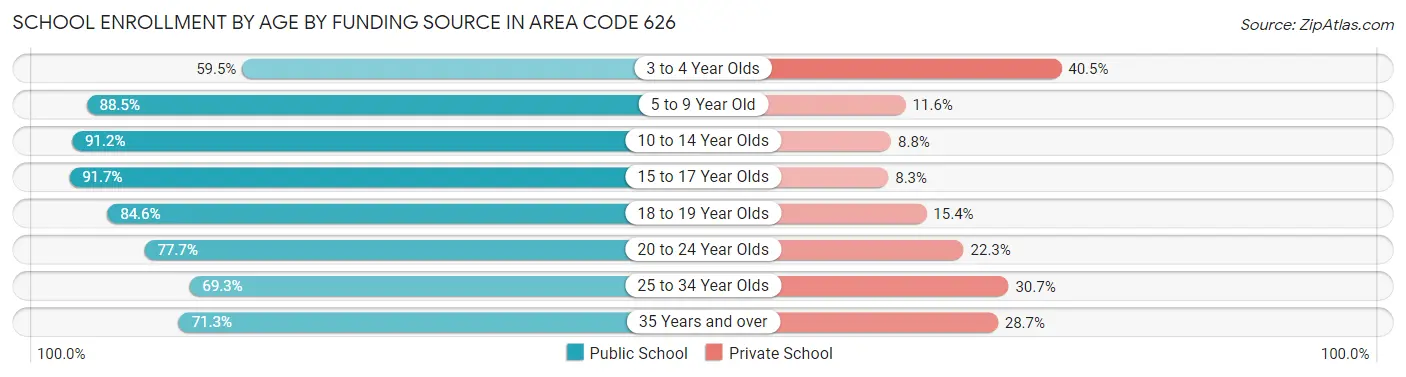
| Age Bracket | Public School | Private School |
| 3 to 4 Year Olds | 12,653 (59.5%) | 8,625 (40.5%) |
| 5 to 9 Year Old | 84,835 (88.4%) | 11,082 (11.6%) |
| 10 to 14 Year Olds | 103,604 (91.2%) | 10,030 (8.8%) |
| 15 to 17 Year Olds | 61,378 (91.7%) | 5,561 (8.3%) |
| 18 to 19 Year Olds | 33,248 (84.6%) | 6,056 (15.4%) |
| 20 to 24 Year Olds | 49,320 (77.7%) | 14,189 (22.3%) |
| 25 to 34 Year Olds | 30,856 (69.3%) | 13,672 (30.7%) |
| 35 Years and over | 20,646 (71.3%) | 8,314 (28.7%) |
| Total | 396,508 (83.6%) | 77,561 (16.4%) |
Educational Attainment by Field of Study in Area Code 626
Business (93,632 | 19.8%), social sciences (50,870 | 10.7%), science & technology (41,008 | 8.6%), visual & performing arts (38,386 | 8.1%), and engineering (38,022 | 8.0%) are the most common fields of study among 473,868 individuals in Area Code 626 who have obtained a bachelor's degree or higher.
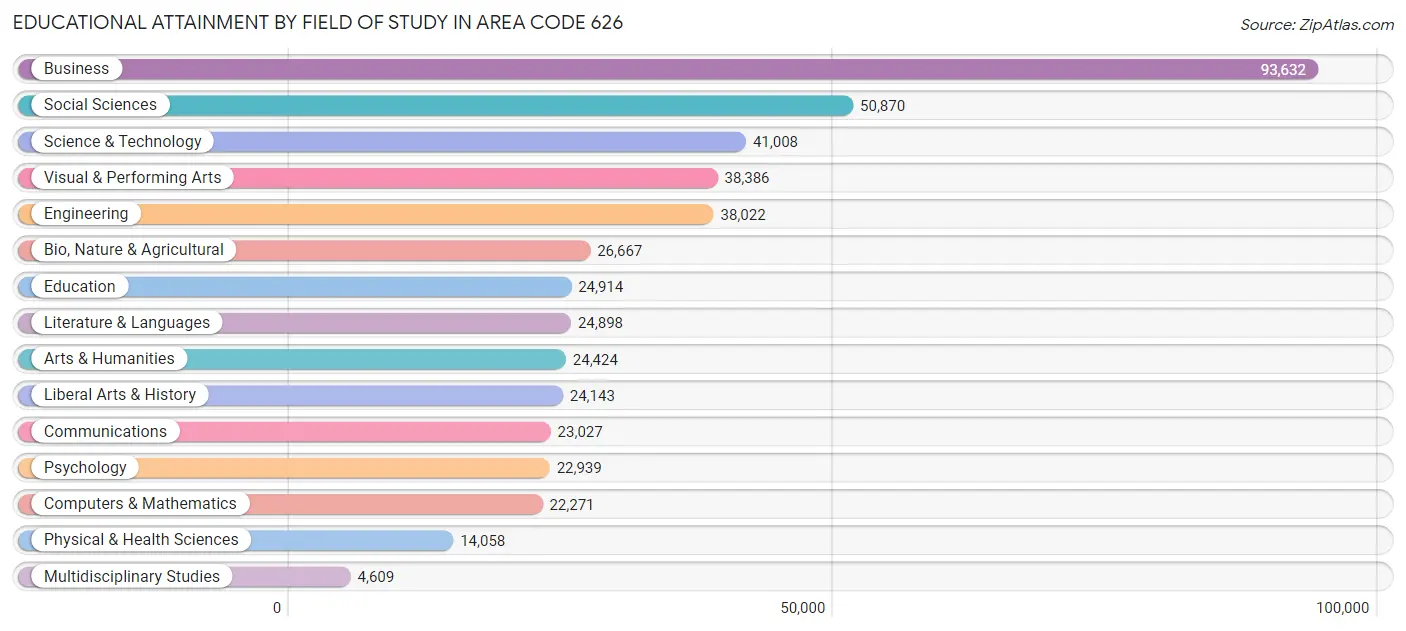
| Field of Study | # Graduates | % Graduates |
| Computers & Mathematics | 22,271 | 4.7% |
| Bio, Nature & Agricultural | 26,667 | 5.6% |
| Physical & Health Sciences | 14,058 | 3.0% |
| Psychology | 22,939 | 4.8% |
| Social Sciences | 50,870 | 10.7% |
| Engineering | 38,022 | 8.0% |
| Multidisciplinary Studies | 4,609 | 1.0% |
| Science & Technology | 41,008 | 8.6% |
| Business | 93,632 | 19.8% |
| Education | 24,914 | 5.3% |
| Literature & Languages | 24,898 | 5.2% |
| Liberal Arts & History | 24,143 | 5.1% |
| Visual & Performing Arts | 38,386 | 8.1% |
| Communications | 23,027 | 4.9% |
| Arts & Humanities | 24,424 | 5.1% |
| Total | 473,868 | 100.0% |
Transportation & Commute in Area Code 626
Vehicle Availability by Sex in Area Code 626
The most prevalent vehicle ownership categories in Area Code 626 are males with 2 vehicles (174,904, accounting for 35.0%) and females with 2 vehicles (143,106, making up 42.0%).
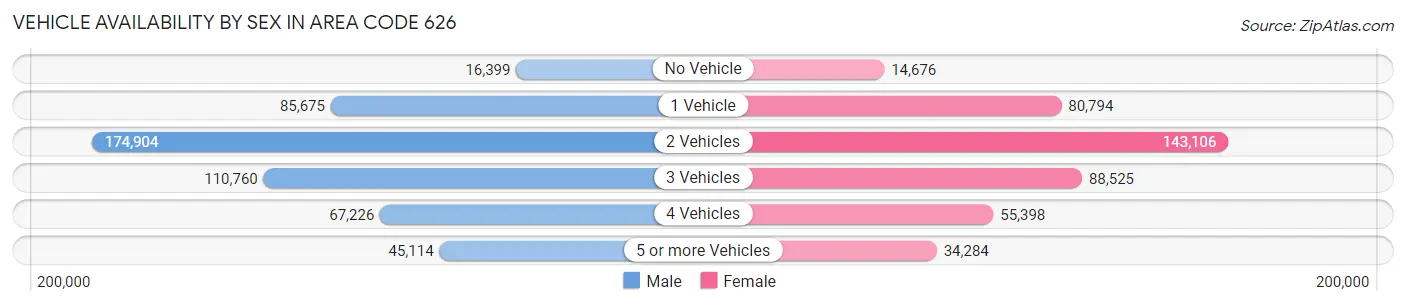
| Vehicles Available | Male | Female |
| No Vehicle | 16,399 (3.3%) | 14,676 (3.5%) |
| 1 Vehicle | 85,675 (17.1%) | 80,794 (19.4%) |
| 2 Vehicles | 174,904 (35.0%) | 143,106 (34.3%) |
| 3 Vehicles | 110,760 (22.2%) | 88,525 (21.2%) |
| 4 Vehicles | 67,226 (13.4%) | 55,398 (13.3%) |
| 5 or more Vehicles | 45,114 (9.0%) | 34,284 (8.2%) |
| Total | 500,078 (100.0%) | 416,783 (100.0%) |
Commute Time in Area Code 626
The most frequently occuring commute durations in Area Code 626 are 30 to 34 minutes (147,329 commuters, 18.1%), 20 to 24 minutes (108,832 commuters, 13.4%), and 15 to 19 minutes (108,033 commuters, 13.3%).
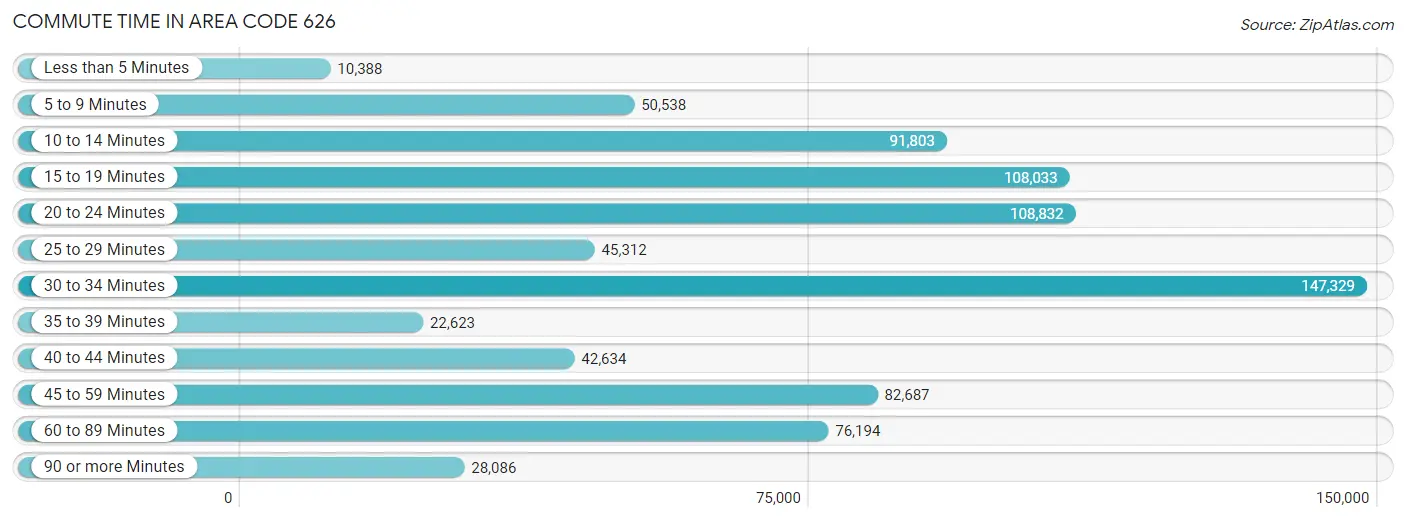
| Commute Time | # Commuters | % Commuters |
| Less than 5 Minutes | 10,388 | 1.3% |
| 5 to 9 Minutes | 50,538 | 6.2% |
| 10 to 14 Minutes | 91,803 | 11.3% |
| 15 to 19 Minutes | 108,033 | 13.3% |
| 20 to 24 Minutes | 108,832 | 13.4% |
| 25 to 29 Minutes | 45,312 | 5.6% |
| 30 to 34 Minutes | 147,329 | 18.1% |
| 35 to 39 Minutes | 22,623 | 2.8% |
| 40 to 44 Minutes | 42,634 | 5.2% |
| 45 to 59 Minutes | 82,687 | 10.2% |
| 60 to 89 Minutes | 76,194 | 9.4% |
| 90 or more Minutes | 28,086 | 3.5% |
Commute Time by Sex in Area Code 626
The most common commute times in Area Code 626 are 30 to 34 minutes (85,398 commuters, 19.0%) for males and 30 to 34 minutes (61,931 commuters, 17.0%) for females.
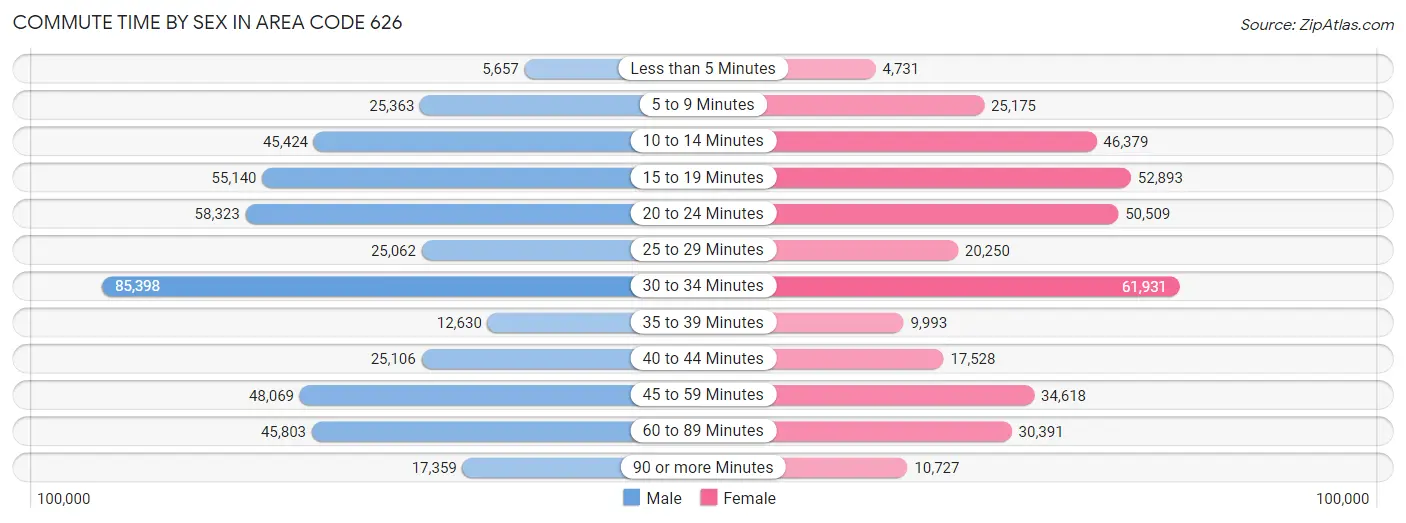
| Commute Time | Male | Female |
| Less than 5 Minutes | 5,657 (1.3%) | 4,731 (1.3%) |
| 5 to 9 Minutes | 25,363 (5.6%) | 25,175 (6.9%) |
| 10 to 14 Minutes | 45,424 (10.1%) | 46,379 (12.7%) |
| 15 to 19 Minutes | 55,140 (12.3%) | 52,893 (14.5%) |
| 20 to 24 Minutes | 58,323 (13.0%) | 50,509 (13.8%) |
| 25 to 29 Minutes | 25,062 (5.6%) | 20,250 (5.6%) |
| 30 to 34 Minutes | 85,398 (19.0%) | 61,931 (17.0%) |
| 35 to 39 Minutes | 12,630 (2.8%) | 9,993 (2.7%) |
| 40 to 44 Minutes | 25,106 (5.6%) | 17,528 (4.8%) |
| 45 to 59 Minutes | 48,069 (10.7%) | 34,618 (9.5%) |
| 60 to 89 Minutes | 45,803 (10.2%) | 30,391 (8.3%) |
| 90 or more Minutes | 17,359 (3.9%) | 10,727 (2.9%) |
Time of Departure to Work by Sex in Area Code 626
The most frequent times of departure to work in Area Code 626 are 8:00 AM to 8:29 AM (58,996, 13.1%) for males and 8:00 AM to 8:29 AM (53,463, 14.6%) for females.
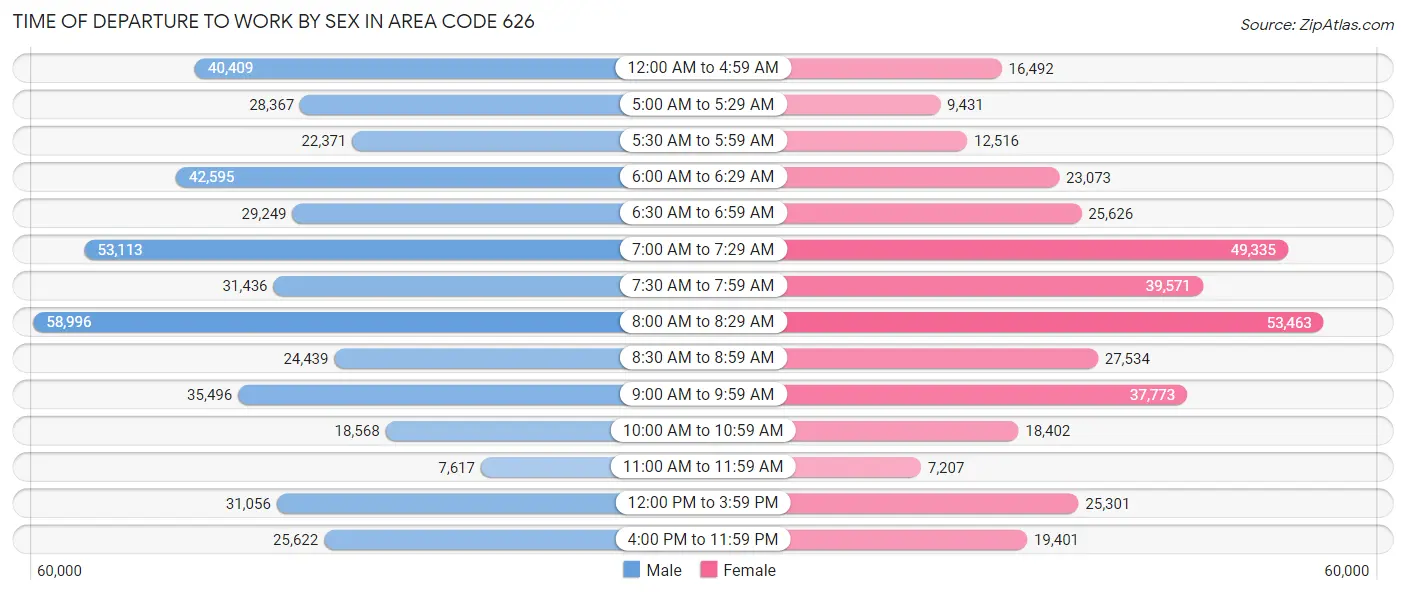
| Time of Departure | Male | Female |
| 12:00 AM to 4:59 AM | 40,409 (9.0%) | 16,492 (4.5%) |
| 5:00 AM to 5:29 AM | 28,367 (6.3%) | 9,431 (2.6%) |
| 5:30 AM to 5:59 AM | 22,371 (5.0%) | 12,516 (3.4%) |
| 6:00 AM to 6:29 AM | 42,595 (9.5%) | 23,073 (6.3%) |
| 6:30 AM to 6:59 AM | 29,249 (6.5%) | 25,626 (7.0%) |
| 7:00 AM to 7:29 AM | 53,113 (11.8%) | 49,335 (13.5%) |
| 7:30 AM to 7:59 AM | 31,436 (7.0%) | 39,571 (10.8%) |
| 8:00 AM to 8:29 AM | 58,996 (13.1%) | 53,463 (14.6%) |
| 8:30 AM to 8:59 AM | 24,439 (5.4%) | 27,534 (7.5%) |
| 9:00 AM to 9:59 AM | 35,496 (7.9%) | 37,773 (10.3%) |
| 10:00 AM to 10:59 AM | 18,568 (4.1%) | 18,402 (5.0%) |
| 11:00 AM to 11:59 AM | 7,617 (1.7%) | 7,207 (2.0%) |
| 12:00 PM to 3:59 PM | 31,056 (6.9%) | 25,301 (6.9%) |
| 4:00 PM to 11:59 PM | 25,622 (5.7%) | 19,401 (5.3%) |
| Total | 449,334 (100.0%) | 365,125 (100.0%) |
Housing Occupancy in Area Code 626
Occupancy by Ownership in Area Code 626
Of the total 617,622 dwellings in Area Code 626, owner-occupied units account for 307,650 (49.8%), while renter-occupied units make up 309,972 (50.2%).
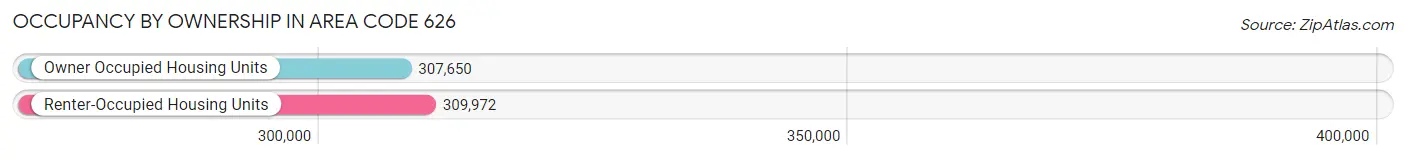
| Occupancy | # Housing Units | % Housing Units |
| Owner Occupied Housing Units | 307,650 | 49.8% |
| Renter-Occupied Housing Units | 309,972 | 50.2% |
| Total Occupied Housing Units | 617,622 | 100.0% |
Occupancy by Household Size in Area Code 626
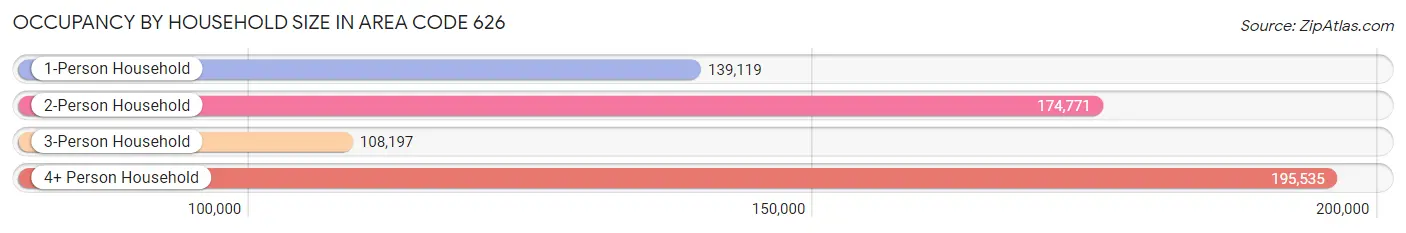
| Household Size | # Housing Units | % Housing Units |
| 1-Person Household | 139,119 | 22.5% |
| 2-Person Household | 174,771 | 28.3% |
| 3-Person Household | 108,197 | 17.5% |
| 4+ Person Household | 195,535 | 31.7% |
| Total Housing Units | 617,622 | 100.0% |
Occupancy by Ownership by Household Size in Area Code 626
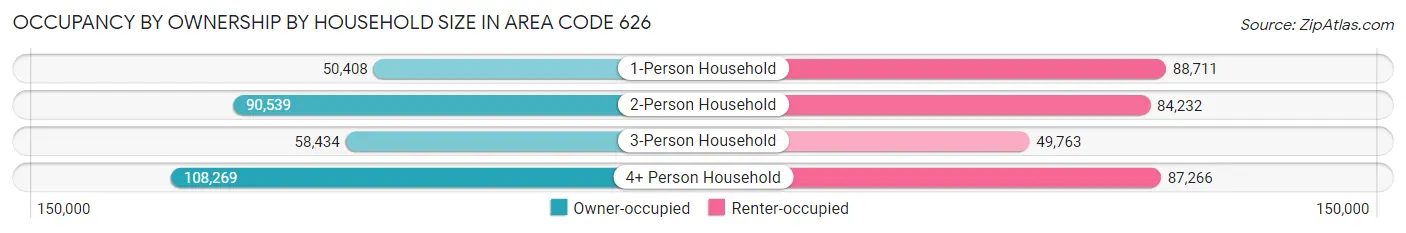
| Household Size | Owner-occupied | Renter-occupied |
| 1-Person Household | 50,408 (36.2%) | 88,711 (63.8%) |
| 2-Person Household | 90,539 (51.8%) | 84,232 (48.2%) |
| 3-Person Household | 58,434 (54.0%) | 49,763 (46.0%) |
| 4+ Person Household | 108,269 (55.4%) | 87,266 (44.6%) |
| Total Housing Units | 307,650 (49.8%) | 309,972 (50.2%) |
Occupancy by Educational Attainment in Area Code 626
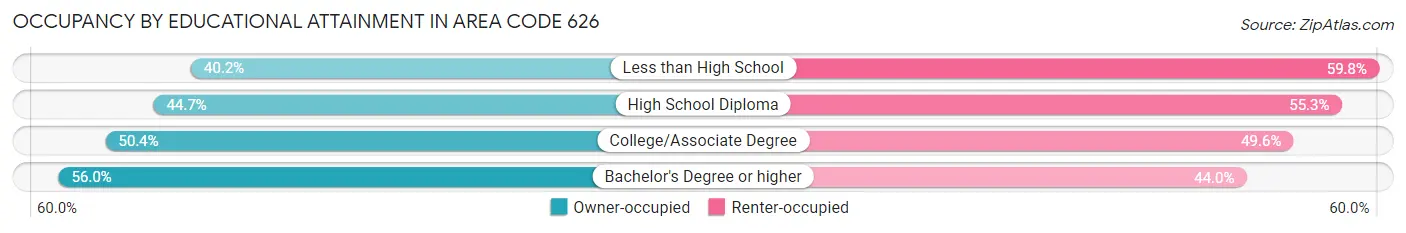
| Household Size | Owner-occupied | Renter-occupied |
| Less than High School | 40,999 (40.2%) | 60,952 (59.8%) |
| High School Diploma | 50,961 (44.7%) | 63,132 (55.3%) |
| College/Associate Degree | 82,027 (50.4%) | 80,759 (49.6%) |
| Bachelor's Degree or higher | 133,663 (56.0%) | 105,129 (44.0%) |
Occupancy by Age of Householder in Area Code 626
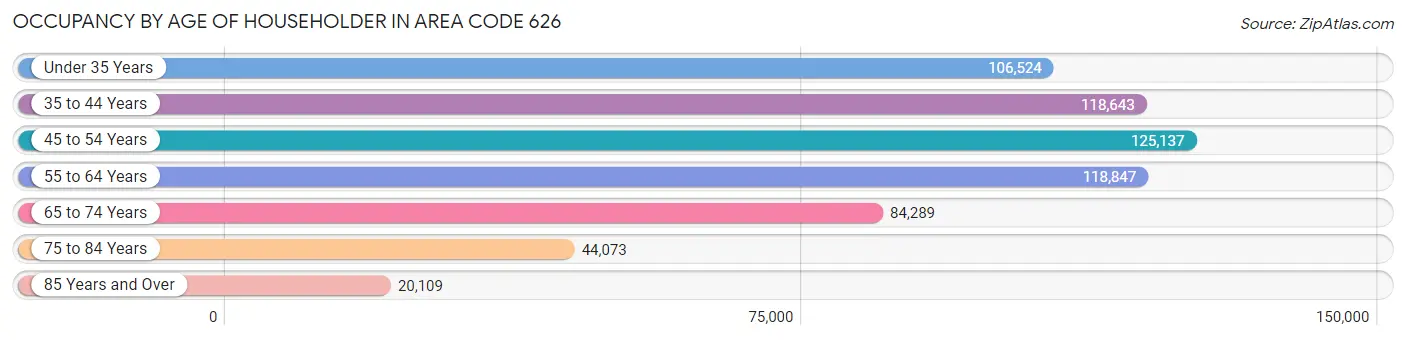
| Age Bracket | # Households | % Households |
| Under 35 Years | 106,524 | 17.2% |
| 35 to 44 Years | 118,643 | 19.2% |
| 45 to 54 Years | 125,137 | 20.3% |
| 55 to 64 Years | 118,847 | 19.2% |
| 65 to 74 Years | 84,289 | 13.7% |
| 75 to 84 Years | 44,073 | 7.1% |
| 85 Years and Over | 20,109 | 3.3% |
| Total | 617,622 | 100.0% |
Housing Finances in Area Code 626
Median Income by Occupancy in Area Code 626
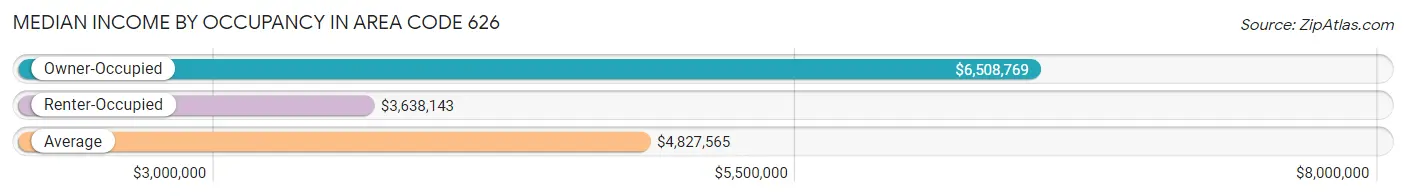
| Occupancy Type | # Households | Median Income |
| Owner-Occupied | 307,650 (49.8%) | $6,508,769 |
| Renter-Occupied | 309,972 (50.2%) | $3,638,143 |
| Average | 617,622 (100.0%) | $4,827,565 |
Occupancy by Householder Income Bracket in Area Code 626
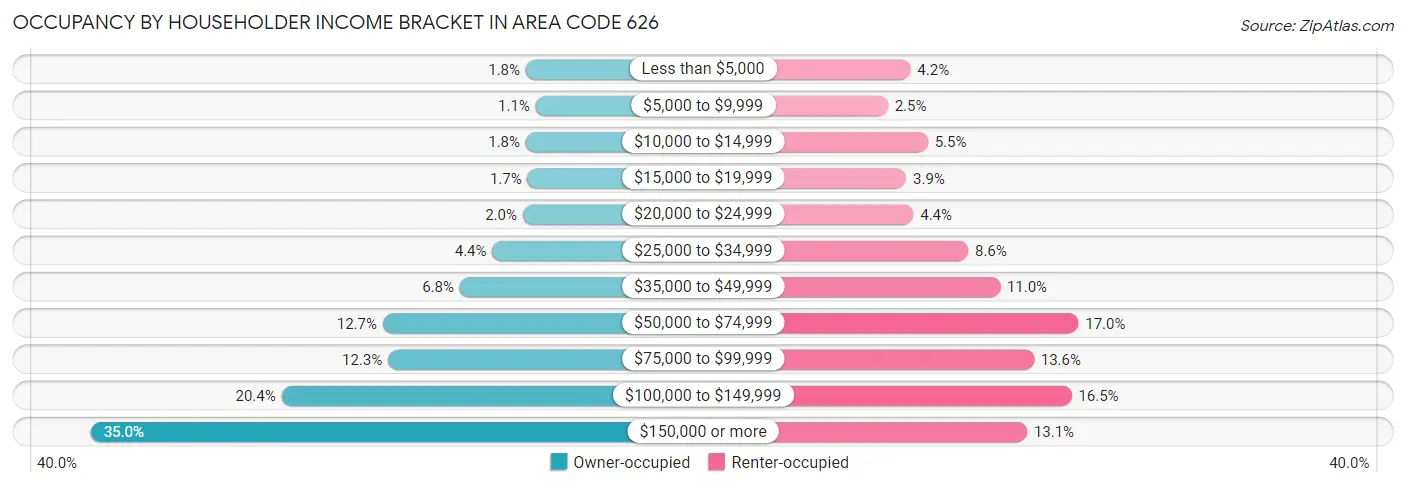
| Income Bracket | Owner-occupied | Renter-occupied |
| Less than $5,000 | 5,582 (1.8%) | 12,942 (4.2%) |
| $5,000 to $9,999 | 3,276 (1.1%) | 7,601 (2.5%) |
| $10,000 to $14,999 | 5,573 (1.8%) | 17,057 (5.5%) |
| $15,000 to $19,999 | 5,182 (1.7%) | 11,928 (3.8%) |
| $20,000 to $24,999 | 6,262 (2.0%) | 13,653 (4.4%) |
| $25,000 to $34,999 | 13,413 (4.4%) | 26,551 (8.6%) |
| $35,000 to $49,999 | 21,041 (6.8%) | 34,100 (11.0%) |
| $50,000 to $74,999 | 39,095 (12.7%) | 52,607 (17.0%) |
| $75,000 to $99,999 | 37,869 (12.3%) | 42,082 (13.6%) |
| $100,000 to $149,999 | 62,815 (20.4%) | 50,977 (16.5%) |
| $150,000 or more | 107,542 (35.0%) | 40,474 (13.1%) |
| Total | 307,650 (100.0%) | 309,972 (100.0%) |
Monthly Housing Cost Tiers in Area Code 626
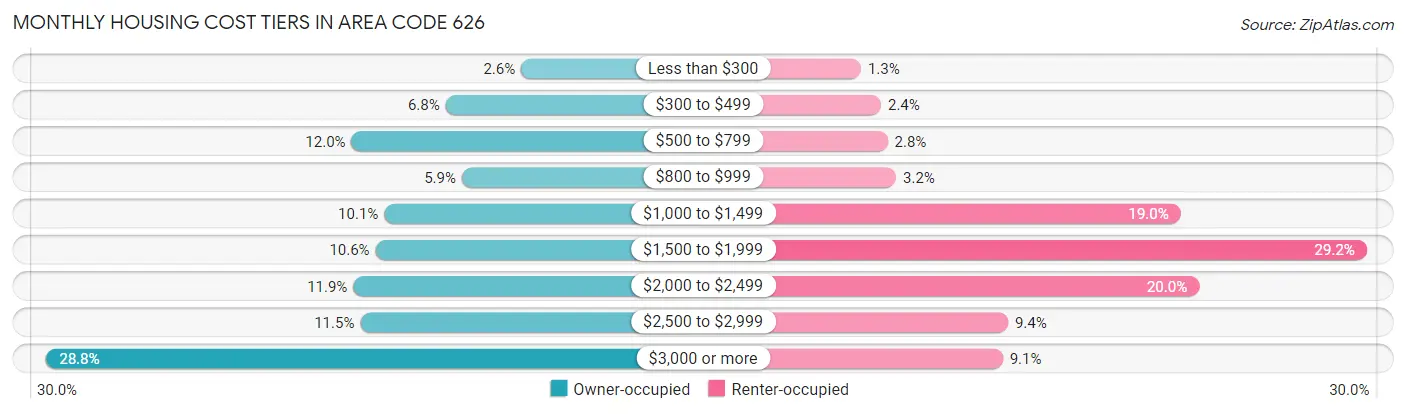
| Monthly Cost | Owner-occupied | Renter-occupied |
| Less than $300 | 7,940 (2.6%) | 4,028 (1.3%) |
| $300 to $499 | 20,780 (6.8%) | 7,479 (2.4%) |
| $500 to $799 | 36,758 (11.9%) | 8,581 (2.8%) |
| $800 to $999 | 17,994 (5.9%) | 10,031 (3.2%) |
| $1,000 to $1,499 | 31,191 (10.1%) | 58,726 (19.0%) |
| $1,500 to $1,999 | 32,677 (10.6%) | 90,606 (29.2%) |
| $2,000 to $2,499 | 36,450 (11.8%) | 61,888 (20.0%) |
| $2,500 to $2,999 | 35,243 (11.5%) | 29,205 (9.4%) |
| $3,000 or more | 88,617 (28.8%) | 28,313 (9.1%) |
| Total | 307,650 (100.0%) | 309,972 (100.0%) |
Physical Housing Characteristics in Area Code 626
Housing Structures in Area Code 626
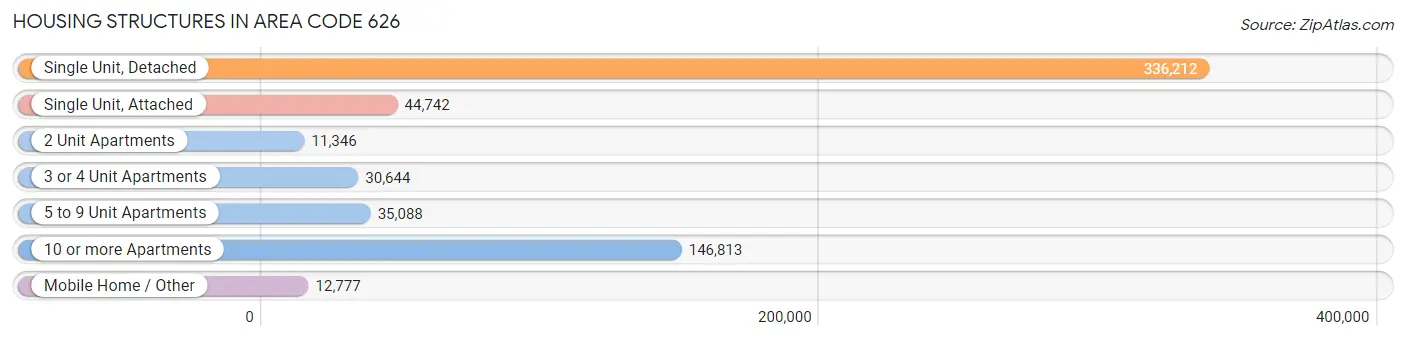
| Structure Type | # Housing Units | % Housing Units |
| Single Unit, Detached | 336,212 | 54.4% |
| Single Unit, Attached | 44,742 | 7.2% |
| 2 Unit Apartments | 11,346 | 1.8% |
| 3 or 4 Unit Apartments | 30,644 | 5.0% |
| 5 to 9 Unit Apartments | 35,088 | 5.7% |
| 10 or more Apartments | 146,813 | 23.8% |
| Mobile Home / Other | 12,777 | 2.1% |
| Total | 617,622 | 100.0% |
Housing Structures by Occupancy in Area Code 626
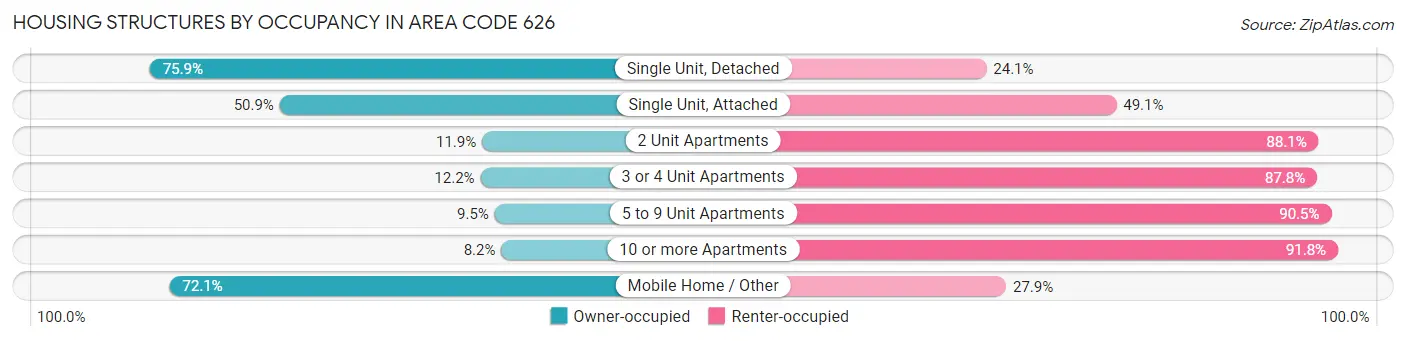
| Structure Type | Owner-occupied | Renter-occupied |
| Single Unit, Detached | 255,179 (75.9%) | 81,033 (24.1%) |
| Single Unit, Attached | 22,765 (50.9%) | 21,977 (49.1%) |
| 2 Unit Apartments | 1,354 (11.9%) | 9,992 (88.1%) |
| 3 or 4 Unit Apartments | 3,751 (12.2%) | 26,893 (87.8%) |
| 5 to 9 Unit Apartments | 3,331 (9.5%) | 31,757 (90.5%) |
| 10 or more Apartments | 12,057 (8.2%) | 134,756 (91.8%) |
| Mobile Home / Other | 9,213 (72.1%) | 3,564 (27.9%) |
| Total | 307,650 (49.8%) | 309,972 (50.2%) |
Housing Structures by Number of Rooms in Area Code 626
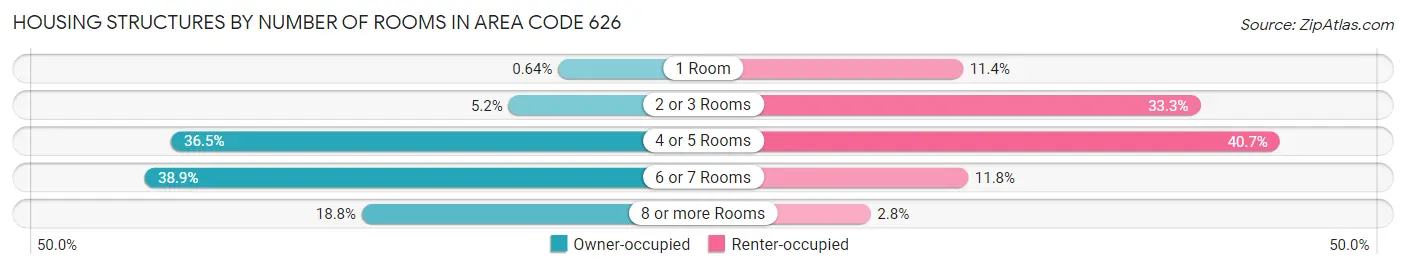
| Number of Rooms | Owner-occupied | Renter-occupied |
| 1 Room | 1,967 (0.6%) | 35,198 (11.4%) |
| 2 or 3 Rooms | 16,112 (5.2%) | 103,288 (33.3%) |
| 4 or 5 Rooms | 112,134 (36.4%) | 126,073 (40.7%) |
| 6 or 7 Rooms | 119,556 (38.9%) | 36,685 (11.8%) |
| 8 or more Rooms | 57,881 (18.8%) | 8,728 (2.8%) |
| Total | 307,650 (100.0%) | 309,972 (100.0%) |
Housing Structure by Heating Type in Area Code 626
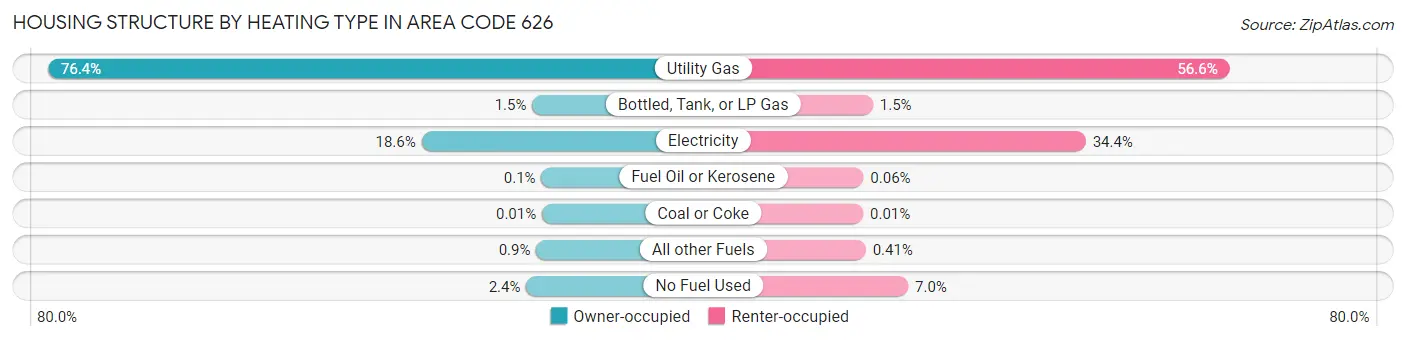
| Heating Type | Owner-occupied | Renter-occupied |
| Utility Gas | 235,033 (76.4%) | 175,564 (56.6%) |
| Bottled, Tank, or LP Gas | 4,670 (1.5%) | 4,667 (1.5%) |
| Electricity | 57,319 (18.6%) | 106,683 (34.4%) |
| Fuel Oil or Kerosene | 314 (0.1%) | 196 (0.1%) |
| Coal or Coke | 44 (0.0%) | 44 (0.0%) |
| All other Fuels | 2,774 (0.9%) | 1,258 (0.4%) |
| No Fuel Used | 7,496 (2.4%) | 21,560 (7.0%) |
| Total | 307,650 (100.0%) | 309,972 (100.0%) |
Household Vehicle Usage in Area Code 626
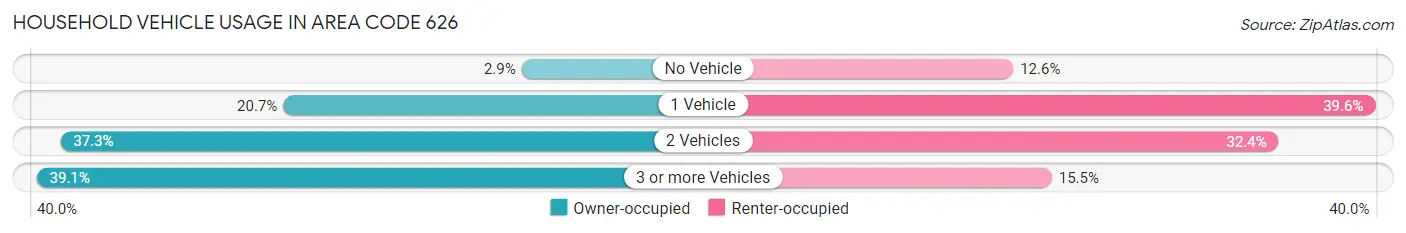
| Vehicles per Household | Owner-occupied | Renter-occupied |
| No Vehicle | 8,883 (2.9%) | 38,959 (12.6%) |
| 1 Vehicle | 63,655 (20.7%) | 122,755 (39.6%) |
| 2 Vehicles | 114,836 (37.3%) | 100,354 (32.4%) |
| 3 or more Vehicles | 120,276 (39.1%) | 47,904 (15.4%) |
| Total | 307,650 (100.0%) | 309,972 (100.0%) |
Real Estate & Mortgages in Area Code 626
Real Estate and Mortgage Overview in Area Code 626
| Characteristic | Without Mortgage | With Mortgage |
| Housing Units | 105,299 | 202,351 |
| Median Property Value | $40,821,901 | $45,012,201 |
| Median Household Income | $4,462,490 | $83,024 |
| Monthly Housing Costs | $42,164 | $87,076 |
| Real Estate Taxes | $222,755 | $2,642 |
Property Value by Mortgage Status in Area Code 626
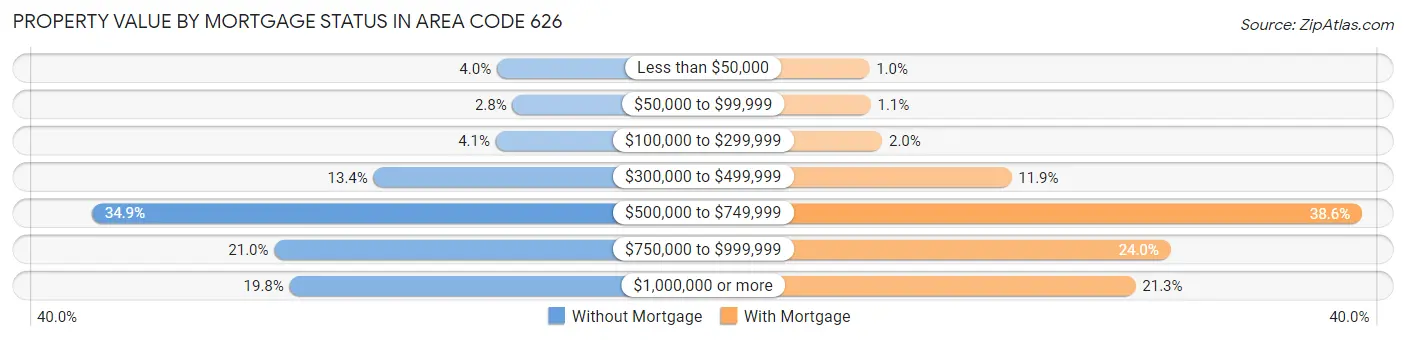
| Property Value | Without Mortgage | With Mortgage |
| Less than $50,000 | 4,219 (4.0%) | 2,102 (1.0%) |
| $50,000 to $99,999 | 2,971 (2.8%) | 2,305 (1.1%) |
| $100,000 to $299,999 | 4,312 (4.1%) | 4,079 (2.0%) |
| $300,000 to $499,999 | 14,122 (13.4%) | 24,016 (11.9%) |
| $500,000 to $749,999 | 36,730 (34.9%) | 78,092 (38.6%) |
| $750,000 to $999,999 | 22,085 (21.0%) | 48,606 (24.0%) |
| $1,000,000 or more | 20,860 (19.8%) | 43,151 (21.3%) |
| Total | 105,299 (100.0%) | 202,351 (100.0%) |
Household Income by Mortgage Status in Area Code 626
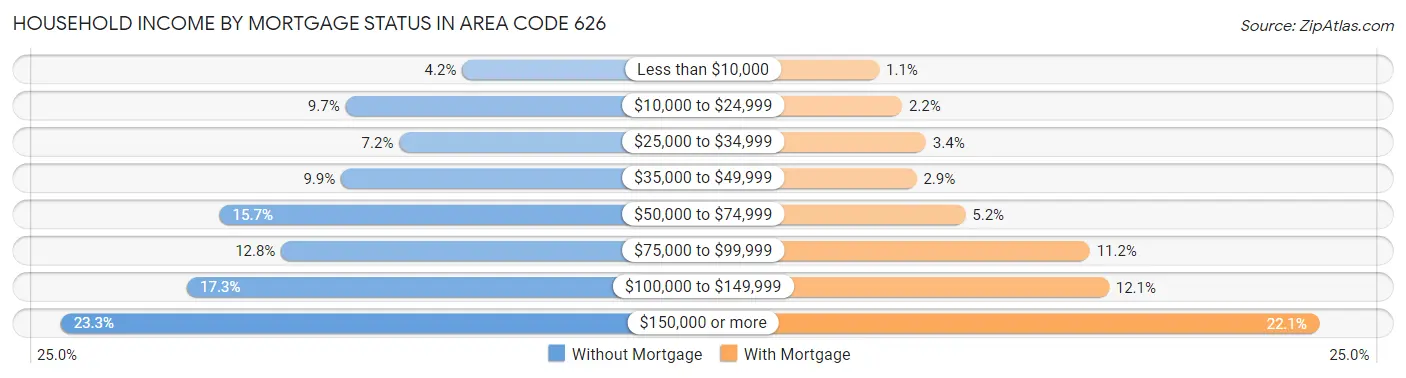
| Household Income | Without Mortgage | With Mortgage |
| Less than $10,000 | 4,377 (4.2%) | 2,265 (1.1%) |
| $10,000 to $24,999 | 10,234 (9.7%) | 4,481 (2.2%) |
| $25,000 to $34,999 | 7,540 (7.2%) | 6,783 (3.4%) |
| $35,000 to $49,999 | 10,457 (9.9%) | 5,873 (2.9%) |
| $50,000 to $74,999 | 16,539 (15.7%) | 10,584 (5.2%) |
| $75,000 to $99,999 | 13,459 (12.8%) | 22,556 (11.2%) |
| $100,000 to $149,999 | 18,175 (17.3%) | 24,410 (12.1%) |
| $150,000 or more | 24,518 (23.3%) | 44,640 (22.1%) |
| Total | 105,299 (100.0%) | 202,351 (100.0%) |
Property Value to Household Income Ratio in Area Code 626
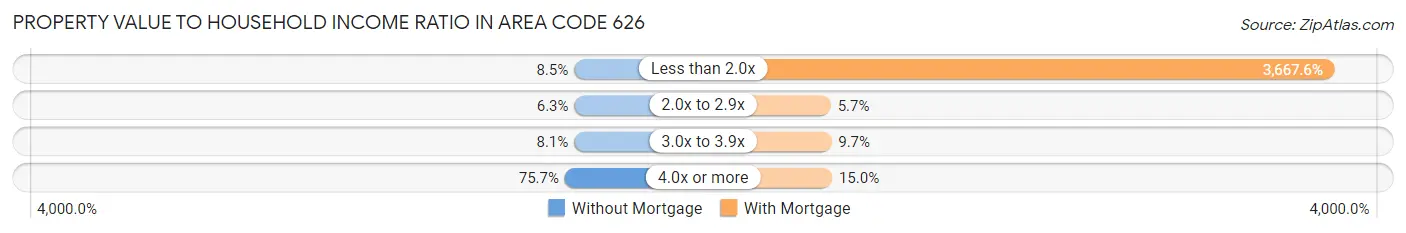
| Value-to-Income Ratio | Without Mortgage | With Mortgage |
| Less than 2.0x | 8,940 (8.5%) | 7,421,356 (3,667.6%) |
| 2.0x to 2.9x | 6,664 (6.3%) | 11,444 (5.7%) |
| 3.0x to 3.9x | 8,485 (8.1%) | 19,609 (9.7%) |
| 4.0x or more | 79,744 (75.7%) | 30,423 (15.0%) |
| Total | 105,299 (100.0%) | 202,351 (100.0%) |
Real Estate Taxes by Mortgage Status in Area Code 626
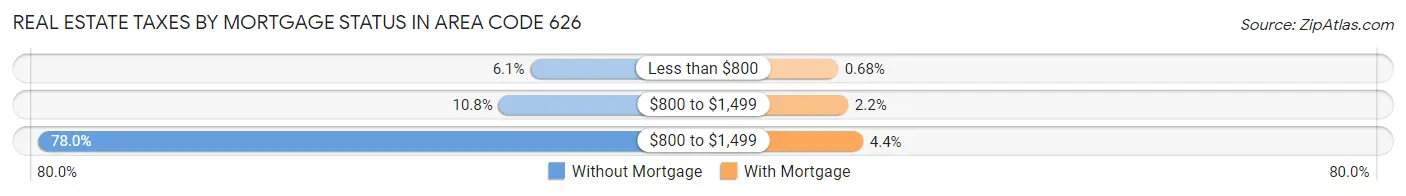
| Property Taxes | Without Mortgage | With Mortgage |
| Less than $800 | 6,430 (6.1%) | 1,376 (0.7%) |
| $800 to $1,499 | 11,320 (10.7%) | 4,390 (2.2%) |
| $800 to $1,499 | 82,155 (78.0%) | 8,821 (4.4%) |
| Total | 105,299 (100.0%) | 202,351 (100.0%) |
Health & Disability in Area Code 626
Health Insurance Coverage by Age in Area Code 626
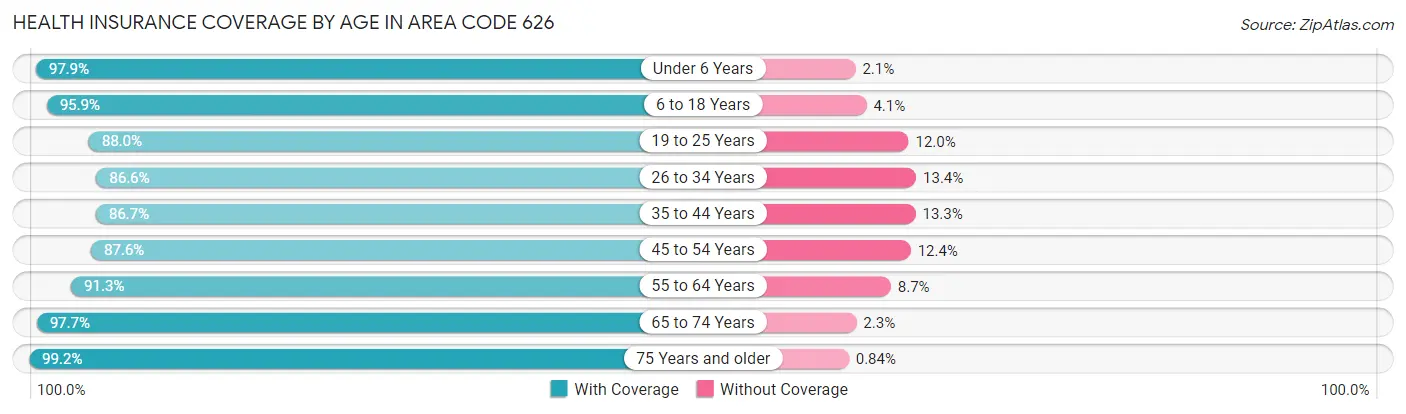
| Age Bracket | With Coverage | Without Coverage |
| Under 6 Years | 117,788 (97.9%) | 2,514 (2.1%) |
| 6 to 18 Years | 278,292 (95.9%) | 12,003 (4.1%) |
| 19 to 25 Years | 162,030 (88.0%) | 22,045 (12.0%) |
| 26 to 34 Years | 229,676 (86.6%) | 35,518 (13.4%) |
| 35 to 44 Years | 229,603 (86.7%) | 35,154 (13.3%) |
| 45 to 54 Years | 225,587 (87.6%) | 31,860 (12.4%) |
| 55 to 64 Years | 217,032 (91.3%) | 20,637 (8.7%) |
| 65 to 74 Years | 159,533 (97.7%) | 3,689 (2.3%) |
| 75 Years and older | 119,562 (99.2%) | 1,014 (0.8%) |
| Total | 1,739,103 (91.4%) | 164,434 (8.6%) |
Health Insurance Coverage by Citizenship Status in Area Code 626
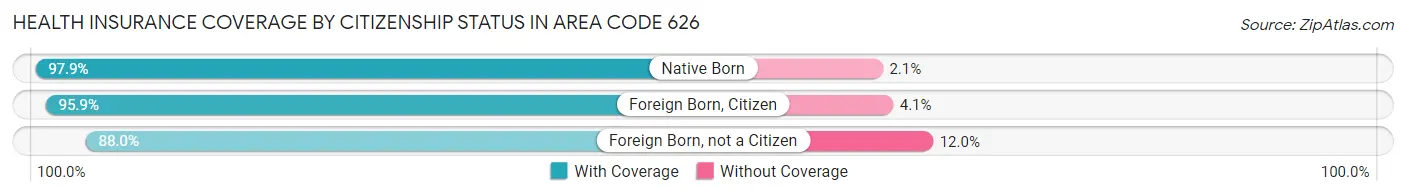
| Citizenship Status | With Coverage | Without Coverage |
| Native Born | 117,788 (97.9%) | 2,514 (2.1%) |
| Foreign Born, Citizen | 278,292 (95.9%) | 12,003 (4.1%) |
| Foreign Born, not a Citizen | 162,030 (88.0%) | 22,045 (12.0%) |
Health Insurance Coverage by Household Income in Area Code 626
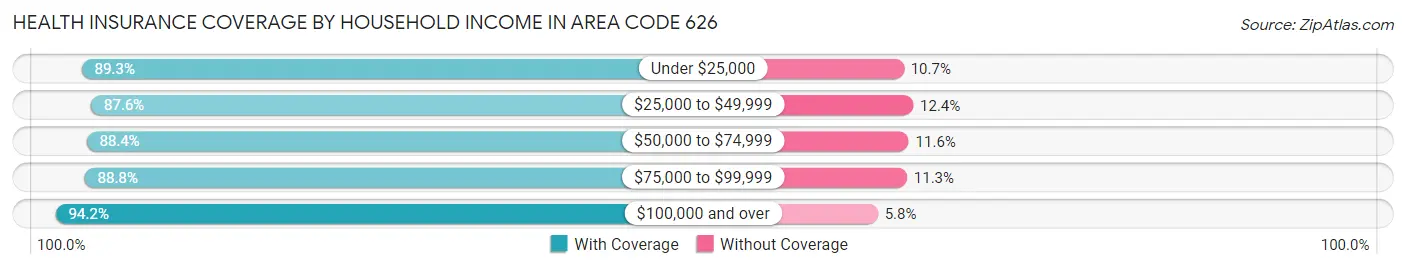
| Household Income | With Coverage | Without Coverage |
| Under $25,000 | 150,773 (89.3%) | 18,017 (10.7%) |
| $25,000 to $49,999 | 221,057 (87.6%) | 31,373 (12.4%) |
| $50,000 to $74,999 | 237,724 (88.4%) | 31,171 (11.6%) |
| $75,000 to $99,999 | 221,804 (88.7%) | 28,124 (11.3%) |
| $100,000 and over | 883,020 (94.2%) | 54,316 (5.8%) |
Public vs Private Health Insurance Coverage by Age in Area Code 626
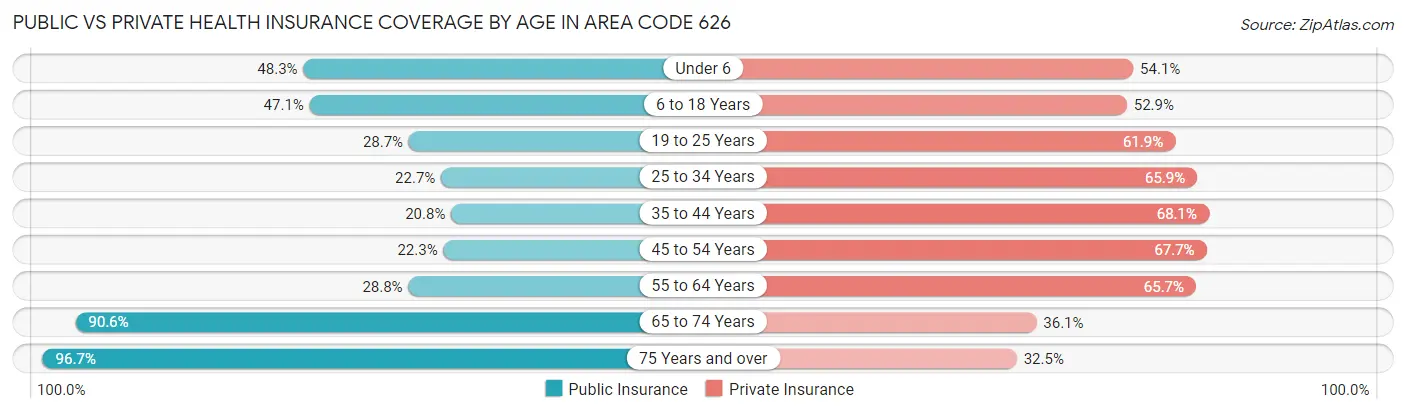
| Age Bracket | Public Insurance | Private Insurance |
| Under 6 | 58,051 (48.2%) | 65,056 (54.1%) |
| 6 to 18 Years | 136,705 (47.1%) | 153,569 (52.9%) |
| 19 to 25 Years | 52,759 (28.7%) | 113,843 (61.9%) |
| 25 to 34 Years | 60,145 (22.7%) | 174,841 (65.9%) |
| 35 to 44 Years | 55,096 (20.8%) | 180,340 (68.1%) |
| 45 to 54 Years | 57,289 (22.3%) | 174,239 (67.7%) |
| 55 to 64 Years | 68,336 (28.7%) | 156,169 (65.7%) |
| 65 to 74 Years | 147,834 (90.6%) | 58,933 (36.1%) |
| 75 Years and over | 116,542 (96.7%) | 39,145 (32.5%) |
| Total | 752,757 (39.6%) | 1,116,135 (58.6%) |
Disability Status by Sex by Age in Area Code 626
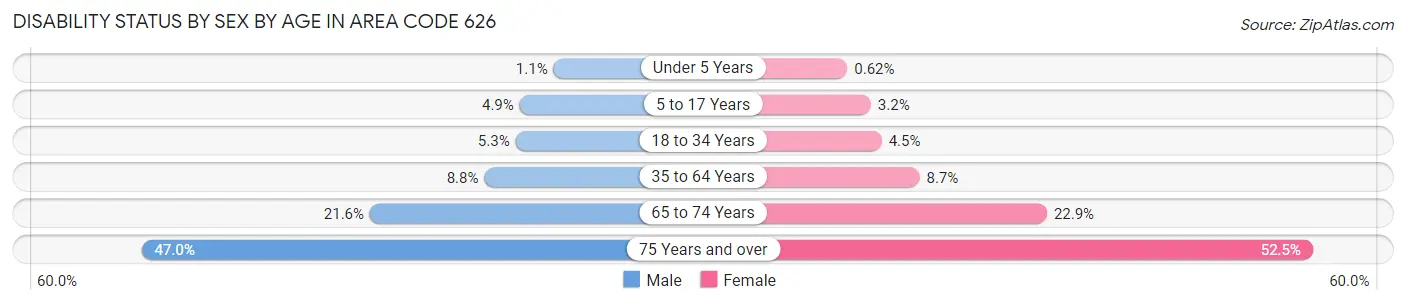
| Age Bracket | Male | Female |
| Under 5 Years | 559 (1.1%) | 302 (0.6%) |
| 5 to 17 Years | 7,125 (4.9%) | 4,525 (3.2%) |
| 18 to 34 Years | 13,110 (5.3%) | 10,161 (4.4%) |
| 35 to 64 Years | 33,431 (8.8%) | 32,917 (8.7%) |
| 65 to 74 Years | 16,201 (21.5%) | 20,117 (22.9%) |
| 75 Years and over | 22,662 (47.0%) | 37,940 (52.4%) |
Disability Class by Sex by Age in Area Code 626
Disability Class: Hearing Difficulty
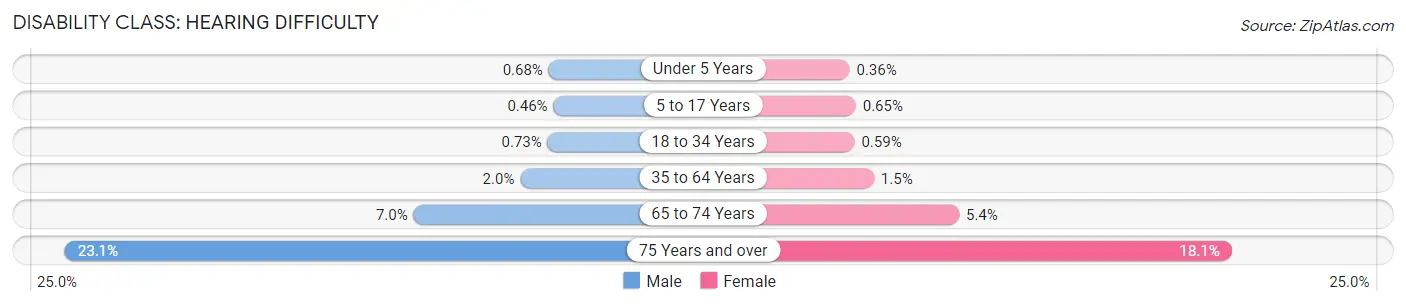
| Age Bracket | Male | Female |
| Under 5 Years | 346 (0.7%) | 178 (0.4%) |
| 5 to 17 Years | 670 (0.5%) | 904 (0.6%) |
| 18 to 34 Years | 1,796 (0.7%) | 1,352 (0.6%) |
| 35 to 64 Years | 7,601 (2.0%) | 5,651 (1.5%) |
| 65 to 74 Years | 5,229 (7.0%) | 4,790 (5.4%) |
| 75 Years and over | 11,159 (23.1%) | 13,084 (18.1%) |
Disability Class: Vision Difficulty
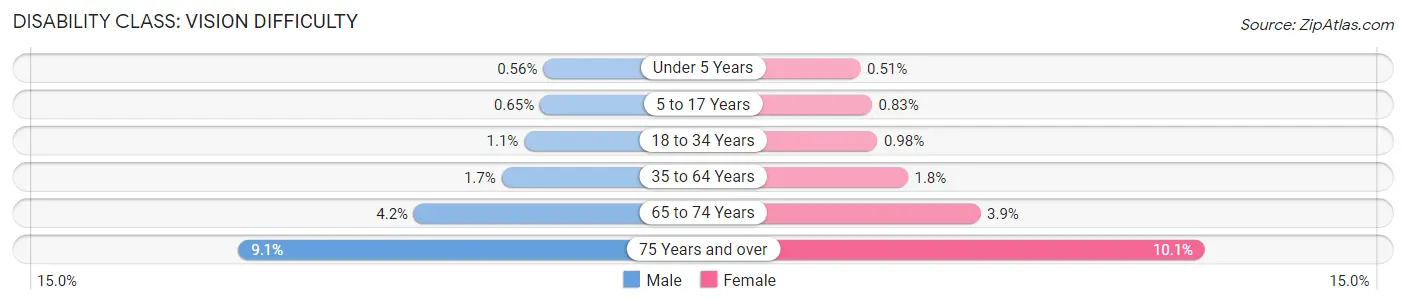
| Age Bracket | Male | Female |
| Under 5 Years | 285 (0.6%) | 251 (0.5%) |
| 5 to 17 Years | 954 (0.6%) | 1,159 (0.8%) |
| 18 to 34 Years | 2,675 (1.1%) | 2,242 (1.0%) |
| 35 to 64 Years | 6,525 (1.7%) | 6,944 (1.8%) |
| 65 to 74 Years | 3,129 (4.2%) | 3,388 (3.8%) |
| 75 Years and over | 4,364 (9.0%) | 7,316 (10.1%) |
Disability Class: Cognitive Difficulty
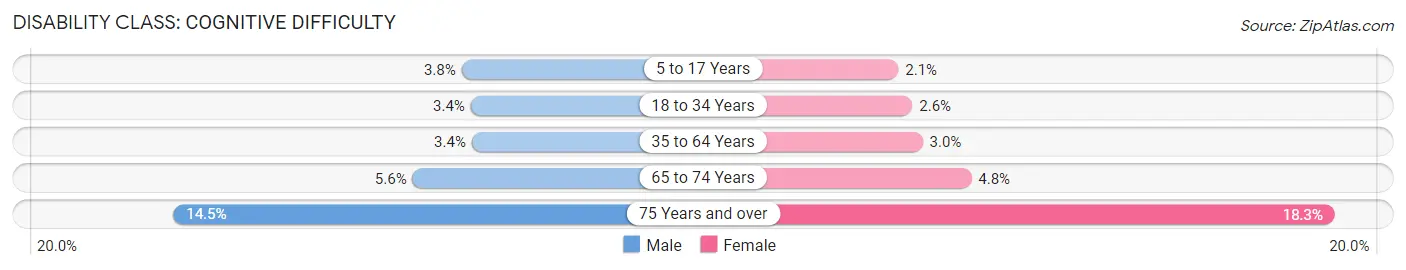
| Age Bracket | Male | Female |
| 5 to 17 Years | 5,522 (3.8%) | 2,927 (2.1%) |
| 18 to 34 Years | 8,463 (3.4%) | 5,980 (2.6%) |
| 35 to 64 Years | 12,915 (3.4%) | 11,400 (3.0%) |
| 65 to 74 Years | 4,209 (5.6%) | 4,235 (4.8%) |
| 75 Years and over | 6,984 (14.5%) | 13,240 (18.3%) |
Disability Class: Ambulatory Difficulty
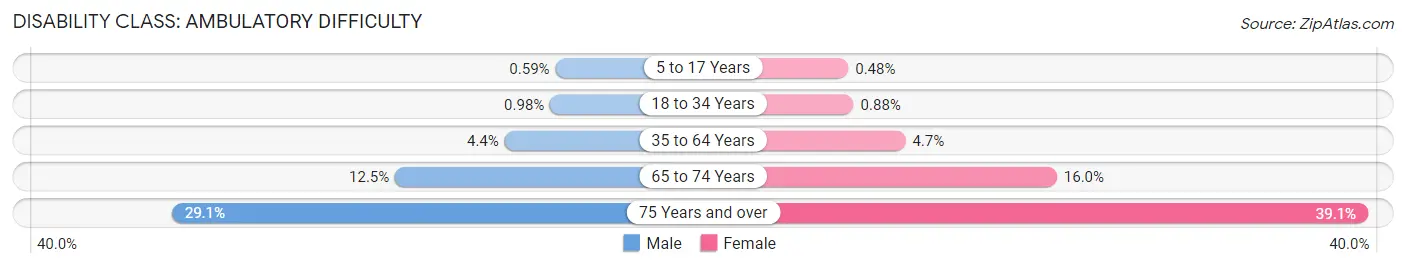
| Age Bracket | Male | Female |
| 5 to 17 Years | 865 (0.6%) | 667 (0.5%) |
| 18 to 34 Years | 2,407 (1.0%) | 2,019 (0.9%) |
| 35 to 64 Years | 16,578 (4.4%) | 17,972 (4.7%) |
| 65 to 74 Years | 9,392 (12.5%) | 14,059 (16.0%) |
| 75 Years and over | 14,023 (29.1%) | 28,256 (39.1%) |
Disability Class: Self-Care Difficulty
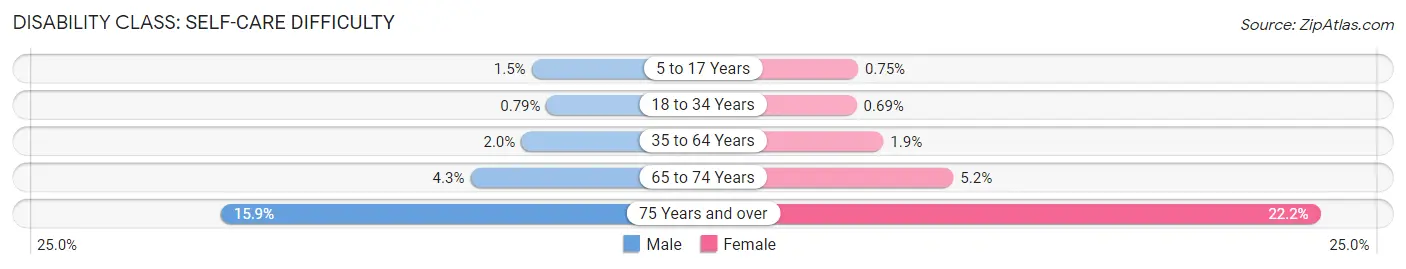
| Age Bracket | Male | Female |
| 5 to 17 Years | 2,160 (1.5%) | 1,049 (0.7%) |
| 18 to 34 Years | 1,949 (0.8%) | 1,582 (0.7%) |
| 35 to 64 Years | 7,437 (2.0%) | 7,336 (1.9%) |
| 65 to 74 Years | 3,251 (4.3%) | 4,560 (5.2%) |
| 75 Years and over | 7,663 (15.9%) | 16,068 (22.2%) |
Technology Access in Area Code 626
Computing Device Access in Area Code 626
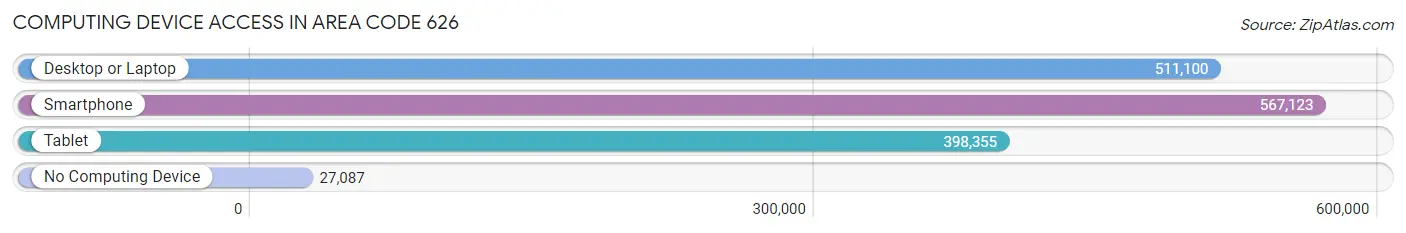
| Device Type | # Households | % Households |
| Desktop or Laptop | 511,100 | 82.8% |
| Smartphone | 567,123 | 91.8% |
| Tablet | 398,355 | 64.5% |
| No Computing Device | 27,087 | 4.4% |
| Total | 617,622 | 100.0% |
Internet Access in Area Code 626
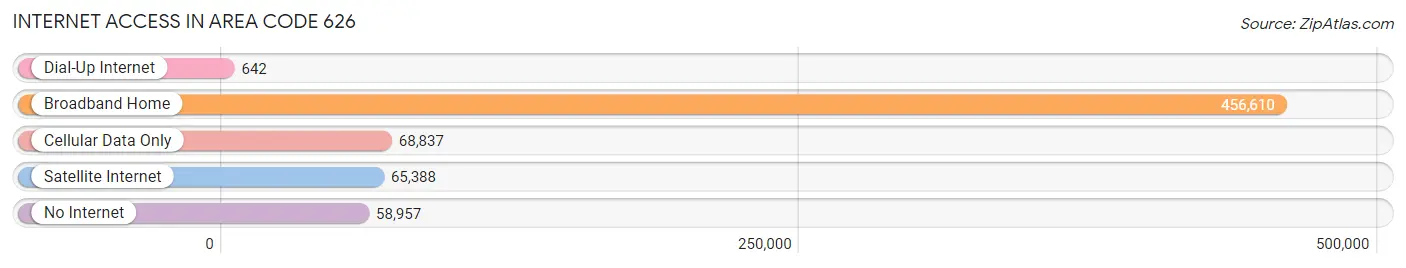
| Internet Type | # Households | % Households |
| Dial-Up Internet | 642 | 0.1% |
| Broadband Home | 456,610 | 73.9% |
| Cellular Data Only | 68,837 | 11.2% |
| Satellite Internet | 65,388 | 10.6% |
| No Internet | 58,957 | 9.6% |
| Total | 617,622 | 100.0% |
Area Code 626 Summary
Geography
Area code 626 is a telephone area code in the North American Numbering Plan (NANP) for the San Gabriel Valley region of Los Angeles County, California. It includes the cities of Alhambra, Arcadia, Azusa, Baldwin Park, Covina, Duarte, El Monte, Glendora, Irwindale, Monrovia, Pasadena, Rosemead, San Gabriel, San Marino, Sierra Madre, South El Monte, and Temple City.
Social
Area code 626 is home to a diverse population of people from all walks of life. The area is known for its vibrant cultural scene, with a variety of restaurants, bars, and entertainment venues. The area is also home to a number of universities and colleges, including the University of Southern California, California Institute of Technology, and Pasadena City College.
Economics
Area code 626 is a major economic hub in the Los Angeles area. The area is home to a number of large corporations, including the headquarters of the Walt Disney Company, Nestle USA, and Kaiser Permanente. The area is also home to a number of small businesses, including restaurants, retail stores, and professional services.
Demographics
Area code 626 is home to a diverse population of people from all walks of life. According to the 2010 census, the population of the area was 1,737,942, with a median age of 34.7 years. The area is majority Hispanic, with a population of 1,093,945, or 63.1%. The area is also home to a large Asian population, with a population of 441,945, or 25.4%.
Common Questions
What is Per Capita Income in Area Code 626?
Per Capita income in Area Code 626 is $43,197.
What is the Median Family Income in Area Code 626?
Median Family Income in Area Code 626 is $105,793.
What is the Median Household income in Area Code 626?
Median Household Income in Area Code 626 is $91,086.
What is Income or Wage Gap in Area Code 626?
Income or Wage Gap in Area Code 626 is 23.3%.
Women in Area Code 626 earn 76.7 cents for every dollar earned by a man.
What is Family Income Deficit in Area Code 626?
Family Income Deficit in Area Code 626 is $10,418.
Families that are below poverty line in Area Code 626 earn $10,418 less on average than the poverty threshold level.
What is Inequality or Gini Index in Area Code 626?
Inequality or Gini Index in Area Code 626 is 24.26.
What is the Total Population of Area Code 626?
Total Population of Area Code 626 is 1,914,659.
What is the Total Male Population of Area Code 626?
Total Male Population of Area Code 626 is 951,928.
What is the Total Female Population of Area Code 626?
Total Female Population of Area Code 626 is 962,731.
What is the Ratio of Males per 100 Females in Area Code 626?
There are 98.88 Males per 100 Females in Area Code 626.
What is the Ratio of Females per 100 Males in Area Code 626?
There are 101.13 Females per 100 Males in Area Code 626.
What is the Median Population Age in Area Code 626?
Median Population Age in Area Code 626 is 39.3 Years.
What is the Average Family Size in Area Code 626
Average Family Size in Area Code 626 is 3.5 People.
What is the Average Household Size in Area Code 626
Average Household Size in Area Code 626 is 3.0 People.
How Large is the Labor Force in Area Code 626?
There are 1,003,654 People in the Labor Forcein in Area Code 626.
What is the Percentage of People in the Labor Force in Area Code 626?
63.7% of People are in the Labor Force in Area Code 626.
What is the Unemployment Rate in Area Code 626?
Unemployment Rate in Area Code 626 is 7.0%.