Stateburg, SC Map & Demographics
Stateburg Map
Stateburg Overview
$31,635
PER CAPITA INCOME
$103,531
AVG FAMILY INCOME
$68,935
AVG HOUSEHOLD INCOME
24.6%
WAGE / INCOME GAP [ % ]
75.4¢/ $1
WAGE / INCOME GAP [ $ ]
0.37
INEQUALITY / GINI INDEX
1,739
TOTAL POPULATION
843
MALE POPULATION
896
FEMALE POPULATION
94.08
MALES / 100 FEMALES
106.29
FEMALES / 100 MALES
39.7
MEDIAN AGE
3.4
AVG FAMILY SIZE
2.9
AVG HOUSEHOLD SIZE
699
LABOR FORCE [ PEOPLE ]
55.9%
PERCENT IN LABOR FORCE
4.8%
UNEMPLOYMENT RATE
Income in Stateburg
Income Overview in Stateburg
Per Capita Income in Stateburg is $31,635, while median incomes of families and households are $103,531 and $68,935 respectively.
| Characteristic | Number | Measure |
| Per Capita Income | 1,739 | $31,635 |
| Median Family Income | 439 | $103,531 |
| Mean Family Income | 439 | $104,948 |
| Median Household Income | 606 | $68,935 |
| Mean Household Income | 606 | $89,719 |
| Income Deficit | 439 | $0 |
| Wage / Income Gap (%) | 1,739 | 24.63% |
| Wage / Income Gap ($) | 1,739 | 75.37¢ per $1 |
| Gini / Inequality Index | 1,739 | 0.37 |
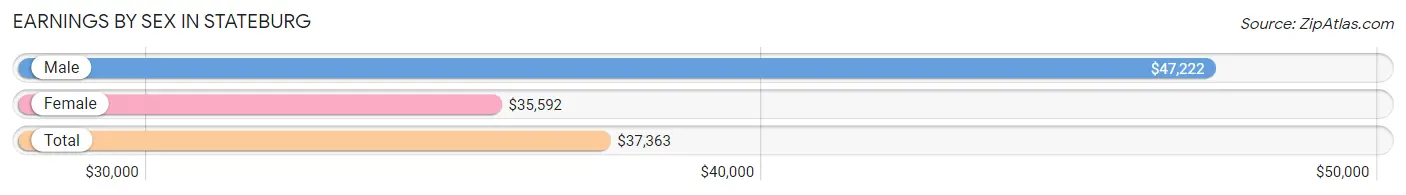
Earnings by Sex in Stateburg
Average Earnings in Stateburg are $37,363, $47,222 for men and $35,592 for women, a difference of 24.6%.
| Sex | Number | Average Earnings |
| Male | 386 (52.8%) | $47,222 |
| Female | 345 (47.2%) | $35,592 |
| Total | 731 (100.0%) | $37,363 |
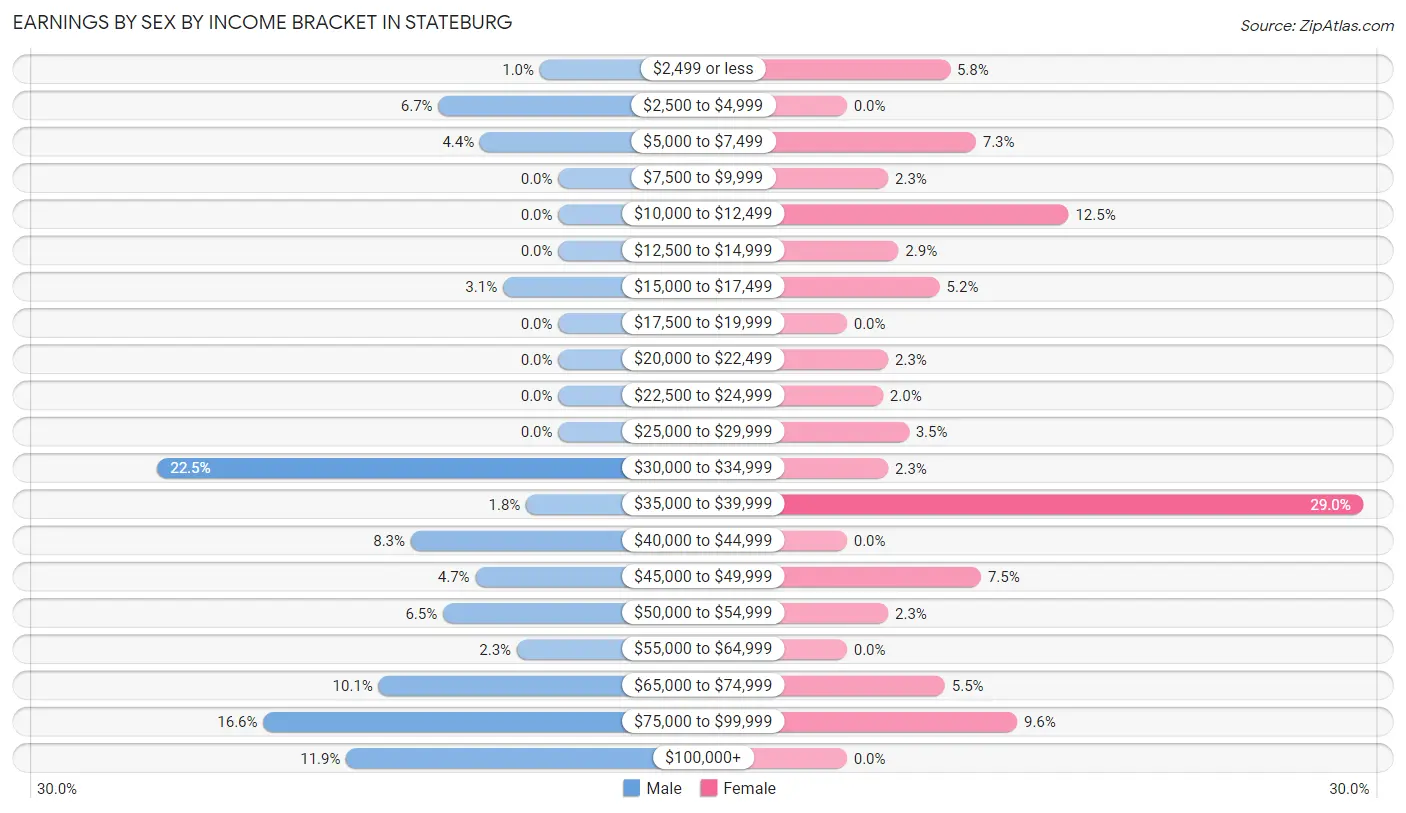
Earnings by Sex by Income Bracket in Stateburg
The most common earnings brackets in Stateburg are $30,000 to $34,999 for men (87 | 22.5%) and $35,000 to $39,999 for women (100 | 29.0%).
| Income | Male | Female |
| $2,499 or less | 4 (1.0%) | 20 (5.8%) |
| $2,500 to $4,999 | 26 (6.7%) | 0 (0.0%) |
| $5,000 to $7,499 | 17 (4.4%) | 25 (7.2%) |
| $7,500 to $9,999 | 0 (0.0%) | 8 (2.3%) |
| $10,000 to $12,499 | 0 (0.0%) | 43 (12.5%) |
| $12,500 to $14,999 | 0 (0.0%) | 10 (2.9%) |
| $15,000 to $17,499 | 12 (3.1%) | 18 (5.2%) |
| $17,500 to $19,999 | 0 (0.0%) | 0 (0.0%) |
| $20,000 to $22,499 | 0 (0.0%) | 8 (2.3%) |
| $22,500 to $24,999 | 0 (0.0%) | 7 (2.0%) |
| $25,000 to $29,999 | 0 (0.0%) | 12 (3.5%) |
| $30,000 to $34,999 | 87 (22.5%) | 8 (2.3%) |
| $35,000 to $39,999 | 7 (1.8%) | 100 (29.0%) |
| $40,000 to $44,999 | 32 (8.3%) | 0 (0.0%) |
| $45,000 to $49,999 | 18 (4.7%) | 26 (7.5%) |
| $50,000 to $54,999 | 25 (6.5%) | 8 (2.3%) |
| $55,000 to $64,999 | 9 (2.3%) | 0 (0.0%) |
| $65,000 to $74,999 | 39 (10.1%) | 19 (5.5%) |
| $75,000 to $99,999 | 64 (16.6%) | 33 (9.6%) |
| $100,000+ | 46 (11.9%) | 0 (0.0%) |
| Total | 386 (100.0%) | 345 (100.0%) |
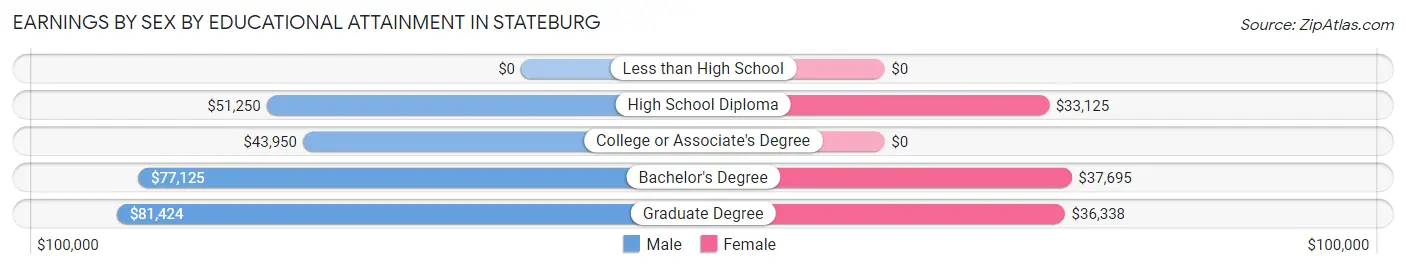
Earnings by Sex by Educational Attainment in Stateburg
Average earnings in Stateburg are $65,188 for men and $35,768 for women, a difference of 45.1%. Men with an educational attainment of graduate degree enjoy the highest average annual earnings of $81,424, while those with college or associate's degree education earn the least with $43,950. Women with an educational attainment of bachelor's degree earn the most with the average annual earnings of $37,695, while those with high school diploma education have the smallest earnings of $33,125.
| Educational Attainment | Male Income | Female Income |
| Less than High School | - | - |
| High School Diploma | $51,250 | $33,125 |
| College or Associate's Degree | $43,950 | $0 |
| Bachelor's Degree | $77,125 | $37,695 |
| Graduate Degree | $81,424 | $36,338 |
| Total | $65,188 | $35,768 |
Family Income in Stateburg
Family Income Brackets in Stateburg
According to the Stateburg family income data, there are 153 families falling into the $100,000 to $149,999 income range, which is the most common income bracket and makes up 34.8% of all families.
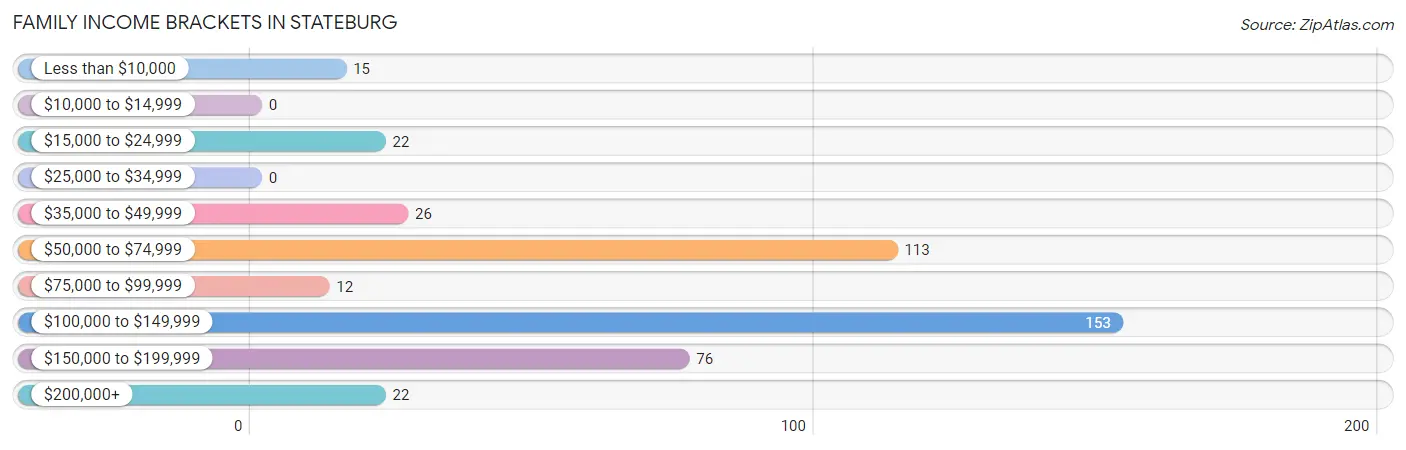
| Income Bracket | # Families | % Families |
| Less than $10,000 | 15 | 3.4% |
| $10,000 to $14,999 | 0 | 0.0% |
| $15,000 to $24,999 | 22 | 5.0% |
| $25,000 to $34,999 | 0 | 0.0% |
| $35,000 to $49,999 | 26 | 5.9% |
| $50,000 to $74,999 | 113 | 25.7% |
| $75,000 to $99,999 | 12 | 2.7% |
| $100,000 to $149,999 | 153 | 34.9% |
| $150,000 to $199,999 | 76 | 17.3% |
| $200,000+ | 22 | 5.0% |
Family Income by Famaliy Size in Stateburg
4-person families (39 | 8.9%) account for the highest median family income in Stateburg with $185,694 per family, while 2-person families (272 | 62.0%) have the highest median income of $51,666 per family member.
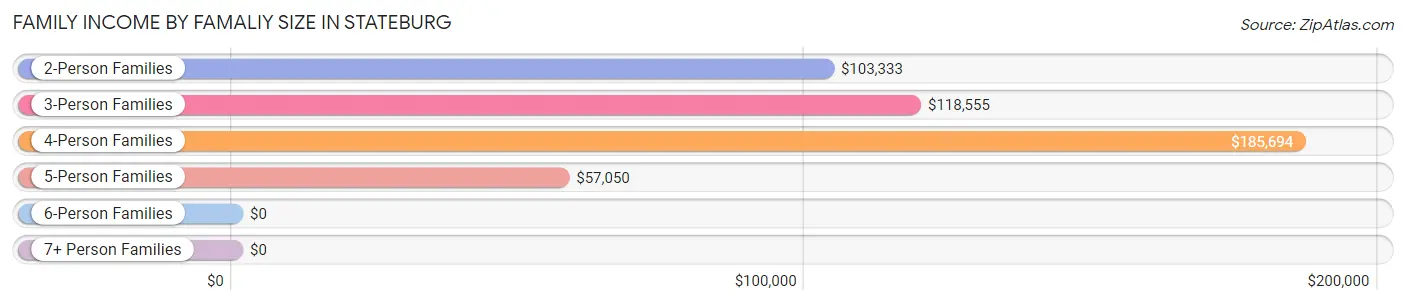
| Income Bracket | # Families | Median Income |
| 2-Person Families | 272 (62.0%) | $103,333 |
| 3-Person Families | 53 (12.1%) | $118,555 |
| 4-Person Families | 39 (8.9%) | $185,694 |
| 5-Person Families | 41 (9.3%) | $57,050 |
| 6-Person Families | 13 (3.0%) | $0 |
| 7+ Person Families | 21 (4.8%) | $0 |
| Total | 439 (100.0%) | $103,531 |
Family Income by Number of Earners in Stateburg
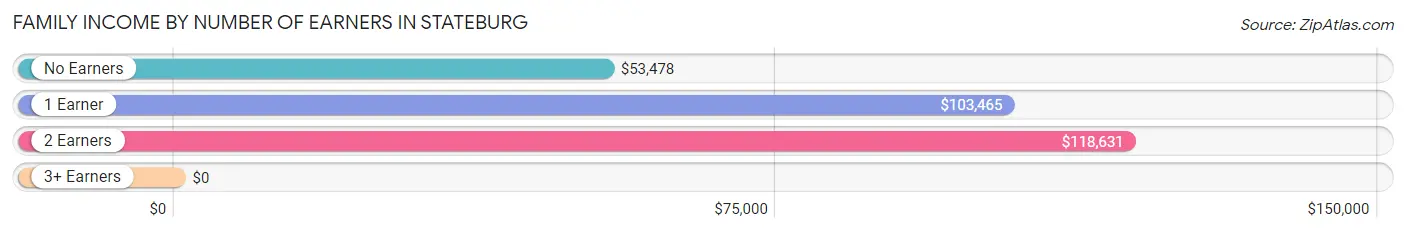
| Number of Earners | # Families | Median Income |
| No Earners | 66 (15.0%) | $53,478 |
| 1 Earner | 176 (40.1%) | $103,465 |
| 2 Earners | 182 (41.5%) | $118,631 |
| 3+ Earners | 15 (3.4%) | $0 |
| Total | 439 (100.0%) | $103,531 |
Household Income in Stateburg
Household Income Brackets in Stateburg
With 192 households falling in the category, the $50,000 to $74,999 income range is the most frequent in Stateburg, accounting for 31.7% of all households.
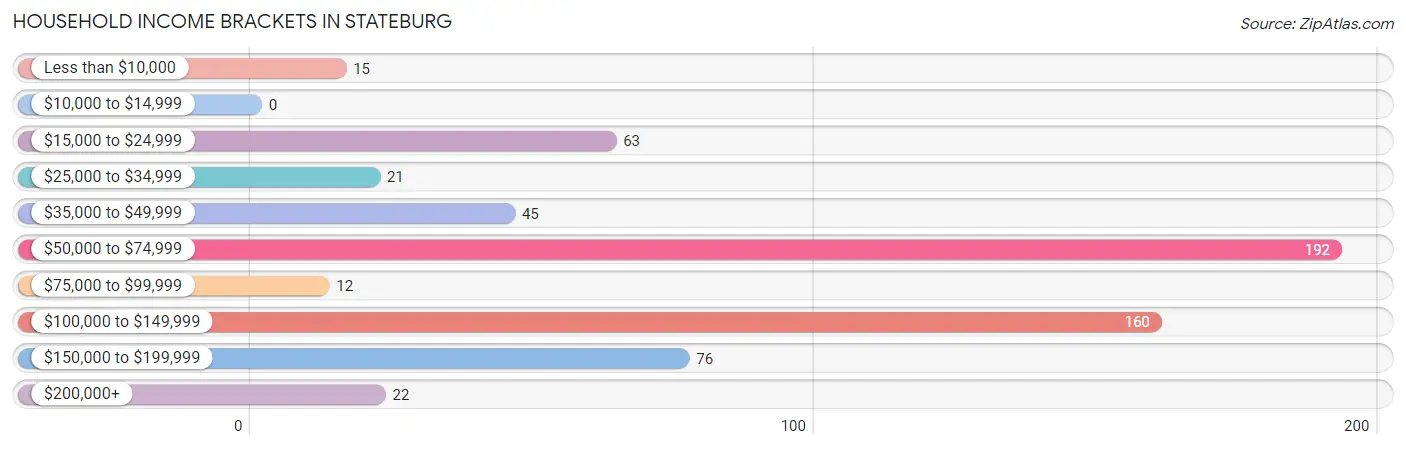
| Income Bracket | # Households | % Households |
| Less than $10,000 | 15 | 2.5% |
| $10,000 to $14,999 | 0 | 0.0% |
| $15,000 to $24,999 | 63 | 10.4% |
| $25,000 to $34,999 | 21 | 3.5% |
| $35,000 to $49,999 | 45 | 7.4% |
| $50,000 to $74,999 | 192 | 31.7% |
| $75,000 to $99,999 | 12 | 2.0% |
| $100,000 to $149,999 | 160 | 26.4% |
| $150,000 to $199,999 | 76 | 12.5% |
| $200,000+ | 22 | 3.6% |
Household Income by Householder Age in Stateburg
The median household income in Stateburg is $68,935, with the highest median household income of $104,386 found in the 45 to 64 years age bracket for the primary householder. A total of 262 households (43.2%) fall into this category. Meanwhile, the 15 to 24 years age bracket for the primary householder has the lowest median household income of $0, with 42 households (6.9%) in this group.
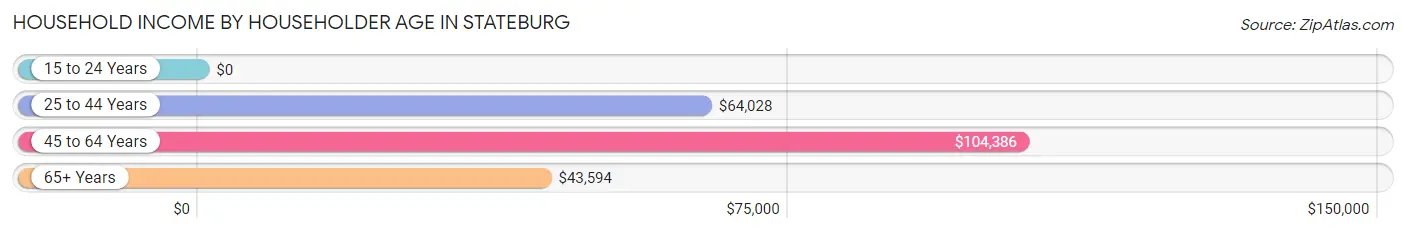
| Income Bracket | # Households | Median Income |
| 15 to 24 Years | 42 (6.9%) | $0 |
| 25 to 44 Years | 153 (25.3%) | $64,028 |
| 45 to 64 Years | 262 (43.2%) | $104,386 |
| 65+ Years | 149 (24.6%) | $43,594 |
| Total | 606 (100.0%) | $68,935 |
Poverty in Stateburg
Income Below Poverty by Sex and Age in Stateburg
With 3.2% poverty level for males and 4.7% for females among the residents of Stateburg, 45 to 54 year old males and 18 to 24 year old females are the most vulnerable to poverty, with 15 males (18.1%) and 15 females (65.2%) in their respective age groups living below the poverty level.
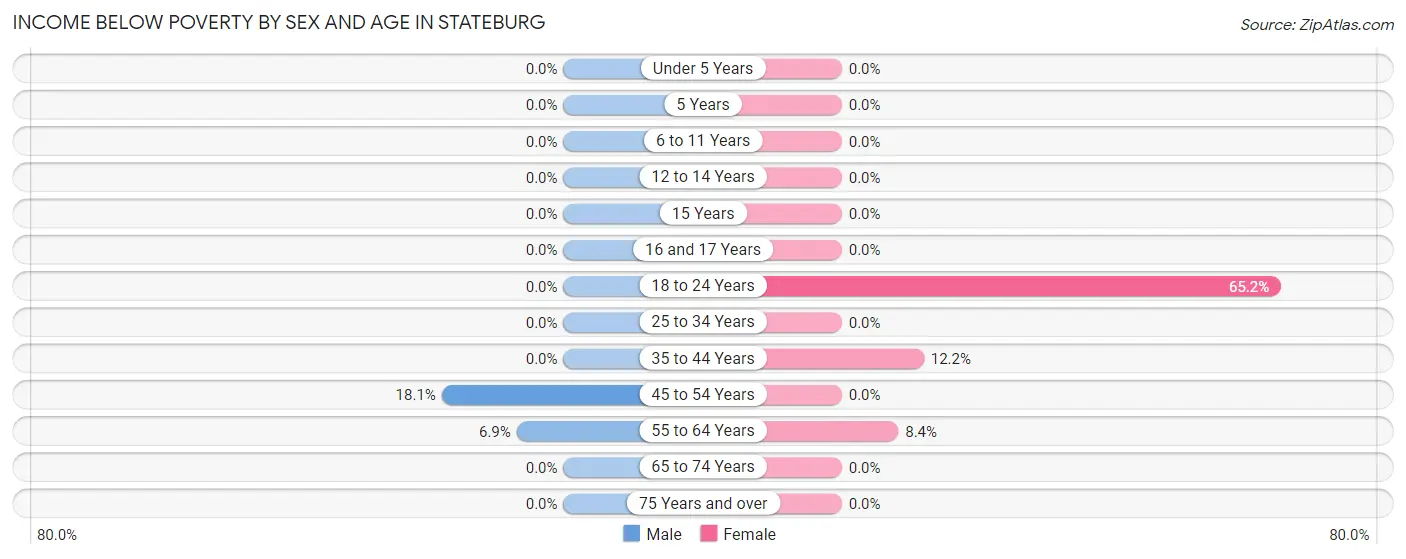
| Age Bracket | Male | Female |
| Under 5 Years | 0 (0.0%) | 0 (0.0%) |
| 5 Years | 0 (0.0%) | 0 (0.0%) |
| 6 to 11 Years | 0 (0.0%) | 0 (0.0%) |
| 12 to 14 Years | 0 (0.0%) | 0 (0.0%) |
| 15 Years | 0 (0.0%) | 0 (0.0%) |
| 16 and 17 Years | 0 (0.0%) | 0 (0.0%) |
| 18 to 24 Years | 0 (0.0%) | 15 (65.2%) |
| 25 to 34 Years | 0 (0.0%) | 0 (0.0%) |
| 35 to 44 Years | 0 (0.0%) | 14 (12.2%) |
| 45 to 54 Years | 15 (18.1%) | 0 (0.0%) |
| 55 to 64 Years | 12 (6.9%) | 13 (8.4%) |
| 65 to 74 Years | 0 (0.0%) | 0 (0.0%) |
| 75 Years and over | 0 (0.0%) | 0 (0.0%) |
| Total | 27 (3.2%) | 42 (4.7%) |
Income Above Poverty by Sex and Age in Stateburg
According to the poverty statistics in Stateburg, males aged under 5 years and females aged under 5 years are the age groups that are most secure financially, with 100.0% of males and 100.0% of females in these age groups living above the poverty line.
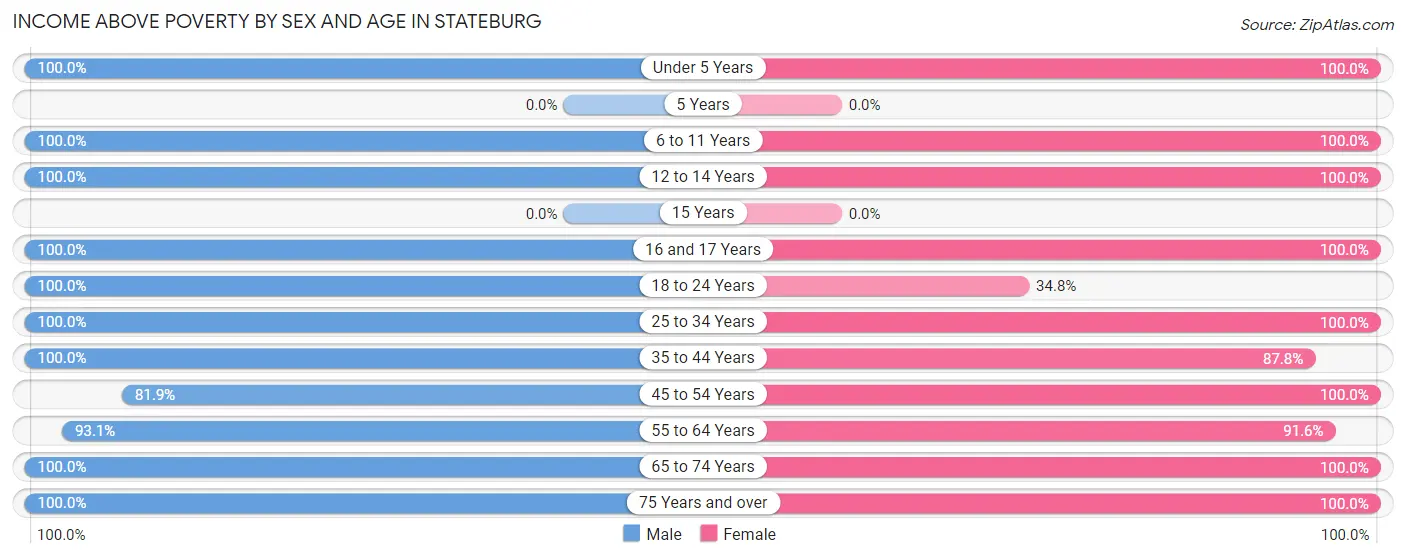
| Age Bracket | Male | Female |
| Under 5 Years | 94 (100.0%) | 126 (100.0%) |
| 5 Years | 0 (0.0%) | 0 (0.0%) |
| 6 to 11 Years | 52 (100.0%) | 129 (100.0%) |
| 12 to 14 Years | 60 (100.0%) | 27 (100.0%) |
| 15 Years | 0 (0.0%) | 0 (0.0%) |
| 16 and 17 Years | 7 (100.0%) | 25 (100.0%) |
| 18 to 24 Years | 99 (100.0%) | 8 (34.8%) |
| 25 to 34 Years | 50 (100.0%) | 112 (100.0%) |
| 35 to 44 Years | 106 (100.0%) | 101 (87.8%) |
| 45 to 54 Years | 68 (81.9%) | 67 (100.0%) |
| 55 to 64 Years | 161 (93.1%) | 142 (91.6%) |
| 65 to 74 Years | 104 (100.0%) | 80 (100.0%) |
| 75 Years and over | 15 (100.0%) | 37 (100.0%) |
| Total | 816 (96.8%) | 854 (95.3%) |
Income Below Poverty Among Married-Couple Families in Stateburg
The poverty statistics for married-couple families in Stateburg show that 3.1% or 13 of the total 417 families live below the poverty line. Families with no children have the highest poverty rate of 4.7%, comprising of 13 families. On the other hand, families with 1 or 2 children have the lowest poverty rate of 0.0%, which includes 0 families.
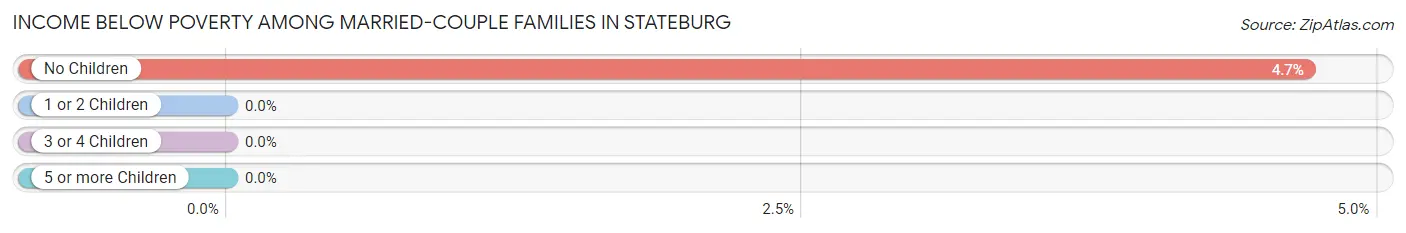
| Children | Above Poverty | Below Poverty |
| No Children | 264 (95.3%) | 13 (4.7%) |
| 1 or 2 Children | 72 (100.0%) | 0 (0.0%) |
| 3 or 4 Children | 47 (100.0%) | 0 (0.0%) |
| 5 or more Children | 21 (100.0%) | 0 (0.0%) |
| Total | 404 (96.9%) | 13 (3.1%) |
Income Below Poverty Among Single-Parent Households in Stateburg
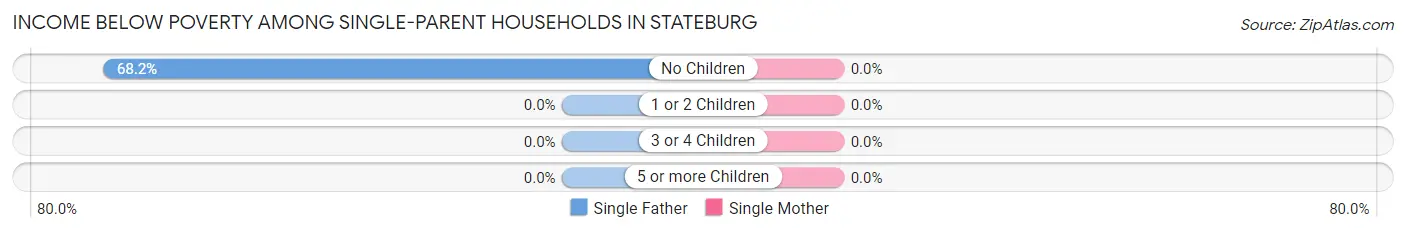
| Children | Single Father | Single Mother |
| No Children | 15 (68.2%) | 0 (0.0%) |
| 1 or 2 Children | 0 (0.0%) | 0 (0.0%) |
| 3 or 4 Children | 0 (0.0%) | 0 (0.0%) |
| 5 or more Children | 0 (0.0%) | 0 (0.0%) |
| Total | 15 (68.2%) | 0 (0.0%) |
Income Below Poverty Among Married-Couple vs Single-Parent Households in Stateburg
The poverty data for Stateburg shows that 13 of the married-couple family households (3.1%) and 15 of the single-parent households (68.2%) are living below the poverty level. Within the married-couple family households, those with no children have the highest poverty rate, with 13 households (4.7%) falling below the poverty line. Among the single-parent households, those with no children have the highest poverty rate, with 15 household (68.2%) living below poverty.
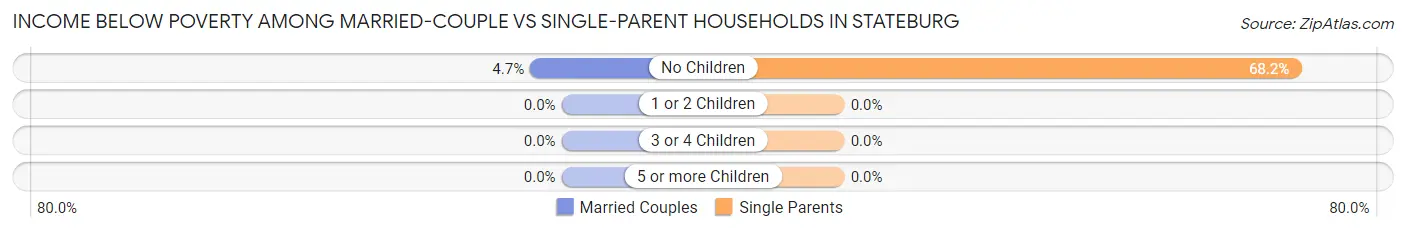
| Children | Married-Couple Families | Single-Parent Households |
| No Children | 13 (4.7%) | 15 (68.2%) |
| 1 or 2 Children | 0 (0.0%) | 0 (0.0%) |
| 3 or 4 Children | 0 (0.0%) | 0 (0.0%) |
| 5 or more Children | 0 (0.0%) | 0 (0.0%) |
| Total | 13 (3.1%) | 15 (68.2%) |
Race in Stateburg
The most populous races in Stateburg are White / Caucasian (1,256 | 72.2%), Two or more Races (231 | 13.3%), and Black / African American (188 | 10.8%).
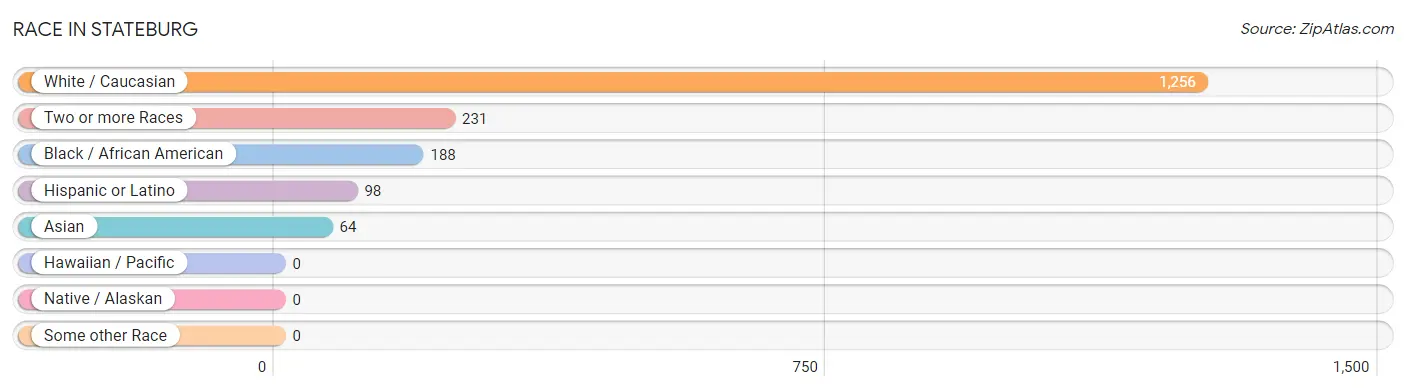
| Race | # Population | % Population |
| Asian | 64 | 3.7% |
| Black / African American | 188 | 10.8% |
| Hawaiian / Pacific | 0 | 0.0% |
| Hispanic or Latino | 98 | 5.6% |
| Native / Alaskan | 0 | 0.0% |
| White / Caucasian | 1,256 | 72.2% |
| Two or more Races | 231 | 13.3% |
| Some other Race | 0 | 0.0% |
| Total | 1,739 | 100.0% |
Ancestry in Stateburg
The most populous ancestries reported in Stateburg are English (168 | 9.7%), German (162 | 9.3%), American (159 | 9.1%), Swedish (149 | 8.6%), and Irish (114 | 6.6%), together accounting for 43.2% of all Stateburg residents.
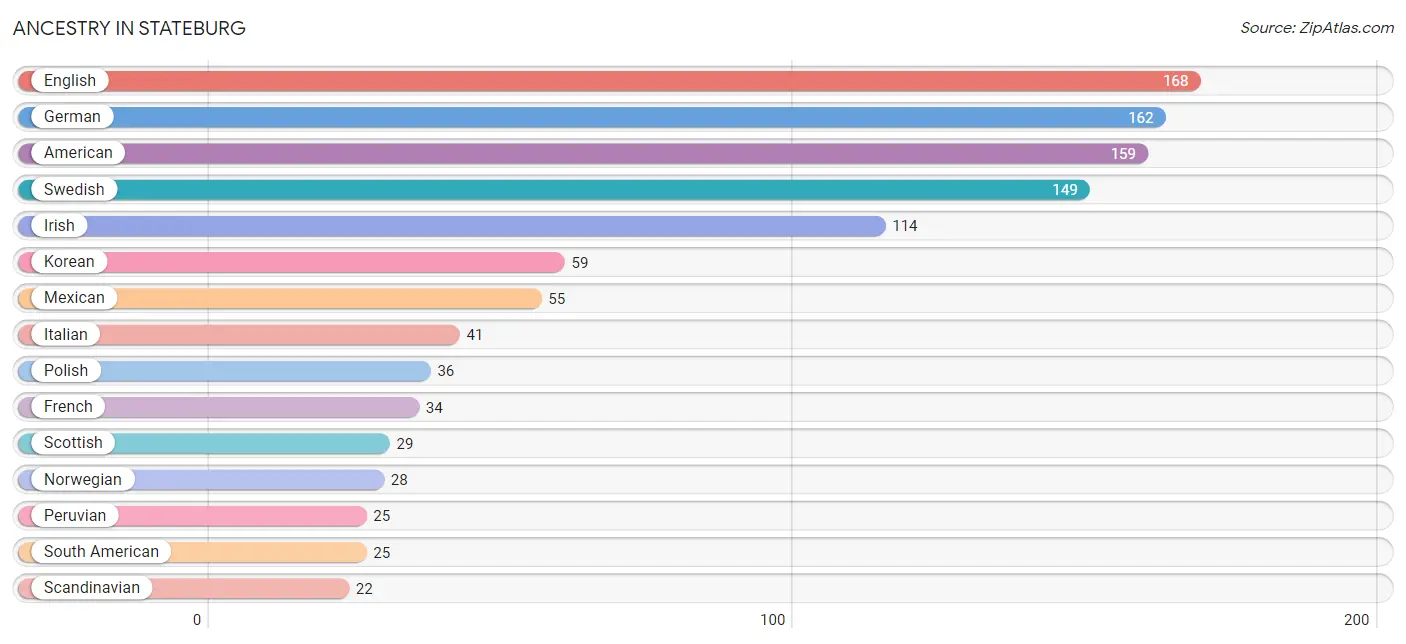
| Ancestry | # Population | % Population |
| American | 159 | 9.1% |
| Burmese | 15 | 0.9% |
| Dutch | 15 | 0.9% |
| Eastern European | 21 | 1.2% |
| English | 168 | 9.7% |
| European | 8 | 0.5% |
| French | 34 | 2.0% |
| German | 162 | 9.3% |
| Irish | 114 | 6.6% |
| Italian | 41 | 2.4% |
| Korean | 59 | 3.4% |
| Mexican | 55 | 3.2% |
| Norwegian | 28 | 1.6% |
| Peruvian | 25 | 1.4% |
| Polish | 36 | 2.1% |
| Puerto Rican | 18 | 1.0% |
| Russian | 20 | 1.1% |
| Scandinavian | 22 | 1.3% |
| Scotch-Irish | 16 | 0.9% |
| Scottish | 29 | 1.7% |
| South American | 25 | 1.4% |
| Swedish | 149 | 8.6% | View All 22 Rows |
Immigrants in Stateburg
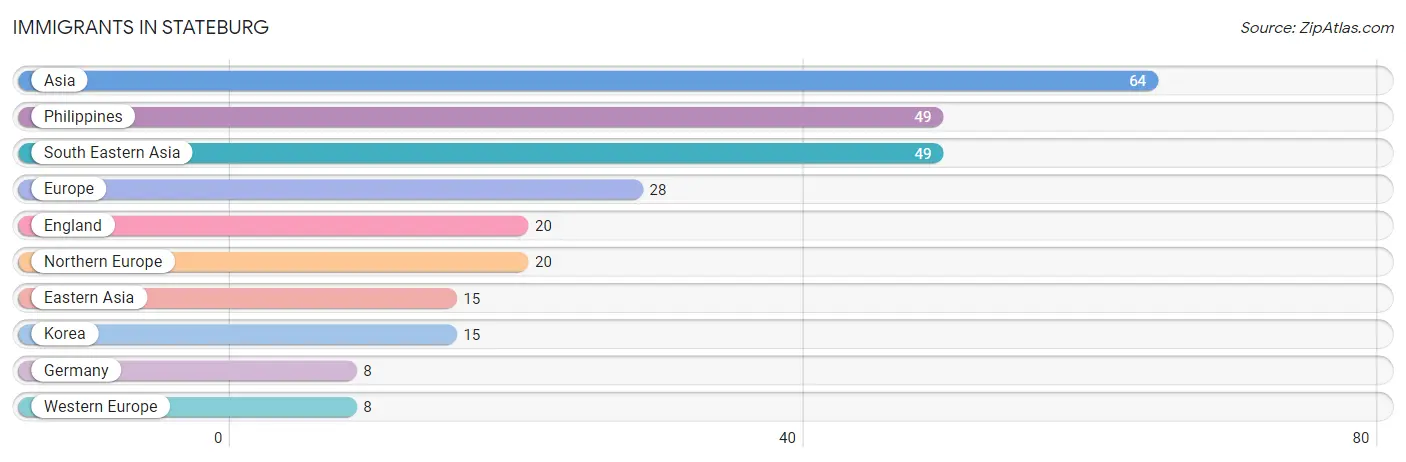
The most numerous immigrant groups reported in Stateburg came from Asia (64 | 3.7%), Philippines (49 | 2.8%), South Eastern Asia (49 | 2.8%), Europe (28 | 1.6%), and England (20 | 1.1%), together accounting for 12.1% of all Stateburg residents.
| Immigration Origin | # Population | % Population |
| Asia | 64 | 3.7% |
| Eastern Asia | 15 | 0.9% |
| England | 20 | 1.1% |
| Europe | 28 | 1.6% |
| Germany | 8 | 0.5% |
| Korea | 15 | 0.9% |
| Northern Europe | 20 | 1.1% |
| Philippines | 49 | 2.8% |
| South Eastern Asia | 49 | 2.8% |
| Western Europe | 8 | 0.5% | View All 10 Rows |
Sex and Age in Stateburg
Sex and Age in Stateburg
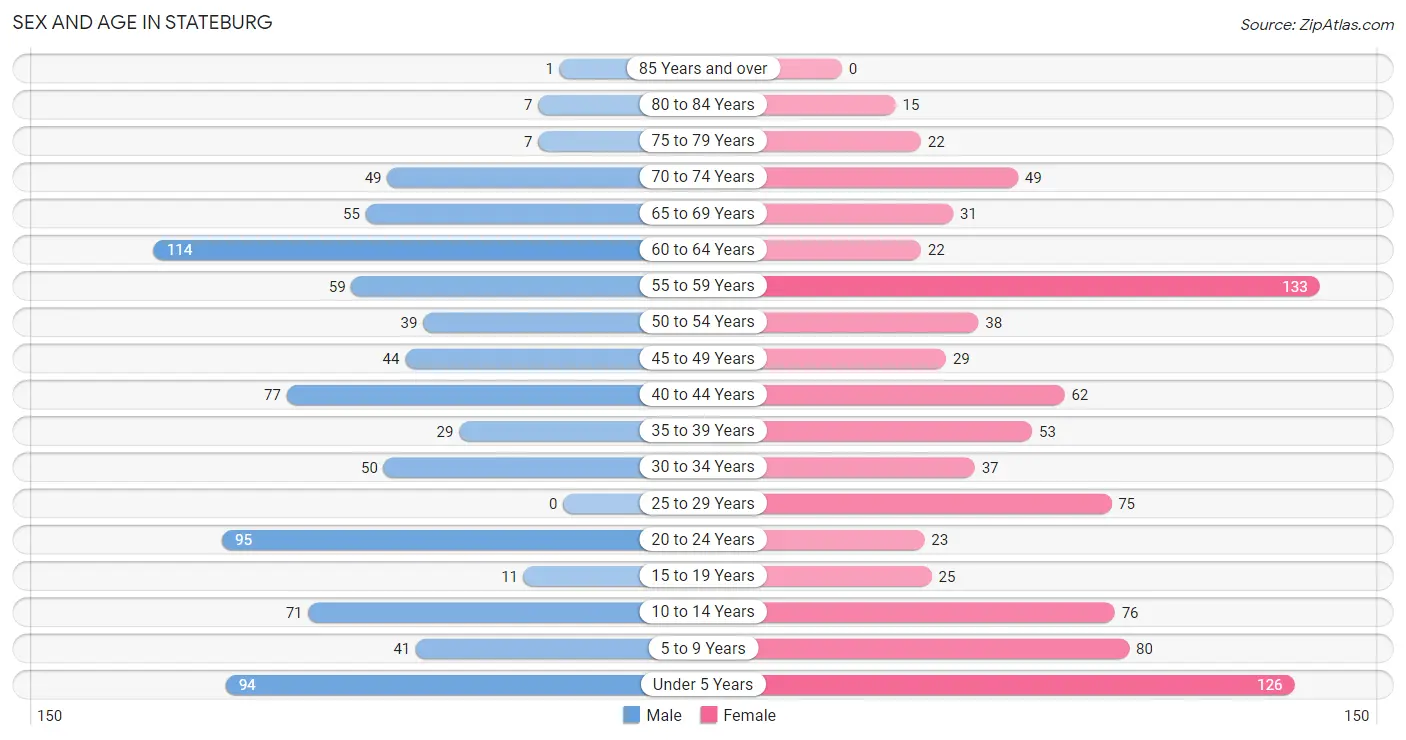
The most populous age groups in Stateburg are 60 to 64 Years (114 | 13.5%) for men and 55 to 59 Years (133 | 14.8%) for women.
| Age Bracket | Male | Female |
| Under 5 Years | 94 (11.2%) | 126 (14.1%) |
| 5 to 9 Years | 41 (4.9%) | 80 (8.9%) |
| 10 to 14 Years | 71 (8.4%) | 76 (8.5%) |
| 15 to 19 Years | 11 (1.3%) | 25 (2.8%) |
| 20 to 24 Years | 95 (11.3%) | 23 (2.6%) |
| 25 to 29 Years | 0 (0.0%) | 75 (8.4%) |
| 30 to 34 Years | 50 (5.9%) | 37 (4.1%) |
| 35 to 39 Years | 29 (3.4%) | 53 (5.9%) |
| 40 to 44 Years | 77 (9.1%) | 62 (6.9%) |
| 45 to 49 Years | 44 (5.2%) | 29 (3.2%) |
| 50 to 54 Years | 39 (4.6%) | 38 (4.2%) |
| 55 to 59 Years | 59 (7.0%) | 133 (14.8%) |
| 60 to 64 Years | 114 (13.5%) | 22 (2.5%) |
| 65 to 69 Years | 55 (6.5%) | 31 (3.5%) |
| 70 to 74 Years | 49 (5.8%) | 49 (5.5%) |
| 75 to 79 Years | 7 (0.8%) | 22 (2.5%) |
| 80 to 84 Years | 7 (0.8%) | 15 (1.7%) |
| 85 Years and over | 1 (0.1%) | 0 (0.0%) |
| Total | 843 (100.0%) | 896 (100.0%) |
Families and Households in Stateburg
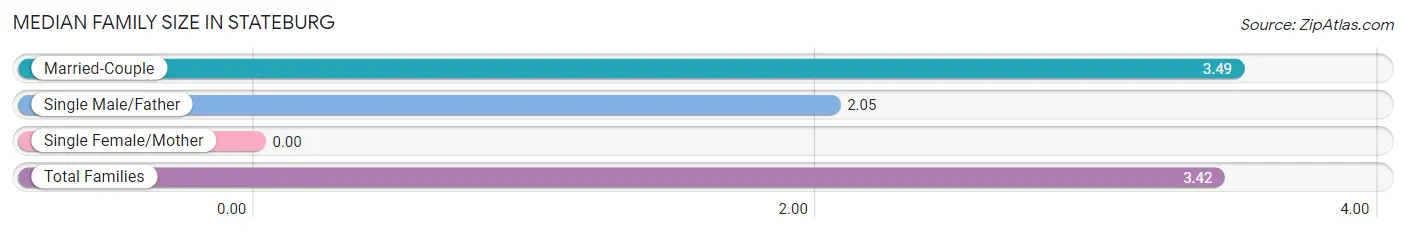
Median Family Size in Stateburg
| Family Type | # Families | Family Size |
| Married-Couple | 417 (95.0%) | 3.49 |
| Single Male/Father | 22 (5.0%) | 2.05 |
| Single Female/Mother | 0 (0.0%) | - |
| Total Families | 439 (100.0%) | 3.42 |
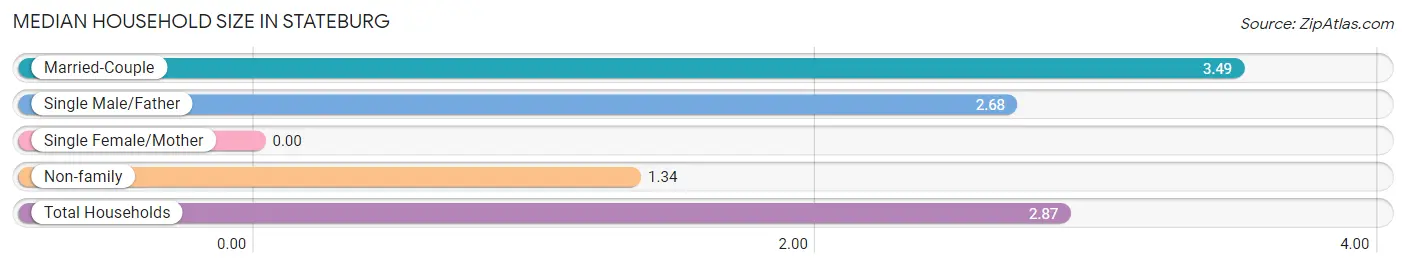
Median Household Size in Stateburg
| Household Type | # Households | Household Size |
| Married-Couple | 417 (68.8%) | 3.49 |
| Single Male/Father | 22 (3.6%) | 2.68 |
| Single Female/Mother | 0 (0.0%) | - |
| Non-family | 167 (27.6%) | 1.34 |
| Total Households | 606 (100.0%) | 2.87 |
Household Size by Marriage Status in Stateburg
Out of a total of 606 households in Stateburg, 439 (72.4%) are family households, while 167 (27.6%) are nonfamily households. The most numerous type of family households are 2-person households, comprising 257, and the most common type of nonfamily households are 1-person households, comprising 117.
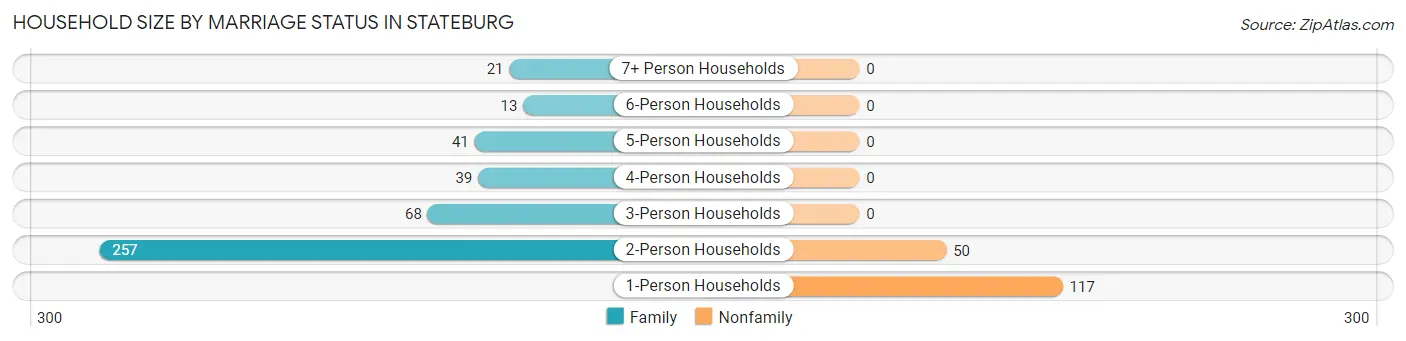
| Household Size | Family Households | Nonfamily Households |
| 1-Person Households | - | 117 (19.3%) |
| 2-Person Households | 257 (42.4%) | 50 (8.3%) |
| 3-Person Households | 68 (11.2%) | 0 (0.0%) |
| 4-Person Households | 39 (6.4%) | 0 (0.0%) |
| 5-Person Households | 41 (6.8%) | 0 (0.0%) |
| 6-Person Households | 13 (2.1%) | 0 (0.0%) |
| 7+ Person Households | 21 (3.5%) | 0 (0.0%) |
| Total | 439 (72.4%) | 167 (27.6%) |
Female Fertility in Stateburg
Fertility by Age in Stateburg
Average fertility rate in Stateburg is 203.0 births per 1,000 women. Women in the age bracket of 20 to 34 years have the highest fertility rate with 504.0 births per 1,000 women. Women in the age bracket of 20 to 34 years acount for 100.0% of all women with births.
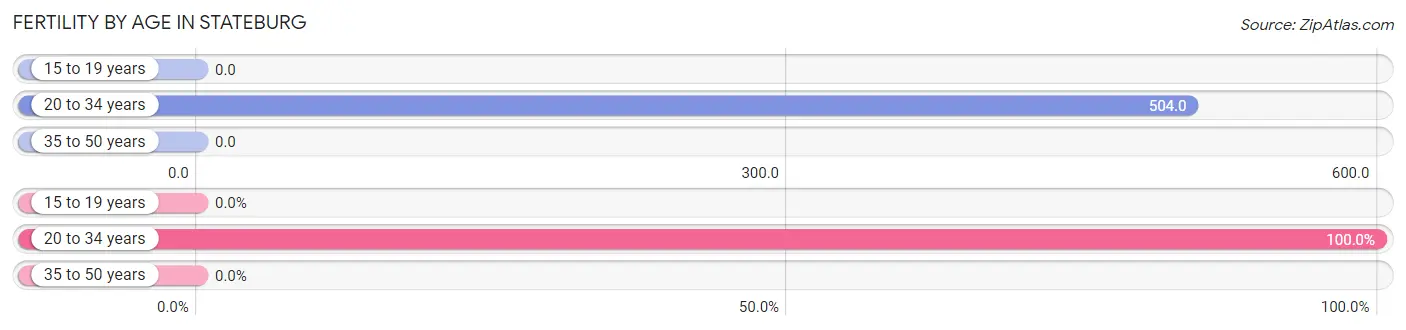
| Age Bracket | Women with Births | Births / 1,000 Women |
| 15 to 19 years | 0 (0.0%) | 0.0 |
| 20 to 34 years | 68 (100.0%) | 504.0 |
| 35 to 50 years | 0 (0.0%) | 0.0 |
| Total | 68 (100.0%) | 203.0 |
Fertility by Age by Marriage Status in Stateburg
88.2% of women with births (68) in Stateburg are married. The highest percentage of unmarried women with births falls into 20 to 34 years age bracket with 11.8% of them unmarried at the time of birth, while the lowest percentage of unmarried women with births belong to 20 to 34 years age bracket with 11.8% of them unmarried.
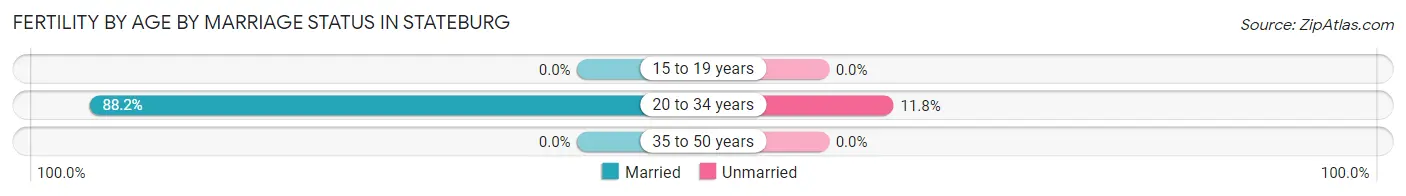
| Age Bracket | Married | Unmarried |
| 15 to 19 years | 0 (0.0%) | 0 (0.0%) |
| 20 to 34 years | 60 (88.2%) | 8 (11.8%) |
| 35 to 50 years | 0 (0.0%) | 0 (0.0%) |
| Total | 60 (88.2%) | 8 (11.8%) |
Fertility by Education in Stateburg
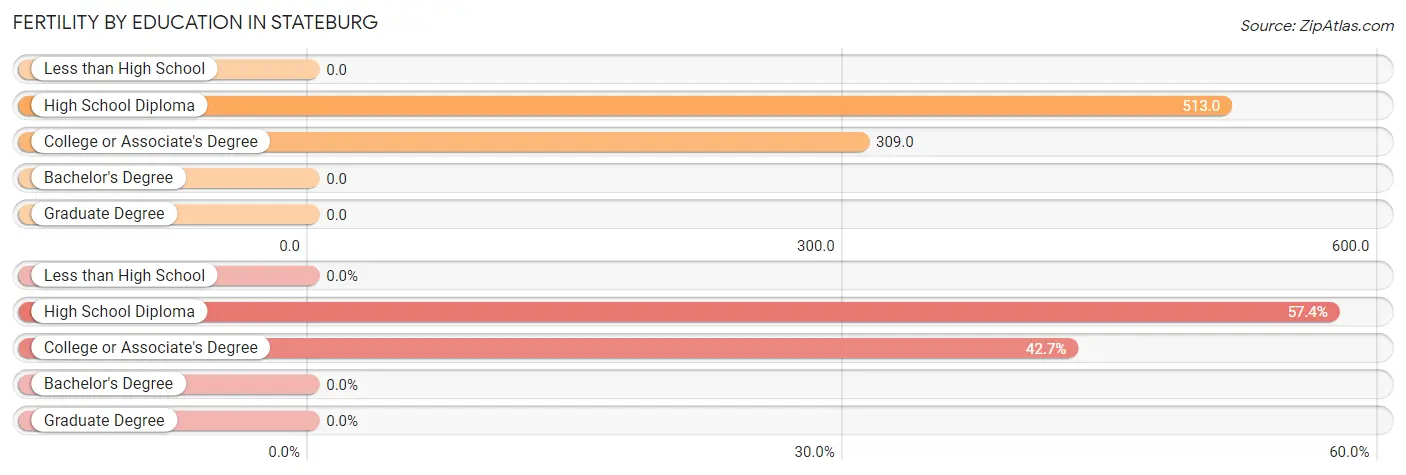
| Educational Attainment | Women with Births | Births / 1,000 Women |
| Less than High School | 0 (0.0%) | 0.0 |
| High School Diploma | 39 (57.4%) | 513.0 |
| College or Associate's Degree | 29 (42.6%) | 309.0 |
| Bachelor's Degree | 0 (0.0%) | 0.0 |
| Graduate Degree | 0 (0.0%) | 0.0 |
| Total | 68 (100.0%) | 203.0 |
Fertility by Education by Marriage Status in Stateburg
11.8% of women with births in Stateburg are unmarried. Women with the educational attainment of high school diploma are most likely to be married with 100.0% of them married at childbirth, while women with the educational attainment of college or associate's degree are least likely to be married with 27.6% of them unmarried at childbirth.
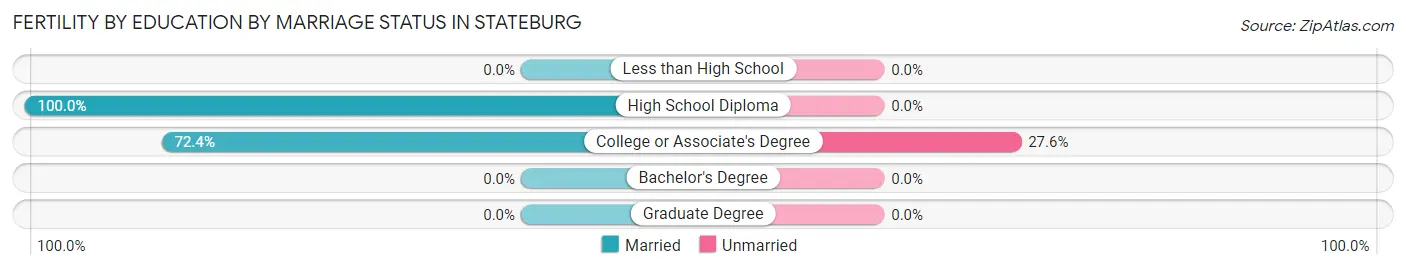
| Educational Attainment | Married | Unmarried |
| Less than High School | 0 (0.0%) | 0 (0.0%) |
| High School Diploma | 39 (100.0%) | 0 (0.0%) |
| College or Associate's Degree | 21 (72.4%) | 8 (27.6%) |
| Bachelor's Degree | 0 (0.0%) | 0 (0.0%) |
| Graduate Degree | 0 (0.0%) | 0 (0.0%) |
| Total | 60 (88.2%) | 8 (11.8%) |
Employment Characteristics in Stateburg
Employment by Class of Employer in Stateburg
Among the 645 employed individuals in Stateburg, federal government employees (247 | 38.3%), private company employees (242 | 37.5%), and not-for-profit organizations (67 | 10.4%) make up the most common classes of employment.
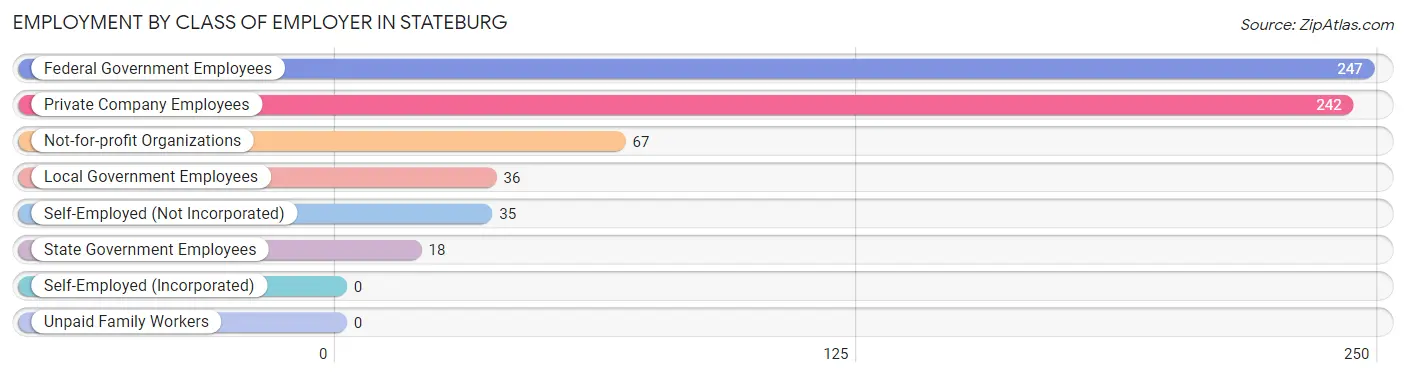
| Employer Class | # Employees | % Employees |
| Private Company Employees | 242 | 37.5% |
| Self-Employed (Incorporated) | 0 | 0.0% |
| Self-Employed (Not Incorporated) | 35 | 5.4% |
| Not-for-profit Organizations | 67 | 10.4% |
| Local Government Employees | 36 | 5.6% |
| State Government Employees | 18 | 2.8% |
| Federal Government Employees | 247 | 38.3% |
| Unpaid Family Workers | 0 | 0.0% |
| Total | 645 | 100.0% |
Employment Status by Age in Stateburg
According to the labor force statistics for Stateburg, out of the total population over 16 years of age (1,251), 55.9% or 699 individuals are in the labor force, with 4.8% or 34 of them unemployed. The age group with the highest labor force participation rate is 20 to 24 years, with 93.2% or 110 individuals in the labor force. Within the labor force, the 20 to 24 years age range has the highest percentage of unemployed individuals, with 65.2% or 72 of them being unemployed.
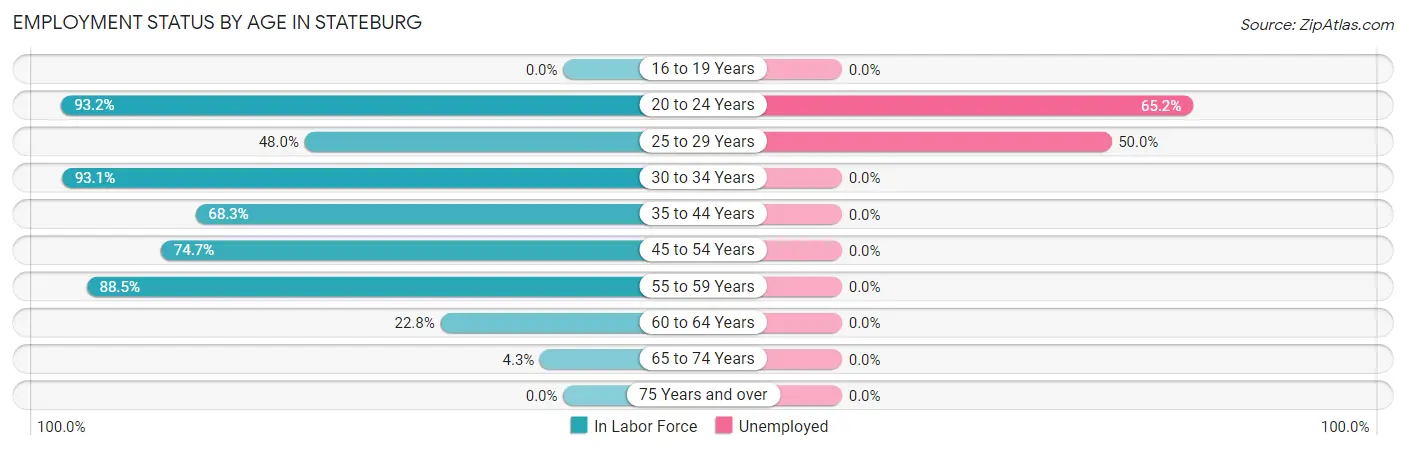
| Age Bracket | In Labor Force | Unemployed |
| 16 to 19 Years | 0 (0.0%) | 0 (0.0%) |
| 20 to 24 Years | 110 (93.2%) | 72 (65.2%) |
| 25 to 29 Years | 36 (48.0%) | 18 (50.0%) |
| 30 to 34 Years | 81 (93.1%) | 0 (0.0%) |
| 35 to 44 Years | 151 (68.3%) | 0 (0.0%) |
| 45 to 54 Years | 112 (74.7%) | 0 (0.0%) |
| 55 to 59 Years | 170 (88.5%) | 0 (0.0%) |
| 60 to 64 Years | 31 (22.8%) | 0 (0.0%) |
| 65 to 74 Years | 8 (4.3%) | 0 (0.0%) |
| 75 Years and over | 0 (0.0%) | 0 (0.0%) |
| Total | 699 (55.9%) | 34 (4.8%) |
Employment Status by Educational Attainment in Stateburg
According to labor force statistics for Stateburg, 67.5% of individuals (581) out of the total population between 25 and 64 years of age (861) are in the labor force, with 2.3% or 13 of them being unemployed. The group with the highest labor force participation rate are those with the educational attainment of less than high school, with 100.0% or 9 individuals in the labor force. Within the labor force, individuals with bachelor's degree or higher education have the highest percentage of unemployment, with 3.9% or 13 of them being unemployed.
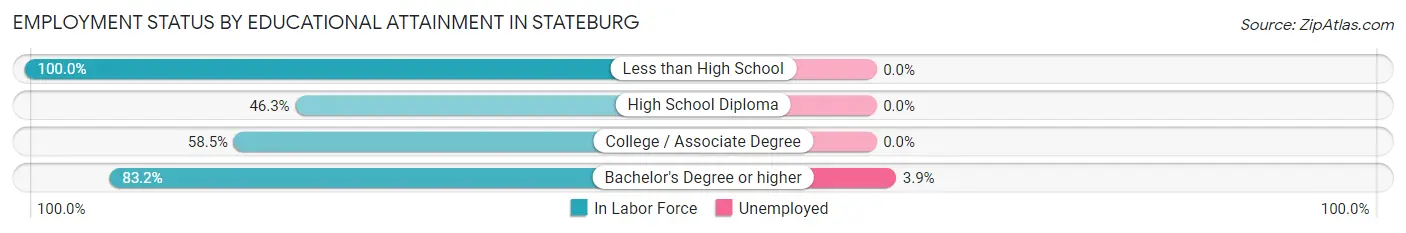
| Educational Attainment | In Labor Force | Unemployed |
| Less than High School | 9 (100.0%) | 0 (0.0%) |
| High School Diploma | 87 (46.3%) | 0 (0.0%) |
| College / Associate Degree | 159 (58.5%) | 0 (0.0%) |
| Bachelor's Degree or higher | 326 (83.2%) | 15 (3.9%) |
| Total | 581 (67.5%) | 20 (2.3%) |
Employment Occupations by Sex in Stateburg
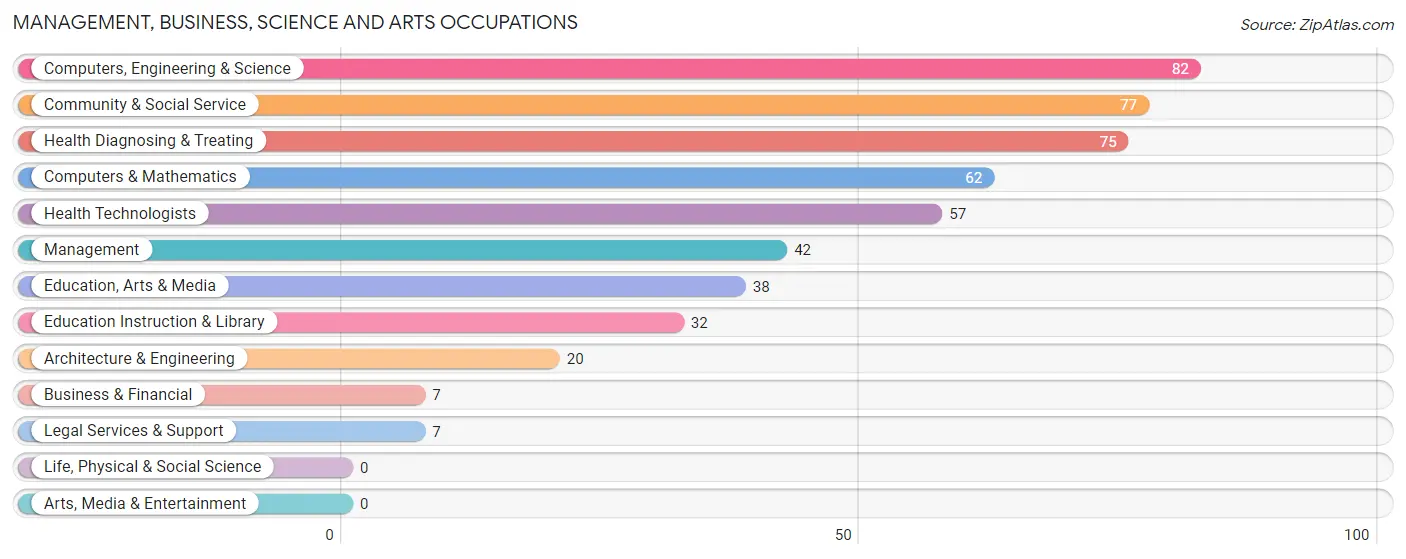
Management, Business, Science and Arts Occupations
The most common Management, Business, Science and Arts occupations in Stateburg are Computers, Engineering & Science (82 | 15.5%), Community & Social Service (77 | 14.5%), Health Diagnosing & Treating (75 | 14.1%), Computers & Mathematics (62 | 11.7%), and Health Technologists (57 | 10.7%).
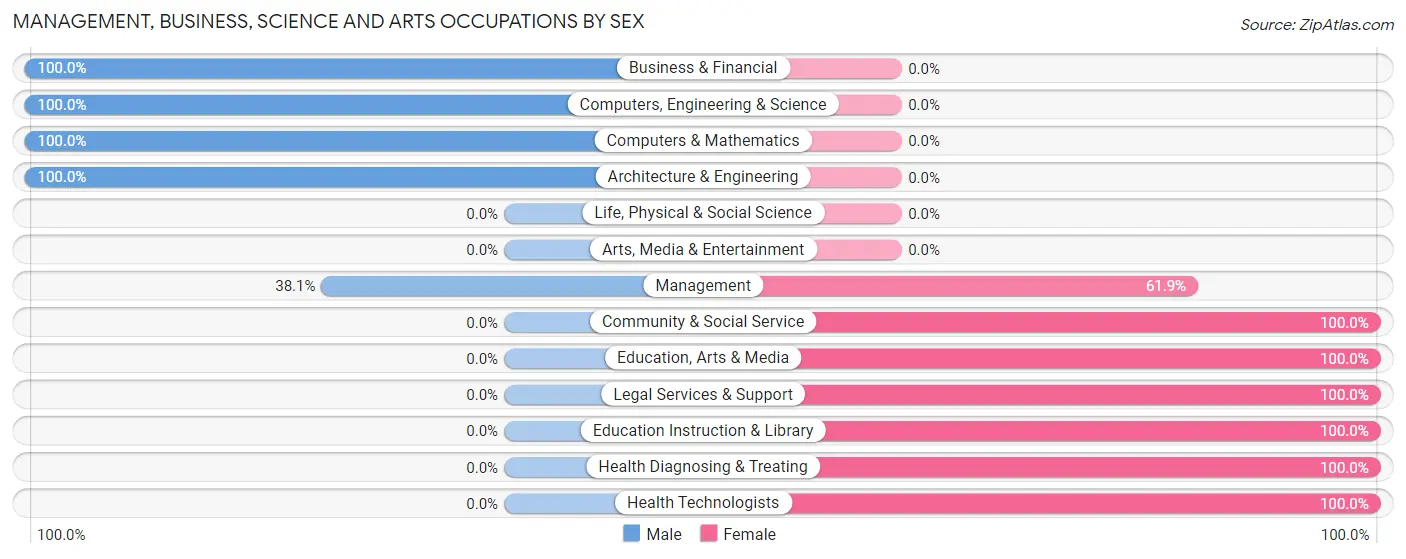
Management, Business, Science and Arts Occupations by Sex
Within the Management, Business, Science and Arts occupations in Stateburg, the most male-oriented occupations are Business & Financial (100.0%), Computers, Engineering & Science (100.0%), and Computers & Mathematics (100.0%), while the most female-oriented occupations are Community & Social Service (100.0%), Education, Arts & Media (100.0%), and Legal Services & Support (100.0%).
| Occupation | Male | Female |
| Management | 16 (38.1%) | 26 (61.9%) |
| Business & Financial | 7 (100.0%) | 0 (0.0%) |
| Computers, Engineering & Science | 82 (100.0%) | 0 (0.0%) |
| Computers & Mathematics | 62 (100.0%) | 0 (0.0%) |
| Architecture & Engineering | 20 (100.0%) | 0 (0.0%) |
| Life, Physical & Social Science | 0 (0.0%) | 0 (0.0%) |
| Community & Social Service | 0 (0.0%) | 77 (100.0%) |
| Education, Arts & Media | 0 (0.0%) | 38 (100.0%) |
| Legal Services & Support | 0 (0.0%) | 7 (100.0%) |
| Education Instruction & Library | 0 (0.0%) | 32 (100.0%) |
| Arts, Media & Entertainment | 0 (0.0%) | 0 (0.0%) |
| Health Diagnosing & Treating | 0 (0.0%) | 75 (100.0%) |
| Health Technologists | 0 (0.0%) | 57 (100.0%) |
| Total (Category) | 105 (37.1%) | 178 (62.9%) |
| Total (Overall) | 217 (40.9%) | 313 (59.1%) |
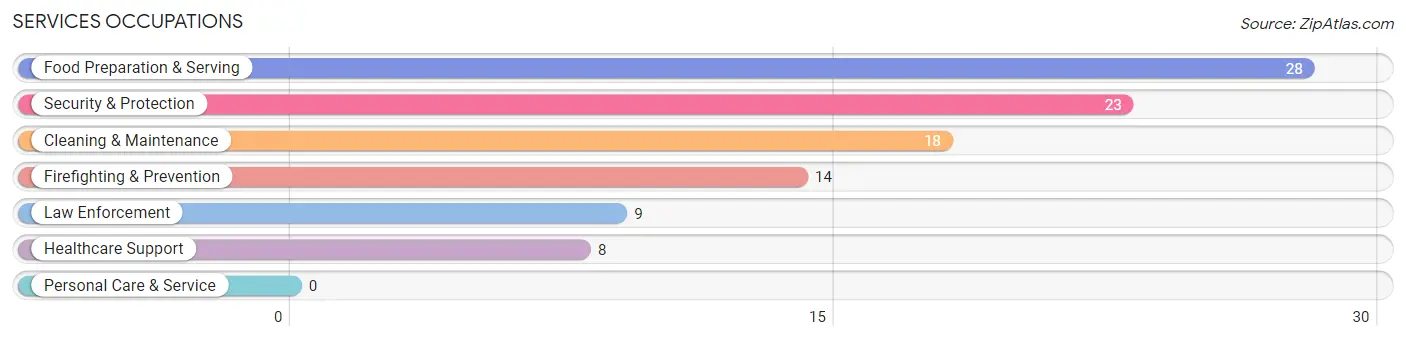
Services Occupations
The most common Services occupations in Stateburg are Food Preparation & Serving (28 | 5.3%), Security & Protection (23 | 4.3%), Cleaning & Maintenance (18 | 3.4%), Firefighting & Prevention (14 | 2.6%), and Law Enforcement (9 | 1.7%).
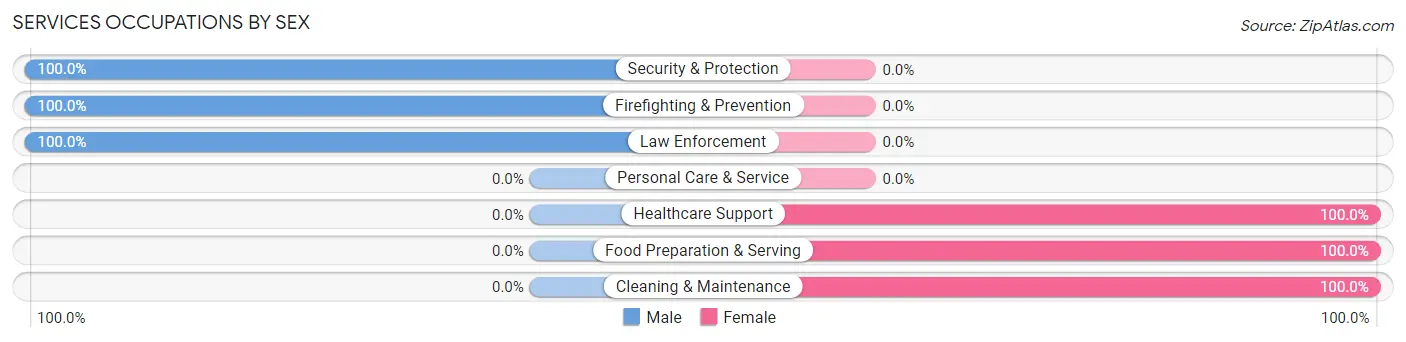
Services Occupations by Sex
Within the Services occupations in Stateburg, the most male-oriented occupations are Security & Protection (100.0%), Firefighting & Prevention (100.0%), and Law Enforcement (100.0%), while the most female-oriented occupations are Healthcare Support (100.0%), Food Preparation & Serving (100.0%), and Cleaning & Maintenance (100.0%).
| Occupation | Male | Female |
| Healthcare Support | 0 (0.0%) | 8 (100.0%) |
| Security & Protection | 23 (100.0%) | 0 (0.0%) |
| Firefighting & Prevention | 14 (100.0%) | 0 (0.0%) |
| Law Enforcement | 9 (100.0%) | 0 (0.0%) |
| Food Preparation & Serving | 0 (0.0%) | 28 (100.0%) |
| Cleaning & Maintenance | 0 (0.0%) | 18 (100.0%) |
| Personal Care & Service | 0 (0.0%) | 0 (0.0%) |
| Total (Category) | 23 (29.9%) | 54 (70.1%) |
| Total (Overall) | 217 (40.9%) | 313 (59.1%) |
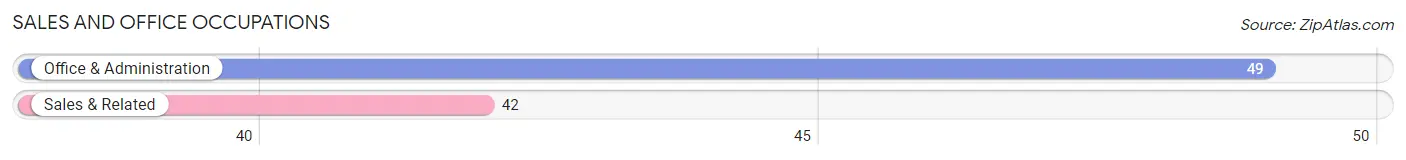
Sales and Office Occupations
The most common Sales and Office occupations in Stateburg are Office & Administration (49 | 9.2%), and Sales & Related (42 | 7.9%).
Sales and Office Occupations by Sex
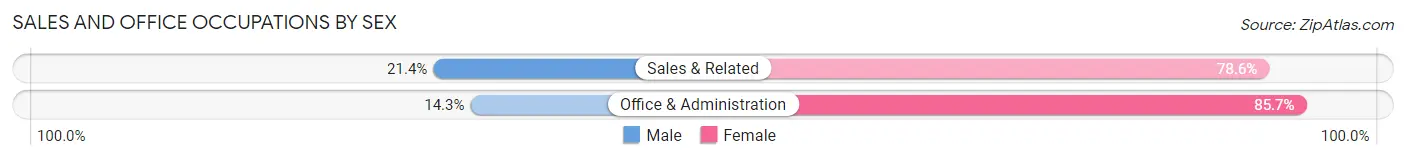
| Occupation | Male | Female |
| Sales & Related | 9 (21.4%) | 33 (78.6%) |
| Office & Administration | 7 (14.3%) | 42 (85.7%) |
| Total (Category) | 16 (17.6%) | 75 (82.4%) |
| Total (Overall) | 217 (40.9%) | 313 (59.1%) |
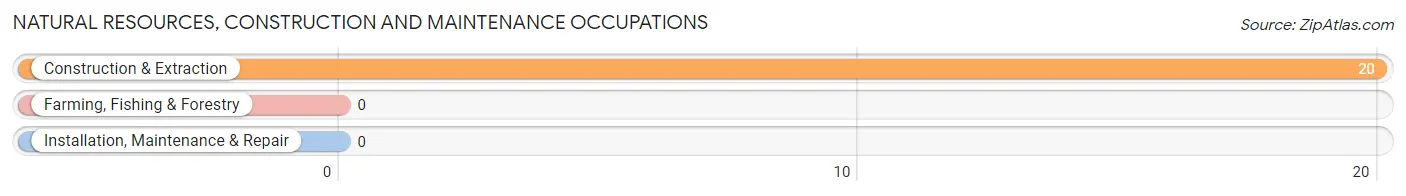
Natural Resources, Construction and Maintenance Occupations
The most common Natural Resources, Construction and Maintenance occupations in Stateburg are , and Construction & Extraction (20 | 3.8%).
Natural Resources, Construction and Maintenance Occupations by Sex
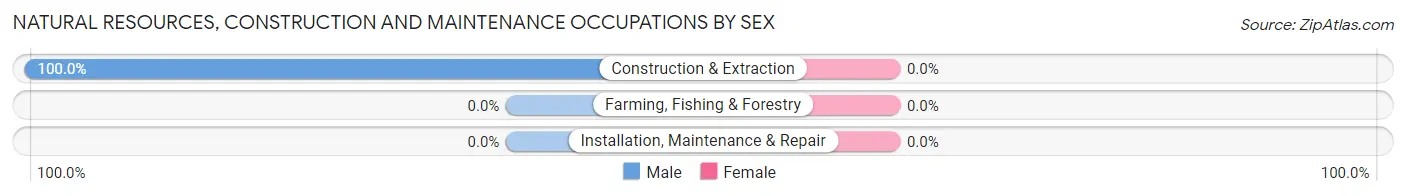
| Occupation | Male | Female |
| Farming, Fishing & Forestry | 0 (0.0%) | 0 (0.0%) |
| Construction & Extraction | 20 (100.0%) | 0 (0.0%) |
| Installation, Maintenance & Repair | 0 (0.0%) | 0 (0.0%) |
| Total (Category) | 20 (100.0%) | 0 (0.0%) |
| Total (Overall) | 217 (40.9%) | 313 (59.1%) |
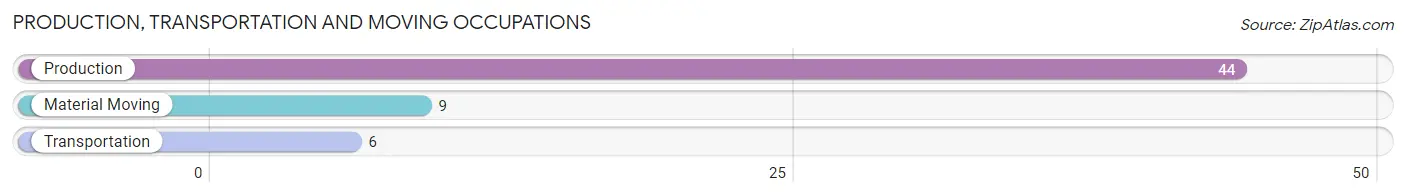
Production, Transportation and Moving Occupations
The most common Production, Transportation and Moving occupations in Stateburg are Production (44 | 8.3%), Material Moving (9 | 1.7%), and Transportation (6 | 1.1%).
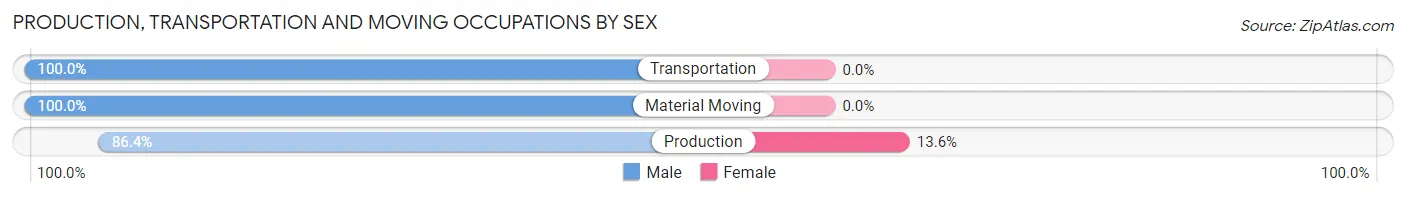
Production, Transportation and Moving Occupations by Sex
| Occupation | Male | Female |
| Production | 38 (86.4%) | 6 (13.6%) |
| Transportation | 6 (100.0%) | 0 (0.0%) |
| Material Moving | 9 (100.0%) | 0 (0.0%) |
| Total (Category) | 53 (89.8%) | 6 (10.2%) |
| Total (Overall) | 217 (40.9%) | 313 (59.1%) |
Employment Industries by Sex in Stateburg
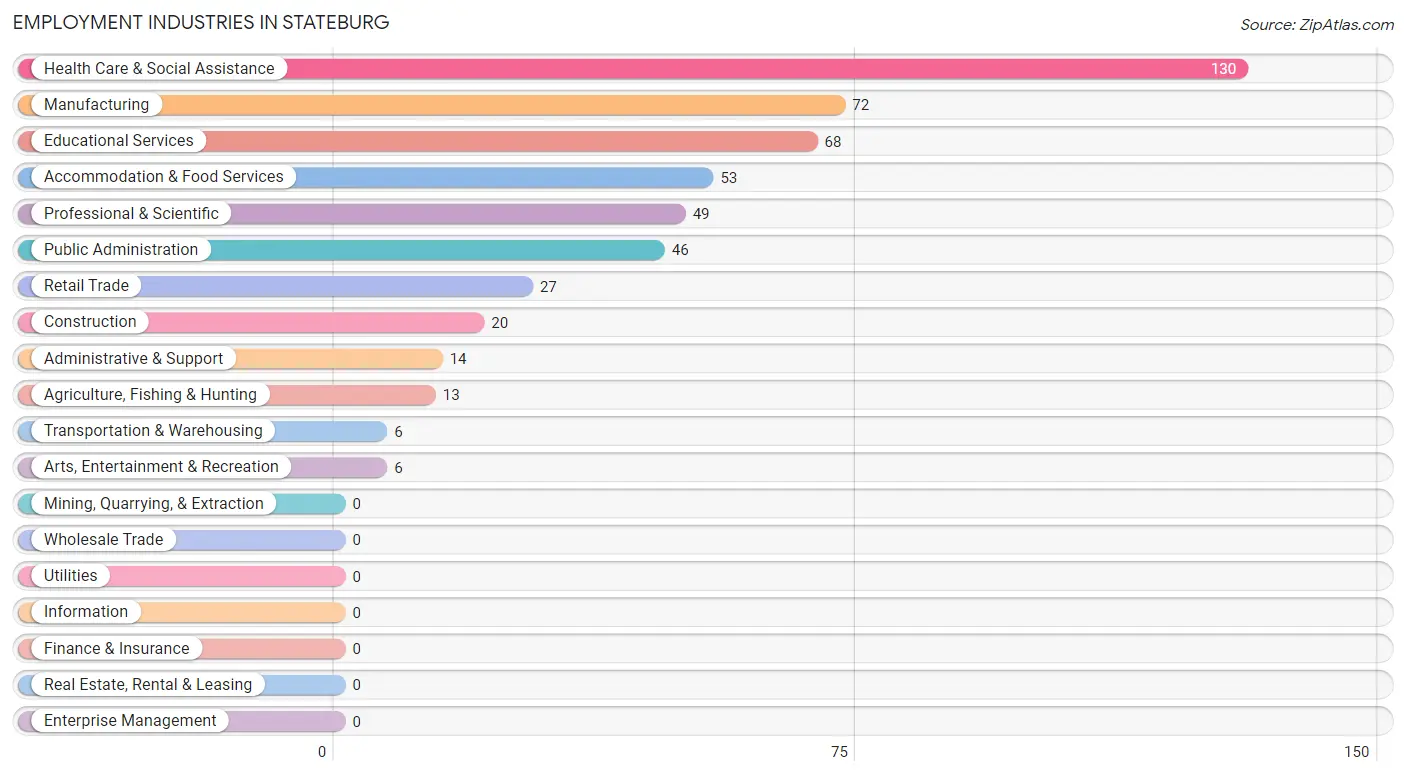
Employment Industries in Stateburg
The major employment industries in Stateburg include Health Care & Social Assistance (130 | 24.5%), Manufacturing (72 | 13.6%), Educational Services (68 | 12.8%), Accommodation & Food Services (53 | 10.0%), and Professional & Scientific (49 | 9.2%).
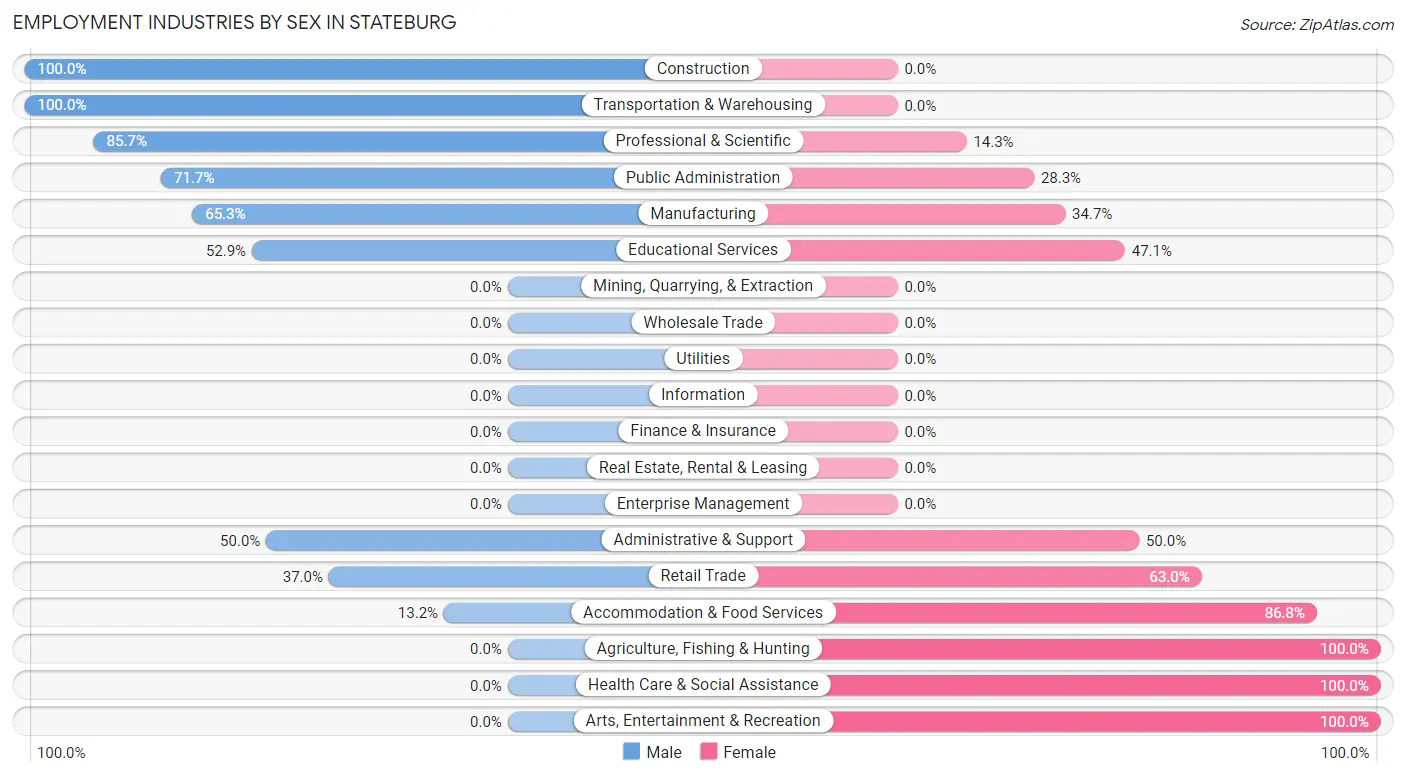
Employment Industries by Sex in Stateburg
The Stateburg industries that see more men than women are Construction (100.0%), Transportation & Warehousing (100.0%), and Professional & Scientific (85.7%), whereas the industries that tend to have a higher number of women are Agriculture, Fishing & Hunting (100.0%), Health Care & Social Assistance (100.0%), and Arts, Entertainment & Recreation (100.0%).
| Industry | Male | Female |
| Agriculture, Fishing & Hunting | 0 (0.0%) | 13 (100.0%) |
| Mining, Quarrying, & Extraction | 0 (0.0%) | 0 (0.0%) |
| Construction | 20 (100.0%) | 0 (0.0%) |
| Manufacturing | 47 (65.3%) | 25 (34.7%) |
| Wholesale Trade | 0 (0.0%) | 0 (0.0%) |
| Retail Trade | 10 (37.0%) | 17 (63.0%) |
| Transportation & Warehousing | 6 (100.0%) | 0 (0.0%) |
| Utilities | 0 (0.0%) | 0 (0.0%) |
| Information | 0 (0.0%) | 0 (0.0%) |
| Finance & Insurance | 0 (0.0%) | 0 (0.0%) |
| Real Estate, Rental & Leasing | 0 (0.0%) | 0 (0.0%) |
| Professional & Scientific | 42 (85.7%) | 7 (14.3%) |
| Enterprise Management | 0 (0.0%) | 0 (0.0%) |
| Administrative & Support | 7 (50.0%) | 7 (50.0%) |
| Educational Services | 36 (52.9%) | 32 (47.1%) |
| Health Care & Social Assistance | 0 (0.0%) | 130 (100.0%) |
| Arts, Entertainment & Recreation | 0 (0.0%) | 6 (100.0%) |
| Accommodation & Food Services | 7 (13.2%) | 46 (86.8%) |
| Public Administration | 33 (71.7%) | 13 (28.3%) |
| Total | 217 (40.9%) | 313 (59.1%) |
Education in Stateburg
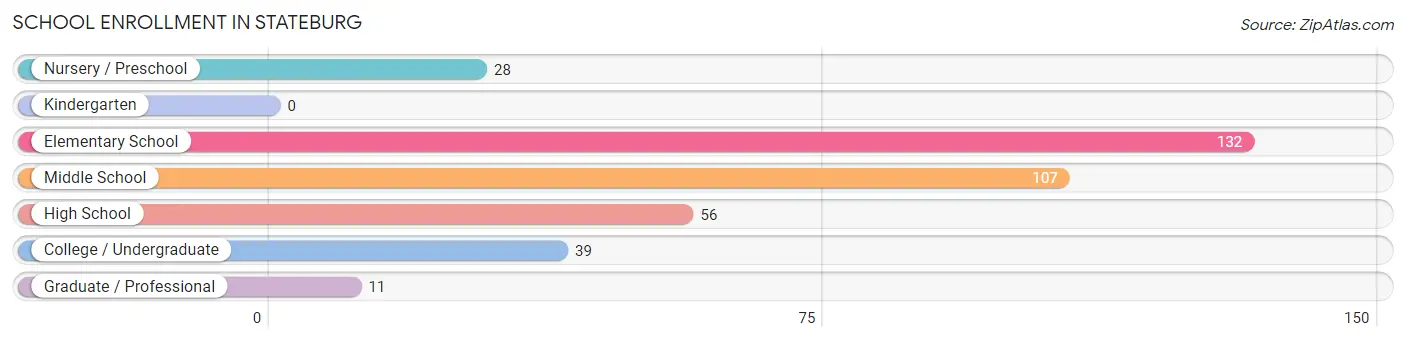
School Enrollment in Stateburg
The most common levels of schooling among the 373 students in Stateburg are elementary school (132 | 35.4%), middle school (107 | 28.7%), and high school (56 | 15.0%).
| School Level | # Students | % Students |
| Nursery / Preschool | 28 | 7.5% |
| Kindergarten | 0 | 0.0% |
| Elementary School | 132 | 35.4% |
| Middle School | 107 | 28.7% |
| High School | 56 | 15.0% |
| College / Undergraduate | 39 | 10.5% |
| Graduate / Professional | 11 | 2.9% |
| Total | 373 | 100.0% |
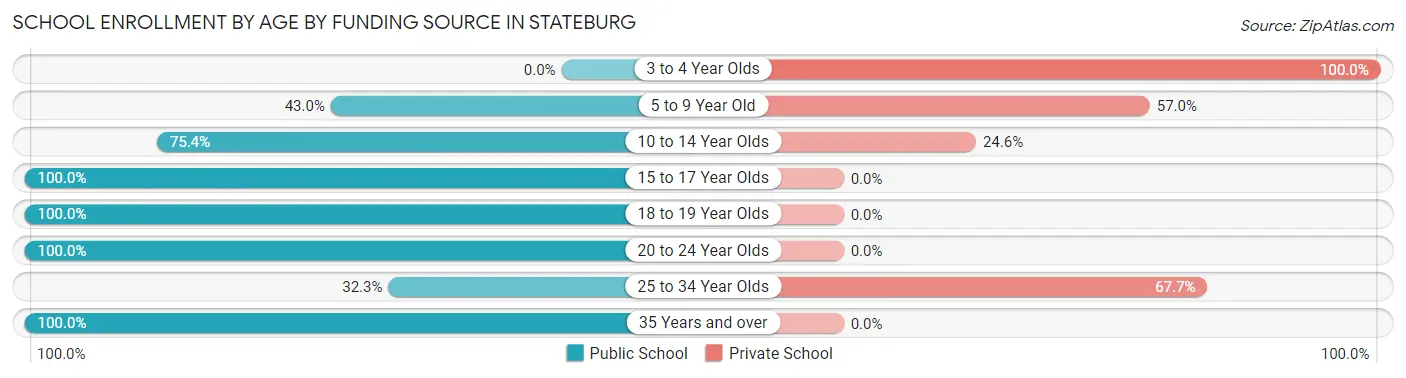
School Enrollment by Age by Funding Source in Stateburg
Out of a total of 373 students who are enrolled in schools in Stateburg, 152 (40.8%) attend a private institution, while the remaining 221 (59.2%) are enrolled in public schools. The age group of 3 to 4 year olds has the highest likelihood of being enrolled in private schools, with 28 (100.0% in the age bracket) enrolled. Conversely, the age group of 15 to 17 year olds has the lowest likelihood of being enrolled in a private school, with 32 (100.0% in the age bracket) attending a public institution.
| Age Bracket | Public School | Private School |
| 3 to 4 Year Olds | 0 (0.0%) | 28 (100.0%) |
| 5 to 9 Year Old | 52 (43.0%) | 69 (57.0%) |
| 10 to 14 Year Olds | 104 (75.4%) | 34 (24.6%) |
| 15 to 17 Year Olds | 32 (100.0%) | 0 (0.0%) |
| 18 to 19 Year Olds | 4 (100.0%) | 0 (0.0%) |
| 20 to 24 Year Olds | 8 (100.0%) | 0 (0.0%) |
| 25 to 34 Year Olds | 10 (32.3%) | 21 (67.7%) |
| 35 Years and over | 11 (100.0%) | 0 (0.0%) |
| Total | 221 (59.2%) | 152 (40.8%) |
Educational Attainment by Field of Study in Stateburg
Education (101 | 16.4%), bio, nature & agricultural (78 | 12.7%), science & technology (70 | 11.4%), arts & humanities (70 | 11.4%), and physical & health sciences (64 | 10.4%) are the most common fields of study among 615 individuals in Stateburg who have obtained a bachelor's degree or higher.
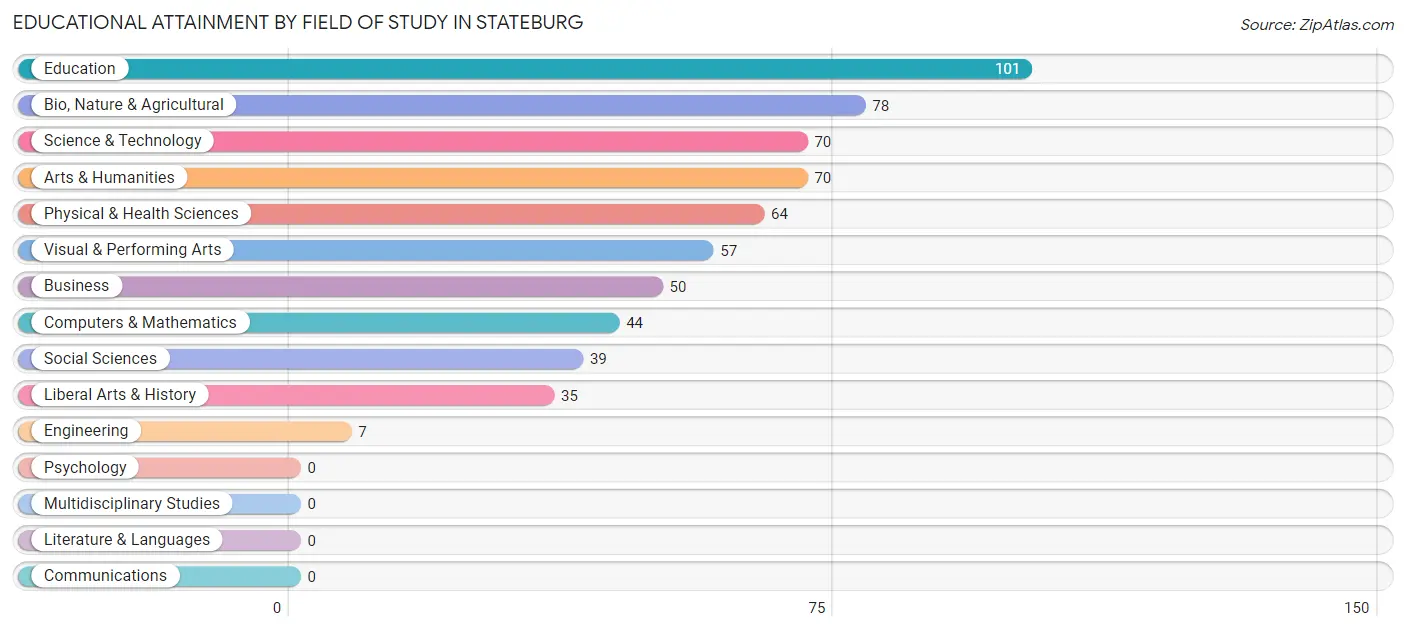
| Field of Study | # Graduates | % Graduates |
| Computers & Mathematics | 44 | 7.1% |
| Bio, Nature & Agricultural | 78 | 12.7% |
| Physical & Health Sciences | 64 | 10.4% |
| Psychology | 0 | 0.0% |
| Social Sciences | 39 | 6.3% |
| Engineering | 7 | 1.1% |
| Multidisciplinary Studies | 0 | 0.0% |
| Science & Technology | 70 | 11.4% |
| Business | 50 | 8.1% |
| Education | 101 | 16.4% |
| Literature & Languages | 0 | 0.0% |
| Liberal Arts & History | 35 | 5.7% |
| Visual & Performing Arts | 57 | 9.3% |
| Communications | 0 | 0.0% |
| Arts & Humanities | 70 | 11.4% |
| Total | 615 | 100.0% |
Transportation & Commute in Stateburg
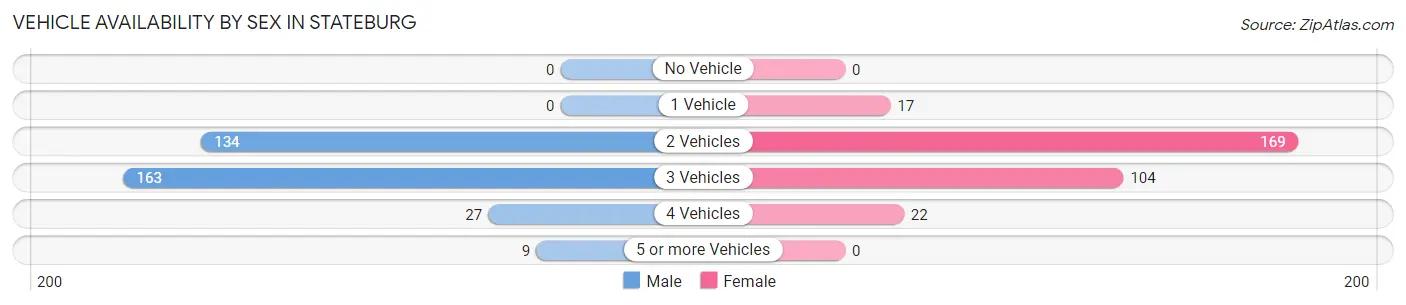
Vehicle Availability by Sex in Stateburg
The most prevalent vehicle ownership categories in Stateburg are males with 3 vehicles (163, accounting for 48.9%) and females with 3 vehicles (104, making up 52.2%).
| Vehicles Available | Male | Female |
| No Vehicle | 0 (0.0%) | 0 (0.0%) |
| 1 Vehicle | 0 (0.0%) | 17 (5.4%) |
| 2 Vehicles | 134 (40.2%) | 169 (54.2%) |
| 3 Vehicles | 163 (48.9%) | 104 (33.3%) |
| 4 Vehicles | 27 (8.1%) | 22 (7.0%) |
| 5 or more Vehicles | 9 (2.7%) | 0 (0.0%) |
| Total | 333 (100.0%) | 312 (100.0%) |
Commute Time in Stateburg
The most frequently occuring commute durations in Stateburg are 15 to 19 minutes (178 commuters, 28.4%), 10 to 14 minutes (133 commuters, 21.2%), and 20 to 24 minutes (86 commuters, 13.7%).
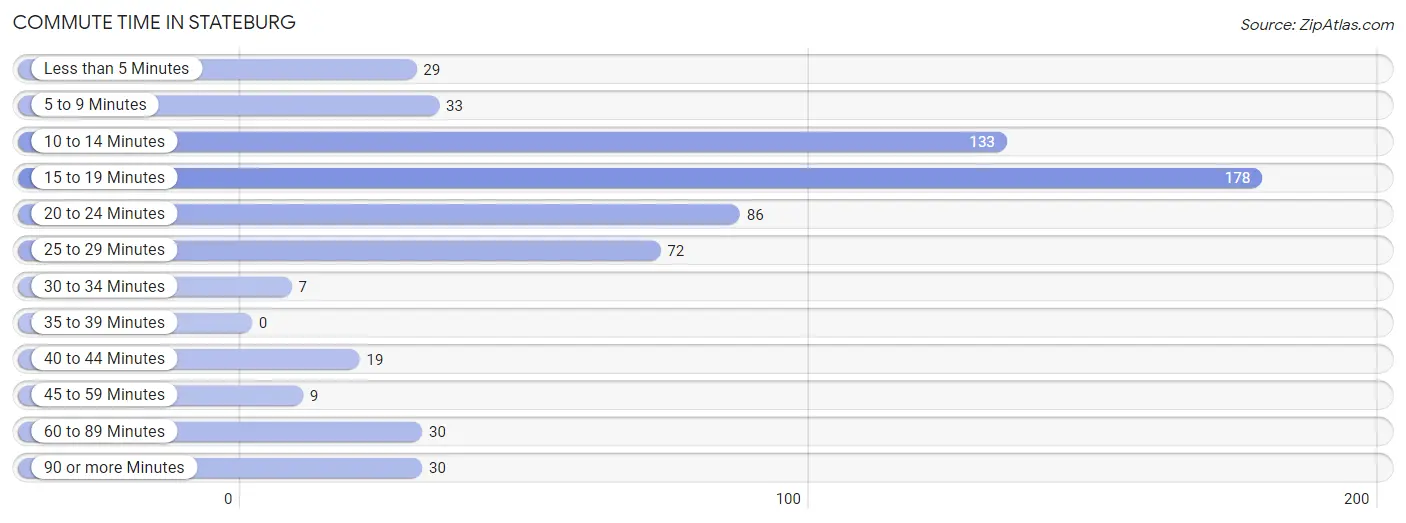
| Commute Time | # Commuters | % Commuters |
| Less than 5 Minutes | 29 | 4.6% |
| 5 to 9 Minutes | 33 | 5.3% |
| 10 to 14 Minutes | 133 | 21.2% |
| 15 to 19 Minutes | 178 | 28.4% |
| 20 to 24 Minutes | 86 | 13.7% |
| 25 to 29 Minutes | 72 | 11.5% |
| 30 to 34 Minutes | 7 | 1.1% |
| 35 to 39 Minutes | 0 | 0.0% |
| 40 to 44 Minutes | 19 | 3.0% |
| 45 to 59 Minutes | 9 | 1.4% |
| 60 to 89 Minutes | 30 | 4.8% |
| 90 or more Minutes | 30 | 4.8% |
Commute Time by Sex in Stateburg
The most common commute times in Stateburg are 10 to 14 minutes (126 commuters, 37.8%) for males and 15 to 19 minutes (130 commuters, 44.4%) for females.
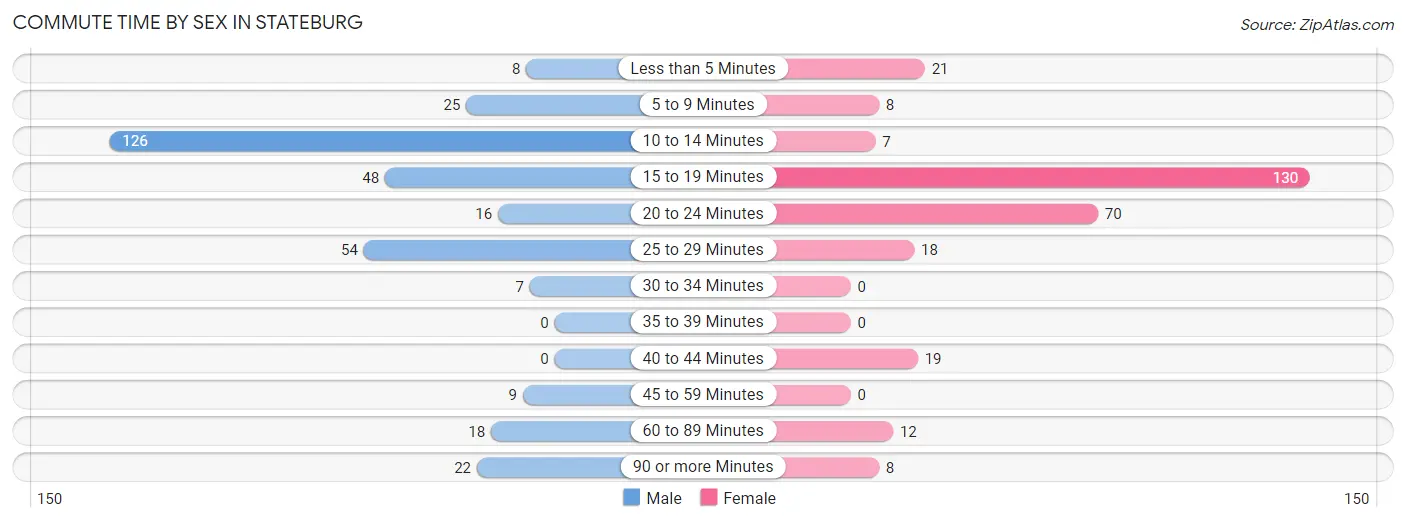
| Commute Time | Male | Female |
| Less than 5 Minutes | 8 (2.4%) | 21 (7.2%) |
| 5 to 9 Minutes | 25 (7.5%) | 8 (2.7%) |
| 10 to 14 Minutes | 126 (37.8%) | 7 (2.4%) |
| 15 to 19 Minutes | 48 (14.4%) | 130 (44.4%) |
| 20 to 24 Minutes | 16 (4.8%) | 70 (23.9%) |
| 25 to 29 Minutes | 54 (16.2%) | 18 (6.1%) |
| 30 to 34 Minutes | 7 (2.1%) | 0 (0.0%) |
| 35 to 39 Minutes | 0 (0.0%) | 0 (0.0%) |
| 40 to 44 Minutes | 0 (0.0%) | 19 (6.5%) |
| 45 to 59 Minutes | 9 (2.7%) | 0 (0.0%) |
| 60 to 89 Minutes | 18 (5.4%) | 12 (4.1%) |
| 90 or more Minutes | 22 (6.6%) | 8 (2.7%) |
Time of Departure to Work by Sex in Stateburg
The most frequent times of departure to work in Stateburg are 6:30 AM to 6:59 AM (145, 43.5%) for males and 7:30 AM to 7:59 AM (75, 25.6%) for females.
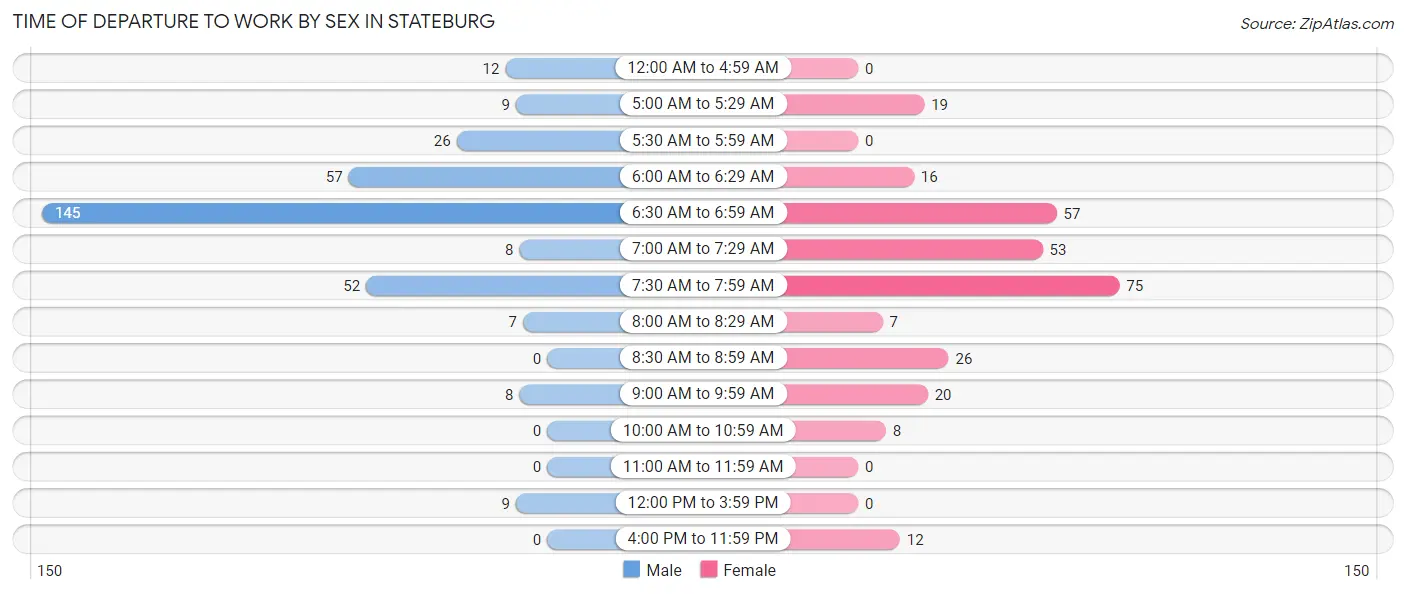
| Time of Departure | Male | Female |
| 12:00 AM to 4:59 AM | 12 (3.6%) | 0 (0.0%) |
| 5:00 AM to 5:29 AM | 9 (2.7%) | 19 (6.5%) |
| 5:30 AM to 5:59 AM | 26 (7.8%) | 0 (0.0%) |
| 6:00 AM to 6:29 AM | 57 (17.1%) | 16 (5.5%) |
| 6:30 AM to 6:59 AM | 145 (43.5%) | 57 (19.5%) |
| 7:00 AM to 7:29 AM | 8 (2.4%) | 53 (18.1%) |
| 7:30 AM to 7:59 AM | 52 (15.6%) | 75 (25.6%) |
| 8:00 AM to 8:29 AM | 7 (2.1%) | 7 (2.4%) |
| 8:30 AM to 8:59 AM | 0 (0.0%) | 26 (8.9%) |
| 9:00 AM to 9:59 AM | 8 (2.4%) | 20 (6.8%) |
| 10:00 AM to 10:59 AM | 0 (0.0%) | 8 (2.7%) |
| 11:00 AM to 11:59 AM | 0 (0.0%) | 0 (0.0%) |
| 12:00 PM to 3:59 PM | 9 (2.7%) | 0 (0.0%) |
| 4:00 PM to 11:59 PM | 0 (0.0%) | 12 (4.1%) |
| Total | 333 (100.0%) | 293 (100.0%) |
Housing Occupancy in Stateburg
Occupancy by Ownership in Stateburg
Of the total 606 dwellings in Stateburg, owner-occupied units account for 503 (83.0%), while renter-occupied units make up 103 (17.0%).
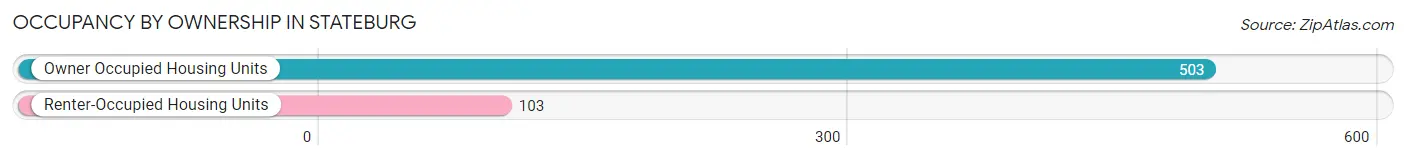
| Occupancy | # Housing Units | % Housing Units |
| Owner Occupied Housing Units | 503 | 83.0% |
| Renter-Occupied Housing Units | 103 | 17.0% |
| Total Occupied Housing Units | 606 | 100.0% |
Occupancy by Household Size in Stateburg
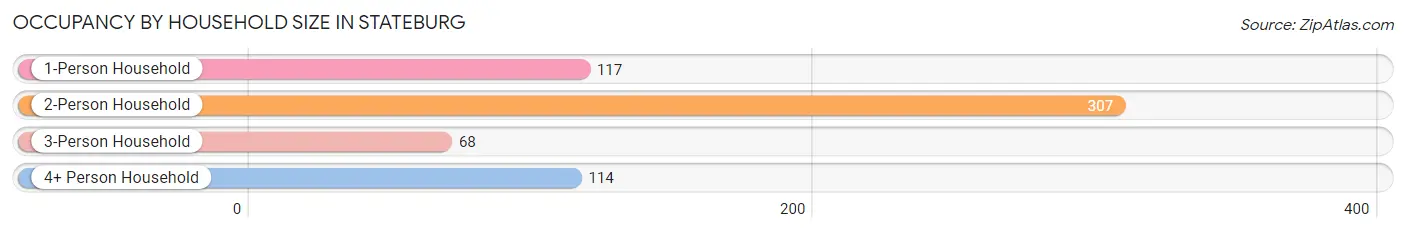
| Household Size | # Housing Units | % Housing Units |
| 1-Person Household | 117 | 19.3% |
| 2-Person Household | 307 | 50.7% |
| 3-Person Household | 68 | 11.2% |
| 4+ Person Household | 114 | 18.8% |
| Total Housing Units | 606 | 100.0% |
Occupancy by Ownership by Household Size in Stateburg
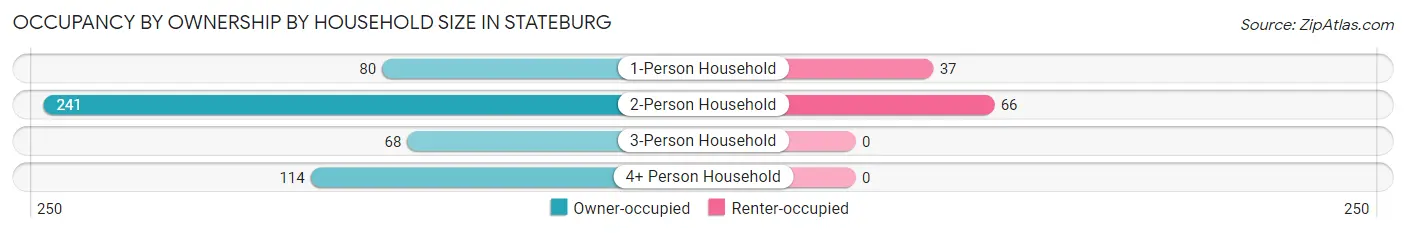
| Household Size | Owner-occupied | Renter-occupied |
| 1-Person Household | 80 (68.4%) | 37 (31.6%) |
| 2-Person Household | 241 (78.5%) | 66 (21.5%) |
| 3-Person Household | 68 (100.0%) | 0 (0.0%) |
| 4+ Person Household | 114 (100.0%) | 0 (0.0%) |
| Total Housing Units | 503 (83.0%) | 103 (17.0%) |
Occupancy by Educational Attainment in Stateburg
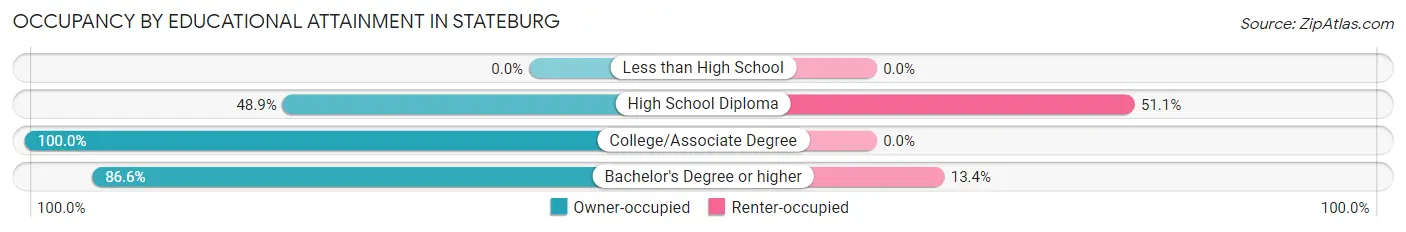
| Household Size | Owner-occupied | Renter-occupied |
| Less than High School | 0 (0.0%) | 0 (0.0%) |
| High School Diploma | 65 (48.9%) | 68 (51.1%) |
| College/Associate Degree | 212 (100.0%) | 0 (0.0%) |
| Bachelor's Degree or higher | 226 (86.6%) | 35 (13.4%) |
Occupancy by Age of Householder in Stateburg
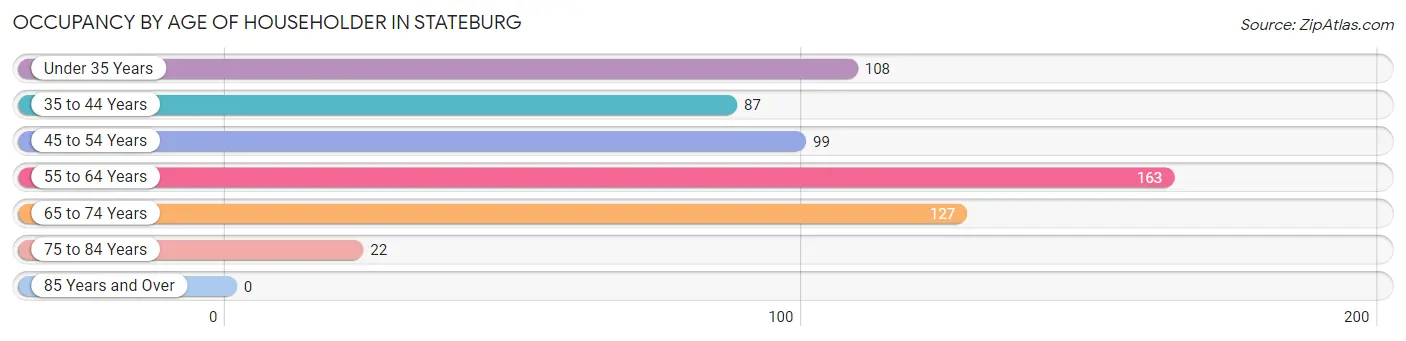
| Age Bracket | # Households | % Households |
| Under 35 Years | 108 | 17.8% |
| 35 to 44 Years | 87 | 14.4% |
| 45 to 54 Years | 99 | 16.3% |
| 55 to 64 Years | 163 | 26.9% |
| 65 to 74 Years | 127 | 21.0% |
| 75 to 84 Years | 22 | 3.6% |
| 85 Years and Over | 0 | 0.0% |
| Total | 606 | 100.0% |
Housing Finances in Stateburg
Median Income by Occupancy in Stateburg
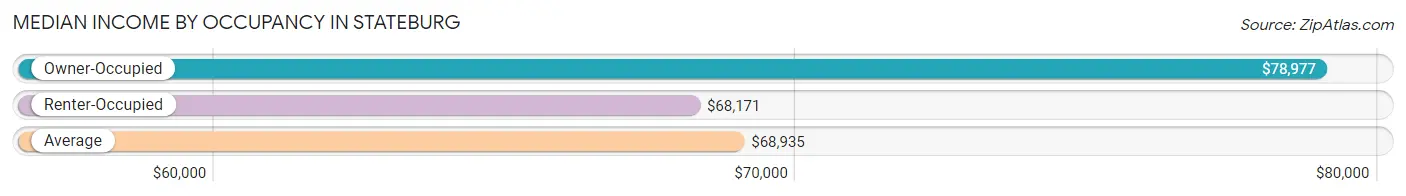
| Occupancy Type | # Households | Median Income |
| Owner-Occupied | 503 (83.0%) | $78,977 |
| Renter-Occupied | 103 (17.0%) | $68,171 |
| Average | 606 (100.0%) | $68,935 |
Occupancy by Householder Income Bracket in Stateburg
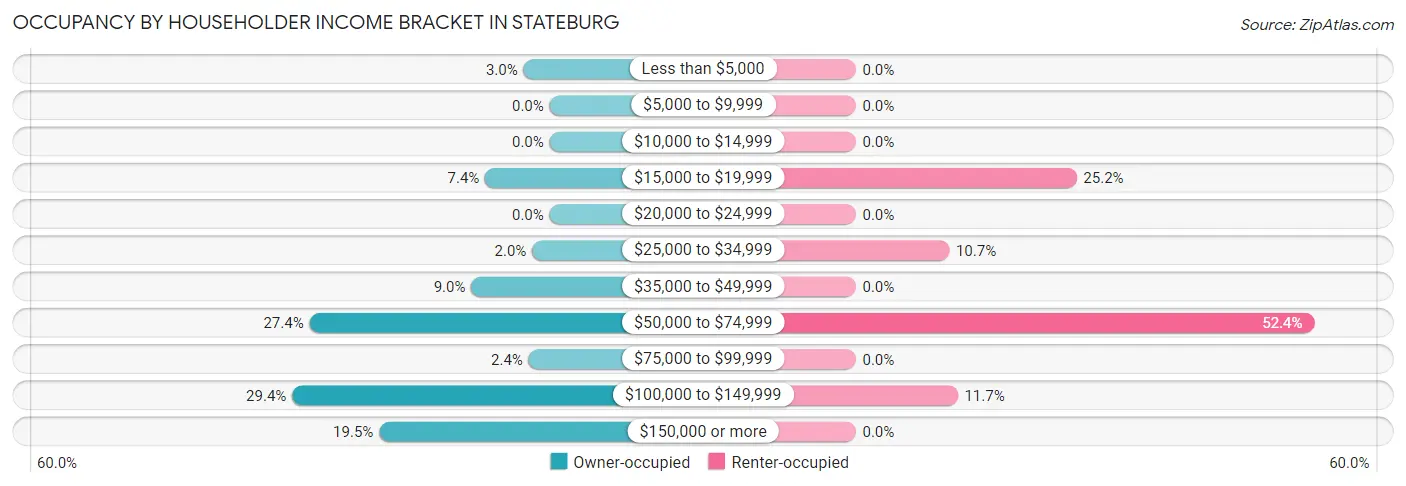
| Income Bracket | Owner-occupied | Renter-occupied |
| Less than $5,000 | 15 (3.0%) | 0 (0.0%) |
| $5,000 to $9,999 | 0 (0.0%) | 0 (0.0%) |
| $10,000 to $14,999 | 0 (0.0%) | 0 (0.0%) |
| $15,000 to $19,999 | 37 (7.4%) | 26 (25.2%) |
| $20,000 to $24,999 | 0 (0.0%) | 0 (0.0%) |
| $25,000 to $34,999 | 10 (2.0%) | 11 (10.7%) |
| $35,000 to $49,999 | 45 (8.9%) | 0 (0.0%) |
| $50,000 to $74,999 | 138 (27.4%) | 54 (52.4%) |
| $75,000 to $99,999 | 12 (2.4%) | 0 (0.0%) |
| $100,000 to $149,999 | 148 (29.4%) | 12 (11.7%) |
| $150,000 or more | 98 (19.5%) | 0 (0.0%) |
| Total | 503 (100.0%) | 103 (100.0%) |
Monthly Housing Cost Tiers in Stateburg
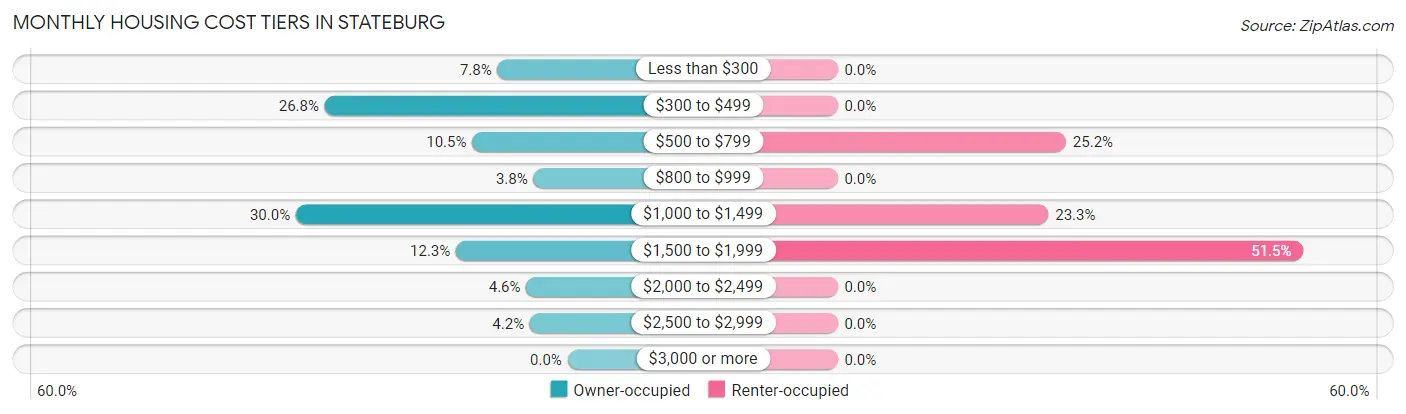
| Monthly Cost | Owner-occupied | Renter-occupied |
| Less than $300 | 39 (7.7%) | 0 (0.0%) |
| $300 to $499 | 135 (26.8%) | 0 (0.0%) |
| $500 to $799 | 53 (10.5%) | 26 (25.2%) |
| $800 to $999 | 19 (3.8%) | 0 (0.0%) |
| $1,000 to $1,499 | 151 (30.0%) | 24 (23.3%) |
| $1,500 to $1,999 | 62 (12.3%) | 53 (51.5%) |
| $2,000 to $2,499 | 23 (4.6%) | 0 (0.0%) |
| $2,500 to $2,999 | 21 (4.2%) | 0 (0.0%) |
| $3,000 or more | 0 (0.0%) | 0 (0.0%) |
| Total | 503 (100.0%) | 103 (100.0%) |
Physical Housing Characteristics in Stateburg
Housing Structures in Stateburg
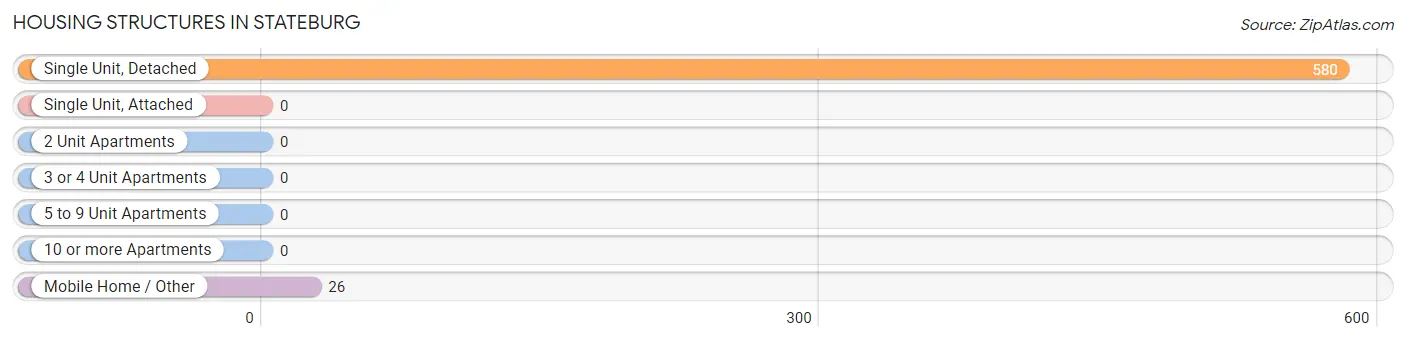
| Structure Type | # Housing Units | % Housing Units |
| Single Unit, Detached | 580 | 95.7% |
| Single Unit, Attached | 0 | 0.0% |
| 2 Unit Apartments | 0 | 0.0% |
| 3 or 4 Unit Apartments | 0 | 0.0% |
| 5 to 9 Unit Apartments | 0 | 0.0% |
| 10 or more Apartments | 0 | 0.0% |
| Mobile Home / Other | 26 | 4.3% |
| Total | 606 | 100.0% |
Housing Structures by Occupancy in Stateburg
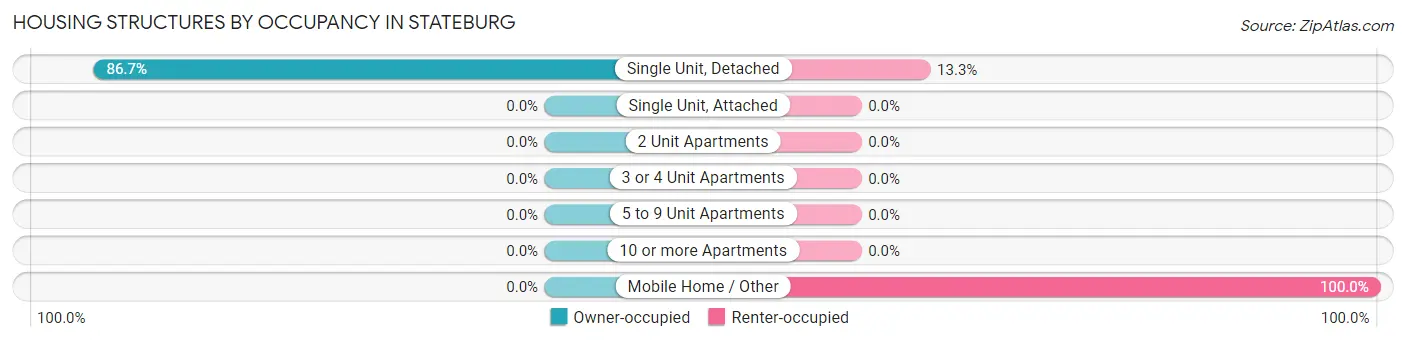
| Structure Type | Owner-occupied | Renter-occupied |
| Single Unit, Detached | 503 (86.7%) | 77 (13.3%) |
| Single Unit, Attached | 0 (0.0%) | 0 (0.0%) |
| 2 Unit Apartments | 0 (0.0%) | 0 (0.0%) |
| 3 or 4 Unit Apartments | 0 (0.0%) | 0 (0.0%) |
| 5 to 9 Unit Apartments | 0 (0.0%) | 0 (0.0%) |
| 10 or more Apartments | 0 (0.0%) | 0 (0.0%) |
| Mobile Home / Other | 0 (0.0%) | 26 (100.0%) |
| Total | 503 (83.0%) | 103 (17.0%) |
Housing Structures by Number of Rooms in Stateburg
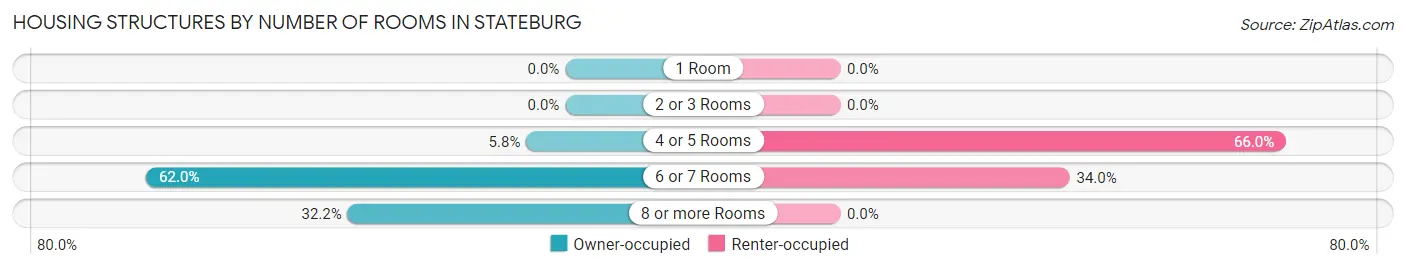
| Number of Rooms | Owner-occupied | Renter-occupied |
| 1 Room | 0 (0.0%) | 0 (0.0%) |
| 2 or 3 Rooms | 0 (0.0%) | 0 (0.0%) |
| 4 or 5 Rooms | 29 (5.8%) | 68 (66.0%) |
| 6 or 7 Rooms | 312 (62.0%) | 35 (34.0%) |
| 8 or more Rooms | 162 (32.2%) | 0 (0.0%) |
| Total | 503 (100.0%) | 103 (100.0%) |
Housing Structure by Heating Type in Stateburg
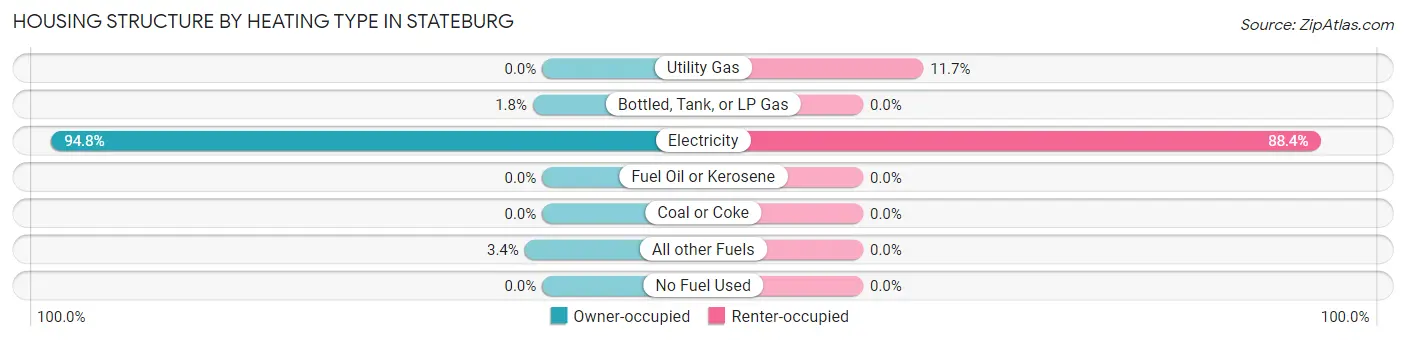
| Heating Type | Owner-occupied | Renter-occupied |
| Utility Gas | 0 (0.0%) | 12 (11.7%) |
| Bottled, Tank, or LP Gas | 9 (1.8%) | 0 (0.0%) |
| Electricity | 477 (94.8%) | 91 (88.3%) |
| Fuel Oil or Kerosene | 0 (0.0%) | 0 (0.0%) |
| Coal or Coke | 0 (0.0%) | 0 (0.0%) |
| All other Fuels | 17 (3.4%) | 0 (0.0%) |
| No Fuel Used | 0 (0.0%) | 0 (0.0%) |
| Total | 503 (100.0%) | 103 (100.0%) |
Household Vehicle Usage in Stateburg
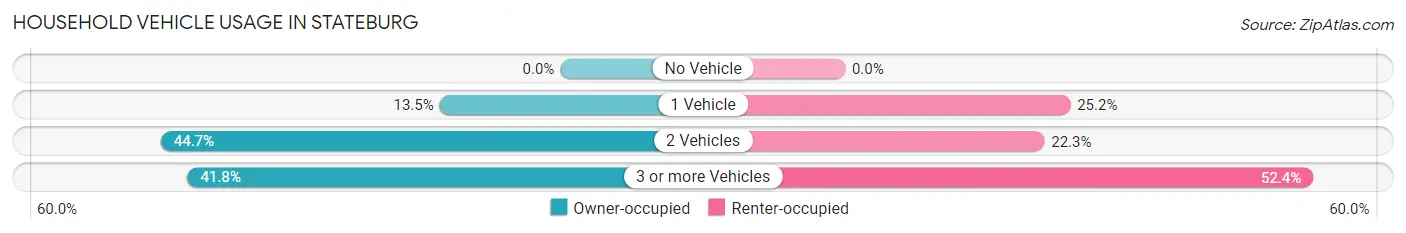
| Vehicles per Household | Owner-occupied | Renter-occupied |
| No Vehicle | 0 (0.0%) | 0 (0.0%) |
| 1 Vehicle | 68 (13.5%) | 26 (25.2%) |
| 2 Vehicles | 225 (44.7%) | 23 (22.3%) |
| 3 or more Vehicles | 210 (41.7%) | 54 (52.4%) |
| Total | 503 (100.0%) | 103 (100.0%) |
Real Estate & Mortgages in Stateburg
Real Estate and Mortgage Overview in Stateburg
| Characteristic | Without Mortgage | With Mortgage |
| Housing Units | 202 | 301 |
| Median Property Value | $226,400 | $203,200 |
| Median Household Income | $103,640 | $53 |
| Monthly Housing Costs | $414 | $0 |
| Real Estate Taxes | $1,019 | $28 |
Property Value by Mortgage Status in Stateburg
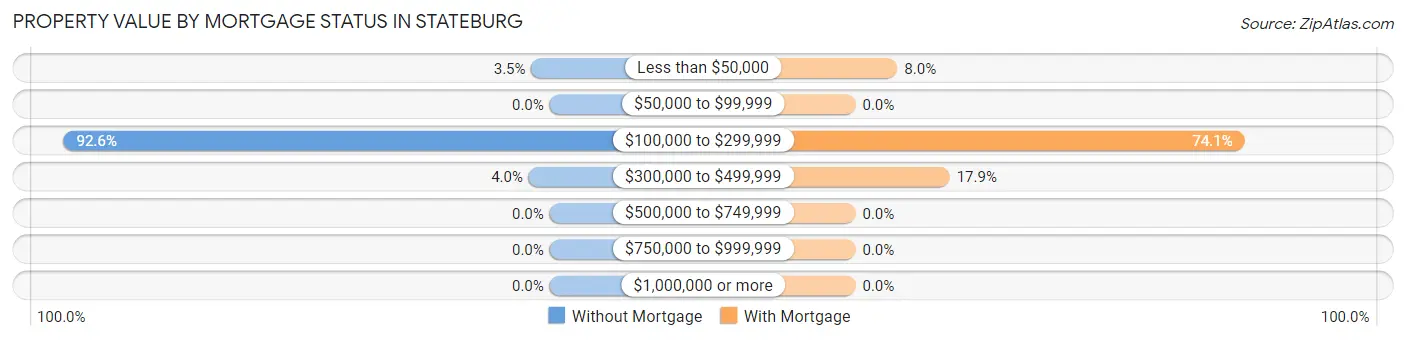
| Property Value | Without Mortgage | With Mortgage |
| Less than $50,000 | 7 (3.5%) | 24 (8.0%) |
| $50,000 to $99,999 | 0 (0.0%) | 0 (0.0%) |
| $100,000 to $299,999 | 187 (92.6%) | 223 (74.1%) |
| $300,000 to $499,999 | 8 (4.0%) | 54 (17.9%) |
| $500,000 to $749,999 | 0 (0.0%) | 0 (0.0%) |
| $750,000 to $999,999 | 0 (0.0%) | 0 (0.0%) |
| $1,000,000 or more | 0 (0.0%) | 0 (0.0%) |
| Total | 202 (100.0%) | 301 (100.0%) |
Household Income by Mortgage Status in Stateburg
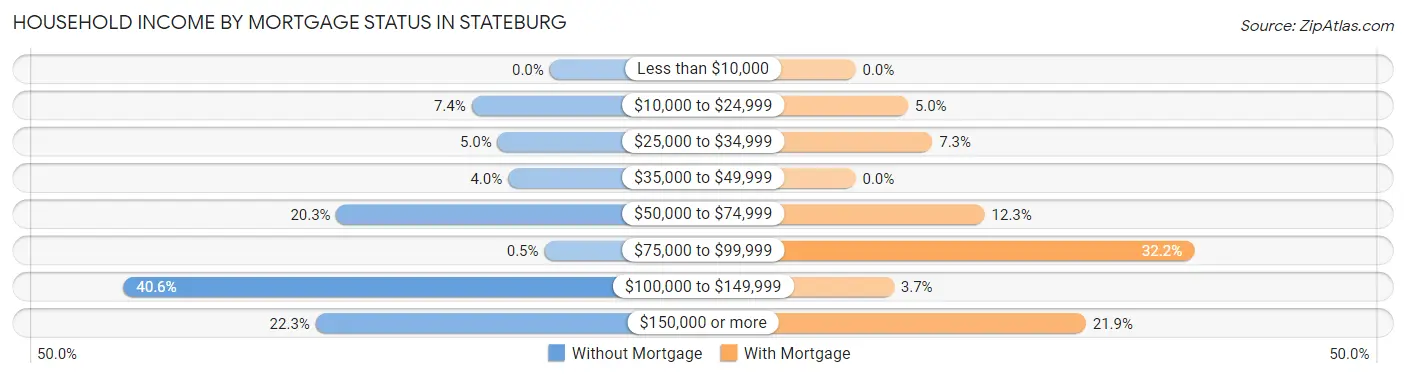
| Household Income | Without Mortgage | With Mortgage |
| Less than $10,000 | 0 (0.0%) | 0 (0.0%) |
| $10,000 to $24,999 | 15 (7.4%) | 15 (5.0%) |
| $25,000 to $34,999 | 10 (5.0%) | 22 (7.3%) |
| $35,000 to $49,999 | 8 (4.0%) | 0 (0.0%) |
| $50,000 to $74,999 | 41 (20.3%) | 37 (12.3%) |
| $75,000 to $99,999 | 1 (0.5%) | 97 (32.2%) |
| $100,000 to $149,999 | 82 (40.6%) | 11 (3.6%) |
| $150,000 or more | 45 (22.3%) | 66 (21.9%) |
| Total | 202 (100.0%) | 301 (100.0%) |
Property Value to Household Income Ratio in Stateburg
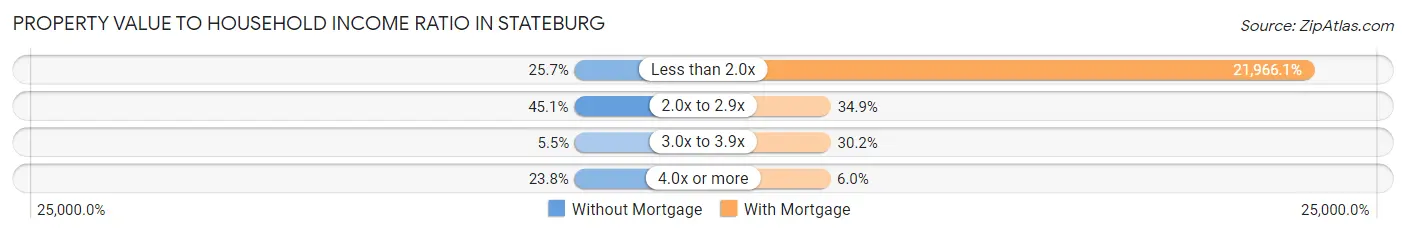
| Value-to-Income Ratio | Without Mortgage | With Mortgage |
| Less than 2.0x | 52 (25.7%) | 66,118 (21,966.1%) |
| 2.0x to 2.9x | 91 (45.1%) | 105 (34.9%) |
| 3.0x to 3.9x | 11 (5.4%) | 91 (30.2%) |
| 4.0x or more | 48 (23.8%) | 18 (6.0%) |
| Total | 202 (100.0%) | 301 (100.0%) |
Real Estate Taxes by Mortgage Status in Stateburg
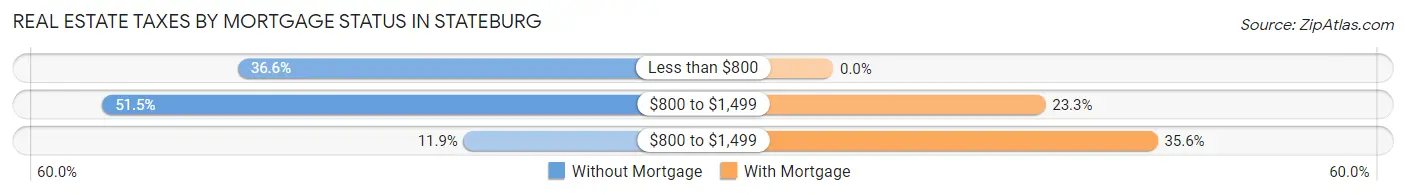
| Property Taxes | Without Mortgage | With Mortgage |
| Less than $800 | 74 (36.6%) | 0 (0.0%) |
| $800 to $1,499 | 104 (51.5%) | 70 (23.3%) |
| $800 to $1,499 | 24 (11.9%) | 107 (35.5%) |
| Total | 202 (100.0%) | 301 (100.0%) |
Health & Disability in Stateburg
Health Insurance Coverage by Age in Stateburg
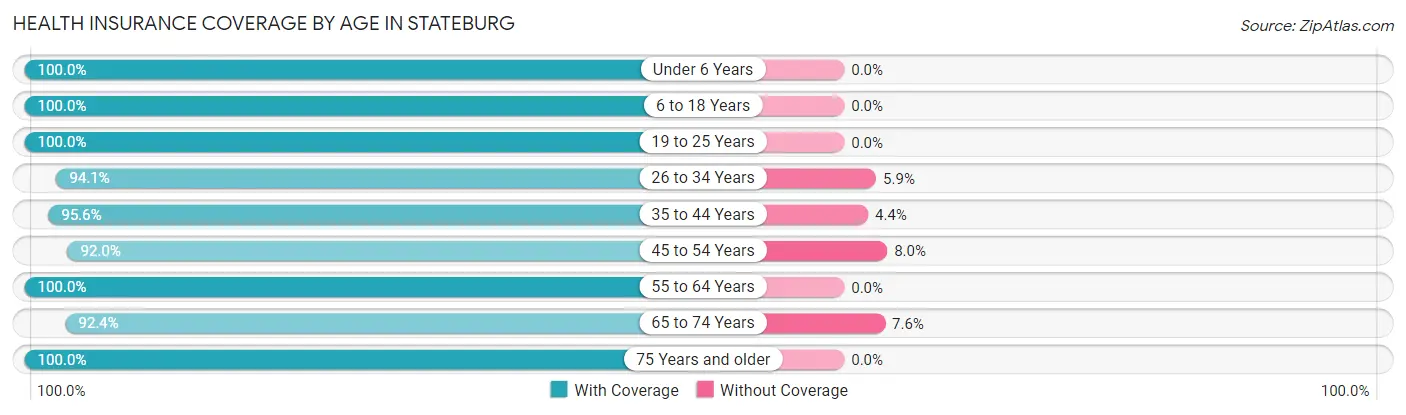
| Age Bracket | With Coverage | Without Coverage |
| Under 6 Years | 220 (100.0%) | 0 (0.0%) |
| 6 to 18 Years | 304 (100.0%) | 0 (0.0%) |
| 19 to 25 Years | 55 (100.0%) | 0 (0.0%) |
| 26 to 34 Years | 95 (94.1%) | 6 (5.9%) |
| 35 to 44 Years | 194 (95.6%) | 9 (4.4%) |
| 45 to 54 Years | 138 (92.0%) | 12 (8.0%) |
| 55 to 64 Years | 328 (100.0%) | 0 (0.0%) |
| 65 to 74 Years | 170 (92.4%) | 14 (7.6%) |
| 75 Years and older | 52 (100.0%) | 0 (0.0%) |
| Total | 1,556 (97.4%) | 41 (2.6%) |
Health Insurance Coverage by Citizenship Status in Stateburg
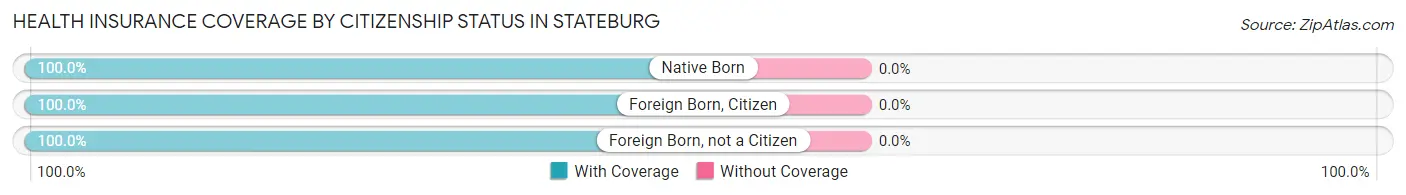
| Citizenship Status | With Coverage | Without Coverage |
| Native Born | 220 (100.0%) | 0 (0.0%) |
| Foreign Born, Citizen | 304 (100.0%) | 0 (0.0%) |
| Foreign Born, not a Citizen | 55 (100.0%) | 0 (0.0%) |
Health Insurance Coverage by Household Income in Stateburg
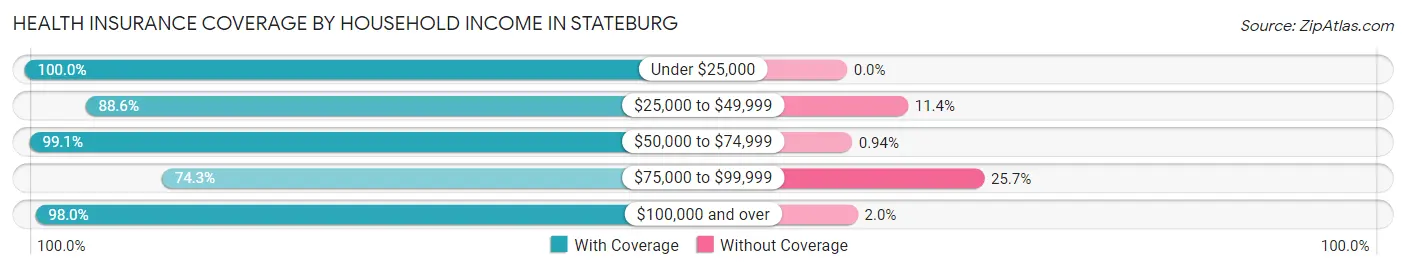
| Household Income | With Coverage | Without Coverage |
| Under $25,000 | 126 (100.0%) | 0 (0.0%) |
| $25,000 to $49,999 | 93 (88.6%) | 12 (11.4%) |
| $50,000 to $74,999 | 632 (99.1%) | 6 (0.9%) |
| $75,000 to $99,999 | 26 (74.3%) | 9 (25.7%) |
| $100,000 and over | 679 (98.0%) | 14 (2.0%) |
Public vs Private Health Insurance Coverage by Age in Stateburg
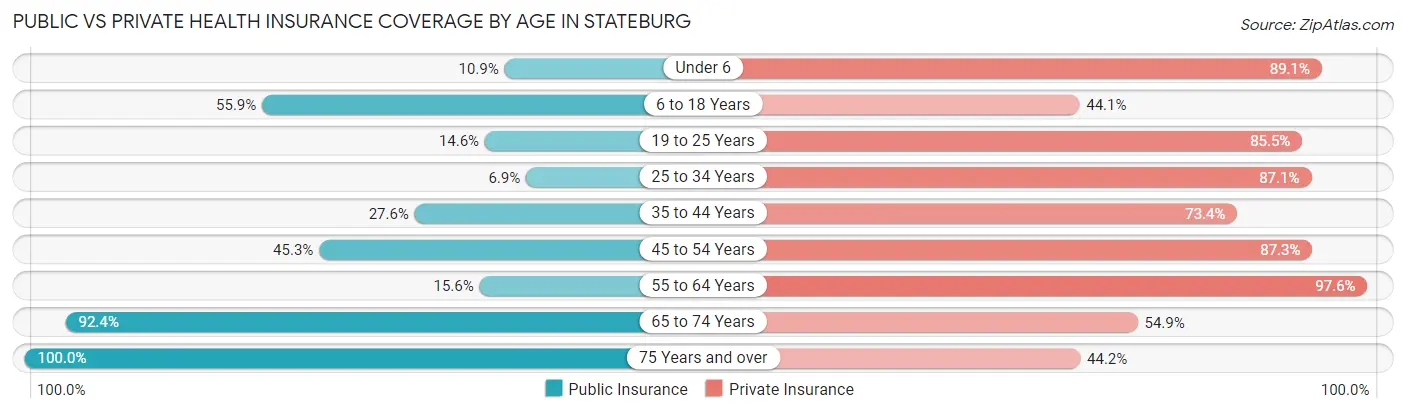
| Age Bracket | Public Insurance | Private Insurance |
| Under 6 | 24 (10.9%) | 196 (89.1%) |
| 6 to 18 Years | 170 (55.9%) | 134 (44.1%) |
| 19 to 25 Years | 8 (14.5%) | 47 (85.5%) |
| 25 to 34 Years | 7 (6.9%) | 88 (87.1%) |
| 35 to 44 Years | 56 (27.6%) | 149 (73.4%) |
| 45 to 54 Years | 68 (45.3%) | 131 (87.3%) |
| 55 to 64 Years | 51 (15.5%) | 320 (97.6%) |
| 65 to 74 Years | 170 (92.4%) | 101 (54.9%) |
| 75 Years and over | 52 (100.0%) | 23 (44.2%) |
| Total | 606 (38.0%) | 1,189 (74.5%) |
Disability Status by Sex by Age in Stateburg
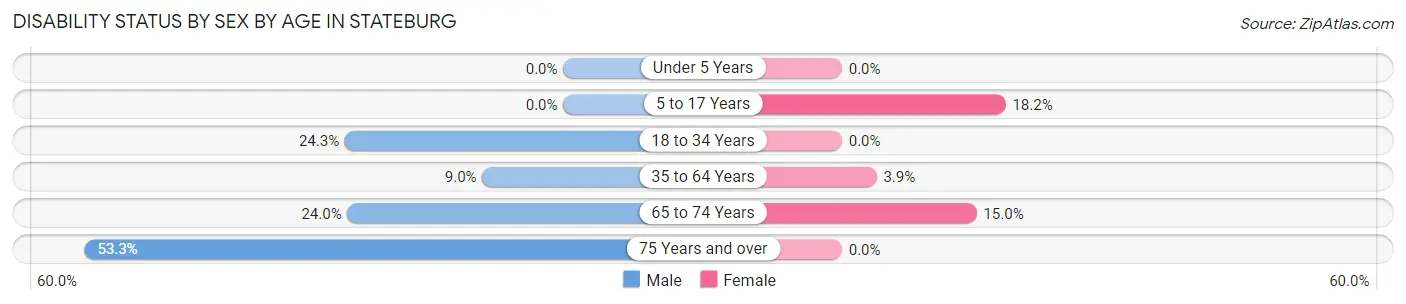
| Age Bracket | Male | Female |
| Under 5 Years | 0 (0.0%) | 0 (0.0%) |
| 5 to 17 Years | 0 (0.0%) | 33 (18.2%) |
| 18 to 34 Years | 9 (24.3%) | 0 (0.0%) |
| 35 to 64 Years | 31 (9.0%) | 13 (3.9%) |
| 65 to 74 Years | 25 (24.0%) | 12 (15.0%) |
| 75 Years and over | 8 (53.3%) | 0 (0.0%) |
Disability Class by Sex by Age in Stateburg
Disability Class: Hearing Difficulty
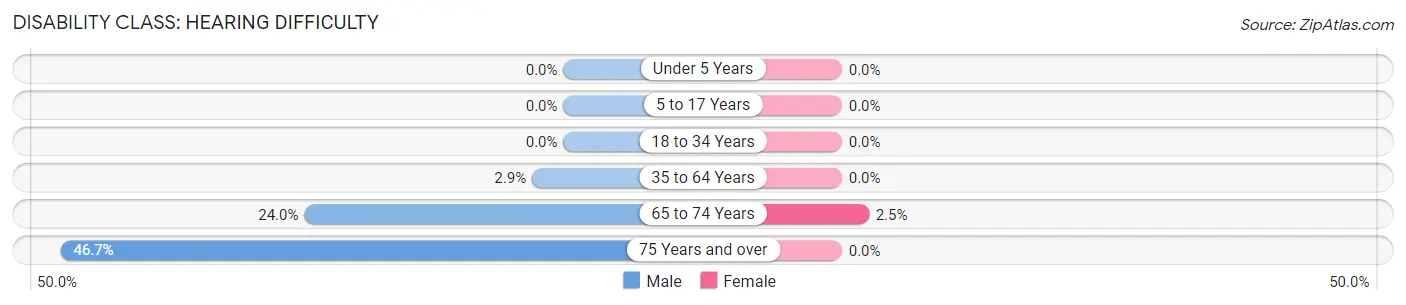
| Age Bracket | Male | Female |
| Under 5 Years | 0 (0.0%) | 0 (0.0%) |
| 5 to 17 Years | 0 (0.0%) | 0 (0.0%) |
| 18 to 34 Years | 0 (0.0%) | 0 (0.0%) |
| 35 to 64 Years | 10 (2.9%) | 0 (0.0%) |
| 65 to 74 Years | 25 (24.0%) | 2 (2.5%) |
| 75 Years and over | 7 (46.7%) | 0 (0.0%) |
Disability Class: Vision Difficulty
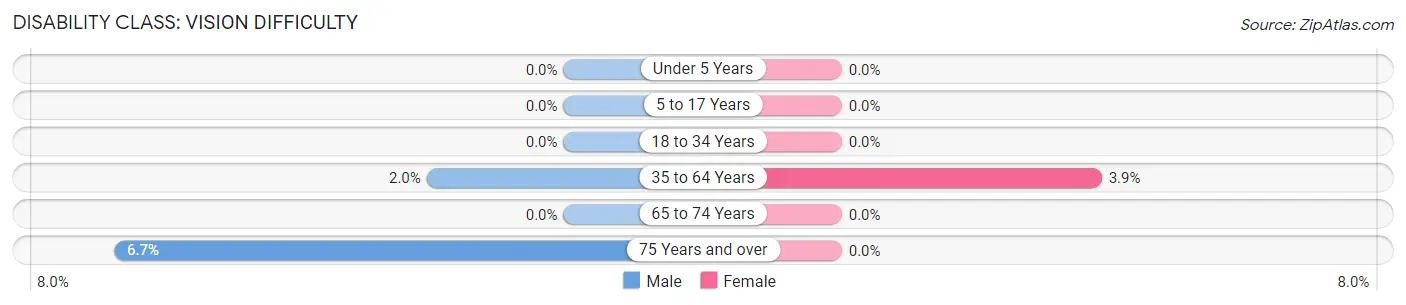
| Age Bracket | Male | Female |
| Under 5 Years | 0 (0.0%) | 0 (0.0%) |
| 5 to 17 Years | 0 (0.0%) | 0 (0.0%) |
| 18 to 34 Years | 0 (0.0%) | 0 (0.0%) |
| 35 to 64 Years | 7 (2.0%) | 13 (3.9%) |
| 65 to 74 Years | 0 (0.0%) | 0 (0.0%) |
| 75 Years and over | 1 (6.7%) | 0 (0.0%) |
Disability Class: Cognitive Difficulty
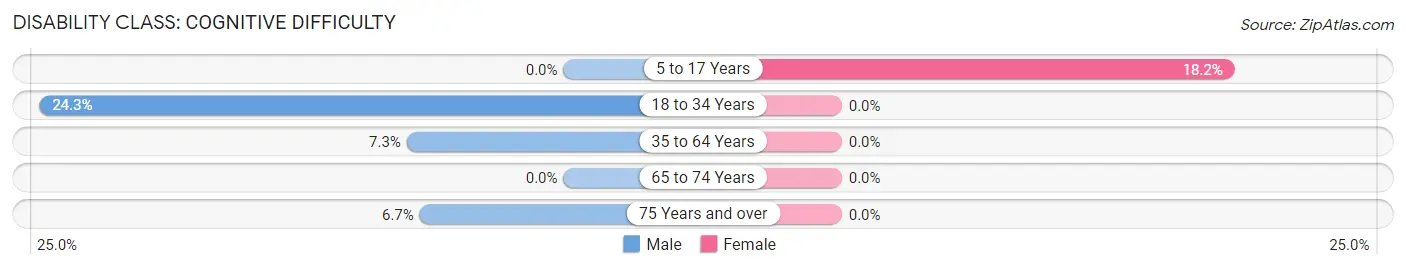
| Age Bracket | Male | Female |
| 5 to 17 Years | 0 (0.0%) | 33 (18.2%) |
| 18 to 34 Years | 9 (24.3%) | 0 (0.0%) |
| 35 to 64 Years | 25 (7.3%) | 0 (0.0%) |
| 65 to 74 Years | 0 (0.0%) | 0 (0.0%) |
| 75 Years and over | 1 (6.7%) | 0 (0.0%) |
Disability Class: Ambulatory Difficulty
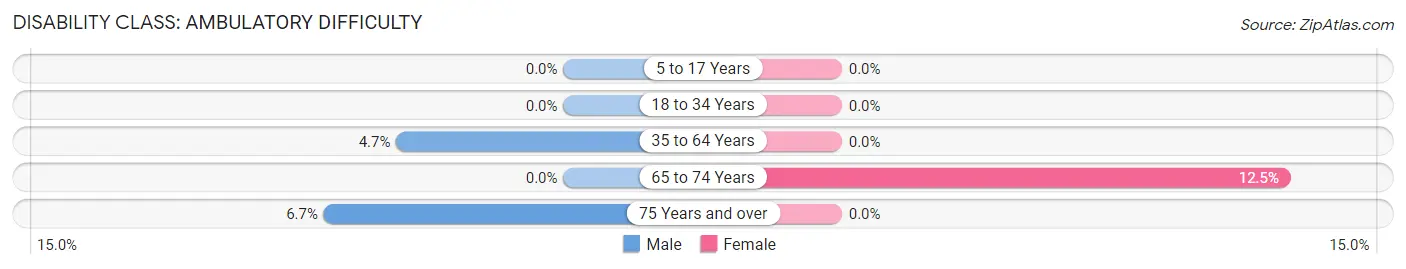
| Age Bracket | Male | Female |
| 5 to 17 Years | 0 (0.0%) | 0 (0.0%) |
| 18 to 34 Years | 0 (0.0%) | 0 (0.0%) |
| 35 to 64 Years | 16 (4.6%) | 0 (0.0%) |
| 65 to 74 Years | 0 (0.0%) | 10 (12.5%) |
| 75 Years and over | 1 (6.7%) | 0 (0.0%) |
Disability Class: Self-Care Difficulty
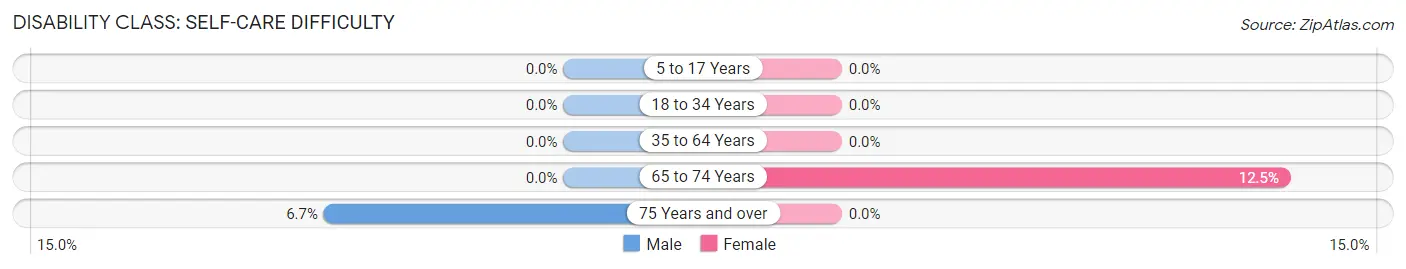
| Age Bracket | Male | Female |
| 5 to 17 Years | 0 (0.0%) | 0 (0.0%) |
| 18 to 34 Years | 0 (0.0%) | 0 (0.0%) |
| 35 to 64 Years | 0 (0.0%) | 0 (0.0%) |
| 65 to 74 Years | 0 (0.0%) | 10 (12.5%) |
| 75 Years and over | 1 (6.7%) | 0 (0.0%) |
Technology Access in Stateburg
Computing Device Access in Stateburg
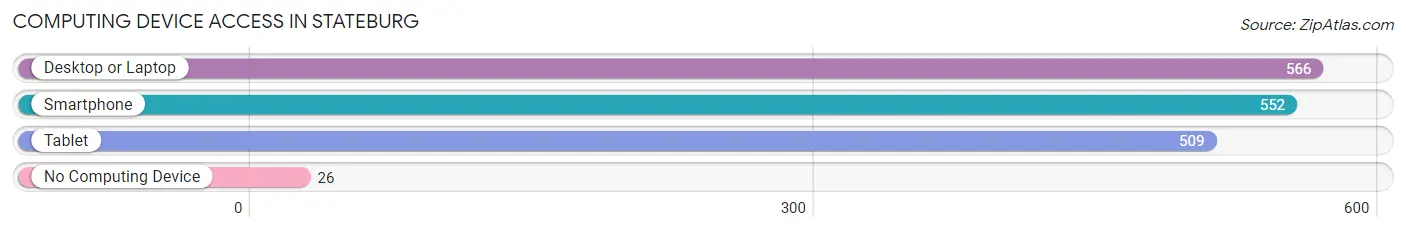
| Device Type | # Households | % Households |
| Desktop or Laptop | 566 | 93.4% |
| Smartphone | 552 | 91.1% |
| Tablet | 509 | 84.0% |
| No Computing Device | 26 | 4.3% |
| Total | 606 | 100.0% |
Internet Access in Stateburg
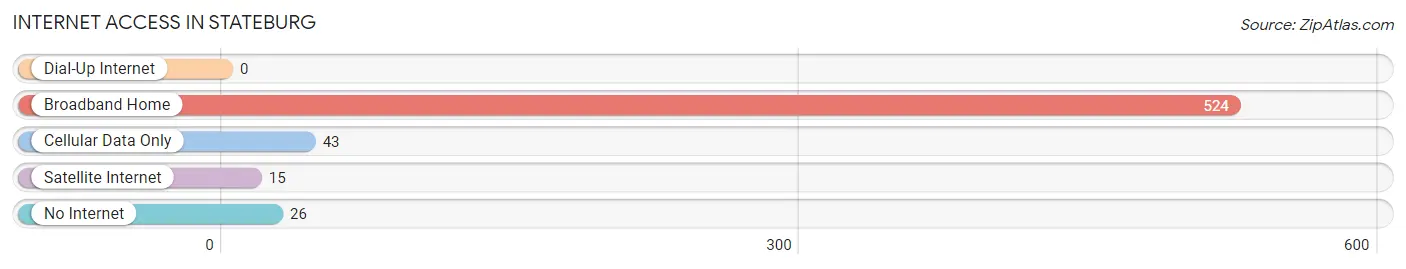
| Internet Type | # Households | % Households |
| Dial-Up Internet | 0 | 0.0% |
| Broadband Home | 524 | 86.5% |
| Cellular Data Only | 43 | 7.1% |
| Satellite Internet | 15 | 2.5% |
| No Internet | 26 | 4.3% |
| Total | 606 | 100.0% |
Stateburg Summary
Stateburg is a small town located in the central part of South Carolina, in the county of Sumter. It is situated on the banks of the Black River, about 25 miles from the state capital of Columbia. The town was founded in 1785 and is one of the oldest towns in the state. It is home to a population of approximately 1,500 people.
History
Stateburg was founded in 1785 by a group of settlers from Virginia. The town was named after the state of Virginia, and was the first town in the area to be incorporated. The town was originally a trading post, and was a major stop on the stagecoach route between Charleston and Columbia. During the Civil War, Stateburg was the site of several battles, including the Battle of Stateburg in 1865. After the war, the town was rebuilt and continued to grow.
Geography
Stateburg is located in the central part of South Carolina, in the county of Sumter. It is situated on the banks of the Black River, about 25 miles from the state capital of Columbia. The town is surrounded by rolling hills and forests, and is located in a rural area. The climate is humid subtropical, with hot summers and mild winters.
Economy
Stateburg’s economy is largely based on agriculture. The town is home to several farms, which produce a variety of crops, including corn, soybeans, cotton, and tobacco. The town also has a small manufacturing sector, which produces furniture, textiles, and other products. In addition, Stateburg is home to several small businesses, including restaurants, shops, and other services.
Demographics
As of the 2010 census, Stateburg had a population of 1,500 people. The racial makeup of the town was 79.2% White, 17.3% African American, 0.7% Native American, 0.7% Asian, and 2.1% from other races. The median household income was $31,250, and the median family income was $37,500. The per capita income was $15,000.
Stateburg is a small town with a rich history and a diverse population. It is a rural community with a strong agricultural base, and is home to a variety of businesses and services. The town is a great place to live, work, and raise a family.
Common Questions
What is Per Capita Income in Stateburg?
Per Capita income in Stateburg is $31,635.
What is the Median Family Income in Stateburg?
Median Family Income in Stateburg is $103,531.
What is the Median Household income in Stateburg?
Median Household Income in Stateburg is $68,935.
What is Income or Wage Gap in Stateburg?
Income or Wage Gap in Stateburg is 24.6%.
Women in Stateburg earn 75.4 cents for every dollar earned by a man.
What is Inequality or Gini Index in Stateburg?
Inequality or Gini Index in Stateburg is 0.37.
What is the Total Population of Stateburg?
Total Population of Stateburg is 1,739.
What is the Total Male Population of Stateburg?
Total Male Population of Stateburg is 843.
What is the Total Female Population of Stateburg?
Total Female Population of Stateburg is 896.
What is the Ratio of Males per 100 Females in Stateburg?
There are 94.08 Males per 100 Females in Stateburg.
What is the Ratio of Females per 100 Males in Stateburg?
There are 106.29 Females per 100 Males in Stateburg.
What is the Median Population Age in Stateburg?
Median Population Age in Stateburg is 39.7 Years.
What is the Average Family Size in Stateburg
Average Family Size in Stateburg is 3.4 People.
What is the Average Household Size in Stateburg
Average Household Size in Stateburg is 2.9 People.
How Large is the Labor Force in Stateburg?
There are 699 People in the Labor Forcein in Stateburg.
What is the Percentage of People in the Labor Force in Stateburg?
55.9% of People are in the Labor Force in Stateburg.
What is the Unemployment Rate in Stateburg?
Unemployment Rate in Stateburg is 4.8%.