Murphys Estates, SC Map & Demographics
Murphys Estates Map
Murphys Estates Overview
$27,518
PER CAPITA INCOME
$74,695
AVG FAMILY INCOME
$73,750
AVG HOUSEHOLD INCOME
0.42
INEQUALITY / GINI INDEX
1,477
TOTAL POPULATION
682
MALE POPULATION
795
FEMALE POPULATION
85.79
MALES / 100 FEMALES
116.57
FEMALES / 100 MALES
35.9
MEDIAN AGE
4.0
AVG FAMILY SIZE
3.3
AVG HOUSEHOLD SIZE
681
LABOR FORCE [ PEOPLE ]
64.6%
PERCENT IN LABOR FORCE
3.7%
UNEMPLOYMENT RATE
Income in Murphys Estates
Income Overview in Murphys Estates
Per Capita Income in Murphys Estates is $27,518, while median incomes of families and households are $74,695 and $73,750 respectively.
| Characteristic | Number | Measure |
| Per Capita Income | 1,477 | $27,518 |
| Median Family Income | 340 | $74,695 |
| Mean Family Income | 340 | $97,294 |
| Median Household Income | 445 | $73,750 |
| Mean Household Income | 445 | $91,366 |
| Income Deficit | 340 | $0 |
| Wage / Income Gap (%) | 1,477 | 0.00% |
| Wage / Income Gap ($) | 1,477 | 100.00¢ per $1 |
| Gini / Inequality Index | 1,477 | 0.42 |
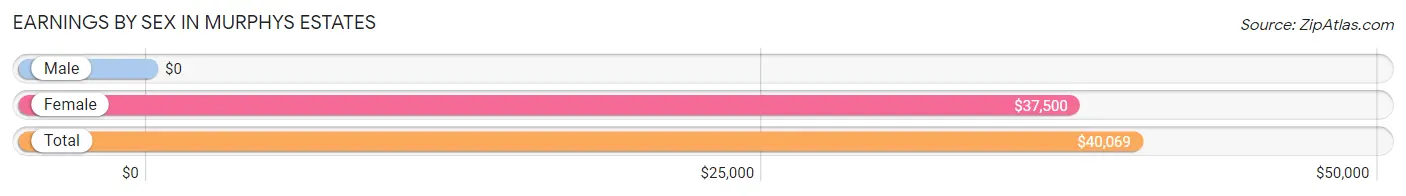
Earnings by Sex in Murphys Estates
| Sex | Number | Average Earnings |
| Male | 304 (42.3%) | $0 |
| Female | 414 (57.7%) | $37,500 |
| Total | 718 (100.0%) | $40,069 |
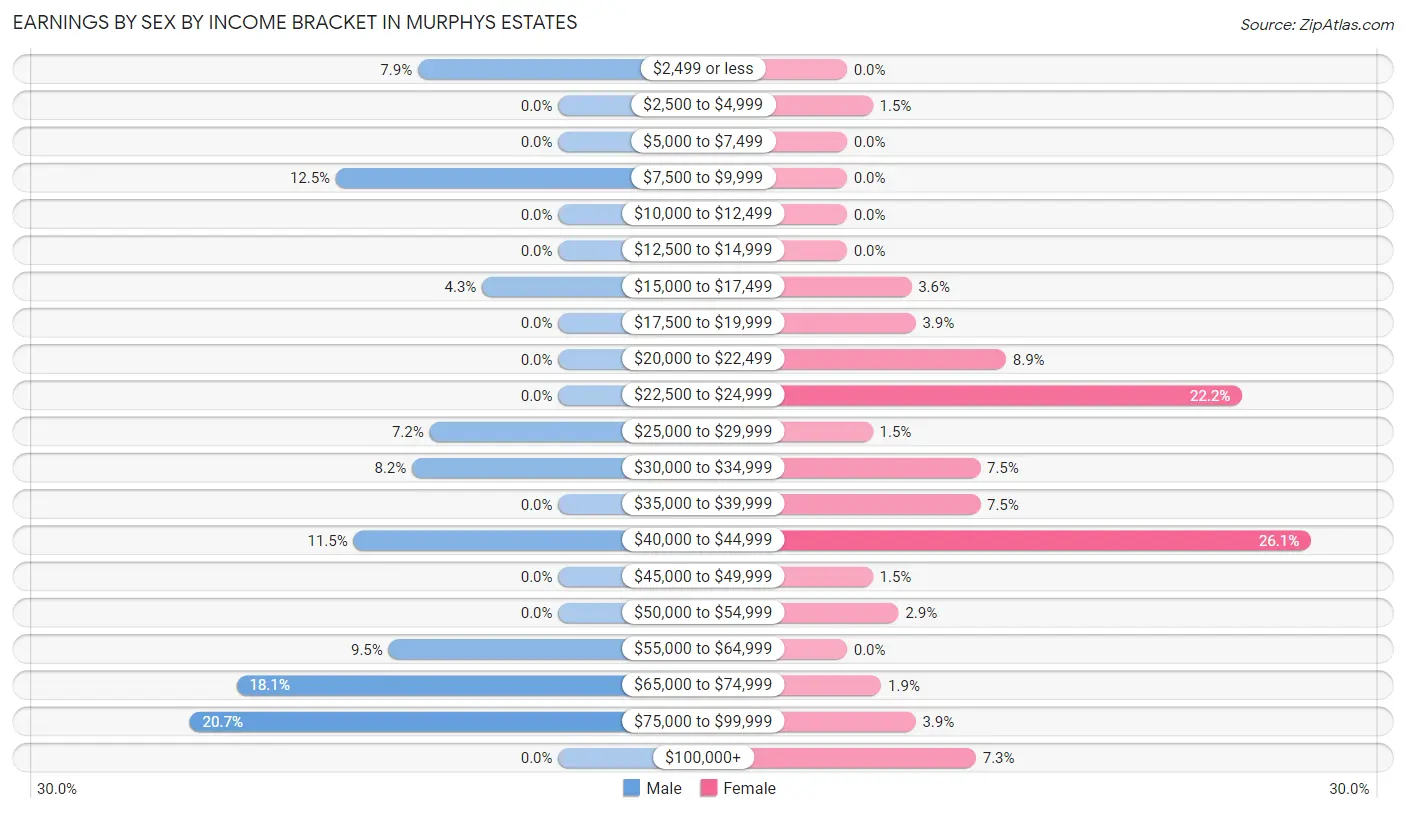
Earnings by Sex by Income Bracket in Murphys Estates
The most common earnings brackets in Murphys Estates are $75,000 to $99,999 for men (63 | 20.7%) and $40,000 to $44,999 for women (108 | 26.1%).
| Income | Male | Female |
| $2,499 or less | 24 (7.9%) | 0 (0.0%) |
| $2,500 to $4,999 | 0 (0.0%) | 6 (1.5%) |
| $5,000 to $7,499 | 0 (0.0%) | 0 (0.0%) |
| $7,500 to $9,999 | 38 (12.5%) | 0 (0.0%) |
| $10,000 to $12,499 | 0 (0.0%) | 0 (0.0%) |
| $12,500 to $14,999 | 0 (0.0%) | 0 (0.0%) |
| $15,000 to $17,499 | 13 (4.3%) | 15 (3.6%) |
| $17,500 to $19,999 | 0 (0.0%) | 16 (3.9%) |
| $20,000 to $22,499 | 0 (0.0%) | 37 (8.9%) |
| $22,500 to $24,999 | 0 (0.0%) | 92 (22.2%) |
| $25,000 to $29,999 | 22 (7.2%) | 6 (1.5%) |
| $30,000 to $34,999 | 25 (8.2%) | 31 (7.5%) |
| $35,000 to $39,999 | 0 (0.0%) | 31 (7.5%) |
| $40,000 to $44,999 | 35 (11.5%) | 108 (26.1%) |
| $45,000 to $49,999 | 0 (0.0%) | 6 (1.5%) |
| $50,000 to $54,999 | 0 (0.0%) | 12 (2.9%) |
| $55,000 to $64,999 | 29 (9.5%) | 0 (0.0%) |
| $65,000 to $74,999 | 55 (18.1%) | 8 (1.9%) |
| $75,000 to $99,999 | 63 (20.7%) | 16 (3.9%) |
| $100,000+ | 0 (0.0%) | 30 (7.2%) |
| Total | 304 (100.0%) | 414 (100.0%) |
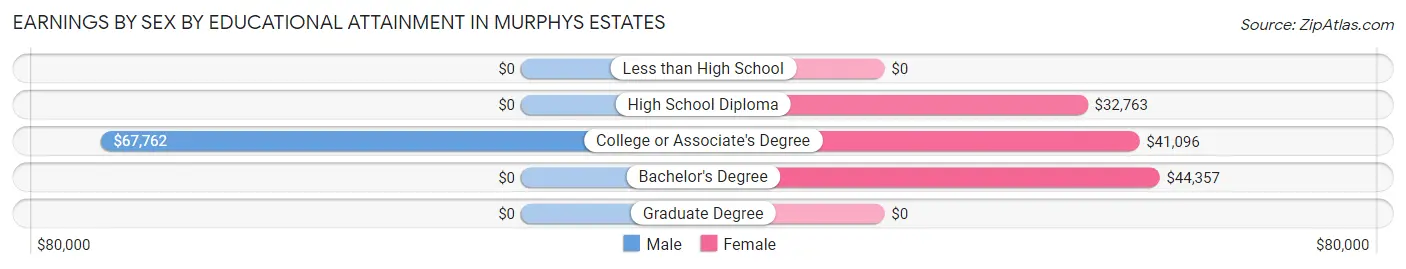
Earnings by Sex by Educational Attainment in Murphys Estates
| Educational Attainment | Male Income | Female Income |
| Less than High School | - | - |
| High School Diploma | - | - |
| College or Associate's Degree | $67,762 | $41,096 |
| Bachelor's Degree | - | - |
| Graduate Degree | - | - |
| Total | - | - |
Family Income in Murphys Estates
Family Income Brackets in Murphys Estates
According to the Murphys Estates family income data, there are 95 families falling into the $50,000 to $74,999 income range, which is the most common income bracket and makes up 27.9% of all families.
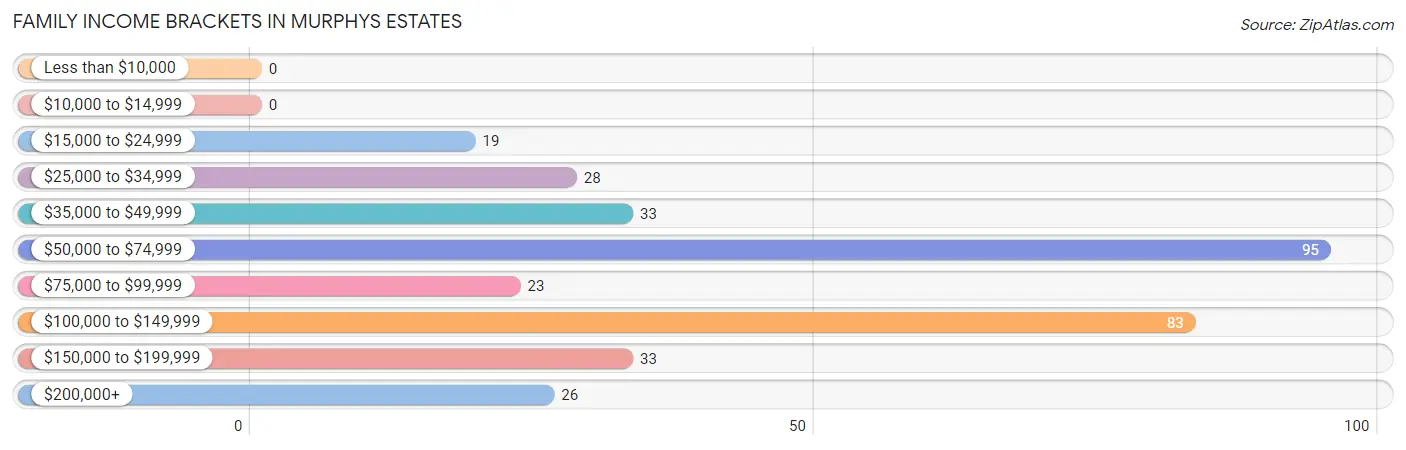
| Income Bracket | # Families | % Families |
| Less than $10,000 | 0 | 0.0% |
| $10,000 to $14,999 | 0 | 0.0% |
| $15,000 to $24,999 | 19 | 5.6% |
| $25,000 to $34,999 | 28 | 8.2% |
| $35,000 to $49,999 | 33 | 9.7% |
| $50,000 to $74,999 | 95 | 27.9% |
| $75,000 to $99,999 | 23 | 6.8% |
| $100,000 to $149,999 | 83 | 24.4% |
| $150,000 to $199,999 | 33 | 9.7% |
| $200,000+ | 26 | 7.6% |
Family Income by Famaliy Size in Murphys Estates
2-person families (141 | 41.5%) account for the highest median family income in Murphys Estates with $80,368 per family, while 2-person families (141 | 41.5%) have the highest median income of $40,184 per family member.
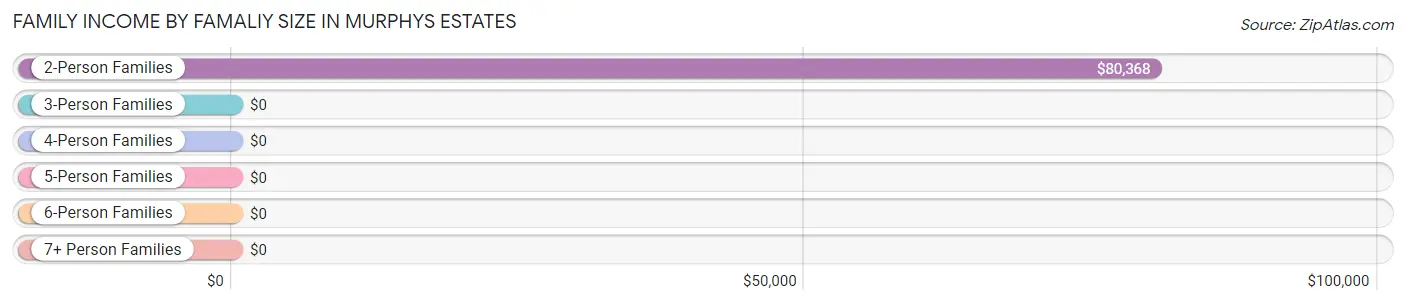
| Income Bracket | # Families | Median Income |
| 2-Person Families | 141 (41.5%) | $80,368 |
| 3-Person Families | 44 (12.9%) | $0 |
| 4-Person Families | 73 (21.5%) | $0 |
| 5-Person Families | 0 (0.0%) | $0 |
| 6-Person Families | 47 (13.8%) | $0 |
| 7+ Person Families | 35 (10.3%) | $0 |
| Total | 340 (100.0%) | $74,695 |
Family Income by Number of Earners in Murphys Estates
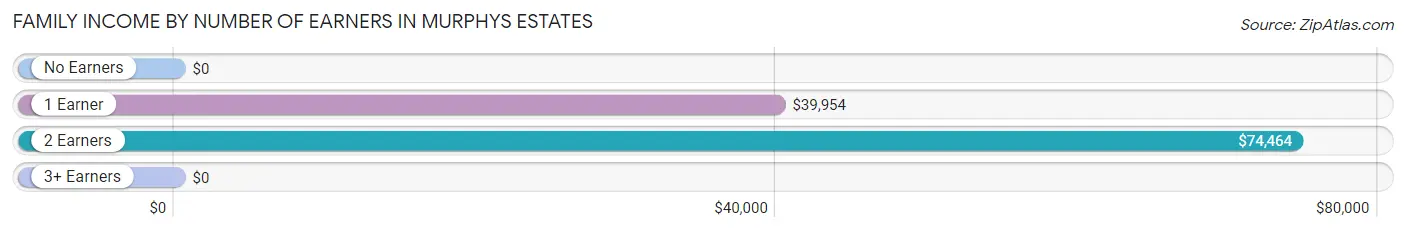
| Number of Earners | # Families | Median Income |
| No Earners | 36 (10.6%) | $0 |
| 1 Earner | 125 (36.8%) | $39,954 |
| 2 Earners | 97 (28.5%) | $74,464 |
| 3+ Earners | 82 (24.1%) | $0 |
| Total | 340 (100.0%) | $74,695 |
Household Income in Murphys Estates
Household Income Brackets in Murphys Estates
With 87 households falling in the category, the $50,000 to $74,999 income range is the most frequent in Murphys Estates, accounting for 19.6% of all households.
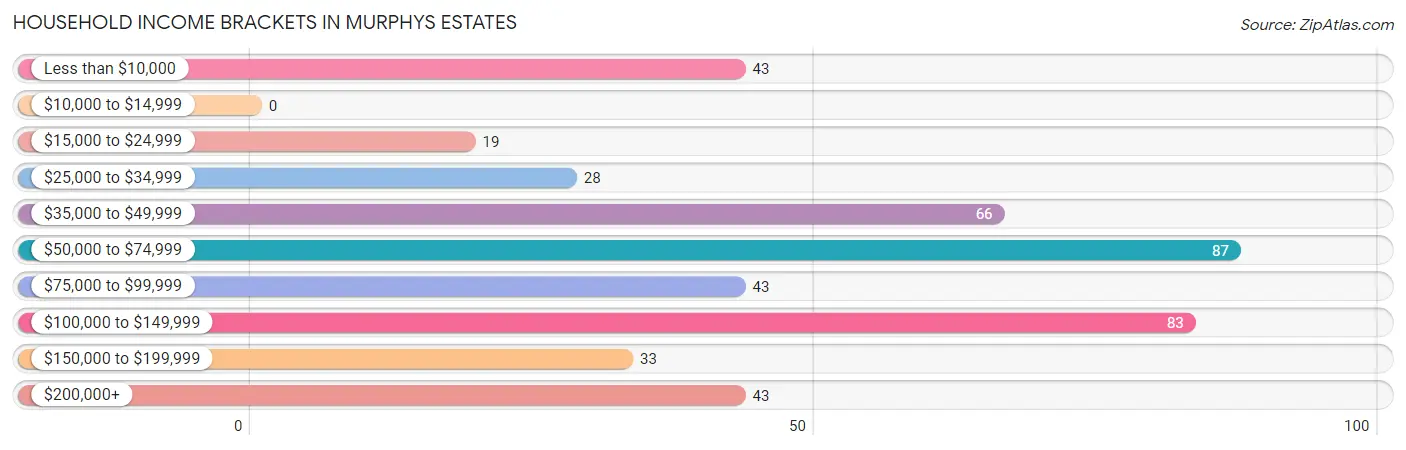
| Income Bracket | # Households | % Households |
| Less than $10,000 | 43 | 9.7% |
| $10,000 to $14,999 | 0 | 0.0% |
| $15,000 to $24,999 | 19 | 4.3% |
| $25,000 to $34,999 | 28 | 6.3% |
| $35,000 to $49,999 | 66 | 14.8% |
| $50,000 to $74,999 | 87 | 19.6% |
| $75,000 to $99,999 | 43 | 9.7% |
| $100,000 to $149,999 | 83 | 18.7% |
| $150,000 to $199,999 | 33 | 7.4% |
| $200,000+ | 43 | 9.7% |
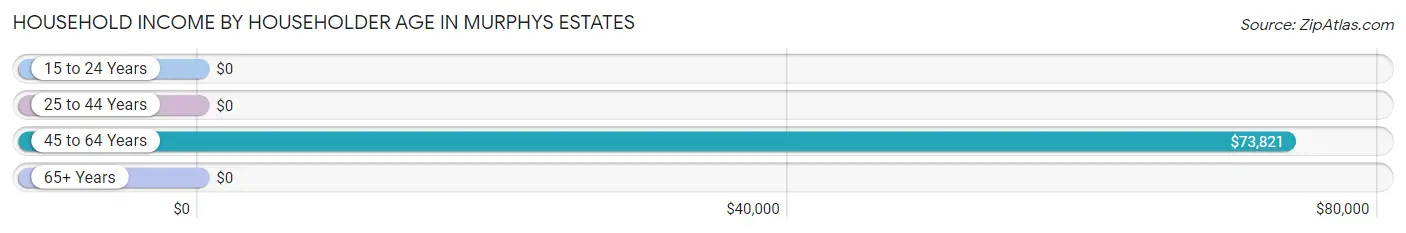
Household Income by Householder Age in Murphys Estates
The median household income in Murphys Estates is $73,750, with the highest median household income of $73,821 found in the 45 to 64 years age bracket for the primary householder. A total of 261 households (58.7%) fall into this category. Meanwhile, the 15 to 24 years age bracket for the primary householder has the lowest median household income of $0, with 20 households (4.5%) in this group.
| Income Bracket | # Households | Median Income |
| 15 to 24 Years | 20 (4.5%) | $0 |
| 25 to 44 Years | 79 (17.7%) | $0 |
| 45 to 64 Years | 261 (58.7%) | $73,821 |
| 65+ Years | 85 (19.1%) | $0 |
| Total | 445 (100.0%) | $73,750 |
Poverty in Murphys Estates
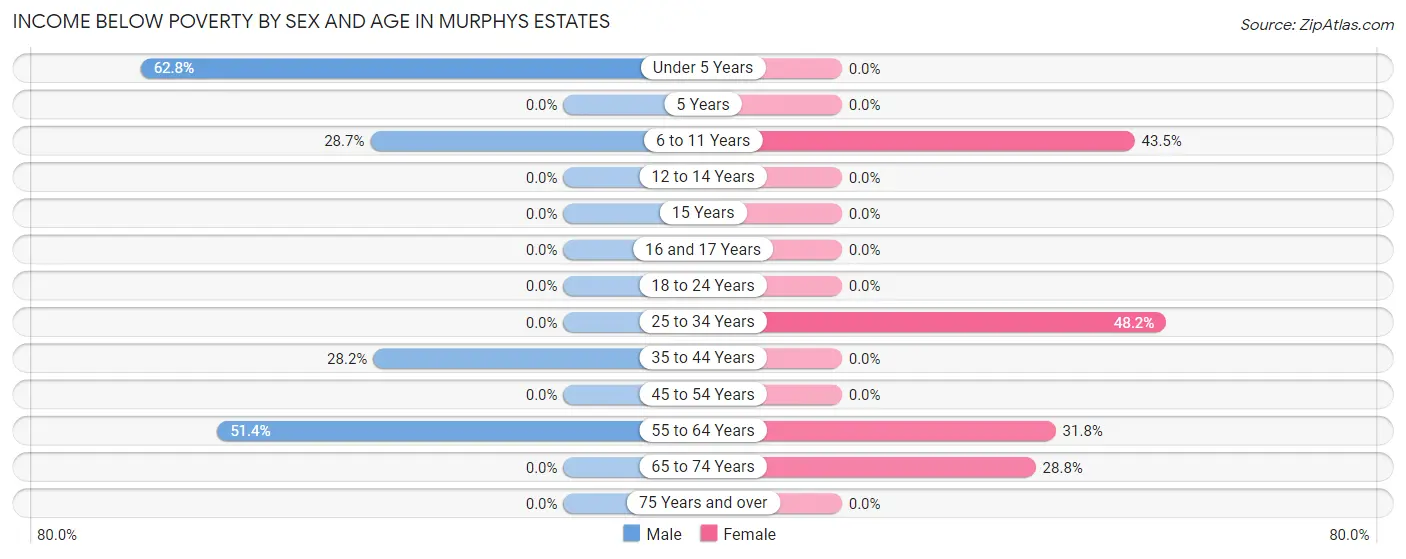
Income Below Poverty by Sex and Age in Murphys Estates
With 19.4% poverty level for males and 15.7% for females among the residents of Murphys Estates, under 5 year old males and 25 to 34 year old females are the most vulnerable to poverty, with 32 males (62.7%) and 39 females (48.1%) in their respective age groups living below the poverty level.
| Age Bracket | Male | Female |
| Under 5 Years | 32 (62.7%) | 0 (0.0%) |
| 5 Years | 0 (0.0%) | 0 (0.0%) |
| 6 to 11 Years | 39 (28.7%) | 40 (43.5%) |
| 12 to 14 Years | 0 (0.0%) | 0 (0.0%) |
| 15 Years | 0 (0.0%) | 0 (0.0%) |
| 16 and 17 Years | 0 (0.0%) | 0 (0.0%) |
| 18 to 24 Years | 0 (0.0%) | 0 (0.0%) |
| 25 to 34 Years | 0 (0.0%) | 39 (48.1%) |
| 35 to 44 Years | 24 (28.2%) | 0 (0.0%) |
| 45 to 54 Years | 0 (0.0%) | 0 (0.0%) |
| 55 to 64 Years | 37 (51.4%) | 27 (31.8%) |
| 65 to 74 Years | 0 (0.0%) | 19 (28.8%) |
| 75 Years and over | 0 (0.0%) | 0 (0.0%) |
| Total | 132 (19.4%) | 125 (15.7%) |
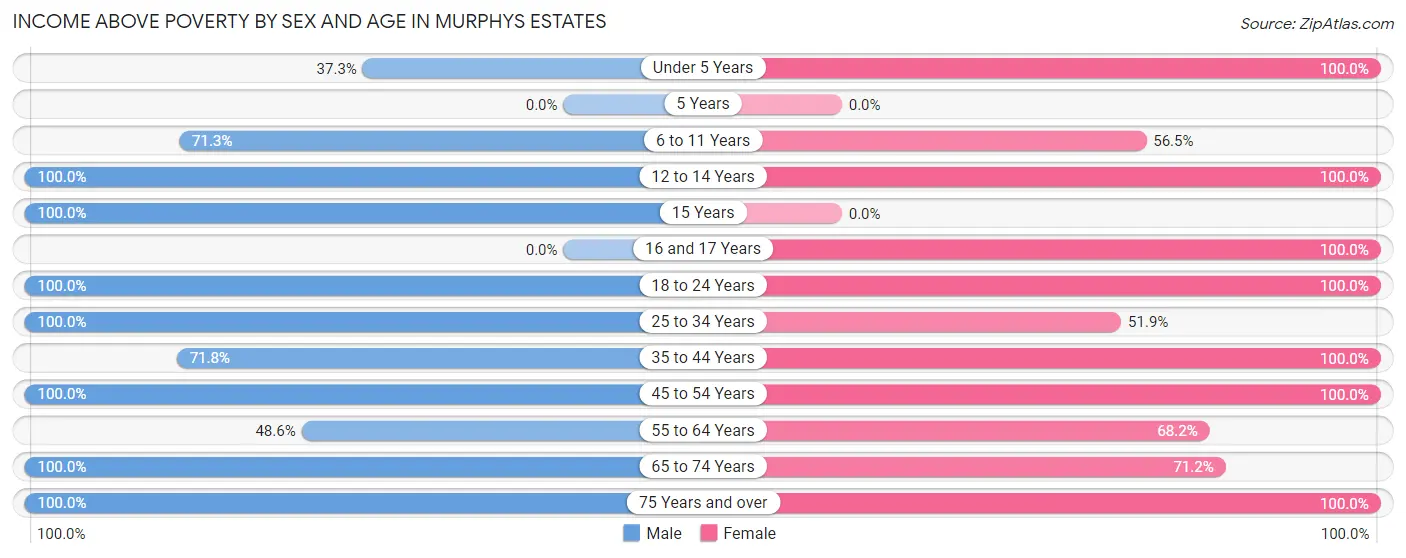
Income Above Poverty by Sex and Age in Murphys Estates
According to the poverty statistics in Murphys Estates, males aged 12 to 14 years and females aged under 5 years are the age groups that are most secure financially, with 100.0% of males and 100.0% of females in these age groups living above the poverty line.
| Age Bracket | Male | Female |
| Under 5 Years | 19 (37.2%) | 11 (100.0%) |
| 5 Years | 0 (0.0%) | 0 (0.0%) |
| 6 to 11 Years | 97 (71.3%) | 52 (56.5%) |
| 12 to 14 Years | 75 (100.0%) | 29 (100.0%) |
| 15 Years | 29 (100.0%) | 0 (0.0%) |
| 16 and 17 Years | 0 (0.0%) | 11 (100.0%) |
| 18 to 24 Years | 48 (100.0%) | 104 (100.0%) |
| 25 to 34 Years | 30 (100.0%) | 42 (51.8%) |
| 35 to 44 Years | 61 (71.8%) | 100 (100.0%) |
| 45 to 54 Years | 125 (100.0%) | 152 (100.0%) |
| 55 to 64 Years | 35 (48.6%) | 58 (68.2%) |
| 65 to 74 Years | 6 (100.0%) | 47 (71.2%) |
| 75 Years and over | 25 (100.0%) | 64 (100.0%) |
| Total | 550 (80.6%) | 670 (84.3%) |
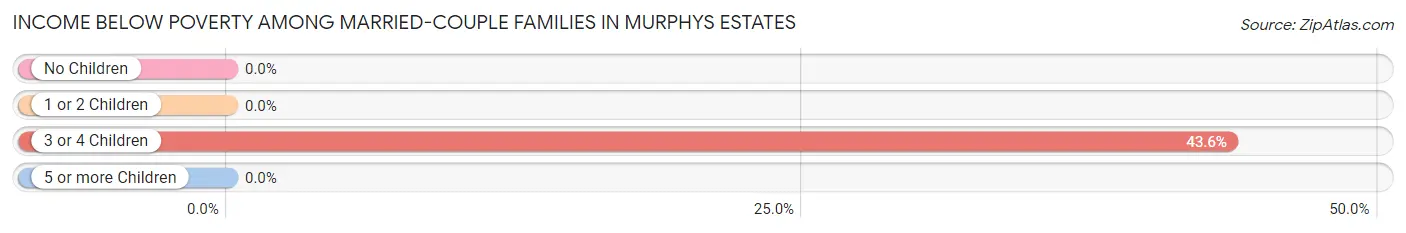
Income Below Poverty Among Married-Couple Families in Murphys Estates
The poverty statistics for married-couple families in Murphys Estates show that 11.3% or 27 of the total 238 families live below the poverty line. Families with 3 or 4 children have the highest poverty rate of 43.5%, comprising of 27 families. On the other hand, families with no children have the lowest poverty rate of 0.0%, which includes 0 families.
| Children | Above Poverty | Below Poverty |
| No Children | 62 (100.0%) | 0 (0.0%) |
| 1 or 2 Children | 114 (100.0%) | 0 (0.0%) |
| 3 or 4 Children | 35 (56.5%) | 27 (43.5%) |
| 5 or more Children | 0 (0.0%) | 0 (0.0%) |
| Total | 211 (88.7%) | 27 (11.3%) |
Income Below Poverty Among Single-Parent Households in Murphys Estates
| Children | Single Father | Single Mother |
| No Children | 0 (0.0%) | 0 (0.0%) |
| 1 or 2 Children | 0 (0.0%) | 0 (0.0%) |
| 3 or 4 Children | 0 (0.0%) | 0 (0.0%) |
| 5 or more Children | 0 (0.0%) | 0 (0.0%) |
| Total | 0 (0.0%) | 0 (0.0%) |
Income Below Poverty Among Married-Couple vs Single-Parent Households in Murphys Estates
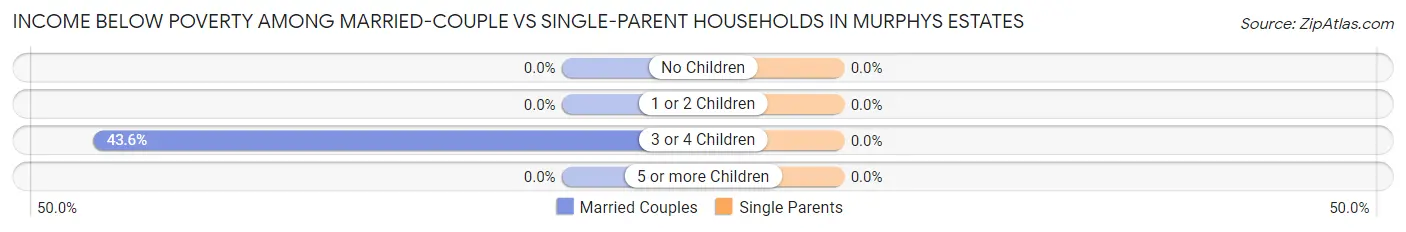
| Children | Married-Couple Families | Single-Parent Households |
| No Children | 0 (0.0%) | 0 (0.0%) |
| 1 or 2 Children | 0 (0.0%) | 0 (0.0%) |
| 3 or 4 Children | 27 (43.5%) | 0 (0.0%) |
| 5 or more Children | 0 (0.0%) | 0 (0.0%) |
| Total | 27 (11.3%) | 0 (0.0%) |
Race in Murphys Estates
The most populous races in Murphys Estates are White / Caucasian (1,163 | 78.7%), Black / African American (274 | 18.5%), and Two or more Races (40 | 2.7%).
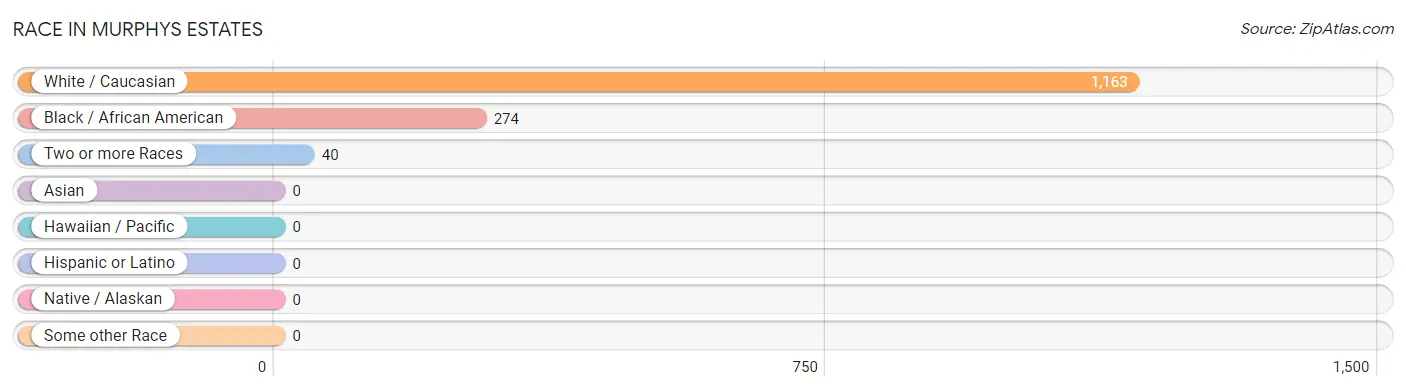
| Race | # Population | % Population |
| Asian | 0 | 0.0% |
| Black / African American | 274 | 18.5% |
| Hawaiian / Pacific | 0 | 0.0% |
| Hispanic or Latino | 0 | 0.0% |
| Native / Alaskan | 0 | 0.0% |
| White / Caucasian | 1,163 | 78.7% |
| Two or more Races | 40 | 2.7% |
| Some other Race | 0 | 0.0% |
| Total | 1,477 | 100.0% |
Ancestry in Murphys Estates
The most populous ancestries reported in Murphys Estates are American (342 | 23.2%), English (103 | 7.0%), Irish (88 | 6.0%), German (75 | 5.1%), and Italian (43 | 2.9%), together accounting for 44.1% of all Murphys Estates residents.
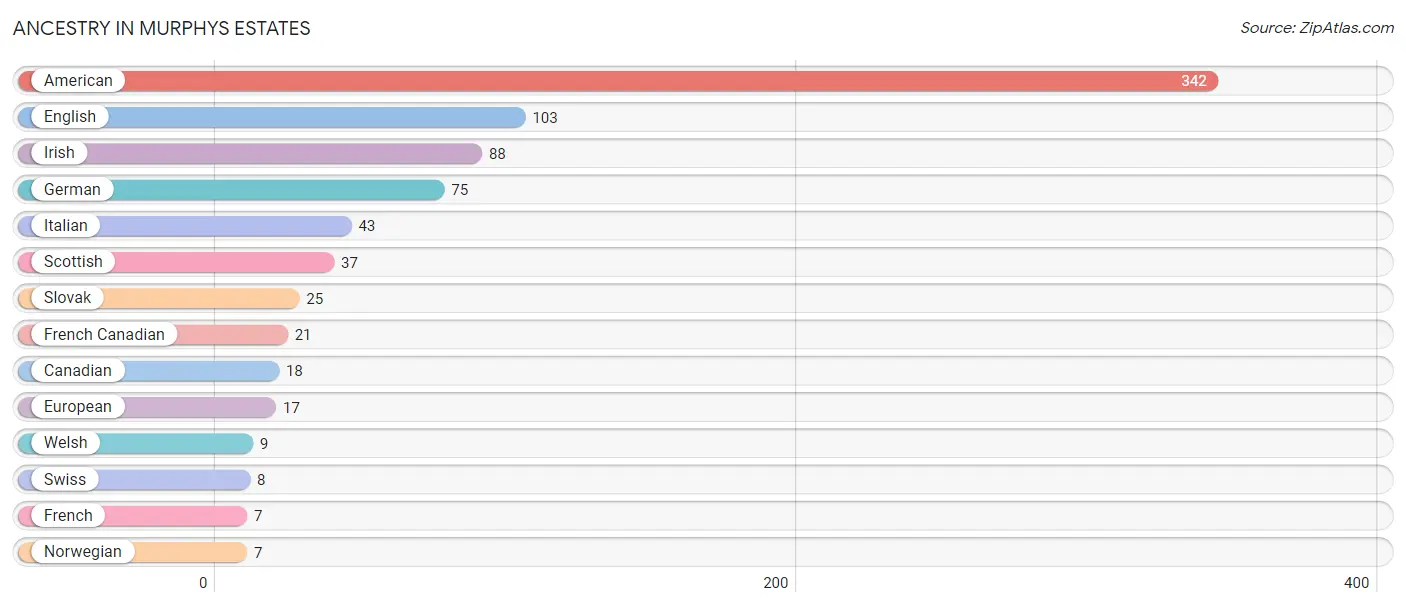
| Ancestry | # Population | % Population |
| American | 342 | 23.2% |
| Canadian | 18 | 1.2% |
| English | 103 | 7.0% |
| European | 17 | 1.1% |
| French | 7 | 0.5% |
| French Canadian | 21 | 1.4% |
| German | 75 | 5.1% |
| Irish | 88 | 6.0% |
| Italian | 43 | 2.9% |
| Norwegian | 7 | 0.5% |
| Scottish | 37 | 2.5% |
| Slovak | 25 | 1.7% |
| Swiss | 8 | 0.5% |
| Welsh | 9 | 0.6% | View All 14 Rows |
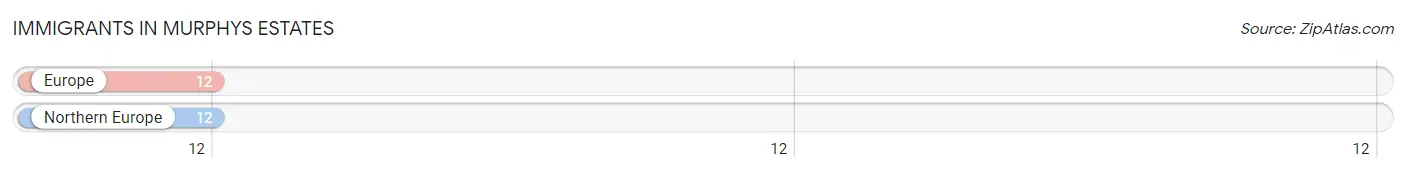
Immigrants in Murphys Estates
The most numerous immigrant groups reported in Murphys Estates came from Europe (12 | 0.8%), and Northern Europe (12 | 0.8%), together accounting for 1.6% of all Murphys Estates residents.
| Immigration Origin | # Population | % Population |
| Europe | 12 | 0.8% |
| Northern Europe | 12 | 0.8% | View All 2 Rows |
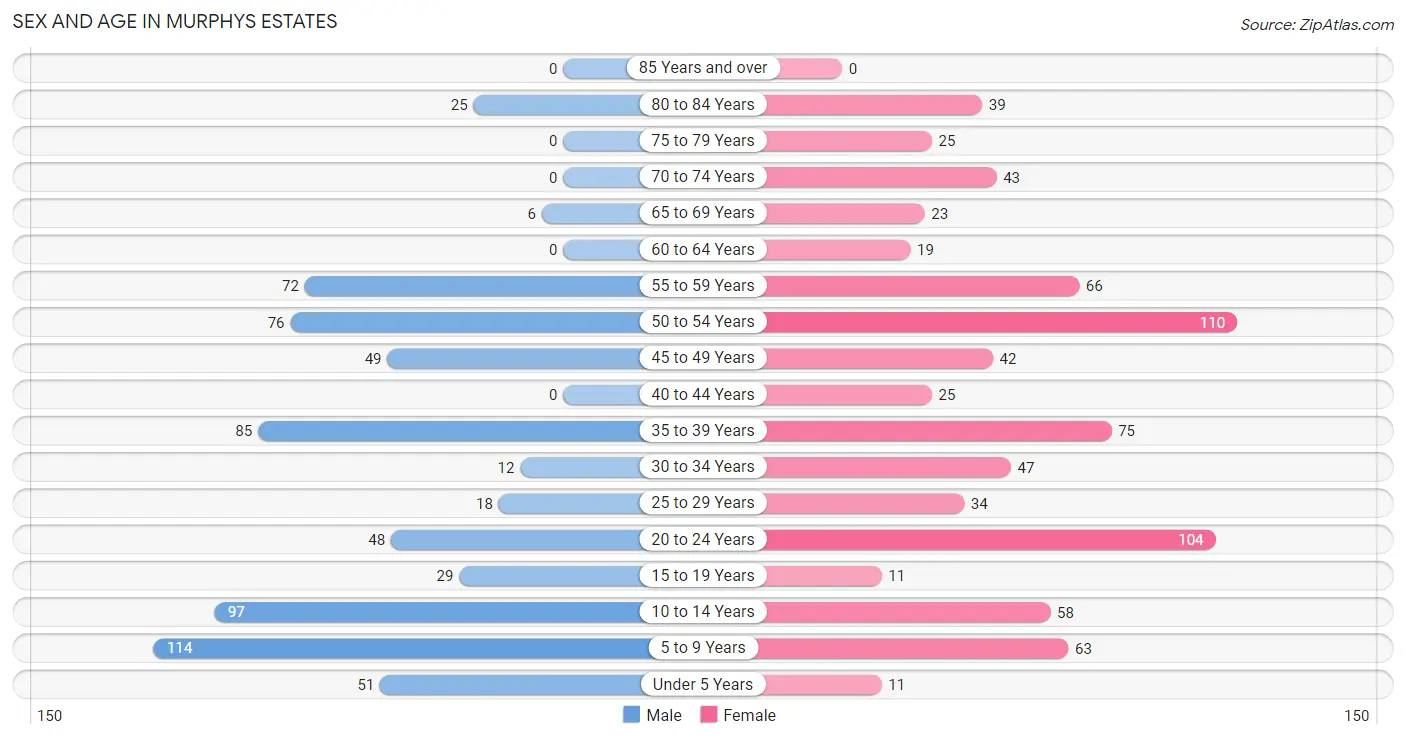
Sex and Age in Murphys Estates
Sex and Age in Murphys Estates
The most populous age groups in Murphys Estates are 5 to 9 Years (114 | 16.7%) for men and 50 to 54 Years (110 | 13.8%) for women.
| Age Bracket | Male | Female |
| Under 5 Years | 51 (7.5%) | 11 (1.4%) |
| 5 to 9 Years | 114 (16.7%) | 63 (7.9%) |
| 10 to 14 Years | 97 (14.2%) | 58 (7.3%) |
| 15 to 19 Years | 29 (4.3%) | 11 (1.4%) |
| 20 to 24 Years | 48 (7.0%) | 104 (13.1%) |
| 25 to 29 Years | 18 (2.6%) | 34 (4.3%) |
| 30 to 34 Years | 12 (1.8%) | 47 (5.9%) |
| 35 to 39 Years | 85 (12.5%) | 75 (9.4%) |
| 40 to 44 Years | 0 (0.0%) | 25 (3.1%) |
| 45 to 49 Years | 49 (7.2%) | 42 (5.3%) |
| 50 to 54 Years | 76 (11.1%) | 110 (13.8%) |
| 55 to 59 Years | 72 (10.6%) | 66 (8.3%) |
| 60 to 64 Years | 0 (0.0%) | 19 (2.4%) |
| 65 to 69 Years | 6 (0.9%) | 23 (2.9%) |
| 70 to 74 Years | 0 (0.0%) | 43 (5.4%) |
| 75 to 79 Years | 0 (0.0%) | 25 (3.1%) |
| 80 to 84 Years | 25 (3.7%) | 39 (4.9%) |
| 85 Years and over | 0 (0.0%) | 0 (0.0%) |
| Total | 682 (100.0%) | 795 (100.0%) |
Families and Households in Murphys Estates
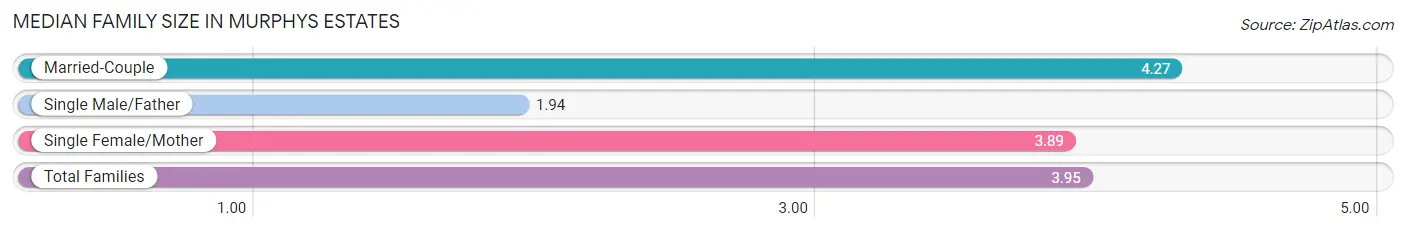
Median Family Size in Murphys Estates
The median family size in Murphys Estates is 3.95 persons per family, with married-couple families (238 | 70.0%) accounting for the largest median family size of 4.27 persons per family. On the other hand, single male/father families (36 | 10.6%) represent the smallest median family size with 1.94 persons per family.
| Family Type | # Families | Family Size |
| Married-Couple | 238 (70.0%) | 4.27 |
| Single Male/Father | 36 (10.6%) | 1.94 |
| Single Female/Mother | 66 (19.4%) | 3.89 |
| Total Families | 340 (100.0%) | 3.95 |
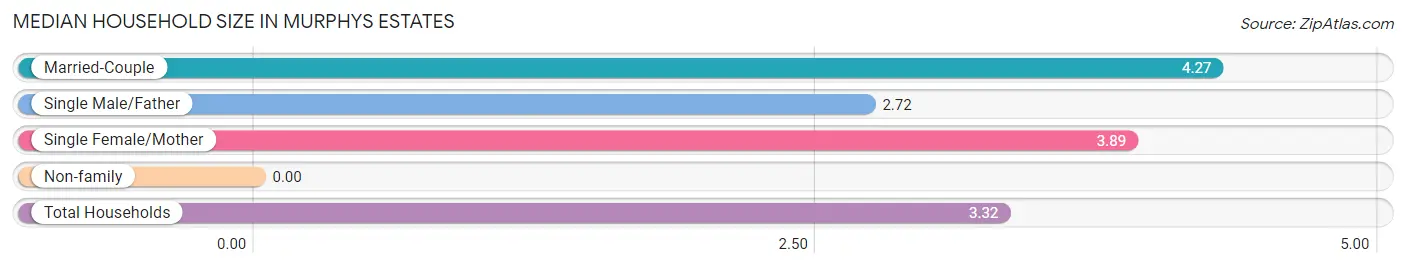
Median Household Size in Murphys Estates
| Household Type | # Households | Household Size |
| Married-Couple | 238 (53.5%) | 4.27 |
| Single Male/Father | 36 (8.1%) | 2.72 |
| Single Female/Mother | 66 (14.8%) | 3.89 |
| Non-family | 105 (23.6%) | - |
| Total Households | 445 (100.0%) | 3.32 |
Household Size by Marriage Status in Murphys Estates
Out of a total of 445 households in Murphys Estates, 340 (76.4%) are family households, while 105 (23.6%) are nonfamily households. The most numerous type of family households are 2-person households, comprising 116, and the most common type of nonfamily households are 1-person households, comprising 105.
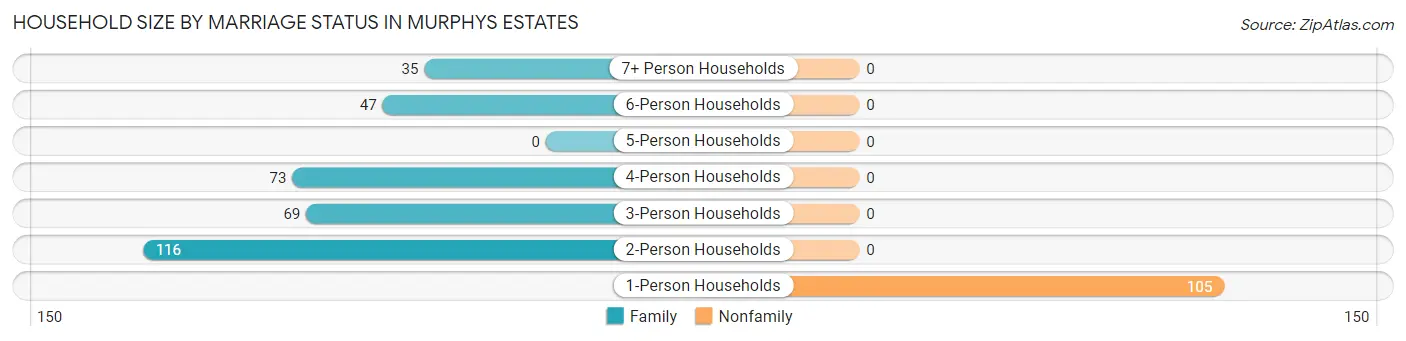
| Household Size | Family Households | Nonfamily Households |
| 1-Person Households | - | 105 (23.6%) |
| 2-Person Households | 116 (26.1%) | 0 (0.0%) |
| 3-Person Households | 69 (15.5%) | 0 (0.0%) |
| 4-Person Households | 73 (16.4%) | 0 (0.0%) |
| 5-Person Households | 0 (0.0%) | 0 (0.0%) |
| 6-Person Households | 47 (10.6%) | 0 (0.0%) |
| 7+ Person Households | 35 (7.9%) | 0 (0.0%) |
| Total | 340 (76.4%) | 105 (23.6%) |
Female Fertility in Murphys Estates
Fertility by Age in Murphys Estates
Average fertility rate in Murphys Estates is 100.0 births per 1,000 women. Women in the age bracket of 35 to 50 years have the highest fertility rate with 121.0 births per 1,000 women. Women in the age bracket of 35 to 50 years acount for 63.4% of all women with births.
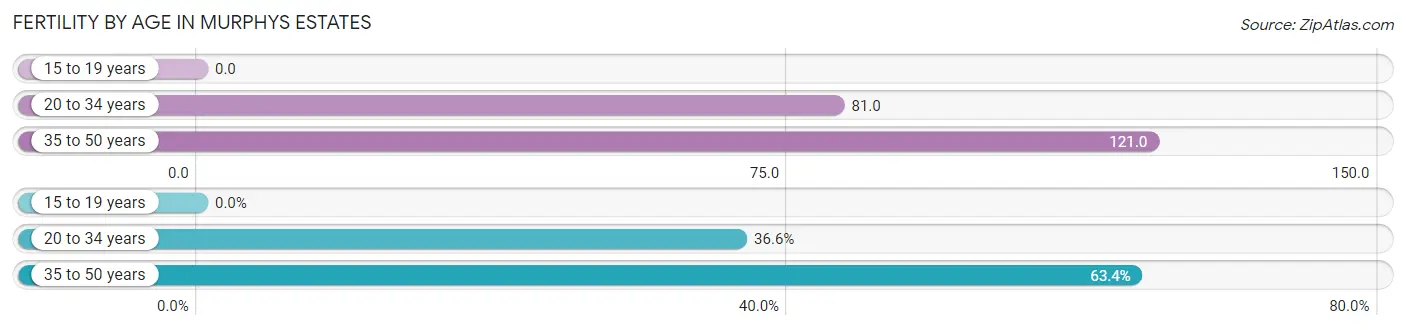
| Age Bracket | Women with Births | Births / 1,000 Women |
| 15 to 19 years | 0 (0.0%) | 0.0 |
| 20 to 34 years | 15 (36.6%) | 81.0 |
| 35 to 50 years | 26 (63.4%) | 121.0 |
| Total | 41 (100.0%) | 100.0 |
Fertility by Age by Marriage Status in Murphys Estates
63.4% of women with births (41) in Murphys Estates are married. The highest percentage of unmarried women with births falls into 20 to 34 years age bracket with 100.0% of them unmarried at the time of birth, while the lowest percentage of unmarried women with births belong to 35 to 50 years age bracket with 0.0% of them unmarried.
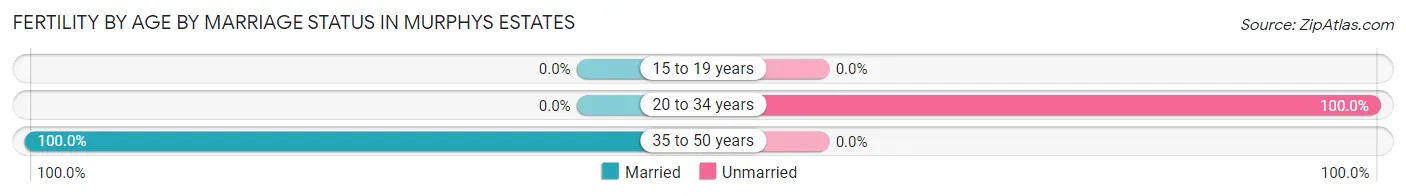
| Age Bracket | Married | Unmarried |
| 15 to 19 years | 0 (0.0%) | 0 (0.0%) |
| 20 to 34 years | 0 (0.0%) | 15 (100.0%) |
| 35 to 50 years | 26 (100.0%) | 0 (0.0%) |
| Total | 26 (63.4%) | 15 (36.6%) |
Fertility by Education in Murphys Estates
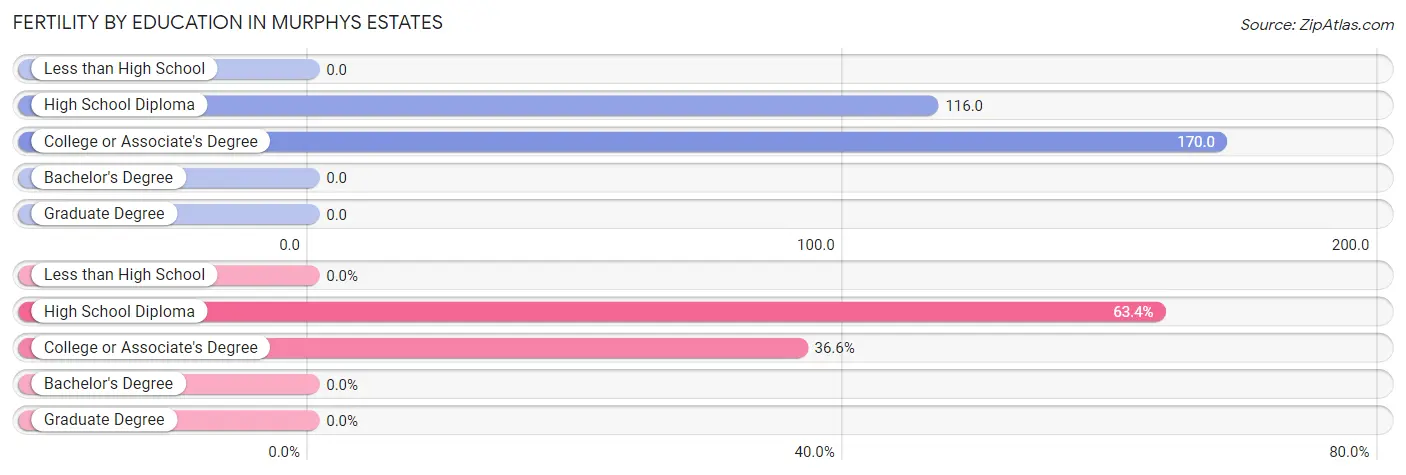
| Educational Attainment | Women with Births | Births / 1,000 Women |
| Less than High School | 0 (0.0%) | 0.0 |
| High School Diploma | 26 (63.4%) | 116.0 |
| College or Associate's Degree | 15 (36.6%) | 170.0 |
| Bachelor's Degree | 0 (0.0%) | 0.0 |
| Graduate Degree | 0 (0.0%) | 0.0 |
| Total | 41 (100.0%) | 100.0 |
Fertility by Education by Marriage Status in Murphys Estates
36.6% of women with births in Murphys Estates are unmarried. Women with the educational attainment of high school diploma are most likely to be married with 100.0% of them married at childbirth, while women with the educational attainment of college or associate's degree are least likely to be married with 100.0% of them unmarried at childbirth.
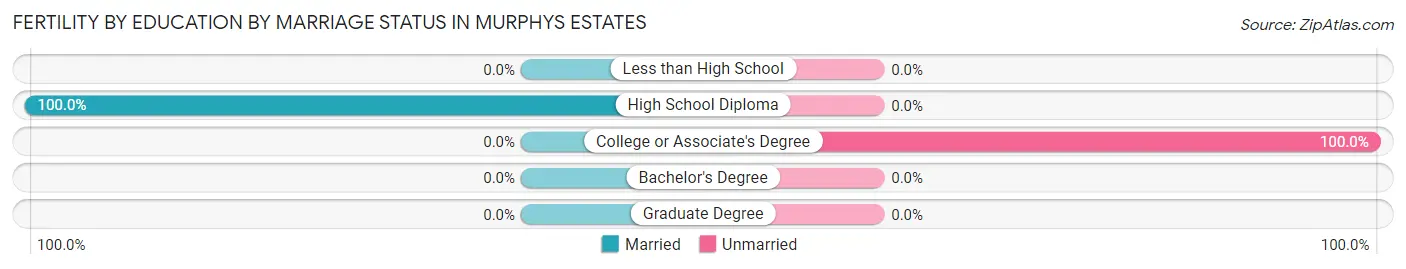
| Educational Attainment | Married | Unmarried |
| Less than High School | 0 (0.0%) | 0 (0.0%) |
| High School Diploma | 26 (100.0%) | 0 (0.0%) |
| College or Associate's Degree | 0 (0.0%) | 15 (100.0%) |
| Bachelor's Degree | 0 (0.0%) | 0 (0.0%) |
| Graduate Degree | 0 (0.0%) | 0 (0.0%) |
| Total | 26 (63.4%) | 15 (36.6%) |
Employment Characteristics in Murphys Estates
Employment by Class of Employer in Murphys Estates
Among the 641 employed individuals in Murphys Estates, private company employees (563 | 87.8%), not-for-profit organizations (35 | 5.5%), and federal government employees (26 | 4.1%) make up the most common classes of employment.
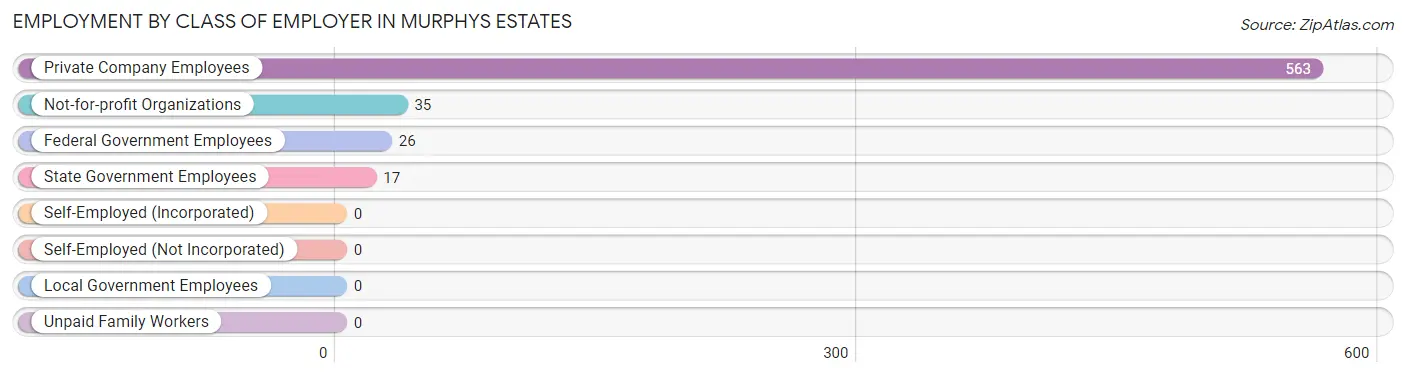
| Employer Class | # Employees | % Employees |
| Private Company Employees | 563 | 87.8% |
| Self-Employed (Incorporated) | 0 | 0.0% |
| Self-Employed (Not Incorporated) | 0 | 0.0% |
| Not-for-profit Organizations | 35 | 5.5% |
| Local Government Employees | 0 | 0.0% |
| State Government Employees | 17 | 2.6% |
| Federal Government Employees | 26 | 4.1% |
| Unpaid Family Workers | 0 | 0.0% |
| Total | 641 | 100.0% |
Employment Status by Age in Murphys Estates
According to the labor force statistics for Murphys Estates, out of the total population over 16 years of age (1,054), 64.6% or 681 individuals are in the labor force, with 3.7% or 25 of them unemployed. The age group with the highest labor force participation rate is 20 to 24 years, with 100.0% or 152 individuals in the labor force. Within the labor force, the 35 to 44 years age range has the highest percentage of unemployed individuals, with 21.0% or 25 of them being unemployed.
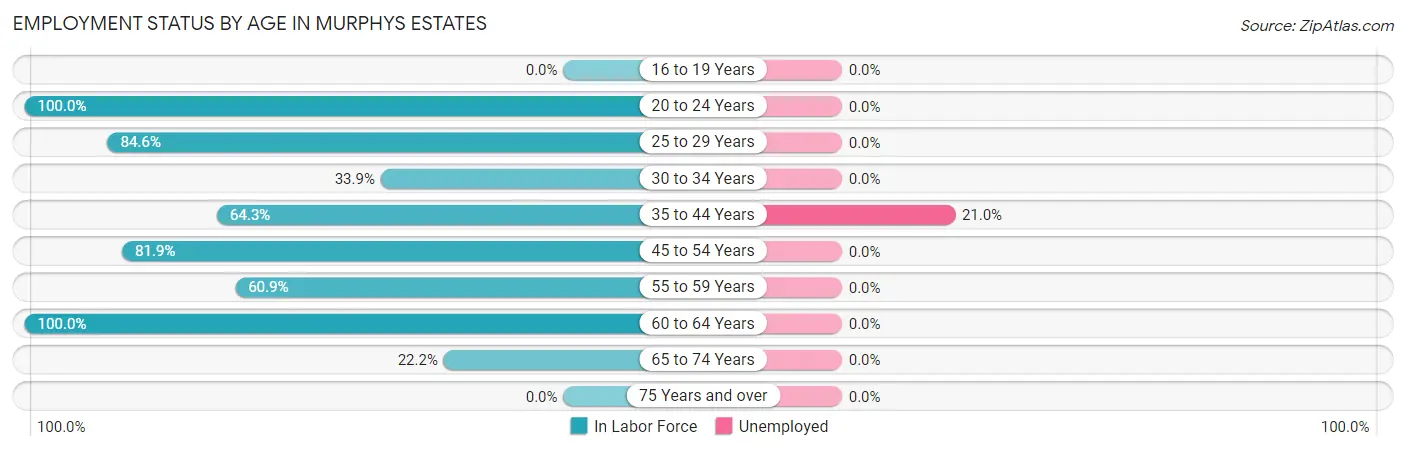
| Age Bracket | In Labor Force | Unemployed |
| 16 to 19 Years | 0 (0.0%) | 0 (0.0%) |
| 20 to 24 Years | 152 (100.0%) | 0 (0.0%) |
| 25 to 29 Years | 44 (84.6%) | 0 (0.0%) |
| 30 to 34 Years | 20 (33.9%) | 0 (0.0%) |
| 35 to 44 Years | 119 (64.3%) | 25 (21.0%) |
| 45 to 54 Years | 227 (81.9%) | 0 (0.0%) |
| 55 to 59 Years | 84 (60.9%) | 0 (0.0%) |
| 60 to 64 Years | 19 (100.0%) | 0 (0.0%) |
| 65 to 74 Years | 16 (22.2%) | 0 (0.0%) |
| 75 Years and over | 0 (0.0%) | 0 (0.0%) |
| Total | 681 (64.6%) | 25 (3.7%) |
Employment Status by Educational Attainment in Murphys Estates
According to labor force statistics for Murphys Estates, 70.3% of individuals (513) out of the total population between 25 and 64 years of age (730) are in the labor force, with 4.9% or 25 of them being unemployed. The group with the highest labor force participation rate are those with the educational attainment of college / associate degree, with 100.0% or 205 individuals in the labor force. Within the labor force, individuals with high school diploma education have the highest percentage of unemployment, with 16.7% or 25 of them being unemployed.
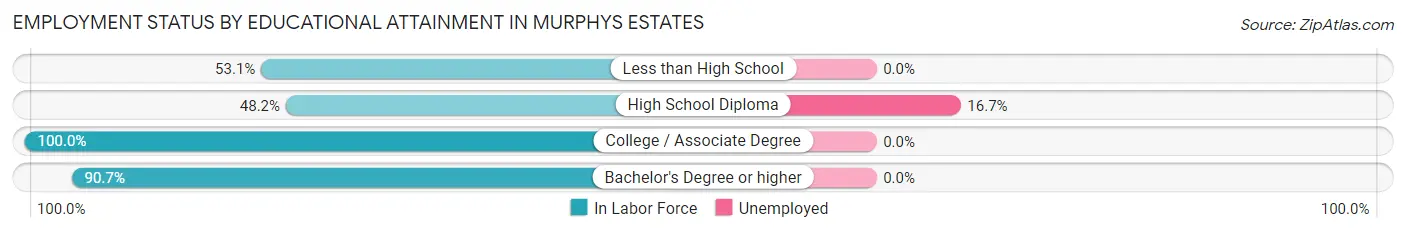
| Educational Attainment | In Labor Force | Unemployed |
| Less than High School | 51 (53.1%) | 0 (0.0%) |
| High School Diploma | 150 (48.2%) | 52 (16.7%) |
| College / Associate Degree | 205 (100.0%) | 0 (0.0%) |
| Bachelor's Degree or higher | 107 (90.7%) | 0 (0.0%) |
| Total | 513 (70.3%) | 36 (4.9%) |
Employment Occupations by Sex in Murphys Estates
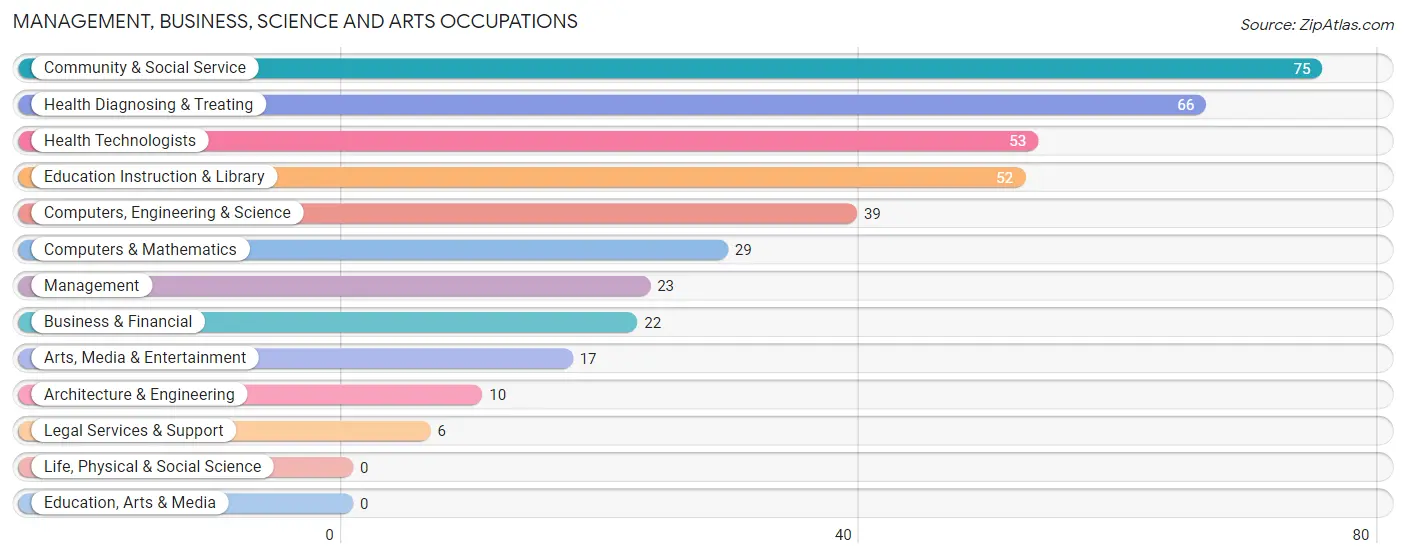
Management, Business, Science and Arts Occupations
The most common Management, Business, Science and Arts occupations in Murphys Estates are Community & Social Service (75 | 11.4%), Health Diagnosing & Treating (66 | 10.1%), Health Technologists (53 | 8.1%), Education Instruction & Library (52 | 7.9%), and Computers, Engineering & Science (39 | 5.9%).
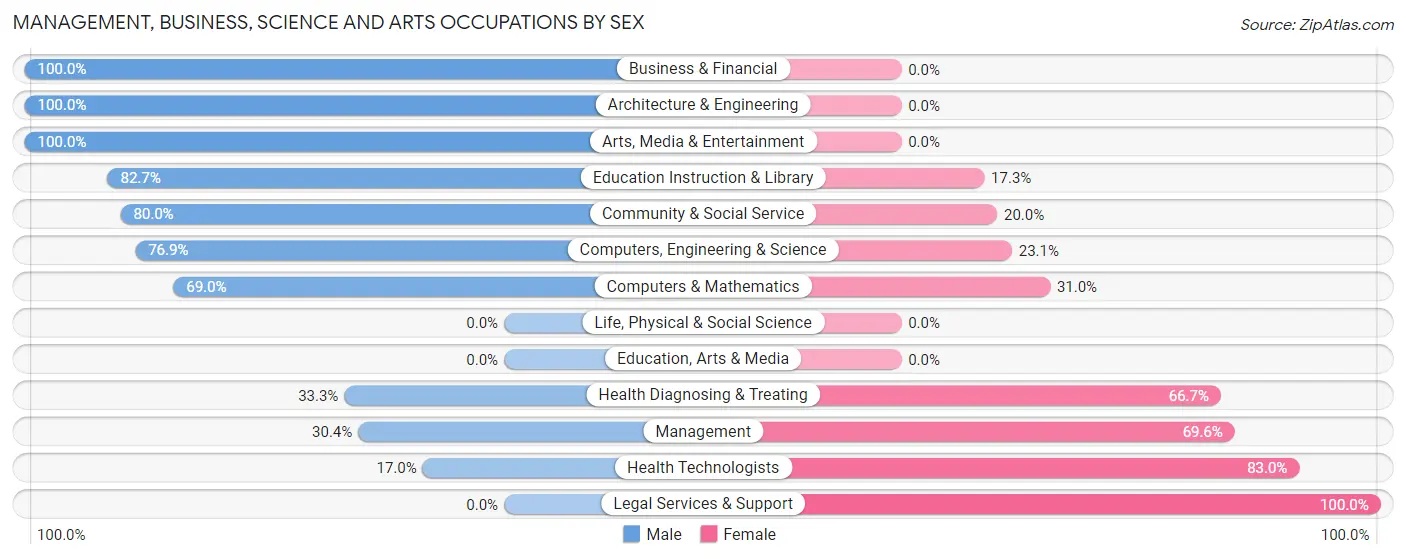
Management, Business, Science and Arts Occupations by Sex
Within the Management, Business, Science and Arts occupations in Murphys Estates, the most male-oriented occupations are Business & Financial (100.0%), Architecture & Engineering (100.0%), and Arts, Media & Entertainment (100.0%), while the most female-oriented occupations are Legal Services & Support (100.0%), Health Technologists (83.0%), and Management (69.6%).
| Occupation | Male | Female |
| Management | 7 (30.4%) | 16 (69.6%) |
| Business & Financial | 22 (100.0%) | 0 (0.0%) |
| Computers, Engineering & Science | 30 (76.9%) | 9 (23.1%) |
| Computers & Mathematics | 20 (69.0%) | 9 (31.0%) |
| Architecture & Engineering | 10 (100.0%) | 0 (0.0%) |
| Life, Physical & Social Science | 0 (0.0%) | 0 (0.0%) |
| Community & Social Service | 60 (80.0%) | 15 (20.0%) |
| Education, Arts & Media | 0 (0.0%) | 0 (0.0%) |
| Legal Services & Support | 0 (0.0%) | 6 (100.0%) |
| Education Instruction & Library | 43 (82.7%) | 9 (17.3%) |
| Arts, Media & Entertainment | 17 (100.0%) | 0 (0.0%) |
| Health Diagnosing & Treating | 22 (33.3%) | 44 (66.7%) |
| Health Technologists | 9 (17.0%) | 44 (83.0%) |
| Total (Category) | 141 (62.7%) | 84 (37.3%) |
| Total (Overall) | 242 (36.9%) | 414 (63.1%) |
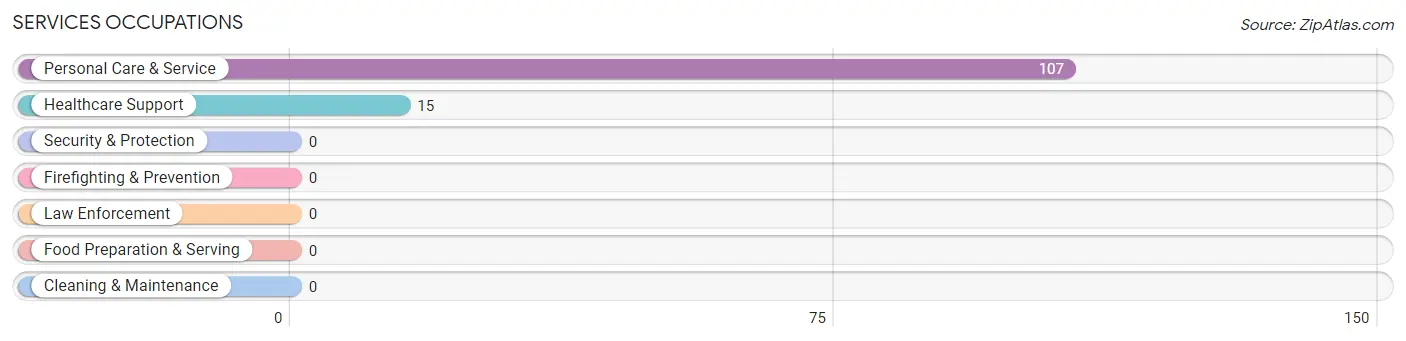
Services Occupations
The most common Services occupations in Murphys Estates are Personal Care & Service (107 | 16.3%), and Healthcare Support (15 | 2.3%).
Services Occupations by Sex
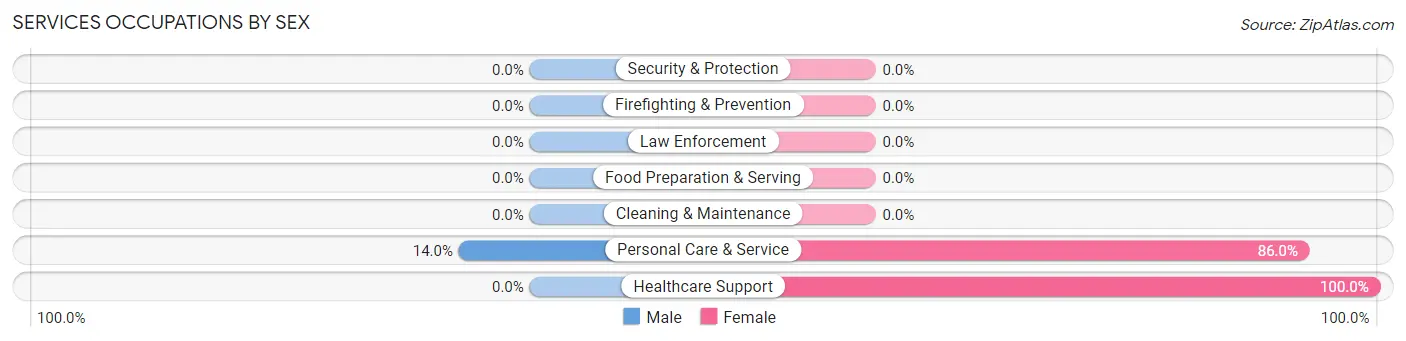
| Occupation | Male | Female |
| Healthcare Support | 0 (0.0%) | 15 (100.0%) |
| Security & Protection | 0 (0.0%) | 0 (0.0%) |
| Firefighting & Prevention | 0 (0.0%) | 0 (0.0%) |
| Law Enforcement | 0 (0.0%) | 0 (0.0%) |
| Food Preparation & Serving | 0 (0.0%) | 0 (0.0%) |
| Cleaning & Maintenance | 0 (0.0%) | 0 (0.0%) |
| Personal Care & Service | 15 (14.0%) | 92 (86.0%) |
| Total (Category) | 15 (12.3%) | 107 (87.7%) |
| Total (Overall) | 242 (36.9%) | 414 (63.1%) |
Sales and Office Occupations
The most common Sales and Office occupations in Murphys Estates are Office & Administration (155 | 23.6%), and Sales & Related (18 | 2.7%).
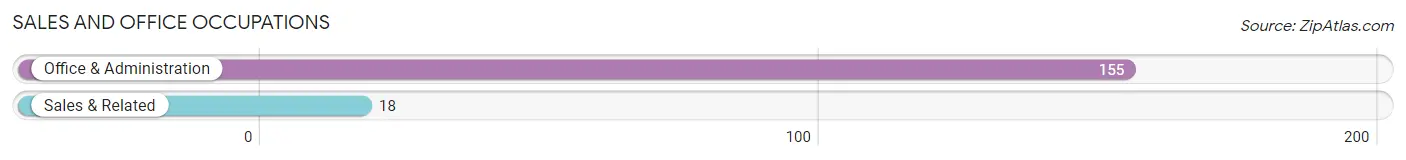
Sales and Office Occupations by Sex
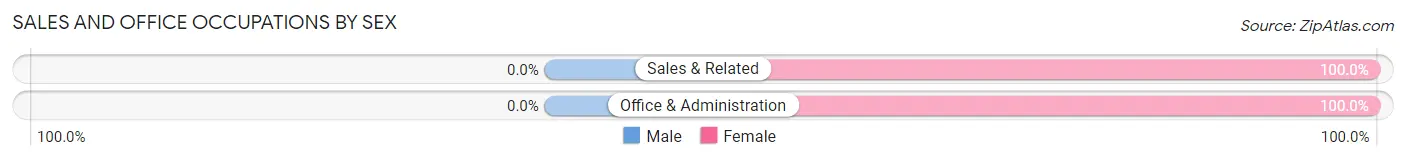
| Occupation | Male | Female |
| Sales & Related | 0 (0.0%) | 18 (100.0%) |
| Office & Administration | 0 (0.0%) | 155 (100.0%) |
| Total (Category) | 0 (0.0%) | 173 (100.0%) |
| Total (Overall) | 242 (36.9%) | 414 (63.1%) |
Natural Resources, Construction and Maintenance Occupations
The most common Natural Resources, Construction and Maintenance occupations in Murphys Estates are Construction & Extraction (35 | 5.3%), and Installation, Maintenance & Repair (31 | 4.7%).
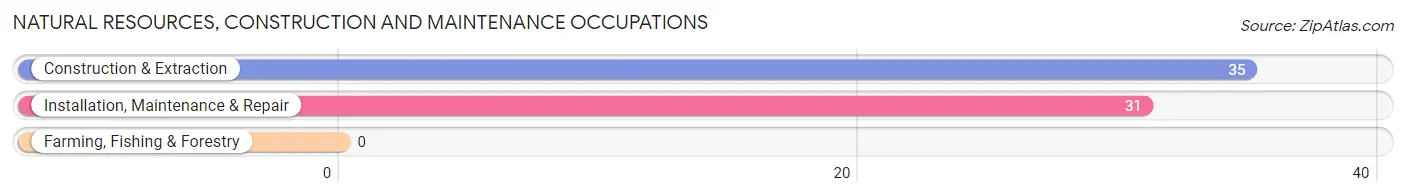
Natural Resources, Construction and Maintenance Occupations by Sex
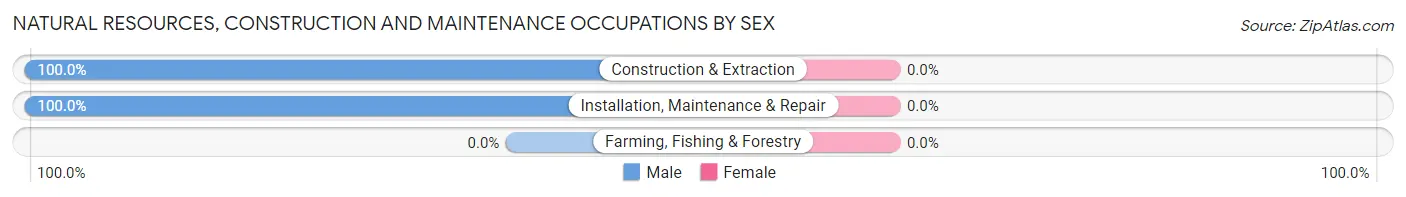
| Occupation | Male | Female |
| Farming, Fishing & Forestry | 0 (0.0%) | 0 (0.0%) |
| Construction & Extraction | 35 (100.0%) | 0 (0.0%) |
| Installation, Maintenance & Repair | 31 (100.0%) | 0 (0.0%) |
| Total (Category) | 66 (100.0%) | 0 (0.0%) |
| Total (Overall) | 242 (36.9%) | 414 (63.1%) |
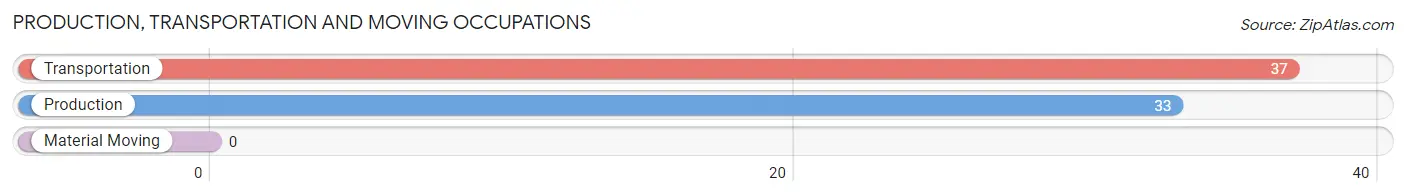
Production, Transportation and Moving Occupations
The most common Production, Transportation and Moving occupations in Murphys Estates are Transportation (37 | 5.6%), and Production (33 | 5.0%).
Production, Transportation and Moving Occupations by Sex
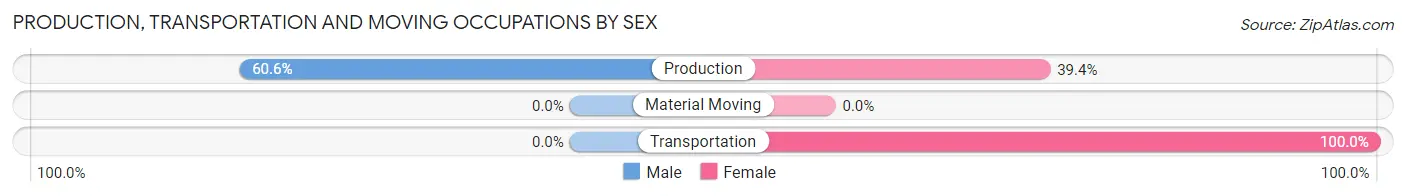
| Occupation | Male | Female |
| Production | 20 (60.6%) | 13 (39.4%) |
| Transportation | 0 (0.0%) | 37 (100.0%) |
| Material Moving | 0 (0.0%) | 0 (0.0%) |
| Total (Category) | 20 (28.6%) | 50 (71.4%) |
| Total (Overall) | 242 (36.9%) | 414 (63.1%) |
Employment Industries by Sex in Murphys Estates
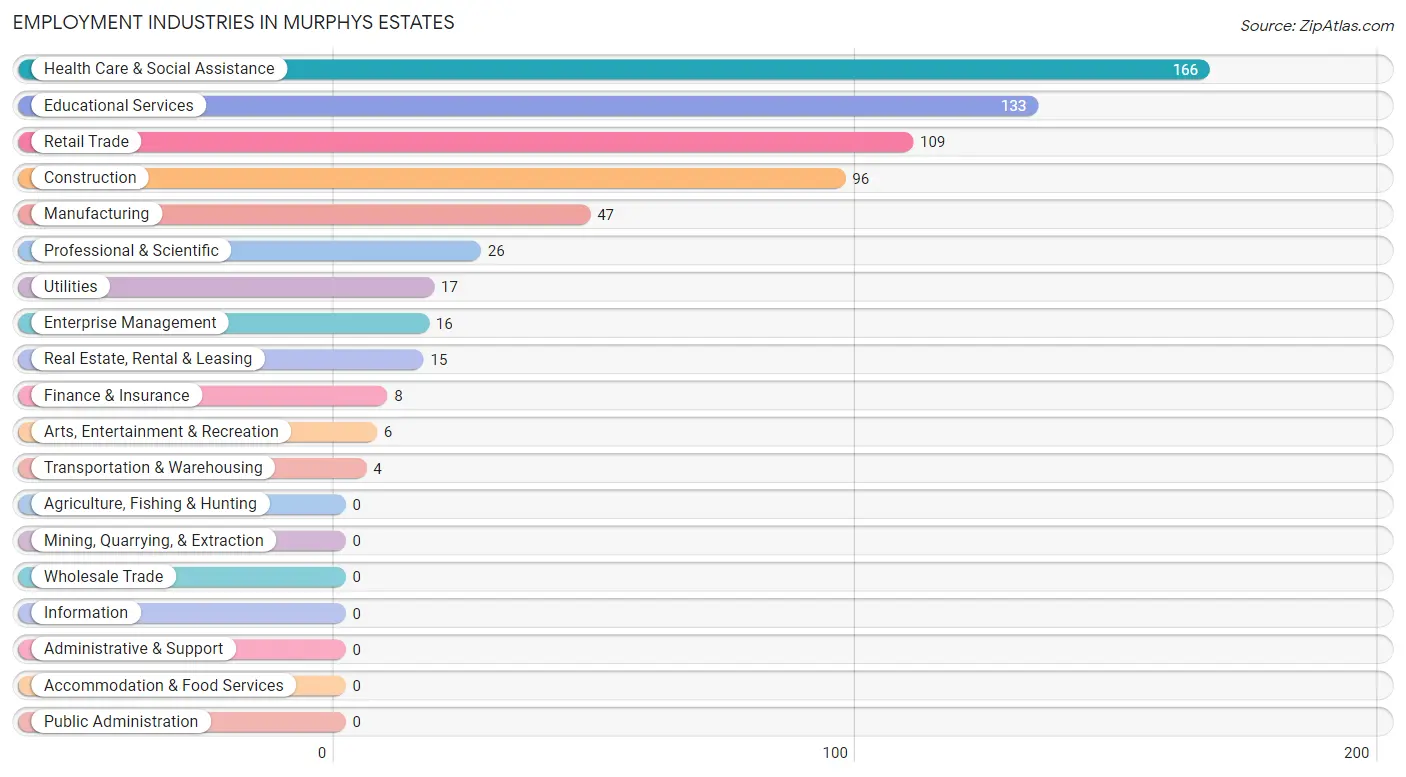
Employment Industries in Murphys Estates
The major employment industries in Murphys Estates include Health Care & Social Assistance (166 | 25.3%), Educational Services (133 | 20.3%), Retail Trade (109 | 16.6%), Construction (96 | 14.6%), and Manufacturing (47 | 7.2%).
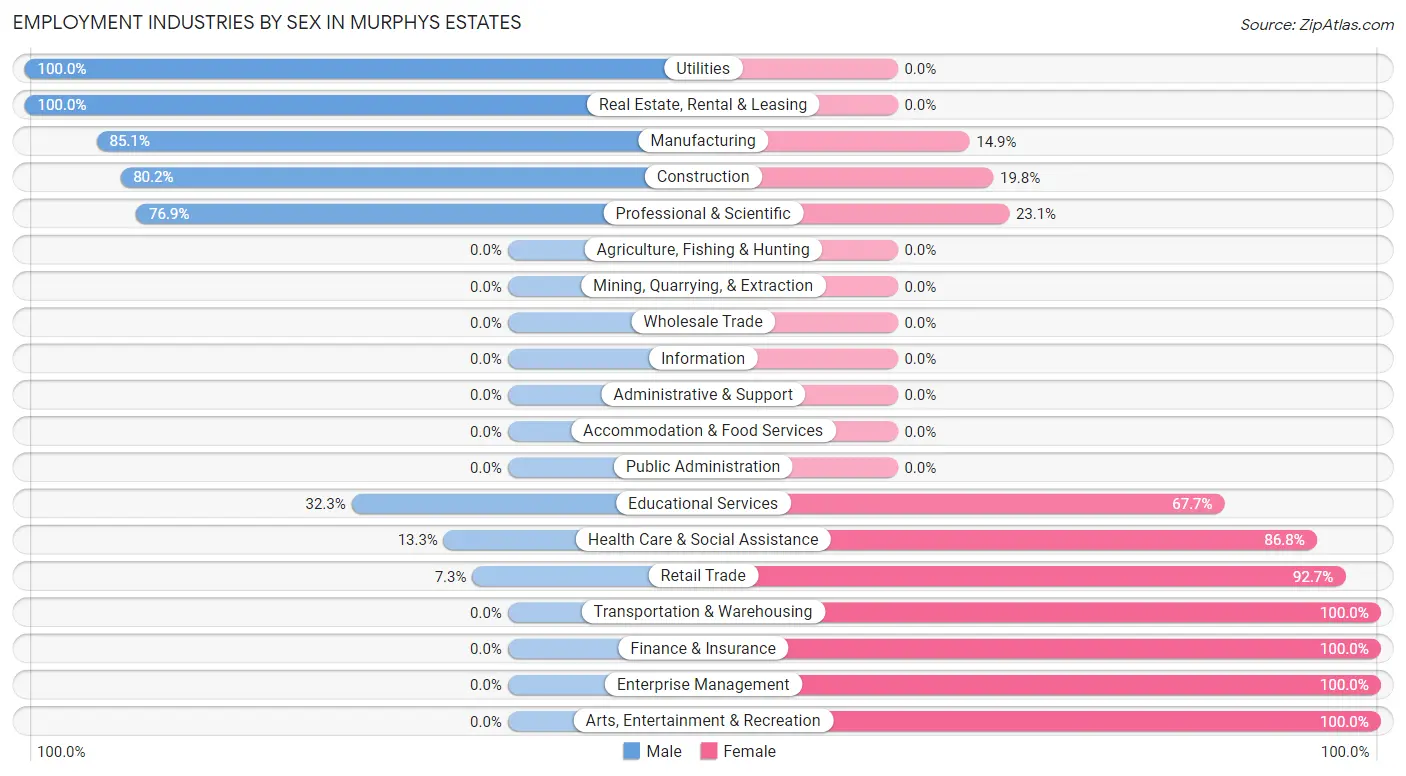
Employment Industries by Sex in Murphys Estates
The Murphys Estates industries that see more men than women are Utilities (100.0%), Real Estate, Rental & Leasing (100.0%), and Manufacturing (85.1%), whereas the industries that tend to have a higher number of women are Transportation & Warehousing (100.0%), Finance & Insurance (100.0%), and Enterprise Management (100.0%).
| Industry | Male | Female |
| Agriculture, Fishing & Hunting | 0 (0.0%) | 0 (0.0%) |
| Mining, Quarrying, & Extraction | 0 (0.0%) | 0 (0.0%) |
| Construction | 77 (80.2%) | 19 (19.8%) |
| Manufacturing | 40 (85.1%) | 7 (14.9%) |
| Wholesale Trade | 0 (0.0%) | 0 (0.0%) |
| Retail Trade | 8 (7.3%) | 101 (92.7%) |
| Transportation & Warehousing | 0 (0.0%) | 4 (100.0%) |
| Utilities | 17 (100.0%) | 0 (0.0%) |
| Information | 0 (0.0%) | 0 (0.0%) |
| Finance & Insurance | 0 (0.0%) | 8 (100.0%) |
| Real Estate, Rental & Leasing | 15 (100.0%) | 0 (0.0%) |
| Professional & Scientific | 20 (76.9%) | 6 (23.1%) |
| Enterprise Management | 0 (0.0%) | 16 (100.0%) |
| Administrative & Support | 0 (0.0%) | 0 (0.0%) |
| Educational Services | 43 (32.3%) | 90 (67.7%) |
| Health Care & Social Assistance | 22 (13.3%) | 144 (86.8%) |
| Arts, Entertainment & Recreation | 0 (0.0%) | 6 (100.0%) |
| Accommodation & Food Services | 0 (0.0%) | 0 (0.0%) |
| Public Administration | 0 (0.0%) | 0 (0.0%) |
| Total | 242 (36.9%) | 414 (63.1%) |
Education in Murphys Estates
School Enrollment in Murphys Estates
The most common levels of schooling among the 400 students in Murphys Estates are middle school (155 | 38.8%), elementary school (137 | 34.3%), and kindergarten (40 | 10.0%).
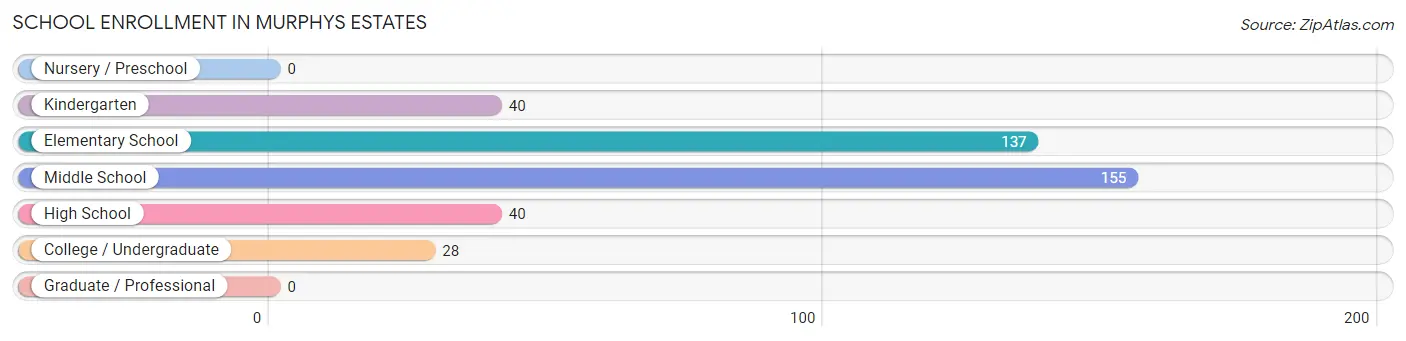
| School Level | # Students | % Students |
| Nursery / Preschool | 0 | 0.0% |
| Kindergarten | 40 | 10.0% |
| Elementary School | 137 | 34.3% |
| Middle School | 155 | 38.8% |
| High School | 40 | 10.0% |
| College / Undergraduate | 28 | 7.0% |
| Graduate / Professional | 0 | 0.0% |
| Total | 400 | 100.0% |
School Enrollment by Age by Funding Source in Murphys Estates
Out of a total of 400 students who are enrolled in schools in Murphys Estates, 16 (4.0%) attend a private institution, while the remaining 384 (96.0%) are enrolled in public schools. The age group of 10 to 14 year olds has the highest likelihood of being enrolled in private schools, with 8 (5.2% in the age bracket) enrolled. Conversely, the age group of 15 to 17 year olds has the lowest likelihood of being enrolled in a private school, with 40 (100.0% in the age bracket) attending a public institution.
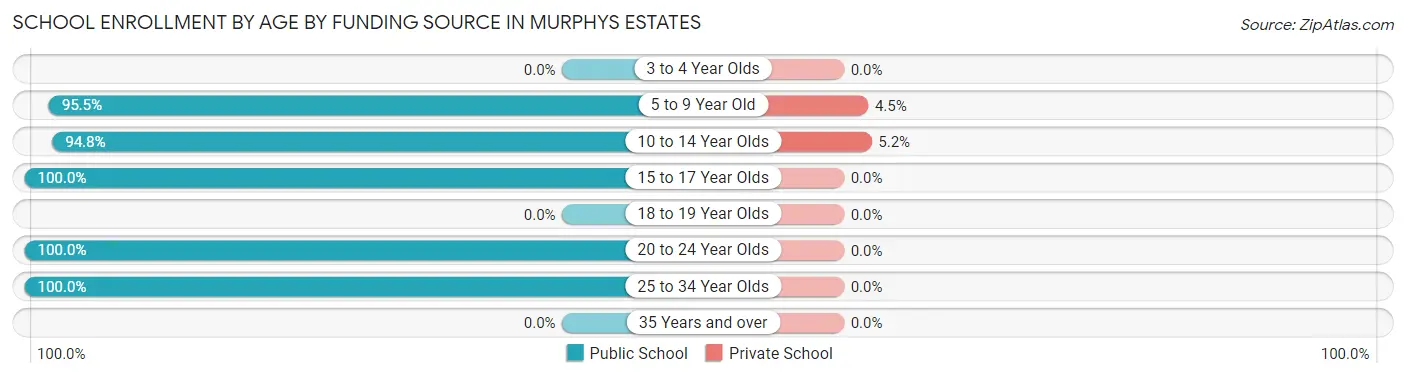
| Age Bracket | Public School | Private School |
| 3 to 4 Year Olds | 0 (0.0%) | 0 (0.0%) |
| 5 to 9 Year Old | 169 (95.5%) | 8 (4.5%) |
| 10 to 14 Year Olds | 147 (94.8%) | 8 (5.2%) |
| 15 to 17 Year Olds | 40 (100.0%) | 0 (0.0%) |
| 18 to 19 Year Olds | 0 (0.0%) | 0 (0.0%) |
| 20 to 24 Year Olds | 13 (100.0%) | 0 (0.0%) |
| 25 to 34 Year Olds | 15 (100.0%) | 0 (0.0%) |
| 35 Years and over | 0 (0.0%) | 0 (0.0%) |
| Total | 384 (96.0%) | 16 (4.0%) |
Educational Attainment by Field of Study in Murphys Estates
Business (65 | 38.0%), science & technology (41 | 24.0%), bio, nature & agricultural (29 | 17.0%), education (19 | 11.1%), and physical & health sciences (17 | 9.9%) are the most common fields of study among 171 individuals in Murphys Estates who have obtained a bachelor's degree or higher.
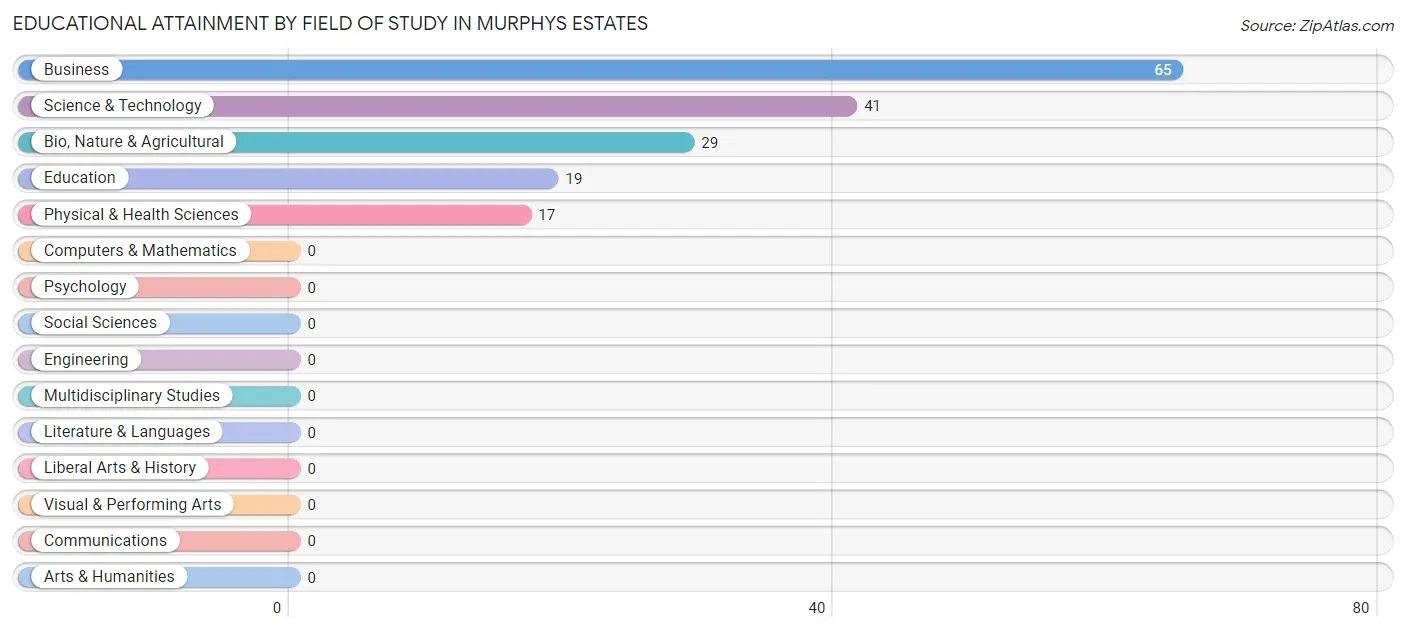
| Field of Study | # Graduates | % Graduates |
| Computers & Mathematics | 0 | 0.0% |
| Bio, Nature & Agricultural | 29 | 17.0% |
| Physical & Health Sciences | 17 | 9.9% |
| Psychology | 0 | 0.0% |
| Social Sciences | 0 | 0.0% |
| Engineering | 0 | 0.0% |
| Multidisciplinary Studies | 0 | 0.0% |
| Science & Technology | 41 | 24.0% |
| Business | 65 | 38.0% |
| Education | 19 | 11.1% |
| Literature & Languages | 0 | 0.0% |
| Liberal Arts & History | 0 | 0.0% |
| Visual & Performing Arts | 0 | 0.0% |
| Communications | 0 | 0.0% |
| Arts & Humanities | 0 | 0.0% |
| Total | 171 | 100.0% |
Transportation & Commute in Murphys Estates
Vehicle Availability by Sex in Murphys Estates
The most prevalent vehicle ownership categories in Murphys Estates are males with 2 vehicles (73, accounting for 30.2%) and females with 2 vehicles (96, making up 18.3%).
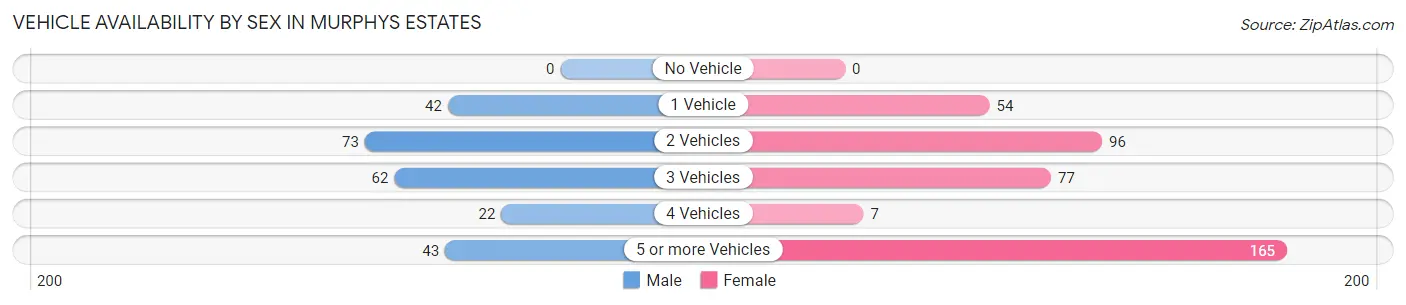
| Vehicles Available | Male | Female |
| No Vehicle | 0 (0.0%) | 0 (0.0%) |
| 1 Vehicle | 42 (17.4%) | 54 (13.5%) |
| 2 Vehicles | 73 (30.2%) | 96 (24.1%) |
| 3 Vehicles | 62 (25.6%) | 77 (19.3%) |
| 4 Vehicles | 22 (9.1%) | 7 (1.8%) |
| 5 or more Vehicles | 43 (17.8%) | 165 (41.3%) |
| Total | 242 (100.0%) | 399 (100.0%) |
Commute Time in Murphys Estates
The most frequently occuring commute durations in Murphys Estates are 30 to 34 minutes (114 commuters, 19.1%), 15 to 19 minutes (101 commuters, 16.9%), and 45 to 59 minutes (97 commuters, 16.2%).
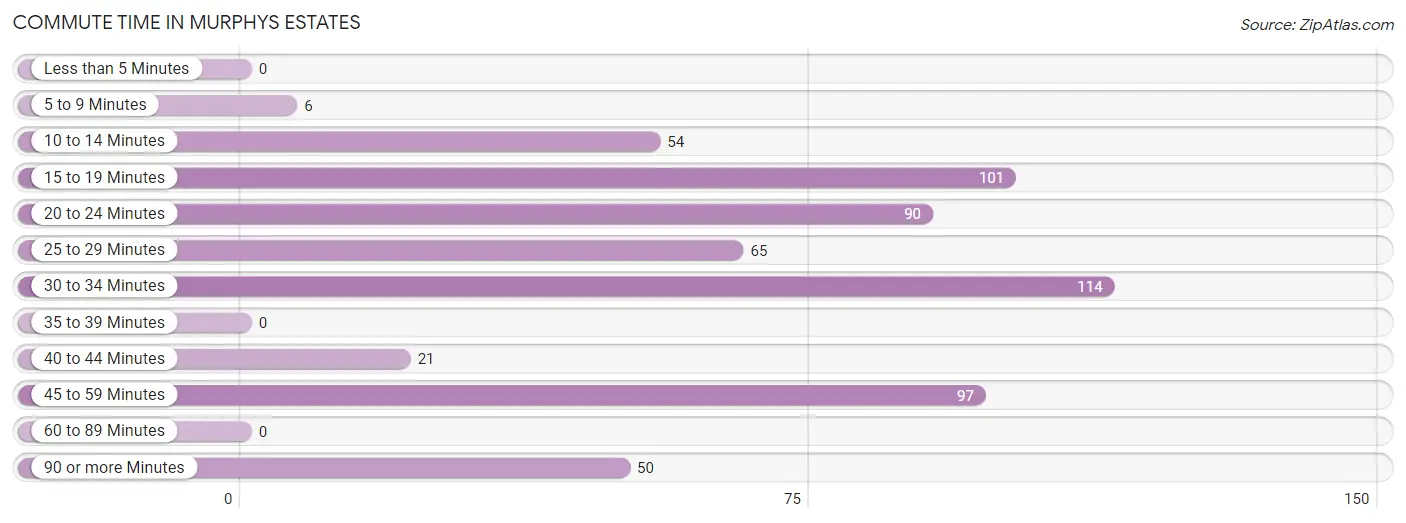
| Commute Time | # Commuters | % Commuters |
| Less than 5 Minutes | 0 | 0.0% |
| 5 to 9 Minutes | 6 | 1.0% |
| 10 to 14 Minutes | 54 | 9.0% |
| 15 to 19 Minutes | 101 | 16.9% |
| 20 to 24 Minutes | 90 | 15.0% |
| 25 to 29 Minutes | 65 | 10.9% |
| 30 to 34 Minutes | 114 | 19.1% |
| 35 to 39 Minutes | 0 | 0.0% |
| 40 to 44 Minutes | 21 | 3.5% |
| 45 to 59 Minutes | 97 | 16.2% |
| 60 to 89 Minutes | 0 | 0.0% |
| 90 or more Minutes | 50 | 8.4% |
Commute Time by Sex in Murphys Estates
The most common commute times in Murphys Estates are 45 to 59 minutes (72 commuters, 29.7%) for males and 30 to 34 minutes (92 commuters, 25.8%) for females.
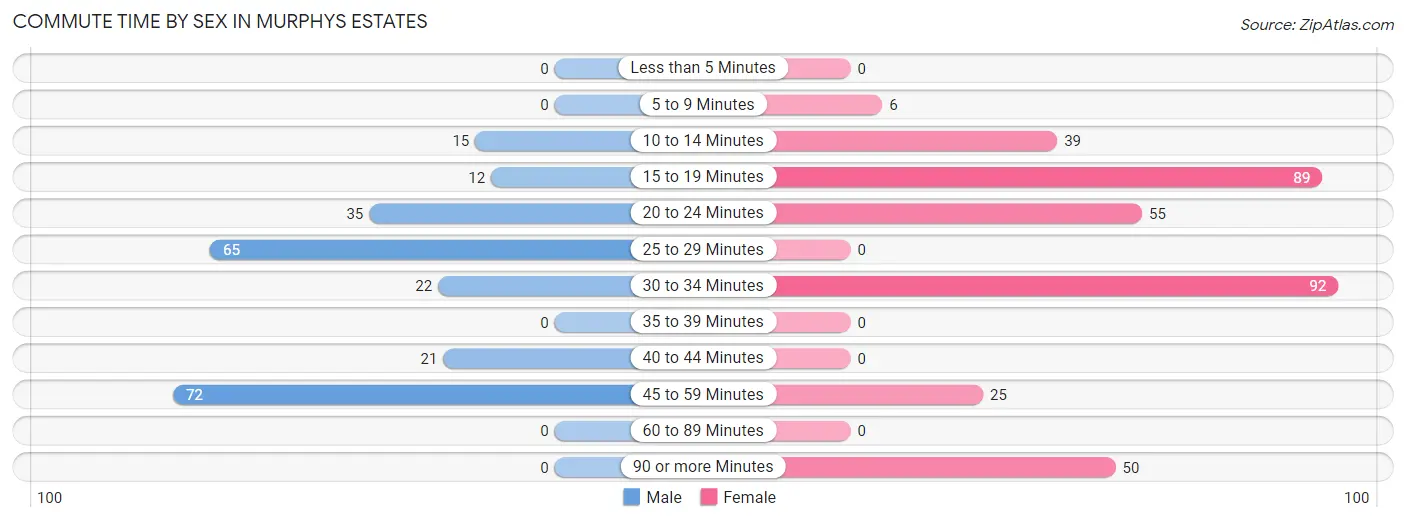
| Commute Time | Male | Female |
| Less than 5 Minutes | 0 (0.0%) | 0 (0.0%) |
| 5 to 9 Minutes | 0 (0.0%) | 6 (1.7%) |
| 10 to 14 Minutes | 15 (6.2%) | 39 (11.0%) |
| 15 to 19 Minutes | 12 (5.0%) | 89 (25.0%) |
| 20 to 24 Minutes | 35 (14.5%) | 55 (15.4%) |
| 25 to 29 Minutes | 65 (26.9%) | 0 (0.0%) |
| 30 to 34 Minutes | 22 (9.1%) | 92 (25.8%) |
| 35 to 39 Minutes | 0 (0.0%) | 0 (0.0%) |
| 40 to 44 Minutes | 21 (8.7%) | 0 (0.0%) |
| 45 to 59 Minutes | 72 (29.7%) | 25 (7.0%) |
| 60 to 89 Minutes | 0 (0.0%) | 0 (0.0%) |
| 90 or more Minutes | 0 (0.0%) | 50 (14.0%) |
Time of Departure to Work by Sex in Murphys Estates
The most frequent times of departure to work in Murphys Estates are 6:00 AM to 6:29 AM (66, 27.3%) for males and 7:00 AM to 7:29 AM (150, 42.1%) for females.
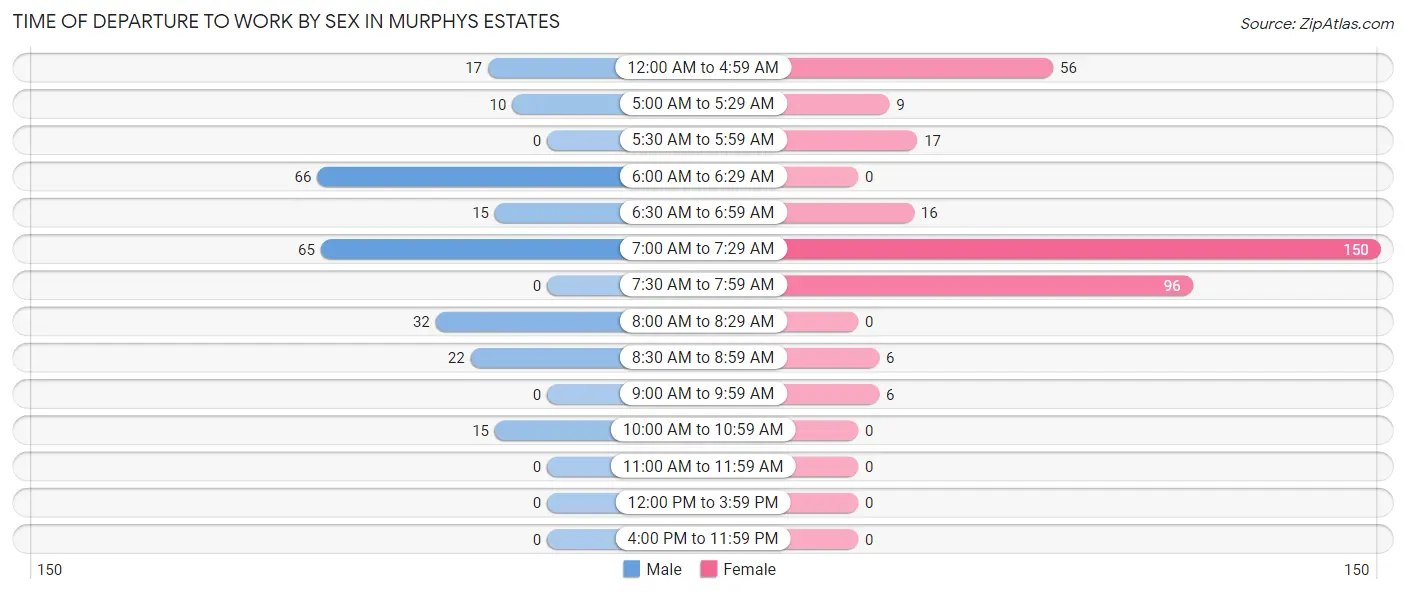
| Time of Departure | Male | Female |
| 12:00 AM to 4:59 AM | 17 (7.0%) | 56 (15.7%) |
| 5:00 AM to 5:29 AM | 10 (4.1%) | 9 (2.5%) |
| 5:30 AM to 5:59 AM | 0 (0.0%) | 17 (4.8%) |
| 6:00 AM to 6:29 AM | 66 (27.3%) | 0 (0.0%) |
| 6:30 AM to 6:59 AM | 15 (6.2%) | 16 (4.5%) |
| 7:00 AM to 7:29 AM | 65 (26.9%) | 150 (42.1%) |
| 7:30 AM to 7:59 AM | 0 (0.0%) | 96 (27.0%) |
| 8:00 AM to 8:29 AM | 32 (13.2%) | 0 (0.0%) |
| 8:30 AM to 8:59 AM | 22 (9.1%) | 6 (1.7%) |
| 9:00 AM to 9:59 AM | 0 (0.0%) | 6 (1.7%) |
| 10:00 AM to 10:59 AM | 15 (6.2%) | 0 (0.0%) |
| 11:00 AM to 11:59 AM | 0 (0.0%) | 0 (0.0%) |
| 12:00 PM to 3:59 PM | 0 (0.0%) | 0 (0.0%) |
| 4:00 PM to 11:59 PM | 0 (0.0%) | 0 (0.0%) |
| Total | 242 (100.0%) | 356 (100.0%) |
Housing Occupancy in Murphys Estates
Occupancy by Ownership in Murphys Estates
Of the total 445 dwellings in Murphys Estates, owner-occupied units account for 376 (84.5%), while renter-occupied units make up 69 (15.5%).
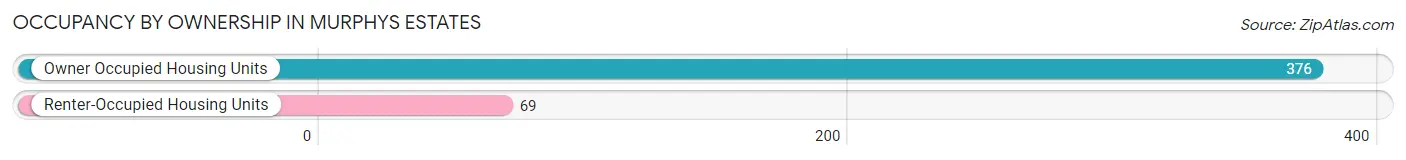
| Occupancy | # Housing Units | % Housing Units |
| Owner Occupied Housing Units | 376 | 84.5% |
| Renter-Occupied Housing Units | 69 | 15.5% |
| Total Occupied Housing Units | 445 | 100.0% |
Occupancy by Household Size in Murphys Estates
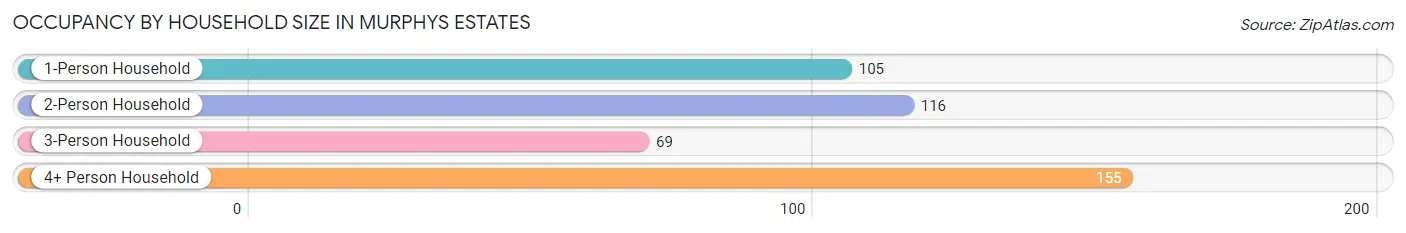
| Household Size | # Housing Units | % Housing Units |
| 1-Person Household | 105 | 23.6% |
| 2-Person Household | 116 | 26.1% |
| 3-Person Household | 69 | 15.5% |
| 4+ Person Household | 155 | 34.8% |
| Total Housing Units | 445 | 100.0% |
Occupancy by Ownership by Household Size in Murphys Estates
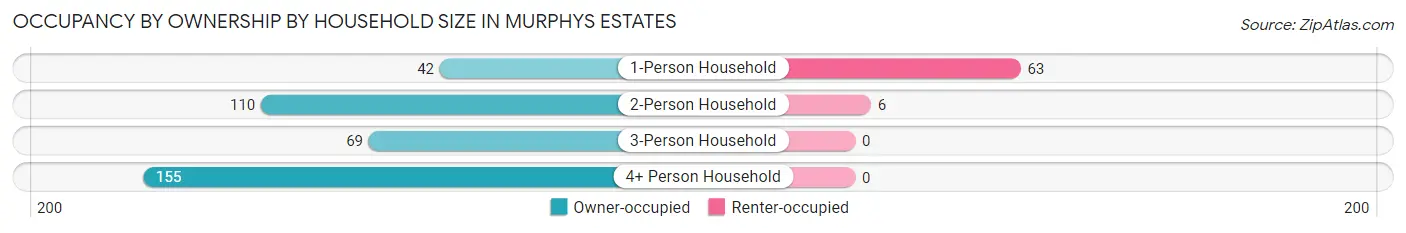
| Household Size | Owner-occupied | Renter-occupied |
| 1-Person Household | 42 (40.0%) | 63 (60.0%) |
| 2-Person Household | 110 (94.8%) | 6 (5.2%) |
| 3-Person Household | 69 (100.0%) | 0 (0.0%) |
| 4+ Person Household | 155 (100.0%) | 0 (0.0%) |
| Total Housing Units | 376 (84.5%) | 69 (15.5%) |
Occupancy by Educational Attainment in Murphys Estates
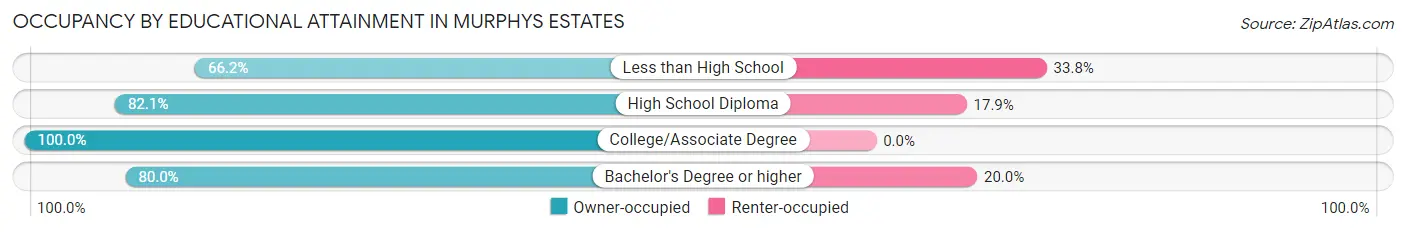
| Household Size | Owner-occupied | Renter-occupied |
| Less than High School | 47 (66.2%) | 24 (33.8%) |
| High School Diploma | 119 (82.1%) | 26 (17.9%) |
| College/Associate Degree | 134 (100.0%) | 0 (0.0%) |
| Bachelor's Degree or higher | 76 (80.0%) | 19 (20.0%) |
Occupancy by Age of Householder in Murphys Estates
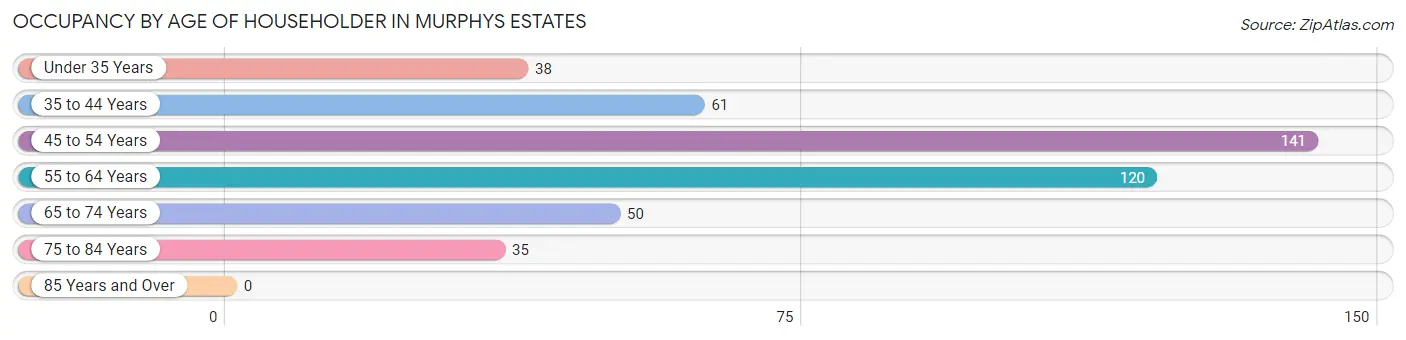
| Age Bracket | # Households | % Households |
| Under 35 Years | 38 | 8.5% |
| 35 to 44 Years | 61 | 13.7% |
| 45 to 54 Years | 141 | 31.7% |
| 55 to 64 Years | 120 | 27.0% |
| 65 to 74 Years | 50 | 11.2% |
| 75 to 84 Years | 35 | 7.9% |
| 85 Years and Over | 0 | 0.0% |
| Total | 445 | 100.0% |
Housing Finances in Murphys Estates
Median Income by Occupancy in Murphys Estates
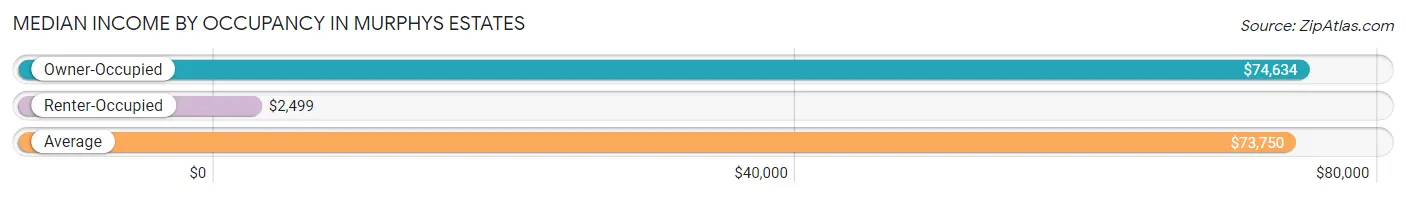
| Occupancy Type | # Households | Median Income |
| Owner-Occupied | 376 (84.5%) | $74,634 |
| Renter-Occupied | 69 (15.5%) | $2,499 |
| Average | 445 (100.0%) | $73,750 |
Occupancy by Householder Income Bracket in Murphys Estates
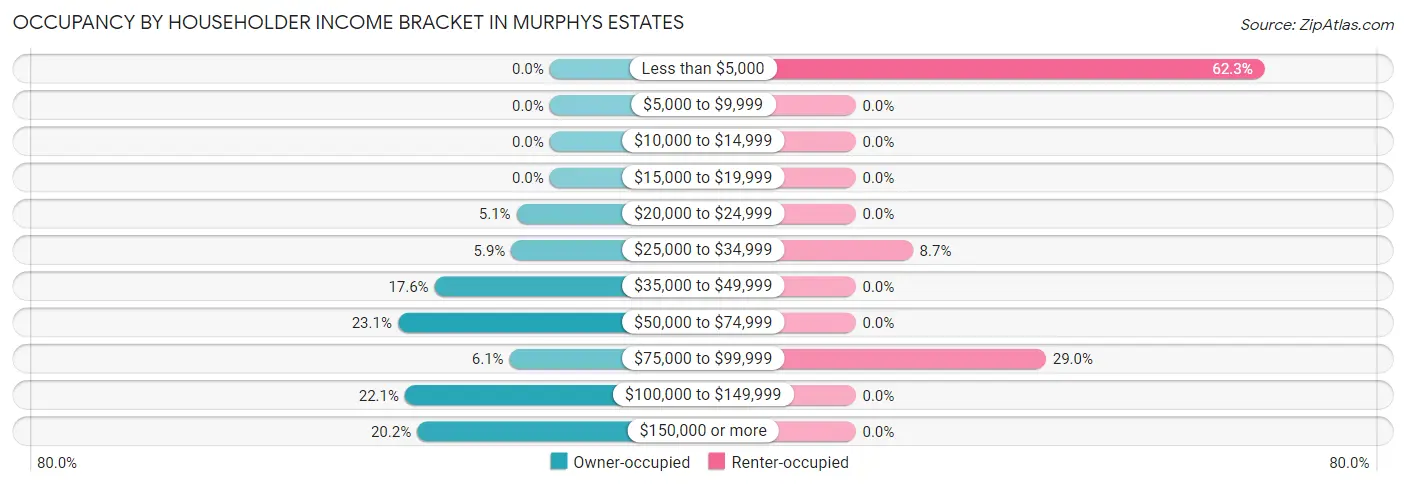
| Income Bracket | Owner-occupied | Renter-occupied |
| Less than $5,000 | 0 (0.0%) | 43 (62.3%) |
| $5,000 to $9,999 | 0 (0.0%) | 0 (0.0%) |
| $10,000 to $14,999 | 0 (0.0%) | 0 (0.0%) |
| $15,000 to $19,999 | 0 (0.0%) | 0 (0.0%) |
| $20,000 to $24,999 | 19 (5.1%) | 0 (0.0%) |
| $25,000 to $34,999 | 22 (5.9%) | 6 (8.7%) |
| $35,000 to $49,999 | 66 (17.5%) | 0 (0.0%) |
| $50,000 to $74,999 | 87 (23.1%) | 0 (0.0%) |
| $75,000 to $99,999 | 23 (6.1%) | 20 (29.0%) |
| $100,000 to $149,999 | 83 (22.1%) | 0 (0.0%) |
| $150,000 or more | 76 (20.2%) | 0 (0.0%) |
| Total | 376 (100.0%) | 69 (100.0%) |
Monthly Housing Cost Tiers in Murphys Estates
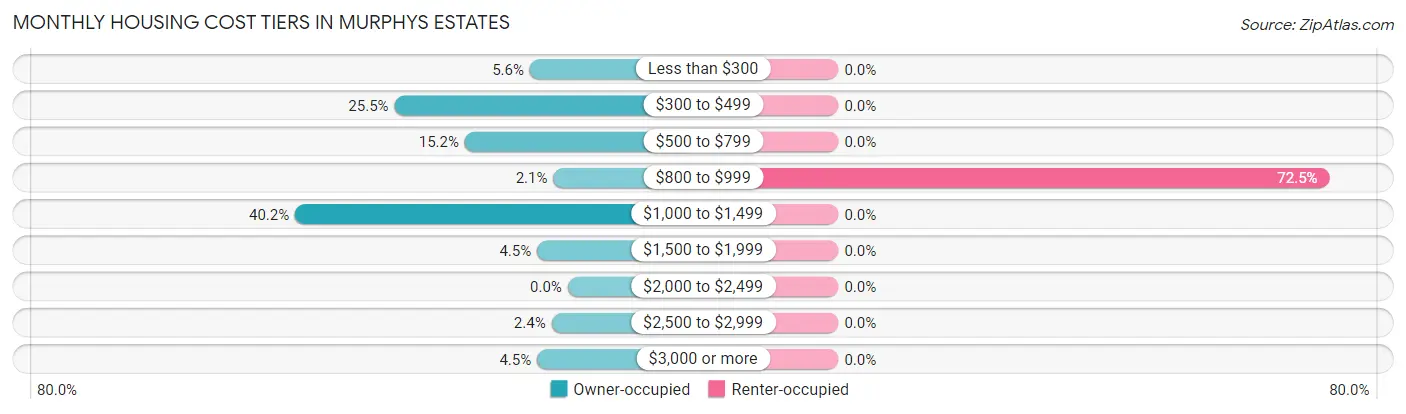
| Monthly Cost | Owner-occupied | Renter-occupied |
| Less than $300 | 21 (5.6%) | 0 (0.0%) |
| $300 to $499 | 96 (25.5%) | 0 (0.0%) |
| $500 to $799 | 57 (15.2%) | 0 (0.0%) |
| $800 to $999 | 8 (2.1%) | 50 (72.5%) |
| $1,000 to $1,499 | 151 (40.2%) | 0 (0.0%) |
| $1,500 to $1,999 | 17 (4.5%) | 0 (0.0%) |
| $2,000 to $2,499 | 0 (0.0%) | 0 (0.0%) |
| $2,500 to $2,999 | 9 (2.4%) | 0 (0.0%) |
| $3,000 or more | 17 (4.5%) | 0 (0.0%) |
| Total | 376 (100.0%) | 69 (100.0%) |
Physical Housing Characteristics in Murphys Estates
Housing Structures in Murphys Estates
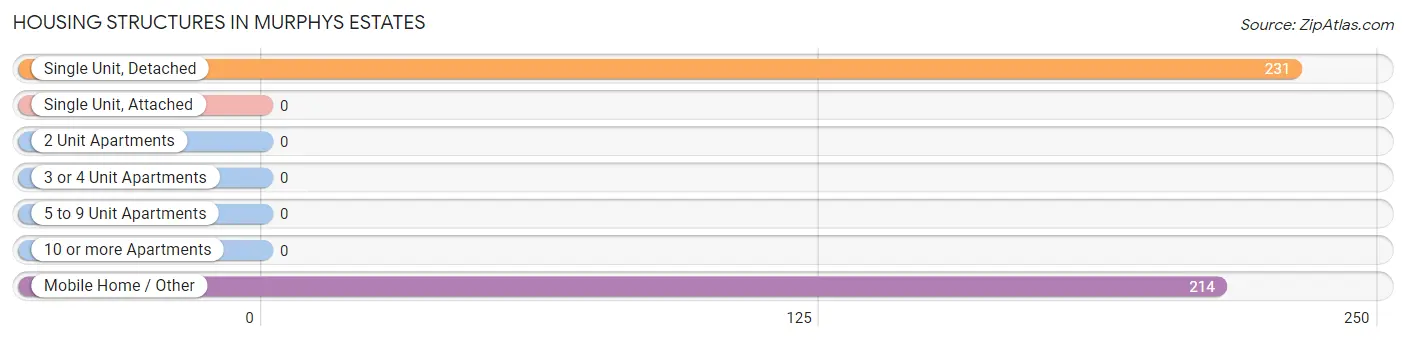
| Structure Type | # Housing Units | % Housing Units |
| Single Unit, Detached | 231 | 51.9% |
| Single Unit, Attached | 0 | 0.0% |
| 2 Unit Apartments | 0 | 0.0% |
| 3 or 4 Unit Apartments | 0 | 0.0% |
| 5 to 9 Unit Apartments | 0 | 0.0% |
| 10 or more Apartments | 0 | 0.0% |
| Mobile Home / Other | 214 | 48.1% |
| Total | 445 | 100.0% |
Housing Structures by Occupancy in Murphys Estates
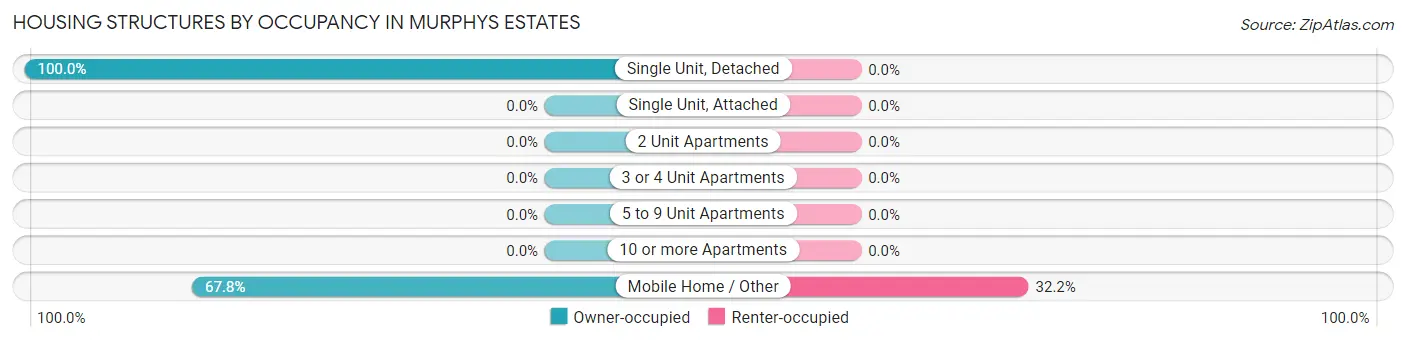
| Structure Type | Owner-occupied | Renter-occupied |
| Single Unit, Detached | 231 (100.0%) | 0 (0.0%) |
| Single Unit, Attached | 0 (0.0%) | 0 (0.0%) |
| 2 Unit Apartments | 0 (0.0%) | 0 (0.0%) |
| 3 or 4 Unit Apartments | 0 (0.0%) | 0 (0.0%) |
| 5 to 9 Unit Apartments | 0 (0.0%) | 0 (0.0%) |
| 10 or more Apartments | 0 (0.0%) | 0 (0.0%) |
| Mobile Home / Other | 145 (67.8%) | 69 (32.2%) |
| Total | 376 (84.5%) | 69 (15.5%) |
Housing Structures by Number of Rooms in Murphys Estates
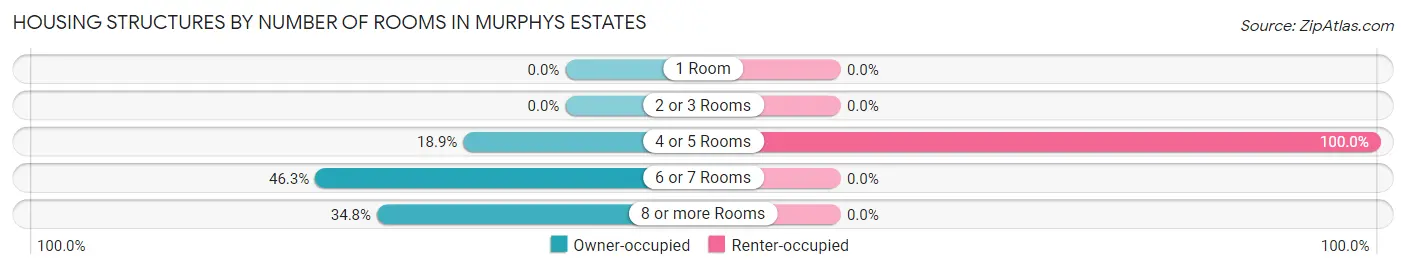
| Number of Rooms | Owner-occupied | Renter-occupied |
| 1 Room | 0 (0.0%) | 0 (0.0%) |
| 2 or 3 Rooms | 0 (0.0%) | 0 (0.0%) |
| 4 or 5 Rooms | 71 (18.9%) | 69 (100.0%) |
| 6 or 7 Rooms | 174 (46.3%) | 0 (0.0%) |
| 8 or more Rooms | 131 (34.8%) | 0 (0.0%) |
| Total | 376 (100.0%) | 69 (100.0%) |
Housing Structure by Heating Type in Murphys Estates
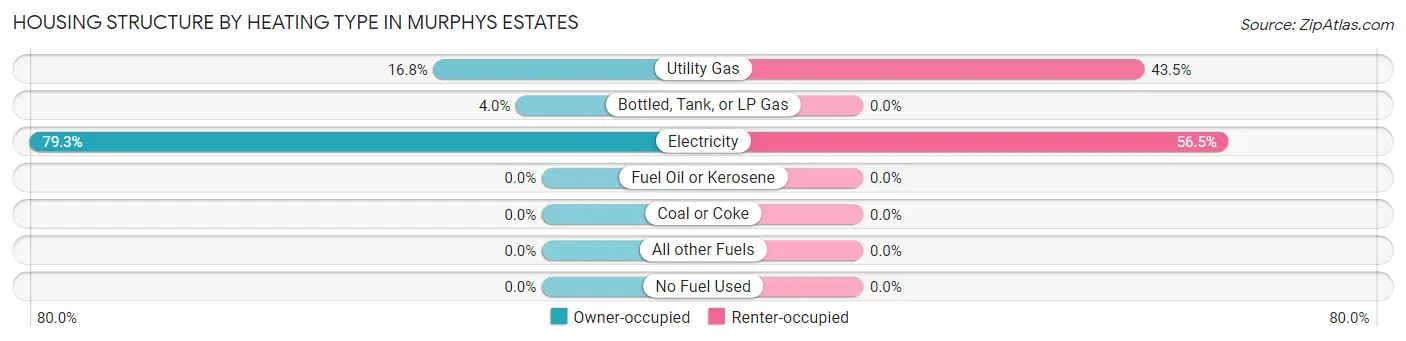
| Heating Type | Owner-occupied | Renter-occupied |
| Utility Gas | 63 (16.8%) | 30 (43.5%) |
| Bottled, Tank, or LP Gas | 15 (4.0%) | 0 (0.0%) |
| Electricity | 298 (79.3%) | 39 (56.5%) |
| Fuel Oil or Kerosene | 0 (0.0%) | 0 (0.0%) |
| Coal or Coke | 0 (0.0%) | 0 (0.0%) |
| All other Fuels | 0 (0.0%) | 0 (0.0%) |
| No Fuel Used | 0 (0.0%) | 0 (0.0%) |
| Total | 376 (100.0%) | 69 (100.0%) |
Household Vehicle Usage in Murphys Estates
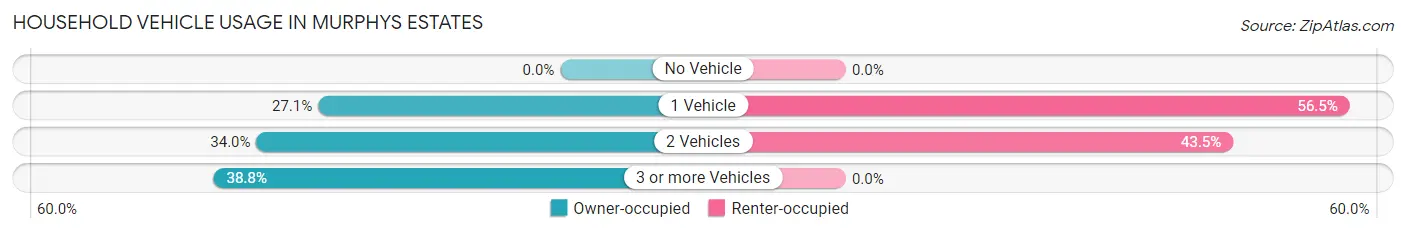
| Vehicles per Household | Owner-occupied | Renter-occupied |
| No Vehicle | 0 (0.0%) | 0 (0.0%) |
| 1 Vehicle | 102 (27.1%) | 39 (56.5%) |
| 2 Vehicles | 128 (34.0%) | 30 (43.5%) |
| 3 or more Vehicles | 146 (38.8%) | 0 (0.0%) |
| Total | 376 (100.0%) | 69 (100.0%) |
Real Estate & Mortgages in Murphys Estates
Real Estate and Mortgage Overview in Murphys Estates
| Characteristic | Without Mortgage | With Mortgage |
| Housing Units | 164 | 212 |
| Median Property Value | $58,400 | $166,100 |
| Median Household Income | $42,000 | $51 |
| Monthly Housing Costs | $451 | $17 |
| Real Estate Taxes | $276 | $0 |
Property Value by Mortgage Status in Murphys Estates
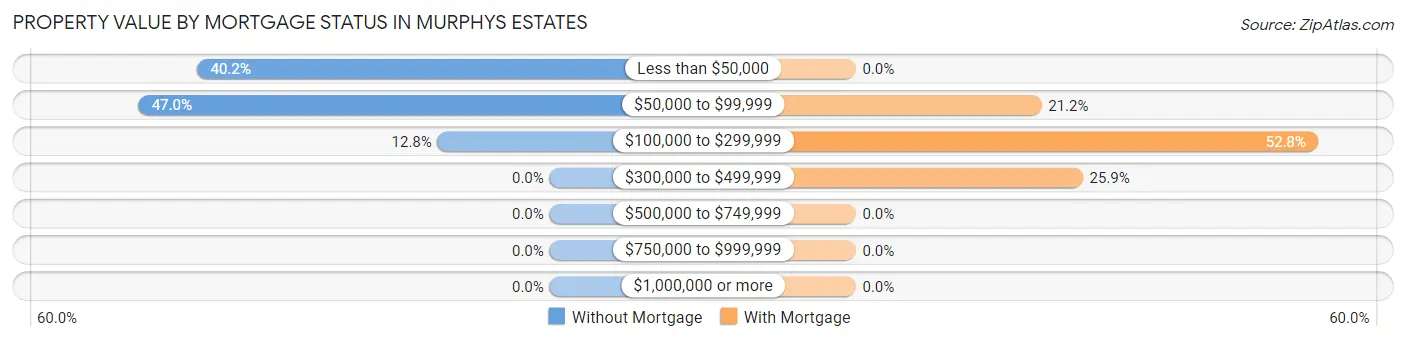
| Property Value | Without Mortgage | With Mortgage |
| Less than $50,000 | 66 (40.2%) | 0 (0.0%) |
| $50,000 to $99,999 | 77 (46.9%) | 45 (21.2%) |
| $100,000 to $299,999 | 21 (12.8%) | 112 (52.8%) |
| $300,000 to $499,999 | 0 (0.0%) | 55 (25.9%) |
| $500,000 to $749,999 | 0 (0.0%) | 0 (0.0%) |
| $750,000 to $999,999 | 0 (0.0%) | 0 (0.0%) |
| $1,000,000 or more | 0 (0.0%) | 0 (0.0%) |
| Total | 164 (100.0%) | 212 (100.0%) |
Household Income by Mortgage Status in Murphys Estates
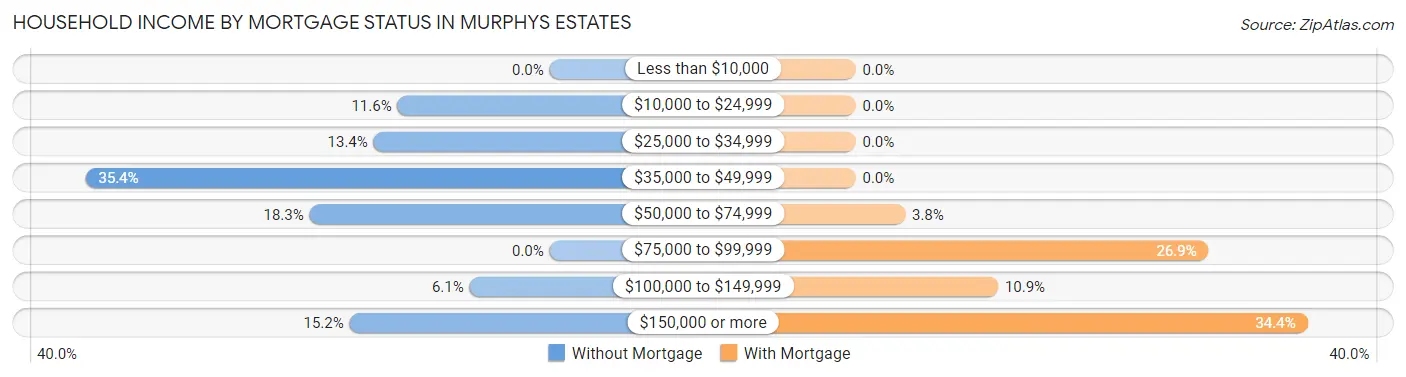
| Household Income | Without Mortgage | With Mortgage |
| Less than $10,000 | 0 (0.0%) | 0 (0.0%) |
| $10,000 to $24,999 | 19 (11.6%) | 0 (0.0%) |
| $25,000 to $34,999 | 22 (13.4%) | 0 (0.0%) |
| $35,000 to $49,999 | 58 (35.4%) | 0 (0.0%) |
| $50,000 to $74,999 | 30 (18.3%) | 8 (3.8%) |
| $75,000 to $99,999 | 0 (0.0%) | 57 (26.9%) |
| $100,000 to $149,999 | 10 (6.1%) | 23 (10.8%) |
| $150,000 or more | 25 (15.2%) | 73 (34.4%) |
| Total | 164 (100.0%) | 212 (100.0%) |
Property Value to Household Income Ratio in Murphys Estates
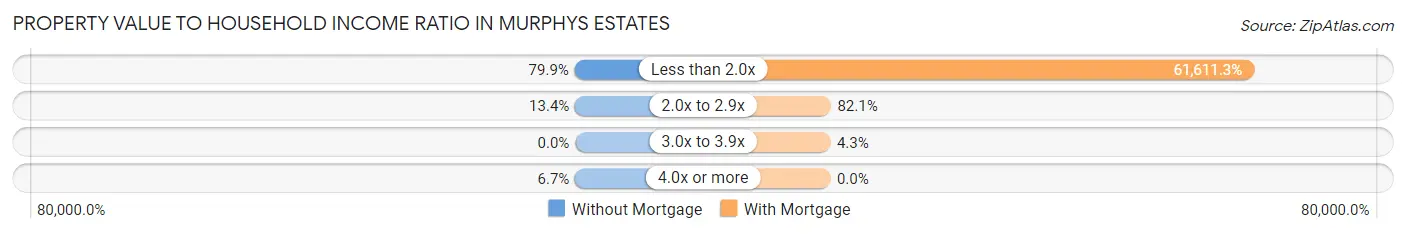
| Value-to-Income Ratio | Without Mortgage | With Mortgage |
| Less than 2.0x | 131 (79.9%) | 130,616 (61,611.3%) |
| 2.0x to 2.9x | 22 (13.4%) | 174 (82.1%) |
| 3.0x to 3.9x | 0 (0.0%) | 9 (4.3%) |
| 4.0x or more | 11 (6.7%) | 0 (0.0%) |
| Total | 164 (100.0%) | 212 (100.0%) |
Real Estate Taxes by Mortgage Status in Murphys Estates
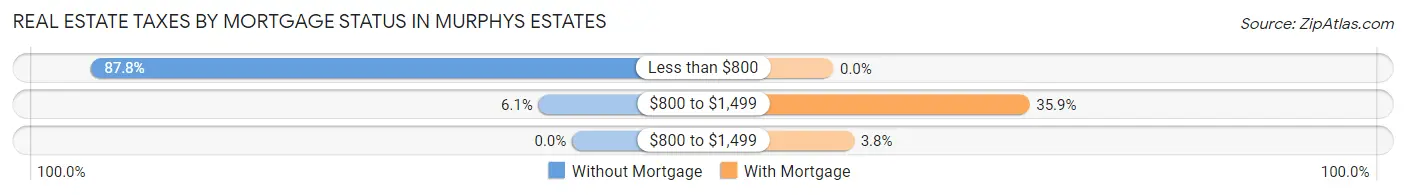
| Property Taxes | Without Mortgage | With Mortgage |
| Less than $800 | 144 (87.8%) | 0 (0.0%) |
| $800 to $1,499 | 10 (6.1%) | 76 (35.8%) |
| $800 to $1,499 | 0 (0.0%) | 8 (3.8%) |
| Total | 164 (100.0%) | 212 (100.0%) |
Health & Disability in Murphys Estates
Health Insurance Coverage by Age in Murphys Estates
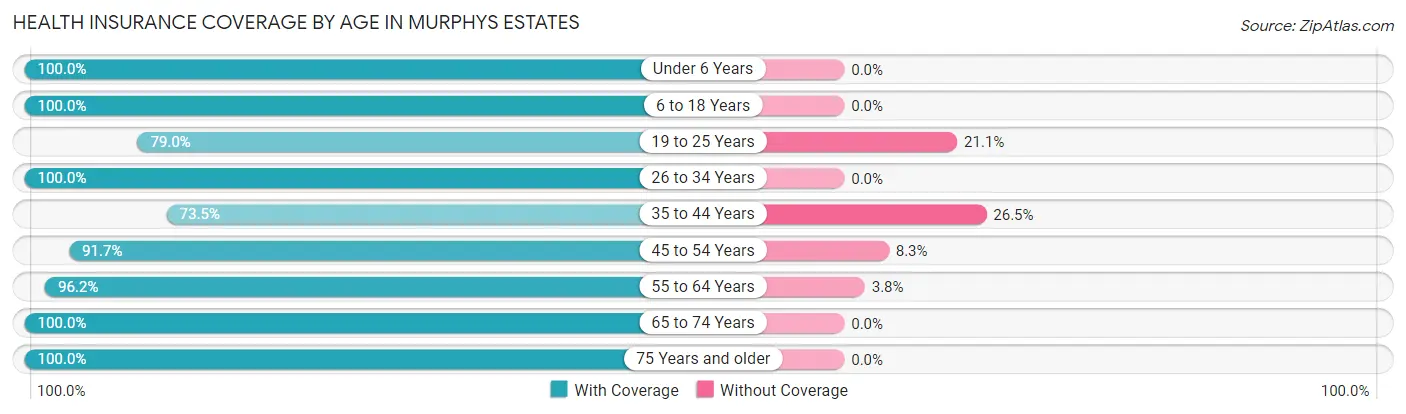
| Age Bracket | With Coverage | Without Coverage |
| Under 6 Years | 62 (100.0%) | 0 (0.0%) |
| 6 to 18 Years | 372 (100.0%) | 0 (0.0%) |
| 19 to 25 Years | 120 (78.9%) | 32 (21.0%) |
| 26 to 34 Years | 111 (100.0%) | 0 (0.0%) |
| 35 to 44 Years | 136 (73.5%) | 49 (26.5%) |
| 45 to 54 Years | 254 (91.7%) | 23 (8.3%) |
| 55 to 64 Years | 151 (96.2%) | 6 (3.8%) |
| 65 to 74 Years | 72 (100.0%) | 0 (0.0%) |
| 75 Years and older | 89 (100.0%) | 0 (0.0%) |
| Total | 1,367 (92.5%) | 110 (7.4%) |
Health Insurance Coverage by Citizenship Status in Murphys Estates
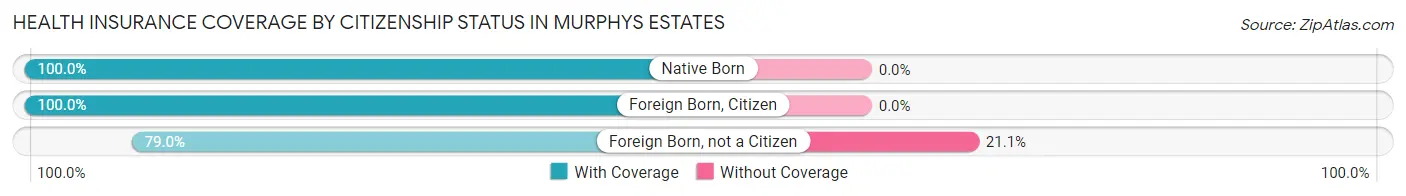
| Citizenship Status | With Coverage | Without Coverage |
| Native Born | 62 (100.0%) | 0 (0.0%) |
| Foreign Born, Citizen | 372 (100.0%) | 0 (0.0%) |
| Foreign Born, not a Citizen | 120 (78.9%) | 32 (21.0%) |
Health Insurance Coverage by Household Income in Murphys Estates
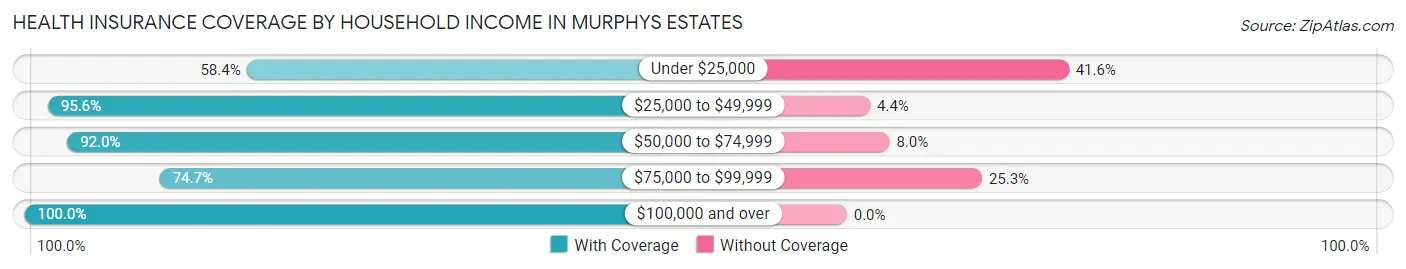
| Household Income | With Coverage | Without Coverage |
| Under $25,000 | 52 (58.4%) | 37 (41.6%) |
| $25,000 to $49,999 | 351 (95.6%) | 16 (4.4%) |
| $50,000 to $74,999 | 426 (92.0%) | 37 (8.0%) |
| $75,000 to $99,999 | 59 (74.7%) | 20 (25.3%) |
| $100,000 and over | 479 (100.0%) | 0 (0.0%) |
Public vs Private Health Insurance Coverage by Age in Murphys Estates
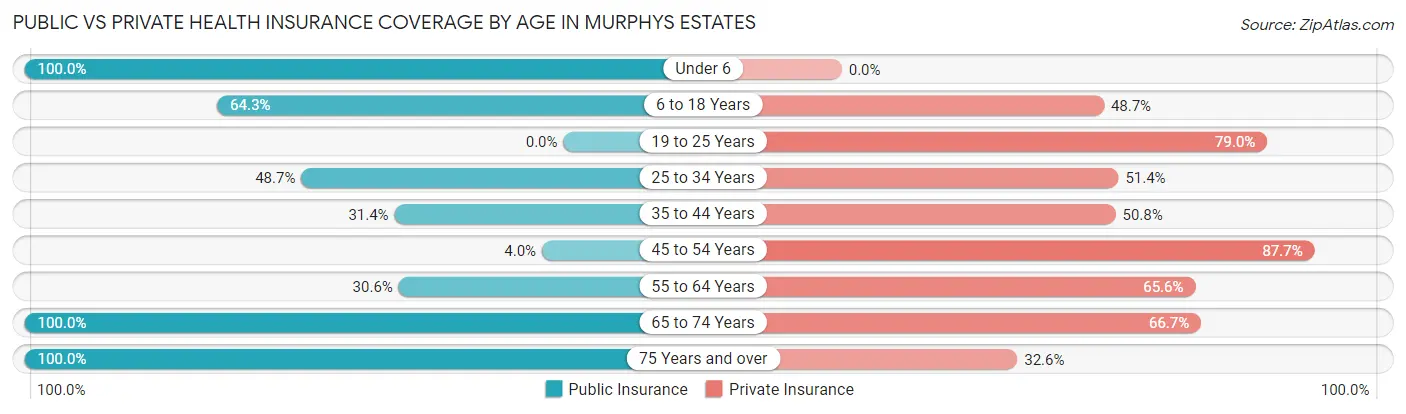
| Age Bracket | Public Insurance | Private Insurance |
| Under 6 | 62 (100.0%) | 0 (0.0%) |
| 6 to 18 Years | 239 (64.2%) | 181 (48.7%) |
| 19 to 25 Years | 0 (0.0%) | 120 (78.9%) |
| 25 to 34 Years | 54 (48.6%) | 57 (51.3%) |
| 35 to 44 Years | 58 (31.4%) | 94 (50.8%) |
| 45 to 54 Years | 11 (4.0%) | 243 (87.7%) |
| 55 to 64 Years | 48 (30.6%) | 103 (65.6%) |
| 65 to 74 Years | 72 (100.0%) | 48 (66.7%) |
| 75 Years and over | 89 (100.0%) | 29 (32.6%) |
| Total | 633 (42.9%) | 875 (59.2%) |
Disability Status by Sex by Age in Murphys Estates
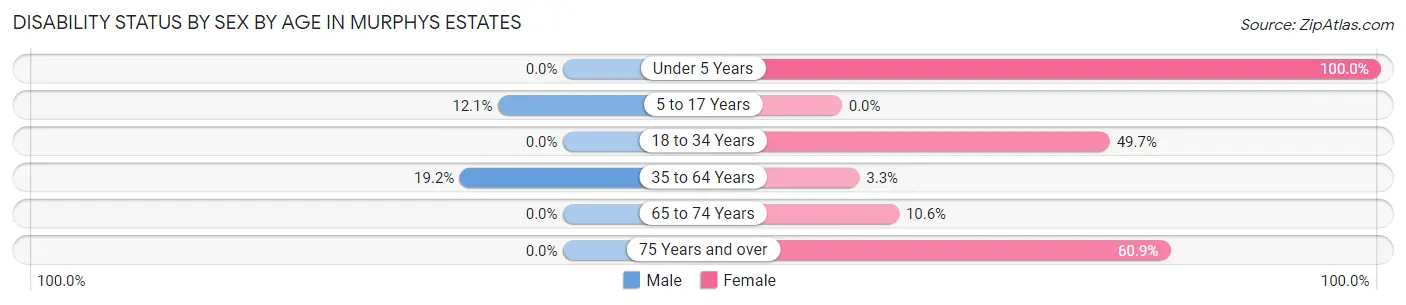
| Age Bracket | Male | Female |
| Under 5 Years | 0 (0.0%) | 11 (100.0%) |
| 5 to 17 Years | 29 (12.1%) | 0 (0.0%) |
| 18 to 34 Years | 0 (0.0%) | 92 (49.7%) |
| 35 to 64 Years | 54 (19.2%) | 11 (3.3%) |
| 65 to 74 Years | 0 (0.0%) | 7 (10.6%) |
| 75 Years and over | 0 (0.0%) | 39 (60.9%) |
Disability Class by Sex by Age in Murphys Estates
Disability Class: Hearing Difficulty
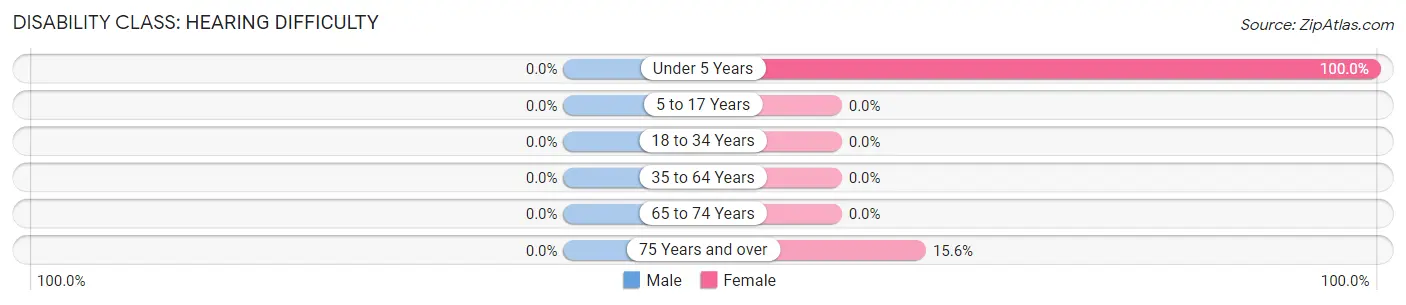
| Age Bracket | Male | Female |
| Under 5 Years | 0 (0.0%) | 11 (100.0%) |
| 5 to 17 Years | 0 (0.0%) | 0 (0.0%) |
| 18 to 34 Years | 0 (0.0%) | 0 (0.0%) |
| 35 to 64 Years | 0 (0.0%) | 0 (0.0%) |
| 65 to 74 Years | 0 (0.0%) | 0 (0.0%) |
| 75 Years and over | 0 (0.0%) | 10 (15.6%) |
Disability Class: Vision Difficulty
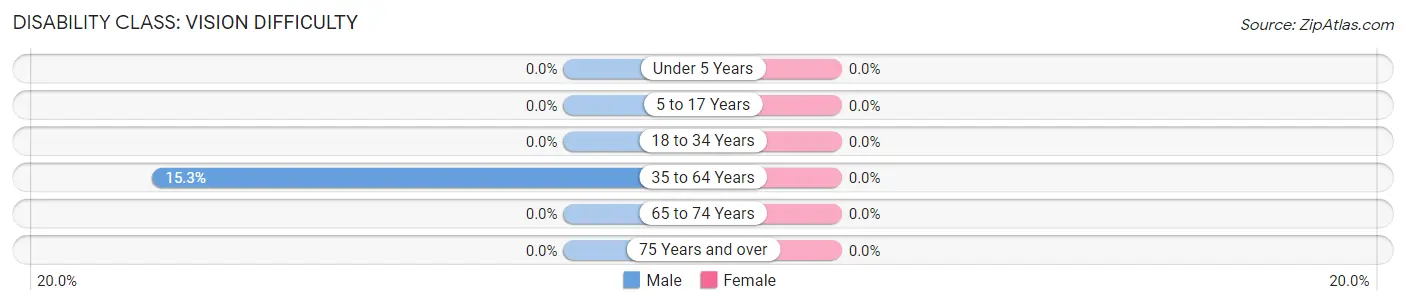
| Age Bracket | Male | Female |
| Under 5 Years | 0 (0.0%) | 0 (0.0%) |
| 5 to 17 Years | 0 (0.0%) | 0 (0.0%) |
| 18 to 34 Years | 0 (0.0%) | 0 (0.0%) |
| 35 to 64 Years | 43 (15.2%) | 0 (0.0%) |
| 65 to 74 Years | 0 (0.0%) | 0 (0.0%) |
| 75 Years and over | 0 (0.0%) | 0 (0.0%) |
Disability Class: Cognitive Difficulty
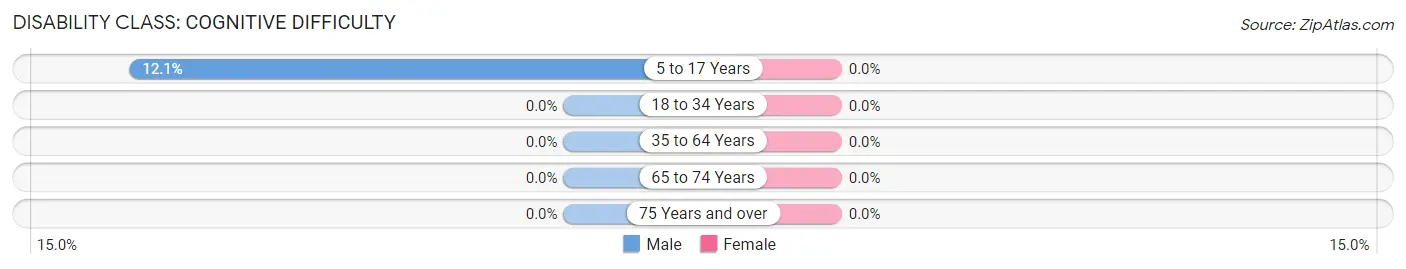
| Age Bracket | Male | Female |
| 5 to 17 Years | 29 (12.1%) | 0 (0.0%) |
| 18 to 34 Years | 0 (0.0%) | 0 (0.0%) |
| 35 to 64 Years | 0 (0.0%) | 0 (0.0%) |
| 65 to 74 Years | 0 (0.0%) | 0 (0.0%) |
| 75 Years and over | 0 (0.0%) | 0 (0.0%) |
Disability Class: Ambulatory Difficulty
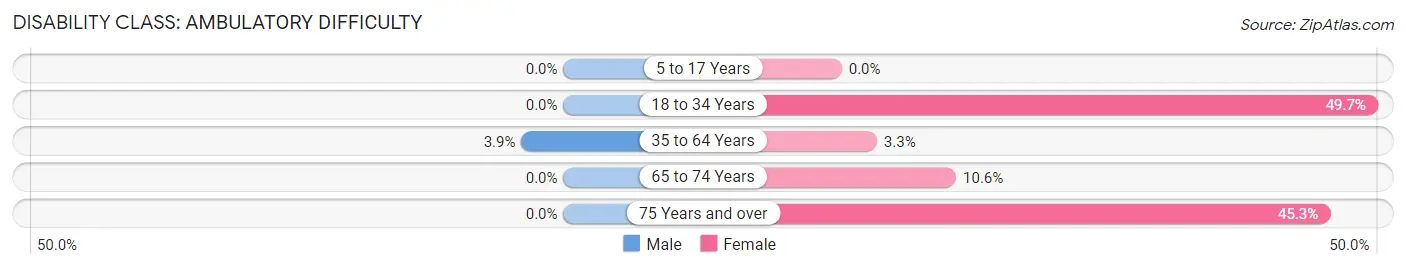
| Age Bracket | Male | Female |
| 5 to 17 Years | 0 (0.0%) | 0 (0.0%) |
| 18 to 34 Years | 0 (0.0%) | 92 (49.7%) |
| 35 to 64 Years | 11 (3.9%) | 11 (3.3%) |
| 65 to 74 Years | 0 (0.0%) | 7 (10.6%) |
| 75 Years and over | 0 (0.0%) | 29 (45.3%) |
Disability Class: Self-Care Difficulty
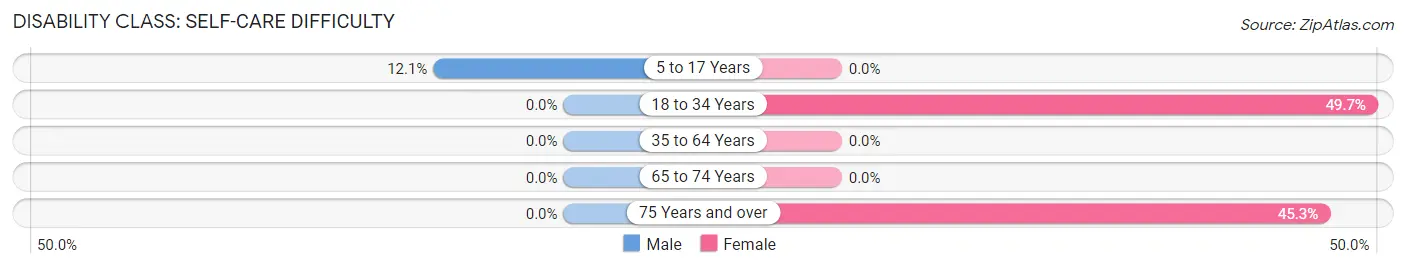
| Age Bracket | Male | Female |
| 5 to 17 Years | 29 (12.1%) | 0 (0.0%) |
| 18 to 34 Years | 0 (0.0%) | 92 (49.7%) |
| 35 to 64 Years | 0 (0.0%) | 0 (0.0%) |
| 65 to 74 Years | 0 (0.0%) | 0 (0.0%) |
| 75 Years and over | 0 (0.0%) | 29 (45.3%) |
Technology Access in Murphys Estates
Computing Device Access in Murphys Estates
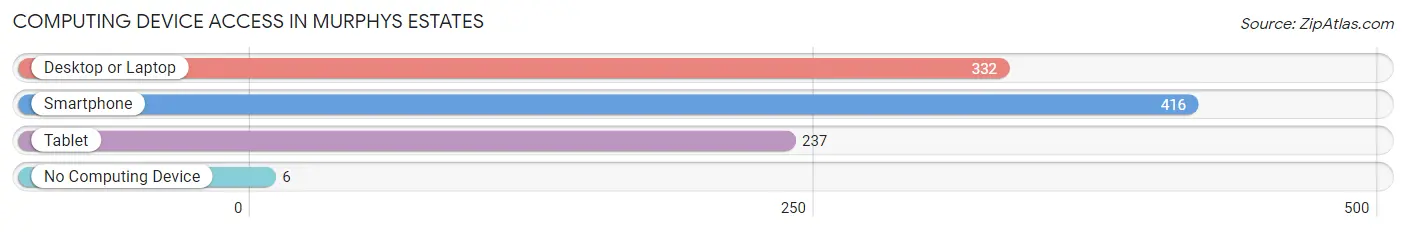
| Device Type | # Households | % Households |
| Desktop or Laptop | 332 | 74.6% |
| Smartphone | 416 | 93.5% |
| Tablet | 237 | 53.3% |
| No Computing Device | 6 | 1.3% |
| Total | 445 | 100.0% |
Internet Access in Murphys Estates
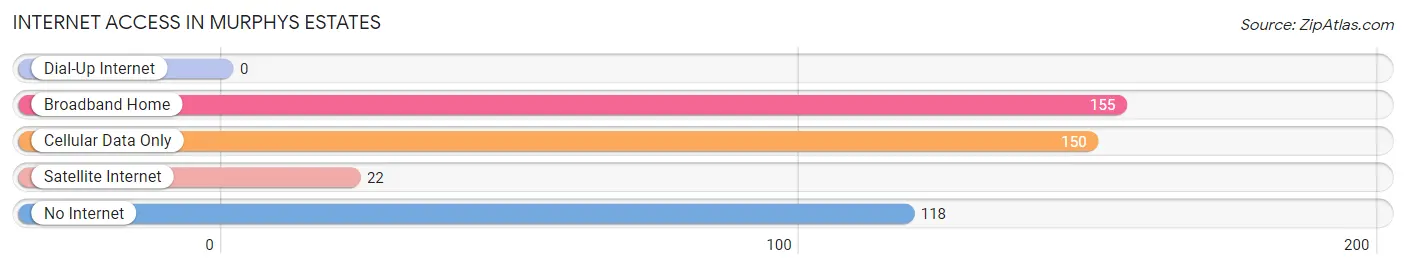
| Internet Type | # Households | % Households |
| Dial-Up Internet | 0 | 0.0% |
| Broadband Home | 155 | 34.8% |
| Cellular Data Only | 150 | 33.7% |
| Satellite Internet | 22 | 4.9% |
| No Internet | 118 | 26.5% |
| Total | 445 | 100.0% |
Murphys Estates Summary
Murphys Estates is a small, unincorporated community located in the Lowcountry region of South Carolina. It is situated in the northern part of Berkeley County, approximately 20 miles northwest of Charleston. The community is bordered by the Francis Marion National Forest to the north and the Santee River to the south.
History
Murphys Estates was founded in the late 1700s by Irish immigrants who had settled in the area. The community was named after the Murphy family, who were among the first settlers. The Murphys were farmers and raised livestock, and the area was known for its fertile soil and abundant wildlife.
In the early 1800s, the community began to grow and develop. A post office was established in 1820, and a school was built in 1825. The community also had a general store, a blacksmith shop, and a sawmill.
In the late 1800s, the community began to decline. The post office closed in 1891, and the school closed in 1895. The population dwindled, and by the early 1900s, the community was nearly abandoned.
In the mid-1900s, the community began to revive. The population slowly increased, and new businesses opened. In the late 1990s, the community was incorporated as Murphys Estates.
Geography
Murphys Estates is located in the Lowcountry region of South Carolina. The community is situated in the northern part of Berkeley County, approximately 20 miles northwest of Charleston. The community is bordered by the Francis Marion National Forest to the north and the Santee River to the south.
The terrain of Murphys Estates is mostly flat, with some rolling hills. The soil is sandy and loamy, and the climate is humid subtropical. The average temperature is around 70 degrees Fahrenheit, and the average annual rainfall is around 50 inches.
Economy
The economy of Murphys Estates is largely based on agriculture. The community is home to several farms, which produce a variety of crops, including corn, soybeans, and cotton. The community also has a few small businesses, including a general store, a gas station, and a restaurant.
Demographics
As of the 2010 census, the population of Murphys Estates was 1,092. The racial makeup of the community was 94.3% White, 3.2% African American, 0.7% Native American, 0.3% Asian, and 1.5% from other races. The median household income was $37,500, and the median home value was $125,000.
Conclusion
Murphys Estates is a small, unincorporated community located in the Lowcountry region of South Carolina. It was founded in the late 1700s by Irish immigrants, and the population has slowly increased over the years. The economy of the community is largely based on agriculture, and the population is mostly White. Murphys Estates is a peaceful, rural community with a rich history and a bright future.
Common Questions
What is Per Capita Income in Murphys Estates?
Per Capita income in Murphys Estates is $27,518.
What is the Median Family Income in Murphys Estates?
Median Family Income in Murphys Estates is $74,695.
What is the Median Household income in Murphys Estates?
Median Household Income in Murphys Estates is $73,750.
What is Inequality or Gini Index in Murphys Estates?
Inequality or Gini Index in Murphys Estates is 0.42.
What is the Total Population of Murphys Estates?
Total Population of Murphys Estates is 1,477.
What is the Total Male Population of Murphys Estates?
Total Male Population of Murphys Estates is 682.
What is the Total Female Population of Murphys Estates?
Total Female Population of Murphys Estates is 795.
What is the Ratio of Males per 100 Females in Murphys Estates?
There are 85.79 Males per 100 Females in Murphys Estates.
What is the Ratio of Females per 100 Males in Murphys Estates?
There are 116.57 Females per 100 Males in Murphys Estates.
What is the Median Population Age in Murphys Estates?
Median Population Age in Murphys Estates is 35.9 Years.
What is the Average Family Size in Murphys Estates
Average Family Size in Murphys Estates is 4.0 People.
What is the Average Household Size in Murphys Estates
Average Household Size in Murphys Estates is 3.3 People.
How Large is the Labor Force in Murphys Estates?
There are 681 People in the Labor Forcein in Murphys Estates.
What is the Percentage of People in the Labor Force in Murphys Estates?
64.6% of People are in the Labor Force in Murphys Estates.
What is the Unemployment Rate in Murphys Estates?
Unemployment Rate in Murphys Estates is 3.7%.