Briarcliffe Acres, SC Map & Demographics
Briarcliffe Acres Map
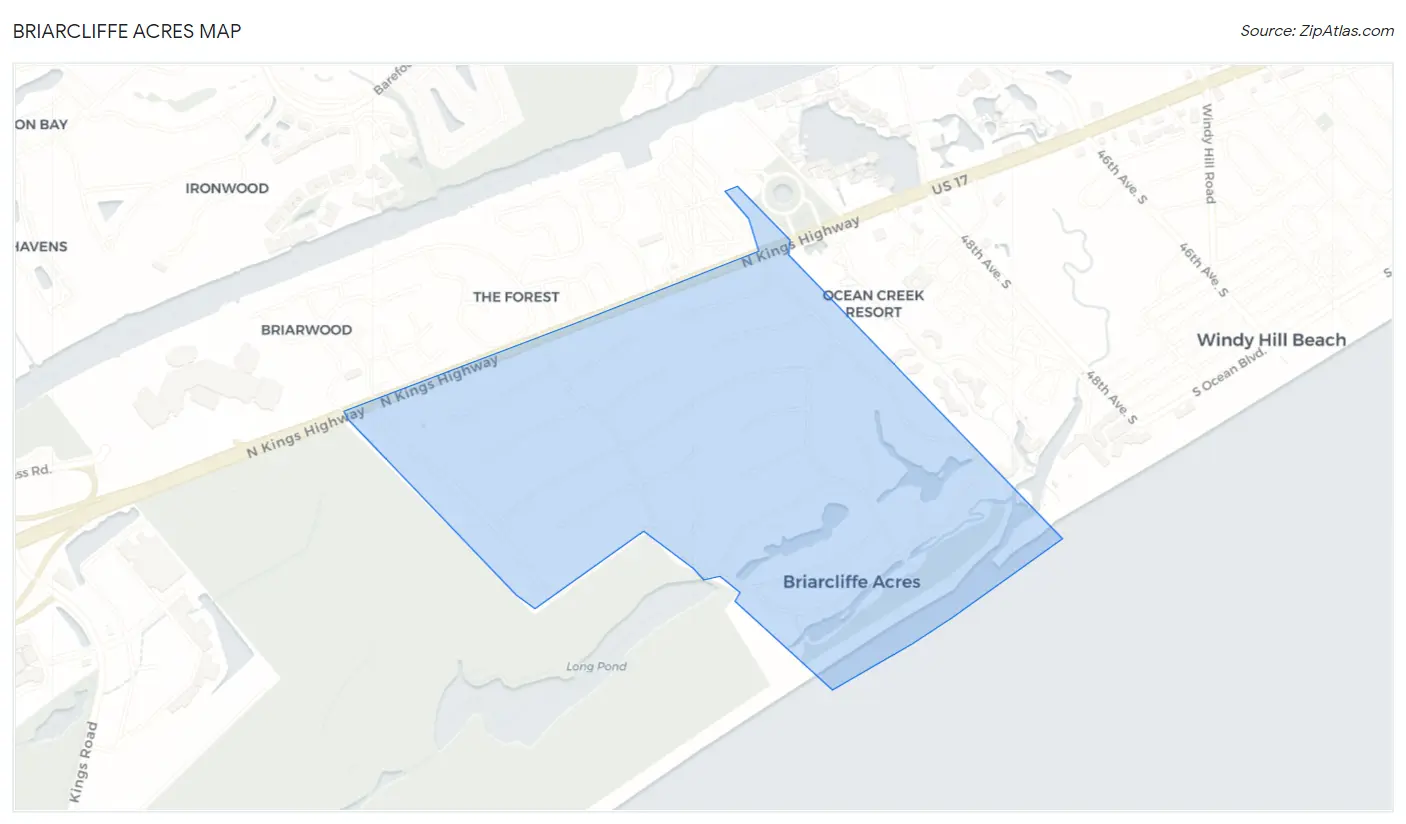
Briarcliffe Acres Overview
$88,697
PER CAPITA INCOME
$150,000
AVG FAMILY INCOME
$134,375
AVG HOUSEHOLD INCOME
$2,883
FAMILY INCOME DEFICIT
0.49
INEQUALITY / GINI INDEX
568
TOTAL POPULATION
312
MALE POPULATION
256
FEMALE POPULATION
121.88
MALES / 100 FEMALES
82.05
FEMALES / 100 MALES
57.8
MEDIAN AGE
3.0
AVG FAMILY SIZE
2.8
AVG HOUSEHOLD SIZE
235
LABOR FORCE [ PEOPLE ]
44.8%
PERCENT IN LABOR FORCE
0.9%
UNEMPLOYMENT RATE
Income in Briarcliffe Acres
Income Overview in Briarcliffe Acres
Per Capita Income in Briarcliffe Acres is $88,697, while median incomes of families and households are $150,000 and $134,375 respectively.
| Characteristic | Number | Measure |
| Per Capita Income | 568 | $88,697 |
| Median Family Income | 158 | $150,000 |
| Mean Family Income | 158 | $268,113 |
| Median Household Income | 205 | $134,375 |
| Mean Household Income | 205 | $243,637 |
| Income Deficit | 158 | $2,883 |
| Wage / Income Gap (%) | 568 | 0.00% |
| Wage / Income Gap ($) | 568 | 100.00¢ per $1 |
| Gini / Inequality Index | 568 | 0.49 |
Earnings by Sex in Briarcliffe Acres
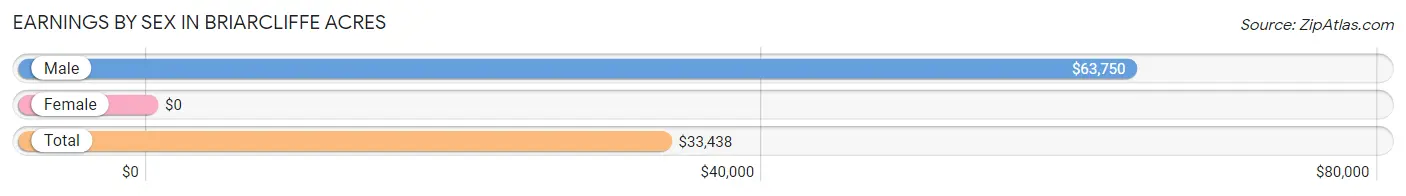
| Sex | Number | Average Earnings |
| Male | 179 (60.3%) | $63,750 |
| Female | 118 (39.7%) | $0 |
| Total | 297 (100.0%) | $33,438 |
Earnings by Sex by Income Bracket in Briarcliffe Acres
The most common earnings brackets in Briarcliffe Acres are $100,000+ for men (59 | 33.0%) and $12,500 to $14,999 for women (34 | 28.8%).
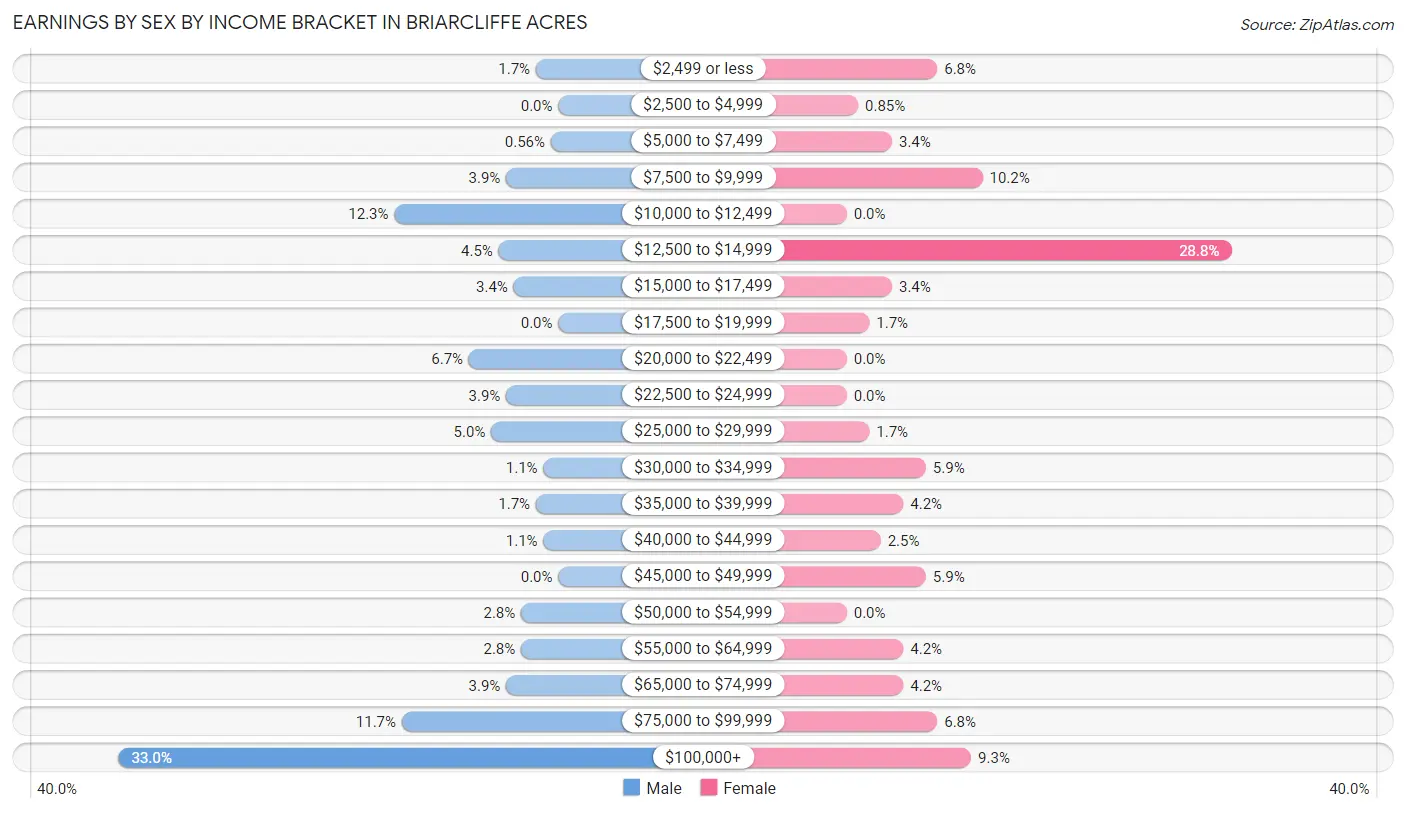
| Income | Male | Female |
| $2,499 or less | 3 (1.7%) | 8 (6.8%) |
| $2,500 to $4,999 | 0 (0.0%) | 1 (0.9%) |
| $5,000 to $7,499 | 1 (0.6%) | 4 (3.4%) |
| $7,500 to $9,999 | 7 (3.9%) | 12 (10.2%) |
| $10,000 to $12,499 | 22 (12.3%) | 0 (0.0%) |
| $12,500 to $14,999 | 8 (4.5%) | 34 (28.8%) |
| $15,000 to $17,499 | 6 (3.4%) | 4 (3.4%) |
| $17,500 to $19,999 | 0 (0.0%) | 2 (1.7%) |
| $20,000 to $22,499 | 12 (6.7%) | 0 (0.0%) |
| $22,500 to $24,999 | 7 (3.9%) | 0 (0.0%) |
| $25,000 to $29,999 | 9 (5.0%) | 2 (1.7%) |
| $30,000 to $34,999 | 2 (1.1%) | 7 (5.9%) |
| $35,000 to $39,999 | 3 (1.7%) | 5 (4.2%) |
| $40,000 to $44,999 | 2 (1.1%) | 3 (2.5%) |
| $45,000 to $49,999 | 0 (0.0%) | 7 (5.9%) |
| $50,000 to $54,999 | 5 (2.8%) | 0 (0.0%) |
| $55,000 to $64,999 | 5 (2.8%) | 5 (4.2%) |
| $65,000 to $74,999 | 7 (3.9%) | 5 (4.2%) |
| $75,000 to $99,999 | 21 (11.7%) | 8 (6.8%) |
| $100,000+ | 59 (33.0%) | 11 (9.3%) |
| Total | 179 (100.0%) | 118 (100.0%) |
Earnings by Sex by Educational Attainment in Briarcliffe Acres
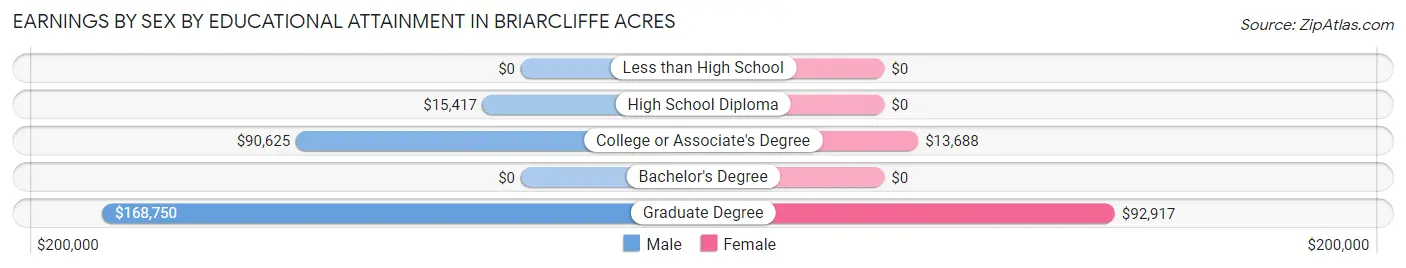
| Educational Attainment | Male Income | Female Income |
| Less than High School | - | - |
| High School Diploma | $15,417 | $0 |
| College or Associate's Degree | $90,625 | $13,688 |
| Bachelor's Degree | - | - |
| Graduate Degree | $168,750 | $92,917 |
| Total | $90,188 | $0 |
Family Income in Briarcliffe Acres
Family Income Brackets in Briarcliffe Acres
According to the Briarcliffe Acres family income data, there are 73 families falling into the $200,000+ income range, which is the most common income bracket and makes up 46.2% of all families.
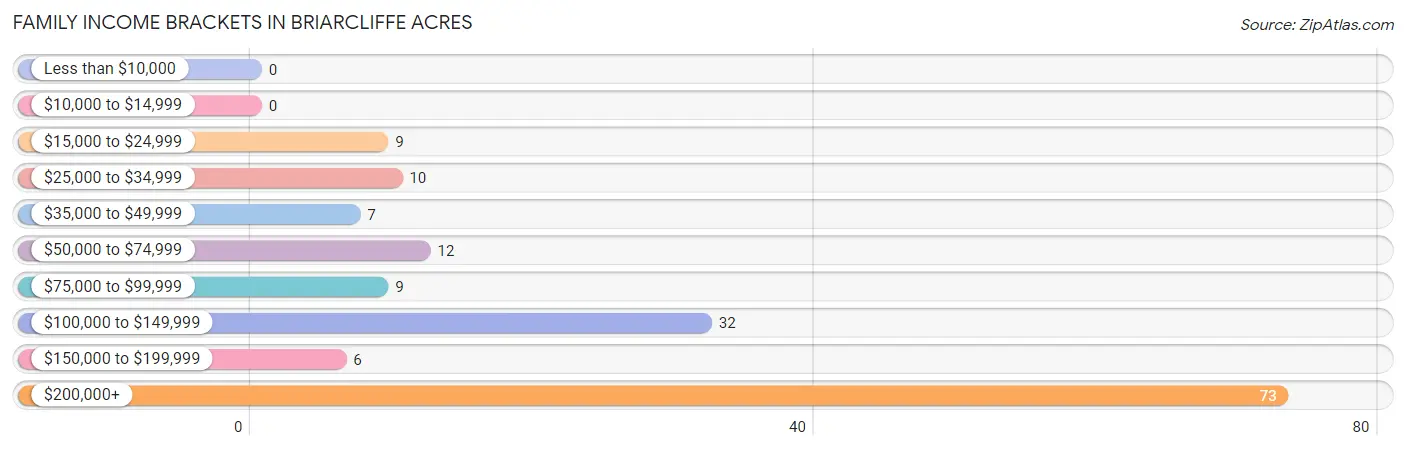
| Income Bracket | # Families | % Families |
| Less than $10,000 | 0 | 0.0% |
| $10,000 to $14,999 | 0 | 0.0% |
| $15,000 to $24,999 | 9 | 5.7% |
| $25,000 to $34,999 | 10 | 6.3% |
| $35,000 to $49,999 | 7 | 4.4% |
| $50,000 to $74,999 | 12 | 7.6% |
| $75,000 to $99,999 | 9 | 5.7% |
| $100,000 to $149,999 | 32 | 20.3% |
| $150,000 to $199,999 | 6 | 3.8% |
| $200,000+ | 73 | 46.2% |
Family Income by Famaliy Size in Briarcliffe Acres
4-person families (19 | 12.0%) account for the highest median family income in Briarcliffe Acres with $250,001 per family, while 2-person families (110 | 69.6%) have the highest median income of $75,000 per family member.
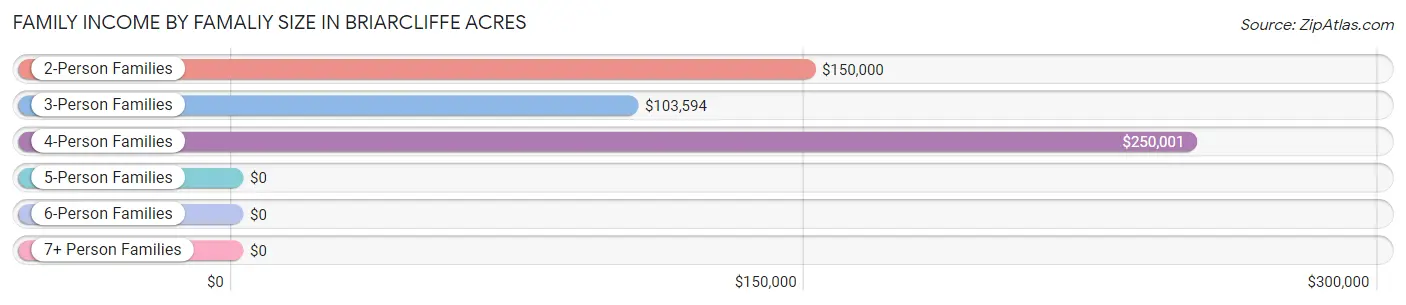
| Income Bracket | # Families | Median Income |
| 2-Person Families | 110 (69.6%) | $150,000 |
| 3-Person Families | 21 (13.3%) | $103,594 |
| 4-Person Families | 19 (12.0%) | $250,001 |
| 5-Person Families | 8 (5.1%) | $0 |
| 6-Person Families | 0 (0.0%) | $0 |
| 7+ Person Families | 0 (0.0%) | $0 |
| Total | 158 (100.0%) | $150,000 |
Family Income by Number of Earners in Briarcliffe Acres
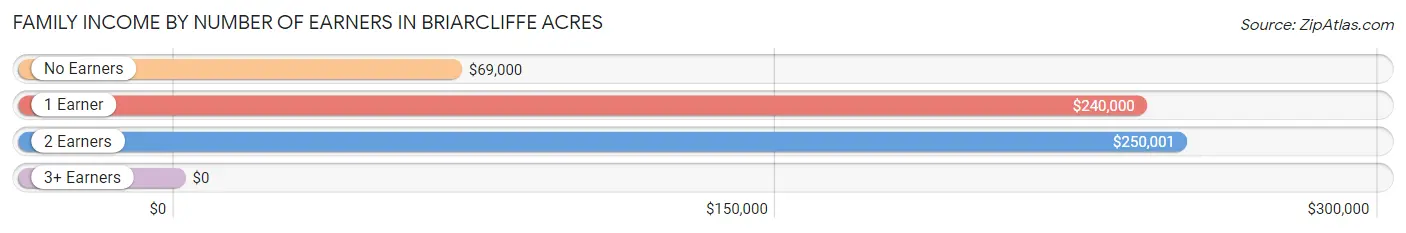
| Number of Earners | # Families | Median Income |
| No Earners | 48 (30.4%) | $69,000 |
| 1 Earner | 40 (25.3%) | $240,000 |
| 2 Earners | 57 (36.1%) | $250,001 |
| 3+ Earners | 13 (8.2%) | $0 |
| Total | 158 (100.0%) | $150,000 |
Household Income in Briarcliffe Acres
Household Income Brackets in Briarcliffe Acres
With 84 households falling in the category, the $200,000+ income range is the most frequent in Briarcliffe Acres, accounting for 41.0% of all households.
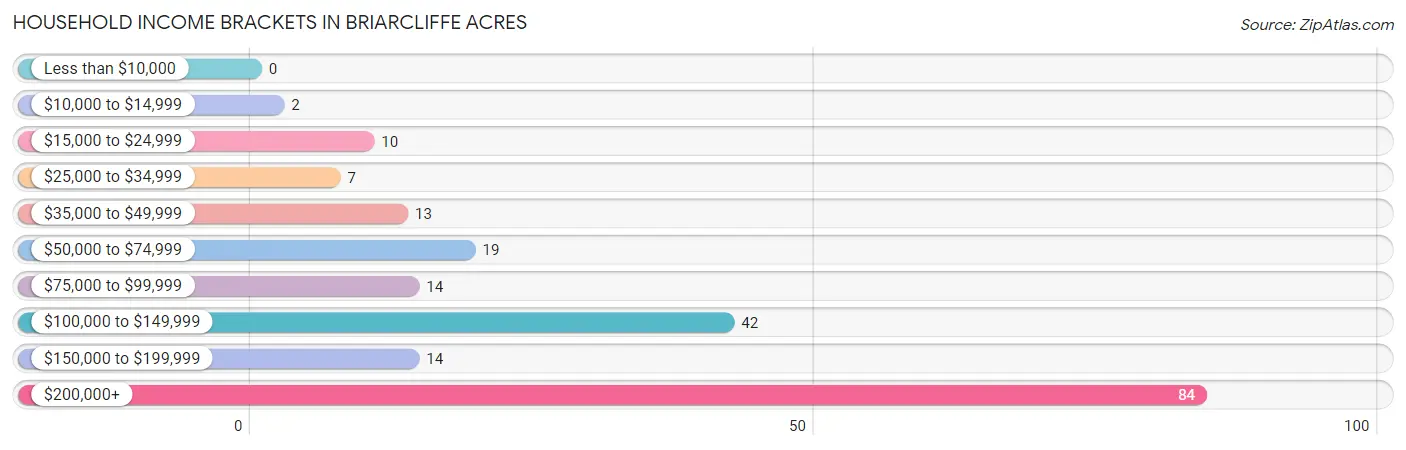
| Income Bracket | # Households | % Households |
| Less than $10,000 | 0 | 0.0% |
| $10,000 to $14,999 | 2 | 1.0% |
| $15,000 to $24,999 | 10 | 4.9% |
| $25,000 to $34,999 | 7 | 3.4% |
| $35,000 to $49,999 | 13 | 6.3% |
| $50,000 to $74,999 | 19 | 9.3% |
| $75,000 to $99,999 | 14 | 6.8% |
| $100,000 to $149,999 | 42 | 20.5% |
| $150,000 to $199,999 | 14 | 6.8% |
| $200,000+ | 84 | 41.0% |
Household Income by Householder Age in Briarcliffe Acres
The median household income in Briarcliffe Acres is $134,375, with the highest median household income of $250,001 found in the 45 to 64 years age bracket for the primary householder. A total of 73 households (35.6%) fall into this category.
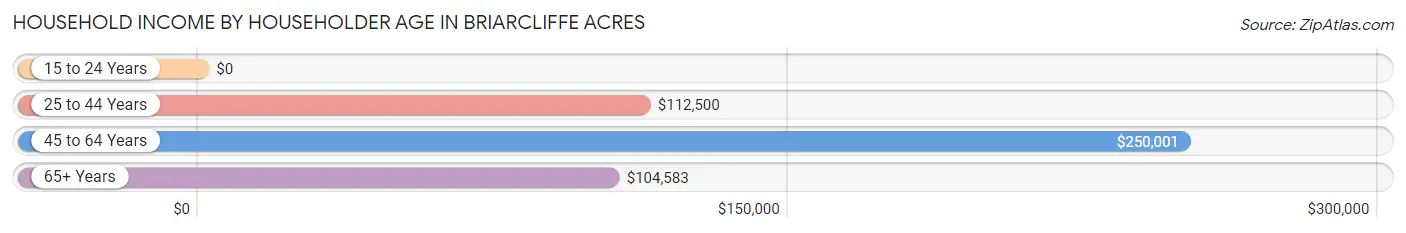
| Income Bracket | # Households | Median Income |
| 15 to 24 Years | 0 (0.0%) | $0 |
| 25 to 44 Years | 14 (6.8%) | $112,500 |
| 45 to 64 Years | 73 (35.6%) | $250,001 |
| 65+ Years | 118 (57.6%) | $104,583 |
| Total | 205 (100.0%) | $134,375 |
Poverty in Briarcliffe Acres
Income Below Poverty by Sex and Age in Briarcliffe Acres
With 5.4% poverty level for males and 12.1% for females among the residents of Briarcliffe Acres, 25 to 34 year old males and 45 to 54 year old females are the most vulnerable to poverty, with 8 males (17.8%) and 14 females (43.8%) in their respective age groups living below the poverty level.
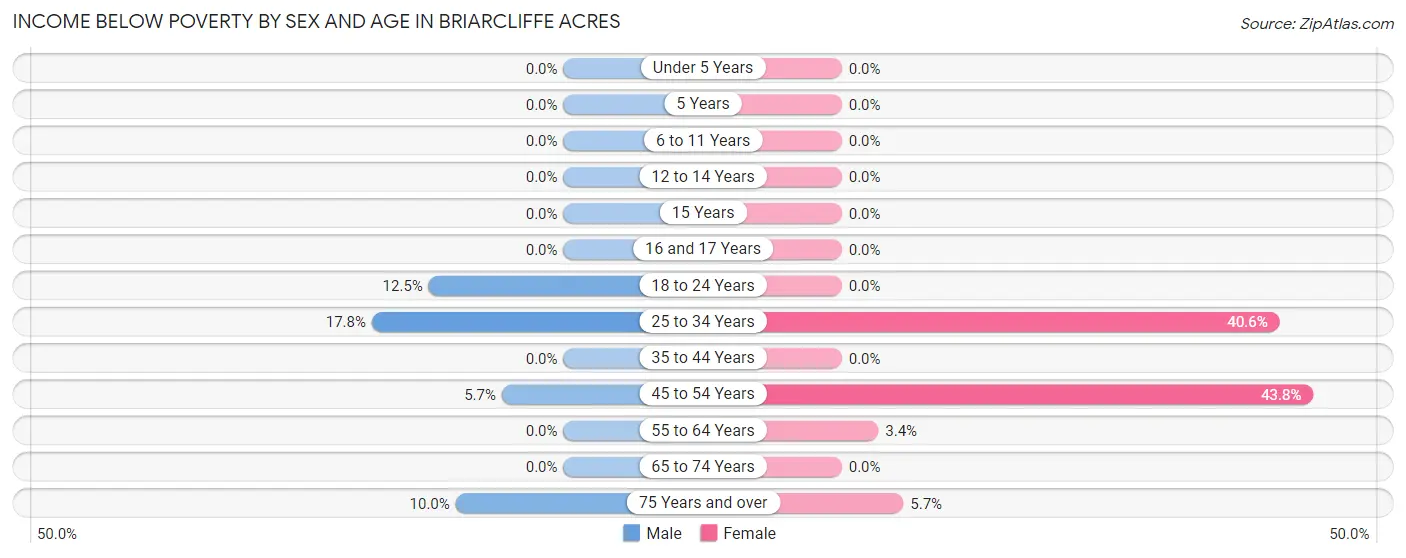
| Age Bracket | Male | Female |
| Under 5 Years | 0 (0.0%) | 0 (0.0%) |
| 5 Years | 0 (0.0%) | 0 (0.0%) |
| 6 to 11 Years | 0 (0.0%) | 0 (0.0%) |
| 12 to 14 Years | 0 (0.0%) | 0 (0.0%) |
| 15 Years | 0 (0.0%) | 0 (0.0%) |
| 16 and 17 Years | 0 (0.0%) | 0 (0.0%) |
| 18 to 24 Years | 3 (12.5%) | 0 (0.0%) |
| 25 to 34 Years | 8 (17.8%) | 13 (40.6%) |
| 35 to 44 Years | 0 (0.0%) | 0 (0.0%) |
| 45 to 54 Years | 2 (5.7%) | 14 (43.8%) |
| 55 to 64 Years | 0 (0.0%) | 2 (3.4%) |
| 65 to 74 Years | 0 (0.0%) | 0 (0.0%) |
| 75 Years and over | 4 (10.0%) | 2 (5.7%) |
| Total | 17 (5.4%) | 31 (12.1%) |
Income Above Poverty by Sex and Age in Briarcliffe Acres
According to the poverty statistics in Briarcliffe Acres, males aged under 5 years and females aged under 5 years are the age groups that are most secure financially, with 100.0% of males and 100.0% of females in these age groups living above the poverty line.
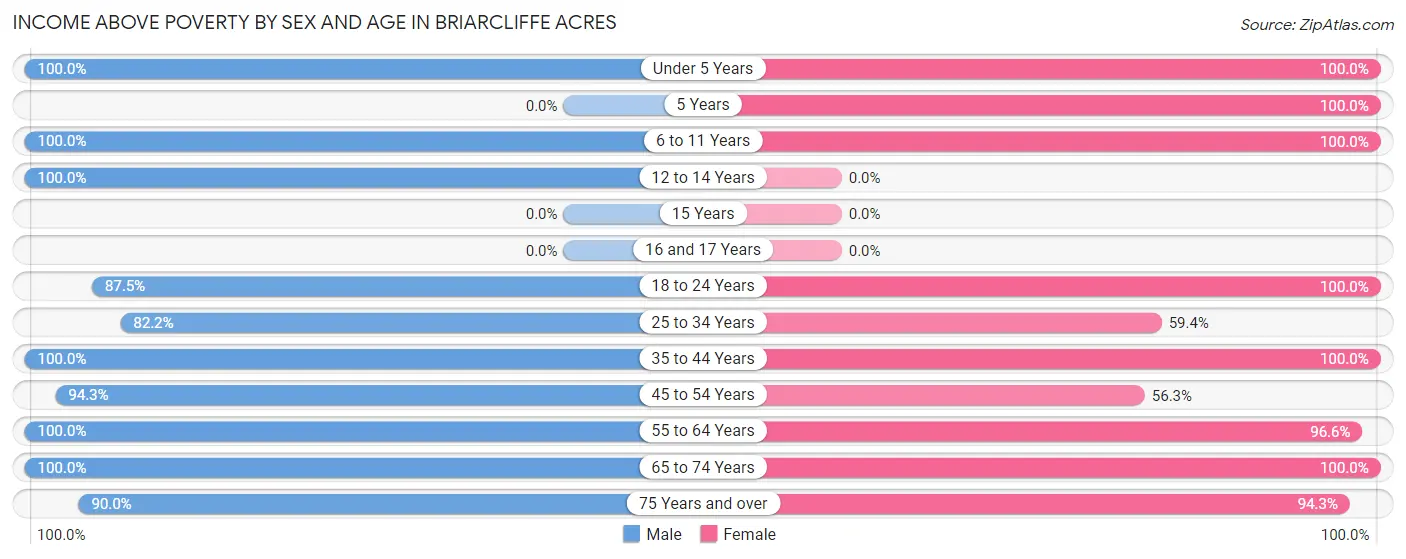
| Age Bracket | Male | Female |
| Under 5 Years | 12 (100.0%) | 4 (100.0%) |
| 5 Years | 0 (0.0%) | 7 (100.0%) |
| 6 to 11 Years | 13 (100.0%) | 3 (100.0%) |
| 12 to 14 Years | 5 (100.0%) | 0 (0.0%) |
| 15 Years | 0 (0.0%) | 0 (0.0%) |
| 16 and 17 Years | 0 (0.0%) | 0 (0.0%) |
| 18 to 24 Years | 21 (87.5%) | 7 (100.0%) |
| 25 to 34 Years | 37 (82.2%) | 19 (59.4%) |
| 35 to 44 Years | 16 (100.0%) | 21 (100.0%) |
| 45 to 54 Years | 33 (94.3%) | 18 (56.2%) |
| 55 to 64 Years | 50 (100.0%) | 57 (96.6%) |
| 65 to 74 Years | 72 (100.0%) | 56 (100.0%) |
| 75 Years and over | 36 (90.0%) | 33 (94.3%) |
| Total | 295 (94.6%) | 225 (87.9%) |
Income Below Poverty Among Married-Couple Families in Briarcliffe Acres
The poverty statistics for married-couple families in Briarcliffe Acres show that 4.5% or 6 of the total 134 families live below the poverty line. Families with no children have the highest poverty rate of 5.5%, comprising of 6 families. On the other hand, families with 1 or 2 children have the lowest poverty rate of 0.0%, which includes 0 families.
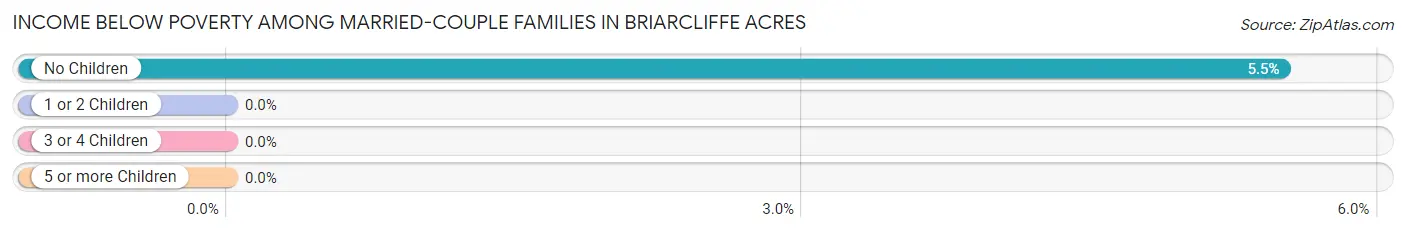
| Children | Above Poverty | Below Poverty |
| No Children | 103 (94.5%) | 6 (5.5%) |
| 1 or 2 Children | 25 (100.0%) | 0 (0.0%) |
| 3 or 4 Children | 0 (0.0%) | 0 (0.0%) |
| 5 or more Children | 0 (0.0%) | 0 (0.0%) |
| Total | 128 (95.5%) | 6 (4.5%) |
Income Below Poverty Among Single-Parent Households in Briarcliffe Acres
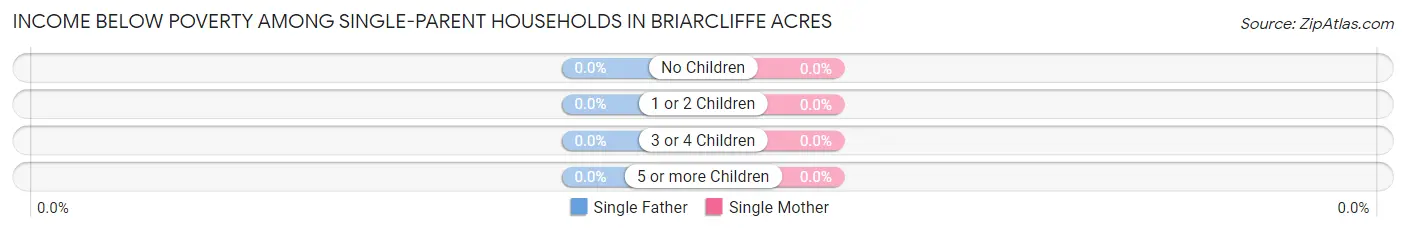
| Children | Single Father | Single Mother |
| No Children | 0 (0.0%) | 0 (0.0%) |
| 1 or 2 Children | 0 (0.0%) | 0 (0.0%) |
| 3 or 4 Children | 0 (0.0%) | 0 (0.0%) |
| 5 or more Children | 0 (0.0%) | 0 (0.0%) |
| Total | 0 (0.0%) | 0 (0.0%) |
Income Below Poverty Among Married-Couple vs Single-Parent Households in Briarcliffe Acres
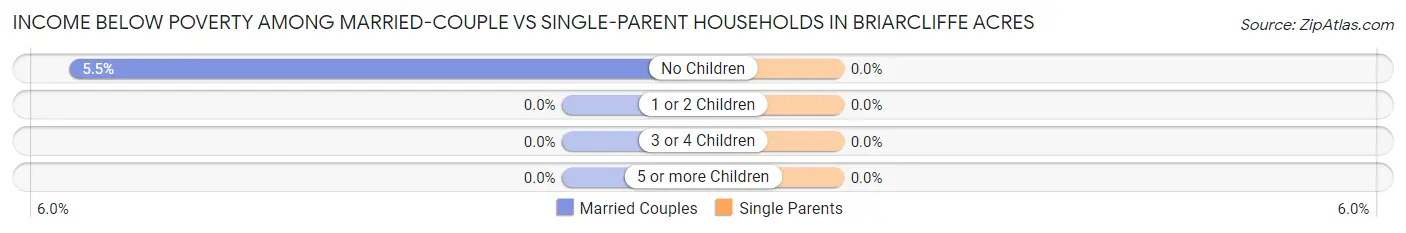
| Children | Married-Couple Families | Single-Parent Households |
| No Children | 6 (5.5%) | 0 (0.0%) |
| 1 or 2 Children | 0 (0.0%) | 0 (0.0%) |
| 3 or 4 Children | 0 (0.0%) | 0 (0.0%) |
| 5 or more Children | 0 (0.0%) | 0 (0.0%) |
| Total | 6 (4.5%) | 0 (0.0%) |
Race in Briarcliffe Acres
The most populous races in Briarcliffe Acres are White / Caucasian (539 | 94.9%), Black / African American (23 | 4.1%), and Hispanic or Latino (11 | 1.9%).
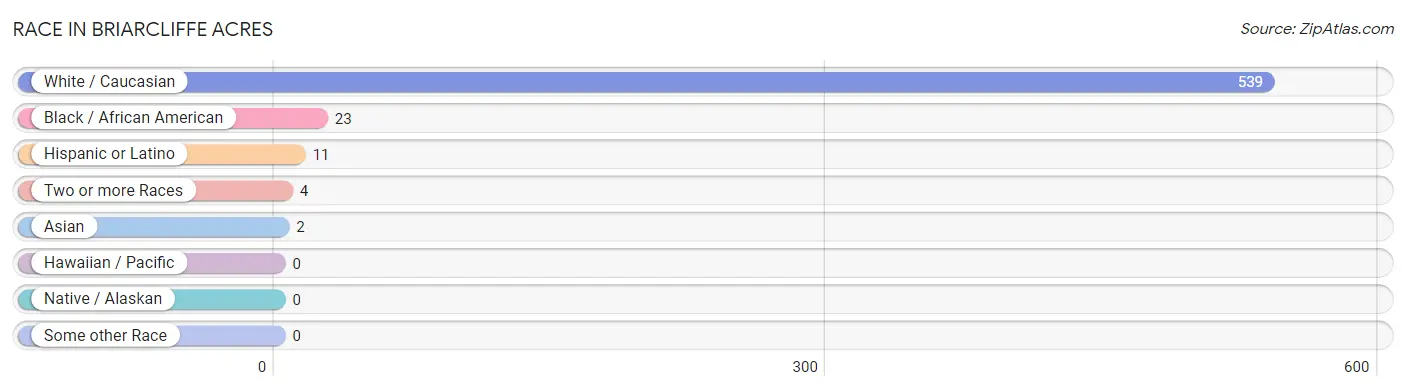
| Race | # Population | % Population |
| Asian | 2 | 0.4% |
| Black / African American | 23 | 4.1% |
| Hawaiian / Pacific | 0 | 0.0% |
| Hispanic or Latino | 11 | 1.9% |
| Native / Alaskan | 0 | 0.0% |
| White / Caucasian | 539 | 94.9% |
| Two or more Races | 4 | 0.7% |
| Some other Race | 0 | 0.0% |
| Total | 568 | 100.0% |
Ancestry in Briarcliffe Acres
The most populous ancestries reported in Briarcliffe Acres are English (164 | 28.9%), Irish (108 | 19.0%), German (104 | 18.3%), Italian (57 | 10.0%), and American (50 | 8.8%), together accounting for 85.0% of all Briarcliffe Acres residents.
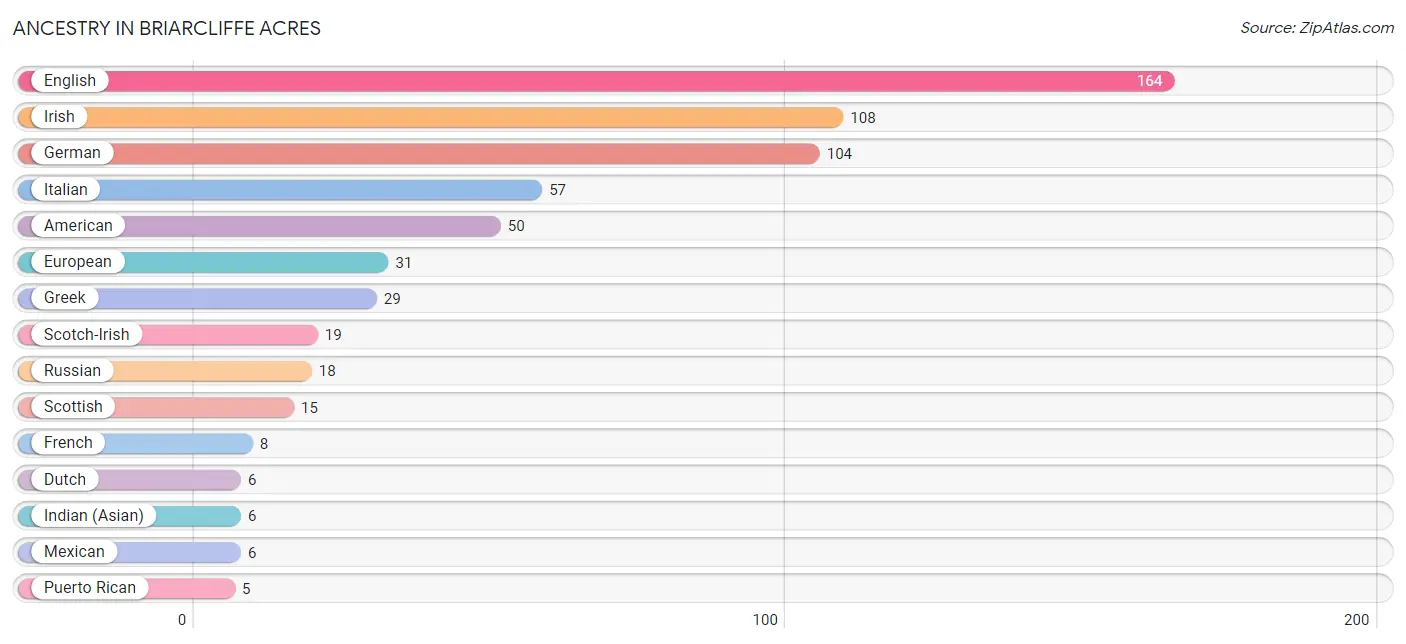
| Ancestry | # Population | % Population |
| American | 50 | 8.8% |
| Armenian | 2 | 0.4% |
| Dutch | 6 | 1.1% |
| English | 164 | 28.9% |
| European | 31 | 5.5% |
| French | 8 | 1.4% |
| German | 104 | 18.3% |
| Greek | 29 | 5.1% |
| Hungarian | 2 | 0.4% |
| Indian (Asian) | 6 | 1.1% |
| Irish | 108 | 19.0% |
| Italian | 57 | 10.0% |
| Lithuanian | 3 | 0.5% |
| Mexican | 6 | 1.1% |
| Polish | 4 | 0.7% |
| Puerto Rican | 5 | 0.9% |
| Russian | 18 | 3.2% |
| Scandinavian | 5 | 0.9% |
| Scotch-Irish | 19 | 3.4% |
| Scottish | 15 | 2.6% |
| Slovene | 2 | 0.4% |
| Swiss | 1 | 0.2% |
| Welsh | 5 | 0.9% | View All 23 Rows |
Immigrants in Briarcliffe Acres
The most numerous immigrant groups reported in Briarcliffe Acres came from Eastern Europe (18 | 3.2%), Europe (18 | 3.2%), Russia (18 | 3.2%), Asia (4 | 0.7%), and Armenia (2 | 0.4%), together accounting for 10.6% of all Briarcliffe Acres residents.
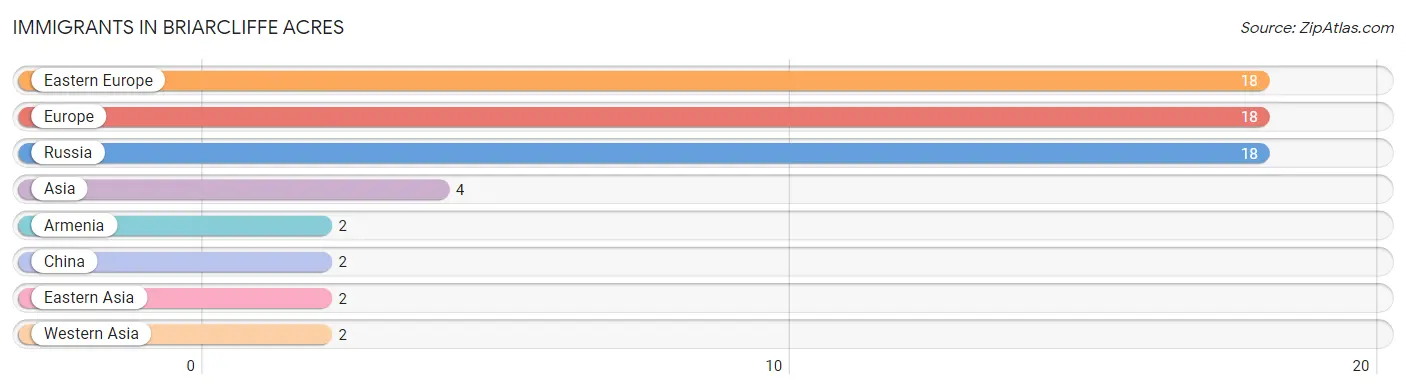
| Immigration Origin | # Population | % Population |
| Armenia | 2 | 0.4% |
| Asia | 4 | 0.7% |
| China | 2 | 0.4% |
| Eastern Asia | 2 | 0.4% |
| Eastern Europe | 18 | 3.2% |
| Europe | 18 | 3.2% |
| Russia | 18 | 3.2% |
| Western Asia | 2 | 0.4% | View All 8 Rows |
Sex and Age in Briarcliffe Acres
Sex and Age in Briarcliffe Acres
The most populous age groups in Briarcliffe Acres are 70 to 74 Years (45 | 14.4%) for men and 60 to 64 Years (41 | 16.0%) for women.
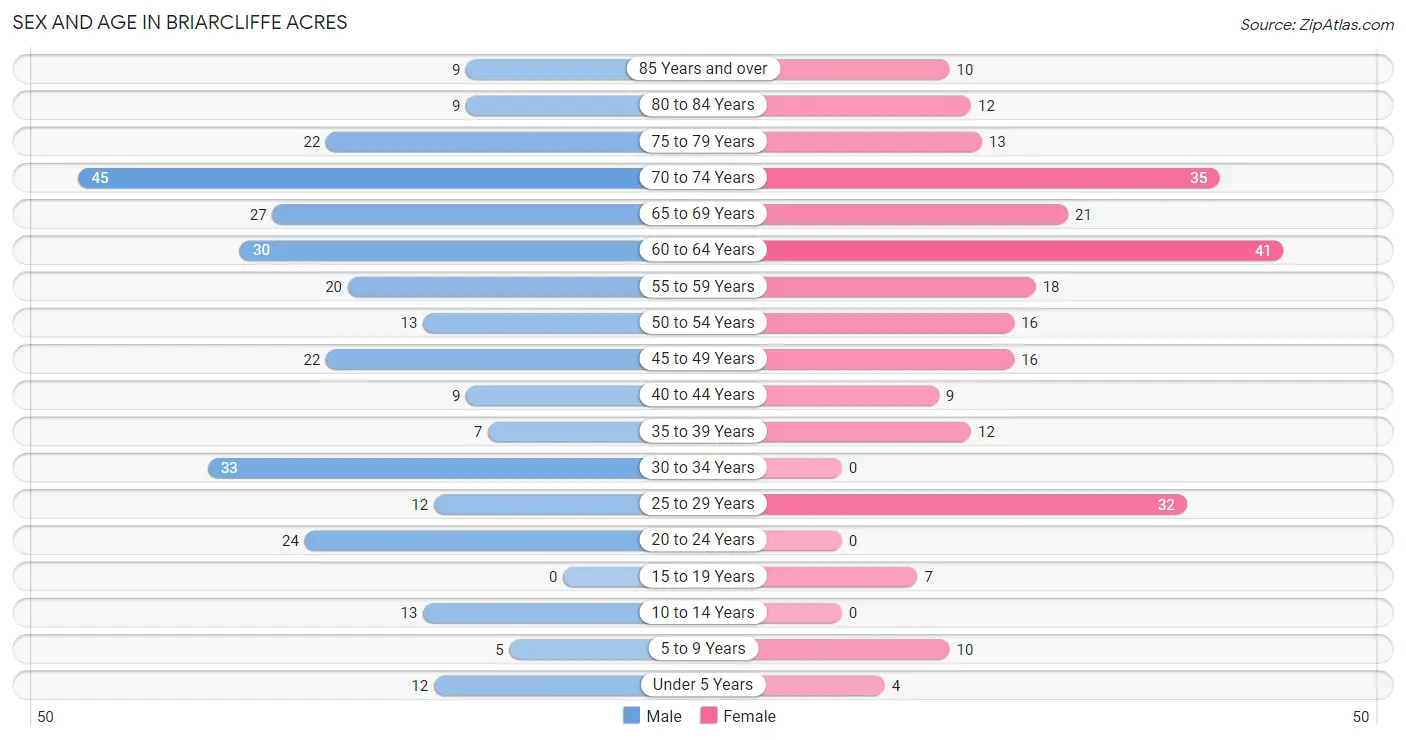
| Age Bracket | Male | Female |
| Under 5 Years | 12 (3.8%) | 4 (1.6%) |
| 5 to 9 Years | 5 (1.6%) | 10 (3.9%) |
| 10 to 14 Years | 13 (4.2%) | 0 (0.0%) |
| 15 to 19 Years | 0 (0.0%) | 7 (2.7%) |
| 20 to 24 Years | 24 (7.7%) | 0 (0.0%) |
| 25 to 29 Years | 12 (3.8%) | 32 (12.5%) |
| 30 to 34 Years | 33 (10.6%) | 0 (0.0%) |
| 35 to 39 Years | 7 (2.2%) | 12 (4.7%) |
| 40 to 44 Years | 9 (2.9%) | 9 (3.5%) |
| 45 to 49 Years | 22 (7.0%) | 16 (6.2%) |
| 50 to 54 Years | 13 (4.2%) | 16 (6.2%) |
| 55 to 59 Years | 20 (6.4%) | 18 (7.0%) |
| 60 to 64 Years | 30 (9.6%) | 41 (16.0%) |
| 65 to 69 Years | 27 (8.6%) | 21 (8.2%) |
| 70 to 74 Years | 45 (14.4%) | 35 (13.7%) |
| 75 to 79 Years | 22 (7.0%) | 13 (5.1%) |
| 80 to 84 Years | 9 (2.9%) | 12 (4.7%) |
| 85 Years and over | 9 (2.9%) | 10 (3.9%) |
| Total | 312 (100.0%) | 256 (100.0%) |
Families and Households in Briarcliffe Acres
Median Family Size in Briarcliffe Acres
The median family size in Briarcliffe Acres is 2.95 persons per family, with single female/mother families (9 | 5.7%) accounting for the largest median family size of 3.78 persons per family. On the other hand, married-couple families (134 | 84.8%) represent the smallest median family size with 2.81 persons per family.
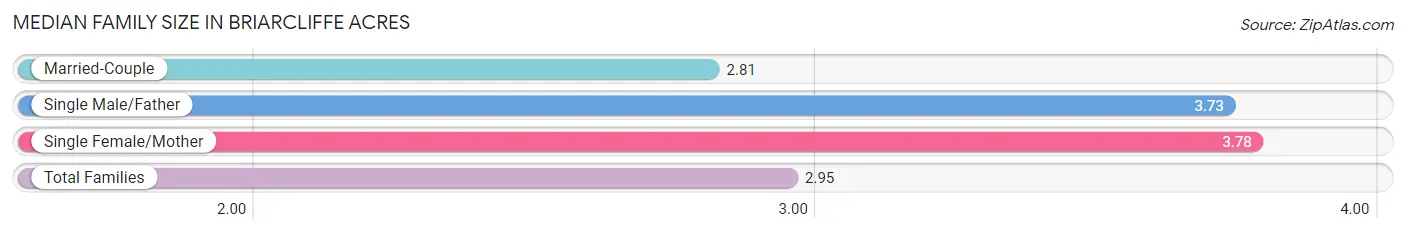
| Family Type | # Families | Family Size |
| Married-Couple | 134 (84.8%) | 2.81 |
| Single Male/Father | 15 (9.5%) | 3.73 |
| Single Female/Mother | 9 (5.7%) | 3.78 |
| Total Families | 158 (100.0%) | 2.95 |
Median Household Size in Briarcliffe Acres
The median household size in Briarcliffe Acres is 2.77 persons per household, with single female/mother households (9 | 4.4%) accounting for the largest median household size of 5 persons per household. non-family households (47 | 22.9%) represent the smallest median household size with 1.83 persons per household.
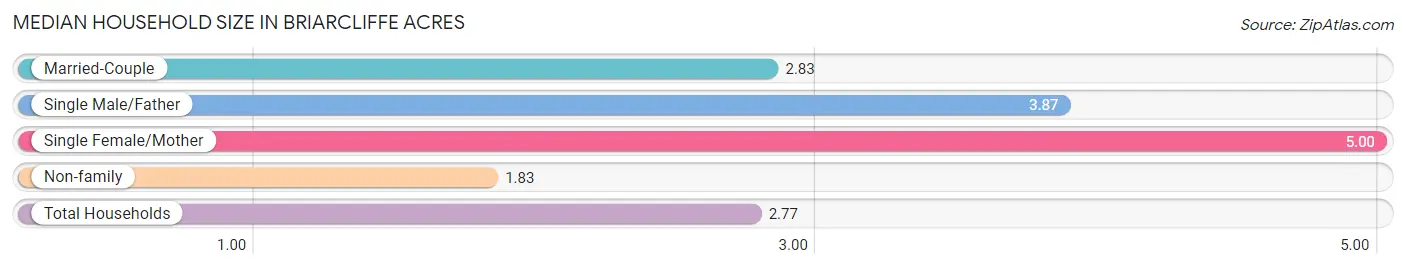
| Household Type | # Households | Household Size |
| Married-Couple | 134 (65.4%) | 2.83 |
| Single Male/Father | 15 (7.3%) | 3.87 |
| Single Female/Mother | 9 (4.4%) | 5.00 |
| Non-family | 47 (22.9%) | 1.83 |
| Total Households | 205 (100.0%) | 2.77 |
Household Size by Marriage Status in Briarcliffe Acres
Out of a total of 205 households in Briarcliffe Acres, 158 (77.1%) are family households, while 47 (22.9%) are nonfamily households. The most numerous type of family households are 2-person households, comprising 103, and the most common type of nonfamily households are 1-person households, comprising 36.
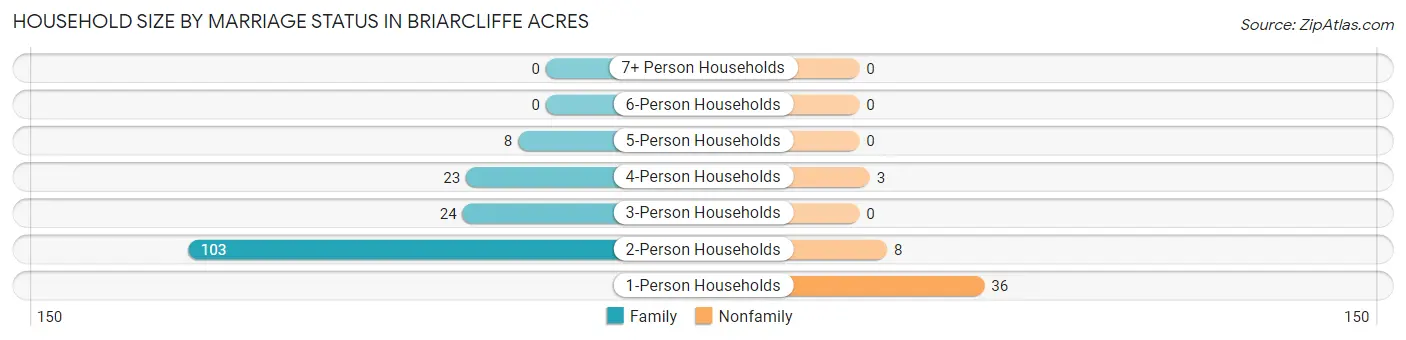
| Household Size | Family Households | Nonfamily Households |
| 1-Person Households | - | 36 (17.6%) |
| 2-Person Households | 103 (50.2%) | 8 (3.9%) |
| 3-Person Households | 24 (11.7%) | 0 (0.0%) |
| 4-Person Households | 23 (11.2%) | 3 (1.5%) |
| 5-Person Households | 8 (3.9%) | 0 (0.0%) |
| 6-Person Households | 0 (0.0%) | 0 (0.0%) |
| 7+ Person Households | 0 (0.0%) | 0 (0.0%) |
| Total | 158 (77.1%) | 47 (22.9%) |
Female Fertility in Briarcliffe Acres
Fertility by Age in Briarcliffe Acres
| Age Bracket | Women with Births | Births / 1,000 Women |
| 15 to 19 years | 0 (0.0%) | 0.0 |
| 20 to 34 years | 0 (0.0%) | 0.0 |
| 35 to 50 years | 0 (0.0%) | 0.0 |
| Total | 0 (0.0%) | 0.0 |
Fertility by Age by Marriage Status in Briarcliffe Acres
| Age Bracket | Married | Unmarried |
| 15 to 19 years | 0 (0.0%) | 0 (0.0%) |
| 20 to 34 years | 0 (0.0%) | 0 (0.0%) |
| 35 to 50 years | 0 (0.0%) | 0 (0.0%) |
| Total | 0 (0.0%) | 0 (0.0%) |
Fertility by Education in Briarcliffe Acres
| Educational Attainment | Women with Births | Births / 1,000 Women |
| Less than High School | 0 (0.0%) | 0.0 |
| High School Diploma | 0 (0.0%) | 0.0 |
| College or Associate's Degree | 0 (0.0%) | 0.0 |
| Bachelor's Degree | 0 (0.0%) | 0.0 |
| Graduate Degree | 0 (0.0%) | 0.0 |
| Total | 0 (0.0%) | 0.0 |
Fertility by Education by Marriage Status in Briarcliffe Acres
| Educational Attainment | Married | Unmarried |
| Less than High School | 0 (0.0%) | 0 (0.0%) |
| High School Diploma | 0 (0.0%) | 0 (0.0%) |
| College or Associate's Degree | 0 (0.0%) | 0 (0.0%) |
| Bachelor's Degree | 0 (0.0%) | 0 (0.0%) |
| Graduate Degree | 0 (0.0%) | 0 (0.0%) |
| Total | 0 (0.0%) | 0 (0.0%) |
Employment Characteristics in Briarcliffe Acres
Employment by Class of Employer in Briarcliffe Acres
Among the 233 employed individuals in Briarcliffe Acres, private company employees (112 | 48.1%), self-employed (incorporated) (41 | 17.6%), and self-employed (not incorporated) (39 | 16.7%) make up the most common classes of employment.
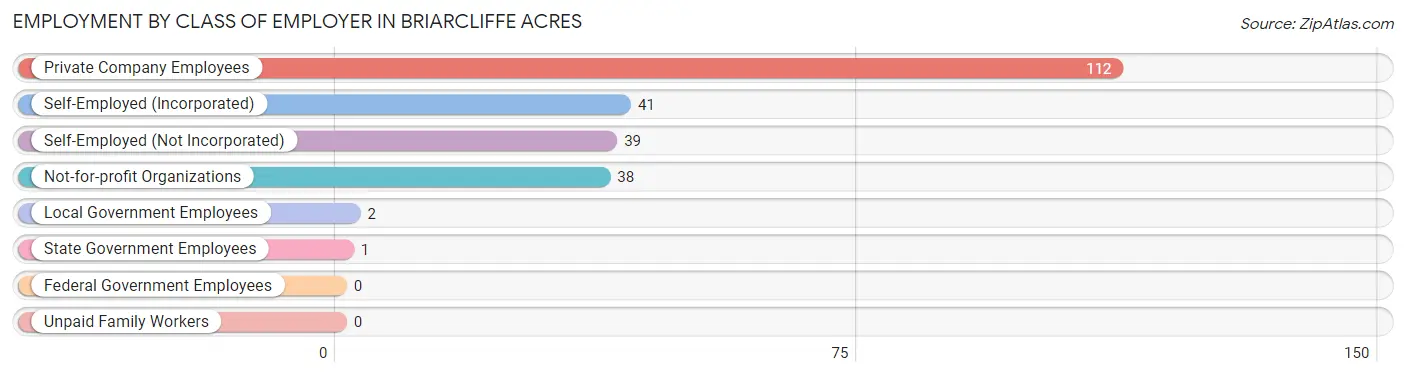
| Employer Class | # Employees | % Employees |
| Private Company Employees | 112 | 48.1% |
| Self-Employed (Incorporated) | 41 | 17.6% |
| Self-Employed (Not Incorporated) | 39 | 16.7% |
| Not-for-profit Organizations | 38 | 16.3% |
| Local Government Employees | 2 | 0.9% |
| State Government Employees | 1 | 0.4% |
| Federal Government Employees | 0 | 0.0% |
| Unpaid Family Workers | 0 | 0.0% |
| Total | 233 | 100.0% |
Employment Status by Age in Briarcliffe Acres
According to the labor force statistics for Briarcliffe Acres, out of the total population over 16 years of age (524), 44.8% or 235 individuals are in the labor force, with 0.9% or 2 of them unemployed. The age group with the highest labor force participation rate is 35 to 44 years, with 91.9% or 34 individuals in the labor force. Within the labor force, the 45 to 54 years age range has the highest percentage of unemployed individuals, with 3.8% or 2 of them being unemployed.
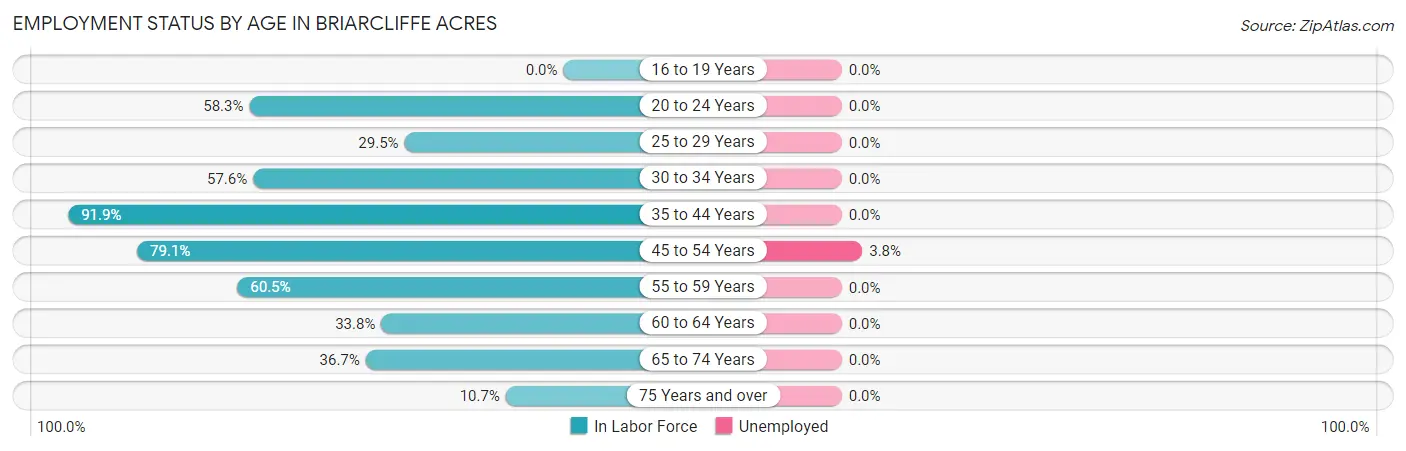
| Age Bracket | In Labor Force | Unemployed |
| 16 to 19 Years | 0 (0.0%) | 0 (0.0%) |
| 20 to 24 Years | 14 (58.3%) | 0 (0.0%) |
| 25 to 29 Years | 13 (29.5%) | 0 (0.0%) |
| 30 to 34 Years | 19 (57.6%) | 0 (0.0%) |
| 35 to 44 Years | 34 (91.9%) | 0 (0.0%) |
| 45 to 54 Years | 53 (79.1%) | 2 (3.8%) |
| 55 to 59 Years | 23 (60.5%) | 0 (0.0%) |
| 60 to 64 Years | 24 (33.8%) | 0 (0.0%) |
| 65 to 74 Years | 47 (36.7%) | 0 (0.0%) |
| 75 Years and over | 8 (10.7%) | 0 (0.0%) |
| Total | 235 (44.8%) | 2 (0.9%) |
Employment Status by Educational Attainment in Briarcliffe Acres
According to labor force statistics for Briarcliffe Acres, 57.2% of individuals (166) out of the total population between 25 and 64 years of age (290) are in the labor force, with 1.2% or 2 of them being unemployed. The group with the highest labor force participation rate are those with the educational attainment of less than high school, with 100.0% or 3 individuals in the labor force. Within the labor force, individuals with college / associate degree education have the highest percentage of unemployment, with 3.6% or 2 of them being unemployed.
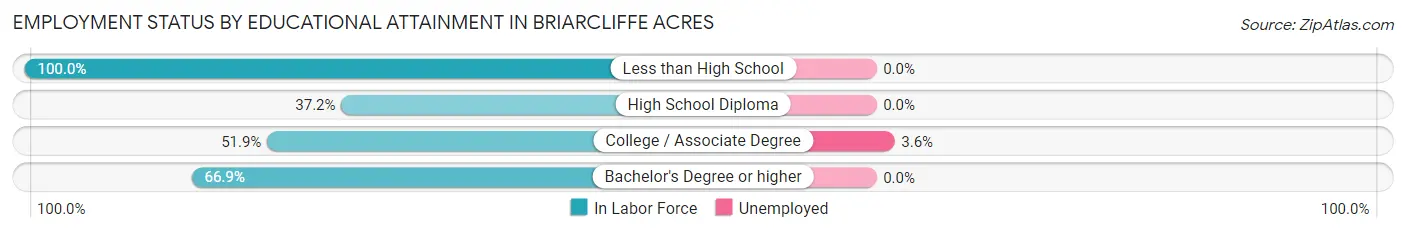
| Educational Attainment | In Labor Force | Unemployed |
| Less than High School | 3 (100.0%) | 0 (0.0%) |
| High School Diploma | 16 (37.2%) | 0 (0.0%) |
| College / Associate Degree | 56 (51.9%) | 4 (3.6%) |
| Bachelor's Degree or higher | 91 (66.9%) | 0 (0.0%) |
| Total | 166 (57.2%) | 3 (1.2%) |
Employment Occupations by Sex in Briarcliffe Acres
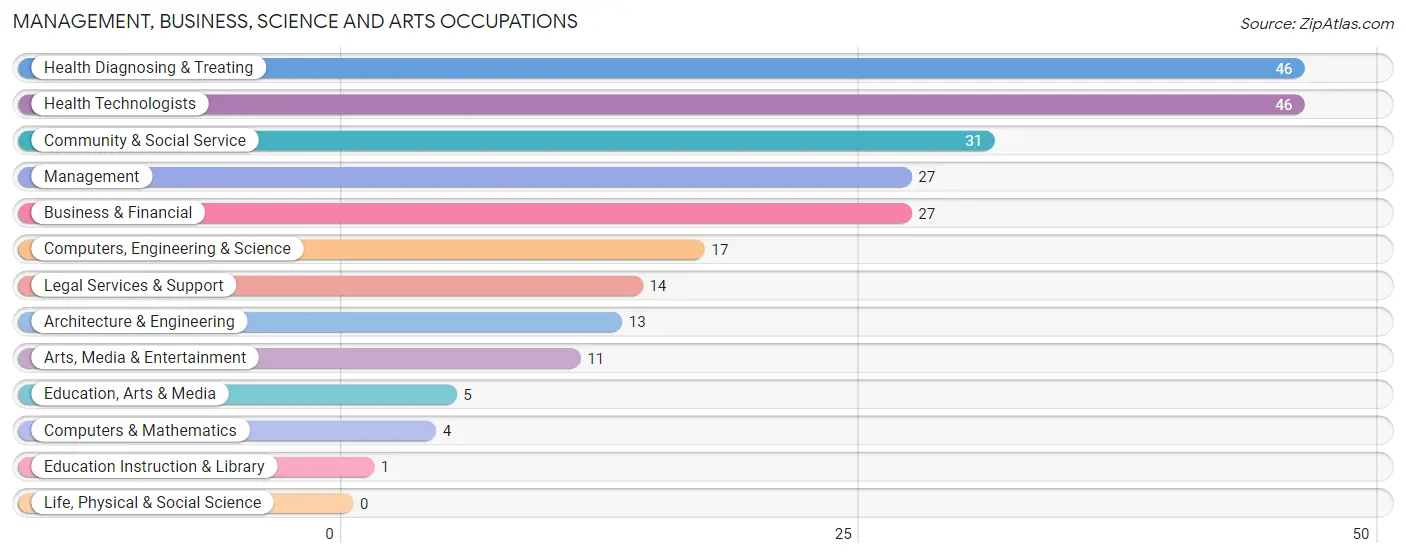
Management, Business, Science and Arts Occupations
The most common Management, Business, Science and Arts occupations in Briarcliffe Acres are Health Diagnosing & Treating (46 | 19.7%), Health Technologists (46 | 19.7%), Community & Social Service (31 | 13.3%), Management (27 | 11.6%), and Business & Financial (27 | 11.6%).
Management, Business, Science and Arts Occupations by Sex
Within the Management, Business, Science and Arts occupations in Briarcliffe Acres, the most male-oriented occupations are Computers, Engineering & Science (100.0%), Computers & Mathematics (100.0%), and Architecture & Engineering (100.0%), while the most female-oriented occupations are Education, Arts & Media (100.0%), Education Instruction & Library (100.0%), and Arts, Media & Entertainment (63.6%).
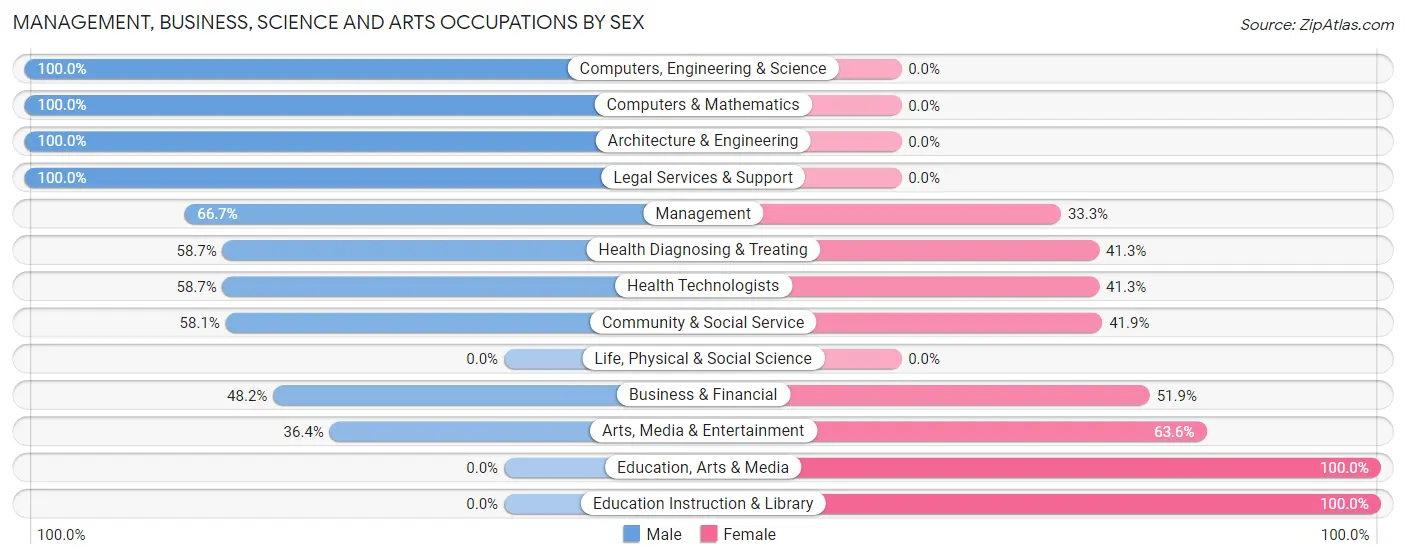
| Occupation | Male | Female |
| Management | 18 (66.7%) | 9 (33.3%) |
| Business & Financial | 13 (48.1%) | 14 (51.8%) |
| Computers, Engineering & Science | 17 (100.0%) | 0 (0.0%) |
| Computers & Mathematics | 4 (100.0%) | 0 (0.0%) |
| Architecture & Engineering | 13 (100.0%) | 0 (0.0%) |
| Life, Physical & Social Science | 0 (0.0%) | 0 (0.0%) |
| Community & Social Service | 18 (58.1%) | 13 (41.9%) |
| Education, Arts & Media | 0 (0.0%) | 5 (100.0%) |
| Legal Services & Support | 14 (100.0%) | 0 (0.0%) |
| Education Instruction & Library | 0 (0.0%) | 1 (100.0%) |
| Arts, Media & Entertainment | 4 (36.4%) | 7 (63.6%) |
| Health Diagnosing & Treating | 27 (58.7%) | 19 (41.3%) |
| Health Technologists | 27 (58.7%) | 19 (41.3%) |
| Total (Category) | 93 (62.8%) | 55 (37.2%) |
| Total (Overall) | 139 (59.7%) | 94 (40.3%) |
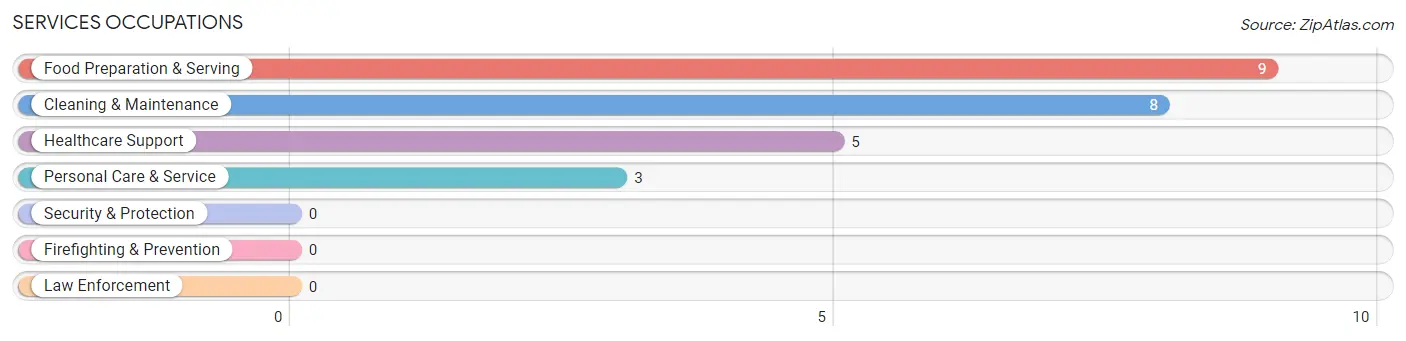
Services Occupations
The most common Services occupations in Briarcliffe Acres are Food Preparation & Serving (9 | 3.9%), Cleaning & Maintenance (8 | 3.4%), Healthcare Support (5 | 2.1%), and Personal Care & Service (3 | 1.3%).
Services Occupations by Sex
Within the Services occupations in Briarcliffe Acres, the most male-oriented occupations are Food Preparation & Serving (100.0%), and Cleaning & Maintenance (100.0%), while the most female-oriented occupations are Healthcare Support (100.0%), and Personal Care & Service (100.0%).
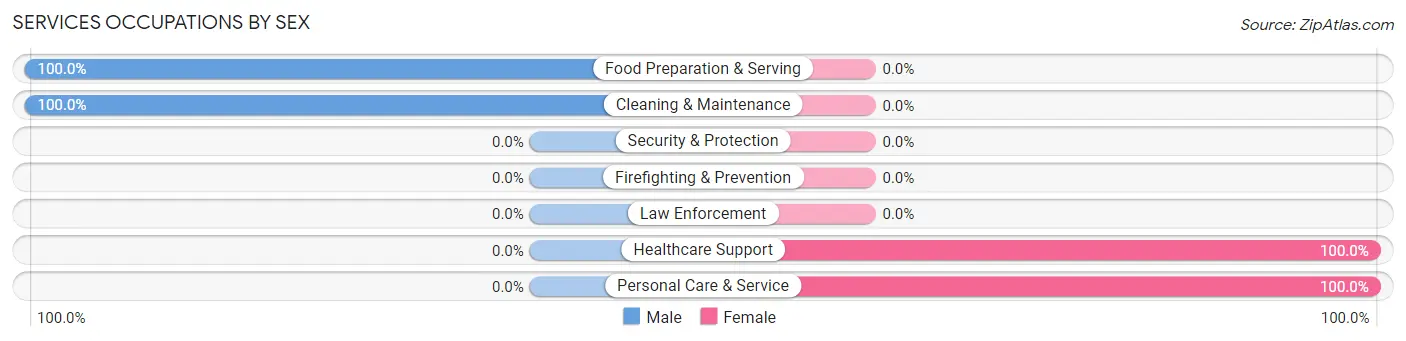
| Occupation | Male | Female |
| Healthcare Support | 0 (0.0%) | 5 (100.0%) |
| Security & Protection | 0 (0.0%) | 0 (0.0%) |
| Firefighting & Prevention | 0 (0.0%) | 0 (0.0%) |
| Law Enforcement | 0 (0.0%) | 0 (0.0%) |
| Food Preparation & Serving | 9 (100.0%) | 0 (0.0%) |
| Cleaning & Maintenance | 8 (100.0%) | 0 (0.0%) |
| Personal Care & Service | 0 (0.0%) | 3 (100.0%) |
| Total (Category) | 17 (68.0%) | 8 (32.0%) |
| Total (Overall) | 139 (59.7%) | 94 (40.3%) |
Sales and Office Occupations
The most common Sales and Office occupations in Briarcliffe Acres are Sales & Related (34 | 14.6%), and Office & Administration (11 | 4.7%).
Sales and Office Occupations by Sex
| Occupation | Male | Female |
| Sales & Related | 14 (41.2%) | 20 (58.8%) |
| Office & Administration | 0 (0.0%) | 11 (100.0%) |
| Total (Category) | 14 (31.1%) | 31 (68.9%) |
| Total (Overall) | 139 (59.7%) | 94 (40.3%) |
Natural Resources, Construction and Maintenance Occupations
The most common Natural Resources, Construction and Maintenance occupations in Briarcliffe Acres are Construction & Extraction (13 | 5.6%), and Installation, Maintenance & Repair (2 | 0.9%).
Natural Resources, Construction and Maintenance Occupations by Sex
| Occupation | Male | Female |
| Farming, Fishing & Forestry | 0 (0.0%) | 0 (0.0%) |
| Construction & Extraction | 13 (100.0%) | 0 (0.0%) |
| Installation, Maintenance & Repair | 2 (100.0%) | 0 (0.0%) |
| Total (Category) | 15 (100.0%) | 0 (0.0%) |
| Total (Overall) | 139 (59.7%) | 94 (40.3%) |
Production, Transportation and Moving Occupations
Production, Transportation and Moving Occupations by Sex
| Occupation | Male | Female |
| Production | 0 (0.0%) | 0 (0.0%) |
| Transportation | 0 (0.0%) | 0 (0.0%) |
| Material Moving | 0 (0.0%) | 0 (0.0%) |
| Total (Category) | 0 (0.0%) | 0 (0.0%) |
| Total (Overall) | 139 (59.7%) | 94 (40.3%) |
Employment Industries by Sex in Briarcliffe Acres
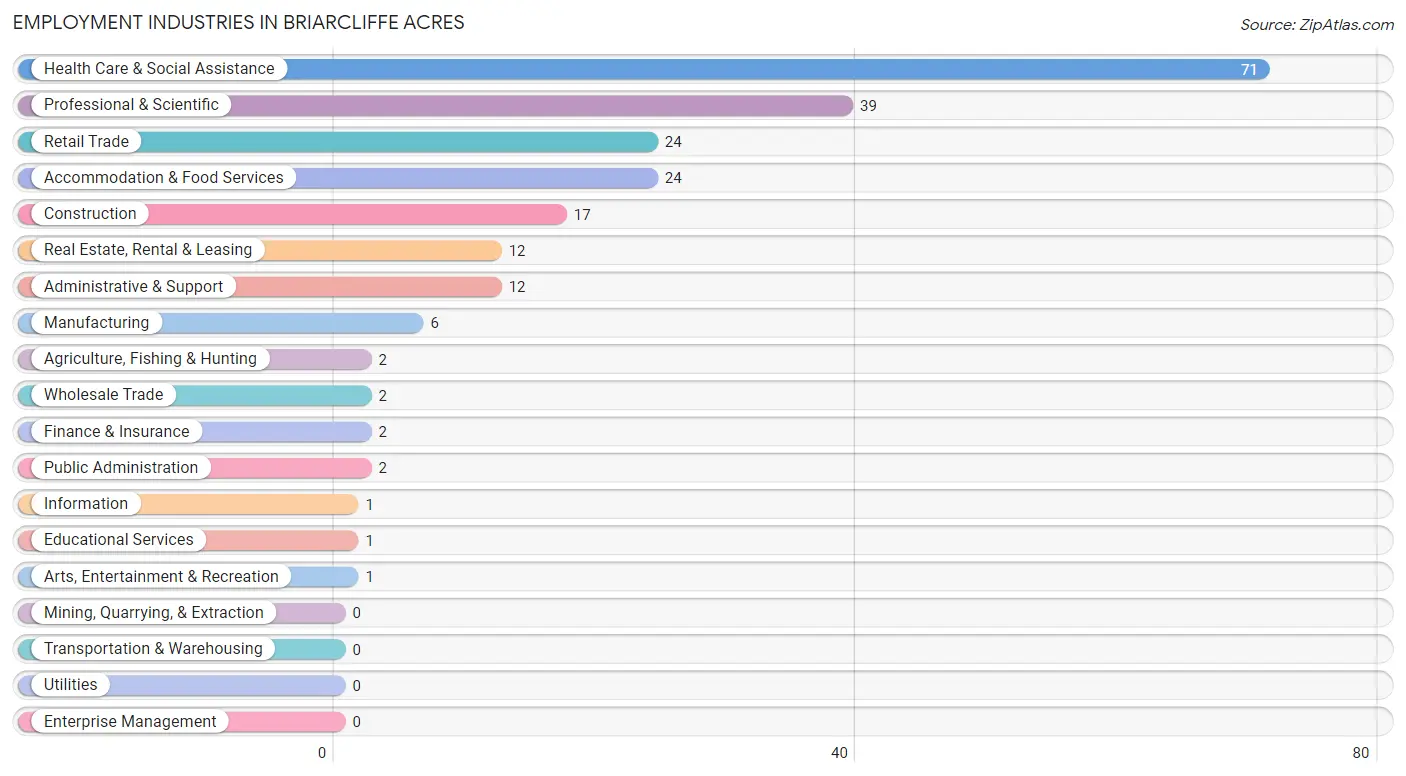
Employment Industries in Briarcliffe Acres
The major employment industries in Briarcliffe Acres include Health Care & Social Assistance (71 | 30.5%), Professional & Scientific (39 | 16.7%), Retail Trade (24 | 10.3%), Accommodation & Food Services (24 | 10.3%), and Construction (17 | 7.3%).
Employment Industries by Sex in Briarcliffe Acres
The Briarcliffe Acres industries that see more men than women are Agriculture, Fishing & Hunting (100.0%), Manufacturing (100.0%), and Wholesale Trade (100.0%), whereas the industries that tend to have a higher number of women are Information (100.0%), Educational Services (100.0%), and Arts, Entertainment & Recreation (100.0%).
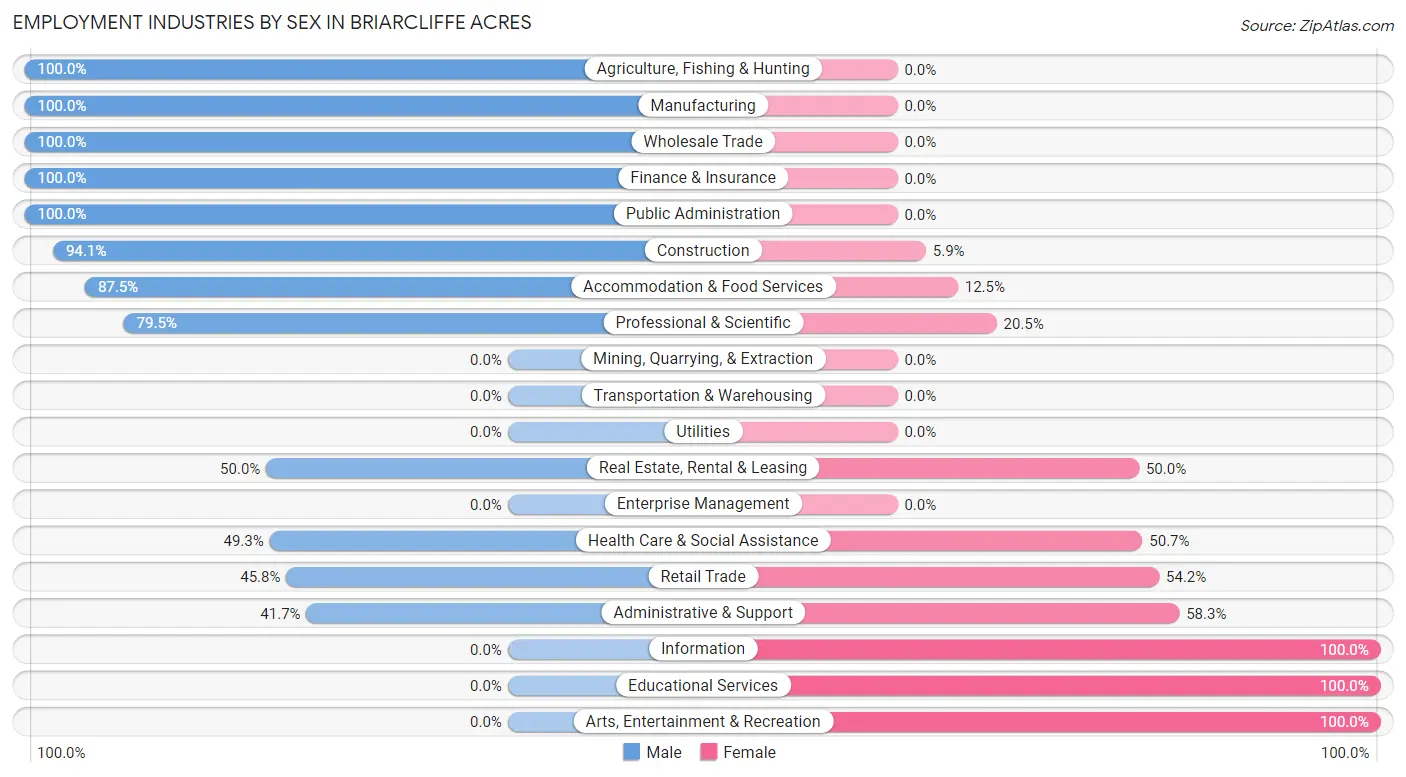
| Industry | Male | Female |
| Agriculture, Fishing & Hunting | 2 (100.0%) | 0 (0.0%) |
| Mining, Quarrying, & Extraction | 0 (0.0%) | 0 (0.0%) |
| Construction | 16 (94.1%) | 1 (5.9%) |
| Manufacturing | 6 (100.0%) | 0 (0.0%) |
| Wholesale Trade | 2 (100.0%) | 0 (0.0%) |
| Retail Trade | 11 (45.8%) | 13 (54.2%) |
| Transportation & Warehousing | 0 (0.0%) | 0 (0.0%) |
| Utilities | 0 (0.0%) | 0 (0.0%) |
| Information | 0 (0.0%) | 1 (100.0%) |
| Finance & Insurance | 2 (100.0%) | 0 (0.0%) |
| Real Estate, Rental & Leasing | 6 (50.0%) | 6 (50.0%) |
| Professional & Scientific | 31 (79.5%) | 8 (20.5%) |
| Enterprise Management | 0 (0.0%) | 0 (0.0%) |
| Administrative & Support | 5 (41.7%) | 7 (58.3%) |
| Educational Services | 0 (0.0%) | 1 (100.0%) |
| Health Care & Social Assistance | 35 (49.3%) | 36 (50.7%) |
| Arts, Entertainment & Recreation | 0 (0.0%) | 1 (100.0%) |
| Accommodation & Food Services | 21 (87.5%) | 3 (12.5%) |
| Public Administration | 2 (100.0%) | 0 (0.0%) |
| Total | 139 (59.7%) | 94 (40.3%) |
Education in Briarcliffe Acres
School Enrollment in Briarcliffe Acres
The most common levels of schooling among the 89 students in Briarcliffe Acres are college / undergraduate (29 | 32.6%), graduate / professional (28 | 31.5%), and elementary school (11 | 12.4%).
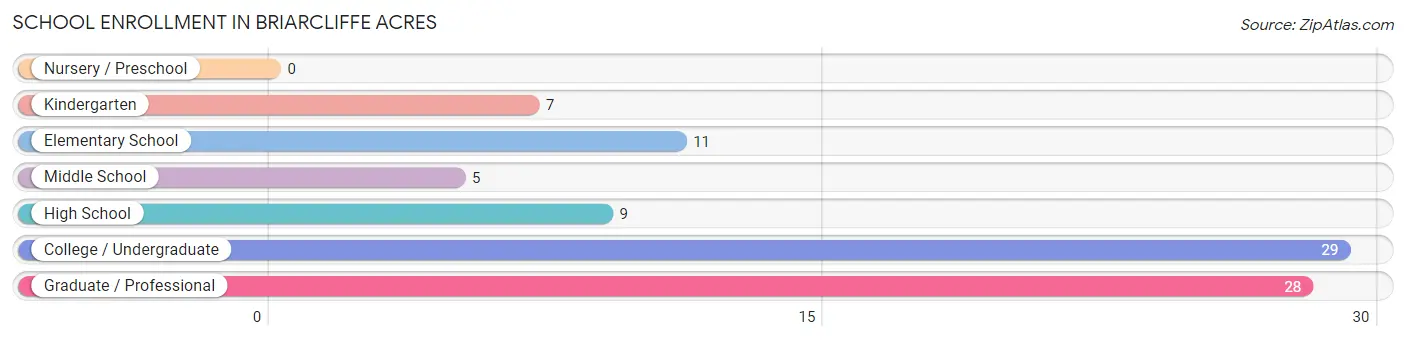
| School Level | # Students | % Students |
| Nursery / Preschool | 0 | 0.0% |
| Kindergarten | 7 | 7.9% |
| Elementary School | 11 | 12.4% |
| Middle School | 5 | 5.6% |
| High School | 9 | 10.1% |
| College / Undergraduate | 29 | 32.6% |
| Graduate / Professional | 28 | 31.5% |
| Total | 89 | 100.0% |
School Enrollment by Age by Funding Source in Briarcliffe Acres
Out of a total of 89 students who are enrolled in schools in Briarcliffe Acres, 12 (13.5%) attend a private institution, while the remaining 77 (86.5%) are enrolled in public schools. The age group of 5 to 9 year old has the highest likelihood of being enrolled in private schools, with 10 (83.3% in the age bracket) enrolled. Conversely, the age group of 18 to 19 year olds has the lowest likelihood of being enrolled in a private school, with 7 (100.0% in the age bracket) attending a public institution.
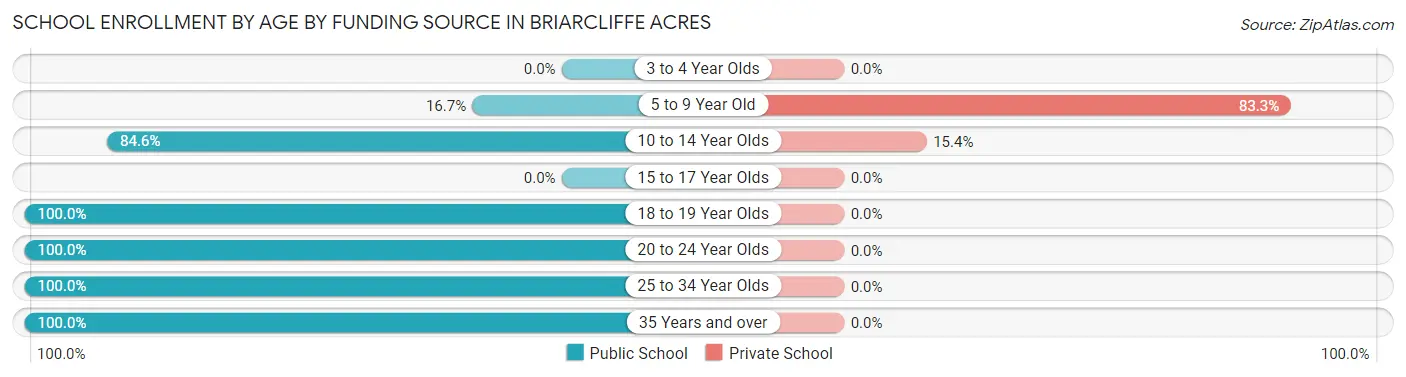
| Age Bracket | Public School | Private School |
| 3 to 4 Year Olds | 0 (0.0%) | 0 (0.0%) |
| 5 to 9 Year Old | 2 (16.7%) | 10 (83.3%) |
| 10 to 14 Year Olds | 11 (84.6%) | 2 (15.4%) |
| 15 to 17 Year Olds | 0 (0.0%) | 0 (0.0%) |
| 18 to 19 Year Olds | 7 (100.0%) | 0 (0.0%) |
| 20 to 24 Year Olds | 14 (100.0%) | 0 (0.0%) |
| 25 to 34 Year Olds | 36 (100.0%) | 0 (0.0%) |
| 35 Years and over | 7 (100.0%) | 0 (0.0%) |
| Total | 77 (86.5%) | 12 (13.5%) |
Educational Attainment by Field of Study in Briarcliffe Acres
Bio, nature & agricultural (56 | 18.4%), business (52 | 17.1%), science & technology (36 | 11.8%), education (29 | 9.5%), and engineering (19 | 6.2%) are the most common fields of study among 304 individuals in Briarcliffe Acres who have obtained a bachelor's degree or higher.
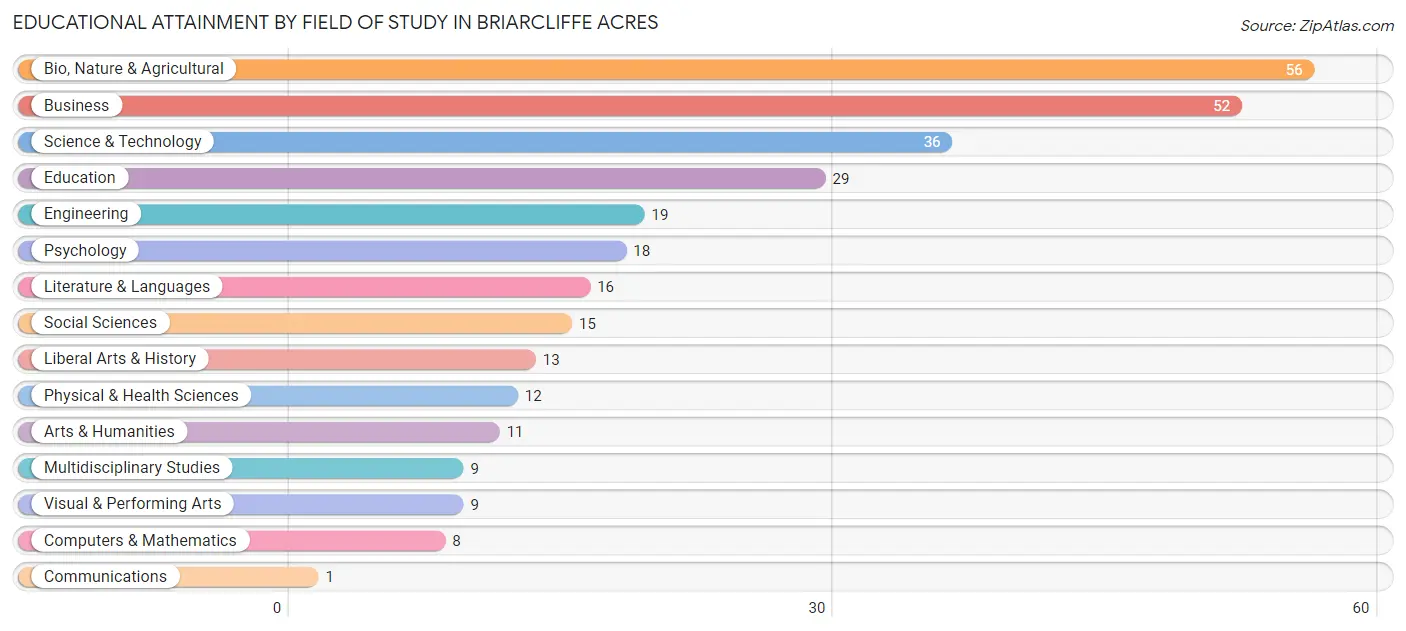
| Field of Study | # Graduates | % Graduates |
| Computers & Mathematics | 8 | 2.6% |
| Bio, Nature & Agricultural | 56 | 18.4% |
| Physical & Health Sciences | 12 | 4.0% |
| Psychology | 18 | 5.9% |
| Social Sciences | 15 | 4.9% |
| Engineering | 19 | 6.2% |
| Multidisciplinary Studies | 9 | 3.0% |
| Science & Technology | 36 | 11.8% |
| Business | 52 | 17.1% |
| Education | 29 | 9.5% |
| Literature & Languages | 16 | 5.3% |
| Liberal Arts & History | 13 | 4.3% |
| Visual & Performing Arts | 9 | 3.0% |
| Communications | 1 | 0.3% |
| Arts & Humanities | 11 | 3.6% |
| Total | 304 | 100.0% |
Transportation & Commute in Briarcliffe Acres
Vehicle Availability by Sex in Briarcliffe Acres
The most prevalent vehicle ownership categories in Briarcliffe Acres are males with 2 vehicles (44, accounting for 31.7%) and females with 2 vehicles (46, making up 46.8%).
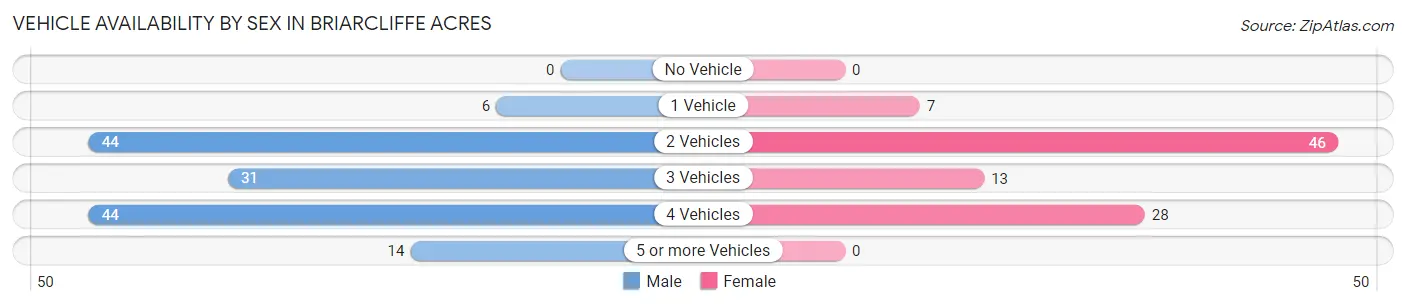
| Vehicles Available | Male | Female |
| No Vehicle | 0 (0.0%) | 0 (0.0%) |
| 1 Vehicle | 6 (4.3%) | 7 (7.4%) |
| 2 Vehicles | 44 (31.7%) | 46 (48.9%) |
| 3 Vehicles | 31 (22.3%) | 13 (13.8%) |
| 4 Vehicles | 44 (31.7%) | 28 (29.8%) |
| 5 or more Vehicles | 14 (10.1%) | 0 (0.0%) |
| Total | 139 (100.0%) | 94 (100.0%) |
Commute Time in Briarcliffe Acres
The most frequently occuring commute durations in Briarcliffe Acres are 10 to 14 minutes (55 commuters, 27.5%), 20 to 24 minutes (52 commuters, 26.0%), and 15 to 19 minutes (30 commuters, 15.0%).
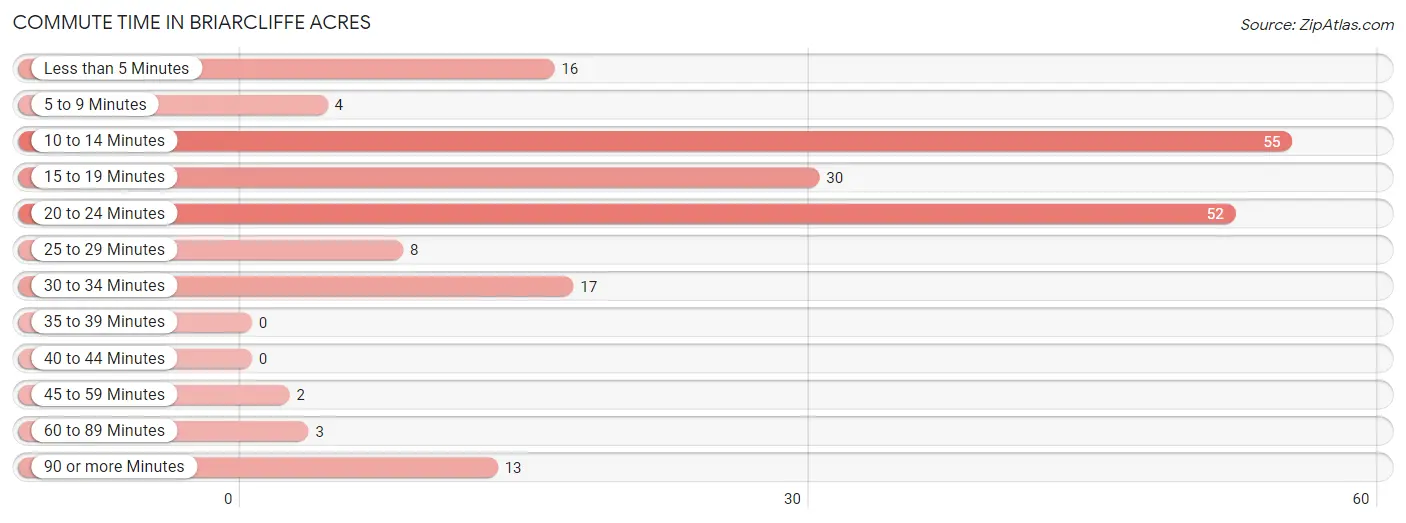
| Commute Time | # Commuters | % Commuters |
| Less than 5 Minutes | 16 | 8.0% |
| 5 to 9 Minutes | 4 | 2.0% |
| 10 to 14 Minutes | 55 | 27.5% |
| 15 to 19 Minutes | 30 | 15.0% |
| 20 to 24 Minutes | 52 | 26.0% |
| 25 to 29 Minutes | 8 | 4.0% |
| 30 to 34 Minutes | 17 | 8.5% |
| 35 to 39 Minutes | 0 | 0.0% |
| 40 to 44 Minutes | 0 | 0.0% |
| 45 to 59 Minutes | 2 | 1.0% |
| 60 to 89 Minutes | 3 | 1.5% |
| 90 or more Minutes | 13 | 6.5% |
Commute Time by Sex in Briarcliffe Acres
The most common commute times in Briarcliffe Acres are 10 to 14 minutes (33 commuters, 26.2%) for males and 20 to 24 minutes (24 commuters, 32.4%) for females.
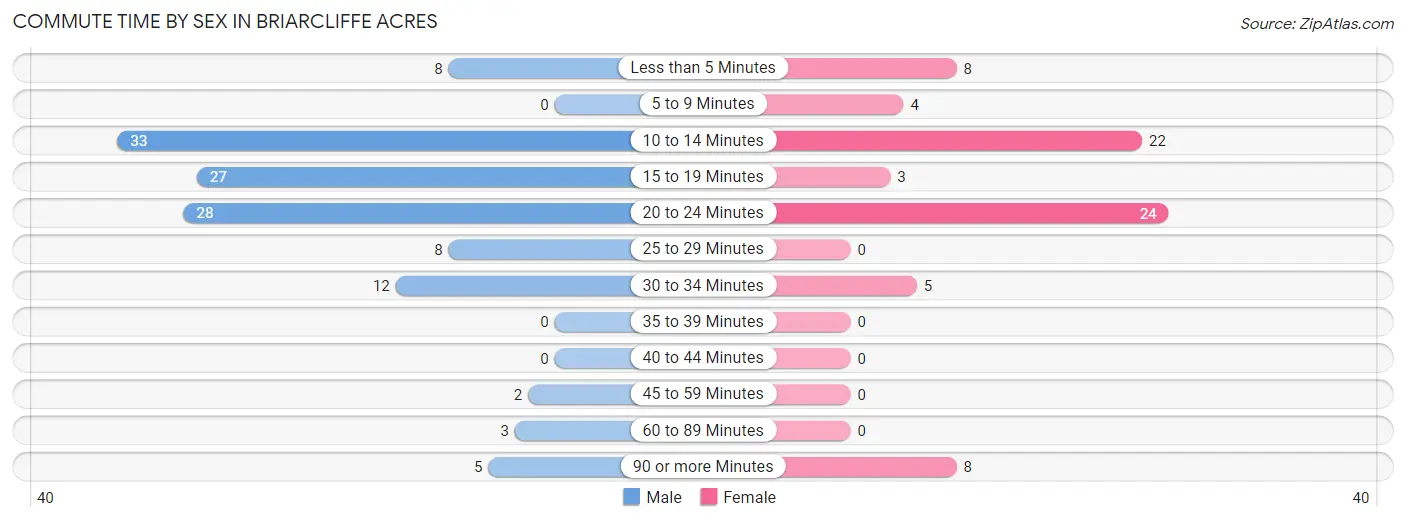
| Commute Time | Male | Female |
| Less than 5 Minutes | 8 (6.4%) | 8 (10.8%) |
| 5 to 9 Minutes | 0 (0.0%) | 4 (5.4%) |
| 10 to 14 Minutes | 33 (26.2%) | 22 (29.7%) |
| 15 to 19 Minutes | 27 (21.4%) | 3 (4.1%) |
| 20 to 24 Minutes | 28 (22.2%) | 24 (32.4%) |
| 25 to 29 Minutes | 8 (6.4%) | 0 (0.0%) |
| 30 to 34 Minutes | 12 (9.5%) | 5 (6.8%) |
| 35 to 39 Minutes | 0 (0.0%) | 0 (0.0%) |
| 40 to 44 Minutes | 0 (0.0%) | 0 (0.0%) |
| 45 to 59 Minutes | 2 (1.6%) | 0 (0.0%) |
| 60 to 89 Minutes | 3 (2.4%) | 0 (0.0%) |
| 90 or more Minutes | 5 (4.0%) | 8 (10.8%) |
Time of Departure to Work by Sex in Briarcliffe Acres
The most frequent times of departure to work in Briarcliffe Acres are 6:30 AM to 6:59 AM (23, 18.2%) for males and 9:00 AM to 9:59 AM (24, 32.4%) for females.
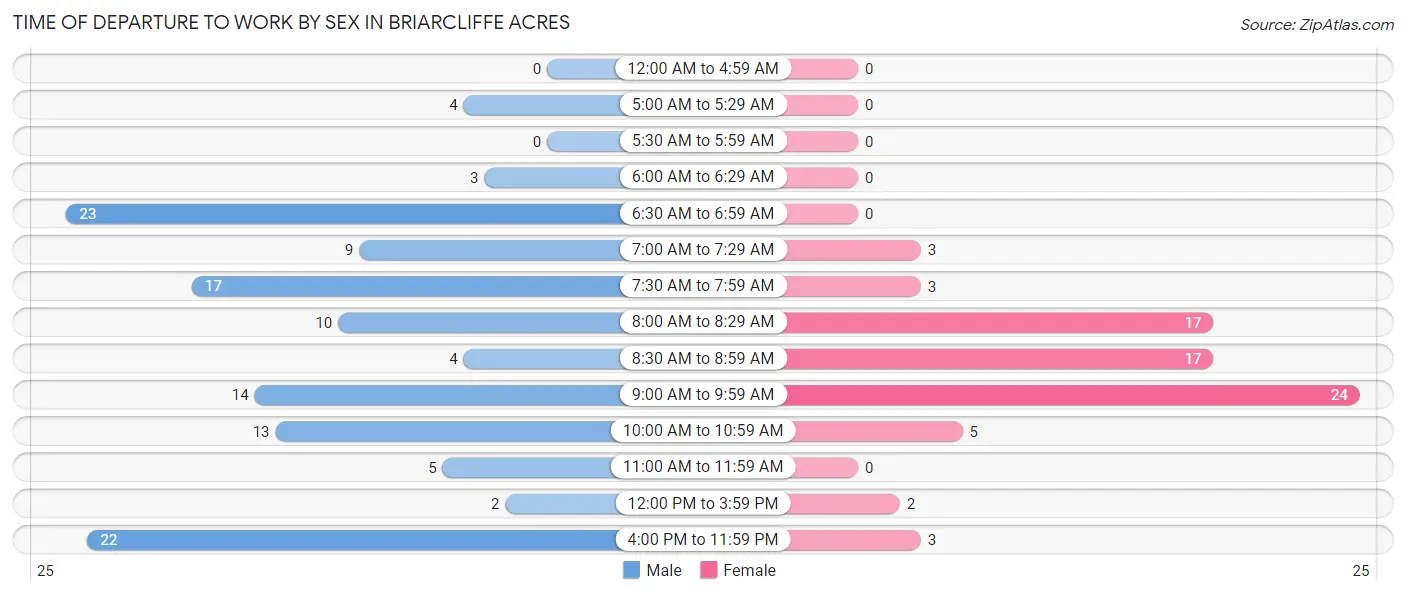
| Time of Departure | Male | Female |
| 12:00 AM to 4:59 AM | 0 (0.0%) | 0 (0.0%) |
| 5:00 AM to 5:29 AM | 4 (3.2%) | 0 (0.0%) |
| 5:30 AM to 5:59 AM | 0 (0.0%) | 0 (0.0%) |
| 6:00 AM to 6:29 AM | 3 (2.4%) | 0 (0.0%) |
| 6:30 AM to 6:59 AM | 23 (18.2%) | 0 (0.0%) |
| 7:00 AM to 7:29 AM | 9 (7.1%) | 3 (4.1%) |
| 7:30 AM to 7:59 AM | 17 (13.5%) | 3 (4.1%) |
| 8:00 AM to 8:29 AM | 10 (7.9%) | 17 (23.0%) |
| 8:30 AM to 8:59 AM | 4 (3.2%) | 17 (23.0%) |
| 9:00 AM to 9:59 AM | 14 (11.1%) | 24 (32.4%) |
| 10:00 AM to 10:59 AM | 13 (10.3%) | 5 (6.8%) |
| 11:00 AM to 11:59 AM | 5 (4.0%) | 0 (0.0%) |
| 12:00 PM to 3:59 PM | 2 (1.6%) | 2 (2.7%) |
| 4:00 PM to 11:59 PM | 22 (17.5%) | 3 (4.1%) |
| Total | 126 (100.0%) | 74 (100.0%) |
Housing Occupancy in Briarcliffe Acres
Occupancy by Ownership in Briarcliffe Acres
Of the total 205 dwellings in Briarcliffe Acres, owner-occupied units account for 190 (92.7%), while renter-occupied units make up 15 (7.3%).
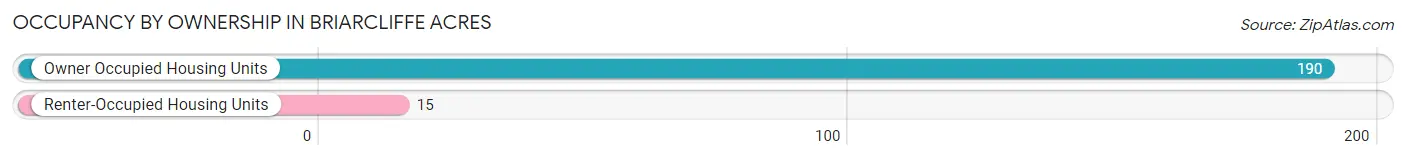
| Occupancy | # Housing Units | % Housing Units |
| Owner Occupied Housing Units | 190 | 92.7% |
| Renter-Occupied Housing Units | 15 | 7.3% |
| Total Occupied Housing Units | 205 | 100.0% |
Occupancy by Household Size in Briarcliffe Acres
| Household Size | # Housing Units | % Housing Units |
| 1-Person Household | 36 | 17.6% |
| 2-Person Household | 111 | 54.1% |
| 3-Person Household | 24 | 11.7% |
| 4+ Person Household | 34 | 16.6% |
| Total Housing Units | 205 | 100.0% |
Occupancy by Ownership by Household Size in Briarcliffe Acres
| Household Size | Owner-occupied | Renter-occupied |
| 1-Person Household | 30 (83.3%) | 6 (16.7%) |
| 2-Person Household | 106 (95.5%) | 5 (4.5%) |
| 3-Person Household | 24 (100.0%) | 0 (0.0%) |
| 4+ Person Household | 30 (88.2%) | 4 (11.8%) |
| Total Housing Units | 190 (92.7%) | 15 (7.3%) |
Occupancy by Educational Attainment in Briarcliffe Acres
| Household Size | Owner-occupied | Renter-occupied |
| Less than High School | 1 (100.0%) | 0 (0.0%) |
| High School Diploma | 1 (33.3%) | 2 (66.7%) |
| College/Associate Degree | 36 (81.8%) | 8 (18.2%) |
| Bachelor's Degree or higher | 152 (96.8%) | 5 (3.2%) |
Occupancy by Age of Householder in Briarcliffe Acres
| Age Bracket | # Households | % Households |
| Under 35 Years | 2 | 1.0% |
| 35 to 44 Years | 12 | 5.9% |
| 45 to 54 Years | 18 | 8.8% |
| 55 to 64 Years | 55 | 26.8% |
| 65 to 74 Years | 68 | 33.2% |
| 75 to 84 Years | 37 | 18.0% |
| 85 Years and Over | 13 | 6.3% |
| Total | 205 | 100.0% |
Housing Finances in Briarcliffe Acres
Median Income by Occupancy in Briarcliffe Acres
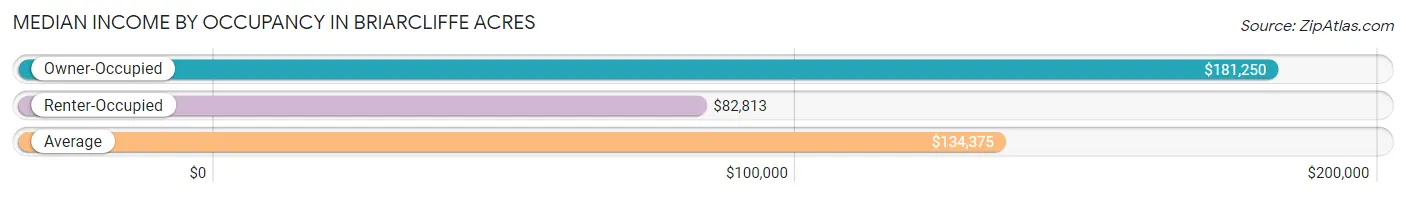
| Occupancy Type | # Households | Median Income |
| Owner-Occupied | 190 (92.7%) | $181,250 |
| Renter-Occupied | 15 (7.3%) | $82,813 |
| Average | 205 (100.0%) | $134,375 |
Occupancy by Householder Income Bracket in Briarcliffe Acres
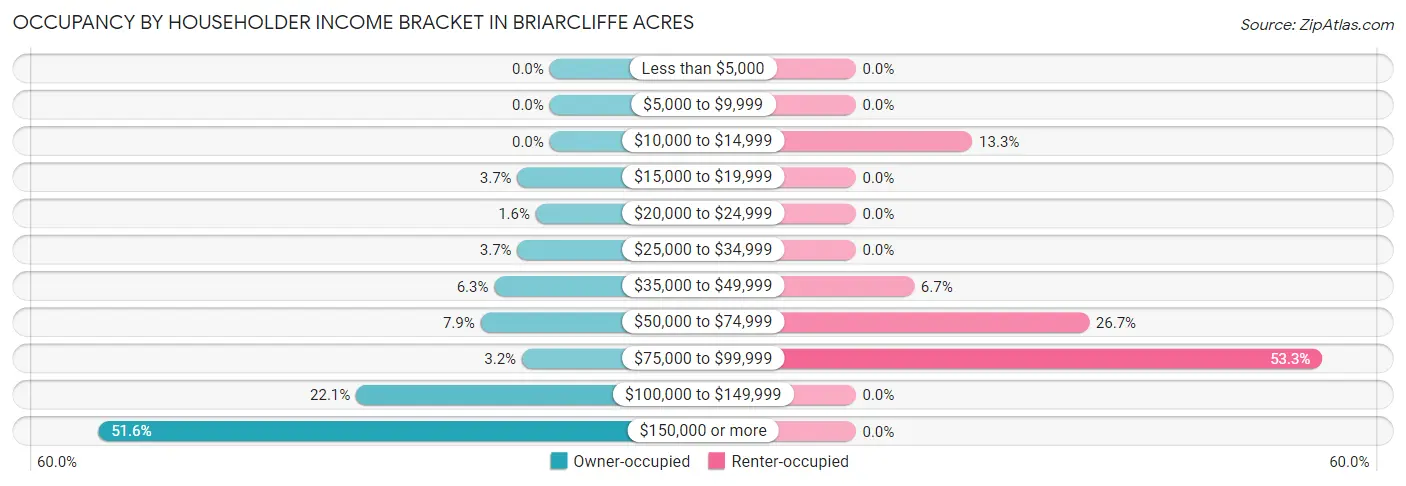
| Income Bracket | Owner-occupied | Renter-occupied |
| Less than $5,000 | 0 (0.0%) | 0 (0.0%) |
| $5,000 to $9,999 | 0 (0.0%) | 0 (0.0%) |
| $10,000 to $14,999 | 0 (0.0%) | 2 (13.3%) |
| $15,000 to $19,999 | 7 (3.7%) | 0 (0.0%) |
| $20,000 to $24,999 | 3 (1.6%) | 0 (0.0%) |
| $25,000 to $34,999 | 7 (3.7%) | 0 (0.0%) |
| $35,000 to $49,999 | 12 (6.3%) | 1 (6.7%) |
| $50,000 to $74,999 | 15 (7.9%) | 4 (26.7%) |
| $75,000 to $99,999 | 6 (3.2%) | 8 (53.3%) |
| $100,000 to $149,999 | 42 (22.1%) | 0 (0.0%) |
| $150,000 or more | 98 (51.6%) | 0 (0.0%) |
| Total | 190 (100.0%) | 15 (100.0%) |
Monthly Housing Cost Tiers in Briarcliffe Acres
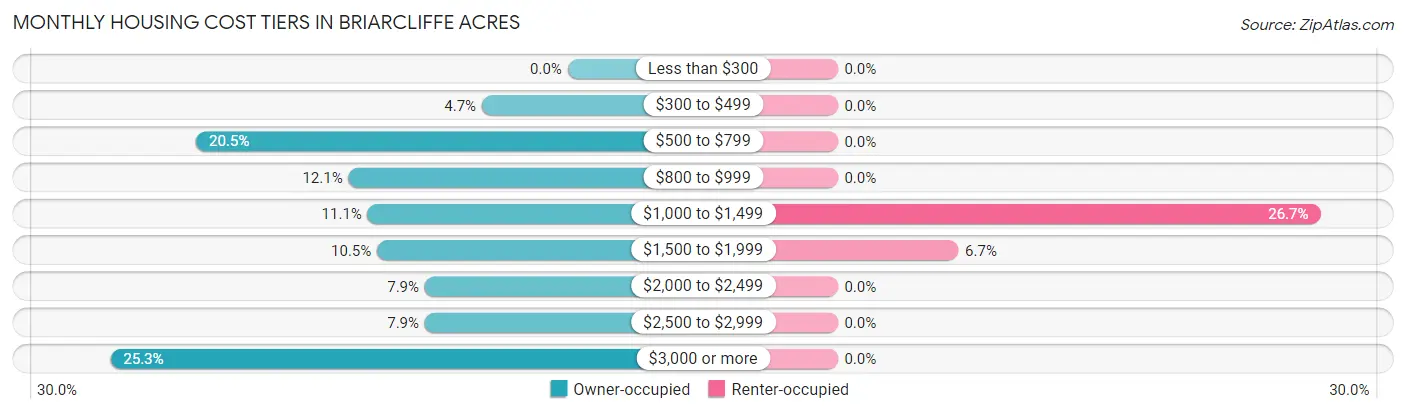
| Monthly Cost | Owner-occupied | Renter-occupied |
| Less than $300 | 0 (0.0%) | 0 (0.0%) |
| $300 to $499 | 9 (4.7%) | 0 (0.0%) |
| $500 to $799 | 39 (20.5%) | 0 (0.0%) |
| $800 to $999 | 23 (12.1%) | 0 (0.0%) |
| $1,000 to $1,499 | 21 (11.1%) | 4 (26.7%) |
| $1,500 to $1,999 | 20 (10.5%) | 1 (6.7%) |
| $2,000 to $2,499 | 15 (7.9%) | 0 (0.0%) |
| $2,500 to $2,999 | 15 (7.9%) | 0 (0.0%) |
| $3,000 or more | 48 (25.3%) | 0 (0.0%) |
| Total | 190 (100.0%) | 15 (100.0%) |
Physical Housing Characteristics in Briarcliffe Acres
Housing Structures in Briarcliffe Acres
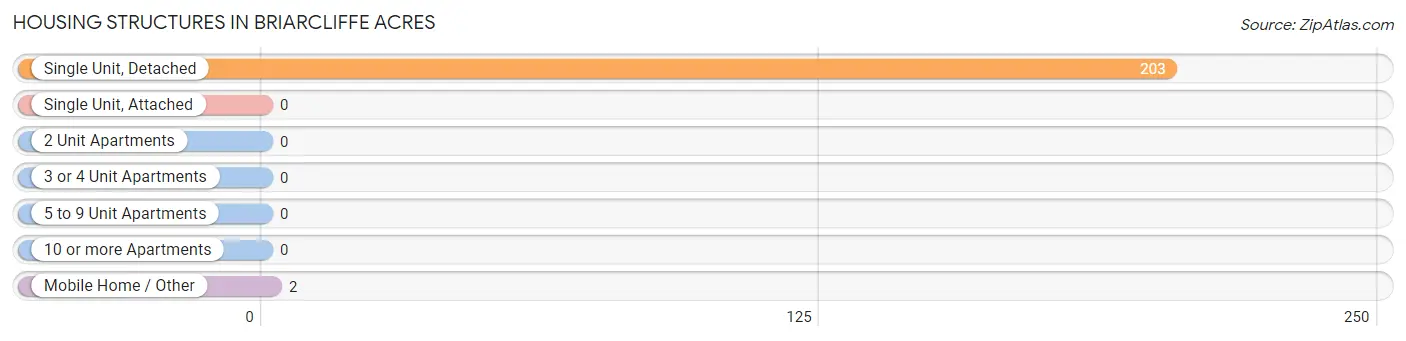
| Structure Type | # Housing Units | % Housing Units |
| Single Unit, Detached | 203 | 99.0% |
| Single Unit, Attached | 0 | 0.0% |
| 2 Unit Apartments | 0 | 0.0% |
| 3 or 4 Unit Apartments | 0 | 0.0% |
| 5 to 9 Unit Apartments | 0 | 0.0% |
| 10 or more Apartments | 0 | 0.0% |
| Mobile Home / Other | 2 | 1.0% |
| Total | 205 | 100.0% |
Housing Structures by Occupancy in Briarcliffe Acres
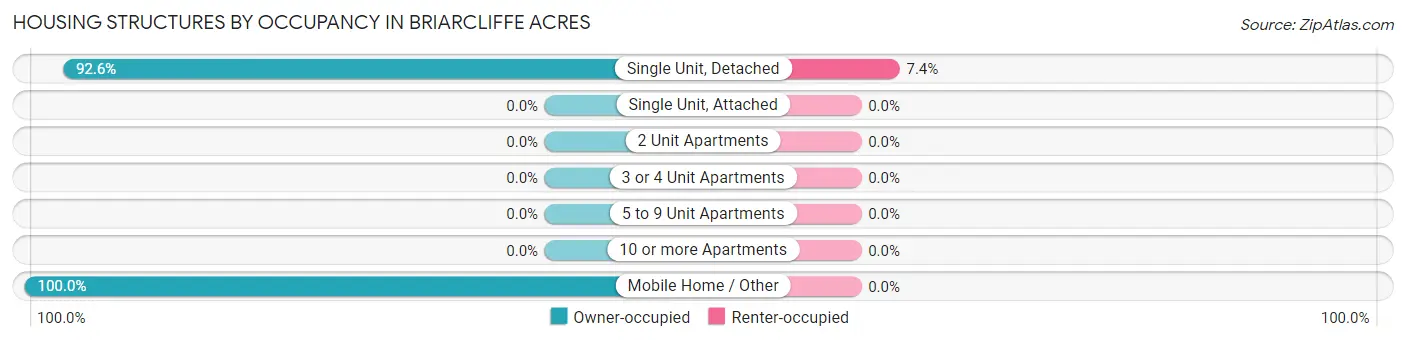
| Structure Type | Owner-occupied | Renter-occupied |
| Single Unit, Detached | 188 (92.6%) | 15 (7.4%) |
| Single Unit, Attached | 0 (0.0%) | 0 (0.0%) |
| 2 Unit Apartments | 0 (0.0%) | 0 (0.0%) |
| 3 or 4 Unit Apartments | 0 (0.0%) | 0 (0.0%) |
| 5 to 9 Unit Apartments | 0 (0.0%) | 0 (0.0%) |
| 10 or more Apartments | 0 (0.0%) | 0 (0.0%) |
| Mobile Home / Other | 2 (100.0%) | 0 (0.0%) |
| Total | 190 (92.7%) | 15 (7.3%) |
Housing Structures by Number of Rooms in Briarcliffe Acres
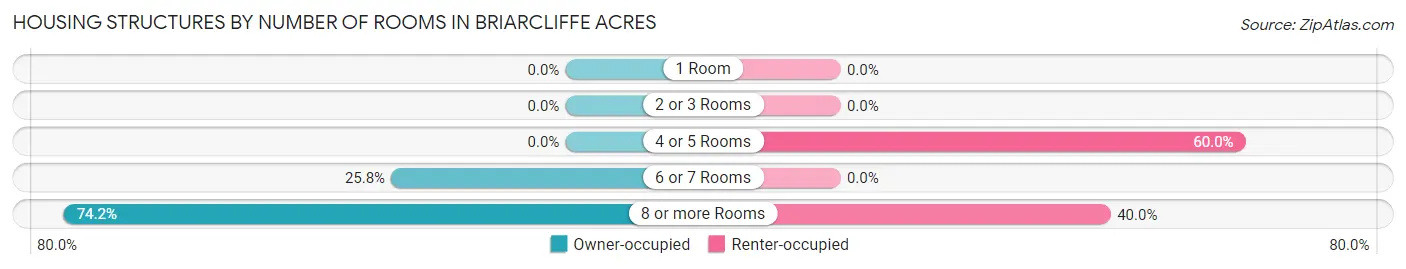
| Number of Rooms | Owner-occupied | Renter-occupied |
| 1 Room | 0 (0.0%) | 0 (0.0%) |
| 2 or 3 Rooms | 0 (0.0%) | 0 (0.0%) |
| 4 or 5 Rooms | 0 (0.0%) | 9 (60.0%) |
| 6 or 7 Rooms | 49 (25.8%) | 0 (0.0%) |
| 8 or more Rooms | 141 (74.2%) | 6 (40.0%) |
| Total | 190 (100.0%) | 15 (100.0%) |
Housing Structure by Heating Type in Briarcliffe Acres
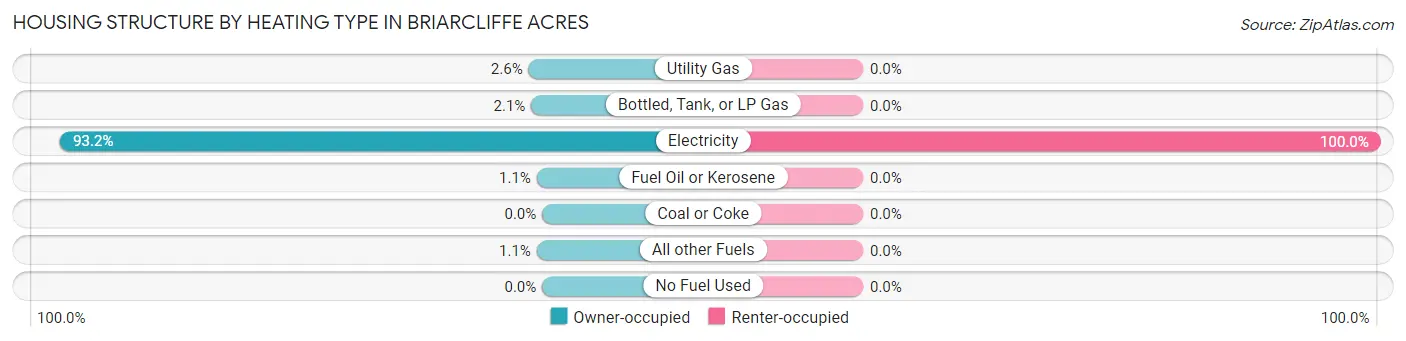
| Heating Type | Owner-occupied | Renter-occupied |
| Utility Gas | 5 (2.6%) | 0 (0.0%) |
| Bottled, Tank, or LP Gas | 4 (2.1%) | 0 (0.0%) |
| Electricity | 177 (93.2%) | 15 (100.0%) |
| Fuel Oil or Kerosene | 2 (1.1%) | 0 (0.0%) |
| Coal or Coke | 0 (0.0%) | 0 (0.0%) |
| All other Fuels | 2 (1.1%) | 0 (0.0%) |
| No Fuel Used | 0 (0.0%) | 0 (0.0%) |
| Total | 190 (100.0%) | 15 (100.0%) |
Household Vehicle Usage in Briarcliffe Acres
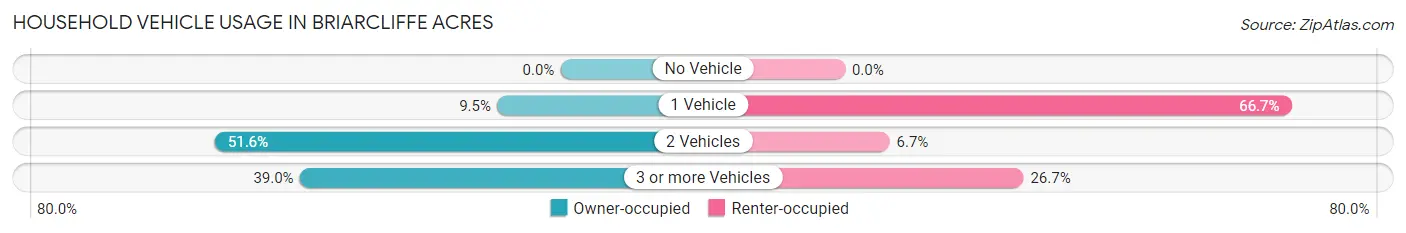
| Vehicles per Household | Owner-occupied | Renter-occupied |
| No Vehicle | 0 (0.0%) | 0 (0.0%) |
| 1 Vehicle | 18 (9.5%) | 10 (66.7%) |
| 2 Vehicles | 98 (51.6%) | 1 (6.7%) |
| 3 or more Vehicles | 74 (39.0%) | 4 (26.7%) |
| Total | 190 (100.0%) | 15 (100.0%) |
Real Estate & Mortgages in Briarcliffe Acres
Real Estate and Mortgage Overview in Briarcliffe Acres
| Characteristic | Without Mortgage | With Mortgage |
| Housing Units | 95 | 95 |
| Median Property Value | $674,000 | $712,800 |
| Median Household Income | $206,250 | $47 |
| Monthly Housing Costs | $821 | $48 |
| Real Estate Taxes | $2,567 | $0 |
Property Value by Mortgage Status in Briarcliffe Acres
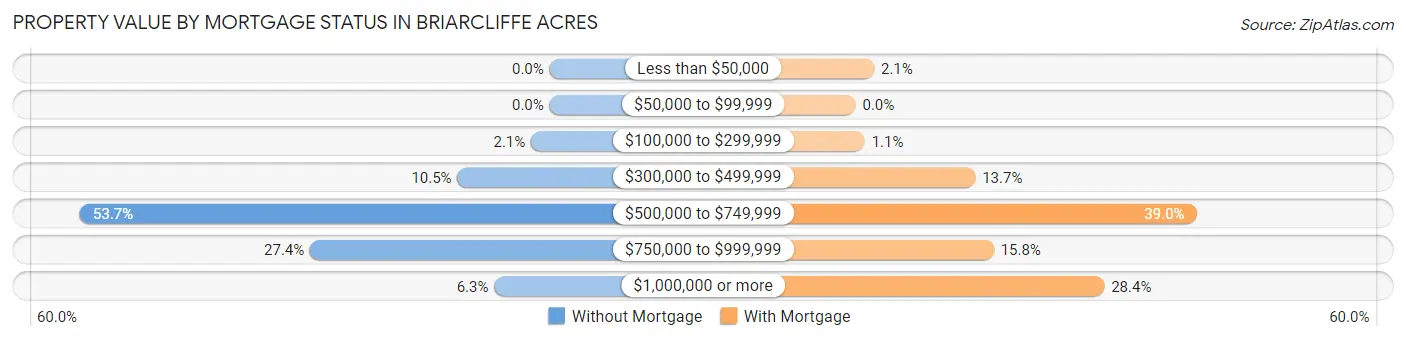
| Property Value | Without Mortgage | With Mortgage |
| Less than $50,000 | 0 (0.0%) | 2 (2.1%) |
| $50,000 to $99,999 | 0 (0.0%) | 0 (0.0%) |
| $100,000 to $299,999 | 2 (2.1%) | 1 (1.1%) |
| $300,000 to $499,999 | 10 (10.5%) | 13 (13.7%) |
| $500,000 to $749,999 | 51 (53.7%) | 37 (39.0%) |
| $750,000 to $999,999 | 26 (27.4%) | 15 (15.8%) |
| $1,000,000 or more | 6 (6.3%) | 27 (28.4%) |
| Total | 95 (100.0%) | 95 (100.0%) |
Household Income by Mortgage Status in Briarcliffe Acres
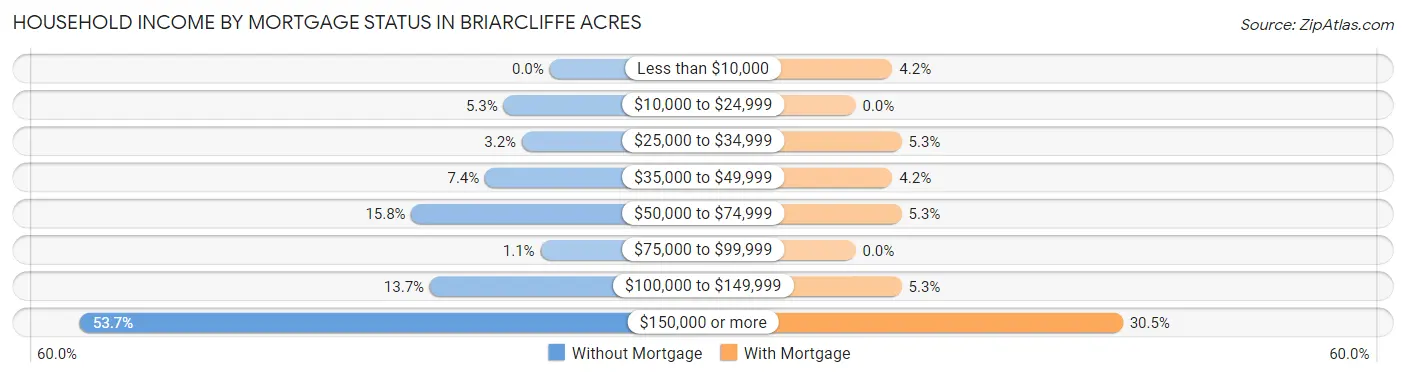
| Household Income | Without Mortgage | With Mortgage |
| Less than $10,000 | 0 (0.0%) | 4 (4.2%) |
| $10,000 to $24,999 | 5 (5.3%) | 0 (0.0%) |
| $25,000 to $34,999 | 3 (3.2%) | 5 (5.3%) |
| $35,000 to $49,999 | 7 (7.4%) | 4 (4.2%) |
| $50,000 to $74,999 | 15 (15.8%) | 5 (5.3%) |
| $75,000 to $99,999 | 1 (1.1%) | 0 (0.0%) |
| $100,000 to $149,999 | 13 (13.7%) | 5 (5.3%) |
| $150,000 or more | 51 (53.7%) | 29 (30.5%) |
| Total | 95 (100.0%) | 95 (100.0%) |
Property Value to Household Income Ratio in Briarcliffe Acres
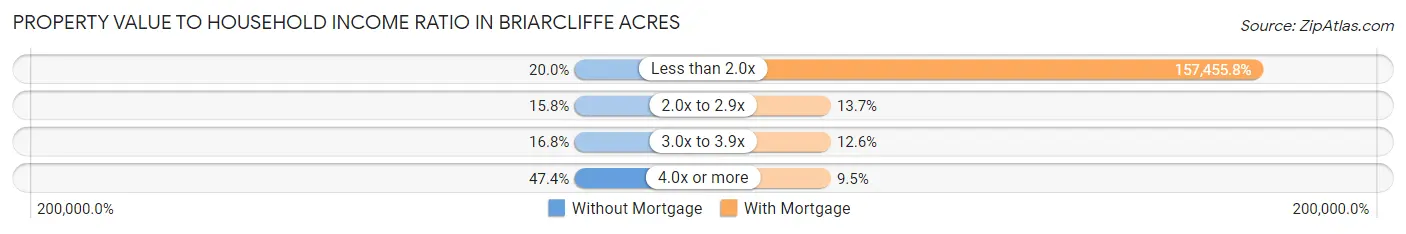
| Value-to-Income Ratio | Without Mortgage | With Mortgage |
| Less than 2.0x | 19 (20.0%) | 149,583 (157,455.8%) |
| 2.0x to 2.9x | 15 (15.8%) | 13 (13.7%) |
| 3.0x to 3.9x | 16 (16.8%) | 12 (12.6%) |
| 4.0x or more | 45 (47.4%) | 9 (9.5%) |
| Total | 95 (100.0%) | 95 (100.0%) |
Real Estate Taxes by Mortgage Status in Briarcliffe Acres
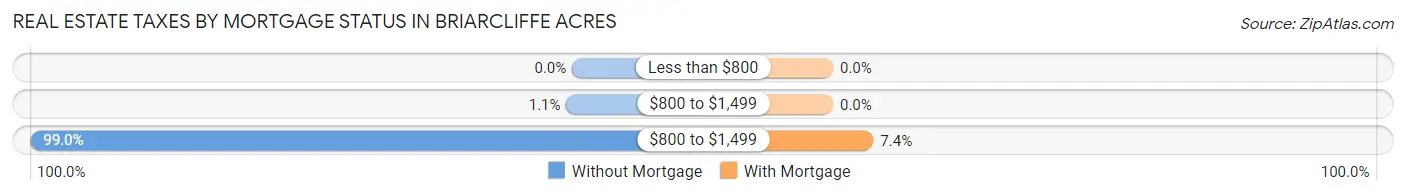
| Property Taxes | Without Mortgage | With Mortgage |
| Less than $800 | 0 (0.0%) | 0 (0.0%) |
| $800 to $1,499 | 1 (1.1%) | 0 (0.0%) |
| $800 to $1,499 | 94 (99.0%) | 7 (7.4%) |
| Total | 95 (100.0%) | 95 (100.0%) |
Health & Disability in Briarcliffe Acres
Health Insurance Coverage by Age in Briarcliffe Acres
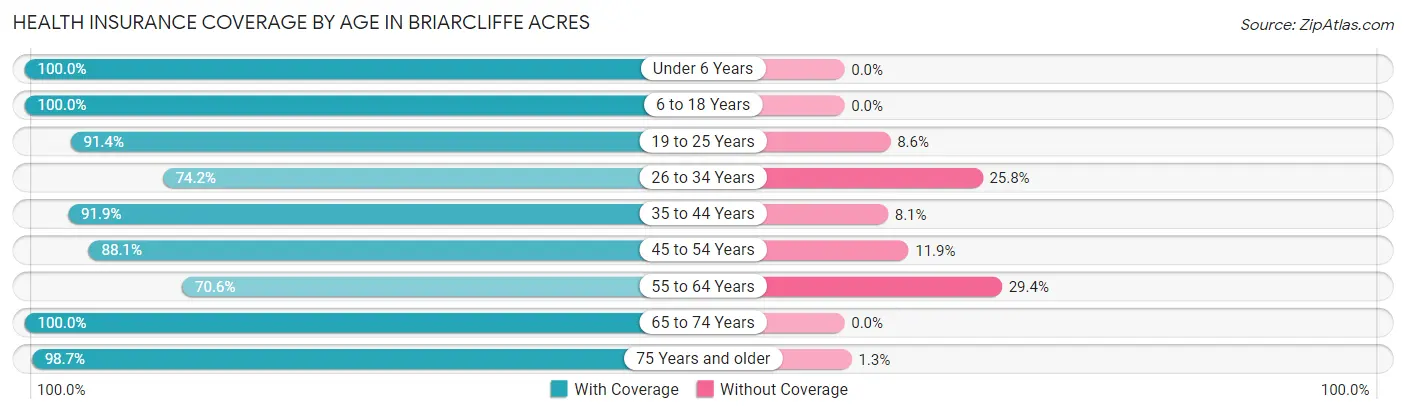
| Age Bracket | With Coverage | Without Coverage |
| Under 6 Years | 23 (100.0%) | 0 (0.0%) |
| 6 to 18 Years | 28 (100.0%) | 0 (0.0%) |
| 19 to 25 Years | 32 (91.4%) | 3 (8.6%) |
| 26 to 34 Years | 49 (74.2%) | 17 (25.8%) |
| 35 to 44 Years | 34 (91.9%) | 3 (8.1%) |
| 45 to 54 Years | 59 (88.1%) | 8 (11.9%) |
| 55 to 64 Years | 77 (70.6%) | 32 (29.4%) |
| 65 to 74 Years | 128 (100.0%) | 0 (0.0%) |
| 75 Years and older | 74 (98.7%) | 1 (1.3%) |
| Total | 504 (88.7%) | 64 (11.3%) |
Health Insurance Coverage by Citizenship Status in Briarcliffe Acres
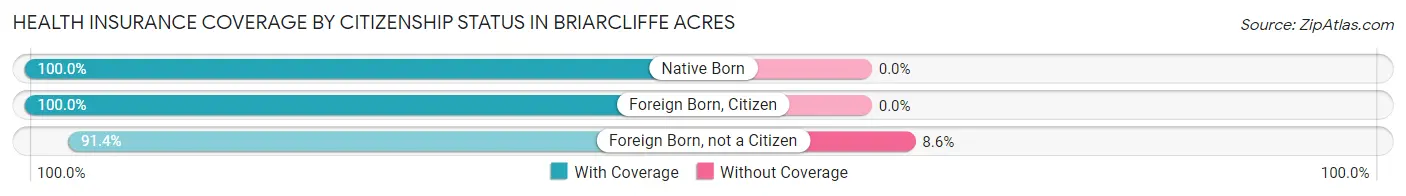
| Citizenship Status | With Coverage | Without Coverage |
| Native Born | 23 (100.0%) | 0 (0.0%) |
| Foreign Born, Citizen | 28 (100.0%) | 0 (0.0%) |
| Foreign Born, not a Citizen | 32 (91.4%) | 3 (8.6%) |
Health Insurance Coverage by Household Income in Briarcliffe Acres
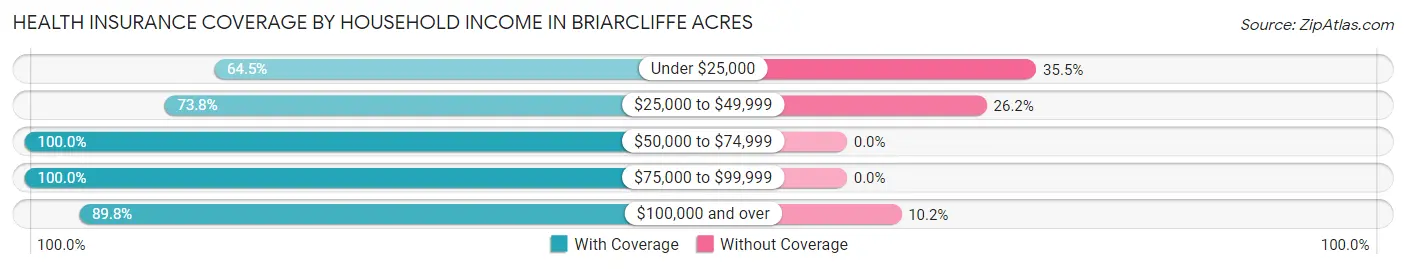
| Household Income | With Coverage | Without Coverage |
| Under $25,000 | 20 (64.5%) | 11 (35.5%) |
| $25,000 to $49,999 | 31 (73.8%) | 11 (26.2%) |
| $50,000 to $74,999 | 37 (100.0%) | 0 (0.0%) |
| $75,000 to $99,999 | 46 (100.0%) | 0 (0.0%) |
| $100,000 and over | 370 (89.8%) | 42 (10.2%) |
Public vs Private Health Insurance Coverage by Age in Briarcliffe Acres
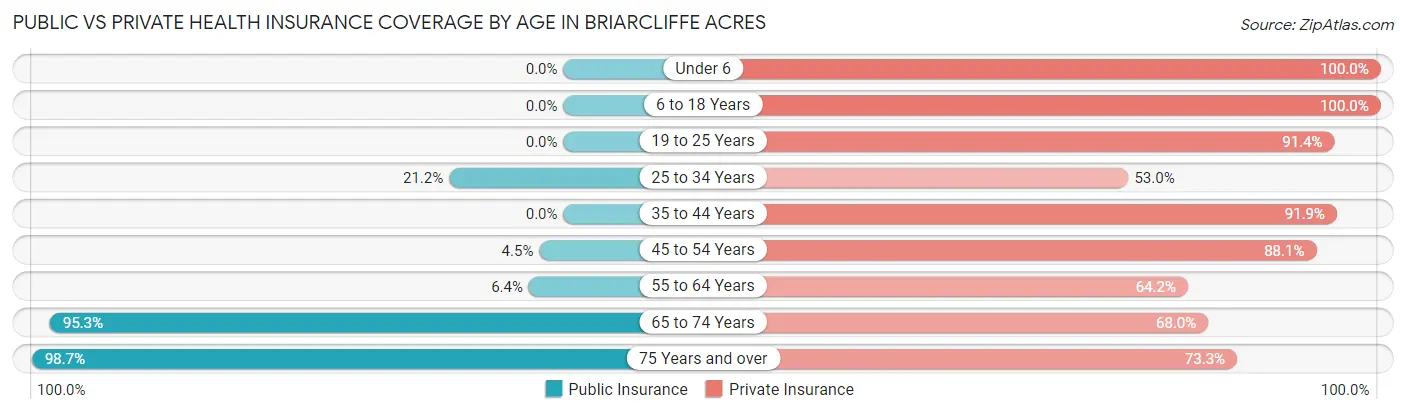
| Age Bracket | Public Insurance | Private Insurance |
| Under 6 | 0 (0.0%) | 23 (100.0%) |
| 6 to 18 Years | 0 (0.0%) | 28 (100.0%) |
| 19 to 25 Years | 0 (0.0%) | 32 (91.4%) |
| 25 to 34 Years | 14 (21.2%) | 35 (53.0%) |
| 35 to 44 Years | 0 (0.0%) | 34 (91.9%) |
| 45 to 54 Years | 3 (4.5%) | 59 (88.1%) |
| 55 to 64 Years | 7 (6.4%) | 70 (64.2%) |
| 65 to 74 Years | 122 (95.3%) | 87 (68.0%) |
| 75 Years and over | 74 (98.7%) | 55 (73.3%) |
| Total | 220 (38.7%) | 423 (74.5%) |
Disability Status by Sex by Age in Briarcliffe Acres
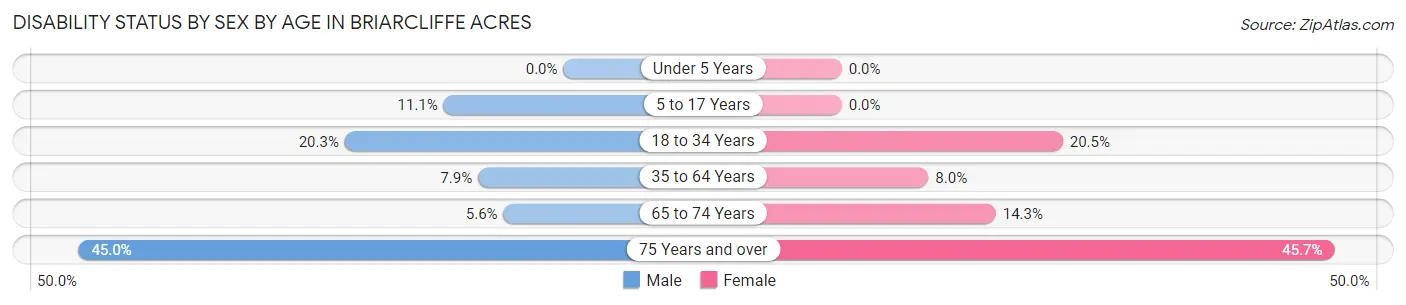
| Age Bracket | Male | Female |
| Under 5 Years | 0 (0.0%) | 0 (0.0%) |
| 5 to 17 Years | 2 (11.1%) | 0 (0.0%) |
| 18 to 34 Years | 14 (20.3%) | 8 (20.5%) |
| 35 to 64 Years | 8 (7.9%) | 9 (8.0%) |
| 65 to 74 Years | 4 (5.6%) | 8 (14.3%) |
| 75 Years and over | 18 (45.0%) | 16 (45.7%) |
Disability Class by Sex by Age in Briarcliffe Acres
Disability Class: Hearing Difficulty
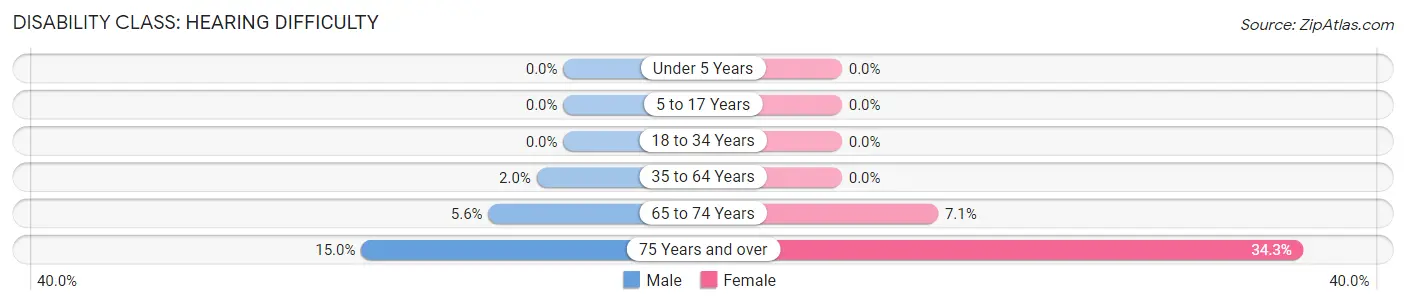
| Age Bracket | Male | Female |
| Under 5 Years | 0 (0.0%) | 0 (0.0%) |
| 5 to 17 Years | 0 (0.0%) | 0 (0.0%) |
| 18 to 34 Years | 0 (0.0%) | 0 (0.0%) |
| 35 to 64 Years | 2 (2.0%) | 0 (0.0%) |
| 65 to 74 Years | 4 (5.6%) | 4 (7.1%) |
| 75 Years and over | 6 (15.0%) | 12 (34.3%) |
Disability Class: Vision Difficulty
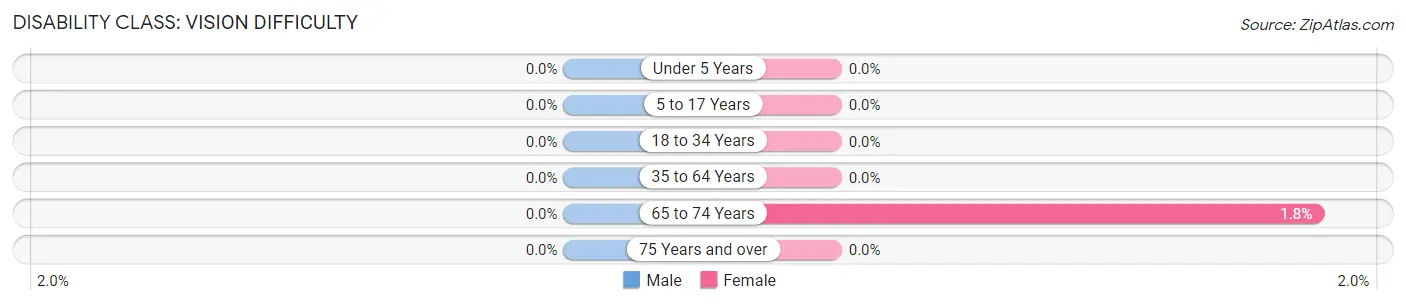
| Age Bracket | Male | Female |
| Under 5 Years | 0 (0.0%) | 0 (0.0%) |
| 5 to 17 Years | 0 (0.0%) | 0 (0.0%) |
| 18 to 34 Years | 0 (0.0%) | 0 (0.0%) |
| 35 to 64 Years | 0 (0.0%) | 0 (0.0%) |
| 65 to 74 Years | 0 (0.0%) | 1 (1.8%) |
| 75 Years and over | 0 (0.0%) | 0 (0.0%) |
Disability Class: Cognitive Difficulty
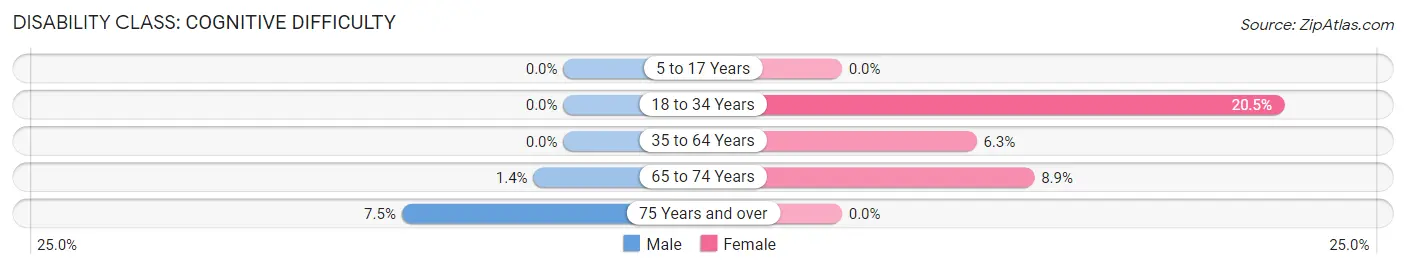
| Age Bracket | Male | Female |
| 5 to 17 Years | 0 (0.0%) | 0 (0.0%) |
| 18 to 34 Years | 0 (0.0%) | 8 (20.5%) |
| 35 to 64 Years | 0 (0.0%) | 7 (6.2%) |
| 65 to 74 Years | 1 (1.4%) | 5 (8.9%) |
| 75 Years and over | 3 (7.5%) | 0 (0.0%) |
Disability Class: Ambulatory Difficulty
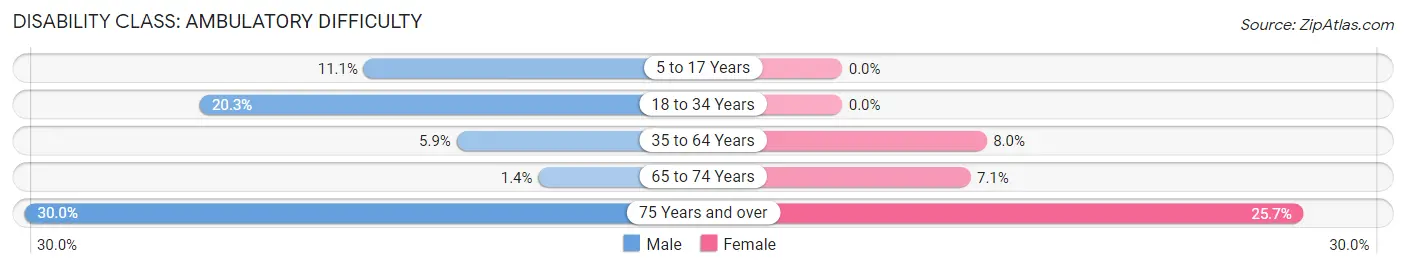
| Age Bracket | Male | Female |
| 5 to 17 Years | 2 (11.1%) | 0 (0.0%) |
| 18 to 34 Years | 14 (20.3%) | 0 (0.0%) |
| 35 to 64 Years | 6 (5.9%) | 9 (8.0%) |
| 65 to 74 Years | 1 (1.4%) | 4 (7.1%) |
| 75 Years and over | 12 (30.0%) | 9 (25.7%) |
Disability Class: Self-Care Difficulty
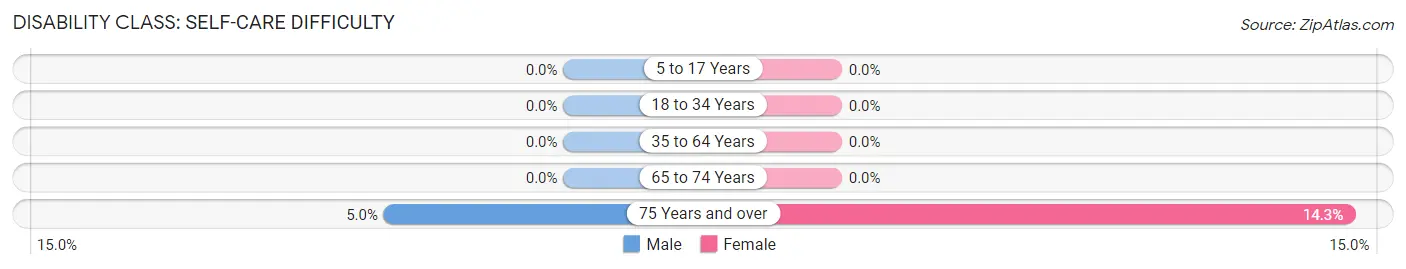
| Age Bracket | Male | Female |
| 5 to 17 Years | 0 (0.0%) | 0 (0.0%) |
| 18 to 34 Years | 0 (0.0%) | 0 (0.0%) |
| 35 to 64 Years | 0 (0.0%) | 0 (0.0%) |
| 65 to 74 Years | 0 (0.0%) | 0 (0.0%) |
| 75 Years and over | 2 (5.0%) | 5 (14.3%) |
Technology Access in Briarcliffe Acres
Computing Device Access in Briarcliffe Acres
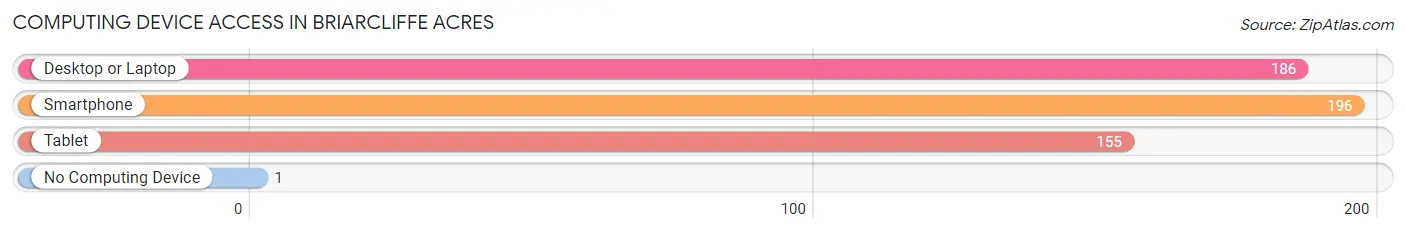
| Device Type | # Households | % Households |
| Desktop or Laptop | 186 | 90.7% |
| Smartphone | 196 | 95.6% |
| Tablet | 155 | 75.6% |
| No Computing Device | 1 | 0.5% |
| Total | 205 | 100.0% |
Internet Access in Briarcliffe Acres
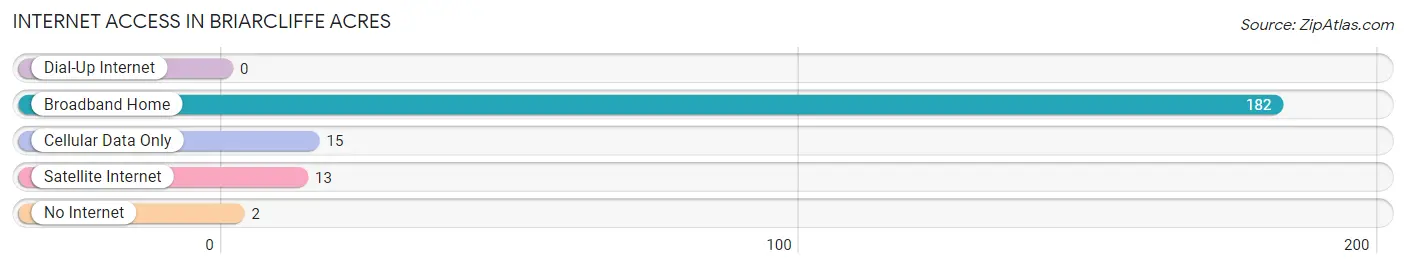
| Internet Type | # Households | % Households |
| Dial-Up Internet | 0 | 0.0% |
| Broadband Home | 182 | 88.8% |
| Cellular Data Only | 15 | 7.3% |
| Satellite Internet | 13 | 6.3% |
| No Internet | 2 | 1.0% |
| Total | 205 | 100.0% |
Briarcliffe Acres Summary
Briarcliffe Acres is a small town located in Horry County, South Carolina. It is situated on the Atlantic Ocean, just south of Myrtle Beach. The town was founded in the 1950s and has since become a popular destination for vacationers and retirees alike.
Geography
Briarcliffe Acres is located in the northeastern corner of Horry County, South Carolina. It is bordered by the Atlantic Ocean to the east, the Waccamaw River to the north, and the Intracoastal Waterway to the south. The town is situated on a peninsula, with the Waccamaw River to the north and the Intracoastal Waterway to the south. The town is approximately 4.5 square miles in size and is home to approximately 1,000 residents.
The town is located in a humid subtropical climate zone, with hot, humid summers and mild winters. The average temperature in the summer is around 80 degrees Fahrenheit, while the average temperature in the winter is around 60 degrees Fahrenheit. The town receives an average of 48 inches of rain per year, with most of the rain falling in the summer months.
Economy
Briarcliffe Acres is primarily a tourist destination, with many of its residents employed in the hospitality industry. The town is home to several hotels, restaurants, and other tourist attractions. The town also has a number of small businesses, including a grocery store, a hardware store, and a few other retail stores.
The town is also home to a number of retirement communities, which attract retirees from all over the country. These communities provide a variety of amenities, including golf courses, swimming pools, and other recreational activities.
Demographics
As of the 2010 census, the population of Briarcliffe Acres was 1,039. The racial makeup of the town was 97.3% White, 0.9% African American, 0.3% Native American, 0.3% Asian, 0.1% Pacific Islander, 0.3% from other races, and 0.9% from two or more races. Hispanic or Latino of any race were 1.2% of the population.
The median household income in Briarcliffe Acres was $50,000, and the median family income was $54,000. The per capita income for the town was $25,000. About 8.3% of families and 10.2% of the population were below the poverty line, including 14.3% of those under age 18 and 4.2% of those age 65 or over.
History
Briarcliffe Acres was founded in the 1950s by a group of developers from New York. The town was originally intended to be a resort community, and the developers built a number of hotels and other tourist attractions. The town quickly became a popular destination for vacationers and retirees alike.
In the 1970s, the town was incorporated as a municipality. Since then, the town has continued to grow and develop, and it is now home to a number of retirement communities, hotels, restaurants, and other tourist attractions. The town is also home to a number of small businesses, including a grocery store, a hardware store, and a few other retail stores.
Common Questions
What is Per Capita Income in Briarcliffe Acres?
Per Capita income in Briarcliffe Acres is $88,697.
What is the Median Family Income in Briarcliffe Acres?
Median Family Income in Briarcliffe Acres is $150,000.
What is the Median Household income in Briarcliffe Acres?
Median Household Income in Briarcliffe Acres is $134,375.
What is Family Income Deficit in Briarcliffe Acres?
Family Income Deficit in Briarcliffe Acres is $2,883.
Families that are below poverty line in Briarcliffe Acres earn $2,883 less on average than the poverty threshold level.
What is Inequality or Gini Index in Briarcliffe Acres?
Inequality or Gini Index in Briarcliffe Acres is 0.49.
What is the Total Population of Briarcliffe Acres?
Total Population of Briarcliffe Acres is 568.
What is the Total Male Population of Briarcliffe Acres?
Total Male Population of Briarcliffe Acres is 312.
What is the Total Female Population of Briarcliffe Acres?
Total Female Population of Briarcliffe Acres is 256.
What is the Ratio of Males per 100 Females in Briarcliffe Acres?
There are 121.88 Males per 100 Females in Briarcliffe Acres.
What is the Ratio of Females per 100 Males in Briarcliffe Acres?
There are 82.05 Females per 100 Males in Briarcliffe Acres.
What is the Median Population Age in Briarcliffe Acres?
Median Population Age in Briarcliffe Acres is 57.8 Years.
What is the Average Family Size in Briarcliffe Acres
Average Family Size in Briarcliffe Acres is 3.0 People.
What is the Average Household Size in Briarcliffe Acres
Average Household Size in Briarcliffe Acres is 2.8 People.
How Large is the Labor Force in Briarcliffe Acres?
There are 235 People in the Labor Forcein in Briarcliffe Acres.
What is the Percentage of People in the Labor Force in Briarcliffe Acres?
44.8% of People are in the Labor Force in Briarcliffe Acres.
What is the Unemployment Rate in Briarcliffe Acres?
Unemployment Rate in Briarcliffe Acres is 0.9%.