Golden Grove, SC Map & Demographics
Golden Grove Map
Golden Grove Overview
$34,194
PER CAPITA INCOME
$66,699
AVG FAMILY INCOME
$67,147
AVG HOUSEHOLD INCOME
24.0%
WAGE / INCOME GAP [ % ]
76.0¢/ $1
WAGE / INCOME GAP [ $ ]
0.38
INEQUALITY / GINI INDEX
3,282
TOTAL POPULATION
1,693
MALE POPULATION
1,589
FEMALE POPULATION
106.54
MALES / 100 FEMALES
93.86
FEMALES / 100 MALES
39.9
MEDIAN AGE
2.9
AVG FAMILY SIZE
2.3
AVG HOUSEHOLD SIZE
1,874
LABOR FORCE [ PEOPLE ]
71.8%
PERCENT IN LABOR FORCE
0.9%
UNEMPLOYMENT RATE
Income in Golden Grove
Income Overview in Golden Grove
Per Capita Income in Golden Grove is $34,194, while median incomes of families and households are $66,699 and $67,147 respectively.
| Characteristic | Number | Measure |
| Per Capita Income | 3,282 | $34,194 |
| Median Family Income | 852 | $66,699 |
| Mean Family Income | 852 | $75,103 |
| Median Household Income | 1,442 | $67,147 |
| Mean Household Income | 1,442 | $77,804 |
| Income Deficit | 852 | $0 |
| Wage / Income Gap (%) | 3,282 | 23.95% |
| Wage / Income Gap ($) | 3,282 | 76.05¢ per $1 |
| Gini / Inequality Index | 3,282 | 0.38 |
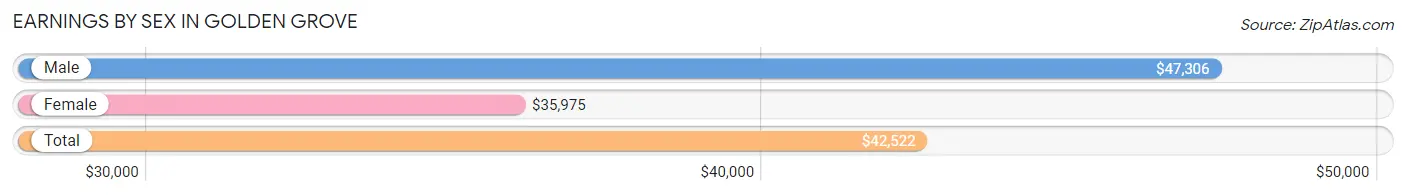
Earnings by Sex in Golden Grove
Average Earnings in Golden Grove are $42,522, $47,306 for men and $35,975 for women, a difference of 23.9%.
| Sex | Number | Average Earnings |
| Male | 941 (49.8%) | $47,306 |
| Female | 950 (50.2%) | $35,975 |
| Total | 1,891 (100.0%) | $42,522 |
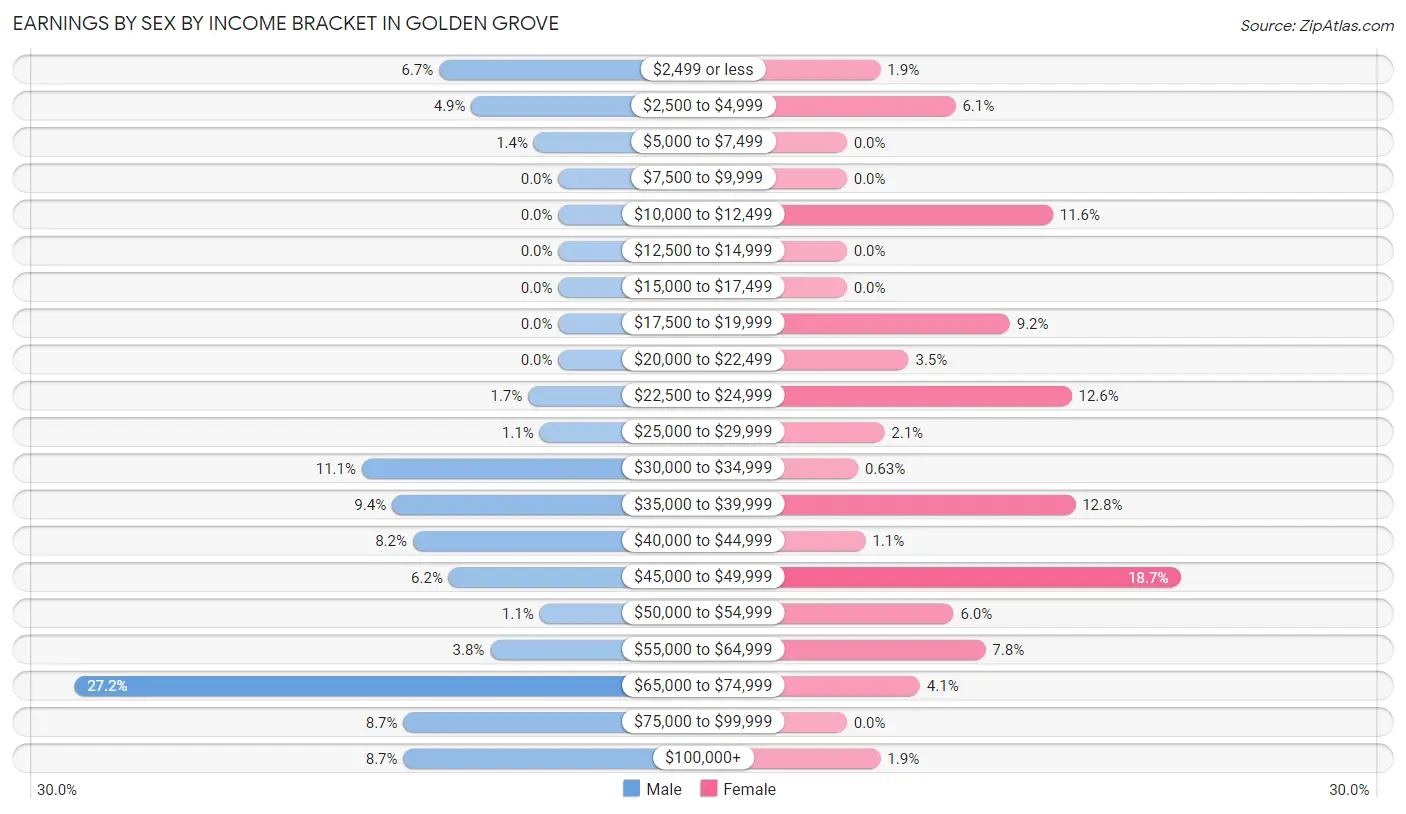
Earnings by Sex by Income Bracket in Golden Grove
The most common earnings brackets in Golden Grove are $65,000 to $74,999 for men (256 | 27.2%) and $45,000 to $49,999 for women (178 | 18.7%).
| Income | Male | Female |
| $2,499 or less | 63 (6.7%) | 18 (1.9%) |
| $2,500 to $4,999 | 46 (4.9%) | 58 (6.1%) |
| $5,000 to $7,499 | 13 (1.4%) | 0 (0.0%) |
| $7,500 to $9,999 | 0 (0.0%) | 0 (0.0%) |
| $10,000 to $12,499 | 0 (0.0%) | 110 (11.6%) |
| $12,500 to $14,999 | 0 (0.0%) | 0 (0.0%) |
| $15,000 to $17,499 | 0 (0.0%) | 0 (0.0%) |
| $17,500 to $19,999 | 0 (0.0%) | 87 (9.2%) |
| $20,000 to $22,499 | 0 (0.0%) | 33 (3.5%) |
| $22,500 to $24,999 | 16 (1.7%) | 120 (12.6%) |
| $25,000 to $29,999 | 10 (1.1%) | 20 (2.1%) |
| $30,000 to $34,999 | 104 (11.1%) | 6 (0.6%) |
| $35,000 to $39,999 | 88 (9.3%) | 122 (12.8%) |
| $40,000 to $44,999 | 77 (8.2%) | 10 (1.1%) |
| $45,000 to $49,999 | 58 (6.2%) | 178 (18.7%) |
| $50,000 to $54,999 | 10 (1.1%) | 57 (6.0%) |
| $55,000 to $64,999 | 36 (3.8%) | 74 (7.8%) |
| $65,000 to $74,999 | 256 (27.2%) | 39 (4.1%) |
| $75,000 to $99,999 | 82 (8.7%) | 0 (0.0%) |
| $100,000+ | 82 (8.7%) | 18 (1.9%) |
| Total | 941 (100.0%) | 950 (100.0%) |
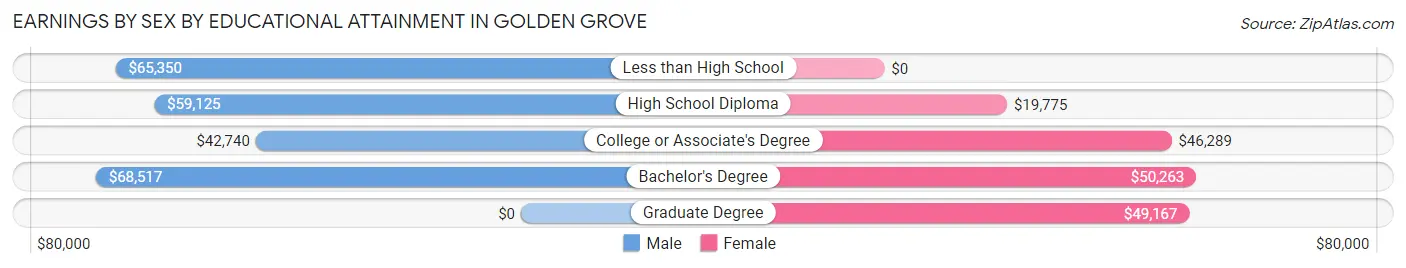
Earnings by Sex by Educational Attainment in Golden Grove
Average earnings in Golden Grove are $57,563 for men and $38,433 for women, a difference of 33.2%. Men with an educational attainment of bachelor's degree enjoy the highest average annual earnings of $68,517, while those with college or associate's degree education earn the least with $42,740. Women with an educational attainment of bachelor's degree earn the most with the average annual earnings of $50,263, while those with high school diploma education have the smallest earnings of $19,775.
| Educational Attainment | Male Income | Female Income |
| Less than High School | $65,350 | $0 |
| High School Diploma | $59,125 | $19,775 |
| College or Associate's Degree | $42,740 | $46,289 |
| Bachelor's Degree | $68,517 | $50,263 |
| Graduate Degree | - | - |
| Total | $57,563 | $38,433 |
Family Income in Golden Grove
Family Income Brackets in Golden Grove
According to the Golden Grove family income data, there are 210 families falling into the $50,000 to $74,999 income range, which is the most common income bracket and makes up 24.6% of all families.
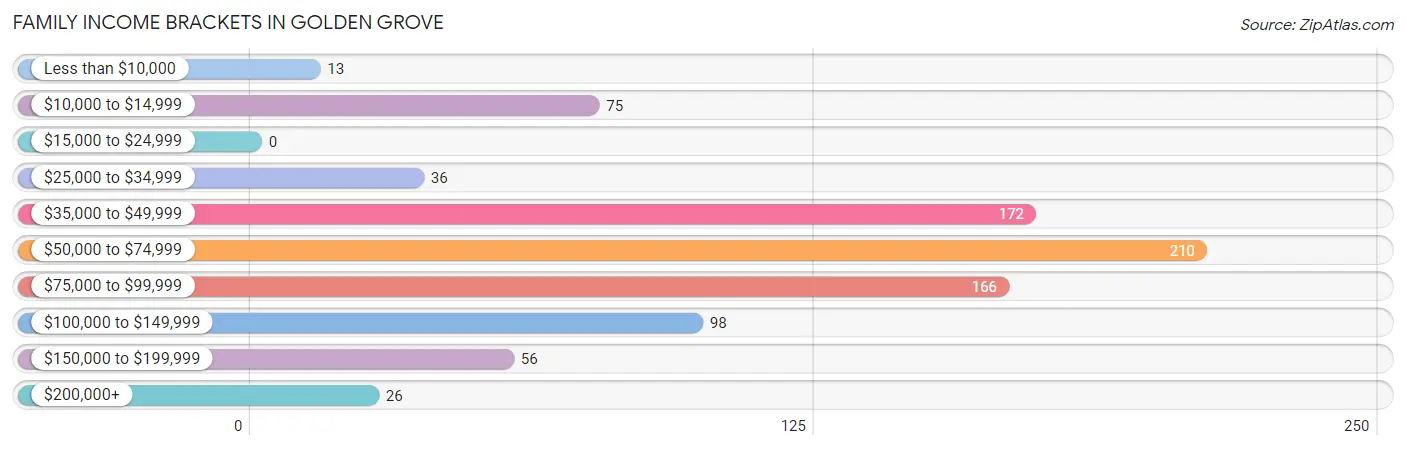
| Income Bracket | # Families | % Families |
| Less than $10,000 | 13 | 1.5% |
| $10,000 to $14,999 | 75 | 8.8% |
| $15,000 to $24,999 | 0 | 0.0% |
| $25,000 to $34,999 | 36 | 4.2% |
| $35,000 to $49,999 | 172 | 20.2% |
| $50,000 to $74,999 | 210 | 24.6% |
| $75,000 to $99,999 | 166 | 19.5% |
| $100,000 to $149,999 | 98 | 11.5% |
| $150,000 to $199,999 | 56 | 6.6% |
| $200,000+ | 26 | 3.1% |
Family Income by Famaliy Size in Golden Grove
5-person families (85 | 10.0%) account for the highest median family income in Golden Grove with $85,110 per family, while 2-person families (431 | 50.6%) have the highest median income of $33,021 per family member.
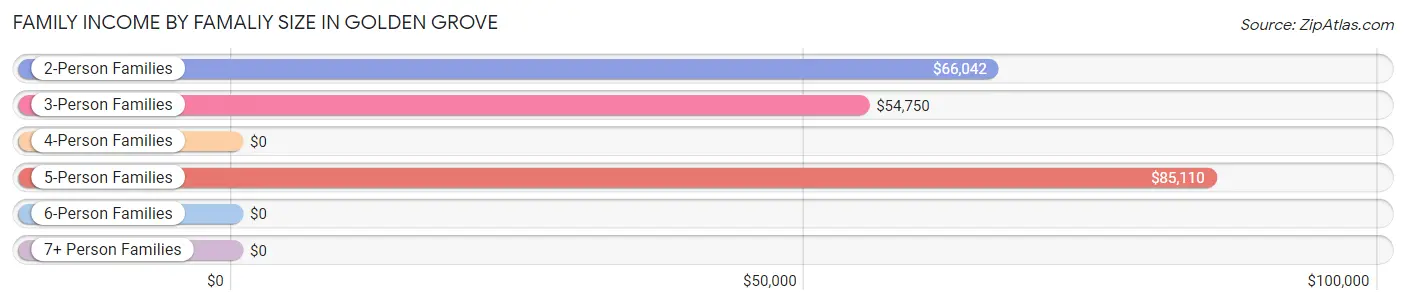
| Income Bracket | # Families | Median Income |
| 2-Person Families | 431 (50.6%) | $66,042 |
| 3-Person Families | 230 (27.0%) | $54,750 |
| 4-Person Families | 85 (10.0%) | $0 |
| 5-Person Families | 85 (10.0%) | $85,110 |
| 6-Person Families | 21 (2.5%) | $0 |
| 7+ Person Families | 0 (0.0%) | $0 |
| Total | 852 (100.0%) | $66,699 |
Family Income by Number of Earners in Golden Grove
The median family income in Golden Grove is $66,699, with families comprising 2 earners (302) having the highest median family income of $91,758, while families with no earners (196) have the lowest median family income of $41,276, accounting for 35.4% and 23.0% of families, respectively.
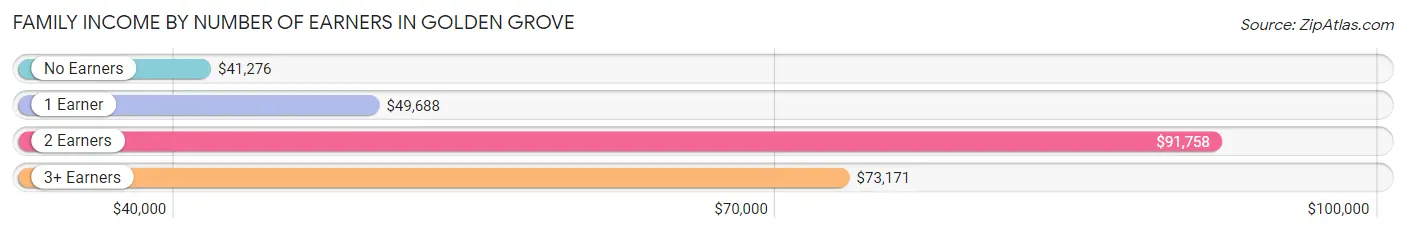
| Number of Earners | # Families | Median Income |
| No Earners | 196 (23.0%) | $41,276 |
| 1 Earner | 226 (26.5%) | $49,688 |
| 2 Earners | 302 (35.4%) | $91,758 |
| 3+ Earners | 128 (15.0%) | $73,171 |
| Total | 852 (100.0%) | $66,699 |
Household Income in Golden Grove
Household Income Brackets in Golden Grove
With 410 households falling in the category, the $50,000 to $74,999 income range is the most frequent in Golden Grove, accounting for 28.4% of all households. In contrast, only 13 households (0.9%) fall into the less than $10,000 income bracket, making it the least populous group.
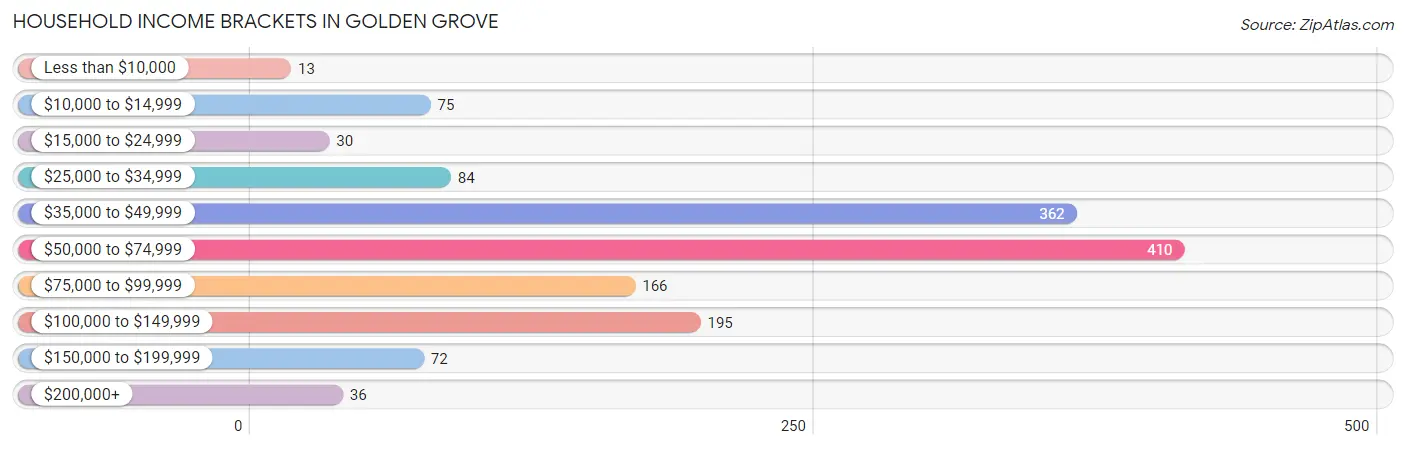
| Income Bracket | # Households | % Households |
| Less than $10,000 | 13 | 0.9% |
| $10,000 to $14,999 | 75 | 5.2% |
| $15,000 to $24,999 | 30 | 2.1% |
| $25,000 to $34,999 | 84 | 5.8% |
| $35,000 to $49,999 | 362 | 25.1% |
| $50,000 to $74,999 | 410 | 28.4% |
| $75,000 to $99,999 | 166 | 11.5% |
| $100,000 to $149,999 | 195 | 13.5% |
| $150,000 to $199,999 | 72 | 5.0% |
| $200,000+ | 36 | 2.5% |
Household Income by Householder Age in Golden Grove
The median household income in Golden Grove is $67,147, with the highest median household income of $85,184 found in the 45 to 64 years age bracket for the primary householder. A total of 407 households (28.2%) fall into this category. Meanwhile, the 15 to 24 years age bracket for the primary householder has the lowest median household income of $0, with 18 households (1.3%) in this group.
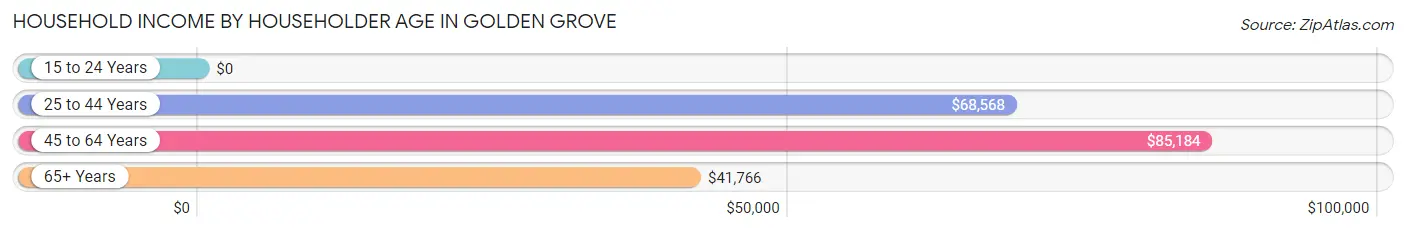
| Income Bracket | # Households | Median Income |
| 15 to 24 Years | 18 (1.3%) | $0 |
| 25 to 44 Years | 703 (48.7%) | $68,568 |
| 45 to 64 Years | 407 (28.2%) | $85,184 |
| 65+ Years | 314 (21.8%) | $41,766 |
| Total | 1,442 (100.0%) | $67,147 |
Poverty in Golden Grove
Income Below Poverty by Sex and Age in Golden Grove
With 12.9% poverty level for males and 8.3% for females among the residents of Golden Grove, 5 year old males and 55 to 64 year old females are the most vulnerable to poverty, with 22 males (100.0%) and 34 females (29.1%) in their respective age groups living below the poverty level.
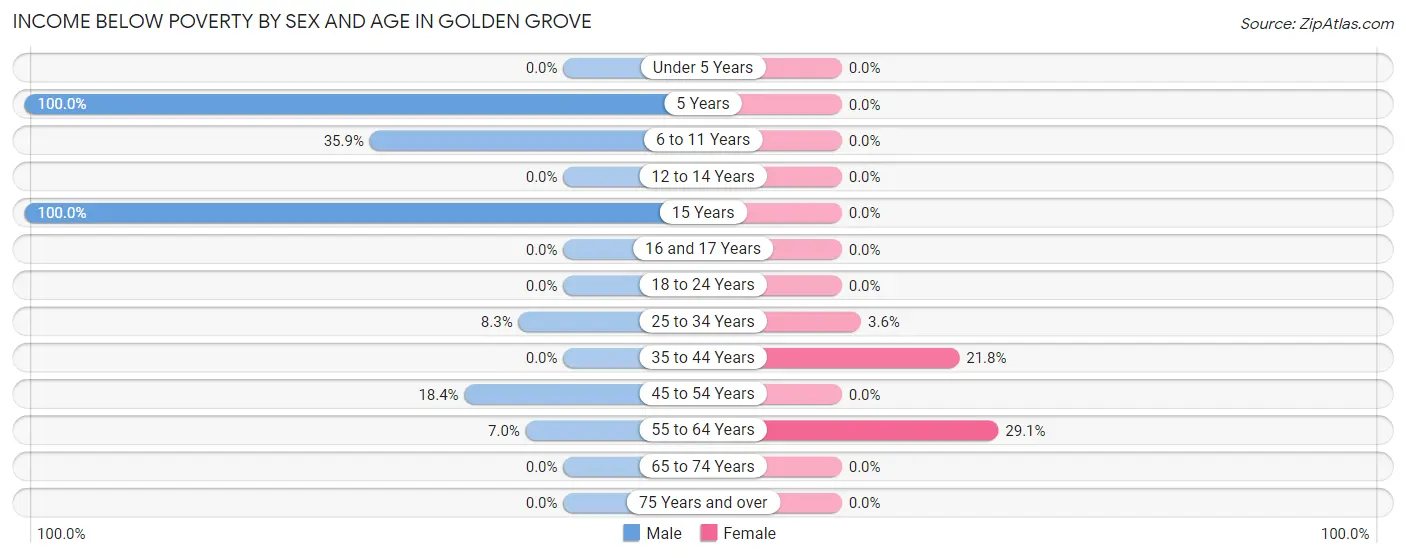
| Age Bracket | Male | Female |
| Under 5 Years | 0 (0.0%) | 0 (0.0%) |
| 5 Years | 22 (100.0%) | 0 (0.0%) |
| 6 to 11 Years | 69 (35.9%) | 0 (0.0%) |
| 12 to 14 Years | 0 (0.0%) | 0 (0.0%) |
| 15 Years | 55 (100.0%) | 0 (0.0%) |
| 16 and 17 Years | 0 (0.0%) | 0 (0.0%) |
| 18 to 24 Years | 0 (0.0%) | 0 (0.0%) |
| 25 to 34 Years | 18 (8.3%) | 12 (3.6%) |
| 35 to 44 Years | 0 (0.0%) | 82 (21.8%) |
| 45 to 54 Years | 38 (18.4%) | 0 (0.0%) |
| 55 to 64 Years | 13 (7.0%) | 34 (29.1%) |
| 65 to 74 Years | 0 (0.0%) | 0 (0.0%) |
| 75 Years and over | 0 (0.0%) | 0 (0.0%) |
| Total | 215 (12.9%) | 128 (8.3%) |
Income Above Poverty by Sex and Age in Golden Grove
According to the poverty statistics in Golden Grove, males aged under 5 years and females aged under 5 years are the age groups that are most secure financially, with 100.0% of males and 100.0% of females in these age groups living above the poverty line.
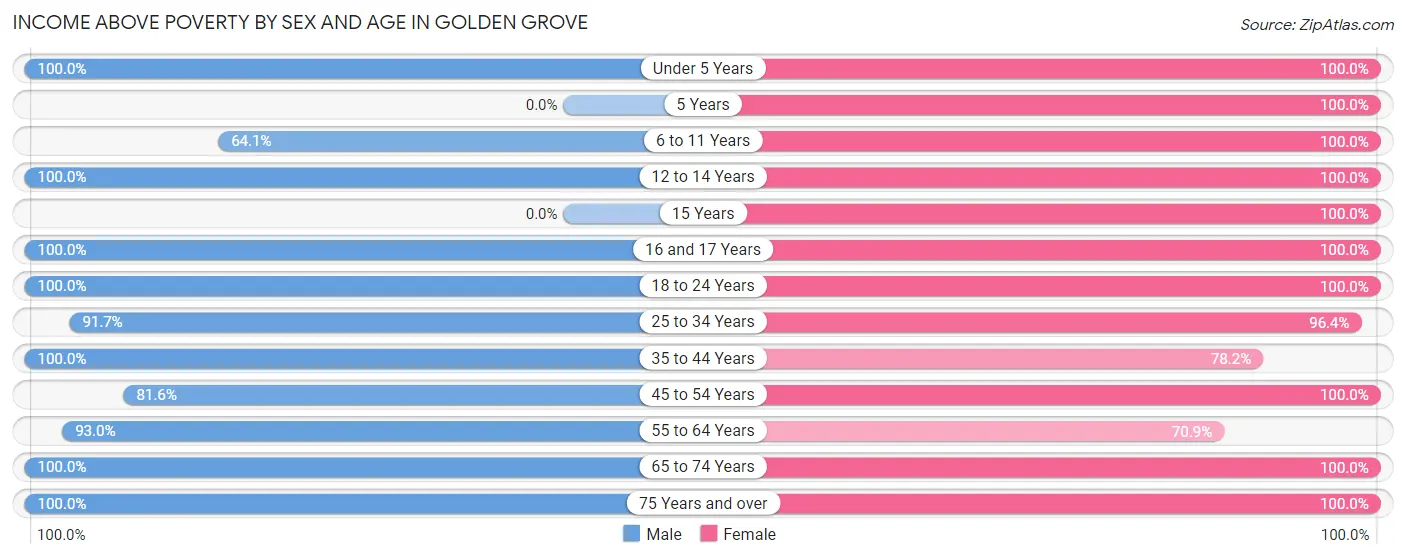
| Age Bracket | Male | Female |
| Under 5 Years | 103 (100.0%) | 56 (100.0%) |
| 5 Years | 0 (0.0%) | 14 (100.0%) |
| 6 to 11 Years | 123 (64.1%) | 14 (100.0%) |
| 12 to 14 Years | 81 (100.0%) | 7 (100.0%) |
| 15 Years | 0 (0.0%) | 46 (100.0%) |
| 16 and 17 Years | 31 (100.0%) | 80 (100.0%) |
| 18 to 24 Years | 62 (100.0%) | 39 (100.0%) |
| 25 to 34 Years | 198 (91.7%) | 323 (96.4%) |
| 35 to 44 Years | 289 (100.0%) | 294 (78.2%) |
| 45 to 54 Years | 169 (81.6%) | 176 (100.0%) |
| 55 to 64 Years | 173 (93.0%) | 83 (70.9%) |
| 65 to 74 Years | 134 (100.0%) | 25 (100.0%) |
| 75 Years and over | 83 (100.0%) | 254 (100.0%) |
| Total | 1,446 (87.1%) | 1,411 (91.7%) |
Income Below Poverty Among Married-Couple Families in Golden Grove
The poverty statistics for married-couple families in Golden Grove show that 5.7% or 33 of the total 584 families live below the poverty line. Families with 1 or 2 children have the highest poverty rate of 13.0%, comprising of 33 families. On the other hand, families with no children have the lowest poverty rate of 0.0%, which includes 0 families.
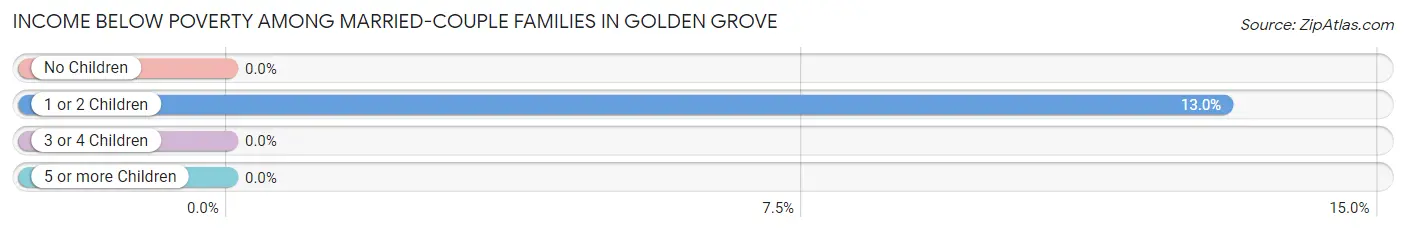
| Children | Above Poverty | Below Poverty |
| No Children | 289 (100.0%) | 0 (0.0%) |
| 1 or 2 Children | 221 (87.0%) | 33 (13.0%) |
| 3 or 4 Children | 41 (100.0%) | 0 (0.0%) |
| 5 or more Children | 0 (0.0%) | 0 (0.0%) |
| Total | 551 (94.4%) | 33 (5.7%) |
Income Below Poverty Among Single-Parent Households in Golden Grove
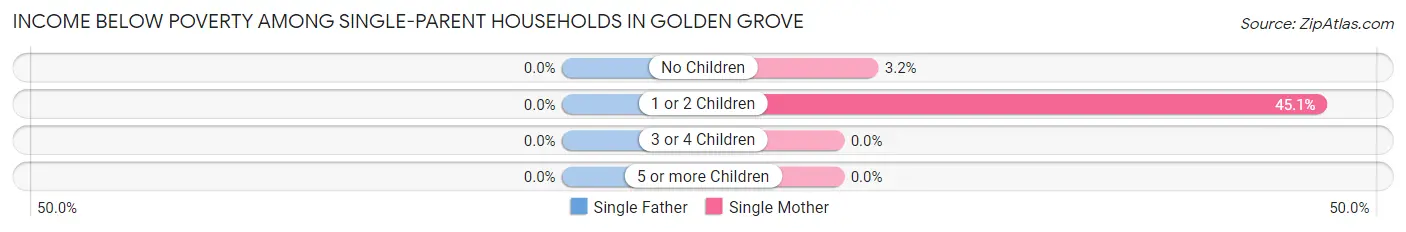
| Children | Single Father | Single Mother |
| No Children | 0 (0.0%) | 5 (3.2%) |
| 1 or 2 Children | 0 (0.0%) | 50 (45.1%) |
| 3 or 4 Children | 0 (0.0%) | 0 (0.0%) |
| 5 or more Children | 0 (0.0%) | 0 (0.0%) |
| Total | 0 (0.0%) | 55 (20.5%) |
Income Below Poverty Among Married-Couple vs Single-Parent Households in Golden Grove
The poverty data for Golden Grove shows that 33 of the married-couple family households (5.7%) and 55 of the single-parent households (20.5%) are living below the poverty level. Within the married-couple family households, those with 1 or 2 children have the highest poverty rate, with 33 households (13.0%) falling below the poverty line. Among the single-parent households, those with 1 or 2 children have the highest poverty rate, with 50 household (45.1%) living below poverty.
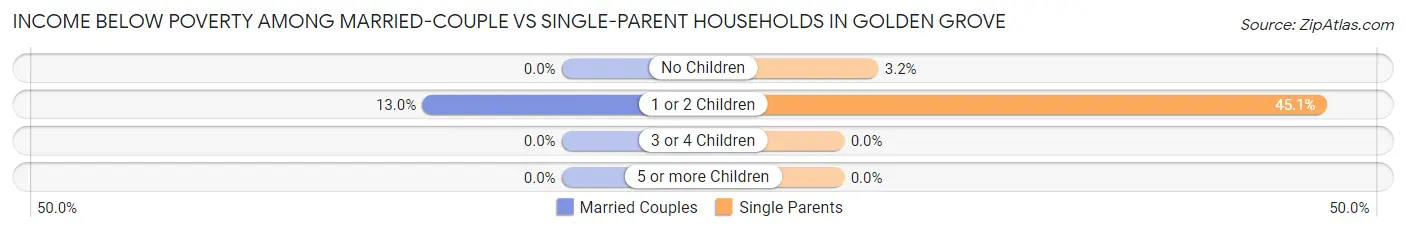
| Children | Married-Couple Families | Single-Parent Households |
| No Children | 0 (0.0%) | 5 (3.2%) |
| 1 or 2 Children | 33 (13.0%) | 50 (45.1%) |
| 3 or 4 Children | 0 (0.0%) | 0 (0.0%) |
| 5 or more Children | 0 (0.0%) | 0 (0.0%) |
| Total | 33 (5.7%) | 55 (20.5%) |
Race in Golden Grove
The most populous races in Golden Grove are White / Caucasian (1,854 | 56.5%), Black / African American (1,023 | 31.2%), and Two or more Races (294 | 9.0%).
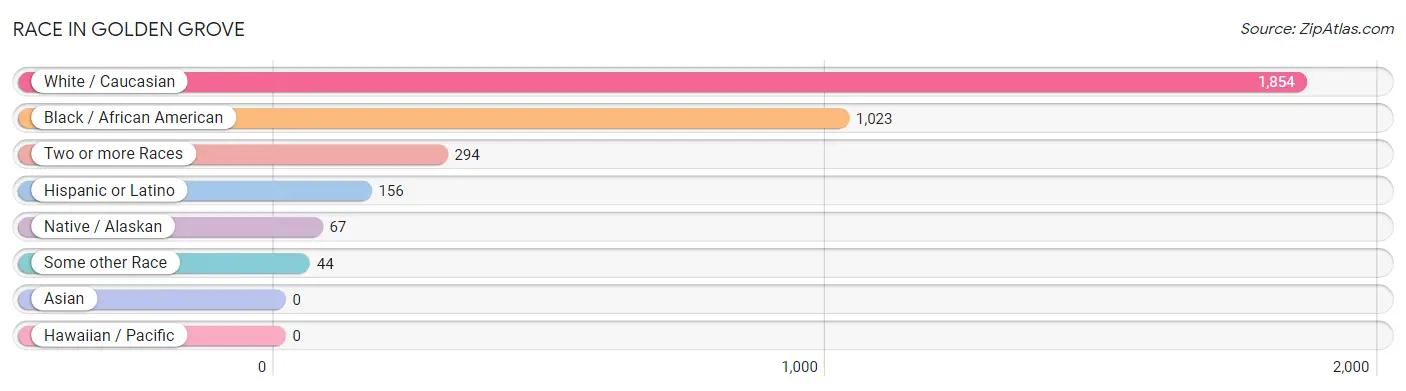
| Race | # Population | % Population |
| Asian | 0 | 0.0% |
| Black / African American | 1,023 | 31.2% |
| Hawaiian / Pacific | 0 | 0.0% |
| Hispanic or Latino | 156 | 4.8% |
| Native / Alaskan | 67 | 2.0% |
| White / Caucasian | 1,854 | 56.5% |
| Two or more Races | 294 | 9.0% |
| Some other Race | 44 | 1.3% |
| Total | 3,282 | 100.0% |
Ancestry in Golden Grove
The most populous ancestries reported in Golden Grove are American (429 | 13.1%), English (306 | 9.3%), German (304 | 9.3%), South American (133 | 4.1%), and Irish (126 | 3.8%), together accounting for 39.5% of all Golden Grove residents.
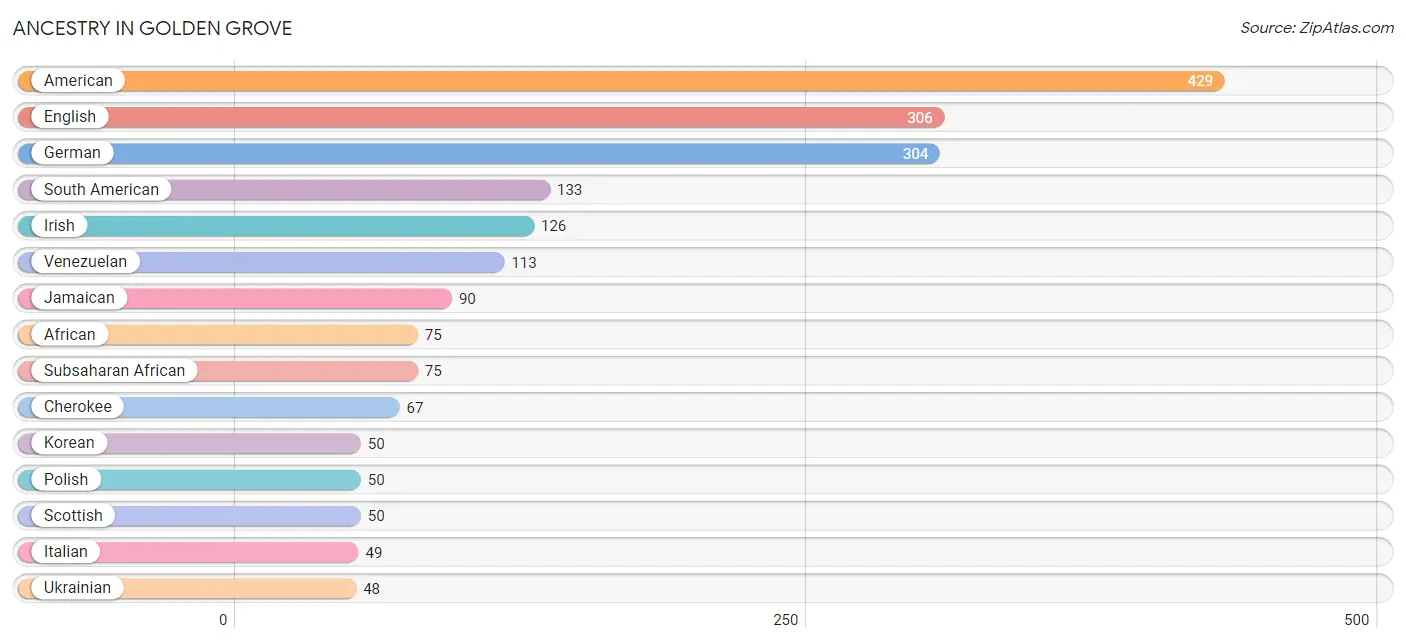
| Ancestry | # Population | % Population |
| African | 75 | 2.3% |
| American | 429 | 13.1% |
| Arab | 1 | 0.0% |
| Brazilian | 38 | 1.2% |
| British | 30 | 0.9% |
| Cherokee | 67 | 2.0% |
| Choctaw | 17 | 0.5% |
| Colombian | 20 | 0.6% |
| Cuban | 22 | 0.7% |
| Dominican | 1 | 0.0% |
| Dutch | 16 | 0.5% |
| English | 306 | 9.3% |
| French | 44 | 1.3% |
| French Canadian | 9 | 0.3% |
| German | 304 | 9.3% |
| Irish | 126 | 3.8% |
| Italian | 49 | 1.5% |
| Jamaican | 90 | 2.7% |
| Korean | 50 | 1.5% |
| Lebanese | 1 | 0.0% |
| Polish | 50 | 1.5% |
| Scotch-Irish | 31 | 0.9% |
| Scottish | 50 | 1.5% |
| South American | 133 | 4.1% |
| Subsaharan African | 75 | 2.3% |
| Swedish | 15 | 0.5% |
| Ukrainian | 48 | 1.5% |
| Venezuelan | 113 | 3.4% | View All 28 Rows |
Immigrants in Golden Grove
The most numerous immigrant groups reported in Golden Grove came from Europe (177 | 5.4%), Germany (177 | 5.4%), Western Europe (177 | 5.4%), Latin America (135 | 4.1%), and South America (135 | 4.1%), together accounting for 24.4% of all Golden Grove residents.
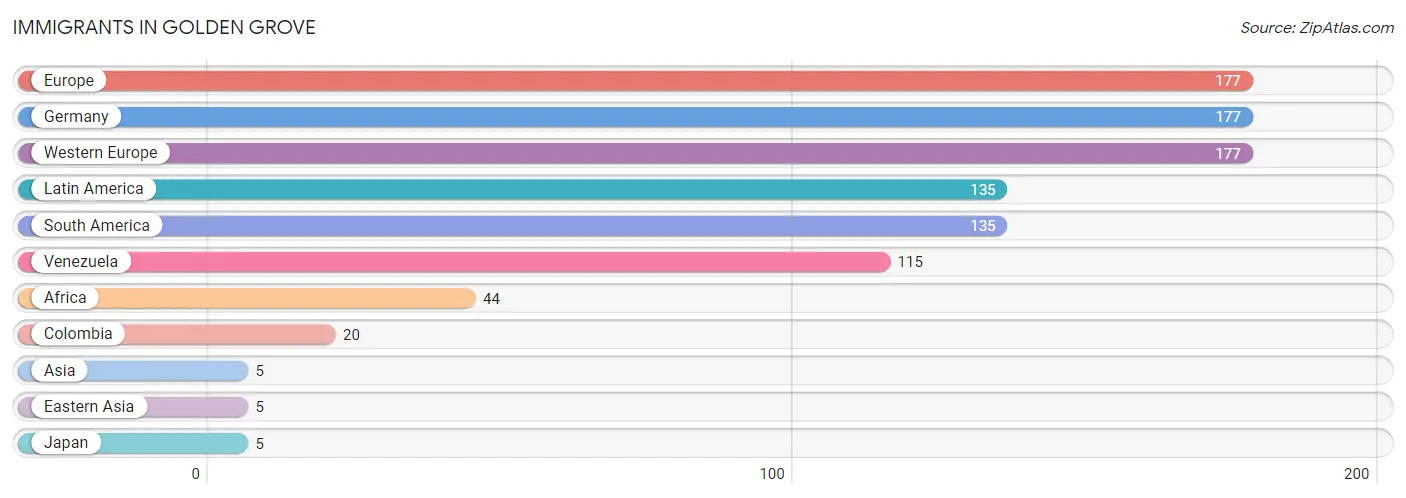
| Immigration Origin | # Population | % Population |
| Africa | 44 | 1.3% |
| Asia | 5 | 0.2% |
| Colombia | 20 | 0.6% |
| Eastern Asia | 5 | 0.2% |
| Europe | 177 | 5.4% |
| Germany | 177 | 5.4% |
| Japan | 5 | 0.2% |
| Latin America | 135 | 4.1% |
| South America | 135 | 4.1% |
| Venezuela | 115 | 3.5% |
| Western Europe | 177 | 5.4% | View All 11 Rows |
Sex and Age in Golden Grove
Sex and Age in Golden Grove
The most populous age groups in Golden Grove are 40 to 44 Years (253 | 14.9%) for men and 25 to 29 Years (233 | 14.7%) for women.
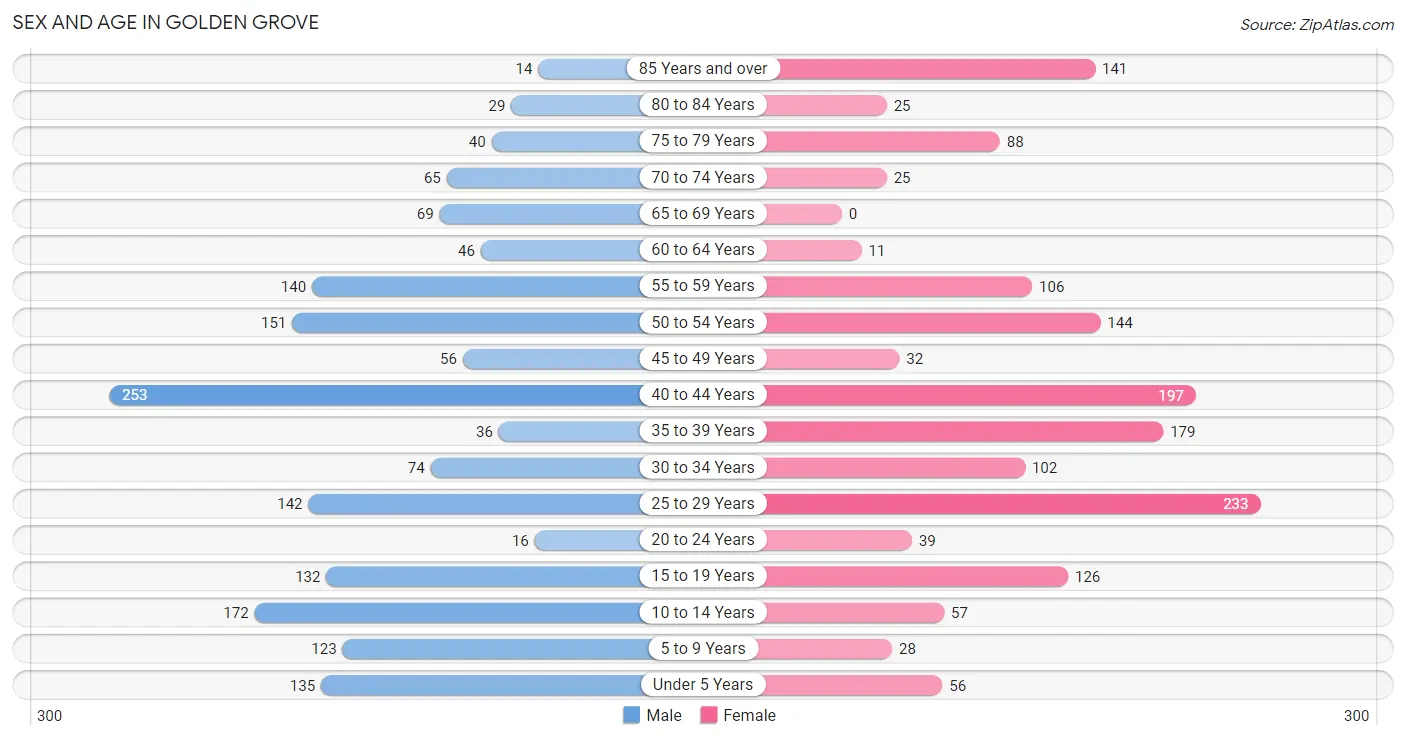
| Age Bracket | Male | Female |
| Under 5 Years | 135 (8.0%) | 56 (3.5%) |
| 5 to 9 Years | 123 (7.3%) | 28 (1.8%) |
| 10 to 14 Years | 172 (10.2%) | 57 (3.6%) |
| 15 to 19 Years | 132 (7.8%) | 126 (7.9%) |
| 20 to 24 Years | 16 (0.9%) | 39 (2.5%) |
| 25 to 29 Years | 142 (8.4%) | 233 (14.7%) |
| 30 to 34 Years | 74 (4.4%) | 102 (6.4%) |
| 35 to 39 Years | 36 (2.1%) | 179 (11.3%) |
| 40 to 44 Years | 253 (14.9%) | 197 (12.4%) |
| 45 to 49 Years | 56 (3.3%) | 32 (2.0%) |
| 50 to 54 Years | 151 (8.9%) | 144 (9.1%) |
| 55 to 59 Years | 140 (8.3%) | 106 (6.7%) |
| 60 to 64 Years | 46 (2.7%) | 11 (0.7%) |
| 65 to 69 Years | 69 (4.1%) | 0 (0.0%) |
| 70 to 74 Years | 65 (3.8%) | 25 (1.6%) |
| 75 to 79 Years | 40 (2.4%) | 88 (5.5%) |
| 80 to 84 Years | 29 (1.7%) | 25 (1.6%) |
| 85 Years and over | 14 (0.8%) | 141 (8.9%) |
| Total | 1,693 (100.0%) | 1,589 (100.0%) |
Families and Households in Golden Grove
Median Family Size in Golden Grove
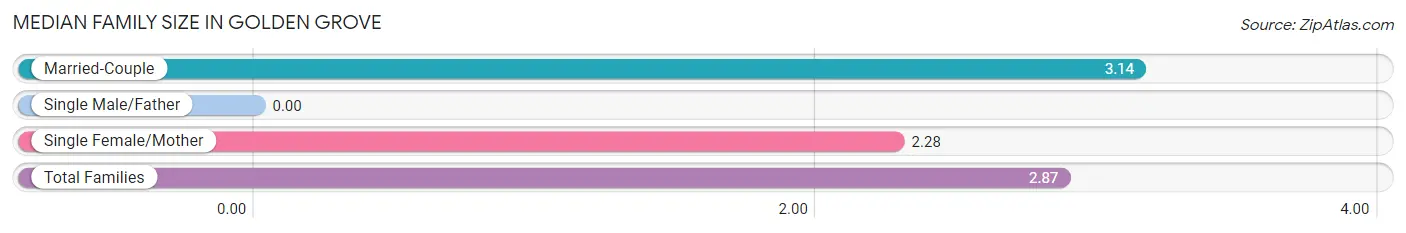
| Family Type | # Families | Family Size |
| Married-Couple | 584 (68.5%) | 3.14 |
| Single Male/Father | 0 (0.0%) | - |
| Single Female/Mother | 268 (31.5%) | 2.28 |
| Total Families | 852 (100.0%) | 2.87 |
Median Household Size in Golden Grove
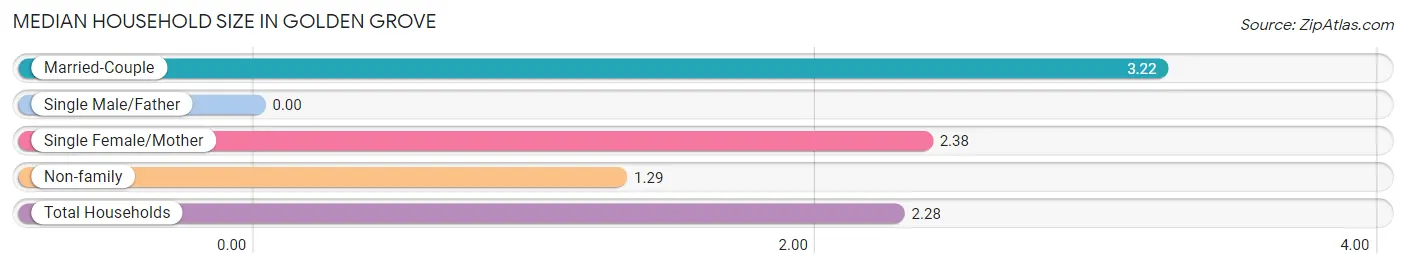
| Household Type | # Households | Household Size |
| Married-Couple | 584 (40.5%) | 3.22 |
| Single Male/Father | 0 (0.0%) | - |
| Single Female/Mother | 268 (18.6%) | 2.38 |
| Non-family | 590 (40.9%) | 1.29 |
| Total Households | 1,442 (100.0%) | 2.28 |
Household Size by Marriage Status in Golden Grove
Out of a total of 1,442 households in Golden Grove, 852 (59.1%) are family households, while 590 (40.9%) are nonfamily households. The most numerous type of family households are 2-person households, comprising 425, and the most common type of nonfamily households are 1-person households, comprising 490.
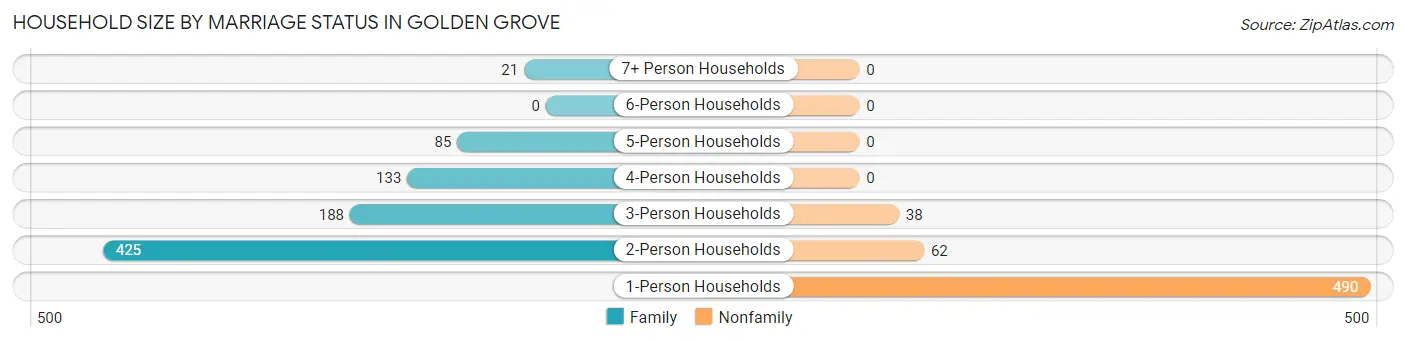
| Household Size | Family Households | Nonfamily Households |
| 1-Person Households | - | 490 (34.0%) |
| 2-Person Households | 425 (29.5%) | 62 (4.3%) |
| 3-Person Households | 188 (13.0%) | 38 (2.6%) |
| 4-Person Households | 133 (9.2%) | 0 (0.0%) |
| 5-Person Households | 85 (5.9%) | 0 (0.0%) |
| 6-Person Households | 0 (0.0%) | 0 (0.0%) |
| 7+ Person Households | 21 (1.5%) | 0 (0.0%) |
| Total | 852 (59.1%) | 590 (40.9%) |
Female Fertility in Golden Grove
Fertility by Age in Golden Grove
| Age Bracket | Women with Births | Births / 1,000 Women |
| 15 to 19 years | 0 (0.0%) | 0.0 |
| 20 to 34 years | 0 (0.0%) | 0.0 |
| 35 to 50 years | 0 (0.0%) | 0.0 |
| Total | 0 (0.0%) | 0.0 |
Fertility by Age by Marriage Status in Golden Grove
| Age Bracket | Married | Unmarried |
| 15 to 19 years | 0 (0.0%) | 0 (0.0%) |
| 20 to 34 years | 0 (0.0%) | 0 (0.0%) |
| 35 to 50 years | 0 (0.0%) | 0 (0.0%) |
| Total | 0 (0.0%) | 0 (0.0%) |
Fertility by Education in Golden Grove
| Educational Attainment | Women with Births | Births / 1,000 Women |
| Less than High School | 0 (0.0%) | 0.0 |
| High School Diploma | 0 (0.0%) | 0.0 |
| College or Associate's Degree | 0 (0.0%) | 0.0 |
| Bachelor's Degree | 0 (0.0%) | 0.0 |
| Graduate Degree | 0 (0.0%) | 0.0 |
| Total | 0 (0.0%) | 0.0 |
Fertility by Education by Marriage Status in Golden Grove
| Educational Attainment | Married | Unmarried |
| Less than High School | 0 (0.0%) | 0 (0.0%) |
| High School Diploma | 0 (0.0%) | 0 (0.0%) |
| College or Associate's Degree | 0 (0.0%) | 0 (0.0%) |
| Bachelor's Degree | 0 (0.0%) | 0 (0.0%) |
| Graduate Degree | 0 (0.0%) | 0 (0.0%) |
| Total | 0 (0.0%) | 0 (0.0%) |
Employment Characteristics in Golden Grove
Employment by Class of Employer in Golden Grove
Among the 1,812 employed individuals in Golden Grove, private company employees (1,600 | 88.3%), self-employed (not incorporated) (67 | 3.7%), and local government employees (56 | 3.1%) make up the most common classes of employment.
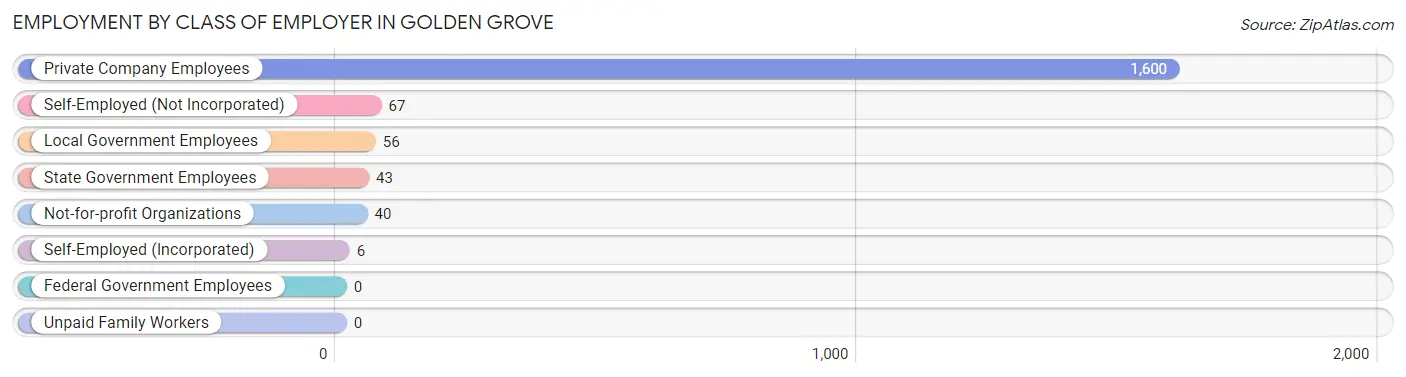
| Employer Class | # Employees | % Employees |
| Private Company Employees | 1,600 | 88.3% |
| Self-Employed (Incorporated) | 6 | 0.3% |
| Self-Employed (Not Incorporated) | 67 | 3.7% |
| Not-for-profit Organizations | 40 | 2.2% |
| Local Government Employees | 56 | 3.1% |
| State Government Employees | 43 | 2.4% |
| Federal Government Employees | 0 | 0.0% |
| Unpaid Family Workers | 0 | 0.0% |
| Total | 1,812 | 100.0% |
Employment Status by Age in Golden Grove
According to the labor force statistics for Golden Grove, out of the total population over 16 years of age (2,610), 71.8% or 1,874 individuals are in the labor force, with 0.9% or 17 of them unemployed. The age group with the highest labor force participation rate is 20 to 24 years, with 100.0% or 55 individuals in the labor force. Within the labor force, the 25 to 29 years age range has the highest percentage of unemployed individuals, with 3.8% or 12 of them being unemployed.
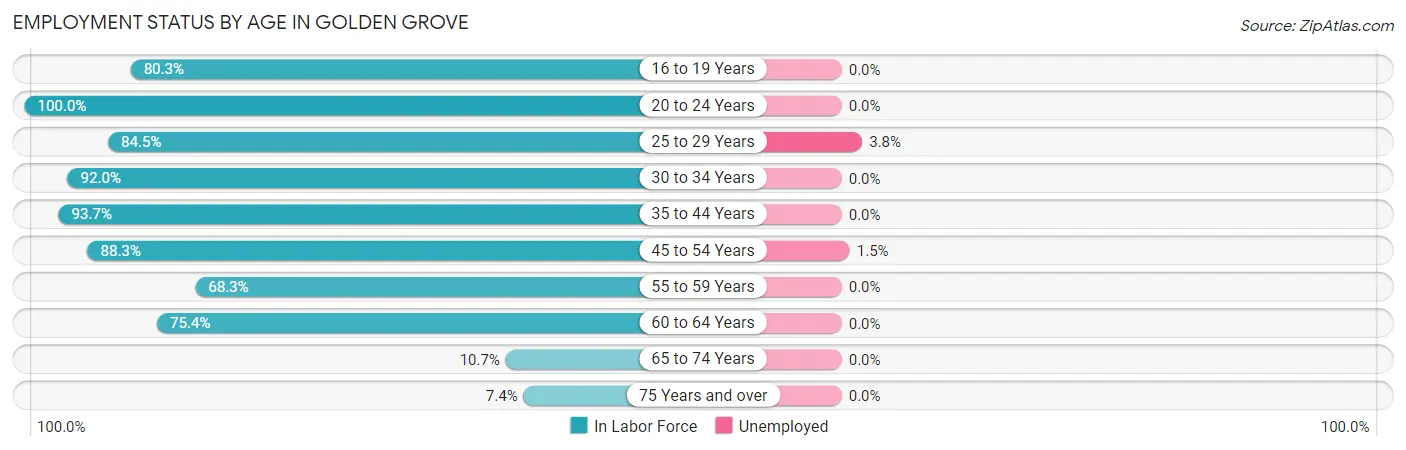
| Age Bracket | In Labor Force | Unemployed |
| 16 to 19 Years | 126 (80.3%) | 0 (0.0%) |
| 20 to 24 Years | 55 (100.0%) | 0 (0.0%) |
| 25 to 29 Years | 317 (84.5%) | 12 (3.8%) |
| 30 to 34 Years | 162 (92.0%) | 0 (0.0%) |
| 35 to 44 Years | 623 (93.7%) | 0 (0.0%) |
| 45 to 54 Years | 338 (88.3%) | 5 (1.5%) |
| 55 to 59 Years | 168 (68.3%) | 0 (0.0%) |
| 60 to 64 Years | 43 (75.4%) | 0 (0.0%) |
| 65 to 74 Years | 17 (10.7%) | 0 (0.0%) |
| 75 Years and over | 25 (7.4%) | 0 (0.0%) |
| Total | 1,874 (71.8%) | 17 (0.9%) |
Employment Status by Educational Attainment in Golden Grove
According to labor force statistics for Golden Grove, 86.8% of individuals (1,651) out of the total population between 25 and 64 years of age (1,902) are in the labor force, with 1.0% or 17 of them being unemployed. The group with the highest labor force participation rate are those with the educational attainment of less than high school, with 100.0% or 102 individuals in the labor force. Within the labor force, individuals with college / associate degree education have the highest percentage of unemployment, with 2.1% or 12 of them being unemployed.
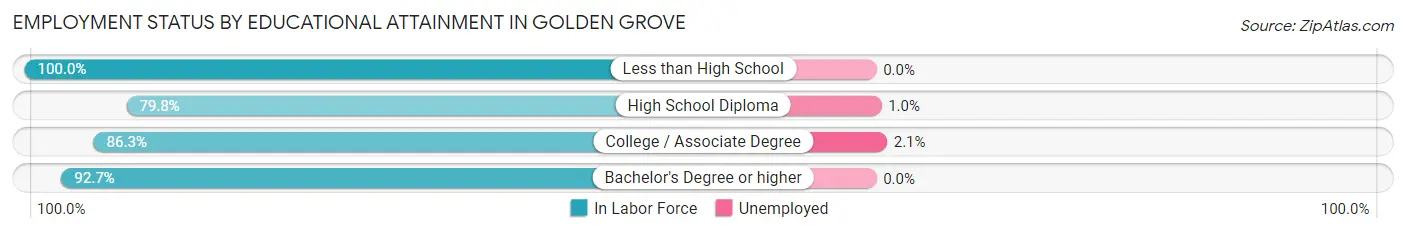
| Educational Attainment | In Labor Force | Unemployed |
| Less than High School | 102 (100.0%) | 0 (0.0%) |
| High School Diploma | 479 (79.8%) | 6 (1.0%) |
| College / Associate Degree | 565 (86.3%) | 14 (2.1%) |
| Bachelor's Degree or higher | 505 (92.7%) | 0 (0.0%) |
| Total | 1,651 (86.8%) | 19 (1.0%) |
Employment Occupations by Sex in Golden Grove
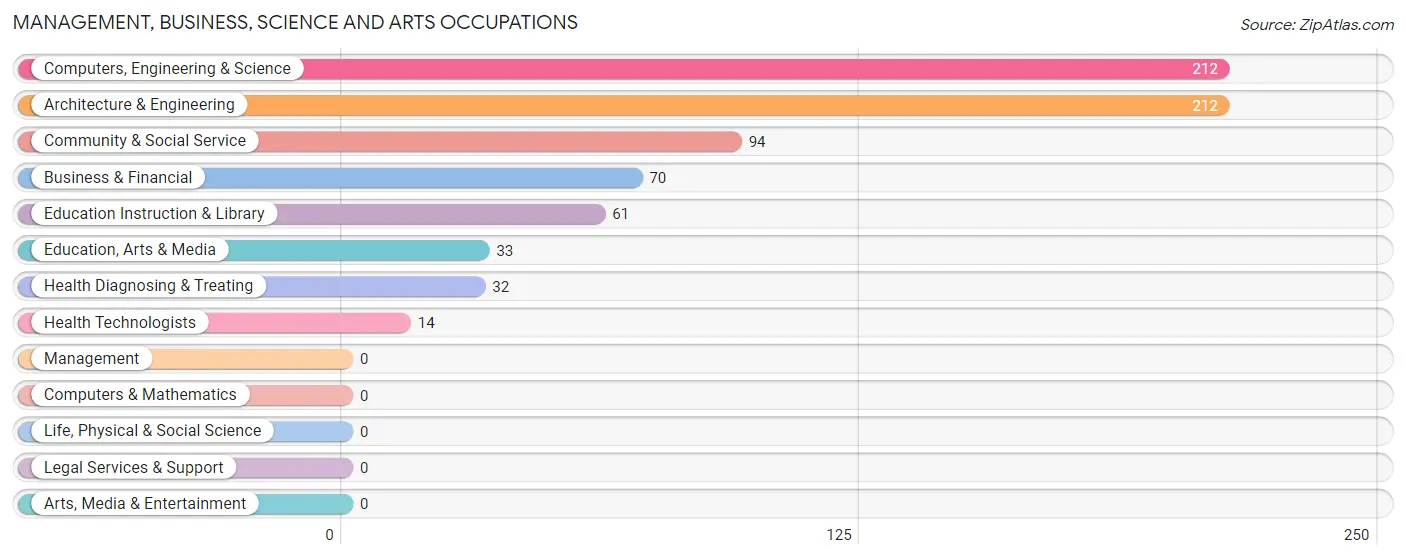
Management, Business, Science and Arts Occupations
The most common Management, Business, Science and Arts occupations in Golden Grove are Computers, Engineering & Science (212 | 11.4%), Architecture & Engineering (212 | 11.4%), Community & Social Service (94 | 5.1%), Business & Financial (70 | 3.8%), and Education Instruction & Library (61 | 3.3%).
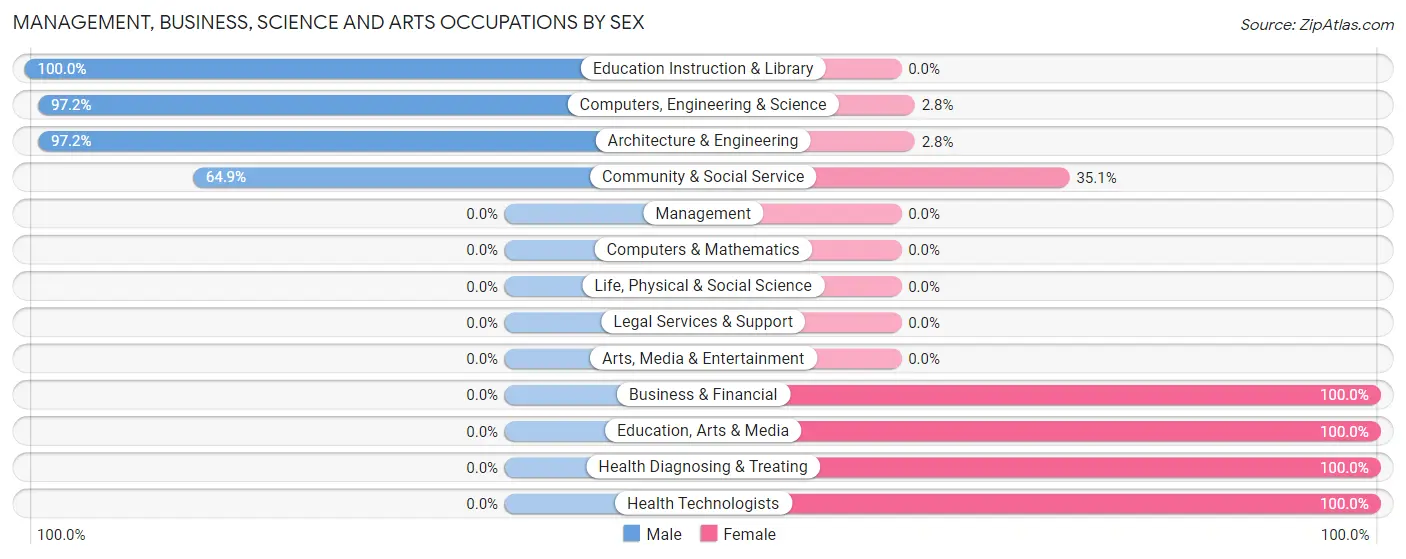
Management, Business, Science and Arts Occupations by Sex
Within the Management, Business, Science and Arts occupations in Golden Grove, the most male-oriented occupations are Education Instruction & Library (100.0%), Computers, Engineering & Science (97.2%), and Architecture & Engineering (97.2%), while the most female-oriented occupations are Business & Financial (100.0%), Education, Arts & Media (100.0%), and Health Diagnosing & Treating (100.0%).
| Occupation | Male | Female |
| Management | 0 (0.0%) | 0 (0.0%) |
| Business & Financial | 0 (0.0%) | 70 (100.0%) |
| Computers, Engineering & Science | 206 (97.2%) | 6 (2.8%) |
| Computers & Mathematics | 0 (0.0%) | 0 (0.0%) |
| Architecture & Engineering | 206 (97.2%) | 6 (2.8%) |
| Life, Physical & Social Science | 0 (0.0%) | 0 (0.0%) |
| Community & Social Service | 61 (64.9%) | 33 (35.1%) |
| Education, Arts & Media | 0 (0.0%) | 33 (100.0%) |
| Legal Services & Support | 0 (0.0%) | 0 (0.0%) |
| Education Instruction & Library | 61 (100.0%) | 0 (0.0%) |
| Arts, Media & Entertainment | 0 (0.0%) | 0 (0.0%) |
| Health Diagnosing & Treating | 0 (0.0%) | 32 (100.0%) |
| Health Technologists | 0 (0.0%) | 14 (100.0%) |
| Total (Category) | 267 (65.4%) | 141 (34.6%) |
| Total (Overall) | 941 (50.7%) | 916 (49.3%) |
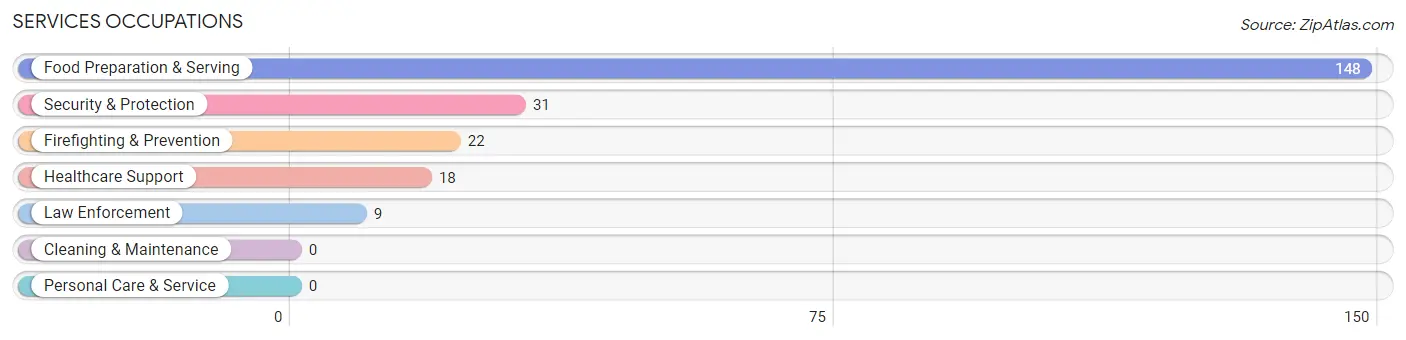
Services Occupations
The most common Services occupations in Golden Grove are Food Preparation & Serving (148 | 8.0%), Security & Protection (31 | 1.7%), Firefighting & Prevention (22 | 1.2%), Healthcare Support (18 | 1.0%), and Law Enforcement (9 | 0.5%).
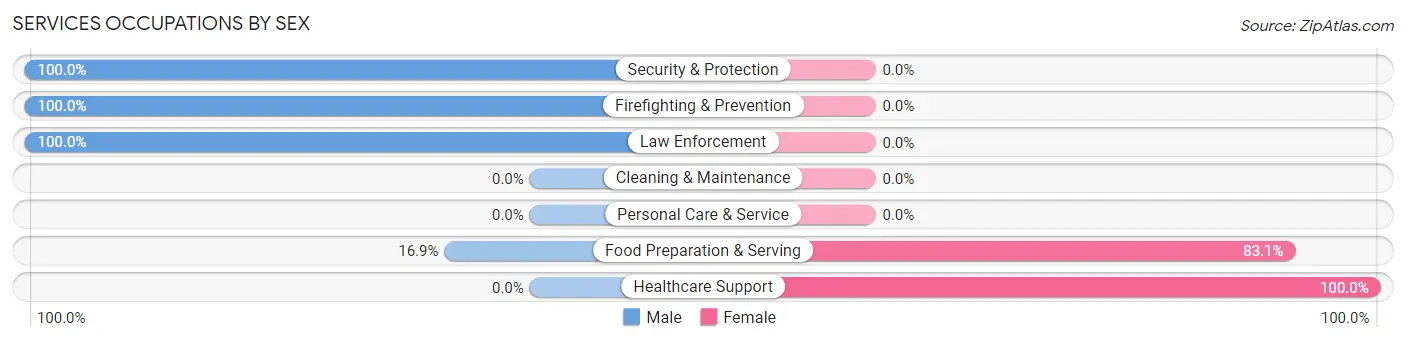
Services Occupations by Sex
Within the Services occupations in Golden Grove, the most male-oriented occupations are Security & Protection (100.0%), Firefighting & Prevention (100.0%), and Law Enforcement (100.0%), while the most female-oriented occupations are Healthcare Support (100.0%), and Food Preparation & Serving (83.1%).
| Occupation | Male | Female |
| Healthcare Support | 0 (0.0%) | 18 (100.0%) |
| Security & Protection | 31 (100.0%) | 0 (0.0%) |
| Firefighting & Prevention | 22 (100.0%) | 0 (0.0%) |
| Law Enforcement | 9 (100.0%) | 0 (0.0%) |
| Food Preparation & Serving | 25 (16.9%) | 123 (83.1%) |
| Cleaning & Maintenance | 0 (0.0%) | 0 (0.0%) |
| Personal Care & Service | 0 (0.0%) | 0 (0.0%) |
| Total (Category) | 56 (28.4%) | 141 (71.6%) |
| Total (Overall) | 941 (50.7%) | 916 (49.3%) |
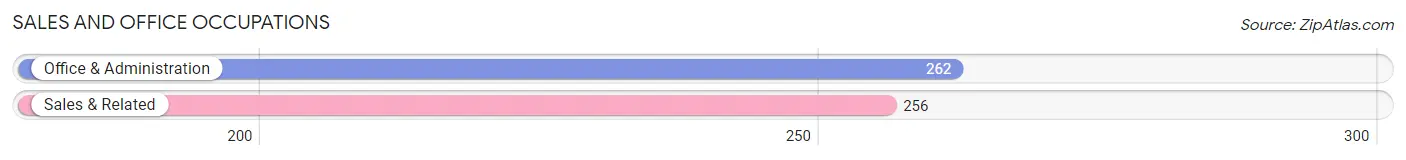
Sales and Office Occupations
The most common Sales and Office occupations in Golden Grove are Office & Administration (262 | 14.1%), and Sales & Related (256 | 13.8%).
Sales and Office Occupations by Sex
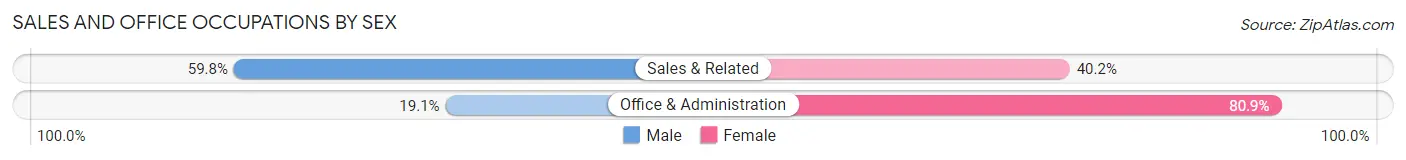
| Occupation | Male | Female |
| Sales & Related | 153 (59.8%) | 103 (40.2%) |
| Office & Administration | 50 (19.1%) | 212 (80.9%) |
| Total (Category) | 203 (39.2%) | 315 (60.8%) |
| Total (Overall) | 941 (50.7%) | 916 (49.3%) |
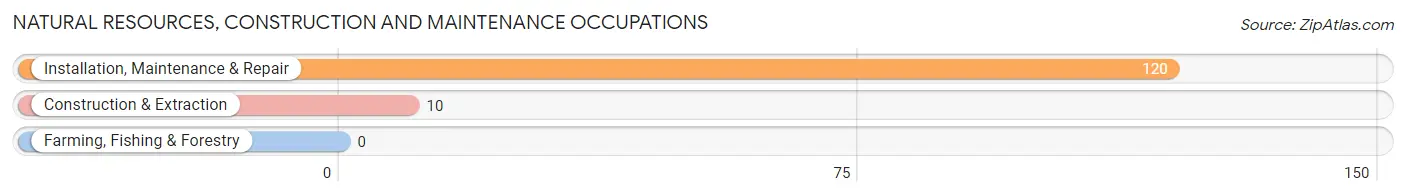
Natural Resources, Construction and Maintenance Occupations
The most common Natural Resources, Construction and Maintenance occupations in Golden Grove are Installation, Maintenance & Repair (120 | 6.5%), and Construction & Extraction (10 | 0.5%).
Natural Resources, Construction and Maintenance Occupations by Sex
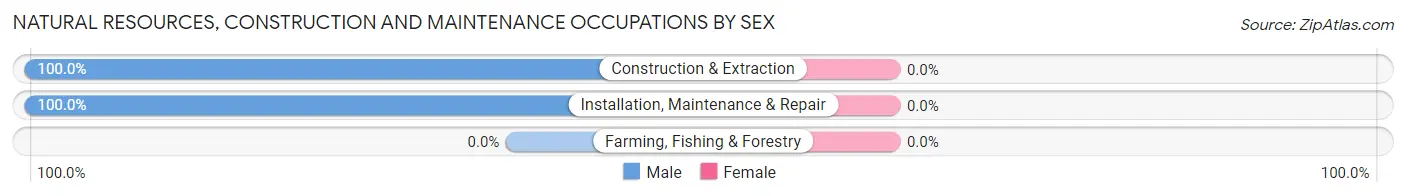
| Occupation | Male | Female |
| Farming, Fishing & Forestry | 0 (0.0%) | 0 (0.0%) |
| Construction & Extraction | 10 (100.0%) | 0 (0.0%) |
| Installation, Maintenance & Repair | 120 (100.0%) | 0 (0.0%) |
| Total (Category) | 130 (100.0%) | 0 (0.0%) |
| Total (Overall) | 941 (50.7%) | 916 (49.3%) |
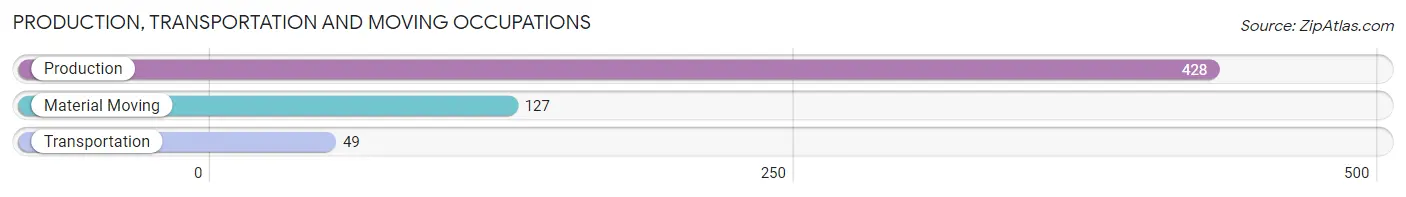
Production, Transportation and Moving Occupations
The most common Production, Transportation and Moving occupations in Golden Grove are Production (428 | 23.1%), Material Moving (127 | 6.8%), and Transportation (49 | 2.6%).
Production, Transportation and Moving Occupations by Sex
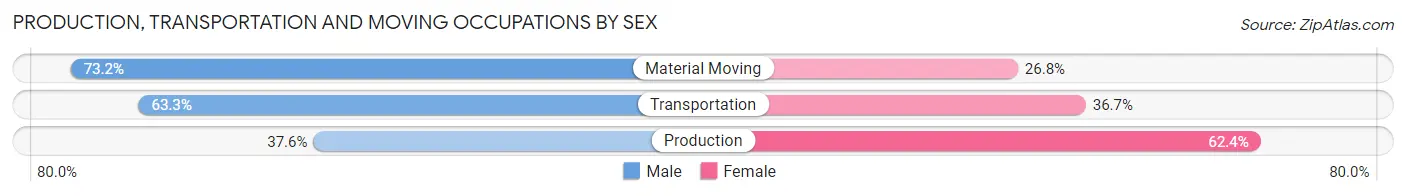
| Occupation | Male | Female |
| Production | 161 (37.6%) | 267 (62.4%) |
| Transportation | 31 (63.3%) | 18 (36.7%) |
| Material Moving | 93 (73.2%) | 34 (26.8%) |
| Total (Category) | 285 (47.2%) | 319 (52.8%) |
| Total (Overall) | 941 (50.7%) | 916 (49.3%) |
Employment Industries by Sex in Golden Grove
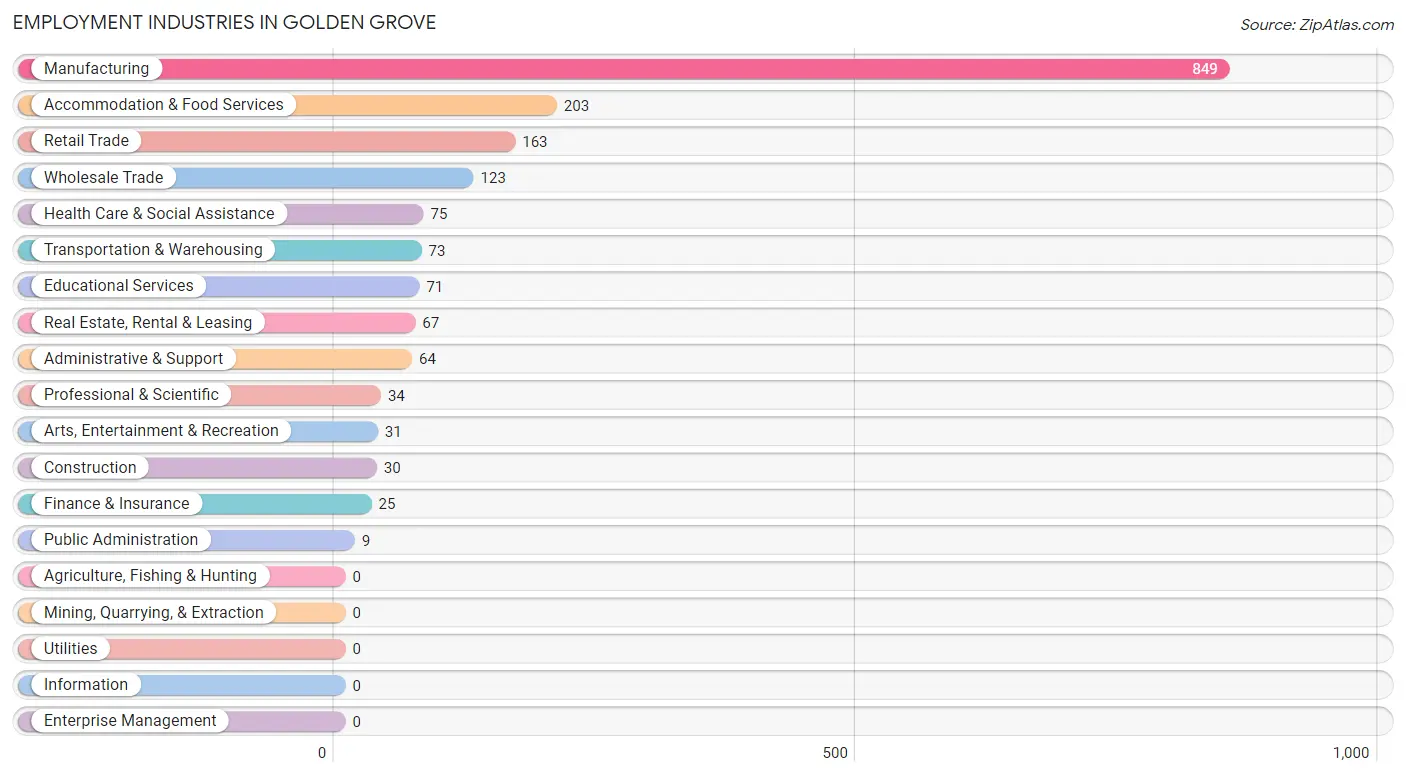
Employment Industries in Golden Grove
The major employment industries in Golden Grove include Manufacturing (849 | 45.7%), Accommodation & Food Services (203 | 10.9%), Retail Trade (163 | 8.8%), Wholesale Trade (123 | 6.6%), and Health Care & Social Assistance (75 | 4.0%).
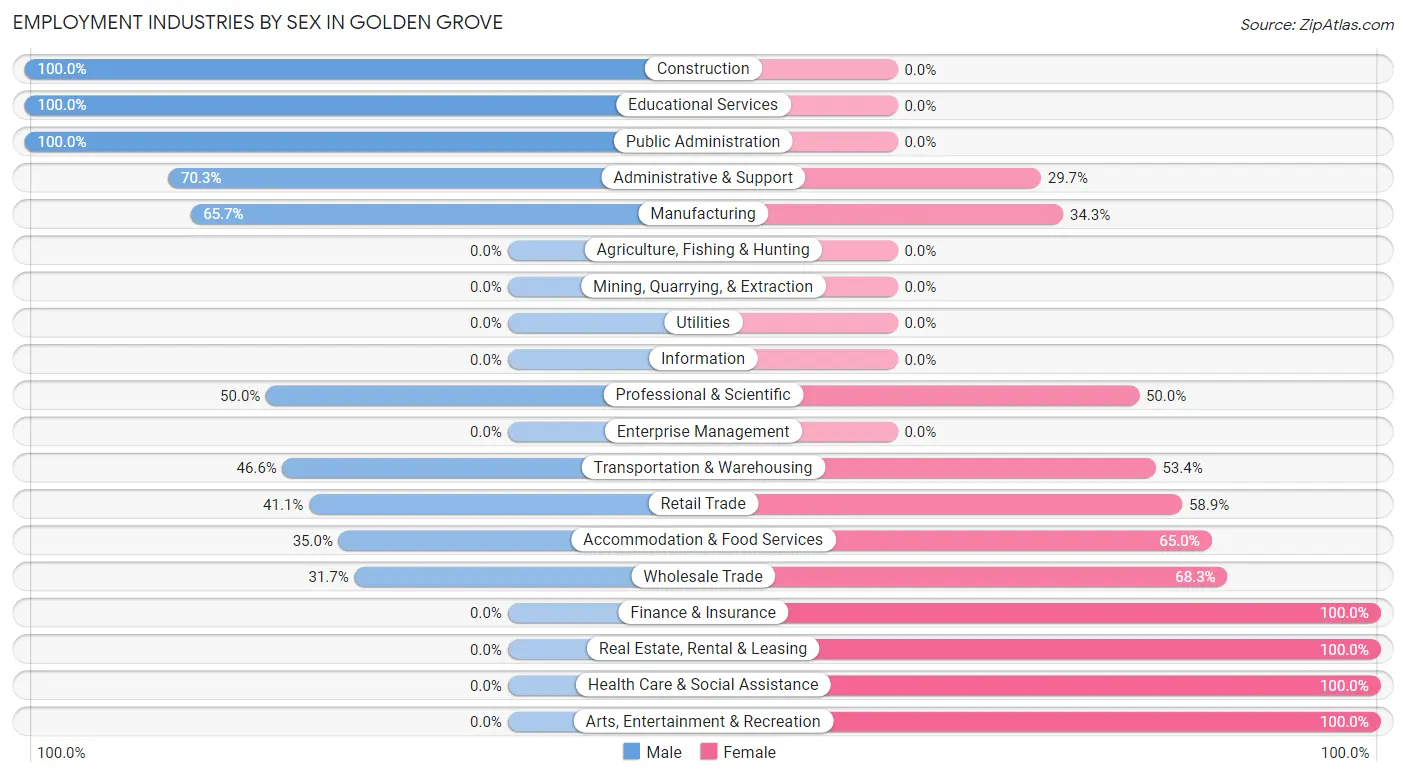
Employment Industries by Sex in Golden Grove
The Golden Grove industries that see more men than women are Construction (100.0%), Educational Services (100.0%), and Public Administration (100.0%), whereas the industries that tend to have a higher number of women are Finance & Insurance (100.0%), Real Estate, Rental & Leasing (100.0%), and Health Care & Social Assistance (100.0%).
| Industry | Male | Female |
| Agriculture, Fishing & Hunting | 0 (0.0%) | 0 (0.0%) |
| Mining, Quarrying, & Extraction | 0 (0.0%) | 0 (0.0%) |
| Construction | 30 (100.0%) | 0 (0.0%) |
| Manufacturing | 558 (65.7%) | 291 (34.3%) |
| Wholesale Trade | 39 (31.7%) | 84 (68.3%) |
| Retail Trade | 67 (41.1%) | 96 (58.9%) |
| Transportation & Warehousing | 34 (46.6%) | 39 (53.4%) |
| Utilities | 0 (0.0%) | 0 (0.0%) |
| Information | 0 (0.0%) | 0 (0.0%) |
| Finance & Insurance | 0 (0.0%) | 25 (100.0%) |
| Real Estate, Rental & Leasing | 0 (0.0%) | 67 (100.0%) |
| Professional & Scientific | 17 (50.0%) | 17 (50.0%) |
| Enterprise Management | 0 (0.0%) | 0 (0.0%) |
| Administrative & Support | 45 (70.3%) | 19 (29.7%) |
| Educational Services | 71 (100.0%) | 0 (0.0%) |
| Health Care & Social Assistance | 0 (0.0%) | 75 (100.0%) |
| Arts, Entertainment & Recreation | 0 (0.0%) | 31 (100.0%) |
| Accommodation & Food Services | 71 (35.0%) | 132 (65.0%) |
| Public Administration | 9 (100.0%) | 0 (0.0%) |
| Total | 941 (50.7%) | 916 (49.3%) |
Education in Golden Grove
School Enrollment in Golden Grove
The most common levels of schooling among the 783 students in Golden Grove are high school (212 | 27.1%), middle school (171 | 21.8%), and elementary school (155 | 19.8%).
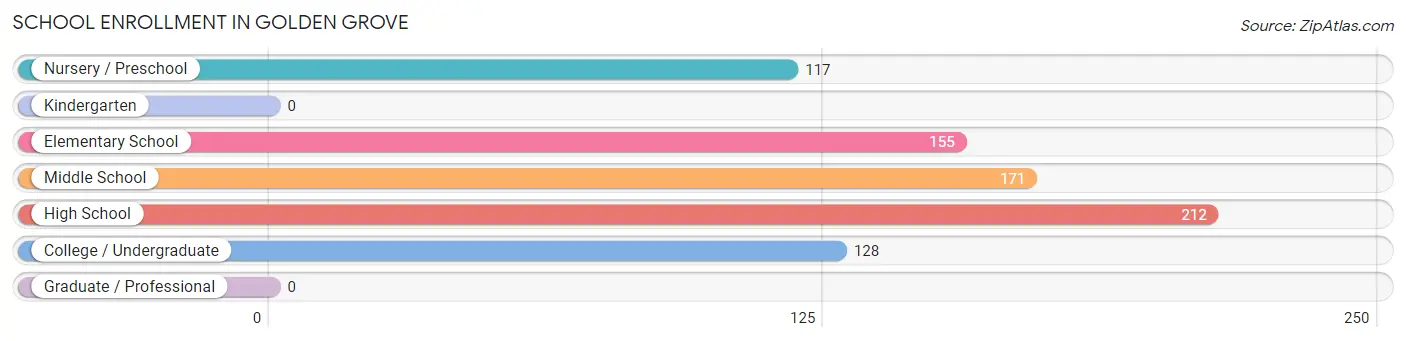
| School Level | # Students | % Students |
| Nursery / Preschool | 117 | 14.9% |
| Kindergarten | 0 | 0.0% |
| Elementary School | 155 | 19.8% |
| Middle School | 171 | 21.8% |
| High School | 212 | 27.1% |
| College / Undergraduate | 128 | 16.4% |
| Graduate / Professional | 0 | 0.0% |
| Total | 783 | 100.0% |
School Enrollment by Age by Funding Source in Golden Grove
Out of a total of 783 students who are enrolled in schools in Golden Grove, 74 (9.5%) attend a private institution, while the remaining 709 (90.5%) are enrolled in public schools. The age group of 3 to 4 year olds has the highest likelihood of being enrolled in private schools, with 38 (46.9% in the age bracket) enrolled. Conversely, the age group of 10 to 14 year olds has the lowest likelihood of being enrolled in a private school, with 229 (100.0% in the age bracket) attending a public institution.
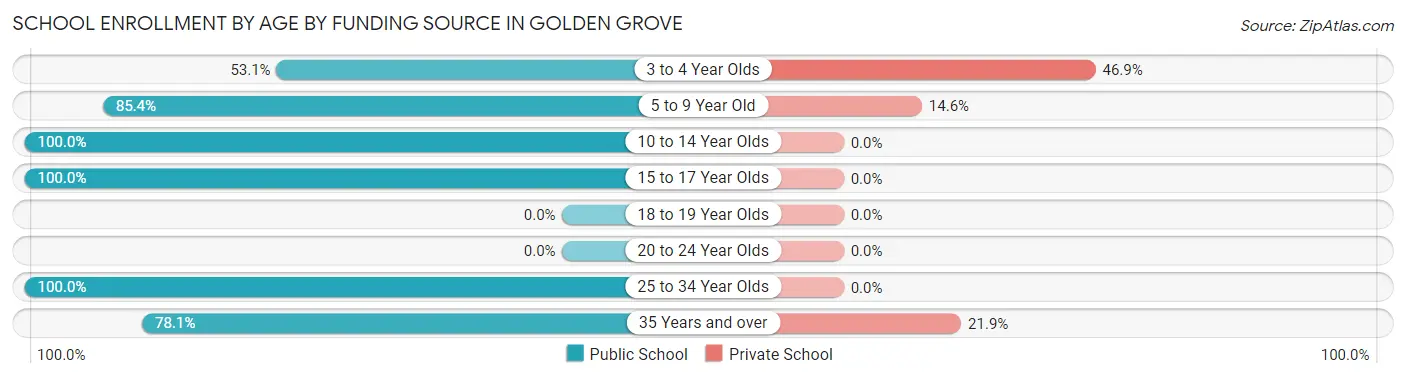
| Age Bracket | Public School | Private School |
| 3 to 4 Year Olds | 43 (53.1%) | 38 (46.9%) |
| 5 to 9 Year Old | 129 (85.4%) | 22 (14.6%) |
| 10 to 14 Year Olds | 229 (100.0%) | 0 (0.0%) |
| 15 to 17 Year Olds | 194 (100.0%) | 0 (0.0%) |
| 18 to 19 Year Olds | 0 (0.0%) | 0 (0.0%) |
| 20 to 24 Year Olds | 0 (0.0%) | 0 (0.0%) |
| 25 to 34 Year Olds | 64 (100.0%) | 0 (0.0%) |
| 35 Years and over | 50 (78.1%) | 14 (21.9%) |
| Total | 709 (90.5%) | 74 (9.5%) |
Educational Attainment by Field of Study in Golden Grove
Engineering (203 | 31.0%), business (135 | 20.6%), social sciences (70 | 10.7%), visual & performing arts (50 | 7.6%), and psychology (39 | 5.9%) are the most common fields of study among 655 individuals in Golden Grove who have obtained a bachelor's degree or higher.
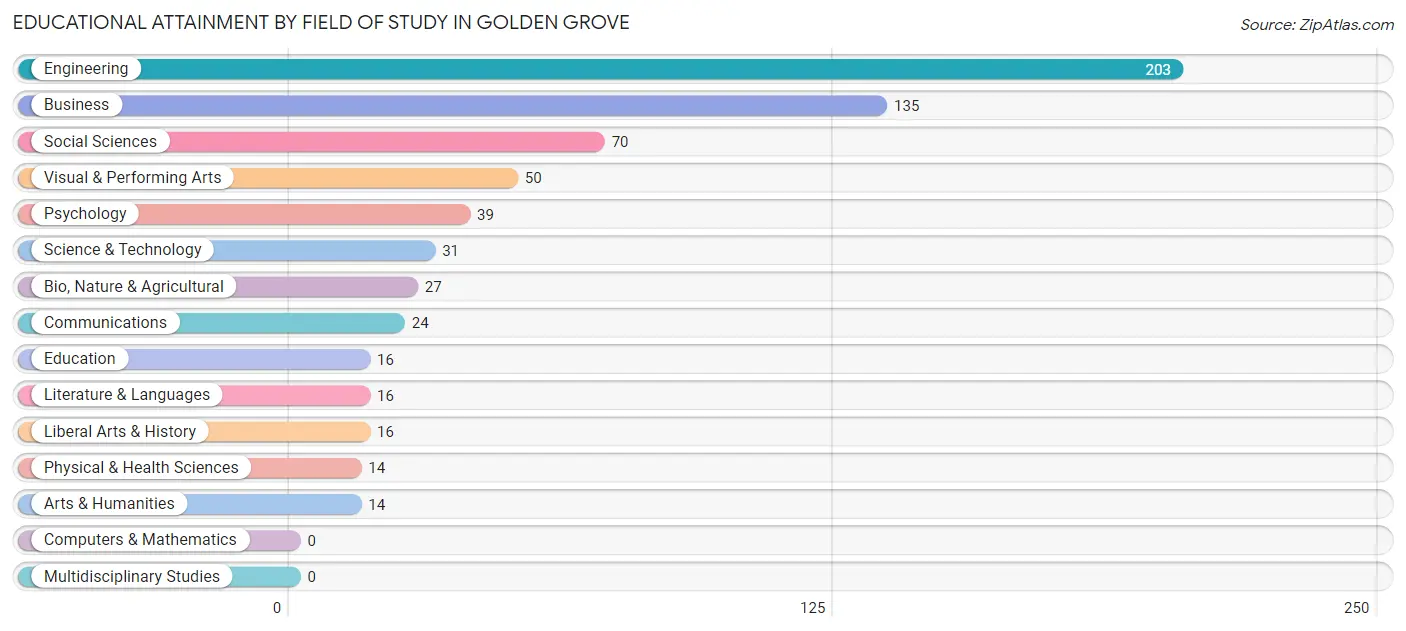
| Field of Study | # Graduates | % Graduates |
| Computers & Mathematics | 0 | 0.0% |
| Bio, Nature & Agricultural | 27 | 4.1% |
| Physical & Health Sciences | 14 | 2.1% |
| Psychology | 39 | 5.9% |
| Social Sciences | 70 | 10.7% |
| Engineering | 203 | 31.0% |
| Multidisciplinary Studies | 0 | 0.0% |
| Science & Technology | 31 | 4.7% |
| Business | 135 | 20.6% |
| Education | 16 | 2.4% |
| Literature & Languages | 16 | 2.4% |
| Liberal Arts & History | 16 | 2.4% |
| Visual & Performing Arts | 50 | 7.6% |
| Communications | 24 | 3.7% |
| Arts & Humanities | 14 | 2.1% |
| Total | 655 | 100.0% |
Transportation & Commute in Golden Grove
Vehicle Availability by Sex in Golden Grove
The most prevalent vehicle ownership categories in Golden Grove are males with 2 vehicles (527, accounting for 58.8%) and females with 2 vehicles (385, making up 57.5%).
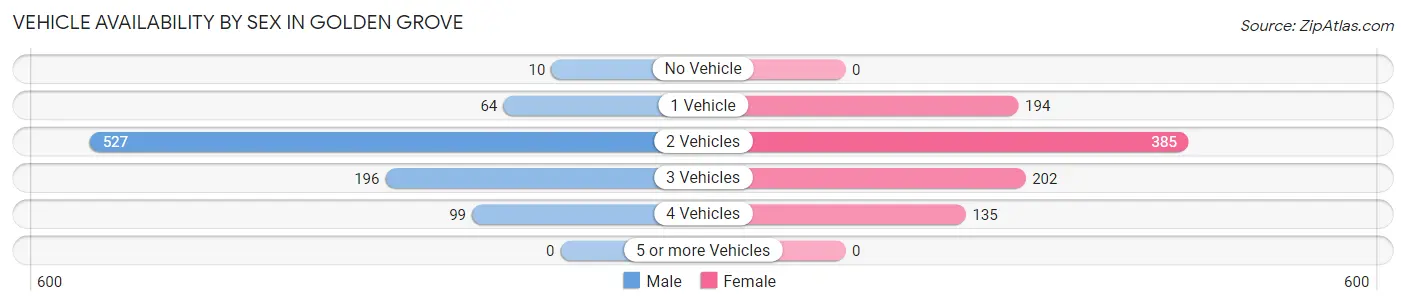
| Vehicles Available | Male | Female |
| No Vehicle | 10 (1.1%) | 0 (0.0%) |
| 1 Vehicle | 64 (7.1%) | 194 (21.2%) |
| 2 Vehicles | 527 (58.8%) | 385 (42.0%) |
| 3 Vehicles | 196 (21.9%) | 202 (22.1%) |
| 4 Vehicles | 99 (11.1%) | 135 (14.7%) |
| 5 or more Vehicles | 0 (0.0%) | 0 (0.0%) |
| Total | 896 (100.0%) | 916 (100.0%) |
Commute Time in Golden Grove
The most frequently occuring commute durations in Golden Grove are 30 to 34 minutes (528 commuters, 29.7%), 10 to 14 minutes (297 commuters, 16.7%), and 25 to 29 minutes (252 commuters, 14.2%).
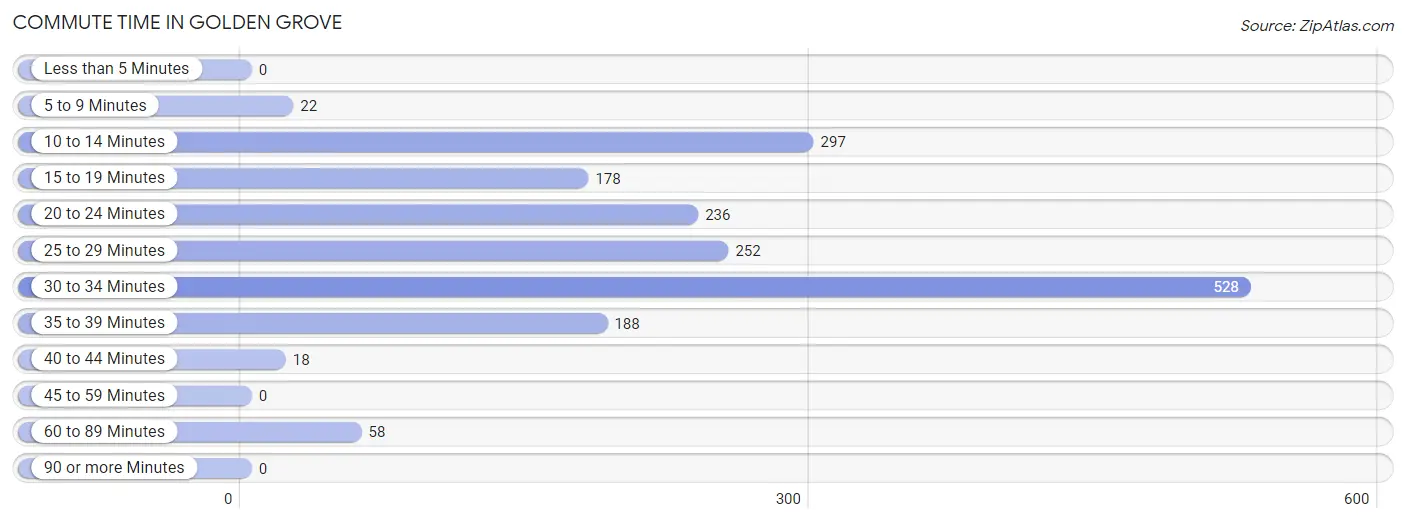
| Commute Time | # Commuters | % Commuters |
| Less than 5 Minutes | 0 | 0.0% |
| 5 to 9 Minutes | 22 | 1.2% |
| 10 to 14 Minutes | 297 | 16.7% |
| 15 to 19 Minutes | 178 | 10.0% |
| 20 to 24 Minutes | 236 | 13.3% |
| 25 to 29 Minutes | 252 | 14.2% |
| 30 to 34 Minutes | 528 | 29.7% |
| 35 to 39 Minutes | 188 | 10.6% |
| 40 to 44 Minutes | 18 | 1.0% |
| 45 to 59 Minutes | 0 | 0.0% |
| 60 to 89 Minutes | 58 | 3.3% |
| 90 or more Minutes | 0 | 0.0% |
Commute Time by Sex in Golden Grove
The most common commute times in Golden Grove are 30 to 34 minutes (316 commuters, 35.3%) for males and 30 to 34 minutes (212 commuters, 24.1%) for females.
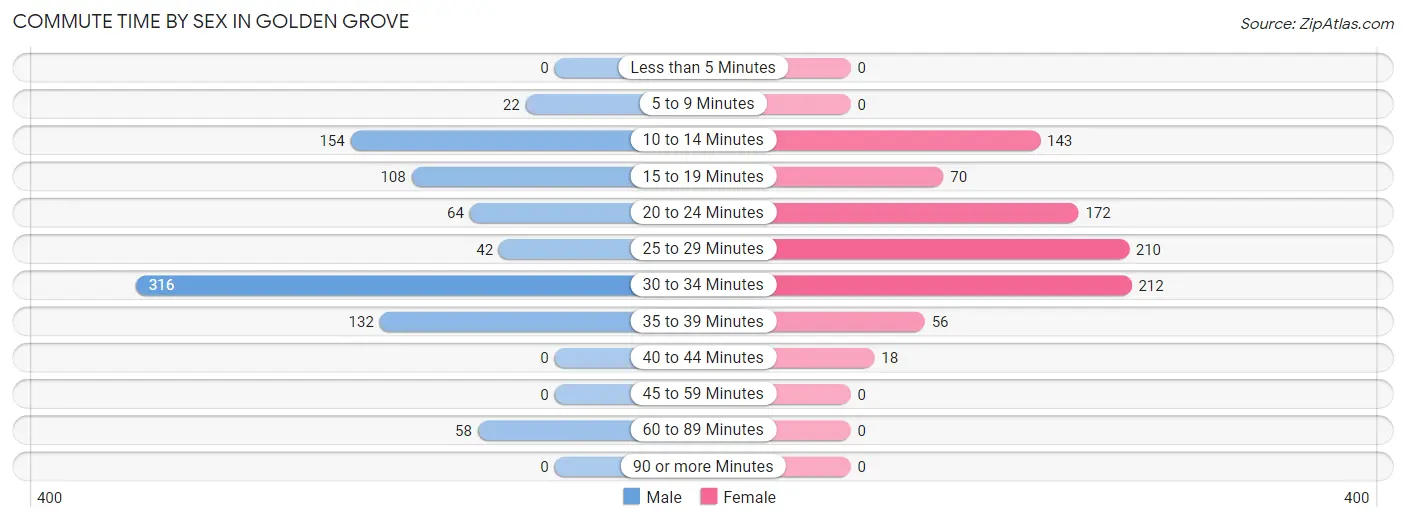
| Commute Time | Male | Female |
| Less than 5 Minutes | 0 (0.0%) | 0 (0.0%) |
| 5 to 9 Minutes | 22 (2.5%) | 0 (0.0%) |
| 10 to 14 Minutes | 154 (17.2%) | 143 (16.2%) |
| 15 to 19 Minutes | 108 (12.0%) | 70 (8.0%) |
| 20 to 24 Minutes | 64 (7.1%) | 172 (19.5%) |
| 25 to 29 Minutes | 42 (4.7%) | 210 (23.8%) |
| 30 to 34 Minutes | 316 (35.3%) | 212 (24.1%) |
| 35 to 39 Minutes | 132 (14.7%) | 56 (6.4%) |
| 40 to 44 Minutes | 0 (0.0%) | 18 (2.0%) |
| 45 to 59 Minutes | 0 (0.0%) | 0 (0.0%) |
| 60 to 89 Minutes | 58 (6.5%) | 0 (0.0%) |
| 90 or more Minutes | 0 (0.0%) | 0 (0.0%) |
Time of Departure to Work by Sex in Golden Grove
The most frequent times of departure to work in Golden Grove are 4:00 PM to 11:59 PM (319, 35.6%) for males and 6:00 AM to 6:29 AM (141, 16.0%) for females.
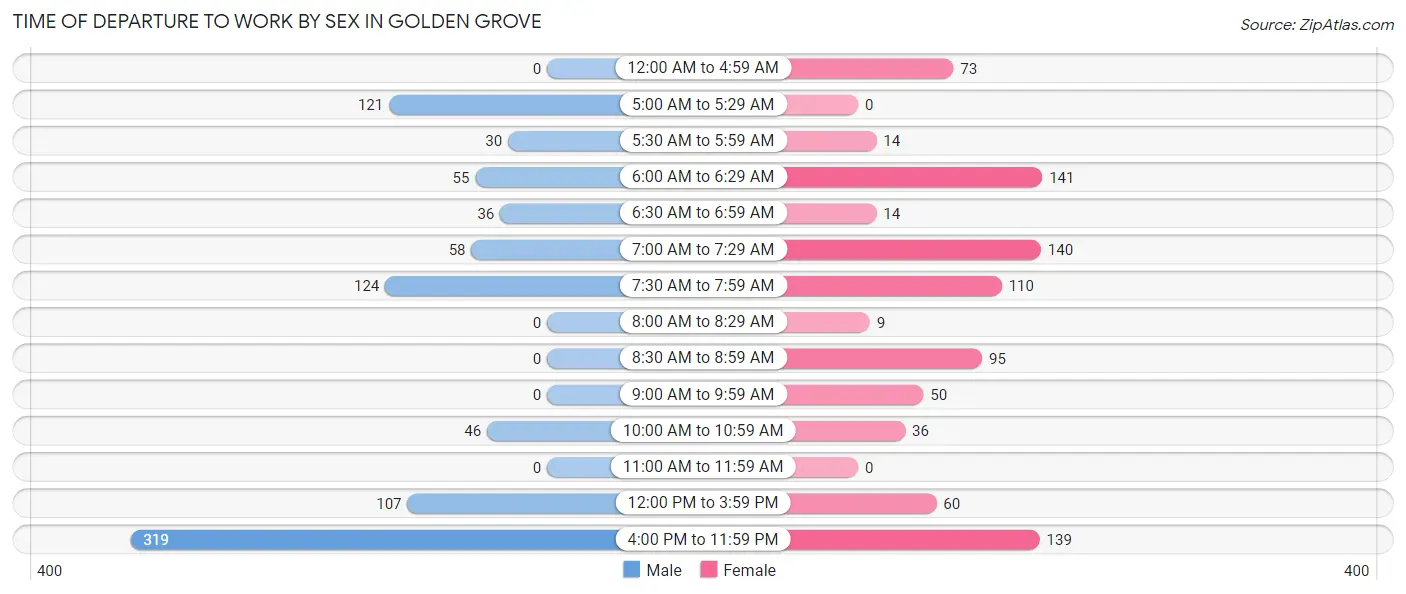
| Time of Departure | Male | Female |
| 12:00 AM to 4:59 AM | 0 (0.0%) | 73 (8.3%) |
| 5:00 AM to 5:29 AM | 121 (13.5%) | 0 (0.0%) |
| 5:30 AM to 5:59 AM | 30 (3.4%) | 14 (1.6%) |
| 6:00 AM to 6:29 AM | 55 (6.1%) | 141 (16.0%) |
| 6:30 AM to 6:59 AM | 36 (4.0%) | 14 (1.6%) |
| 7:00 AM to 7:29 AM | 58 (6.5%) | 140 (15.9%) |
| 7:30 AM to 7:59 AM | 124 (13.8%) | 110 (12.5%) |
| 8:00 AM to 8:29 AM | 0 (0.0%) | 9 (1.0%) |
| 8:30 AM to 8:59 AM | 0 (0.0%) | 95 (10.8%) |
| 9:00 AM to 9:59 AM | 0 (0.0%) | 50 (5.7%) |
| 10:00 AM to 10:59 AM | 46 (5.1%) | 36 (4.1%) |
| 11:00 AM to 11:59 AM | 0 (0.0%) | 0 (0.0%) |
| 12:00 PM to 3:59 PM | 107 (11.9%) | 60 (6.8%) |
| 4:00 PM to 11:59 PM | 319 (35.6%) | 139 (15.8%) |
| Total | 896 (100.0%) | 881 (100.0%) |
Housing Occupancy in Golden Grove
Occupancy by Ownership in Golden Grove
Of the total 1,442 dwellings in Golden Grove, owner-occupied units account for 1,217 (84.4%), while renter-occupied units make up 225 (15.6%).
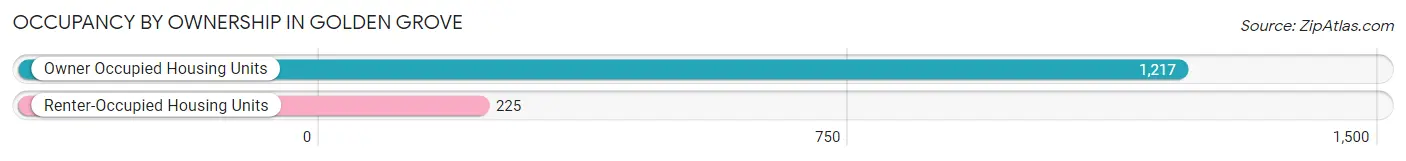
| Occupancy | # Housing Units | % Housing Units |
| Owner Occupied Housing Units | 1,217 | 84.4% |
| Renter-Occupied Housing Units | 225 | 15.6% |
| Total Occupied Housing Units | 1,442 | 100.0% |
Occupancy by Household Size in Golden Grove
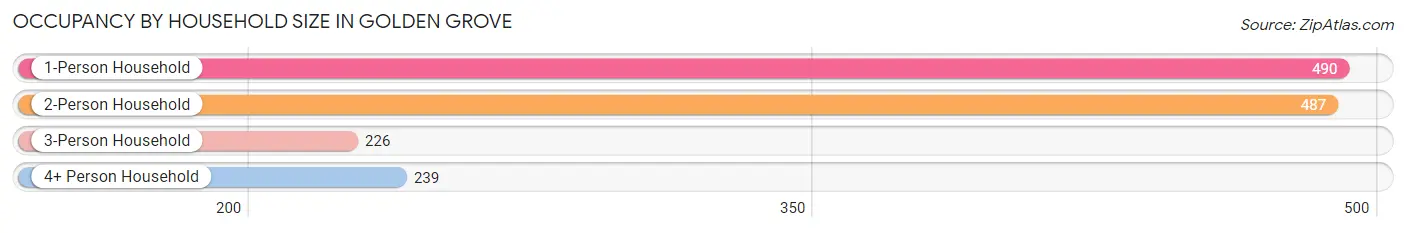
| Household Size | # Housing Units | % Housing Units |
| 1-Person Household | 490 | 34.0% |
| 2-Person Household | 487 | 33.8% |
| 3-Person Household | 226 | 15.7% |
| 4+ Person Household | 239 | 16.6% |
| Total Housing Units | 1,442 | 100.0% |
Occupancy by Ownership by Household Size in Golden Grove
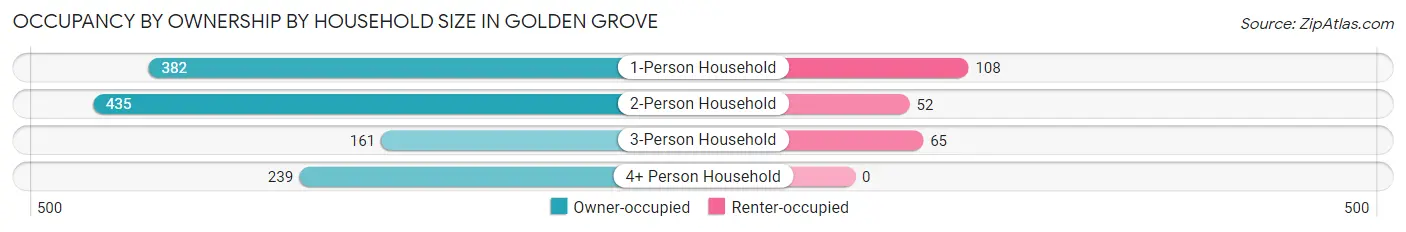
| Household Size | Owner-occupied | Renter-occupied |
| 1-Person Household | 382 (78.0%) | 108 (22.0%) |
| 2-Person Household | 435 (89.3%) | 52 (10.7%) |
| 3-Person Household | 161 (71.2%) | 65 (28.8%) |
| 4+ Person Household | 239 (100.0%) | 0 (0.0%) |
| Total Housing Units | 1,217 (84.4%) | 225 (15.6%) |
Occupancy by Educational Attainment in Golden Grove
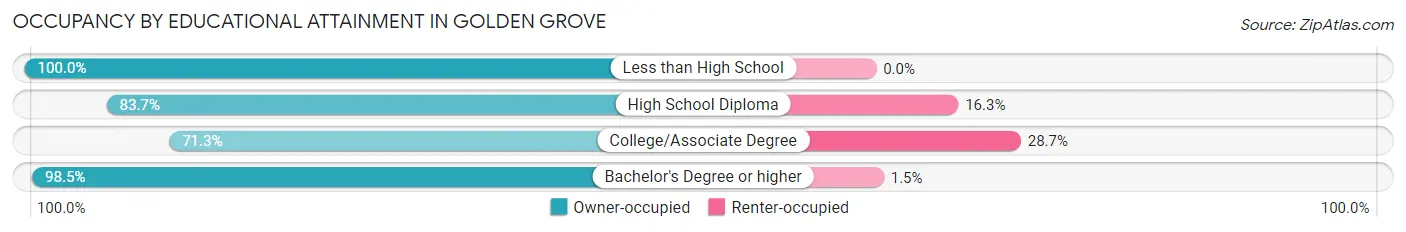
| Household Size | Owner-occupied | Renter-occupied |
| Less than High School | 97 (100.0%) | 0 (0.0%) |
| High School Diploma | 355 (83.7%) | 69 (16.3%) |
| College/Associate Degree | 373 (71.3%) | 150 (28.7%) |
| Bachelor's Degree or higher | 392 (98.5%) | 6 (1.5%) |
Occupancy by Age of Householder in Golden Grove
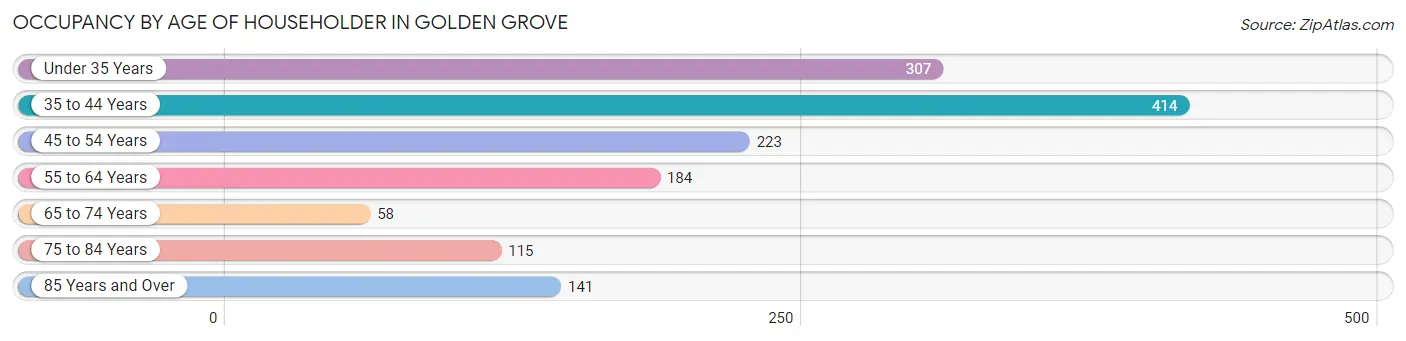
| Age Bracket | # Households | % Households |
| Under 35 Years | 307 | 21.3% |
| 35 to 44 Years | 414 | 28.7% |
| 45 to 54 Years | 223 | 15.5% |
| 55 to 64 Years | 184 | 12.8% |
| 65 to 74 Years | 58 | 4.0% |
| 75 to 84 Years | 115 | 8.0% |
| 85 Years and Over | 141 | 9.8% |
| Total | 1,442 | 100.0% |
Housing Finances in Golden Grove
Median Income by Occupancy in Golden Grove
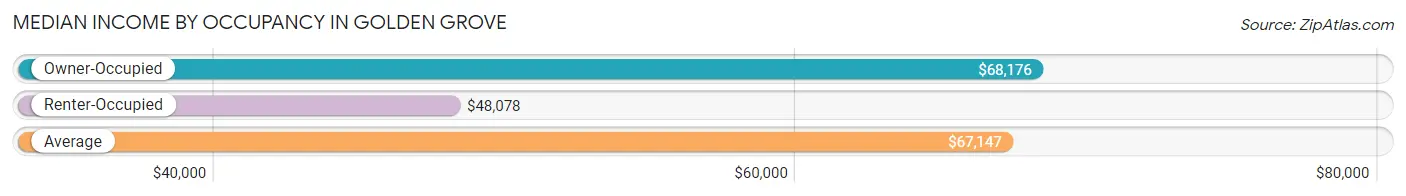
| Occupancy Type | # Households | Median Income |
| Owner-Occupied | 1,217 (84.4%) | $68,176 |
| Renter-Occupied | 225 (15.6%) | $48,078 |
| Average | 1,442 (100.0%) | $67,147 |
Occupancy by Householder Income Bracket in Golden Grove
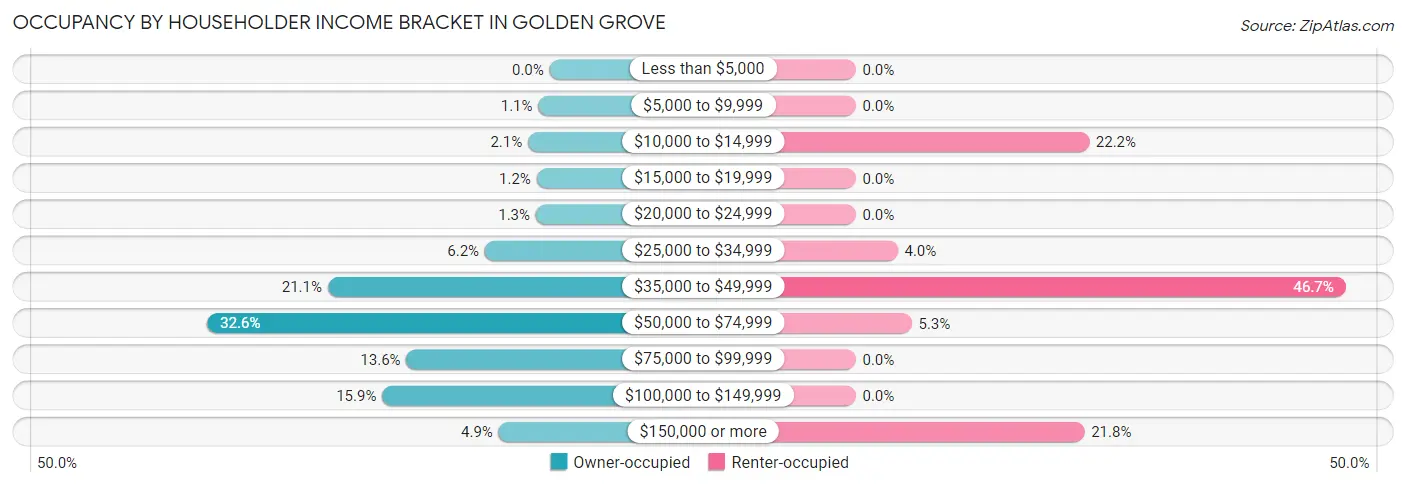
| Income Bracket | Owner-occupied | Renter-occupied |
| Less than $5,000 | 0 (0.0%) | 0 (0.0%) |
| $5,000 to $9,999 | 13 (1.1%) | 0 (0.0%) |
| $10,000 to $14,999 | 25 (2.1%) | 50 (22.2%) |
| $15,000 to $19,999 | 15 (1.2%) | 0 (0.0%) |
| $20,000 to $24,999 | 16 (1.3%) | 0 (0.0%) |
| $25,000 to $34,999 | 75 (6.2%) | 9 (4.0%) |
| $35,000 to $49,999 | 257 (21.1%) | 105 (46.7%) |
| $50,000 to $74,999 | 397 (32.6%) | 12 (5.3%) |
| $75,000 to $99,999 | 166 (13.6%) | 0 (0.0%) |
| $100,000 to $149,999 | 194 (15.9%) | 0 (0.0%) |
| $150,000 or more | 59 (4.9%) | 49 (21.8%) |
| Total | 1,217 (100.0%) | 225 (100.0%) |
Monthly Housing Cost Tiers in Golden Grove
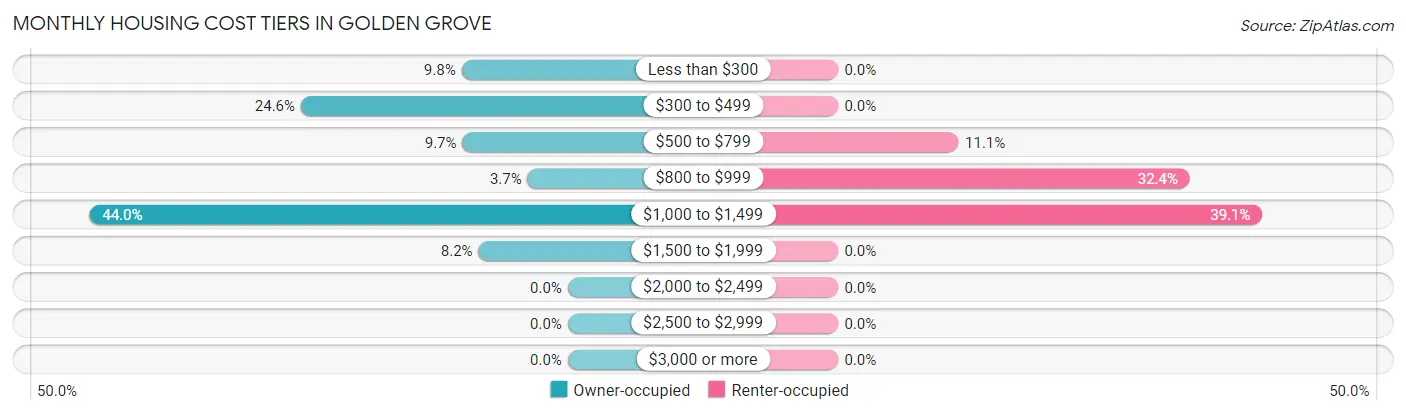
| Monthly Cost | Owner-occupied | Renter-occupied |
| Less than $300 | 119 (9.8%) | 0 (0.0%) |
| $300 to $499 | 299 (24.6%) | 0 (0.0%) |
| $500 to $799 | 118 (9.7%) | 25 (11.1%) |
| $800 to $999 | 45 (3.7%) | 73 (32.4%) |
| $1,000 to $1,499 | 536 (44.0%) | 88 (39.1%) |
| $1,500 to $1,999 | 100 (8.2%) | 0 (0.0%) |
| $2,000 to $2,499 | 0 (0.0%) | 0 (0.0%) |
| $2,500 to $2,999 | 0 (0.0%) | 0 (0.0%) |
| $3,000 or more | 0 (0.0%) | 0 (0.0%) |
| Total | 1,217 (100.0%) | 225 (100.0%) |
Physical Housing Characteristics in Golden Grove
Housing Structures in Golden Grove
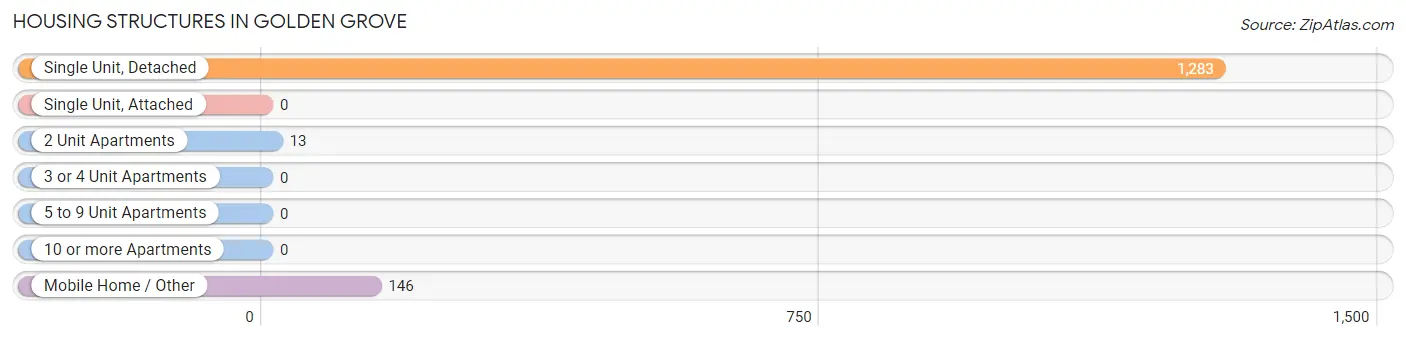
| Structure Type | # Housing Units | % Housing Units |
| Single Unit, Detached | 1,283 | 89.0% |
| Single Unit, Attached | 0 | 0.0% |
| 2 Unit Apartments | 13 | 0.9% |
| 3 or 4 Unit Apartments | 0 | 0.0% |
| 5 to 9 Unit Apartments | 0 | 0.0% |
| 10 or more Apartments | 0 | 0.0% |
| Mobile Home / Other | 146 | 10.1% |
| Total | 1,442 | 100.0% |
Housing Structures by Occupancy in Golden Grove
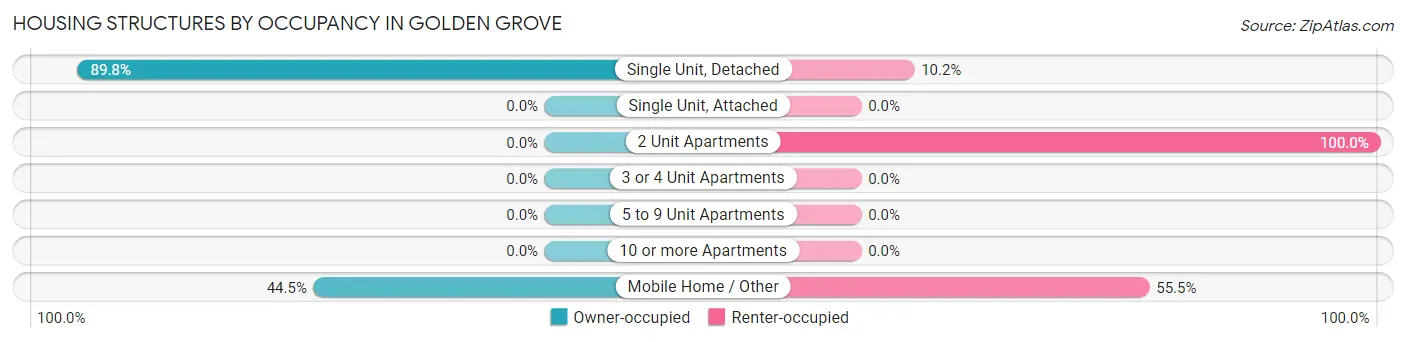
| Structure Type | Owner-occupied | Renter-occupied |
| Single Unit, Detached | 1,152 (89.8%) | 131 (10.2%) |
| Single Unit, Attached | 0 (0.0%) | 0 (0.0%) |
| 2 Unit Apartments | 0 (0.0%) | 13 (100.0%) |
| 3 or 4 Unit Apartments | 0 (0.0%) | 0 (0.0%) |
| 5 to 9 Unit Apartments | 0 (0.0%) | 0 (0.0%) |
| 10 or more Apartments | 0 (0.0%) | 0 (0.0%) |
| Mobile Home / Other | 65 (44.5%) | 81 (55.5%) |
| Total | 1,217 (84.4%) | 225 (15.6%) |
Housing Structures by Number of Rooms in Golden Grove
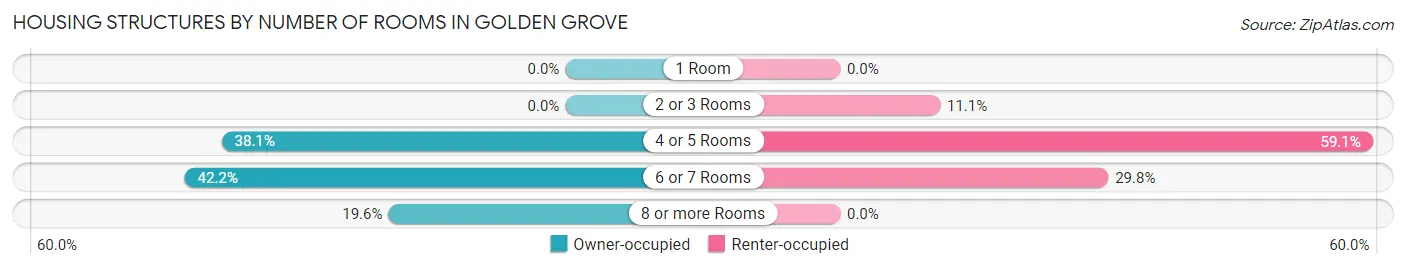
| Number of Rooms | Owner-occupied | Renter-occupied |
| 1 Room | 0 (0.0%) | 0 (0.0%) |
| 2 or 3 Rooms | 0 (0.0%) | 25 (11.1%) |
| 4 or 5 Rooms | 464 (38.1%) | 133 (59.1%) |
| 6 or 7 Rooms | 514 (42.2%) | 67 (29.8%) |
| 8 or more Rooms | 239 (19.6%) | 0 (0.0%) |
| Total | 1,217 (100.0%) | 225 (100.0%) |
Housing Structure by Heating Type in Golden Grove
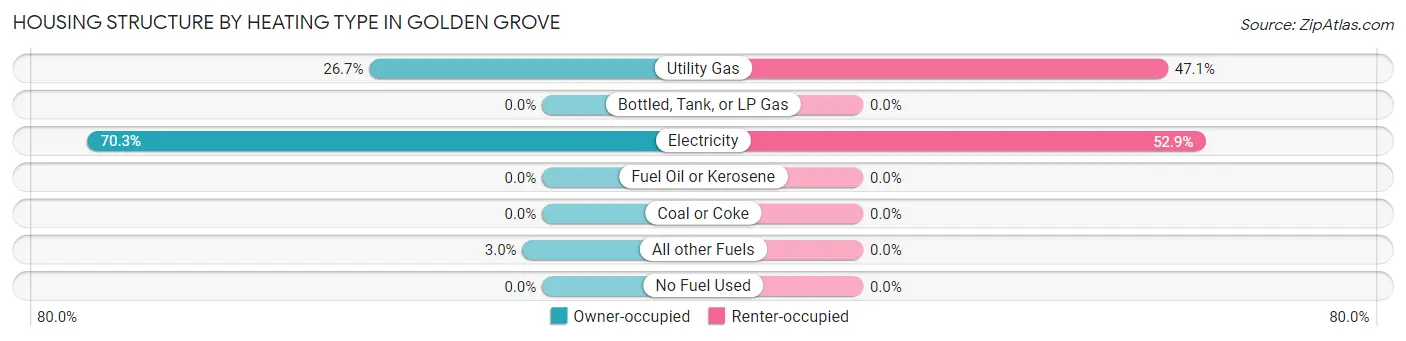
| Heating Type | Owner-occupied | Renter-occupied |
| Utility Gas | 325 (26.7%) | 106 (47.1%) |
| Bottled, Tank, or LP Gas | 0 (0.0%) | 0 (0.0%) |
| Electricity | 855 (70.3%) | 119 (52.9%) |
| Fuel Oil or Kerosene | 0 (0.0%) | 0 (0.0%) |
| Coal or Coke | 0 (0.0%) | 0 (0.0%) |
| All other Fuels | 37 (3.0%) | 0 (0.0%) |
| No Fuel Used | 0 (0.0%) | 0 (0.0%) |
| Total | 1,217 (100.0%) | 225 (100.0%) |
Household Vehicle Usage in Golden Grove
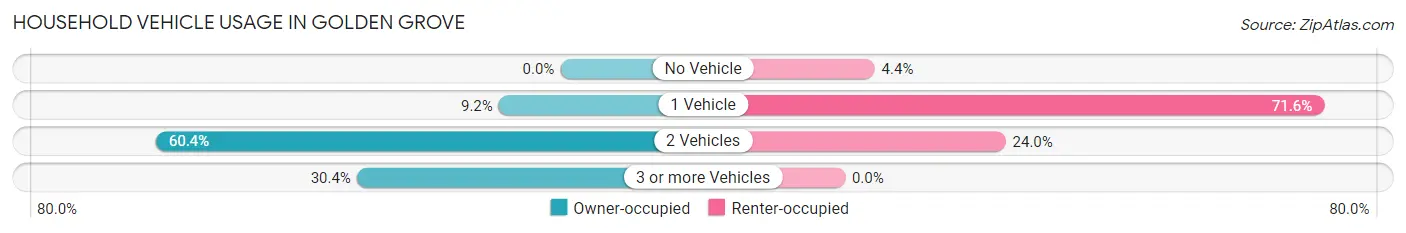
| Vehicles per Household | Owner-occupied | Renter-occupied |
| No Vehicle | 0 (0.0%) | 10 (4.4%) |
| 1 Vehicle | 112 (9.2%) | 161 (71.6%) |
| 2 Vehicles | 735 (60.4%) | 54 (24.0%) |
| 3 or more Vehicles | 370 (30.4%) | 0 (0.0%) |
| Total | 1,217 (100.0%) | 225 (100.0%) |
Real Estate & Mortgages in Golden Grove
Real Estate and Mortgage Overview in Golden Grove
| Characteristic | Without Mortgage | With Mortgage |
| Housing Units | 484 | 733 |
| Median Property Value | $94,700 | $160,000 |
| Median Household Income | $41,818 | $17 |
| Monthly Housing Costs | $336 | $0 |
| Real Estate Taxes | $781 | $42 |
Property Value by Mortgage Status in Golden Grove
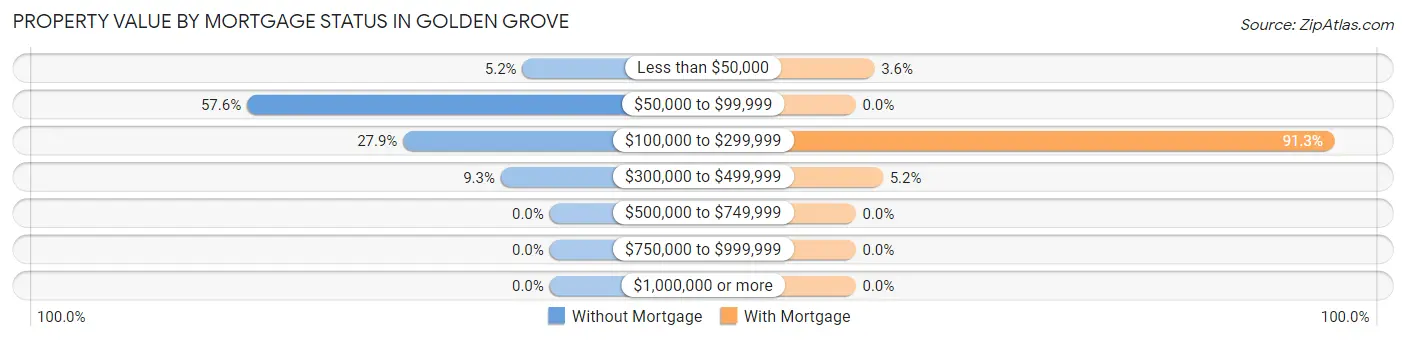
| Property Value | Without Mortgage | With Mortgage |
| Less than $50,000 | 25 (5.2%) | 26 (3.5%) |
| $50,000 to $99,999 | 279 (57.6%) | 0 (0.0%) |
| $100,000 to $299,999 | 135 (27.9%) | 669 (91.3%) |
| $300,000 to $499,999 | 45 (9.3%) | 38 (5.2%) |
| $500,000 to $749,999 | 0 (0.0%) | 0 (0.0%) |
| $750,000 to $999,999 | 0 (0.0%) | 0 (0.0%) |
| $1,000,000 or more | 0 (0.0%) | 0 (0.0%) |
| Total | 484 (100.0%) | 733 (100.0%) |
Household Income by Mortgage Status in Golden Grove
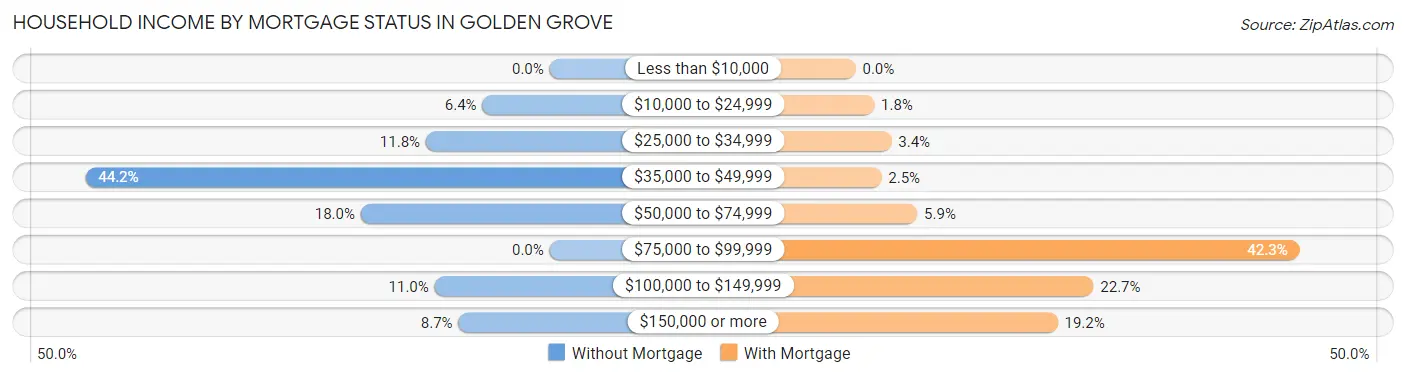
| Household Income | Without Mortgage | With Mortgage |
| Less than $10,000 | 0 (0.0%) | 0 (0.0%) |
| $10,000 to $24,999 | 31 (6.4%) | 13 (1.8%) |
| $25,000 to $34,999 | 57 (11.8%) | 25 (3.4%) |
| $35,000 to $49,999 | 214 (44.2%) | 18 (2.5%) |
| $50,000 to $74,999 | 87 (18.0%) | 43 (5.9%) |
| $75,000 to $99,999 | 0 (0.0%) | 310 (42.3%) |
| $100,000 to $149,999 | 53 (11.0%) | 166 (22.7%) |
| $150,000 or more | 42 (8.7%) | 141 (19.2%) |
| Total | 484 (100.0%) | 733 (100.0%) |
Property Value to Household Income Ratio in Golden Grove
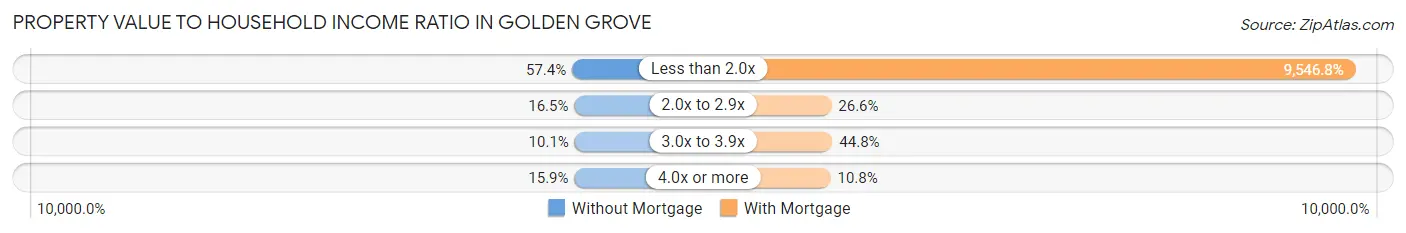
| Value-to-Income Ratio | Without Mortgage | With Mortgage |
| Less than 2.0x | 278 (57.4%) | 69,978 (9,546.8%) |
| 2.0x to 2.9x | 80 (16.5%) | 195 (26.6%) |
| 3.0x to 3.9x | 49 (10.1%) | 328 (44.8%) |
| 4.0x or more | 77 (15.9%) | 79 (10.8%) |
| Total | 484 (100.0%) | 733 (100.0%) |
Real Estate Taxes by Mortgage Status in Golden Grove
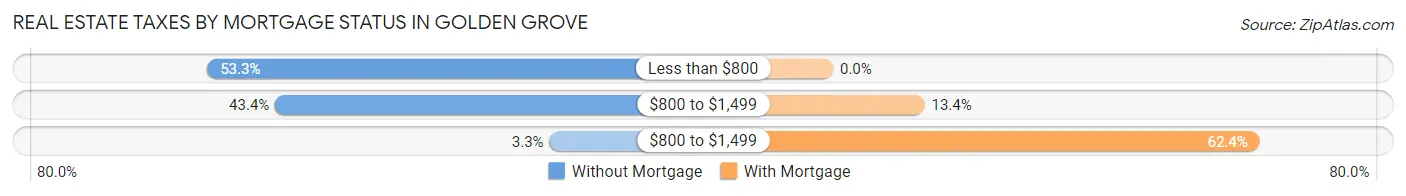
| Property Taxes | Without Mortgage | With Mortgage |
| Less than $800 | 258 (53.3%) | 0 (0.0%) |
| $800 to $1,499 | 210 (43.4%) | 98 (13.4%) |
| $800 to $1,499 | 16 (3.3%) | 457 (62.4%) |
| Total | 484 (100.0%) | 733 (100.0%) |
Health & Disability in Golden Grove
Health Insurance Coverage by Age in Golden Grove
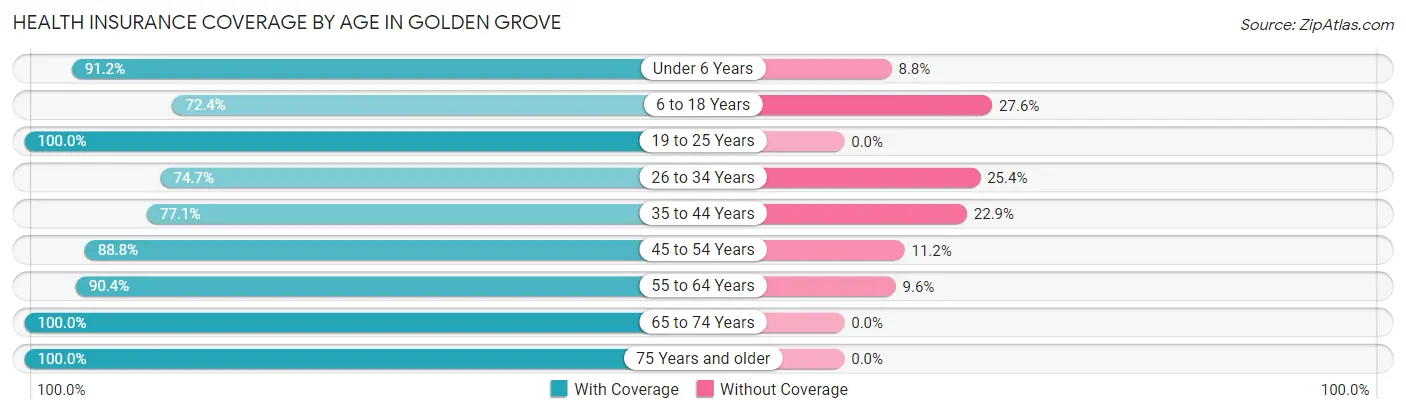
| Age Bracket | With Coverage | Without Coverage |
| Under 6 Years | 207 (91.2%) | 20 (8.8%) |
| 6 to 18 Years | 436 (72.4%) | 166 (27.6%) |
| 19 to 25 Years | 105 (100.0%) | 0 (0.0%) |
| 26 to 34 Years | 374 (74.7%) | 127 (25.4%) |
| 35 to 44 Years | 513 (77.1%) | 152 (22.9%) |
| 45 to 54 Years | 340 (88.8%) | 43 (11.2%) |
| 55 to 64 Years | 274 (90.4%) | 29 (9.6%) |
| 65 to 74 Years | 159 (100.0%) | 0 (0.0%) |
| 75 Years and older | 337 (100.0%) | 0 (0.0%) |
| Total | 2,745 (83.6%) | 537 (16.4%) |
Health Insurance Coverage by Citizenship Status in Golden Grove
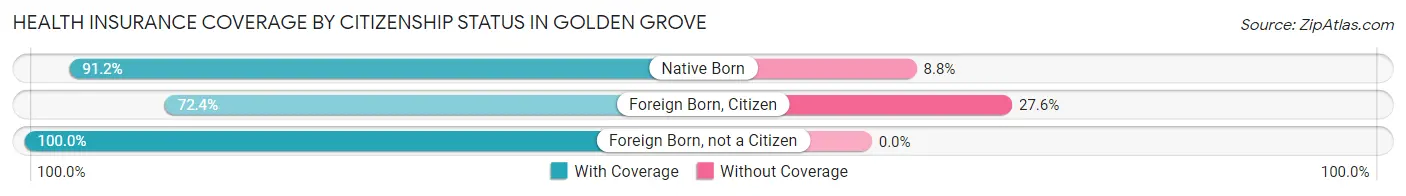
| Citizenship Status | With Coverage | Without Coverage |
| Native Born | 207 (91.2%) | 20 (8.8%) |
| Foreign Born, Citizen | 436 (72.4%) | 166 (27.6%) |
| Foreign Born, not a Citizen | 105 (100.0%) | 0 (0.0%) |
Health Insurance Coverage by Household Income in Golden Grove
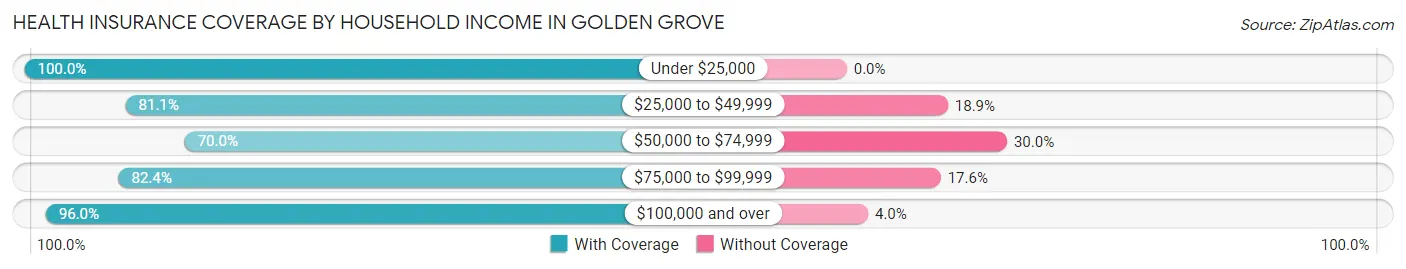
| Household Income | With Coverage | Without Coverage |
| Under $25,000 | 309 (100.0%) | 0 (0.0%) |
| $25,000 to $49,999 | 578 (81.1%) | 135 (18.9%) |
| $50,000 to $74,999 | 583 (70.0%) | 250 (30.0%) |
| $75,000 to $99,999 | 576 (82.4%) | 123 (17.6%) |
| $100,000 and over | 699 (96.0%) | 29 (4.0%) |
Public vs Private Health Insurance Coverage by Age in Golden Grove
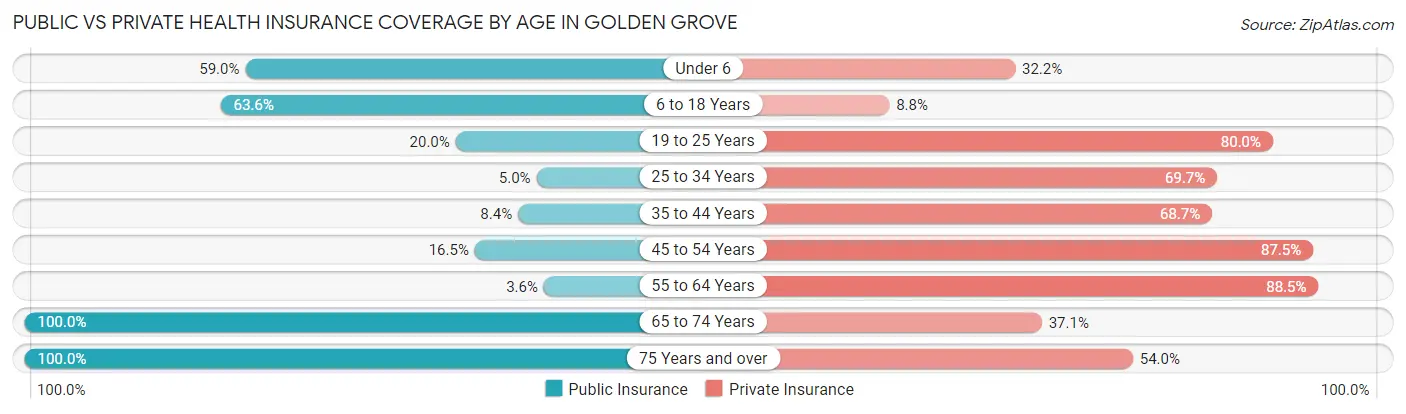
| Age Bracket | Public Insurance | Private Insurance |
| Under 6 | 134 (59.0%) | 73 (32.2%) |
| 6 to 18 Years | 383 (63.6%) | 53 (8.8%) |
| 19 to 25 Years | 21 (20.0%) | 84 (80.0%) |
| 25 to 34 Years | 25 (5.0%) | 349 (69.7%) |
| 35 to 44 Years | 56 (8.4%) | 457 (68.7%) |
| 45 to 54 Years | 63 (16.5%) | 335 (87.5%) |
| 55 to 64 Years | 11 (3.6%) | 268 (88.4%) |
| 65 to 74 Years | 159 (100.0%) | 59 (37.1%) |
| 75 Years and over | 337 (100.0%) | 182 (54.0%) |
| Total | 1,189 (36.2%) | 1,860 (56.7%) |
Disability Status by Sex by Age in Golden Grove
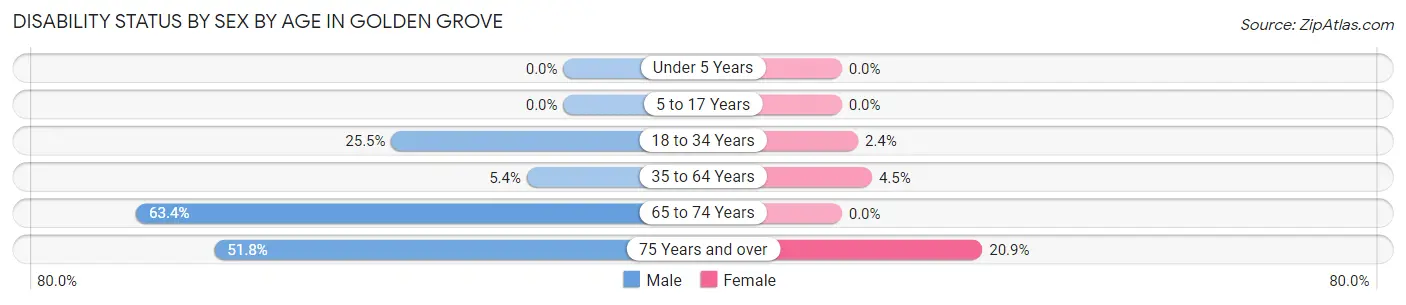
| Age Bracket | Male | Female |
| Under 5 Years | 0 (0.0%) | 0 (0.0%) |
| 5 to 17 Years | 0 (0.0%) | 0 (0.0%) |
| 18 to 34 Years | 71 (25.5%) | 9 (2.4%) |
| 35 to 64 Years | 37 (5.4%) | 30 (4.5%) |
| 65 to 74 Years | 85 (63.4%) | 0 (0.0%) |
| 75 Years and over | 43 (51.8%) | 53 (20.9%) |
Disability Class by Sex by Age in Golden Grove
Disability Class: Hearing Difficulty
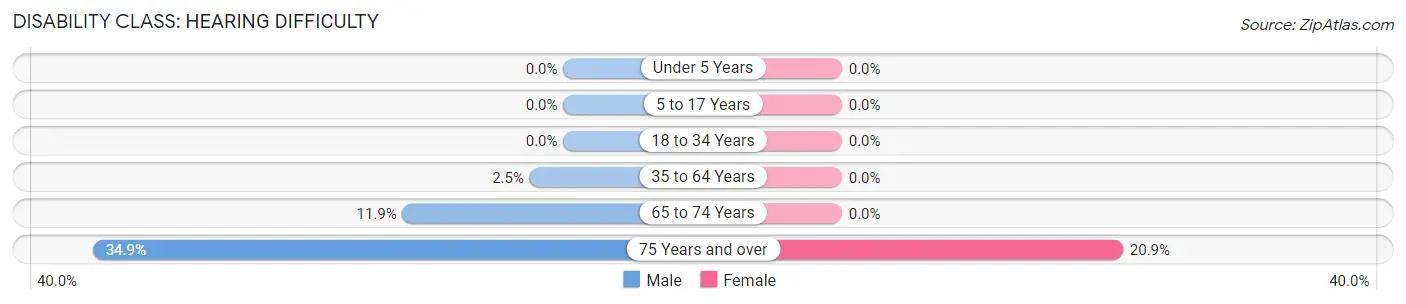
| Age Bracket | Male | Female |
| Under 5 Years | 0 (0.0%) | 0 (0.0%) |
| 5 to 17 Years | 0 (0.0%) | 0 (0.0%) |
| 18 to 34 Years | 0 (0.0%) | 0 (0.0%) |
| 35 to 64 Years | 17 (2.5%) | 0 (0.0%) |
| 65 to 74 Years | 16 (11.9%) | 0 (0.0%) |
| 75 Years and over | 29 (34.9%) | 53 (20.9%) |
Disability Class: Vision Difficulty
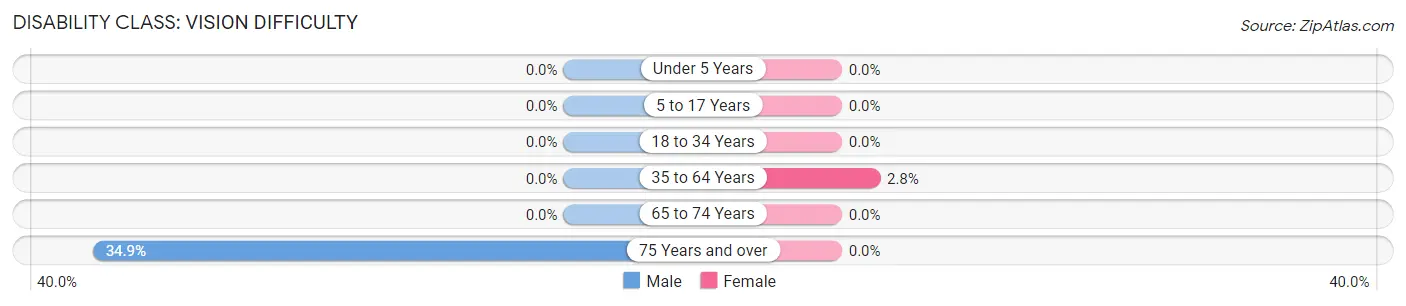
| Age Bracket | Male | Female |
| Under 5 Years | 0 (0.0%) | 0 (0.0%) |
| 5 to 17 Years | 0 (0.0%) | 0 (0.0%) |
| 18 to 34 Years | 0 (0.0%) | 0 (0.0%) |
| 35 to 64 Years | 0 (0.0%) | 19 (2.8%) |
| 65 to 74 Years | 0 (0.0%) | 0 (0.0%) |
| 75 Years and over | 29 (34.9%) | 0 (0.0%) |
Disability Class: Cognitive Difficulty
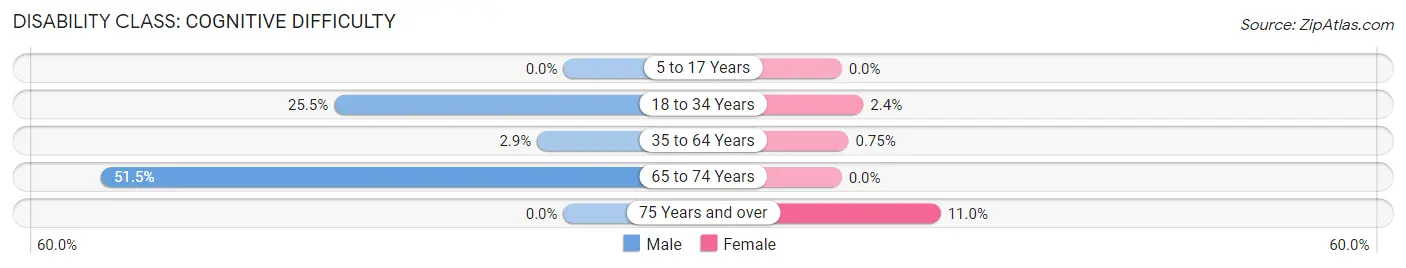
| Age Bracket | Male | Female |
| 5 to 17 Years | 0 (0.0%) | 0 (0.0%) |
| 18 to 34 Years | 71 (25.5%) | 9 (2.4%) |
| 35 to 64 Years | 20 (2.9%) | 5 (0.7%) |
| 65 to 74 Years | 69 (51.5%) | 0 (0.0%) |
| 75 Years and over | 0 (0.0%) | 28 (11.0%) |
Disability Class: Ambulatory Difficulty
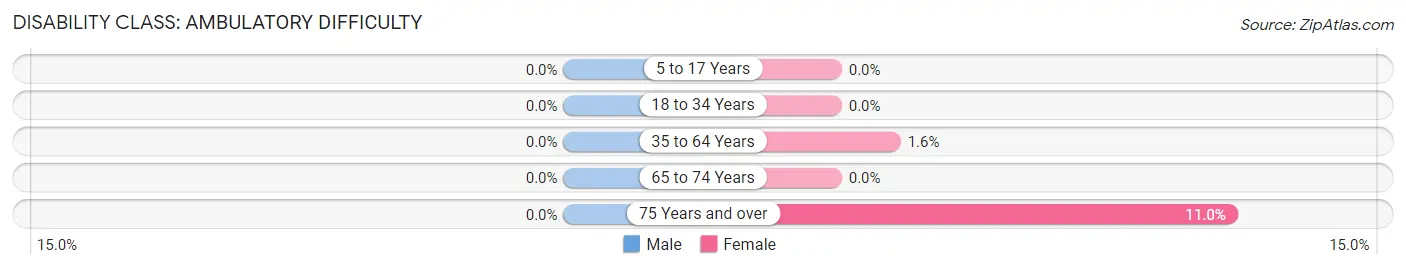
| Age Bracket | Male | Female |
| 5 to 17 Years | 0 (0.0%) | 0 (0.0%) |
| 18 to 34 Years | 0 (0.0%) | 0 (0.0%) |
| 35 to 64 Years | 0 (0.0%) | 11 (1.6%) |
| 65 to 74 Years | 0 (0.0%) | 0 (0.0%) |
| 75 Years and over | 0 (0.0%) | 28 (11.0%) |
Disability Class: Self-Care Difficulty
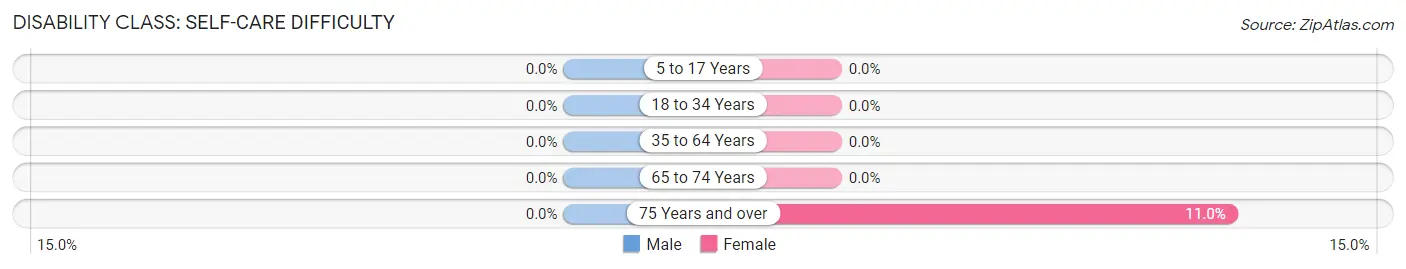
| Age Bracket | Male | Female |
| 5 to 17 Years | 0 (0.0%) | 0 (0.0%) |
| 18 to 34 Years | 0 (0.0%) | 0 (0.0%) |
| 35 to 64 Years | 0 (0.0%) | 0 (0.0%) |
| 65 to 74 Years | 0 (0.0%) | 0 (0.0%) |
| 75 Years and over | 0 (0.0%) | 28 (11.0%) |
Technology Access in Golden Grove
Computing Device Access in Golden Grove
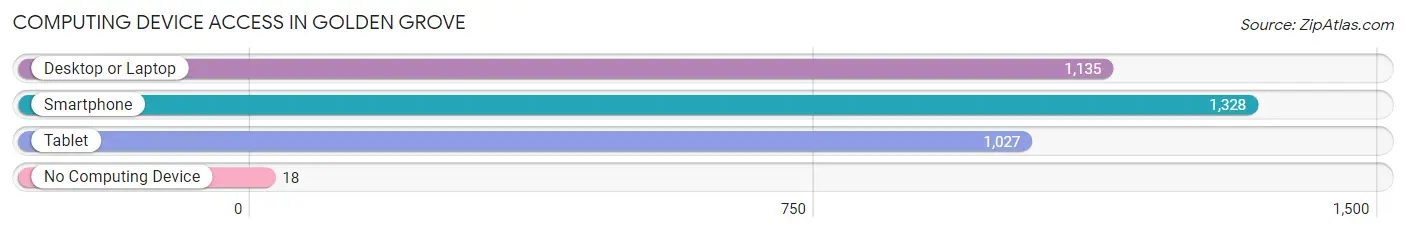
| Device Type | # Households | % Households |
| Desktop or Laptop | 1,135 | 78.7% |
| Smartphone | 1,328 | 92.1% |
| Tablet | 1,027 | 71.2% |
| No Computing Device | 18 | 1.3% |
| Total | 1,442 | 100.0% |
Internet Access in Golden Grove
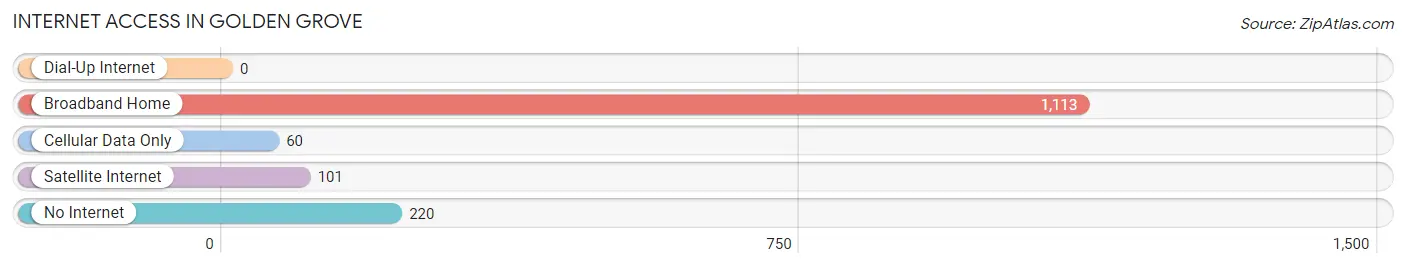
| Internet Type | # Households | % Households |
| Dial-Up Internet | 0 | 0.0% |
| Broadband Home | 1,113 | 77.2% |
| Cellular Data Only | 60 | 4.2% |
| Satellite Internet | 101 | 7.0% |
| No Internet | 220 | 15.3% |
| Total | 1,442 | 100.0% |
Golden Grove Summary
Geography
Golden Grove is a small town located in the state of South Carolina, in the United States. It is situated in the Piedmont region of the state, in the foothills of the Blue Ridge Mountains. The town is located in Laurens County, and is approximately 25 miles south of the city of Greenville. The town is situated on the banks of the Reedy River, and is surrounded by rolling hills and lush forests.
The town of Golden Grove is located at an elevation of 890 feet above sea level. The town is located in a humid subtropical climate zone, with hot, humid summers and mild winters. The average annual temperature is around 64 degrees Fahrenheit, with an average annual precipitation of around 48 inches.
History
The town of Golden Grove was founded in 1820 by a group of settlers from North Carolina. The town was named after a nearby grove of golden-colored trees. The town quickly grew, and by the mid-1800s, it had become a thriving agricultural community. The town was home to several cotton plantations, and the local economy was largely based on the production of cotton.
In the late 1800s, the town began to experience a decline in population as many of the local farmers moved away in search of better opportunities. The town was also affected by the Great Depression, and many of the local businesses closed.
In the 1950s, the town began to experience a resurgence in population as new industries moved into the area. The town was home to several textile mills, and the local economy began to diversify. The town also experienced a population boom in the 1970s, as many people moved to the area in search of a better quality of life.
Economy
The economy of Golden Grove is largely based on the production of textiles and other light manufacturing. The town is home to several textile mills, and the local economy is also supported by the production of furniture, paper products, and other manufactured goods.
The town is also home to several retail stores, restaurants, and other businesses. The town is also home to a number of small businesses, including a local newspaper, a hardware store, and a variety of other small businesses.
Demographics
As of the 2010 census, the population of Golden Grove was 2,845. The town has a population density of 1,072 people per square mile. The median age of the population is 39.7 years, and the median household income is $37,945.
The town is predominantly white, with a population that is 88.3% white, 8.2% African American, 1.2% Hispanic or Latino, and 1.3% Asian. The town is also home to a small Native American population, with 0.2% of the population identifying as Native American.
Conclusion
Golden Grove is a small town located in the state of South Carolina, in the United States. The town was founded in 1820, and has since grown to become a thriving agricultural and manufacturing community. The town is home to several textile mills, and the local economy is also supported by the production of furniture, paper products, and other manufactured goods. The town has a population of 2,845, and is predominantly white, with a population that is 88.3% white, 8.2% African American, 1.2% Hispanic or Latino, and 1.3% Asian.
Common Questions
What is Per Capita Income in Golden Grove?
Per Capita income in Golden Grove is $34,194.
What is the Median Family Income in Golden Grove?
Median Family Income in Golden Grove is $66,699.
What is the Median Household income in Golden Grove?
Median Household Income in Golden Grove is $67,147.
What is Income or Wage Gap in Golden Grove?
Income or Wage Gap in Golden Grove is 24.0%.
Women in Golden Grove earn 76.0 cents for every dollar earned by a man.
What is Inequality or Gini Index in Golden Grove?
Inequality or Gini Index in Golden Grove is 0.38.
What is the Total Population of Golden Grove?
Total Population of Golden Grove is 3,282.
What is the Total Male Population of Golden Grove?
Total Male Population of Golden Grove is 1,693.
What is the Total Female Population of Golden Grove?
Total Female Population of Golden Grove is 1,589.
What is the Ratio of Males per 100 Females in Golden Grove?
There are 106.54 Males per 100 Females in Golden Grove.
What is the Ratio of Females per 100 Males in Golden Grove?
There are 93.86 Females per 100 Males in Golden Grove.
What is the Median Population Age in Golden Grove?
Median Population Age in Golden Grove is 39.9 Years.
What is the Average Family Size in Golden Grove
Average Family Size in Golden Grove is 2.9 People.
What is the Average Household Size in Golden Grove
Average Household Size in Golden Grove is 2.3 People.
How Large is the Labor Force in Golden Grove?
There are 1,874 People in the Labor Forcein in Golden Grove.
What is the Percentage of People in the Labor Force in Golden Grove?
71.8% of People are in the Labor Force in Golden Grove.
What is the Unemployment Rate in Golden Grove?
Unemployment Rate in Golden Grove is 0.9%.