Arcadia, SC Map & Demographics
Arcadia Map
Arcadia Overview
$19,963
PER CAPITA INCOME
$44,491
AVG FAMILY INCOME
$39,931
AVG HOUSEHOLD INCOME
11.1%
WAGE / INCOME GAP [ % ]
88.9¢/ $1
WAGE / INCOME GAP [ $ ]
0.47
INEQUALITY / GINI INDEX
2,846
TOTAL POPULATION
1,269
MALE POPULATION
1,577
FEMALE POPULATION
80.47
MALES / 100 FEMALES
124.27
FEMALES / 100 MALES
27.5
MEDIAN AGE
3.8
AVG FAMILY SIZE
2.7
AVG HOUSEHOLD SIZE
1,478
LABOR FORCE [ PEOPLE ]
76.8%
PERCENT IN LABOR FORCE
12.0%
UNEMPLOYMENT RATE
Arcadia Zip Codes
Arcadia Area Codes
Income in Arcadia
Income Overview in Arcadia
Per Capita Income in Arcadia is $19,963, while median incomes of families and households are $44,491 and $39,931 respectively.
| Characteristic | Number | Measure |
| Per Capita Income | 2,846 | $19,963 |
| Median Family Income | 507 | $44,491 |
| Mean Family Income | 507 | $58,366 |
| Median Household Income | 1,063 | $39,931 |
| Mean Household Income | 1,063 | $49,819 |
| Income Deficit | 507 | $0 |
| Wage / Income Gap (%) | 2,846 | 11.10% |
| Wage / Income Gap ($) | 2,846 | 88.90¢ per $1 |
| Gini / Inequality Index | 2,846 | 0.47 |
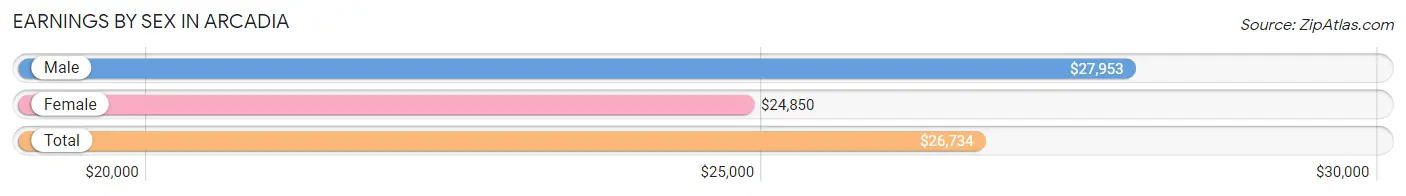
Earnings by Sex in Arcadia
Average Earnings in Arcadia are $26,734, $27,953 for men and $24,850 for women, a difference of 11.1%.
| Sex | Number | Average Earnings |
| Male | 663 (44.9%) | $27,953 |
| Female | 814 (55.1%) | $24,850 |
| Total | 1,477 (100.0%) | $26,734 |
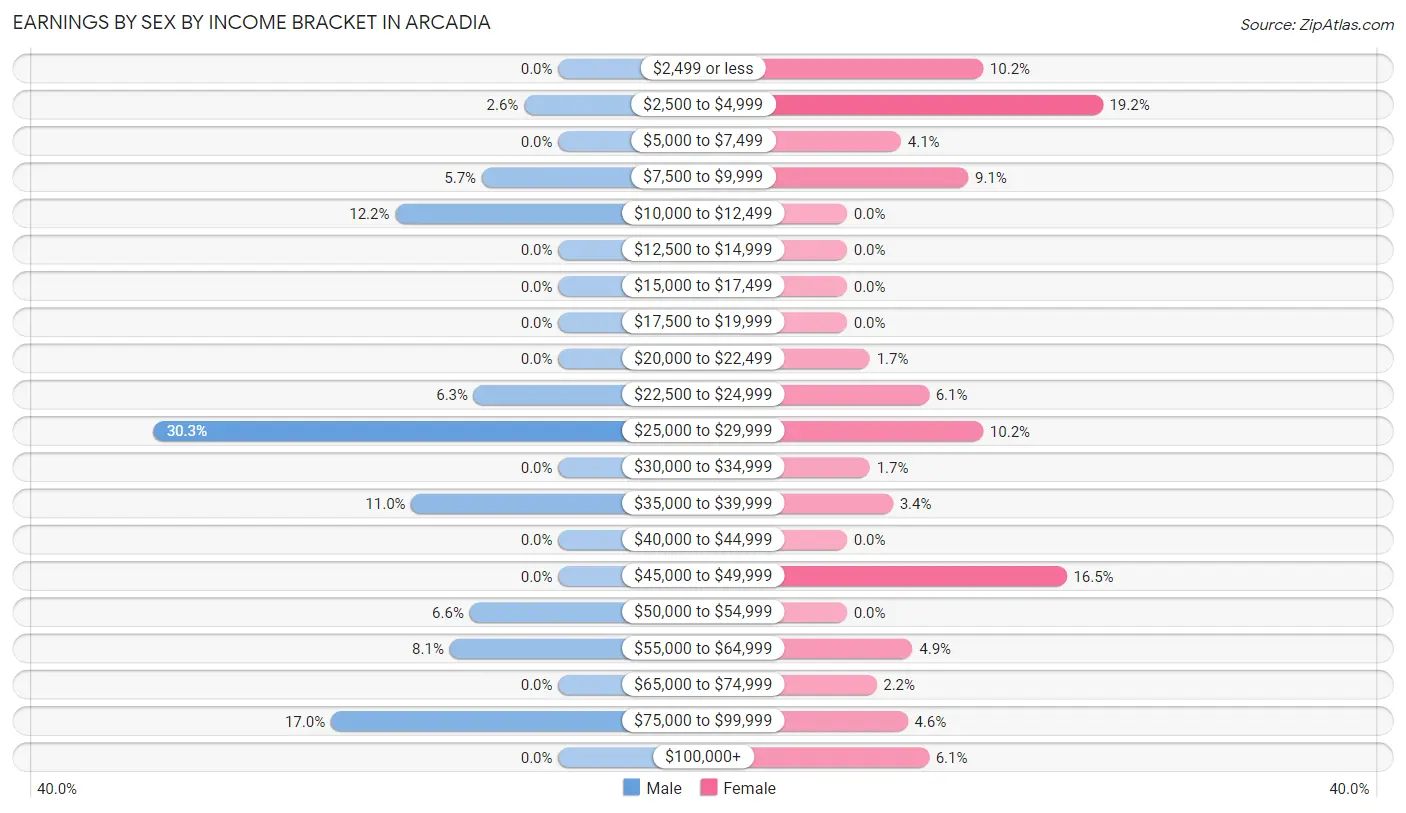
Earnings by Sex by Income Bracket in Arcadia
The most common earnings brackets in Arcadia are $25,000 to $29,999 for men (201 | 30.3%) and $2,500 to $4,999 for women (156 | 19.2%).
| Income | Male | Female |
| $2,499 or less | 0 (0.0%) | 83 (10.2%) |
| $2,500 to $4,999 | 17 (2.6%) | 156 (19.2%) |
| $5,000 to $7,499 | 0 (0.0%) | 33 (4.1%) |
| $7,500 to $9,999 | 38 (5.7%) | 74 (9.1%) |
| $10,000 to $12,499 | 81 (12.2%) | 0 (0.0%) |
| $12,500 to $14,999 | 0 (0.0%) | 0 (0.0%) |
| $15,000 to $17,499 | 0 (0.0%) | 0 (0.0%) |
| $17,500 to $19,999 | 0 (0.0%) | 0 (0.0%) |
| $20,000 to $22,499 | 0 (0.0%) | 14 (1.7%) |
| $22,500 to $24,999 | 42 (6.3%) | 50 (6.1%) |
| $25,000 to $29,999 | 201 (30.3%) | 83 (10.2%) |
| $30,000 to $34,999 | 0 (0.0%) | 14 (1.7%) |
| $35,000 to $39,999 | 73 (11.0%) | 28 (3.4%) |
| $40,000 to $44,999 | 0 (0.0%) | 0 (0.0%) |
| $45,000 to $49,999 | 0 (0.0%) | 134 (16.5%) |
| $50,000 to $54,999 | 44 (6.6%) | 0 (0.0%) |
| $55,000 to $64,999 | 54 (8.1%) | 40 (4.9%) |
| $65,000 to $74,999 | 0 (0.0%) | 18 (2.2%) |
| $75,000 to $99,999 | 113 (17.0%) | 37 (4.5%) |
| $100,000+ | 0 (0.0%) | 50 (6.1%) |
| Total | 663 (100.0%) | 814 (100.0%) |
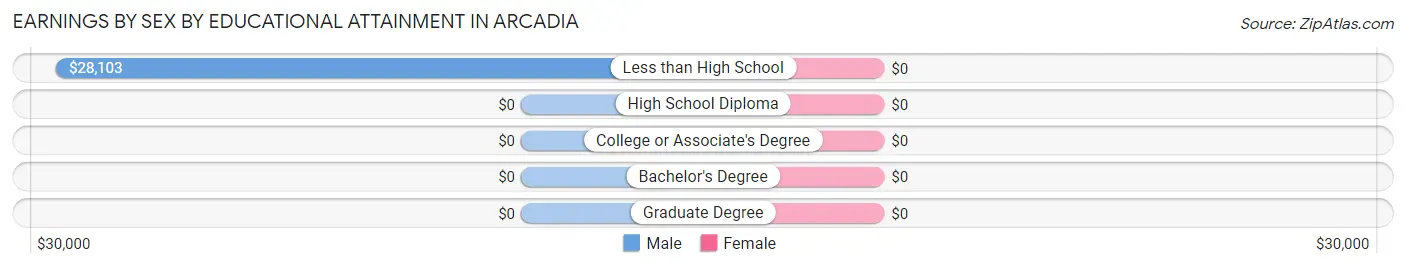
Earnings by Sex by Educational Attainment in Arcadia
| Educational Attainment | Male Income | Female Income |
| Less than High School | $28,103 | $0 |
| High School Diploma | - | - |
| College or Associate's Degree | - | - |
| Bachelor's Degree | - | - |
| Graduate Degree | - | - |
| Total | $29,806 | $26,470 |
Family Income in Arcadia
Family Income Brackets in Arcadia
According to the Arcadia family income data, there are 114 families falling into the less than $10,000 income range, which is the most common income bracket and makes up 22.5% of all families.
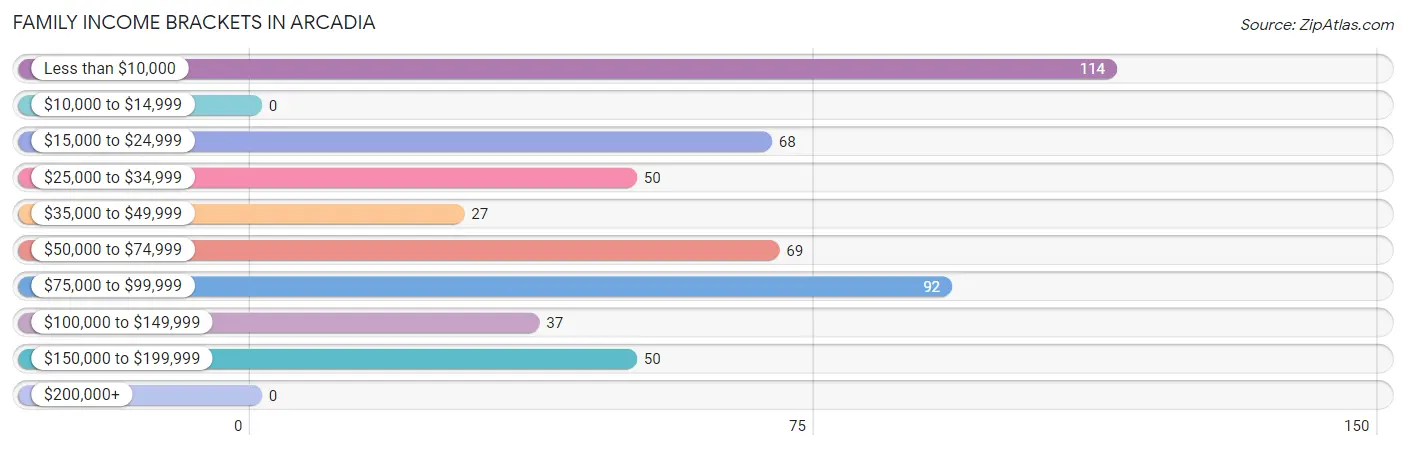
| Income Bracket | # Families | % Families |
| Less than $10,000 | 114 | 22.5% |
| $10,000 to $14,999 | 0 | 0.0% |
| $15,000 to $24,999 | 68 | 13.4% |
| $25,000 to $34,999 | 50 | 9.9% |
| $35,000 to $49,999 | 27 | 5.3% |
| $50,000 to $74,999 | 69 | 13.6% |
| $75,000 to $99,999 | 92 | 18.1% |
| $100,000 to $149,999 | 37 | 7.3% |
| $150,000 to $199,999 | 50 | 9.9% |
| $200,000+ | 0 | 0.0% |
Family Income by Famaliy Size in Arcadia
| Income Bracket | # Families | Median Income |
| 2-Person Families | 127 (25.1%) | $0 |
| 3-Person Families | 102 (20.1%) | $0 |
| 4-Person Families | 209 (41.2%) | $0 |
| 5-Person Families | 52 (10.3%) | $0 |
| 6-Person Families | 17 (3.4%) | $0 |
| 7+ Person Families | 0 (0.0%) | $0 |
| Total | 507 (100.0%) | $44,491 |
Family Income by Number of Earners in Arcadia
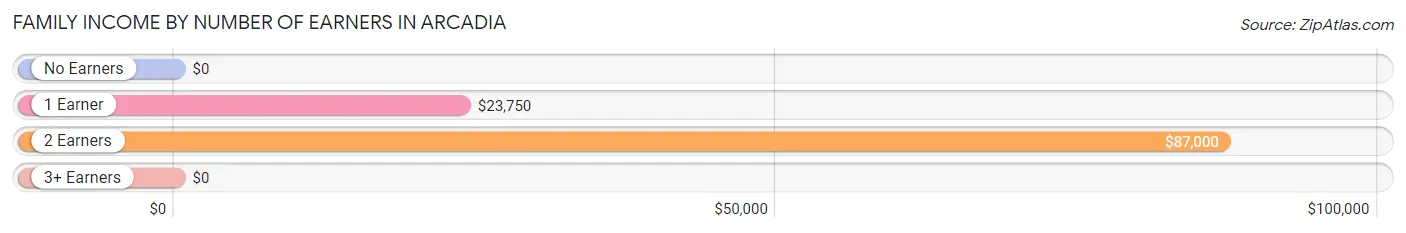
| Number of Earners | # Families | Median Income |
| No Earners | 66 (13.0%) | $0 |
| 1 Earner | 200 (39.5%) | $23,750 |
| 2 Earners | 224 (44.2%) | $87,000 |
| 3+ Earners | 17 (3.4%) | $0 |
| Total | 507 (100.0%) | $44,491 |
Household Income in Arcadia
Household Income Brackets in Arcadia
With 180 households falling in the category, the less than $10,000 income range is the most frequent in Arcadia, accounting for 16.9% of all households.

| Income Bracket | # Households | % Households |
| Less than $10,000 | 180 | 16.9% |
| $10,000 to $14,999 | 37 | 3.5% |
| $15,000 to $24,999 | 146 | 13.7% |
| $25,000 to $34,999 | 151 | 14.2% |
| $35,000 to $49,999 | 141 | 13.3% |
| $50,000 to $74,999 | 142 | 13.4% |
| $75,000 to $99,999 | 129 | 12.1% |
| $100,000 to $149,999 | 87 | 8.2% |
| $150,000 to $199,999 | 50 | 4.7% |
| $200,000+ | 0 | 0.0% |
Household Income by Householder Age in Arcadia
The median household income in Arcadia is $39,931, with the highest median household income of $49,941 found in the 25 to 44 years age bracket for the primary householder. A total of 679 households (63.9%) fall into this category.
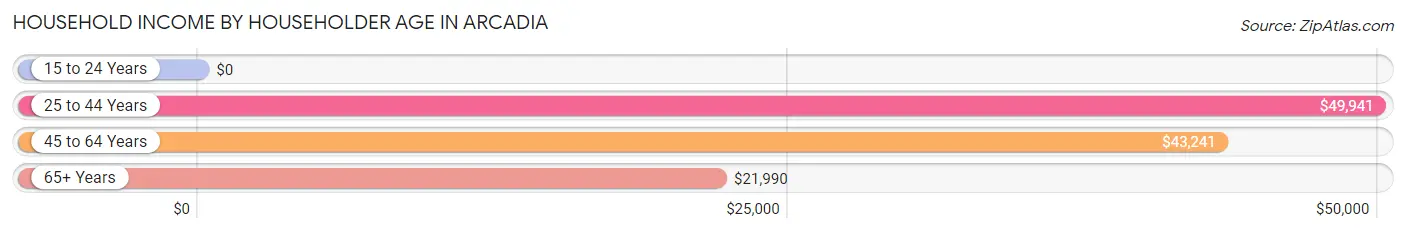
| Income Bracket | # Households | Median Income |
| 15 to 24 Years | 0 (0.0%) | $0 |
| 25 to 44 Years | 679 (63.9%) | $49,941 |
| 45 to 64 Years | 214 (20.1%) | $43,241 |
| 65+ Years | 170 (16.0%) | $21,990 |
| Total | 1,063 (100.0%) | $39,931 |
Poverty in Arcadia
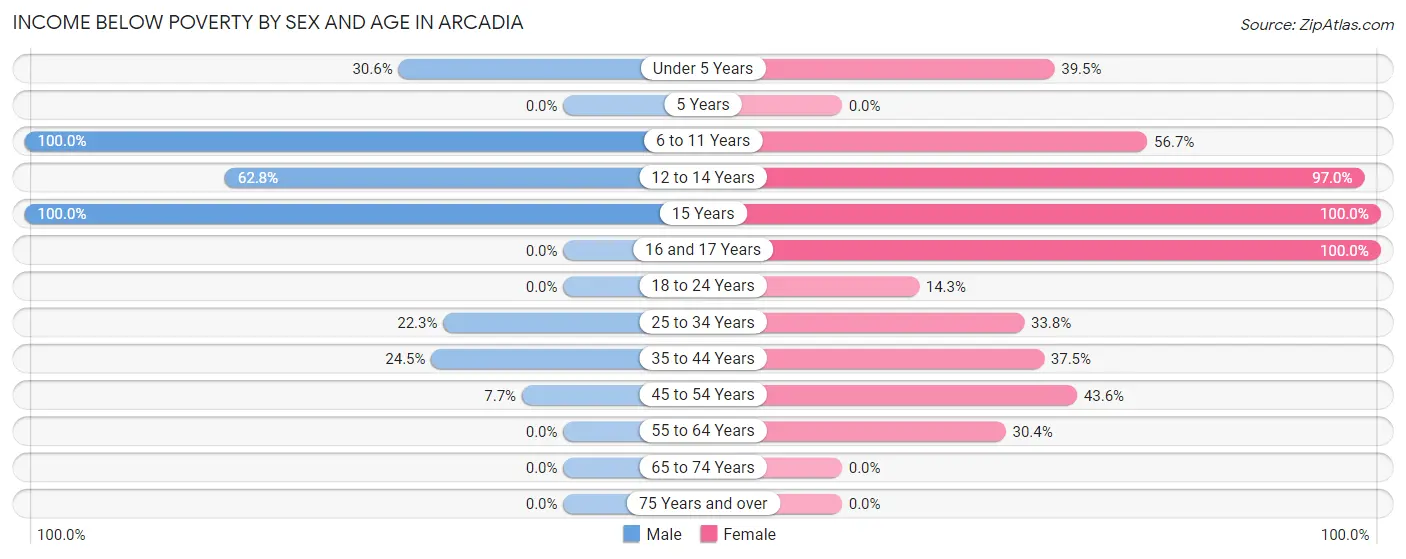
Income Below Poverty by Sex and Age in Arcadia
With 27.3% poverty level for males and 41.7% for females among the residents of Arcadia, 6 to 11 year old males and 15 year old females are the most vulnerable to poverty, with 83 males (100.0%) and 40 females (100.0%) in their respective age groups living below the poverty level.
| Age Bracket | Male | Female |
| Under 5 Years | 56 (30.6%) | 43 (39.5%) |
| 5 Years | 0 (0.0%) | 0 (0.0%) |
| 6 to 11 Years | 83 (100.0%) | 140 (56.7%) |
| 12 to 14 Years | 49 (62.8%) | 128 (97.0%) |
| 15 Years | 13 (100.0%) | 40 (100.0%) |
| 16 and 17 Years | 0 (0.0%) | 9 (100.0%) |
| 18 to 24 Years | 0 (0.0%) | 17 (14.3%) |
| 25 to 34 Years | 82 (22.3%) | 114 (33.8%) |
| 35 to 44 Years | 61 (24.5%) | 33 (37.5%) |
| 45 to 54 Years | 2 (7.7%) | 96 (43.6%) |
| 55 to 64 Years | 0 (0.0%) | 38 (30.4%) |
| 65 to 74 Years | 0 (0.0%) | 0 (0.0%) |
| 75 Years and over | 0 (0.0%) | 0 (0.0%) |
| Total | 346 (27.3%) | 658 (41.7%) |
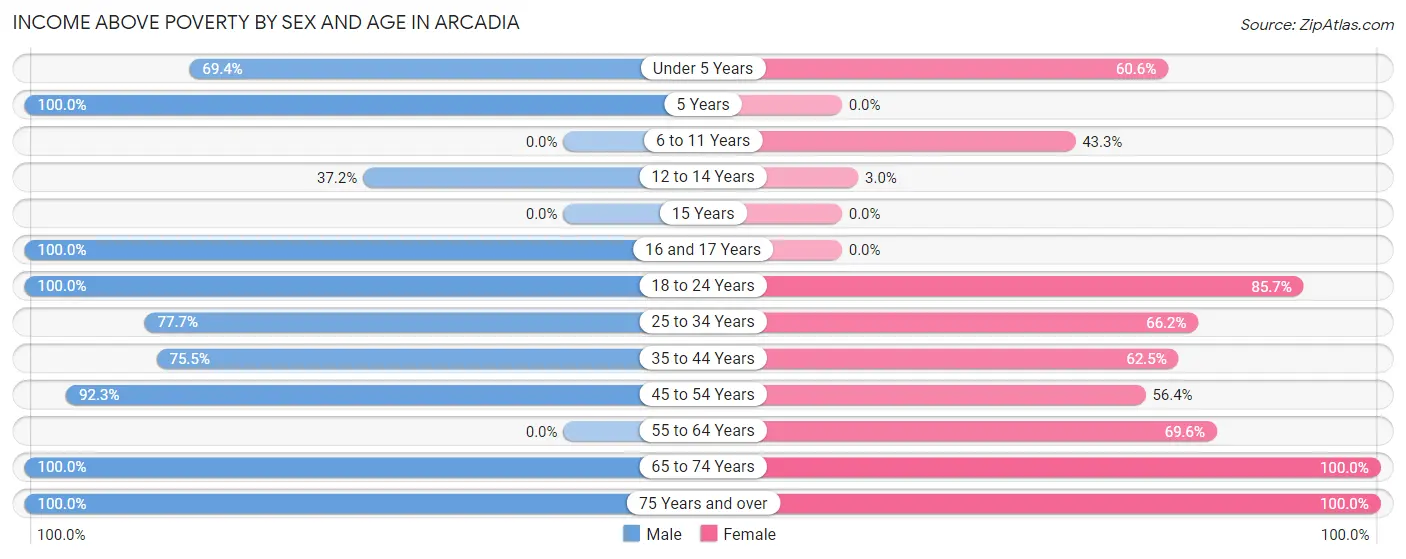
Income Above Poverty by Sex and Age in Arcadia
According to the poverty statistics in Arcadia, males aged 5 years and females aged 65 to 74 years are the age groups that are most secure financially, with 100.0% of males and 100.0% of females in these age groups living above the poverty line.
| Age Bracket | Male | Female |
| Under 5 Years | 127 (69.4%) | 66 (60.6%) |
| 5 Years | 37 (100.0%) | 0 (0.0%) |
| 6 to 11 Years | 0 (0.0%) | 107 (43.3%) |
| 12 to 14 Years | 29 (37.2%) | 4 (3.0%) |
| 15 Years | 0 (0.0%) | 0 (0.0%) |
| 16 and 17 Years | 17 (100.0%) | 0 (0.0%) |
| 18 to 24 Years | 69 (100.0%) | 102 (85.7%) |
| 25 to 34 Years | 286 (77.7%) | 223 (66.2%) |
| 35 to 44 Years | 188 (75.5%) | 55 (62.5%) |
| 45 to 54 Years | 24 (92.3%) | 124 (56.4%) |
| 55 to 64 Years | 0 (0.0%) | 87 (69.6%) |
| 65 to 74 Years | 100 (100.0%) | 113 (100.0%) |
| 75 Years and over | 46 (100.0%) | 38 (100.0%) |
| Total | 923 (72.7%) | 919 (58.3%) |
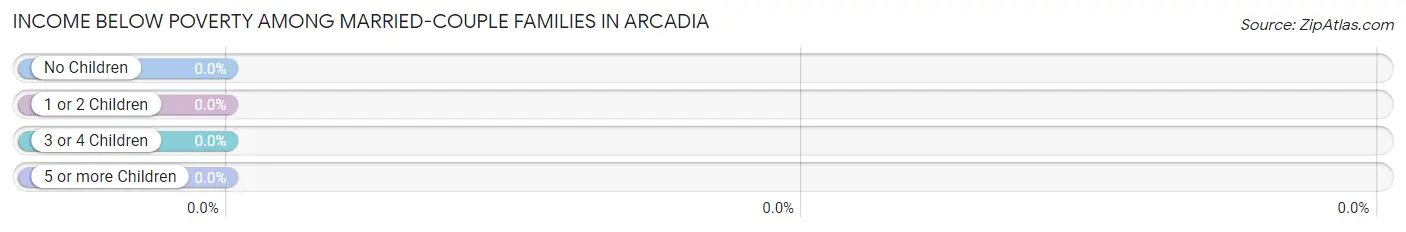
Income Below Poverty Among Married-Couple Families in Arcadia
| Children | Above Poverty | Below Poverty |
| No Children | 51 (100.0%) | 0 (0.0%) |
| 1 or 2 Children | 64 (100.0%) | 0 (0.0%) |
| 3 or 4 Children | 17 (100.0%) | 0 (0.0%) |
| 5 or more Children | 0 (0.0%) | 0 (0.0%) |
| Total | 132 (100.0%) | 0 (0.0%) |
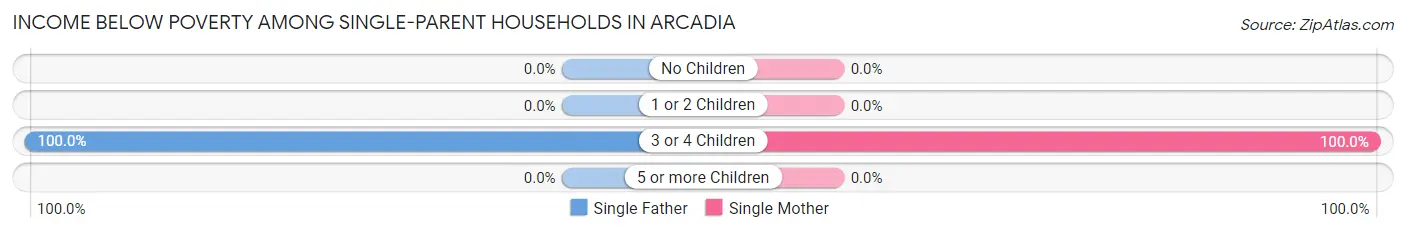
Income Below Poverty Among Single-Parent Households in Arcadia
According to the poverty data in Arcadia, 20.4% or 11 single-father households and 35.5% or 114 single-mother households are living below the poverty line. Among single-father households, those with 3 or 4 children have the highest poverty rate, with 11 households (100.0%) experiencing poverty. Likewise, among single-mother households, those with 3 or 4 children have the highest poverty rate, with 114 households (100.0%) falling below the poverty line.
| Children | Single Father | Single Mother |
| No Children | 0 (0.0%) | 0 (0.0%) |
| 1 or 2 Children | 0 (0.0%) | 0 (0.0%) |
| 3 or 4 Children | 11 (100.0%) | 114 (100.0%) |
| 5 or more Children | 0 (0.0%) | 0 (0.0%) |
| Total | 11 (20.4%) | 114 (35.5%) |
Income Below Poverty Among Married-Couple vs Single-Parent Households in Arcadia
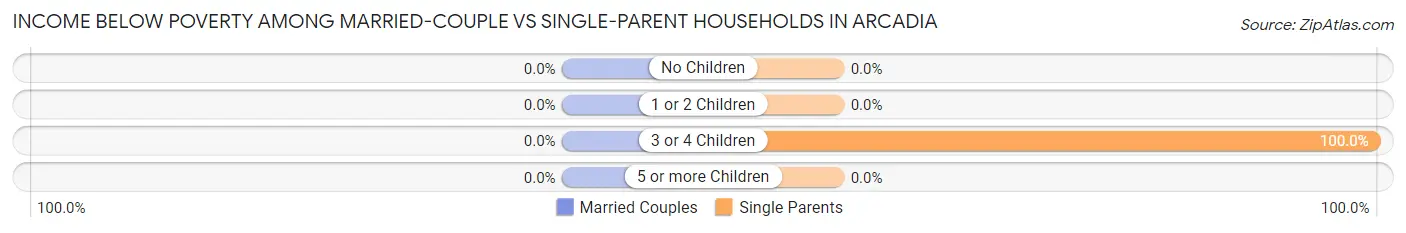
| Children | Married-Couple Families | Single-Parent Households |
| No Children | 0 (0.0%) | 0 (0.0%) |
| 1 or 2 Children | 0 (0.0%) | 0 (0.0%) |
| 3 or 4 Children | 0 (0.0%) | 125 (100.0%) |
| 5 or more Children | 0 (0.0%) | 0 (0.0%) |
| Total | 0 (0.0%) | 125 (33.3%) |
Race in Arcadia
The most populous races in Arcadia are White / Caucasian (1,254 | 44.1%), Hispanic or Latino (1,213 | 42.6%), and Two or more Races (626 | 22.0%).
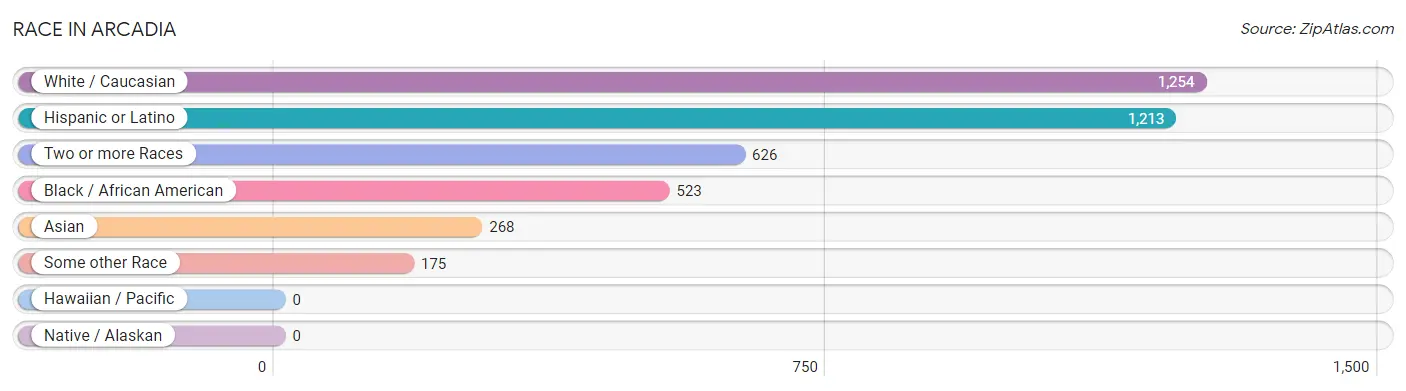
| Race | # Population | % Population |
| Asian | 268 | 9.4% |
| Black / African American | 523 | 18.4% |
| Hawaiian / Pacific | 0 | 0.0% |
| Hispanic or Latino | 1,213 | 42.6% |
| Native / Alaskan | 0 | 0.0% |
| White / Caucasian | 1,254 | 44.1% |
| Two or more Races | 626 | 22.0% |
| Some other Race | 175 | 6.1% |
| Total | 2,846 | 100.0% |
Ancestry in Arcadia
The most populous ancestries reported in Arcadia are Mexican (672 | 23.6%), Central American (355 | 12.5%), German (236 | 8.3%), Indian (Asian) (230 | 8.1%), and Honduran (219 | 7.7%), together accounting for 60.1% of all Arcadia residents.
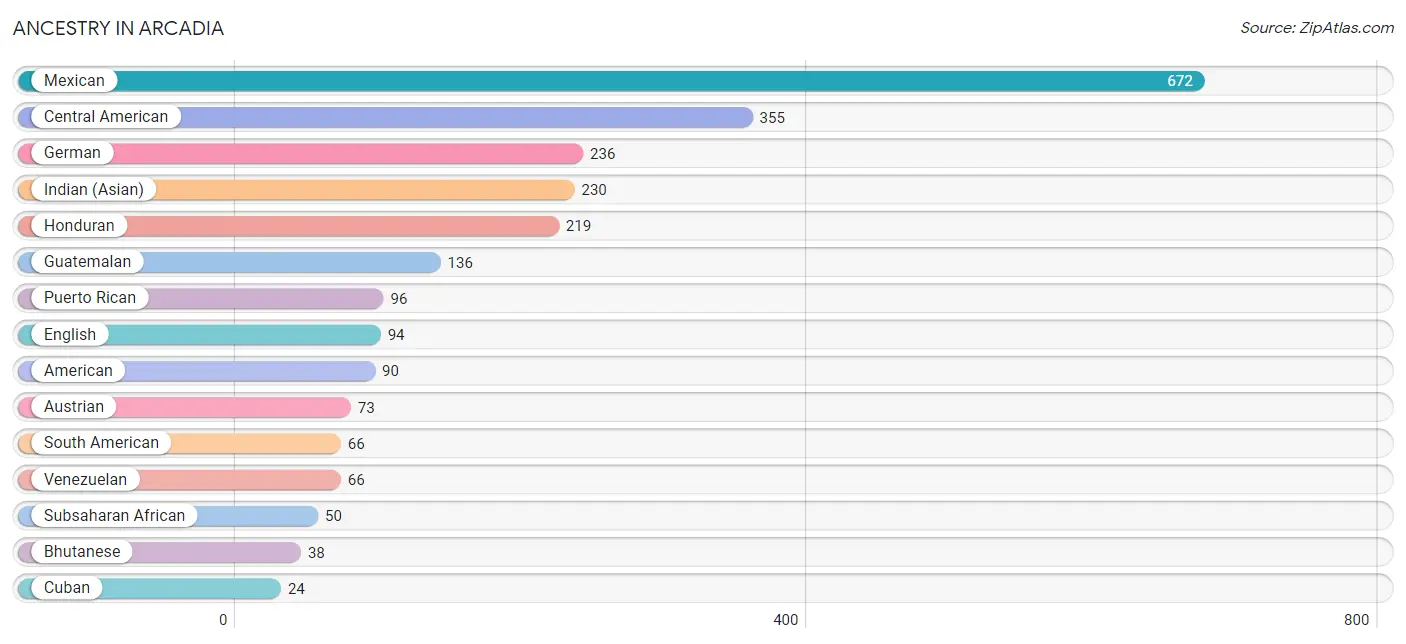
| Ancestry | # Population | % Population |
| American | 90 | 3.2% |
| Austrian | 73 | 2.6% |
| Bhutanese | 38 | 1.3% |
| Central American | 355 | 12.5% |
| Cuban | 24 | 0.8% |
| English | 94 | 3.3% |
| Finnish | 19 | 0.7% |
| German | 236 | 8.3% |
| Guatemalan | 136 | 4.8% |
| Honduran | 219 | 7.7% |
| Indian (Asian) | 230 | 8.1% |
| Mexican | 672 | 23.6% |
| Puerto Rican | 96 | 3.4% |
| South American | 66 | 2.3% |
| Subsaharan African | 50 | 1.8% |
| Swedish | 22 | 0.8% |
| Venezuelan | 66 | 2.3% |
| West Indian | 13 | 0.5% | View All 18 Rows |
Immigrants in Arcadia
The most numerous immigrant groups reported in Arcadia came from Latin America (539 | 18.9%), Central America (473 | 16.6%), Mexico (335 | 11.8%), Asia (165 | 5.8%), and Honduras (113 | 4.0%), together accounting for 57.1% of all Arcadia residents.
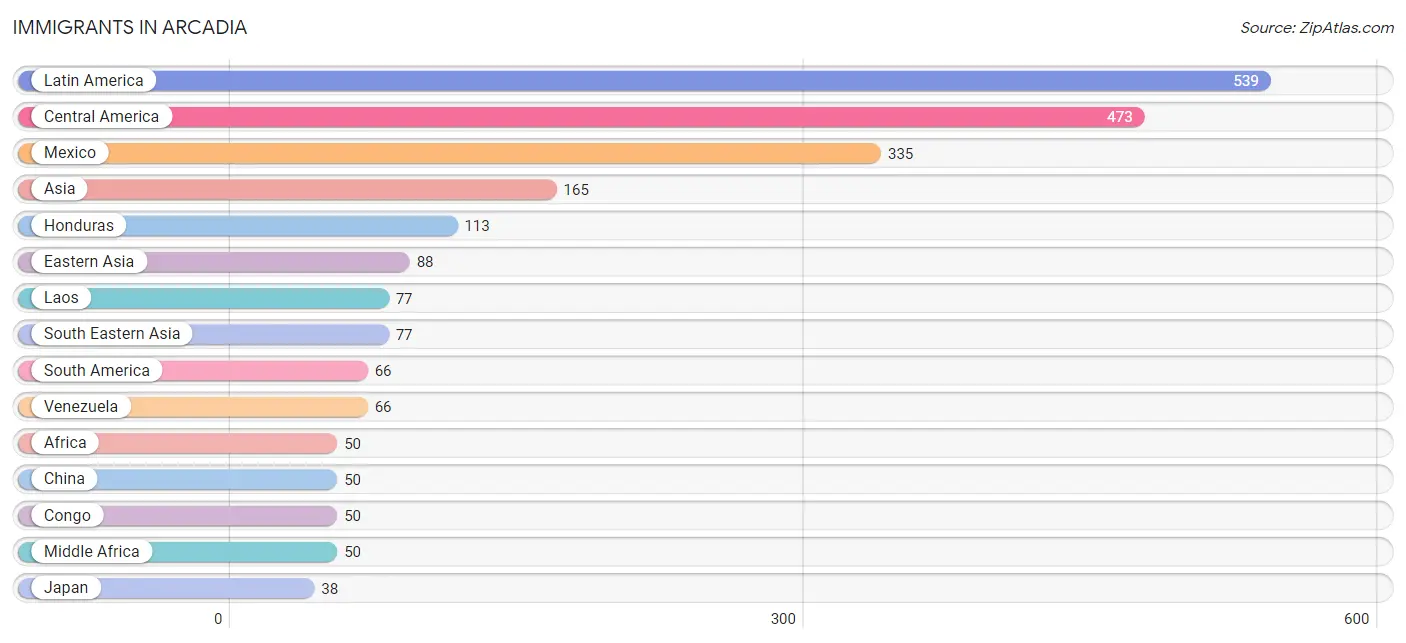
| Immigration Origin | # Population | % Population |
| Africa | 50 | 1.8% |
| Asia | 165 | 5.8% |
| Central America | 473 | 16.6% |
| China | 50 | 1.8% |
| Congo | 50 | 1.8% |
| Eastern Asia | 88 | 3.1% |
| Guatemala | 25 | 0.9% |
| Honduras | 113 | 4.0% |
| Japan | 38 | 1.3% |
| Laos | 77 | 2.7% |
| Latin America | 539 | 18.9% |
| Mexico | 335 | 11.8% |
| Middle Africa | 50 | 1.8% |
| South America | 66 | 2.3% |
| South Eastern Asia | 77 | 2.7% |
| Venezuela | 66 | 2.3% | View All 16 Rows |
Sex and Age in Arcadia
Sex and Age in Arcadia
The most populous age groups in Arcadia are 25 to 29 Years (305 | 24.0%) for men and 30 to 34 Years (251 | 15.9%) for women.
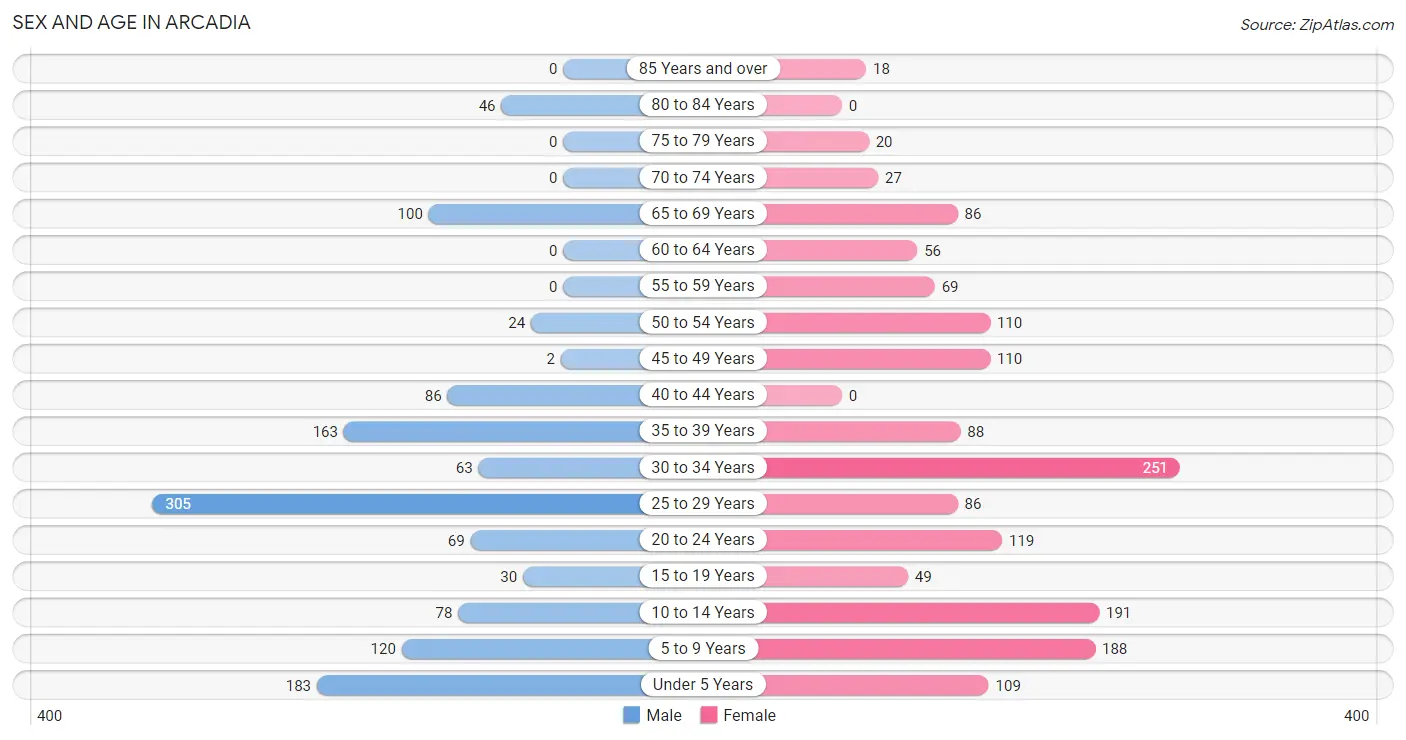
| Age Bracket | Male | Female |
| Under 5 Years | 183 (14.4%) | 109 (6.9%) |
| 5 to 9 Years | 120 (9.5%) | 188 (11.9%) |
| 10 to 14 Years | 78 (6.1%) | 191 (12.1%) |
| 15 to 19 Years | 30 (2.4%) | 49 (3.1%) |
| 20 to 24 Years | 69 (5.4%) | 119 (7.5%) |
| 25 to 29 Years | 305 (24.0%) | 86 (5.4%) |
| 30 to 34 Years | 63 (5.0%) | 251 (15.9%) |
| 35 to 39 Years | 163 (12.8%) | 88 (5.6%) |
| 40 to 44 Years | 86 (6.8%) | 0 (0.0%) |
| 45 to 49 Years | 2 (0.2%) | 110 (7.0%) |
| 50 to 54 Years | 24 (1.9%) | 110 (7.0%) |
| 55 to 59 Years | 0 (0.0%) | 69 (4.4%) |
| 60 to 64 Years | 0 (0.0%) | 56 (3.5%) |
| 65 to 69 Years | 100 (7.9%) | 86 (5.4%) |
| 70 to 74 Years | 0 (0.0%) | 27 (1.7%) |
| 75 to 79 Years | 0 (0.0%) | 20 (1.3%) |
| 80 to 84 Years | 46 (3.6%) | 0 (0.0%) |
| 85 Years and over | 0 (0.0%) | 18 (1.1%) |
| Total | 1,269 (100.0%) | 1,577 (100.0%) |
Families and Households in Arcadia
Median Family Size in Arcadia
The median family size in Arcadia is 3.80 persons per family, with single male/father families (54 | 10.6%) accounting for the largest median family size of 4.8 persons per family. On the other hand, married-couple families (132 | 26.0%) represent the smallest median family size with 3.03 persons per family.
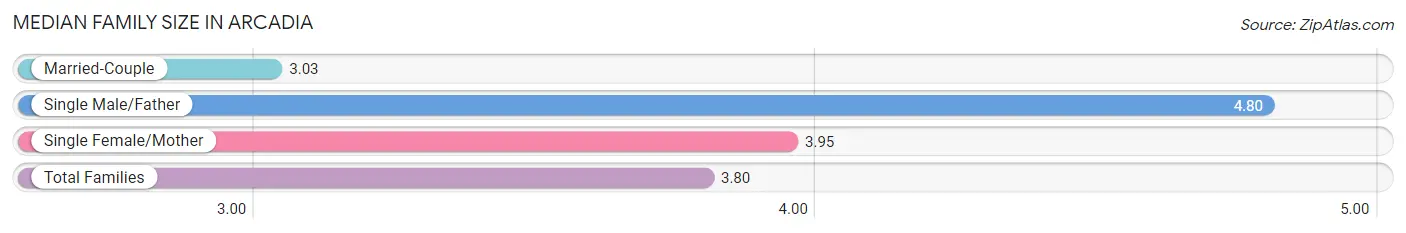
| Family Type | # Families | Family Size |
| Married-Couple | 132 (26.0%) | 3.03 |
| Single Male/Father | 54 (10.6%) | 4.80 |
| Single Female/Mother | 321 (63.3%) | 3.95 |
| Total Families | 507 (100.0%) | 3.80 |
Median Household Size in Arcadia
The median household size in Arcadia is 2.68 persons per household, with single male/father households (54 | 5.1%) accounting for the largest median household size of 5.11 persons per household. non-family households (556 | 52.3%) represent the smallest median household size with 1.30 persons per household.
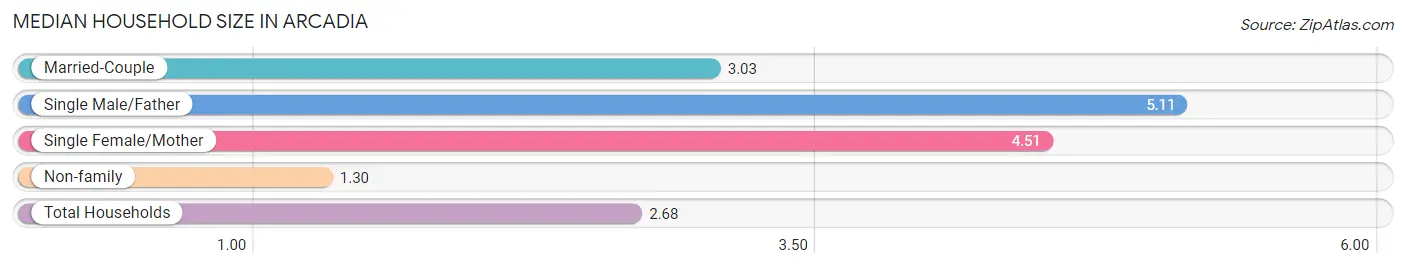
| Household Type | # Households | Household Size |
| Married-Couple | 132 (12.4%) | 3.03 |
| Single Male/Father | 54 (5.1%) | 5.11 |
| Single Female/Mother | 321 (30.2%) | 4.51 |
| Non-family | 556 (52.3%) | 1.30 |
| Total Households | 1,063 (100.0%) | 2.68 |
Household Size by Marriage Status in Arcadia
Out of a total of 1,063 households in Arcadia, 507 (47.7%) are family households, while 556 (52.3%) are nonfamily households. The most numerous type of family households are 4-person households, comprising 183, and the most common type of nonfamily households are 1-person households, comprising 392.

| Household Size | Family Households | Nonfamily Households |
| 1-Person Households | - | 392 (36.9%) |
| 2-Person Households | 127 (11.9%) | 164 (15.4%) |
| 3-Person Households | 52 (4.9%) | 0 (0.0%) |
| 4-Person Households | 183 (17.2%) | 0 (0.0%) |
| 5-Person Households | 128 (12.0%) | 0 (0.0%) |
| 6-Person Households | 17 (1.6%) | 0 (0.0%) |
| 7+ Person Households | 0 (0.0%) | 0 (0.0%) |
| Total | 507 (47.7%) | 556 (52.3%) |
Female Fertility in Arcadia
Fertility by Age in Arcadia
Average fertility rate in Arcadia is 208.0 births per 1,000 women. Women in the age bracket of 20 to 34 years have the highest fertility rate with 320.0 births per 1,000 women. Women in the age bracket of 20 to 34 years acount for 100.0% of all women with births.
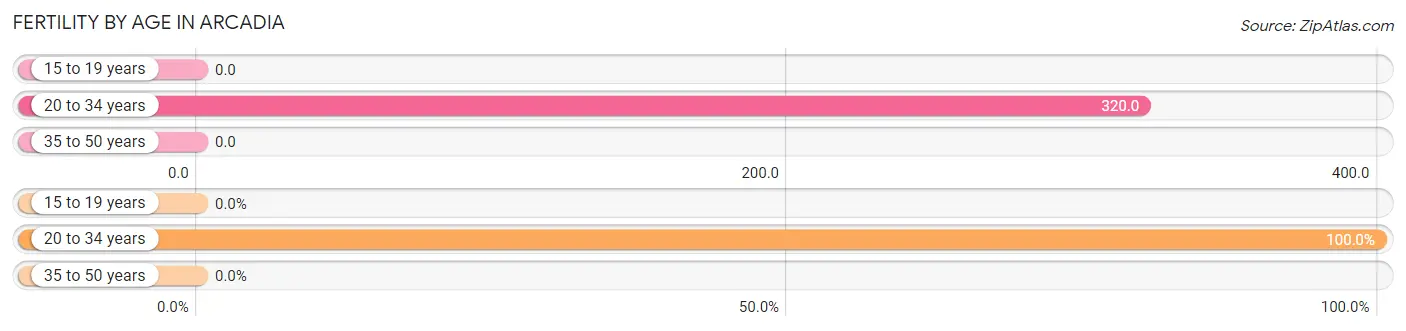
| Age Bracket | Women with Births | Births / 1,000 Women |
| 15 to 19 years | 0 (0.0%) | 0.0 |
| 20 to 34 years | 146 (100.0%) | 320.0 |
| 35 to 50 years | 0 (0.0%) | 0.0 |
| Total | 146 (100.0%) | 208.0 |
Fertility by Age by Marriage Status in Arcadia
34.2% of women with births (146) in Arcadia are married. The highest percentage of unmarried women with births falls into 20 to 34 years age bracket with 65.7% of them unmarried at the time of birth, while the lowest percentage of unmarried women with births belong to 20 to 34 years age bracket with 65.7% of them unmarried.
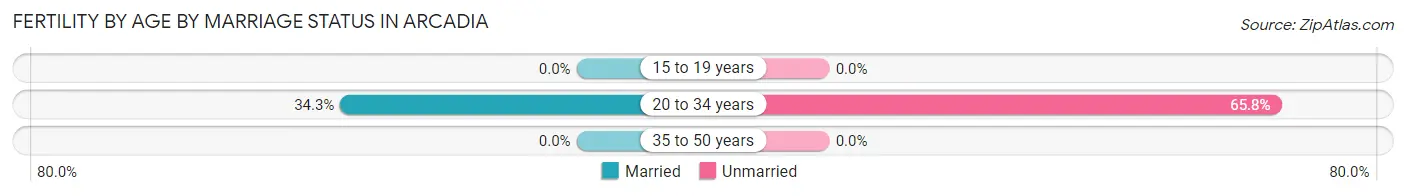
| Age Bracket | Married | Unmarried |
| 15 to 19 years | 0 (0.0%) | 0 (0.0%) |
| 20 to 34 years | 50 (34.3%) | 96 (65.7%) |
| 35 to 50 years | 0 (0.0%) | 0 (0.0%) |
| Total | 50 (34.3%) | 96 (65.7%) |
Fertility by Education in Arcadia
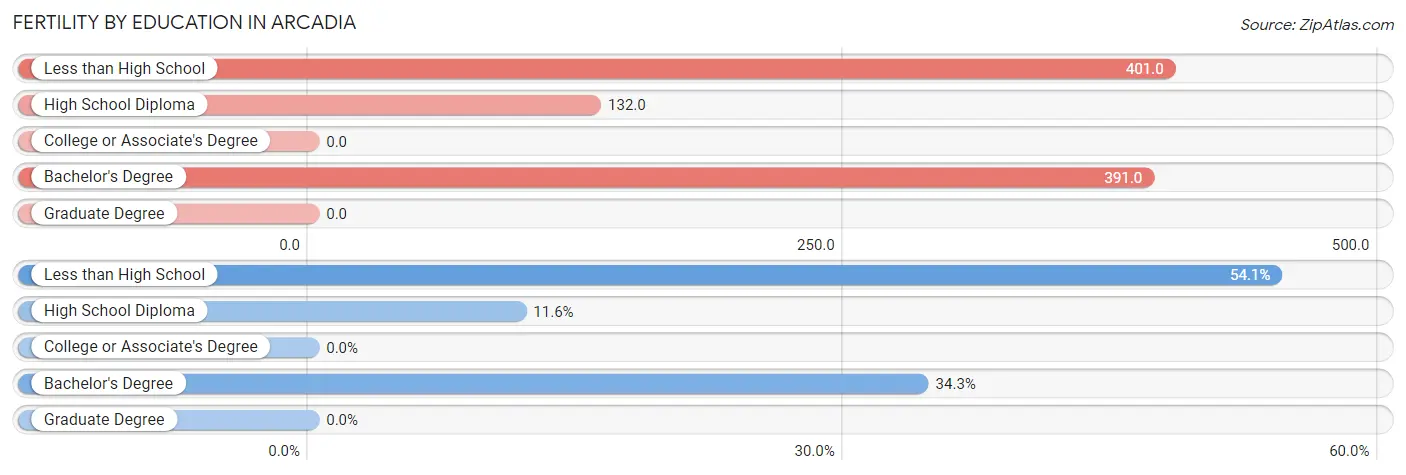
| Educational Attainment | Women with Births | Births / 1,000 Women |
| Less than High School | 79 (54.1%) | 401.0 |
| High School Diploma | 17 (11.6%) | 132.0 |
| College or Associate's Degree | 0 (0.0%) | 0.0 |
| Bachelor's Degree | 50 (34.3%) | 391.0 |
| Graduate Degree | 0 (0.0%) | 0.0 |
| Total | 146 (100.0%) | 208.0 |
Fertility by Education by Marriage Status in Arcadia
65.7% of women with births in Arcadia are unmarried. Women with the educational attainment of less than high school are most likely to be married with 63.3% of them married at childbirth, while women with the educational attainment of high school diploma are least likely to be married with 100.0% of them unmarried at childbirth.
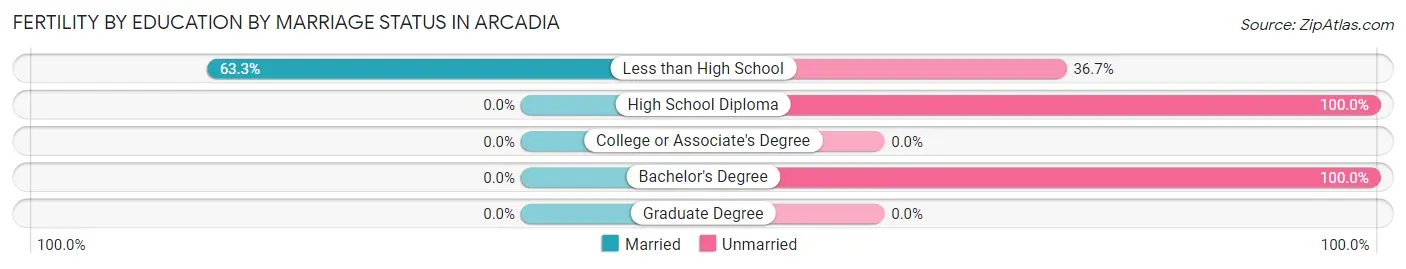
| Educational Attainment | Married | Unmarried |
| Less than High School | 50 (63.3%) | 29 (36.7%) |
| High School Diploma | 0 (0.0%) | 17 (100.0%) |
| College or Associate's Degree | 0 (0.0%) | 0 (0.0%) |
| Bachelor's Degree | 0 (0.0%) | 50 (100.0%) |
| Graduate Degree | 0 (0.0%) | 0 (0.0%) |
| Total | 50 (34.3%) | 96 (65.7%) |
Employment Characteristics in Arcadia
Employment by Class of Employer in Arcadia
Among the 1,300 employed individuals in Arcadia, private company employees (1,013 | 77.9%), not-for-profit organizations (146 | 11.2%), and local government employees (82 | 6.3%) make up the most common classes of employment.
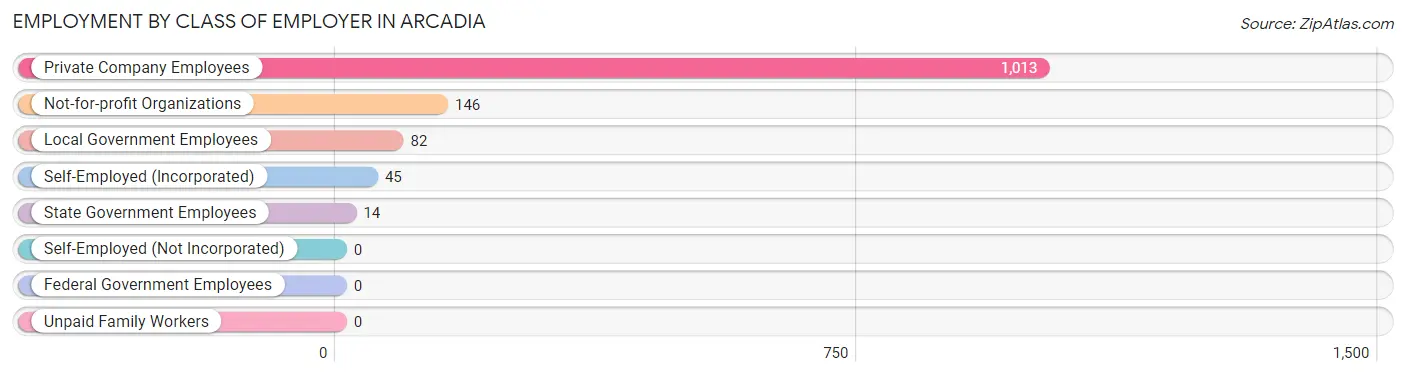
| Employer Class | # Employees | % Employees |
| Private Company Employees | 1,013 | 77.9% |
| Self-Employed (Incorporated) | 45 | 3.5% |
| Self-Employed (Not Incorporated) | 0 | 0.0% |
| Not-for-profit Organizations | 146 | 11.2% |
| Local Government Employees | 82 | 6.3% |
| State Government Employees | 14 | 1.1% |
| Federal Government Employees | 0 | 0.0% |
| Unpaid Family Workers | 0 | 0.0% |
| Total | 1,300 | 100.0% |
Employment Status by Age in Arcadia
According to the labor force statistics for Arcadia, out of the total population over 16 years of age (1,924), 76.8% or 1,478 individuals are in the labor force, with 12.0% or 177 of them unemployed. The age group with the highest labor force participation rate is 16 to 19 years, with 100.0% or 26 individuals in the labor force. Within the labor force, the 45 to 54 years age range has the highest percentage of unemployed individuals, with 29.0% or 63 of them being unemployed.
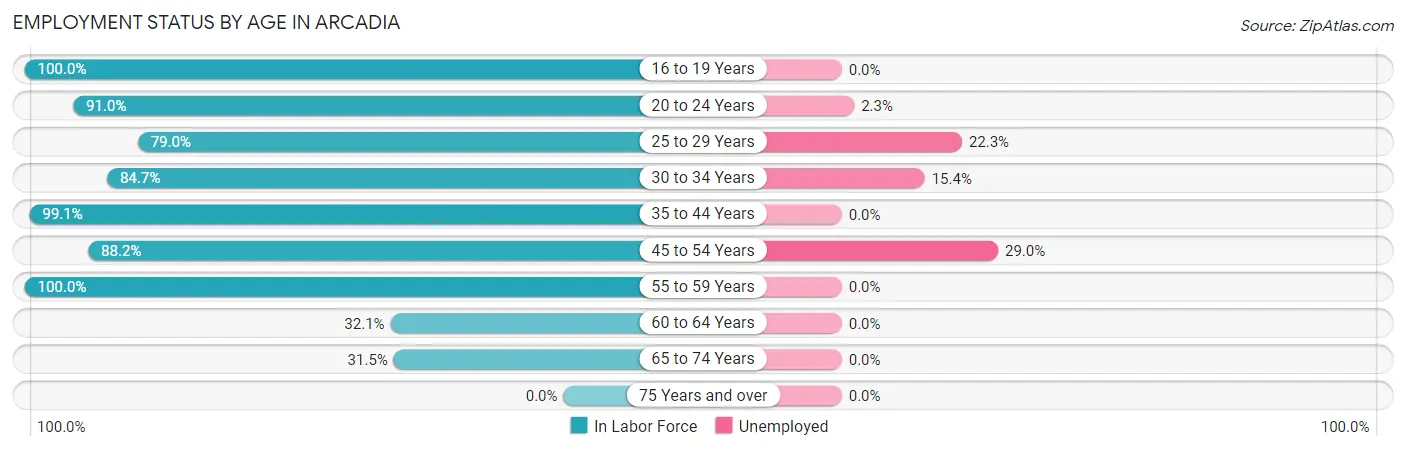
| Age Bracket | In Labor Force | Unemployed |
| 16 to 19 Years | 26 (100.0%) | 0 (0.0%) |
| 20 to 24 Years | 171 (91.0%) | 4 (2.3%) |
| 25 to 29 Years | 309 (79.0%) | 69 (22.3%) |
| 30 to 34 Years | 266 (84.7%) | 41 (15.4%) |
| 35 to 44 Years | 334 (99.1%) | 0 (0.0%) |
| 45 to 54 Years | 217 (88.2%) | 63 (29.0%) |
| 55 to 59 Years | 69 (100.0%) | 0 (0.0%) |
| 60 to 64 Years | 18 (32.1%) | 0 (0.0%) |
| 65 to 74 Years | 67 (31.5%) | 0 (0.0%) |
| 75 Years and over | 0 (0.0%) | 0 (0.0%) |
| Total | 1,478 (76.8%) | 177 (12.0%) |
Employment Status by Educational Attainment in Arcadia
According to labor force statistics for Arcadia, 85.8% of individuals (1,212) out of the total population between 25 and 64 years of age (1,413) are in the labor force, with 14.3% or 173 of them being unemployed. The group with the highest labor force participation rate are those with the educational attainment of bachelor's degree or higher, with 95.0% or 248 individuals in the labor force. Within the labor force, individuals with high school diploma education have the highest percentage of unemployment, with 24.7% or 69 of them being unemployed.
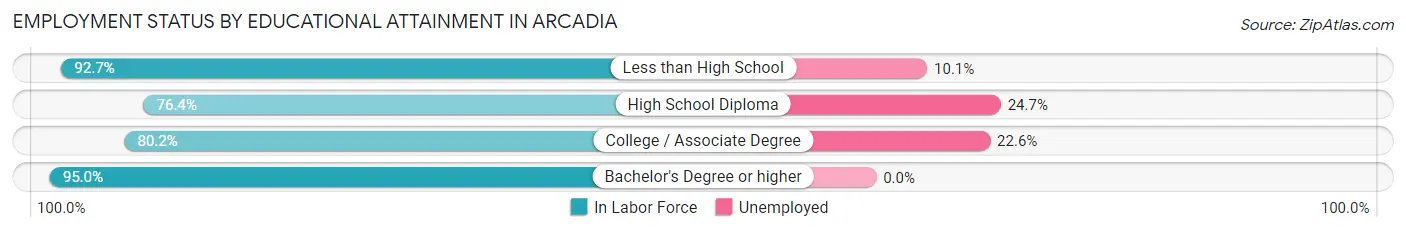
| Educational Attainment | In Labor Force | Unemployed |
| Less than High School | 407 (92.7%) | 44 (10.1%) |
| High School Diploma | 279 (76.4%) | 90 (24.7%) |
| College / Associate Degree | 279 (80.2%) | 79 (22.6%) |
| Bachelor's Degree or higher | 248 (95.0%) | 0 (0.0%) |
| Total | 1,212 (85.8%) | 202 (14.3%) |
Employment Occupations by Sex in Arcadia
Management, Business, Science and Arts Occupations
The most common Management, Business, Science and Arts occupations in Arcadia are Management (161 | 12.4%), Computers, Engineering & Science (77 | 5.9%), Computers & Mathematics (77 | 5.9%), Community & Social Service (54 | 4.2%), and Health Diagnosing & Treating (49 | 3.8%).

Management, Business, Science and Arts Occupations by Sex
Within the Management, Business, Science and Arts occupations in Arcadia, the most male-oriented occupations are Computers, Engineering & Science (100.0%), Computers & Mathematics (100.0%), and Management (29.8%), while the most female-oriented occupations are Community & Social Service (100.0%), Education, Arts & Media (100.0%), and Education Instruction & Library (100.0%).
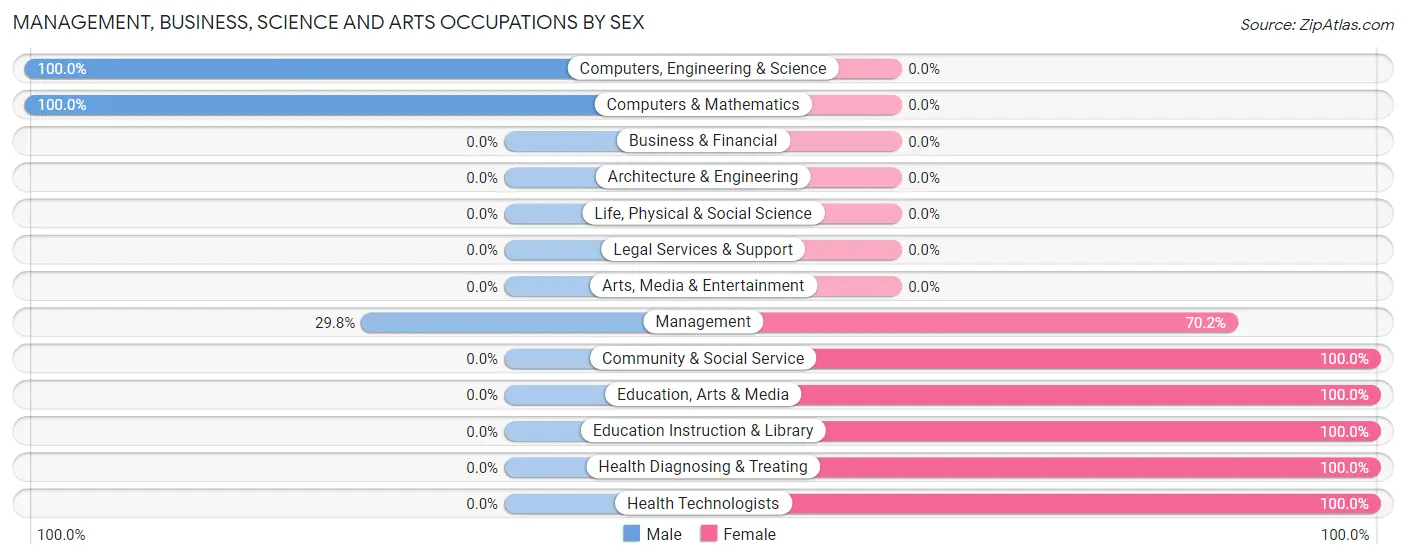
| Occupation | Male | Female |
| Management | 48 (29.8%) | 113 (70.2%) |
| Business & Financial | 0 (0.0%) | 0 (0.0%) |
| Computers, Engineering & Science | 77 (100.0%) | 0 (0.0%) |
| Computers & Mathematics | 77 (100.0%) | 0 (0.0%) |
| Architecture & Engineering | 0 (0.0%) | 0 (0.0%) |
| Life, Physical & Social Science | 0 (0.0%) | 0 (0.0%) |
| Community & Social Service | 0 (0.0%) | 54 (100.0%) |
| Education, Arts & Media | 0 (0.0%) | 40 (100.0%) |
| Legal Services & Support | 0 (0.0%) | 0 (0.0%) |
| Education Instruction & Library | 0 (0.0%) | 14 (100.0%) |
| Arts, Media & Entertainment | 0 (0.0%) | 0 (0.0%) |
| Health Diagnosing & Treating | 0 (0.0%) | 49 (100.0%) |
| Health Technologists | 0 (0.0%) | 31 (100.0%) |
| Total (Category) | 125 (36.7%) | 216 (63.3%) |
| Total (Overall) | 594 (45.7%) | 706 (54.3%) |
Services Occupations
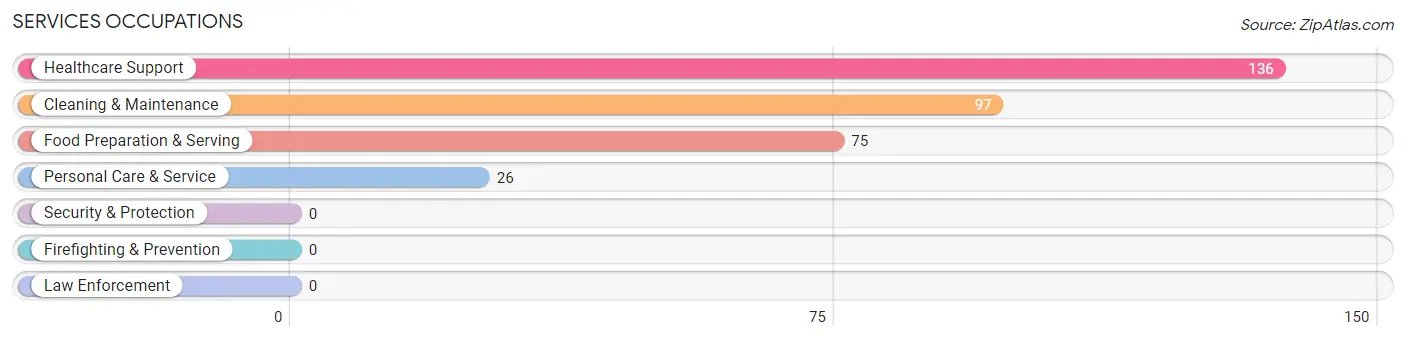
The most common Services occupations in Arcadia are Healthcare Support (136 | 10.5%), Cleaning & Maintenance (97 | 7.5%), Food Preparation & Serving (75 | 5.8%), and Personal Care & Service (26 | 2.0%).
Services Occupations by Sex
Within the Services occupations in Arcadia, the most male-oriented occupations are Cleaning & Maintenance (84.5%), and Personal Care & Service (65.4%), while the most female-oriented occupations are Healthcare Support (100.0%), Food Preparation & Serving (100.0%), and Personal Care & Service (34.6%).
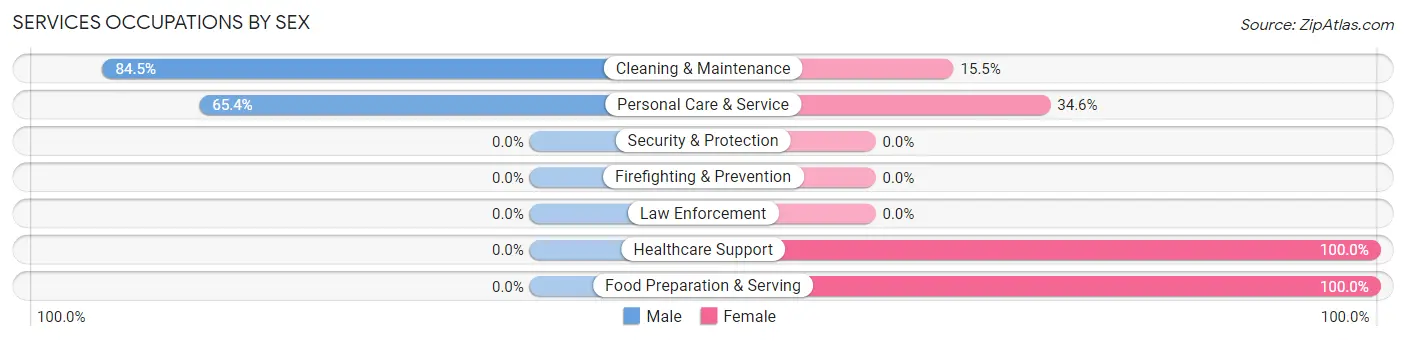
| Occupation | Male | Female |
| Healthcare Support | 0 (0.0%) | 136 (100.0%) |
| Security & Protection | 0 (0.0%) | 0 (0.0%) |
| Firefighting & Prevention | 0 (0.0%) | 0 (0.0%) |
| Law Enforcement | 0 (0.0%) | 0 (0.0%) |
| Food Preparation & Serving | 0 (0.0%) | 75 (100.0%) |
| Cleaning & Maintenance | 82 (84.5%) | 15 (15.5%) |
| Personal Care & Service | 17 (65.4%) | 9 (34.6%) |
| Total (Category) | 99 (29.6%) | 235 (70.4%) |
| Total (Overall) | 594 (45.7%) | 706 (54.3%) |
Sales and Office Occupations
The most common Sales and Office occupations in Arcadia are Sales & Related (160 | 12.3%), and Office & Administration (44 | 3.4%).
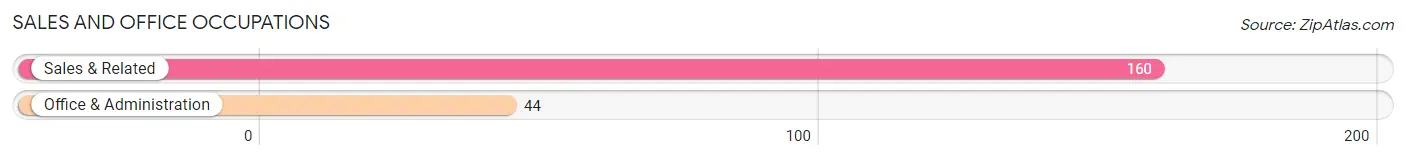
Sales and Office Occupations by Sex

| Occupation | Male | Female |
| Sales & Related | 142 (88.7%) | 18 (11.3%) |
| Office & Administration | 44 (100.0%) | 0 (0.0%) |
| Total (Category) | 186 (91.2%) | 18 (8.8%) |
| Total (Overall) | 594 (45.7%) | 706 (54.3%) |
Natural Resources, Construction and Maintenance Occupations
The most common Natural Resources, Construction and Maintenance occupations in Arcadia are Construction & Extraction (198 | 15.2%), and Installation, Maintenance & Repair (17 | 1.3%).
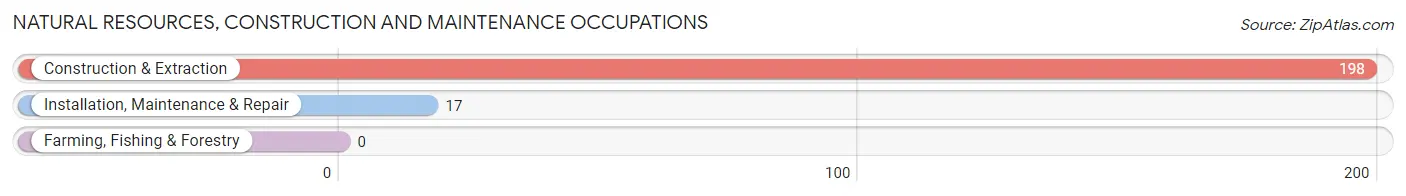
Natural Resources, Construction and Maintenance Occupations by Sex

| Occupation | Male | Female |
| Farming, Fishing & Forestry | 0 (0.0%) | 0 (0.0%) |
| Construction & Extraction | 134 (67.7%) | 64 (32.3%) |
| Installation, Maintenance & Repair | 17 (100.0%) | 0 (0.0%) |
| Total (Category) | 151 (70.2%) | 64 (29.8%) |
| Total (Overall) | 594 (45.7%) | 706 (54.3%) |
Production, Transportation and Moving Occupations
The most common Production, Transportation and Moving occupations in Arcadia are Production (122 | 9.4%), and Material Moving (84 | 6.5%).
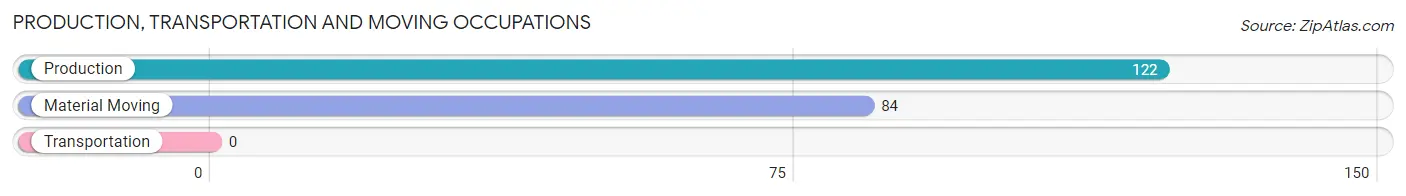
Production, Transportation and Moving Occupations by Sex

| Occupation | Male | Female |
| Production | 33 (27.1%) | 89 (73.0%) |
| Transportation | 0 (0.0%) | 0 (0.0%) |
| Material Moving | 0 (0.0%) | 84 (100.0%) |
| Total (Category) | 33 (16.0%) | 173 (84.0%) |
| Total (Overall) | 594 (45.7%) | 706 (54.3%) |
Employment Industries by Sex in Arcadia
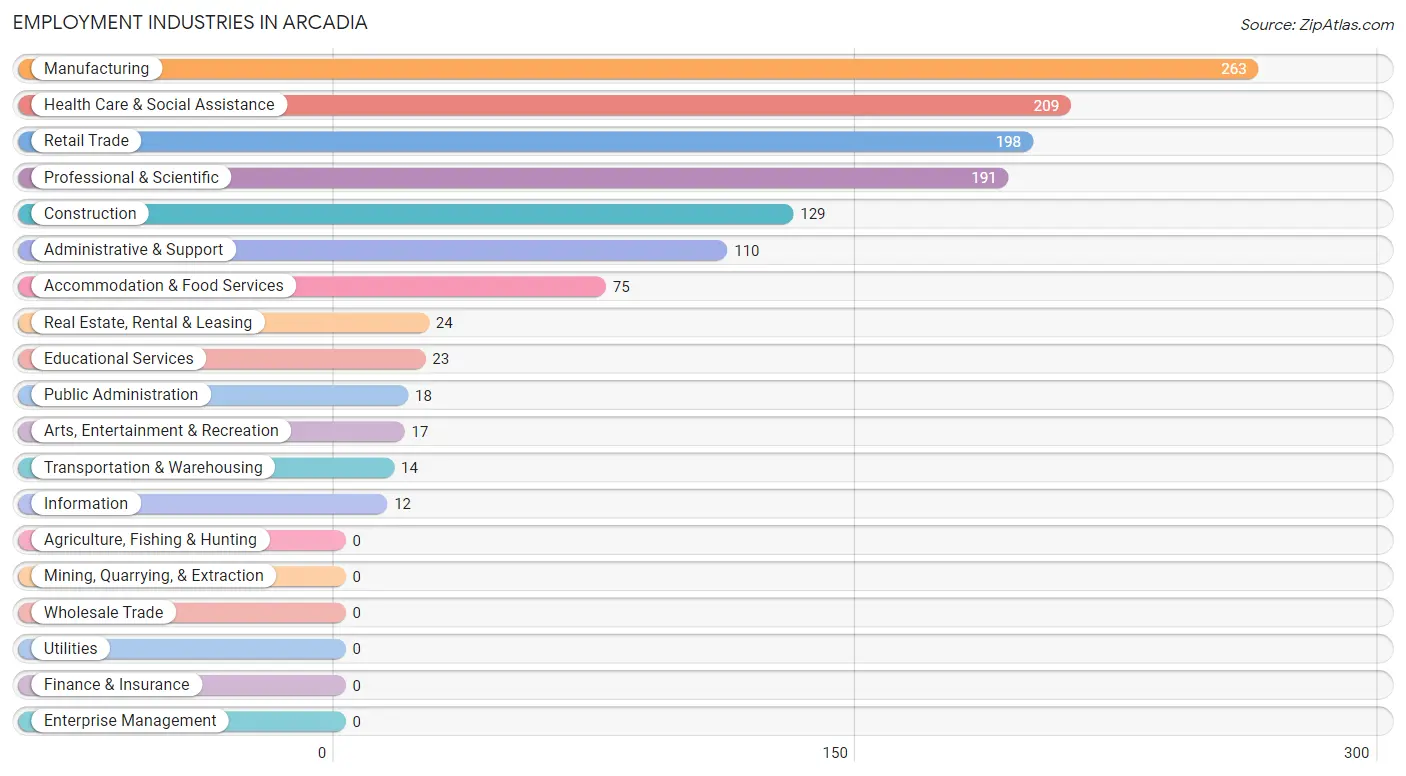
Employment Industries in Arcadia
The major employment industries in Arcadia include Manufacturing (263 | 20.2%), Health Care & Social Assistance (209 | 16.1%), Retail Trade (198 | 15.2%), Professional & Scientific (191 | 14.7%), and Construction (129 | 9.9%).
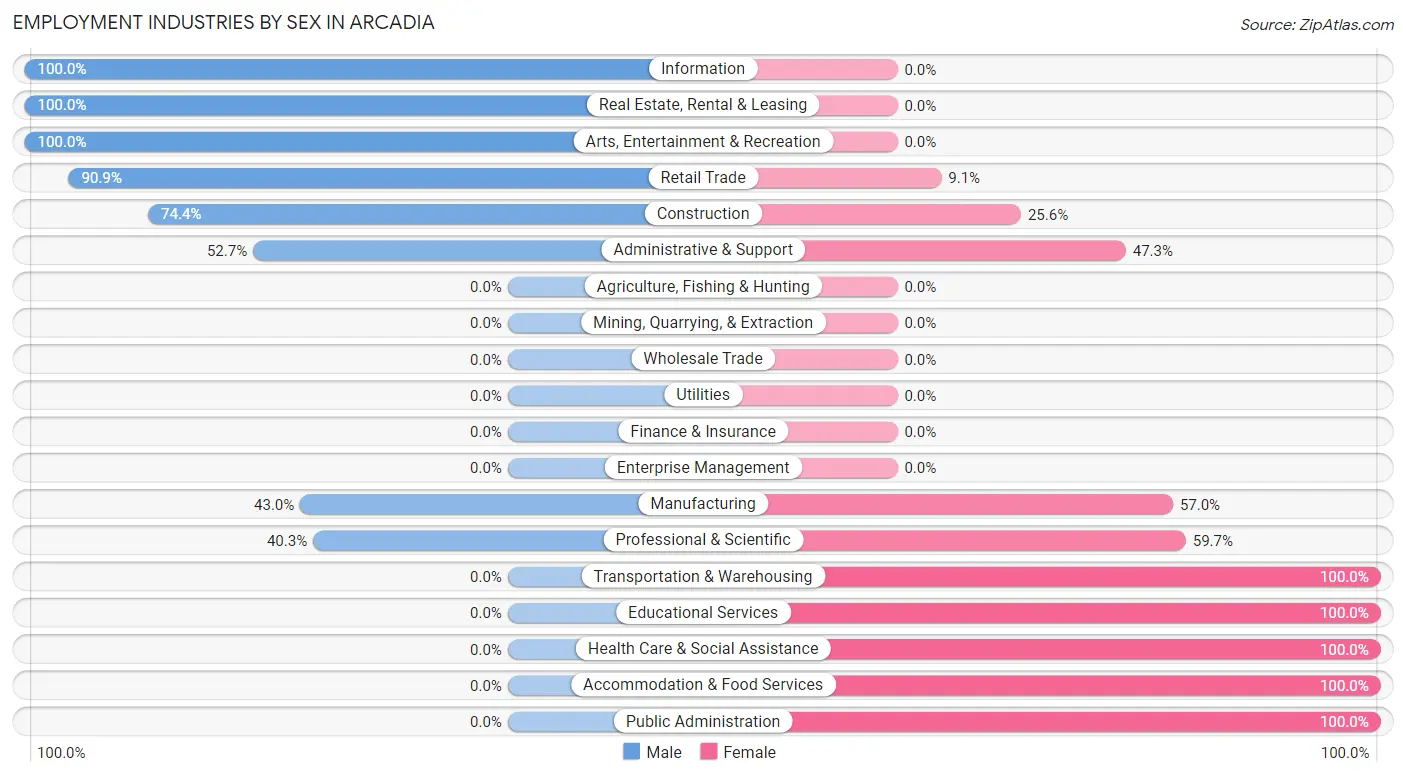
Employment Industries by Sex in Arcadia
The Arcadia industries that see more men than women are Information (100.0%), Real Estate, Rental & Leasing (100.0%), and Arts, Entertainment & Recreation (100.0%), whereas the industries that tend to have a higher number of women are Transportation & Warehousing (100.0%), Educational Services (100.0%), and Health Care & Social Assistance (100.0%).
| Industry | Male | Female |
| Agriculture, Fishing & Hunting | 0 (0.0%) | 0 (0.0%) |
| Mining, Quarrying, & Extraction | 0 (0.0%) | 0 (0.0%) |
| Construction | 96 (74.4%) | 33 (25.6%) |
| Manufacturing | 113 (43.0%) | 150 (57.0%) |
| Wholesale Trade | 0 (0.0%) | 0 (0.0%) |
| Retail Trade | 180 (90.9%) | 18 (9.1%) |
| Transportation & Warehousing | 0 (0.0%) | 14 (100.0%) |
| Utilities | 0 (0.0%) | 0 (0.0%) |
| Information | 12 (100.0%) | 0 (0.0%) |
| Finance & Insurance | 0 (0.0%) | 0 (0.0%) |
| Real Estate, Rental & Leasing | 24 (100.0%) | 0 (0.0%) |
| Professional & Scientific | 77 (40.3%) | 114 (59.7%) |
| Enterprise Management | 0 (0.0%) | 0 (0.0%) |
| Administrative & Support | 58 (52.7%) | 52 (47.3%) |
| Educational Services | 0 (0.0%) | 23 (100.0%) |
| Health Care & Social Assistance | 0 (0.0%) | 209 (100.0%) |
| Arts, Entertainment & Recreation | 17 (100.0%) | 0 (0.0%) |
| Accommodation & Food Services | 0 (0.0%) | 75 (100.0%) |
| Public Administration | 0 (0.0%) | 18 (100.0%) |
| Total | 594 (45.7%) | 706 (54.3%) |
Education in Arcadia
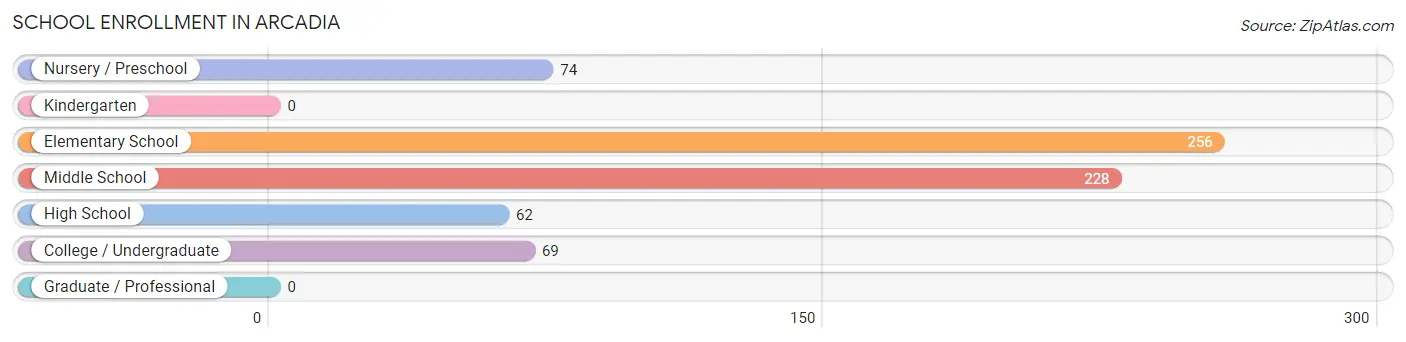
School Enrollment in Arcadia
The most common levels of schooling among the 689 students in Arcadia are elementary school (256 | 37.2%), middle school (228 | 33.1%), and nursery / preschool (74 | 10.7%).
| School Level | # Students | % Students |
| Nursery / Preschool | 74 | 10.7% |
| Kindergarten | 0 | 0.0% |
| Elementary School | 256 | 37.2% |
| Middle School | 228 | 33.1% |
| High School | 62 | 9.0% |
| College / Undergraduate | 69 | 10.0% |
| Graduate / Professional | 0 | 0.0% |
| Total | 689 | 100.0% |
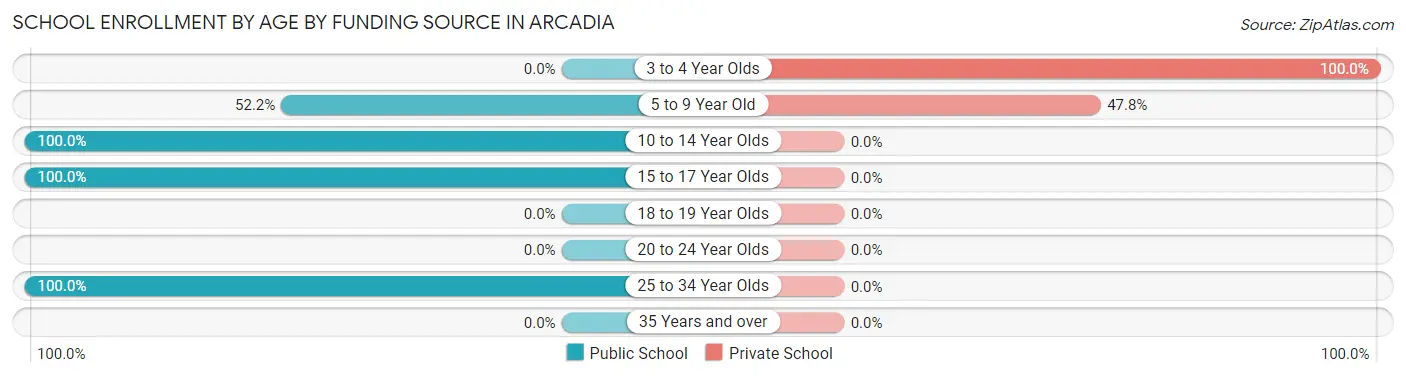
School Enrollment by Age by Funding Source in Arcadia
Out of a total of 689 students who are enrolled in schools in Arcadia, 177 (25.7%) attend a private institution, while the remaining 512 (74.3%) are enrolled in public schools. The age group of 3 to 4 year olds has the highest likelihood of being enrolled in private schools, with 37 (100.0% in the age bracket) enrolled. Conversely, the age group of 10 to 14 year olds has the lowest likelihood of being enrolled in a private school, with 228 (100.0% in the age bracket) attending a public institution.
| Age Bracket | Public School | Private School |
| 3 to 4 Year Olds | 0 (0.0%) | 37 (100.0%) |
| 5 to 9 Year Old | 153 (52.2%) | 140 (47.8%) |
| 10 to 14 Year Olds | 228 (100.0%) | 0 (0.0%) |
| 15 to 17 Year Olds | 62 (100.0%) | 0 (0.0%) |
| 18 to 19 Year Olds | 0 (0.0%) | 0 (0.0%) |
| 20 to 24 Year Olds | 0 (0.0%) | 0 (0.0%) |
| 25 to 34 Year Olds | 69 (100.0%) | 0 (0.0%) |
| 35 Years and over | 0 (0.0%) | 0 (0.0%) |
| Total | 512 (74.3%) | 177 (25.7%) |
Educational Attainment by Field of Study in Arcadia
Bio, nature & agricultural (77 | 29.5%), science & technology (55 | 21.1%), physical & health sciences (50 | 19.2%), engineering (33 | 12.6%), and computers & mathematics (18 | 6.9%) are the most common fields of study among 261 individuals in Arcadia who have obtained a bachelor's degree or higher.
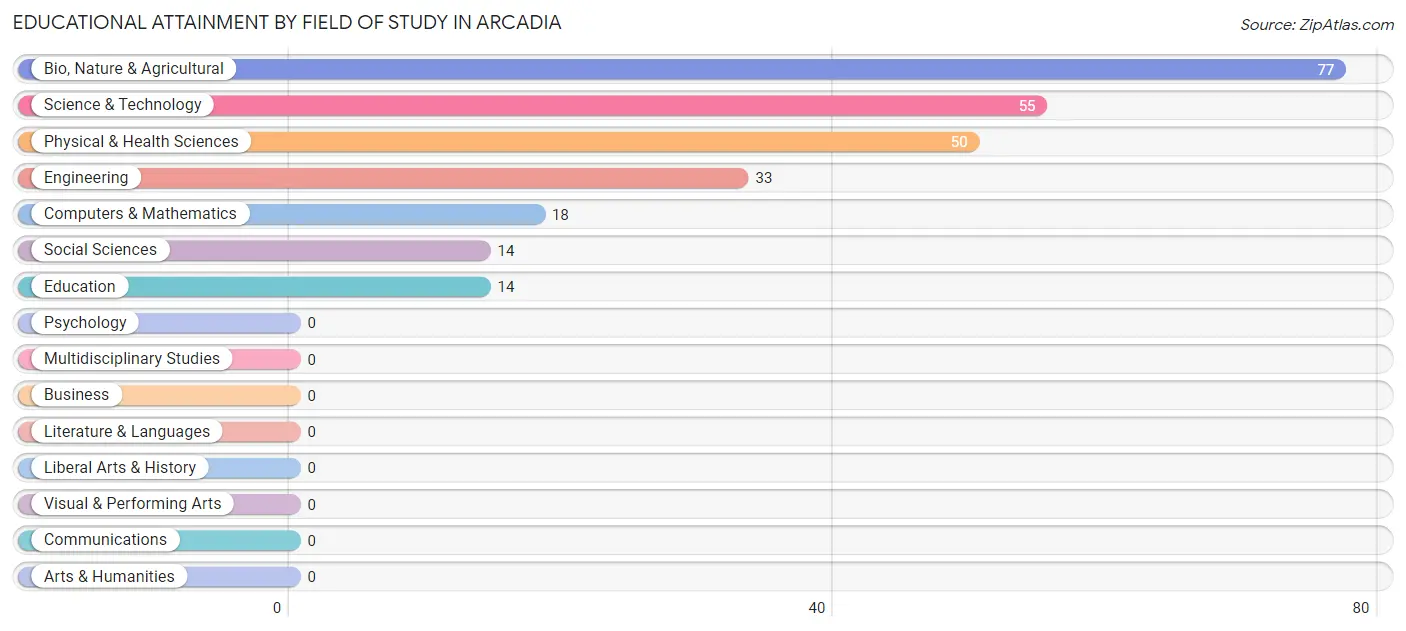
| Field of Study | # Graduates | % Graduates |
| Computers & Mathematics | 18 | 6.9% |
| Bio, Nature & Agricultural | 77 | 29.5% |
| Physical & Health Sciences | 50 | 19.2% |
| Psychology | 0 | 0.0% |
| Social Sciences | 14 | 5.4% |
| Engineering | 33 | 12.6% |
| Multidisciplinary Studies | 0 | 0.0% |
| Science & Technology | 55 | 21.1% |
| Business | 0 | 0.0% |
| Education | 14 | 5.4% |
| Literature & Languages | 0 | 0.0% |
| Liberal Arts & History | 0 | 0.0% |
| Visual & Performing Arts | 0 | 0.0% |
| Communications | 0 | 0.0% |
| Arts & Humanities | 0 | 0.0% |
| Total | 261 | 100.0% |
Transportation & Commute in Arcadia
Vehicle Availability by Sex in Arcadia
The most prevalent vehicle ownership categories in Arcadia are males with 2 vehicles (392, accounting for 66.0%) and females with 2 vehicles (249, making up 55.5%).

| Vehicles Available | Male | Female |
| No Vehicle | 58 (9.8%) | 15 (2.1%) |
| 1 Vehicle | 88 (14.8%) | 400 (56.7%) |
| 2 Vehicles | 392 (66.0%) | 249 (35.3%) |
| 3 Vehicles | 56 (9.4%) | 42 (5.9%) |
| 4 Vehicles | 0 (0.0%) | 0 (0.0%) |
| 5 or more Vehicles | 0 (0.0%) | 0 (0.0%) |
| Total | 594 (100.0%) | 706 (100.0%) |
Commute Time in Arcadia
The most frequently occuring commute durations in Arcadia are 10 to 14 minutes (354 commuters, 27.7%), 5 to 9 minutes (204 commuters, 16.0%), and 20 to 24 minutes (190 commuters, 14.9%).
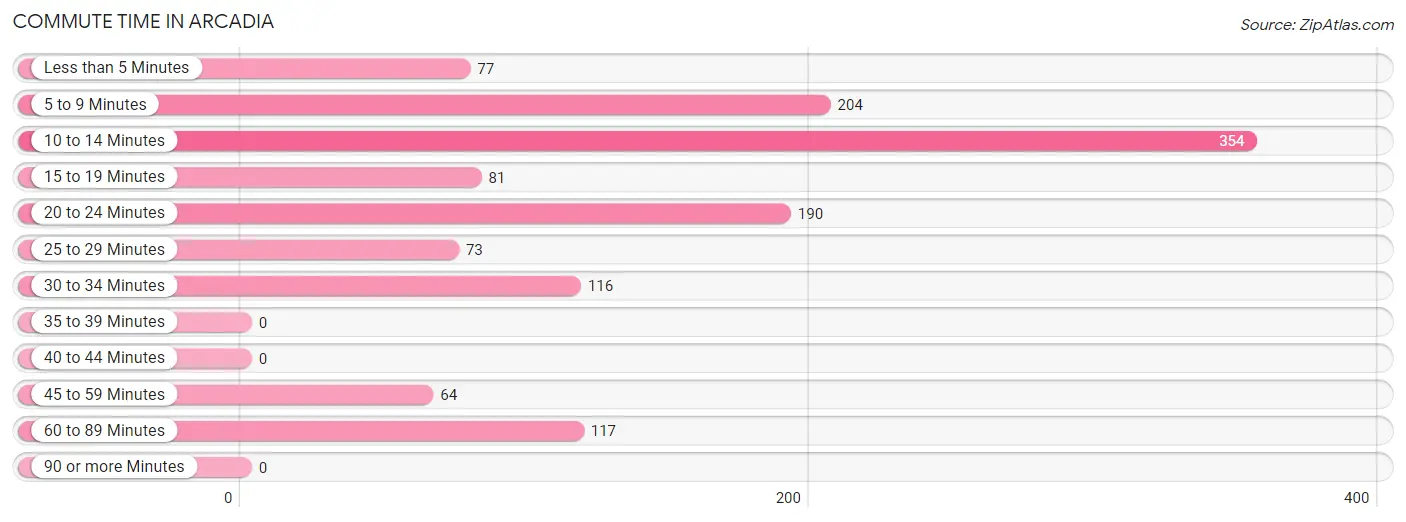
| Commute Time | # Commuters | % Commuters |
| Less than 5 Minutes | 77 | 6.0% |
| 5 to 9 Minutes | 204 | 16.0% |
| 10 to 14 Minutes | 354 | 27.7% |
| 15 to 19 Minutes | 81 | 6.4% |
| 20 to 24 Minutes | 190 | 14.9% |
| 25 to 29 Minutes | 73 | 5.7% |
| 30 to 34 Minutes | 116 | 9.1% |
| 35 to 39 Minutes | 0 | 0.0% |
| 40 to 44 Minutes | 0 | 0.0% |
| 45 to 59 Minutes | 64 | 5.0% |
| 60 to 89 Minutes | 117 | 9.2% |
| 90 or more Minutes | 0 | 0.0% |
Commute Time by Sex in Arcadia
The most common commute times in Arcadia are 10 to 14 minutes (180 commuters, 31.6%) for males and 10 to 14 minutes (174 commuters, 24.6%) for females.
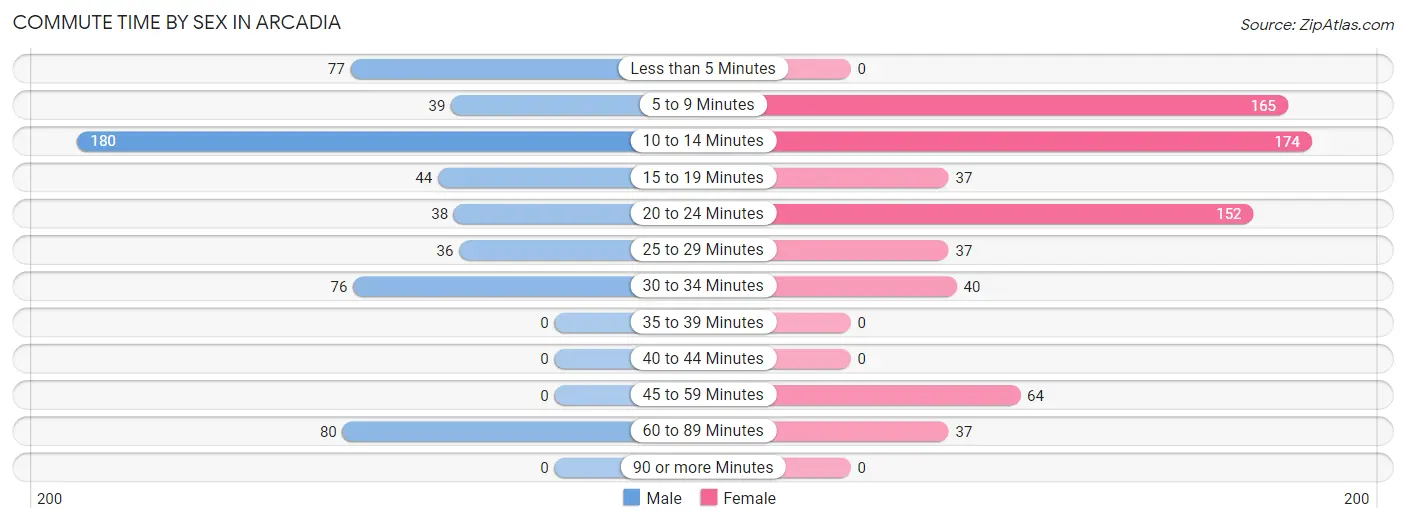
| Commute Time | Male | Female |
| Less than 5 Minutes | 77 (13.5%) | 0 (0.0%) |
| 5 to 9 Minutes | 39 (6.8%) | 165 (23.4%) |
| 10 to 14 Minutes | 180 (31.6%) | 174 (24.6%) |
| 15 to 19 Minutes | 44 (7.7%) | 37 (5.2%) |
| 20 to 24 Minutes | 38 (6.7%) | 152 (21.5%) |
| 25 to 29 Minutes | 36 (6.3%) | 37 (5.2%) |
| 30 to 34 Minutes | 76 (13.3%) | 40 (5.7%) |
| 35 to 39 Minutes | 0 (0.0%) | 0 (0.0%) |
| 40 to 44 Minutes | 0 (0.0%) | 0 (0.0%) |
| 45 to 59 Minutes | 0 (0.0%) | 64 (9.1%) |
| 60 to 89 Minutes | 80 (14.0%) | 37 (5.2%) |
| 90 or more Minutes | 0 (0.0%) | 0 (0.0%) |
Time of Departure to Work by Sex in Arcadia
The most frequent times of departure to work in Arcadia are 4:00 PM to 11:59 PM (222, 39.0%) for males and 4:00 PM to 11:59 PM (245, 34.7%) for females.
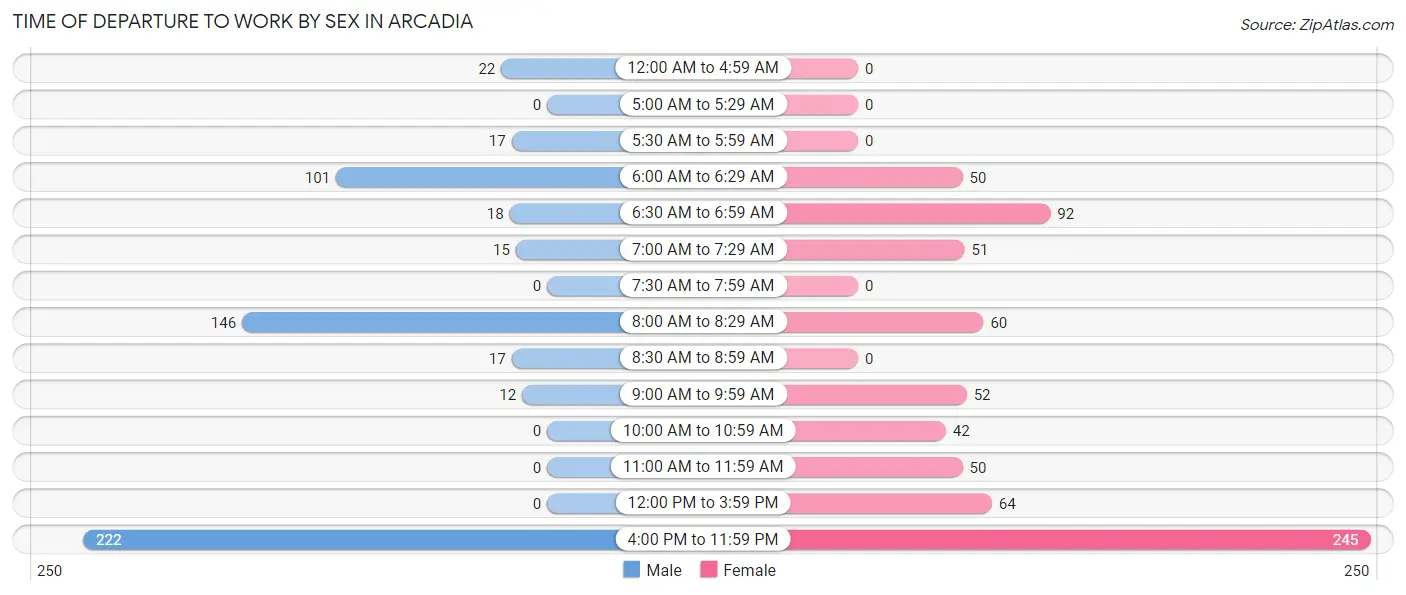
| Time of Departure | Male | Female |
| 12:00 AM to 4:59 AM | 22 (3.9%) | 0 (0.0%) |
| 5:00 AM to 5:29 AM | 0 (0.0%) | 0 (0.0%) |
| 5:30 AM to 5:59 AM | 17 (3.0%) | 0 (0.0%) |
| 6:00 AM to 6:29 AM | 101 (17.7%) | 50 (7.1%) |
| 6:30 AM to 6:59 AM | 18 (3.2%) | 92 (13.0%) |
| 7:00 AM to 7:29 AM | 15 (2.6%) | 51 (7.2%) |
| 7:30 AM to 7:59 AM | 0 (0.0%) | 0 (0.0%) |
| 8:00 AM to 8:29 AM | 146 (25.6%) | 60 (8.5%) |
| 8:30 AM to 8:59 AM | 17 (3.0%) | 0 (0.0%) |
| 9:00 AM to 9:59 AM | 12 (2.1%) | 52 (7.4%) |
| 10:00 AM to 10:59 AM | 0 (0.0%) | 42 (5.9%) |
| 11:00 AM to 11:59 AM | 0 (0.0%) | 50 (7.1%) |
| 12:00 PM to 3:59 PM | 0 (0.0%) | 64 (9.1%) |
| 4:00 PM to 11:59 PM | 222 (39.0%) | 245 (34.7%) |
| Total | 570 (100.0%) | 706 (100.0%) |
Housing Occupancy in Arcadia
Occupancy by Ownership in Arcadia
Of the total 1,063 dwellings in Arcadia, owner-occupied units account for 222 (20.9%), while renter-occupied units make up 841 (79.1%).
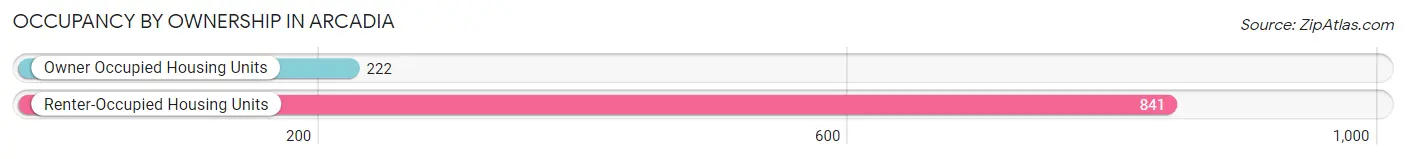
| Occupancy | # Housing Units | % Housing Units |
| Owner Occupied Housing Units | 222 | 20.9% |
| Renter-Occupied Housing Units | 841 | 79.1% |
| Total Occupied Housing Units | 1,063 | 100.0% |
Occupancy by Household Size in Arcadia
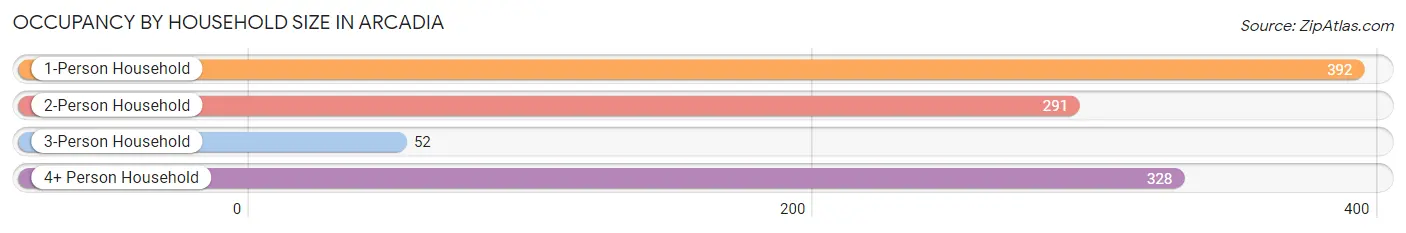
| Household Size | # Housing Units | % Housing Units |
| 1-Person Household | 392 | 36.9% |
| 2-Person Household | 291 | 27.4% |
| 3-Person Household | 52 | 4.9% |
| 4+ Person Household | 328 | 30.9% |
| Total Housing Units | 1,063 | 100.0% |
Occupancy by Ownership by Household Size in Arcadia

| Household Size | Owner-occupied | Renter-occupied |
| 1-Person Household | 107 (27.3%) | 285 (72.7%) |
| 2-Person Household | 76 (26.1%) | 215 (73.9%) |
| 3-Person Household | 0 (0.0%) | 52 (100.0%) |
| 4+ Person Household | 39 (11.9%) | 289 (88.1%) |
| Total Housing Units | 222 (20.9%) | 841 (79.1%) |
Occupancy by Educational Attainment in Arcadia
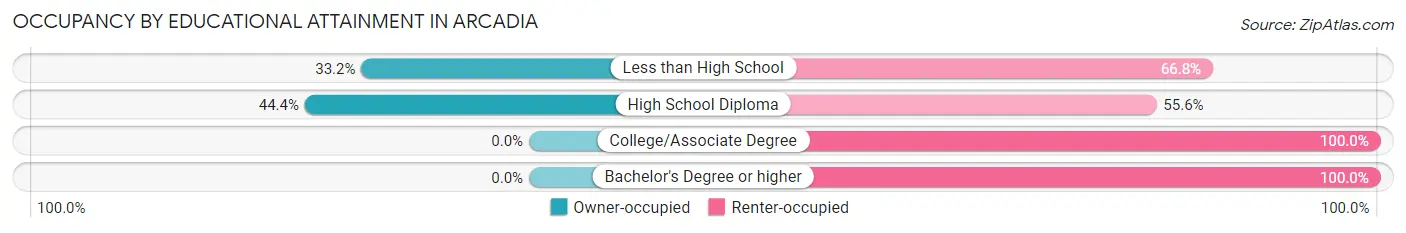
| Household Size | Owner-occupied | Renter-occupied |
| Less than High School | 114 (33.2%) | 229 (66.8%) |
| High School Diploma | 108 (44.4%) | 135 (55.6%) |
| College/Associate Degree | 0 (0.0%) | 249 (100.0%) |
| Bachelor's Degree or higher | 0 (0.0%) | 228 (100.0%) |
Occupancy by Age of Householder in Arcadia
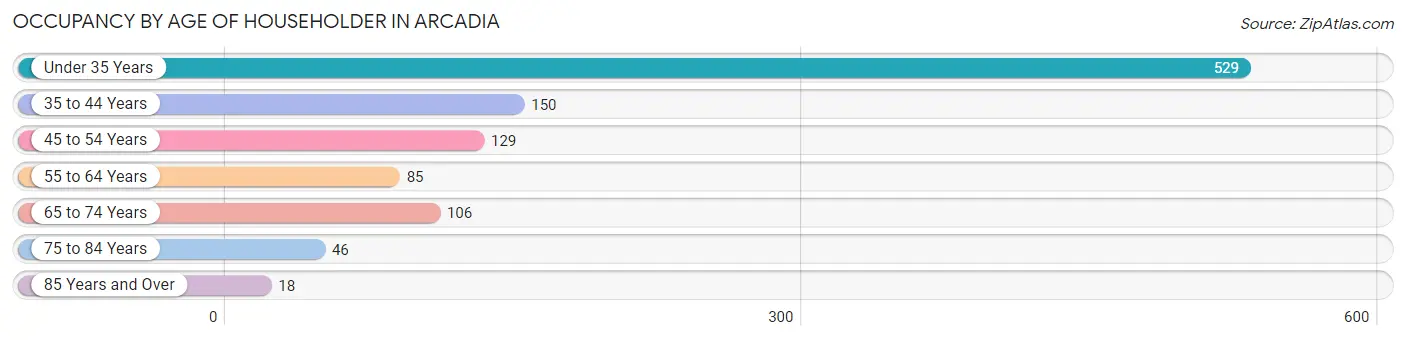
| Age Bracket | # Households | % Households |
| Under 35 Years | 529 | 49.8% |
| 35 to 44 Years | 150 | 14.1% |
| 45 to 54 Years | 129 | 12.1% |
| 55 to 64 Years | 85 | 8.0% |
| 65 to 74 Years | 106 | 10.0% |
| 75 to 84 Years | 46 | 4.3% |
| 85 Years and Over | 18 | 1.7% |
| Total | 1,063 | 100.0% |
Housing Finances in Arcadia
Median Income by Occupancy in Arcadia
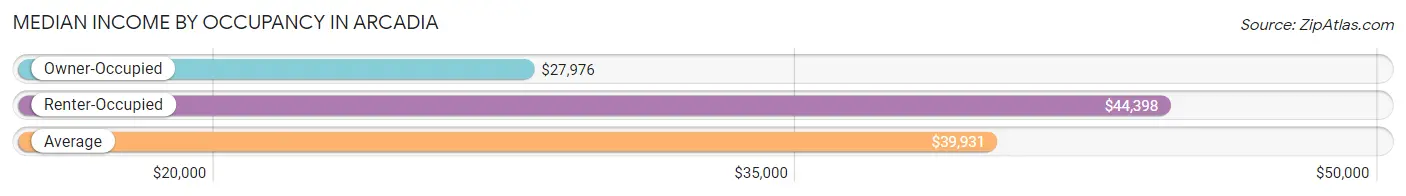
| Occupancy Type | # Households | Median Income |
| Owner-Occupied | 222 (20.9%) | $27,976 |
| Renter-Occupied | 841 (79.1%) | $44,398 |
| Average | 1,063 (100.0%) | $39,931 |
Occupancy by Householder Income Bracket in Arcadia
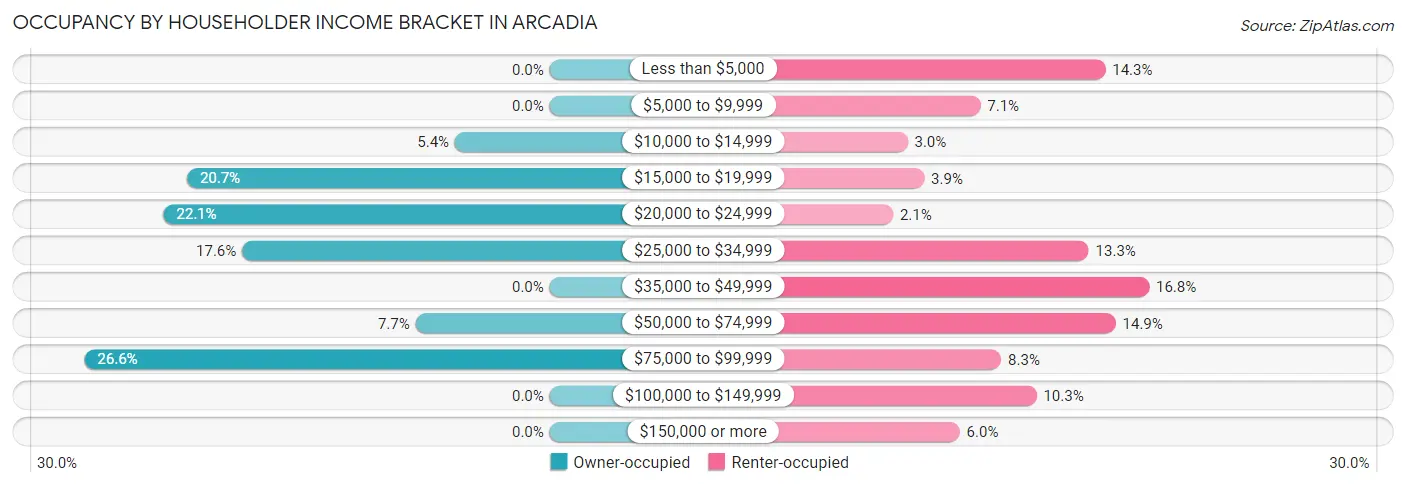
| Income Bracket | Owner-occupied | Renter-occupied |
| Less than $5,000 | 0 (0.0%) | 120 (14.3%) |
| $5,000 to $9,999 | 0 (0.0%) | 60 (7.1%) |
| $10,000 to $14,999 | 12 (5.4%) | 25 (3.0%) |
| $15,000 to $19,999 | 46 (20.7%) | 33 (3.9%) |
| $20,000 to $24,999 | 49 (22.1%) | 18 (2.1%) |
| $25,000 to $34,999 | 39 (17.6%) | 112 (13.3%) |
| $35,000 to $49,999 | 0 (0.0%) | 141 (16.8%) |
| $50,000 to $74,999 | 17 (7.7%) | 125 (14.9%) |
| $75,000 to $99,999 | 59 (26.6%) | 70 (8.3%) |
| $100,000 to $149,999 | 0 (0.0%) | 87 (10.3%) |
| $150,000 or more | 0 (0.0%) | 50 (5.9%) |
| Total | 222 (100.0%) | 841 (100.0%) |
Monthly Housing Cost Tiers in Arcadia
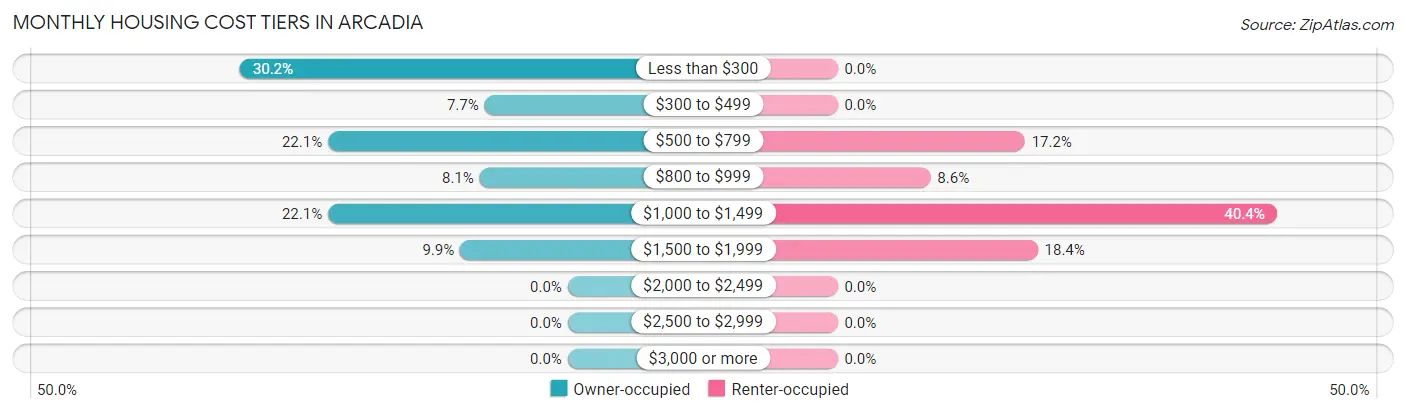
| Monthly Cost | Owner-occupied | Renter-occupied |
| Less than $300 | 67 (30.2%) | 0 (0.0%) |
| $300 to $499 | 17 (7.7%) | 0 (0.0%) |
| $500 to $799 | 49 (22.1%) | 145 (17.2%) |
| $800 to $999 | 18 (8.1%) | 72 (8.6%) |
| $1,000 to $1,499 | 49 (22.1%) | 340 (40.4%) |
| $1,500 to $1,999 | 22 (9.9%) | 155 (18.4%) |
| $2,000 to $2,499 | 0 (0.0%) | 0 (0.0%) |
| $2,500 to $2,999 | 0 (0.0%) | 0 (0.0%) |
| $3,000 or more | 0 (0.0%) | 0 (0.0%) |
| Total | 222 (100.0%) | 841 (100.0%) |
Physical Housing Characteristics in Arcadia
Housing Structures in Arcadia
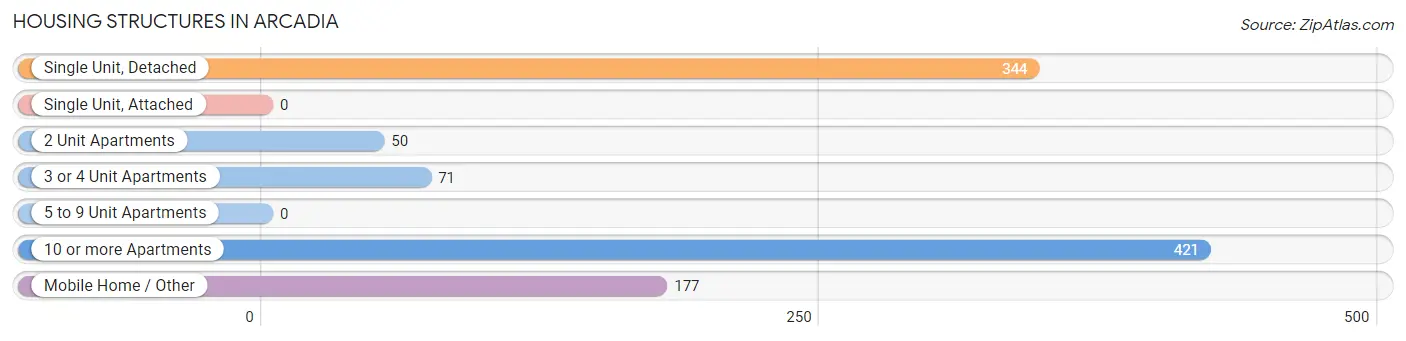
| Structure Type | # Housing Units | % Housing Units |
| Single Unit, Detached | 344 | 32.4% |
| Single Unit, Attached | 0 | 0.0% |
| 2 Unit Apartments | 50 | 4.7% |
| 3 or 4 Unit Apartments | 71 | 6.7% |
| 5 to 9 Unit Apartments | 0 | 0.0% |
| 10 or more Apartments | 421 | 39.6% |
| Mobile Home / Other | 177 | 16.7% |
| Total | 1,063 | 100.0% |
Housing Structures by Occupancy in Arcadia
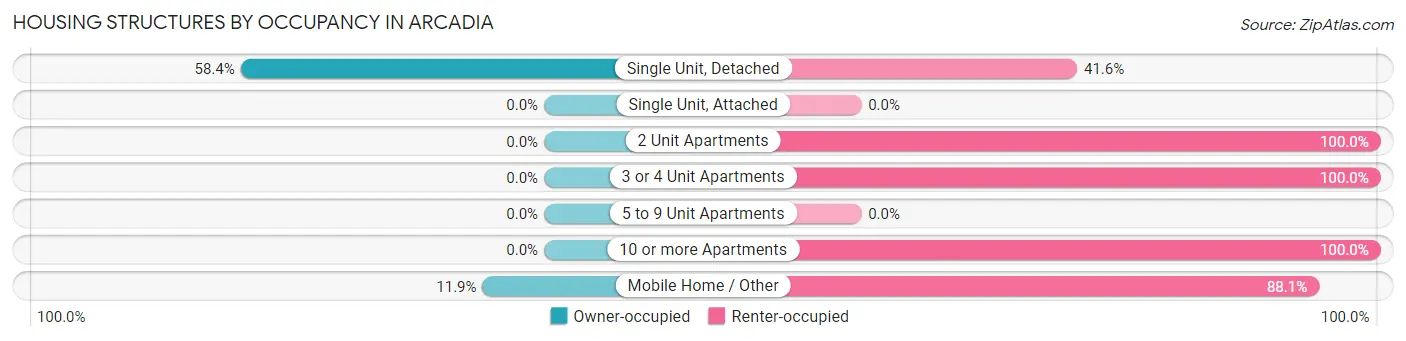
| Structure Type | Owner-occupied | Renter-occupied |
| Single Unit, Detached | 201 (58.4%) | 143 (41.6%) |
| Single Unit, Attached | 0 (0.0%) | 0 (0.0%) |
| 2 Unit Apartments | 0 (0.0%) | 50 (100.0%) |
| 3 or 4 Unit Apartments | 0 (0.0%) | 71 (100.0%) |
| 5 to 9 Unit Apartments | 0 (0.0%) | 0 (0.0%) |
| 10 or more Apartments | 0 (0.0%) | 421 (100.0%) |
| Mobile Home / Other | 21 (11.9%) | 156 (88.1%) |
| Total | 222 (20.9%) | 841 (79.1%) |
Housing Structures by Number of Rooms in Arcadia
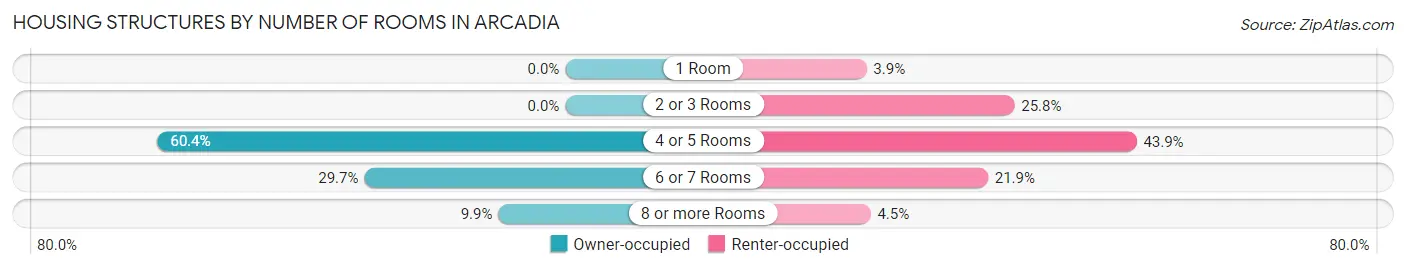
| Number of Rooms | Owner-occupied | Renter-occupied |
| 1 Room | 0 (0.0%) | 33 (3.9%) |
| 2 or 3 Rooms | 0 (0.0%) | 217 (25.8%) |
| 4 or 5 Rooms | 134 (60.4%) | 369 (43.9%) |
| 6 or 7 Rooms | 66 (29.7%) | 184 (21.9%) |
| 8 or more Rooms | 22 (9.9%) | 38 (4.5%) |
| Total | 222 (100.0%) | 841 (100.0%) |
Housing Structure by Heating Type in Arcadia
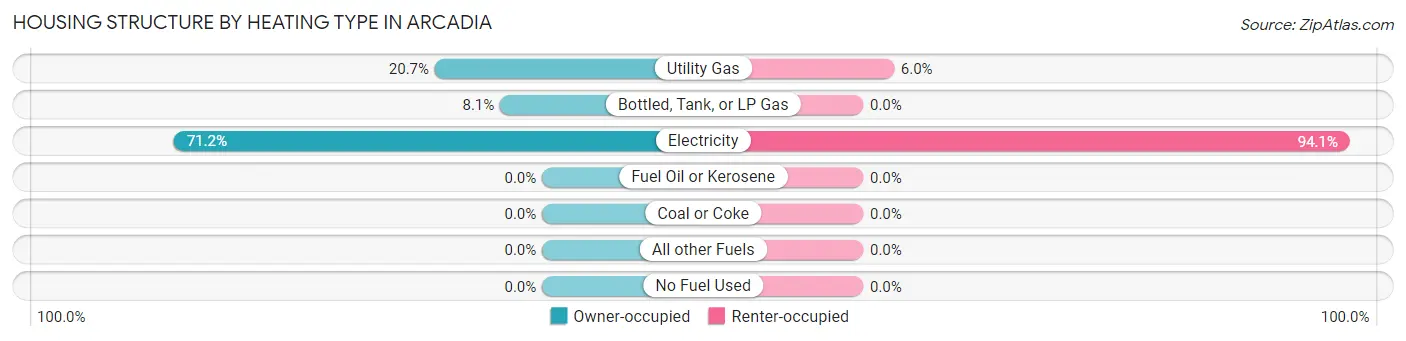
| Heating Type | Owner-occupied | Renter-occupied |
| Utility Gas | 46 (20.7%) | 50 (5.9%) |
| Bottled, Tank, or LP Gas | 18 (8.1%) | 0 (0.0%) |
| Electricity | 158 (71.2%) | 791 (94.1%) |
| Fuel Oil or Kerosene | 0 (0.0%) | 0 (0.0%) |
| Coal or Coke | 0 (0.0%) | 0 (0.0%) |
| All other Fuels | 0 (0.0%) | 0 (0.0%) |
| No Fuel Used | 0 (0.0%) | 0 (0.0%) |
| Total | 222 (100.0%) | 841 (100.0%) |
Household Vehicle Usage in Arcadia
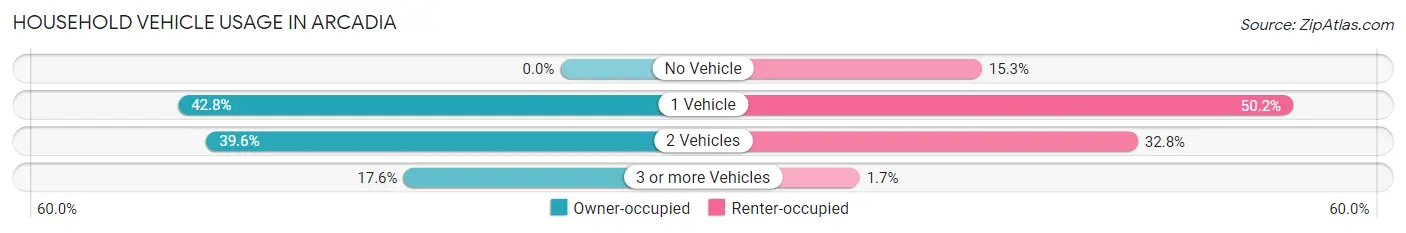
| Vehicles per Household | Owner-occupied | Renter-occupied |
| No Vehicle | 0 (0.0%) | 129 (15.3%) |
| 1 Vehicle | 95 (42.8%) | 422 (50.2%) |
| 2 Vehicles | 88 (39.6%) | 276 (32.8%) |
| 3 or more Vehicles | 39 (17.6%) | 14 (1.7%) |
| Total | 222 (100.0%) | 841 (100.0%) |
Real Estate & Mortgages in Arcadia
Real Estate and Mortgage Overview in Arcadia
| Characteristic | Without Mortgage | With Mortgage |
| Housing Units | 84 | 138 |
| Median Property Value | - | - |
| Median Household Income | - | - |
| Monthly Housing Costs | $273 | $0 |
| Real Estate Taxes | $199 | $0 |
Property Value by Mortgage Status in Arcadia
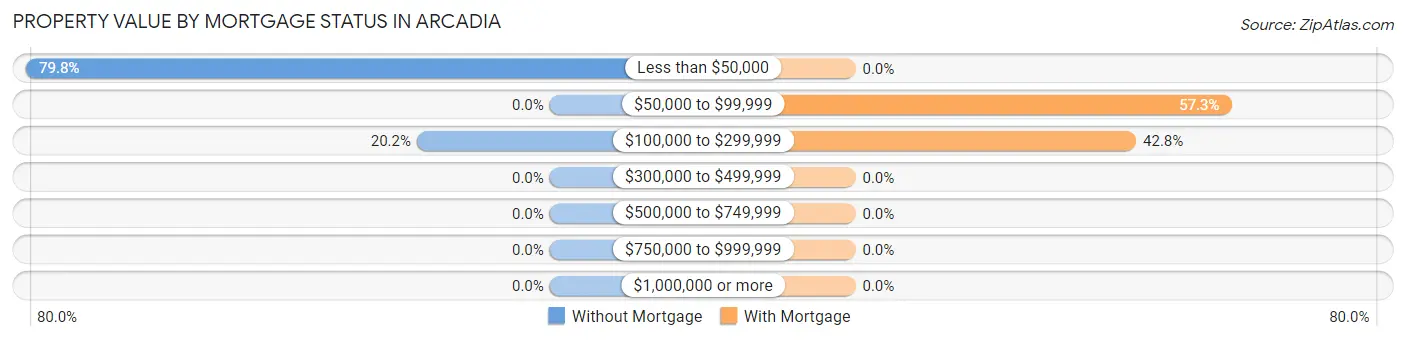
| Property Value | Without Mortgage | With Mortgage |
| Less than $50,000 | 67 (79.8%) | 0 (0.0%) |
| $50,000 to $99,999 | 0 (0.0%) | 79 (57.3%) |
| $100,000 to $299,999 | 17 (20.2%) | 59 (42.7%) |
| $300,000 to $499,999 | 0 (0.0%) | 0 (0.0%) |
| $500,000 to $749,999 | 0 (0.0%) | 0 (0.0%) |
| $750,000 to $999,999 | 0 (0.0%) | 0 (0.0%) |
| $1,000,000 or more | 0 (0.0%) | 0 (0.0%) |
| Total | 84 (100.0%) | 138 (100.0%) |
Household Income by Mortgage Status in Arcadia
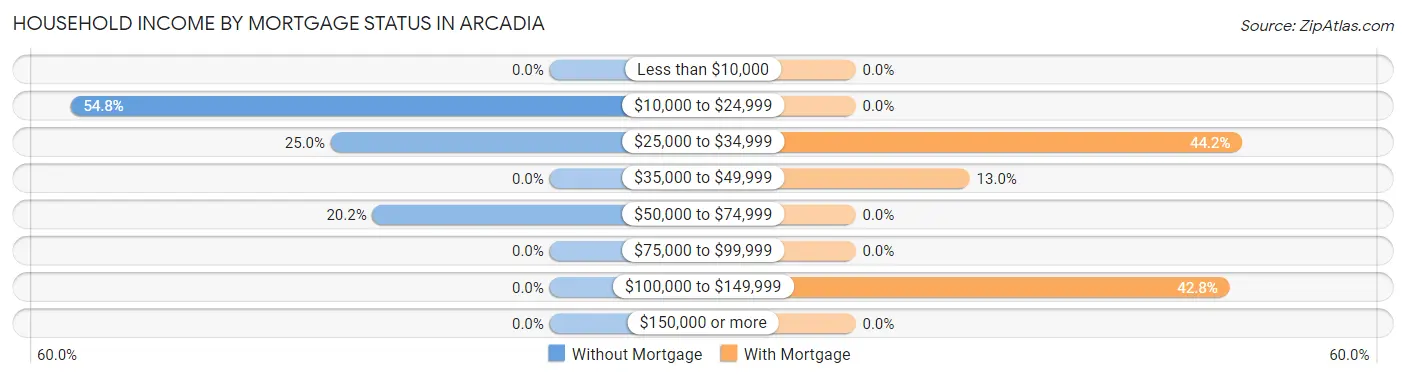
| Household Income | Without Mortgage | With Mortgage |
| Less than $10,000 | 0 (0.0%) | 0 (0.0%) |
| $10,000 to $24,999 | 46 (54.8%) | 0 (0.0%) |
| $25,000 to $34,999 | 21 (25.0%) | 61 (44.2%) |
| $35,000 to $49,999 | 0 (0.0%) | 18 (13.0%) |
| $50,000 to $74,999 | 17 (20.2%) | 0 (0.0%) |
| $75,000 to $99,999 | 0 (0.0%) | 0 (0.0%) |
| $100,000 to $149,999 | 0 (0.0%) | 59 (42.7%) |
| $150,000 or more | 0 (0.0%) | 0 (0.0%) |
| Total | 84 (100.0%) | 138 (100.0%) |
Property Value to Household Income Ratio in Arcadia
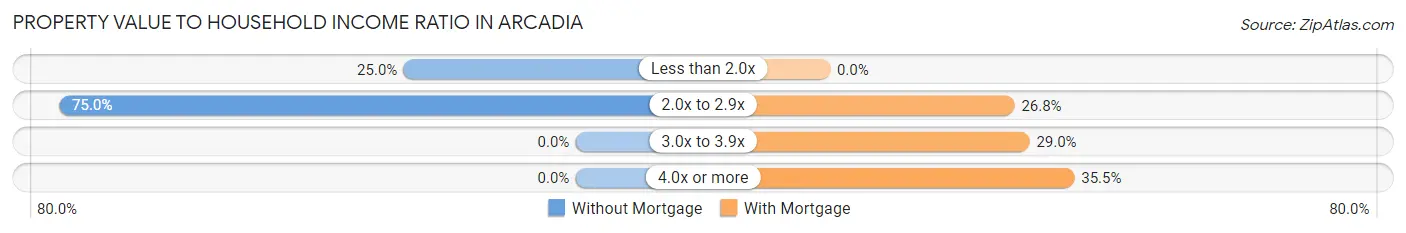
| Value-to-Income Ratio | Without Mortgage | With Mortgage |
| Less than 2.0x | 21 (25.0%) | 0 (0.0%) |
| 2.0x to 2.9x | 63 (75.0%) | 37 (26.8%) |
| 3.0x to 3.9x | 0 (0.0%) | 40 (29.0%) |
| 4.0x or more | 0 (0.0%) | 49 (35.5%) |
| Total | 84 (100.0%) | 138 (100.0%) |
Real Estate Taxes by Mortgage Status in Arcadia
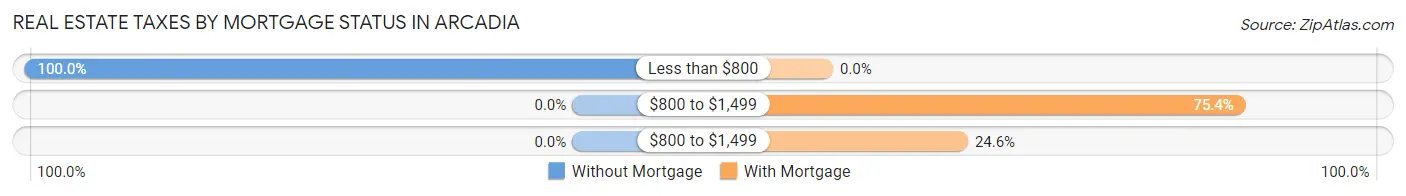
| Property Taxes | Without Mortgage | With Mortgage |
| Less than $800 | 84 (100.0%) | 0 (0.0%) |
| $800 to $1,499 | 0 (0.0%) | 104 (75.4%) |
| $800 to $1,499 | 0 (0.0%) | 34 (24.6%) |
| Total | 84 (100.0%) | 138 (100.0%) |
Health & Disability in Arcadia
Health Insurance Coverage by Age in Arcadia
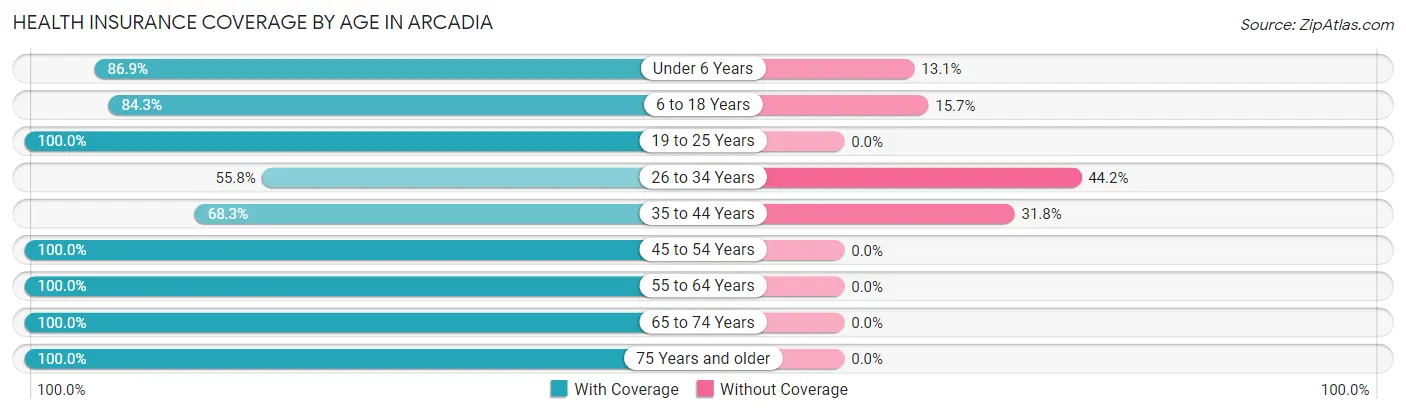
| Age Bracket | With Coverage | Without Coverage |
| Under 6 Years | 286 (86.9%) | 43 (13.1%) |
| 6 to 18 Years | 522 (84.3%) | 97 (15.7%) |
| 19 to 25 Years | 223 (100.0%) | 0 (0.0%) |
| 26 to 34 Years | 374 (55.8%) | 296 (44.2%) |
| 35 to 44 Years | 230 (68.2%) | 107 (31.8%) |
| 45 to 54 Years | 246 (100.0%) | 0 (0.0%) |
| 55 to 64 Years | 125 (100.0%) | 0 (0.0%) |
| 65 to 74 Years | 213 (100.0%) | 0 (0.0%) |
| 75 Years and older | 84 (100.0%) | 0 (0.0%) |
| Total | 2,303 (80.9%) | 543 (19.1%) |
Health Insurance Coverage by Citizenship Status in Arcadia
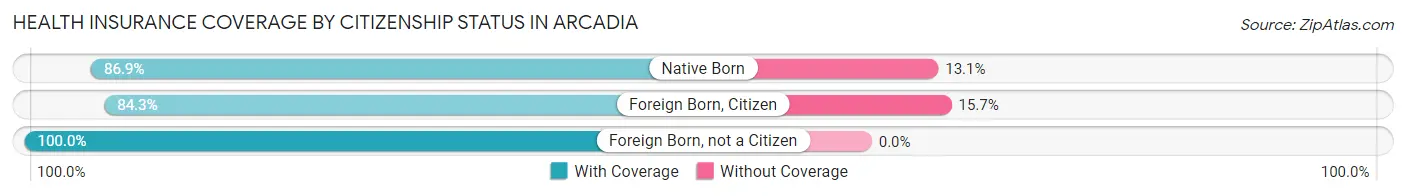
| Citizenship Status | With Coverage | Without Coverage |
| Native Born | 286 (86.9%) | 43 (13.1%) |
| Foreign Born, Citizen | 522 (84.3%) | 97 (15.7%) |
| Foreign Born, not a Citizen | 223 (100.0%) | 0 (0.0%) |
Health Insurance Coverage by Household Income in Arcadia
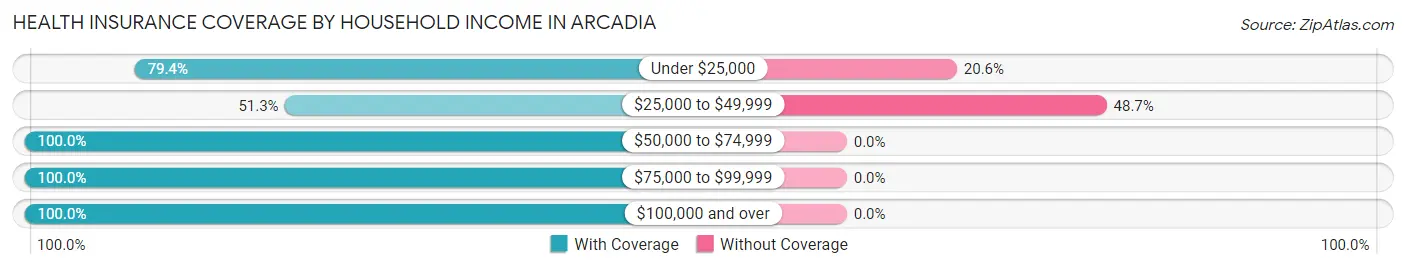
| Household Income | With Coverage | Without Coverage |
| Under $25,000 | 666 (79.4%) | 173 (20.6%) |
| $25,000 to $49,999 | 390 (51.3%) | 370 (48.7%) |
| $50,000 to $74,999 | 392 (100.0%) | 0 (0.0%) |
| $75,000 to $99,999 | 306 (100.0%) | 0 (0.0%) |
| $100,000 and over | 547 (100.0%) | 0 (0.0%) |
Public vs Private Health Insurance Coverage by Age in Arcadia
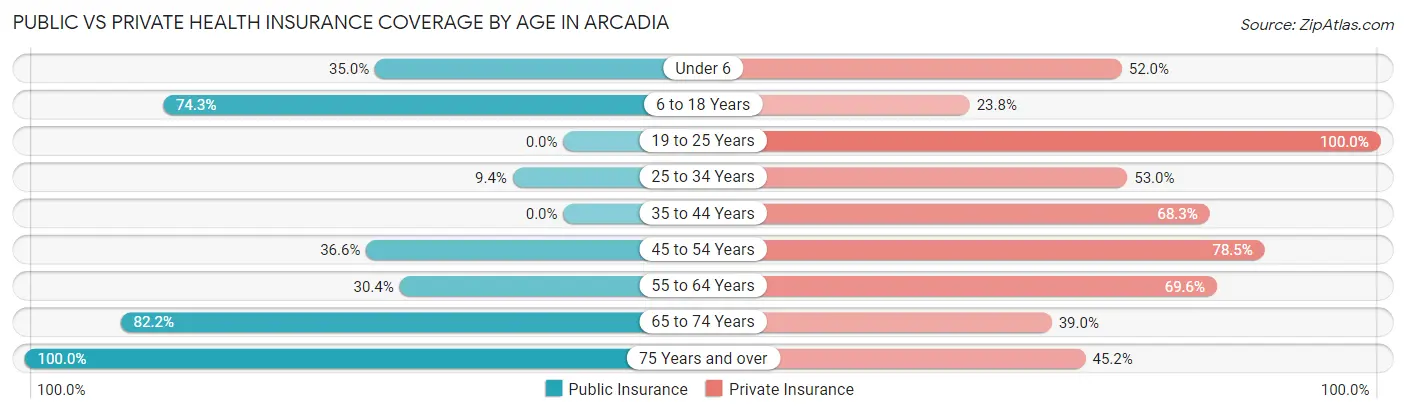
| Age Bracket | Public Insurance | Private Insurance |
| Under 6 | 115 (34.9%) | 171 (52.0%) |
| 6 to 18 Years | 460 (74.3%) | 147 (23.7%) |
| 19 to 25 Years | 0 (0.0%) | 223 (100.0%) |
| 25 to 34 Years | 63 (9.4%) | 355 (53.0%) |
| 35 to 44 Years | 0 (0.0%) | 230 (68.2%) |
| 45 to 54 Years | 90 (36.6%) | 193 (78.5%) |
| 55 to 64 Years | 38 (30.4%) | 87 (69.6%) |
| 65 to 74 Years | 175 (82.2%) | 83 (39.0%) |
| 75 Years and over | 84 (100.0%) | 38 (45.2%) |
| Total | 1,025 (36.0%) | 1,527 (53.6%) |
Disability Status by Sex by Age in Arcadia
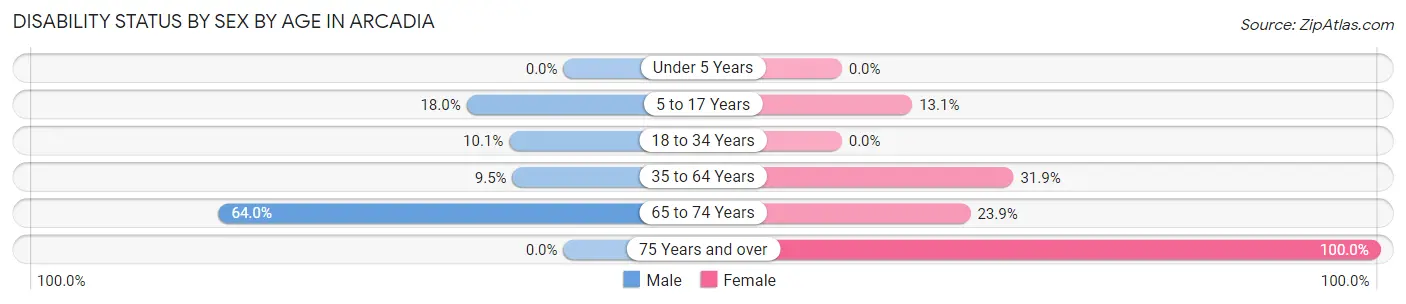
| Age Bracket | Male | Female |
| Under 5 Years | 0 (0.0%) | 0 (0.0%) |
| 5 to 17 Years | 41 (18.0%) | 56 (13.1%) |
| 18 to 34 Years | 44 (10.1%) | 0 (0.0%) |
| 35 to 64 Years | 26 (9.5%) | 138 (31.9%) |
| 65 to 74 Years | 64 (64.0%) | 27 (23.9%) |
| 75 Years and over | 0 (0.0%) | 38 (100.0%) |
Disability Class by Sex by Age in Arcadia
Disability Class: Hearing Difficulty
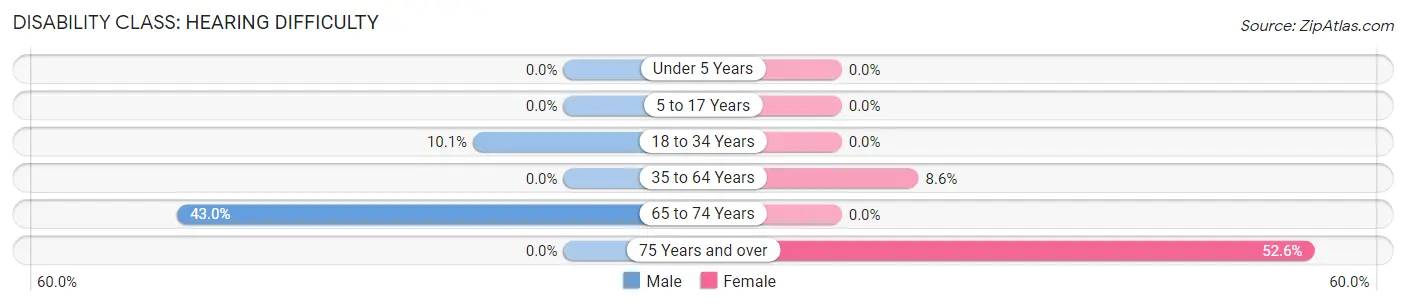
| Age Bracket | Male | Female |
| Under 5 Years | 0 (0.0%) | 0 (0.0%) |
| 5 to 17 Years | 0 (0.0%) | 0 (0.0%) |
| 18 to 34 Years | 44 (10.1%) | 0 (0.0%) |
| 35 to 64 Years | 0 (0.0%) | 37 (8.6%) |
| 65 to 74 Years | 43 (43.0%) | 0 (0.0%) |
| 75 Years and over | 0 (0.0%) | 20 (52.6%) |
Disability Class: Vision Difficulty
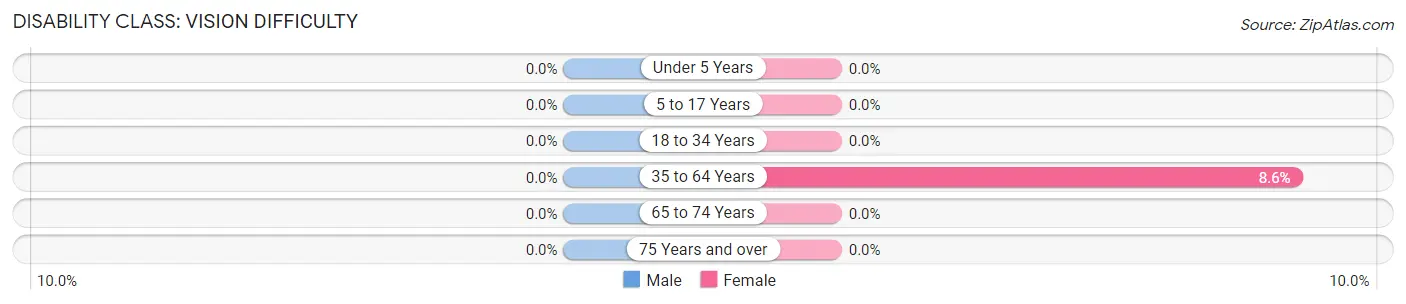
| Age Bracket | Male | Female |
| Under 5 Years | 0 (0.0%) | 0 (0.0%) |
| 5 to 17 Years | 0 (0.0%) | 0 (0.0%) |
| 18 to 34 Years | 0 (0.0%) | 0 (0.0%) |
| 35 to 64 Years | 0 (0.0%) | 37 (8.6%) |
| 65 to 74 Years | 0 (0.0%) | 0 (0.0%) |
| 75 Years and over | 0 (0.0%) | 0 (0.0%) |
Disability Class: Cognitive Difficulty
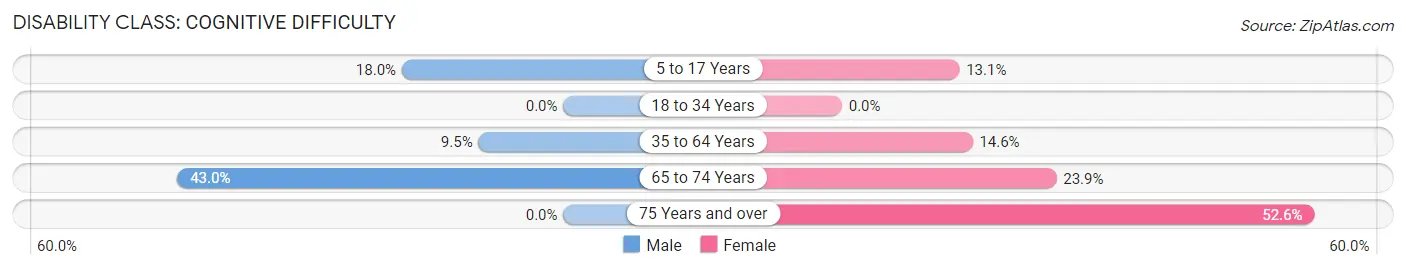
| Age Bracket | Male | Female |
| 5 to 17 Years | 41 (18.0%) | 56 (13.1%) |
| 18 to 34 Years | 0 (0.0%) | 0 (0.0%) |
| 35 to 64 Years | 26 (9.5%) | 63 (14.5%) |
| 65 to 74 Years | 43 (43.0%) | 27 (23.9%) |
| 75 Years and over | 0 (0.0%) | 20 (52.6%) |
Disability Class: Ambulatory Difficulty
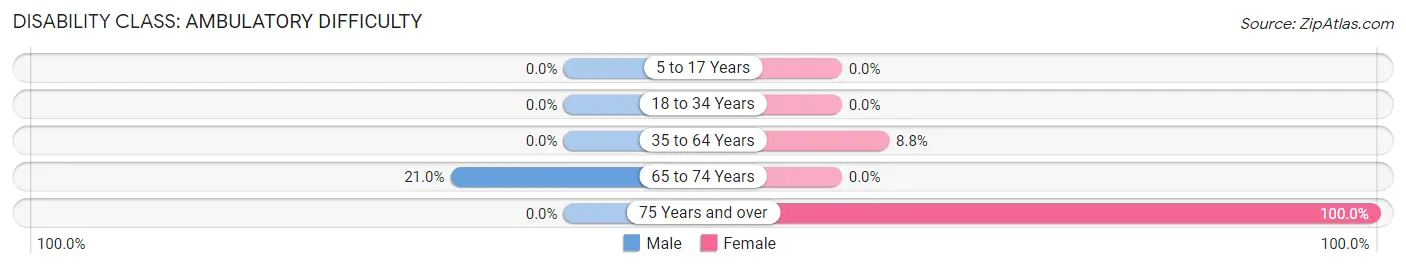
| Age Bracket | Male | Female |
| 5 to 17 Years | 0 (0.0%) | 0 (0.0%) |
| 18 to 34 Years | 0 (0.0%) | 0 (0.0%) |
| 35 to 64 Years | 0 (0.0%) | 38 (8.8%) |
| 65 to 74 Years | 21 (21.0%) | 0 (0.0%) |
| 75 Years and over | 0 (0.0%) | 38 (100.0%) |
Disability Class: Self-Care Difficulty
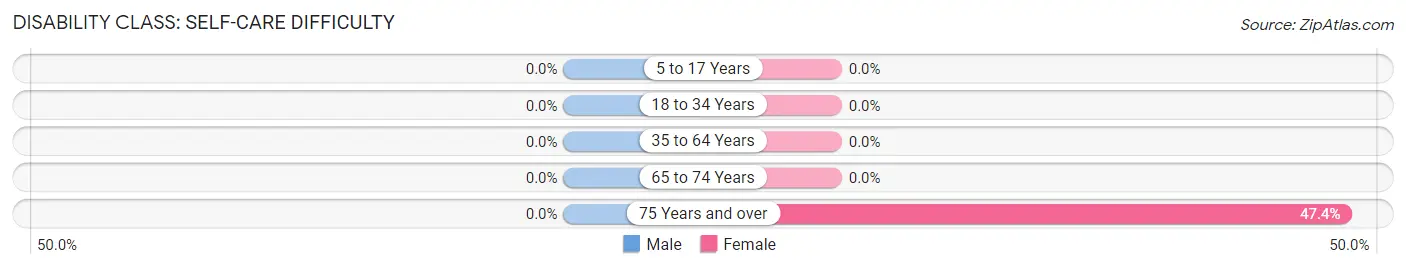
| Age Bracket | Male | Female |
| 5 to 17 Years | 0 (0.0%) | 0 (0.0%) |
| 18 to 34 Years | 0 (0.0%) | 0 (0.0%) |
| 35 to 64 Years | 0 (0.0%) | 0 (0.0%) |
| 65 to 74 Years | 0 (0.0%) | 0 (0.0%) |
| 75 Years and over | 0 (0.0%) | 18 (47.4%) |
Technology Access in Arcadia
Computing Device Access in Arcadia

| Device Type | # Households | % Households |
| Desktop or Laptop | 769 | 72.3% |
| Smartphone | 906 | 85.2% |
| Tablet | 561 | 52.8% |
| No Computing Device | 139 | 13.1% |
| Total | 1,063 | 100.0% |
Internet Access in Arcadia
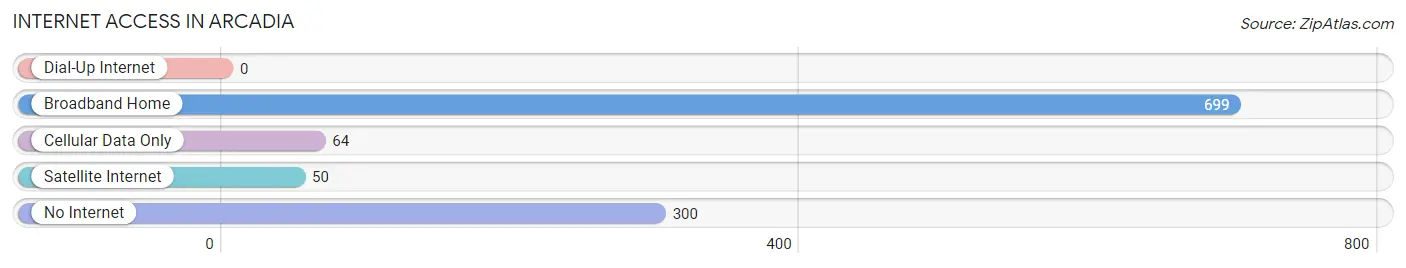
| Internet Type | # Households | % Households |
| Dial-Up Internet | 0 | 0.0% |
| Broadband Home | 699 | 65.8% |
| Cellular Data Only | 64 | 6.0% |
| Satellite Internet | 50 | 4.7% |
| No Internet | 300 | 28.2% |
| Total | 1,063 | 100.0% |
Arcadia Summary
Arcadia is a small town located in the state of South Carolina, United States. It is situated in the northern part of the state, in the Piedmont region. The town is located in the county of Anderson, and is part of the Anderson Metropolitan Statistical Area. The population of Arcadia was estimated to be 1,845 in the year 2020.
Geography
Arcadia is located in the northern part of South Carolina, in the Piedmont region. It is situated in the county of Anderson, and is part of the Anderson Metropolitan Statistical Area. The town is located at an elevation of 845 feet above sea level. The town is situated on the banks of the Saluda River, and is surrounded by the Sumter National Forest. The town is located at the intersection of US Highway 29 and South Carolina Highway 81.
History
Arcadia was founded in 1820 by a group of settlers from North Carolina. The town was named after the Greek city of Arcadia, which was known for its beauty and tranquility. The town was incorporated in 1837, and the first post office was established in 1838. The town was a major center for cotton production during the 19th century, and the town's economy was largely based on agriculture.
Economy
The economy of Arcadia is largely based on agriculture. The town is home to several farms, which produce a variety of crops, including cotton, corn, soybeans, and wheat. The town is also home to several manufacturing companies, which produce a variety of products, including furniture, textiles, and automotive parts. The town is also home to several retail stores, which sell a variety of goods, including clothing, electronics, and home goods.
Demographics
According to the 2020 census, the population of Arcadia was estimated to be 1,845. The racial makeup of the town was 79.2% White, 17.2% African American, 0.7% Native American, 0.3% Asian, 0.1% Pacific Islander, and 2.5% from other races. The median household income in Arcadia was estimated to be $37,941, and the median home value was estimated to be $117,400.
Conclusion
Arcadia is a small town located in the northern part of South Carolina, in the Piedmont region. The town was founded in 1820, and was incorporated in 1837. The town's economy is largely based on agriculture, and the town is home to several manufacturing companies. The population of Arcadia was estimated to be 1,845 in the year 2020, and the median household income was estimated to be $37,941.
Common Questions
What is Per Capita Income in Arcadia?
Per Capita income in Arcadia is $19,963.
What is the Median Family Income in Arcadia?
Median Family Income in Arcadia is $44,491.
What is the Median Household income in Arcadia?
Median Household Income in Arcadia is $39,931.
What is Income or Wage Gap in Arcadia?
Income or Wage Gap in Arcadia is 11.1%.
Women in Arcadia earn 88.9 cents for every dollar earned by a man.
What is Inequality or Gini Index in Arcadia?
Inequality or Gini Index in Arcadia is 0.47.
What is the Total Population of Arcadia?
Total Population of Arcadia is 2,846.
What is the Total Male Population of Arcadia?
Total Male Population of Arcadia is 1,269.
What is the Total Female Population of Arcadia?
Total Female Population of Arcadia is 1,577.
What is the Ratio of Males per 100 Females in Arcadia?
There are 80.47 Males per 100 Females in Arcadia.
What is the Ratio of Females per 100 Males in Arcadia?
There are 124.27 Females per 100 Males in Arcadia.
What is the Median Population Age in Arcadia?
Median Population Age in Arcadia is 27.5 Years.
What is the Average Family Size in Arcadia
Average Family Size in Arcadia is 3.8 People.
What is the Average Household Size in Arcadia
Average Household Size in Arcadia is 2.7 People.
How Large is the Labor Force in Arcadia?
There are 1,478 People in the Labor Forcein in Arcadia.
What is the Percentage of People in the Labor Force in Arcadia?
76.8% of People are in the Labor Force in Arcadia.
What is the Unemployment Rate in Arcadia?
Unemployment Rate in Arcadia is 12.0%.