North Hartsville, SC Map & Demographics
North Hartsville Map
North Hartsville Overview
$35,577
PER CAPITA INCOME
$92,639
AVG FAMILY INCOME
$71,000
AVG HOUSEHOLD INCOME
$5,413
FAMILY INCOME DEFICIT
0.41
INEQUALITY / GINI INDEX
3,261
TOTAL POPULATION
1,333
MALE POPULATION
1,928
FEMALE POPULATION
69.14
MALES / 100 FEMALES
144.64
FEMALES / 100 MALES
32.0
MEDIAN AGE
3.8
AVG FAMILY SIZE
2.8
AVG HOUSEHOLD SIZE
1,679
LABOR FORCE [ PEOPLE ]
77.3%
PERCENT IN LABOR FORCE
0.9%
UNEMPLOYMENT RATE
Income in North Hartsville
Income Overview in North Hartsville
Per Capita Income in North Hartsville is $35,577, while median incomes of families and households are $92,639 and $71,000 respectively.
| Characteristic | Number | Measure |
| Per Capita Income | 3,261 | $35,577 |
| Median Family Income | 766 | $92,639 |
| Mean Family Income | 766 | $111,996 |
| Median Household Income | 1,154 | $71,000 |
| Mean Household Income | 1,154 | $96,544 |
| Income Deficit | 766 | $5,413 |
| Wage / Income Gap (%) | 3,261 | 0.00% |
| Wage / Income Gap ($) | 3,261 | 100.00¢ per $1 |
| Gini / Inequality Index | 3,261 | 0.41 |
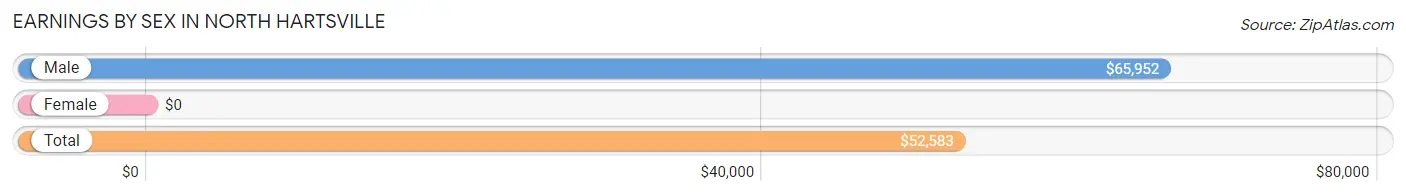
Earnings by Sex in North Hartsville
| Sex | Number | Average Earnings |
| Male | 866 (50.3%) | $65,952 |
| Female | 857 (49.7%) | $0 |
| Total | 1,723 (100.0%) | $52,583 |
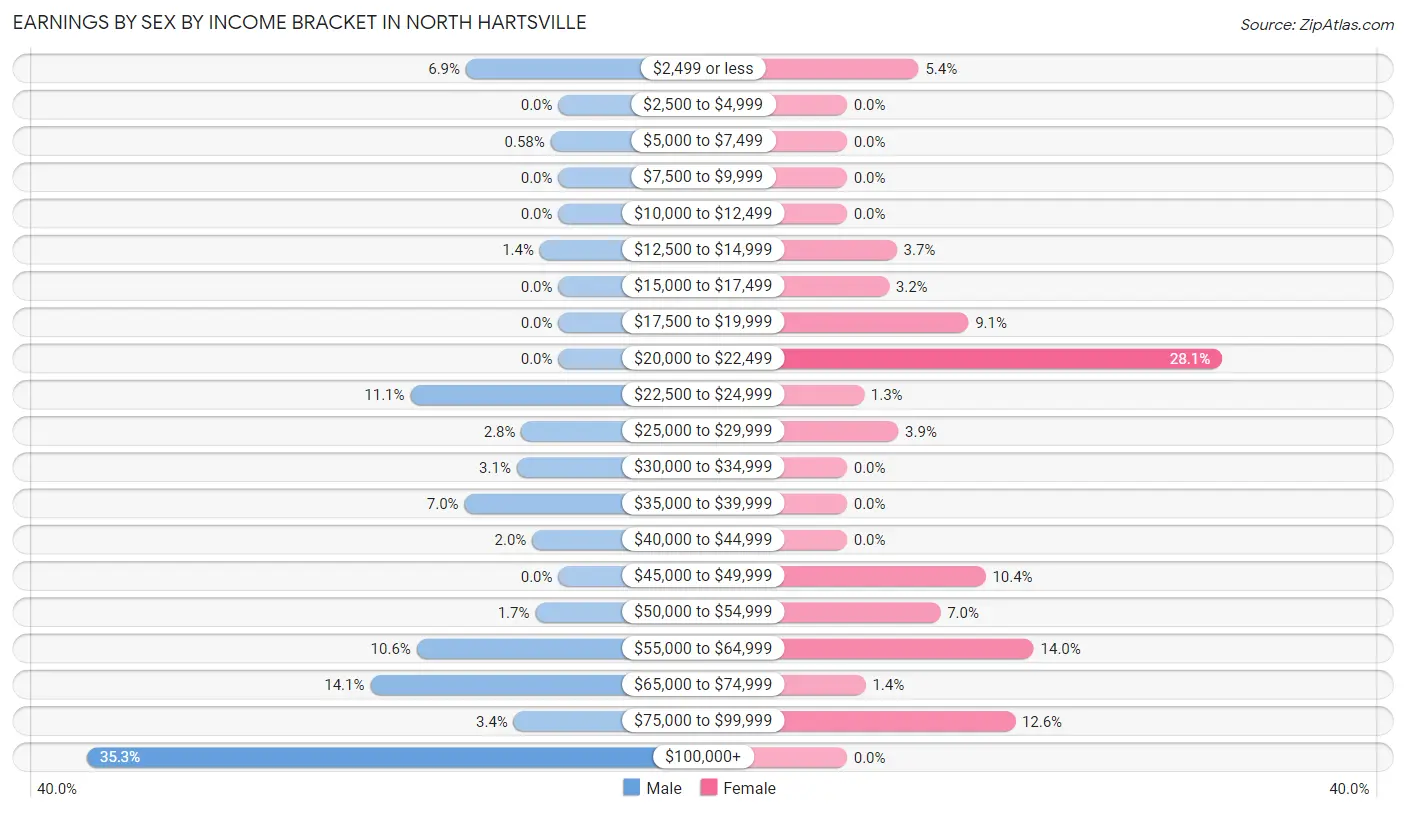
Earnings by Sex by Income Bracket in North Hartsville
The most common earnings brackets in North Hartsville are $100,000+ for men (306 | 35.3%) and $20,000 to $22,499 for women (241 | 28.1%).
| Income | Male | Female |
| $2,499 or less | 60 (6.9%) | 46 (5.4%) |
| $2,500 to $4,999 | 0 (0.0%) | 0 (0.0%) |
| $5,000 to $7,499 | 5 (0.6%) | 0 (0.0%) |
| $7,500 to $9,999 | 0 (0.0%) | 0 (0.0%) |
| $10,000 to $12,499 | 0 (0.0%) | 0 (0.0%) |
| $12,500 to $14,999 | 12 (1.4%) | 32 (3.7%) |
| $15,000 to $17,499 | 0 (0.0%) | 27 (3.2%) |
| $17,500 to $19,999 | 0 (0.0%) | 78 (9.1%) |
| $20,000 to $22,499 | 0 (0.0%) | 241 (28.1%) |
| $22,500 to $24,999 | 96 (11.1%) | 11 (1.3%) |
| $25,000 to $29,999 | 24 (2.8%) | 33 (3.8%) |
| $30,000 to $34,999 | 27 (3.1%) | 0 (0.0%) |
| $35,000 to $39,999 | 61 (7.0%) | 0 (0.0%) |
| $40,000 to $44,999 | 17 (2.0%) | 0 (0.0%) |
| $45,000 to $49,999 | 0 (0.0%) | 89 (10.4%) |
| $50,000 to $54,999 | 15 (1.7%) | 60 (7.0%) |
| $55,000 to $64,999 | 92 (10.6%) | 120 (14.0%) |
| $65,000 to $74,999 | 122 (14.1%) | 12 (1.4%) |
| $75,000 to $99,999 | 29 (3.4%) | 108 (12.6%) |
| $100,000+ | 306 (35.3%) | 0 (0.0%) |
| Total | 866 (100.0%) | 857 (100.0%) |
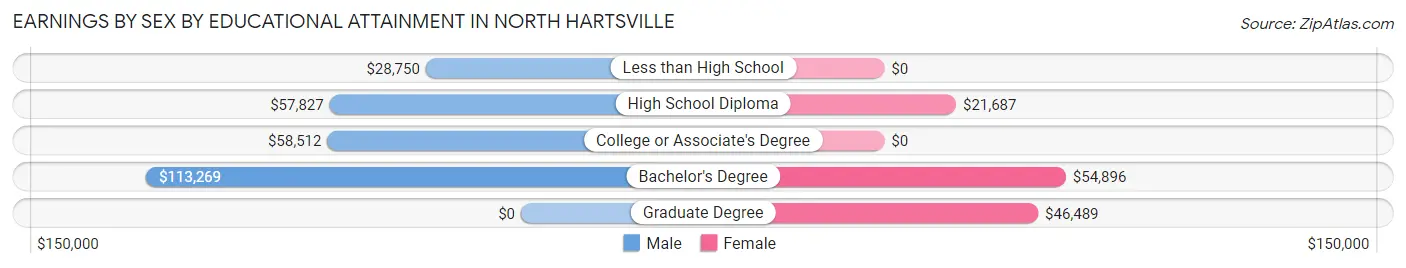
Earnings by Sex by Educational Attainment in North Hartsville
| Educational Attainment | Male Income | Female Income |
| Less than High School | $28,750 | $0 |
| High School Diploma | $57,827 | $21,687 |
| College or Associate's Degree | $58,512 | $0 |
| Bachelor's Degree | $113,269 | $54,896 |
| Graduate Degree | - | - |
| Total | $66,250 | $0 |
Family Income in North Hartsville
Family Income Brackets in North Hartsville
According to the North Hartsville family income data, there are 152 families falling into the $150,000 to $199,999 income range, which is the most common income bracket and makes up 19.8% of all families.
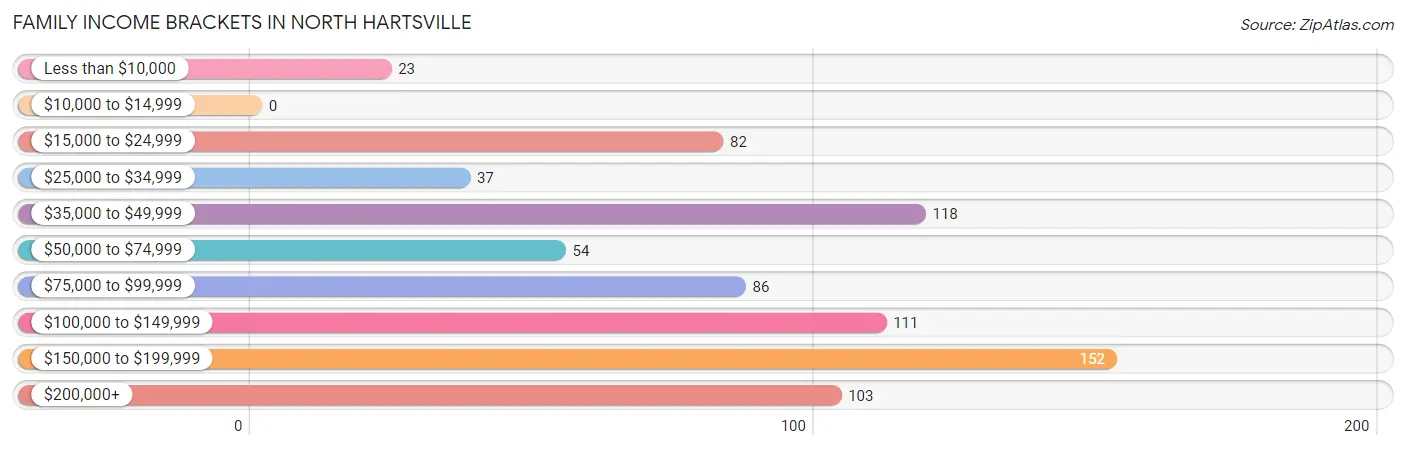
| Income Bracket | # Families | % Families |
| Less than $10,000 | 23 | 3.0% |
| $10,000 to $14,999 | 0 | 0.0% |
| $15,000 to $24,999 | 82 | 10.7% |
| $25,000 to $34,999 | 37 | 4.8% |
| $35,000 to $49,999 | 118 | 15.4% |
| $50,000 to $74,999 | 54 | 7.0% |
| $75,000 to $99,999 | 86 | 11.2% |
| $100,000 to $149,999 | 111 | 14.5% |
| $150,000 to $199,999 | 152 | 19.8% |
| $200,000+ | 103 | 13.4% |
Family Income by Famaliy Size in North Hartsville
3-person families (244 | 31.9%) account for the highest median family income in North Hartsville with $129,167 per family, while 3-person families (244 | 31.9%) have the highest median income of $43,056 per family member.
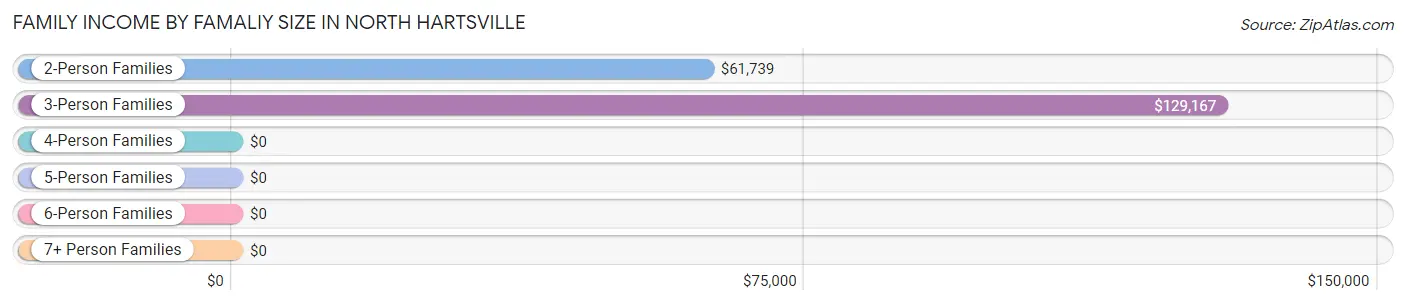
| Income Bracket | # Families | Median Income |
| 2-Person Families | 220 (28.7%) | $61,739 |
| 3-Person Families | 244 (31.9%) | $129,167 |
| 4-Person Families | 200 (26.1%) | $0 |
| 5-Person Families | 23 (3.0%) | $0 |
| 6-Person Families | 0 (0.0%) | $0 |
| 7+ Person Families | 79 (10.3%) | $0 |
| Total | 766 (100.0%) | $92,639 |
Family Income by Number of Earners in North Hartsville
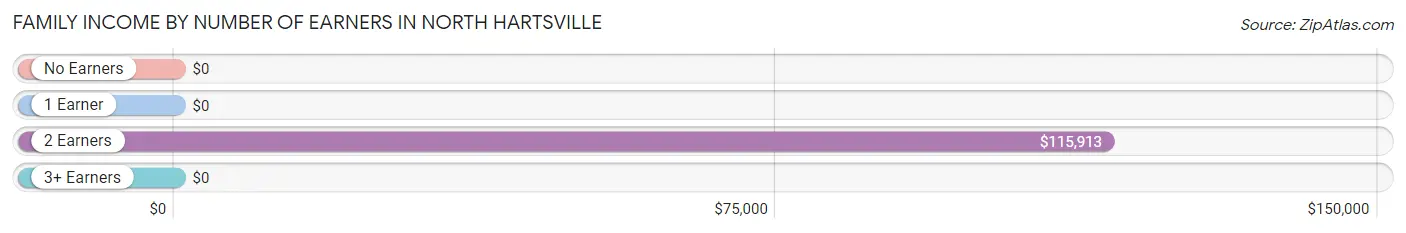
| Number of Earners | # Families | Median Income |
| No Earners | 34 (4.4%) | $0 |
| 1 Earner | 195 (25.5%) | $0 |
| 2 Earners | 464 (60.6%) | $115,913 |
| 3+ Earners | 73 (9.5%) | $0 |
| Total | 766 (100.0%) | $92,639 |
Household Income in North Hartsville
Household Income Brackets in North Hartsville
With 250 households falling in the category, the $50,000 to $74,999 income range is the most frequent in North Hartsville, accounting for 21.7% of all households. In contrast, only 14 households (1.2%) fall into the $10,000 to $14,999 income bracket, making it the least populous group.
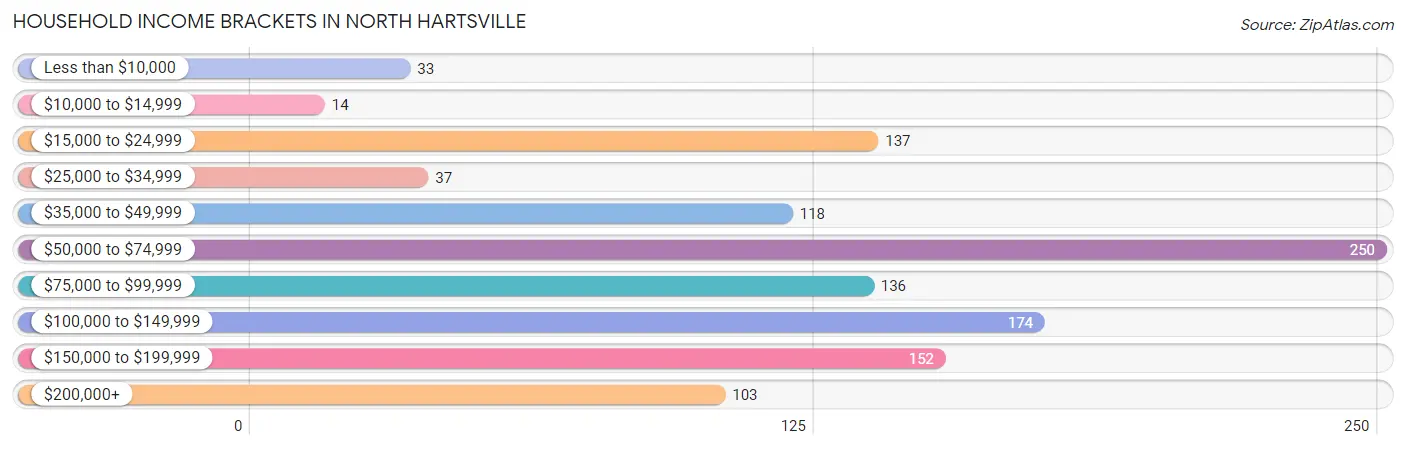
| Income Bracket | # Households | % Households |
| Less than $10,000 | 33 | 2.9% |
| $10,000 to $14,999 | 14 | 1.2% |
| $15,000 to $24,999 | 137 | 11.9% |
| $25,000 to $34,999 | 37 | 3.2% |
| $35,000 to $49,999 | 118 | 10.2% |
| $50,000 to $74,999 | 250 | 21.7% |
| $75,000 to $99,999 | 136 | 11.8% |
| $100,000 to $149,999 | 174 | 15.1% |
| $150,000 to $199,999 | 152 | 13.2% |
| $200,000+ | 103 | 8.9% |
Household Income by Householder Age in North Hartsville
The median household income in North Hartsville is $71,000, with the highest median household income of $92,143 found in the 45 to 64 years age bracket for the primary householder. A total of 426 households (36.9%) fall into this category.
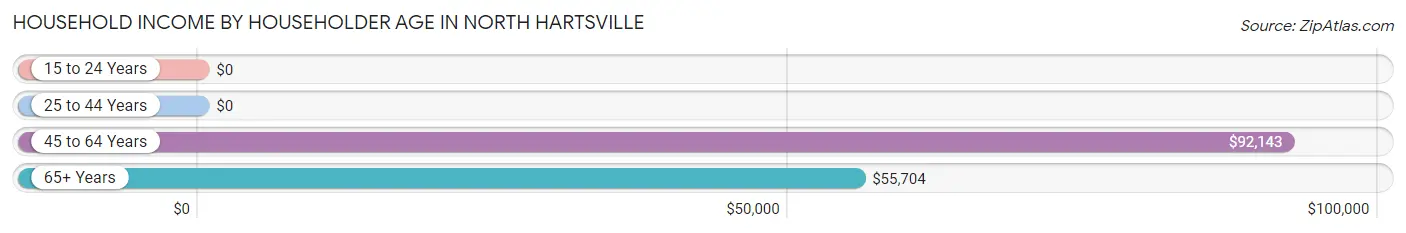
| Income Bracket | # Households | Median Income |
| 15 to 24 Years | 0 (0.0%) | $0 |
| 25 to 44 Years | 441 (38.2%) | $0 |
| 45 to 64 Years | 426 (36.9%) | $92,143 |
| 65+ Years | 287 (24.9%) | $55,704 |
| Total | 1,154 (100.0%) | $71,000 |
Poverty in North Hartsville
Income Below Poverty by Sex and Age in North Hartsville
With 25.2% poverty level for males and 29.2% for females among the residents of North Hartsville, 16 and 17 year old males and 35 to 44 year old females are the most vulnerable to poverty, with 15 males (100.0%) and 132 females (63.2%) in their respective age groups living below the poverty level.
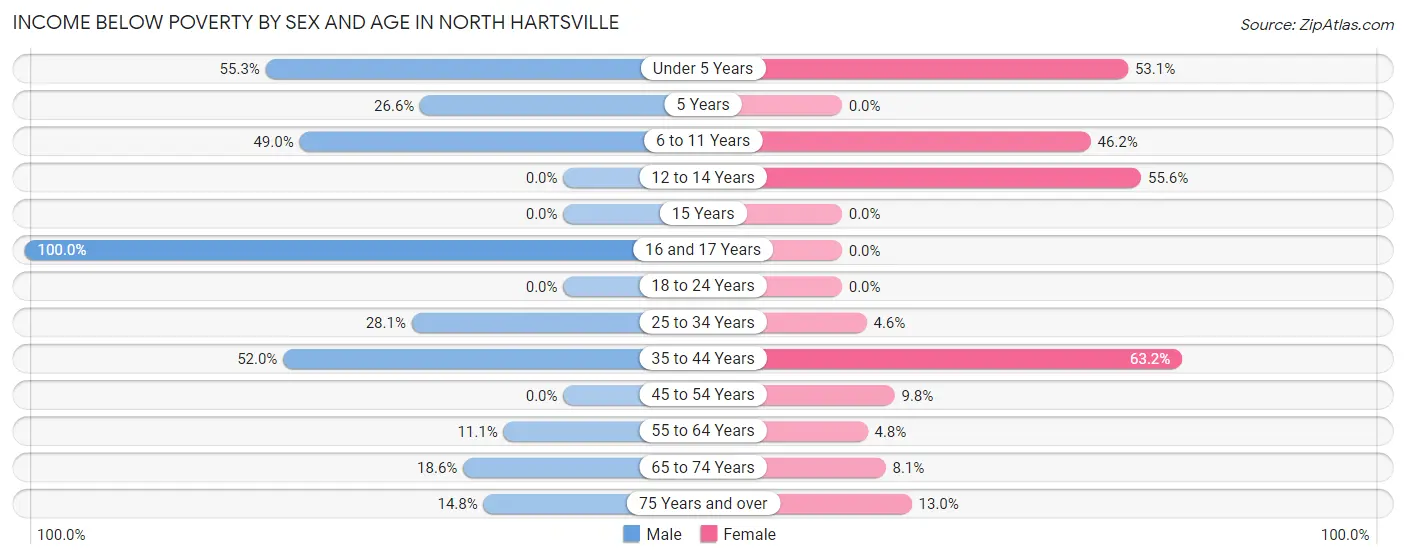
| Age Bracket | Male | Female |
| Under 5 Years | 84 (55.3%) | 102 (53.1%) |
| 5 Years | 21 (26.6%) | 0 (0.0%) |
| 6 to 11 Years | 24 (49.0%) | 247 (46.2%) |
| 12 to 14 Years | 0 (0.0%) | 25 (55.6%) |
| 15 Years | 0 (0.0%) | 0 (0.0%) |
| 16 and 17 Years | 15 (100.0%) | 0 (0.0%) |
| 18 to 24 Years | 0 (0.0%) | 0 (0.0%) |
| 25 to 34 Years | 94 (28.1%) | 14 (4.6%) |
| 35 to 44 Years | 52 (52.0%) | 132 (63.2%) |
| 45 to 54 Years | 0 (0.0%) | 14 (9.8%) |
| 55 to 64 Years | 22 (11.1%) | 10 (4.8%) |
| 65 to 74 Years | 16 (18.6%) | 13 (8.1%) |
| 75 Years and over | 8 (14.8%) | 7 (13.0%) |
| Total | 336 (25.2%) | 564 (29.2%) |
Income Above Poverty by Sex and Age in North Hartsville
According to the poverty statistics in North Hartsville, males aged 12 to 14 years and females aged 15 years are the age groups that are most secure financially, with 100.0% of males and 100.0% of females in these age groups living above the poverty line.
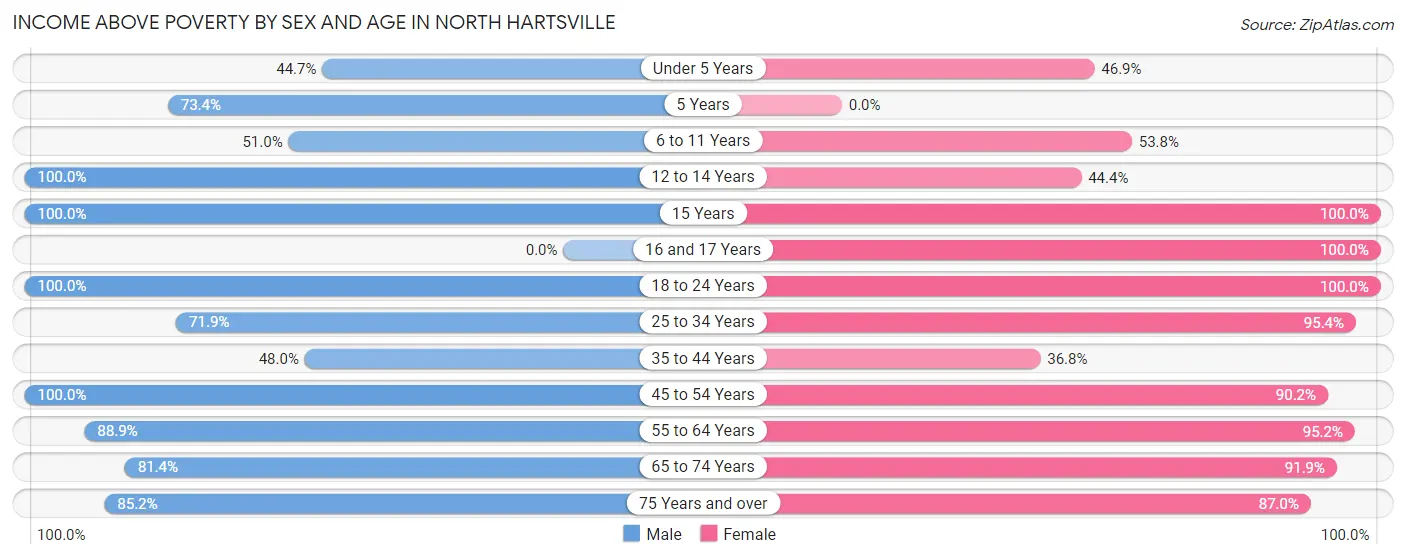
| Age Bracket | Male | Female |
| Under 5 Years | 68 (44.7%) | 90 (46.9%) |
| 5 Years | 58 (73.4%) | 0 (0.0%) |
| 6 to 11 Years | 25 (51.0%) | 288 (53.8%) |
| 12 to 14 Years | 11 (100.0%) | 20 (44.4%) |
| 15 Years | 13 (100.0%) | 13 (100.0%) |
| 16 and 17 Years | 0 (0.0%) | 17 (100.0%) |
| 18 to 24 Years | 58 (100.0%) | 46 (100.0%) |
| 25 to 34 Years | 240 (71.9%) | 291 (95.4%) |
| 35 to 44 Years | 48 (48.0%) | 77 (36.8%) |
| 45 to 54 Years | 184 (100.0%) | 129 (90.2%) |
| 55 to 64 Years | 176 (88.9%) | 199 (95.2%) |
| 65 to 74 Years | 70 (81.4%) | 147 (91.9%) |
| 75 Years and over | 46 (85.2%) | 47 (87.0%) |
| Total | 997 (74.8%) | 1,364 (70.8%) |
Income Below Poverty Among Married-Couple Families in North Hartsville
The poverty statistics for married-couple families in North Hartsville show that 24.0% or 175 of the total 729 families live below the poverty line. Families with 3 or 4 children have the highest poverty rate of 100.0%, comprising of 23 families. On the other hand, families with no children have the lowest poverty rate of 9.9%, which includes 27 families.
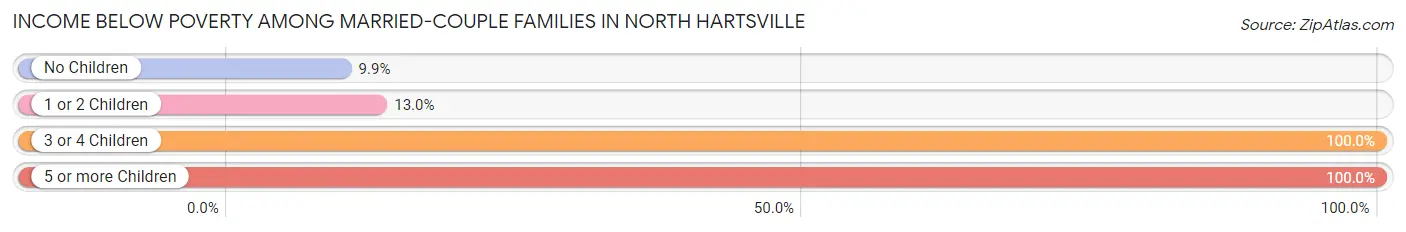
| Children | Above Poverty | Below Poverty |
| No Children | 246 (90.1%) | 27 (9.9%) |
| 1 or 2 Children | 308 (87.0%) | 46 (13.0%) |
| 3 or 4 Children | 0 (0.0%) | 23 (100.0%) |
| 5 or more Children | 0 (0.0%) | 79 (100.0%) |
| Total | 554 (76.0%) | 175 (24.0%) |
Income Below Poverty Among Single-Parent Households in North Hartsville
| Children | Single Father | Single Mother |
| No Children | 0 (0.0%) | 0 (0.0%) |
| 1 or 2 Children | 0 (0.0%) | 0 (0.0%) |
| 3 or 4 Children | 0 (0.0%) | 0 (0.0%) |
| 5 or more Children | 0 (0.0%) | 0 (0.0%) |
| Total | 0 (0.0%) | 0 (0.0%) |
Income Below Poverty Among Married-Couple vs Single-Parent Households in North Hartsville
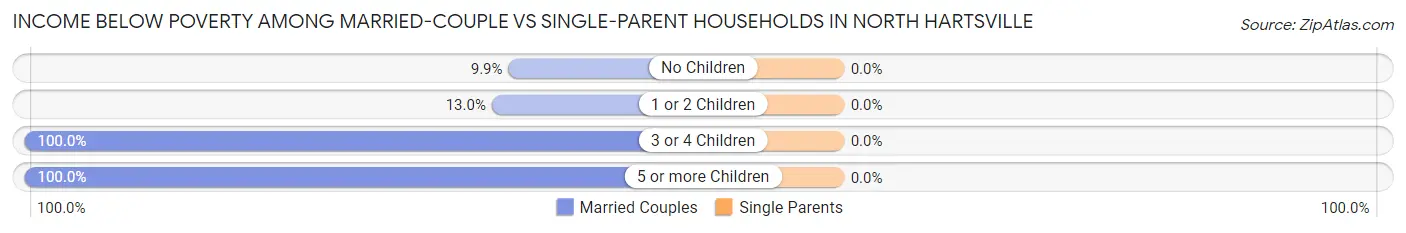
| Children | Married-Couple Families | Single-Parent Households |
| No Children | 27 (9.9%) | 0 (0.0%) |
| 1 or 2 Children | 46 (13.0%) | 0 (0.0%) |
| 3 or 4 Children | 23 (100.0%) | 0 (0.0%) |
| 5 or more Children | 79 (100.0%) | 0 (0.0%) |
| Total | 175 (24.0%) | 0 (0.0%) |
Race in North Hartsville
The most populous races in North Hartsville are White / Caucasian (2,049 | 62.8%), Black / African American (669 | 20.5%), and Two or more Races (506 | 15.5%).
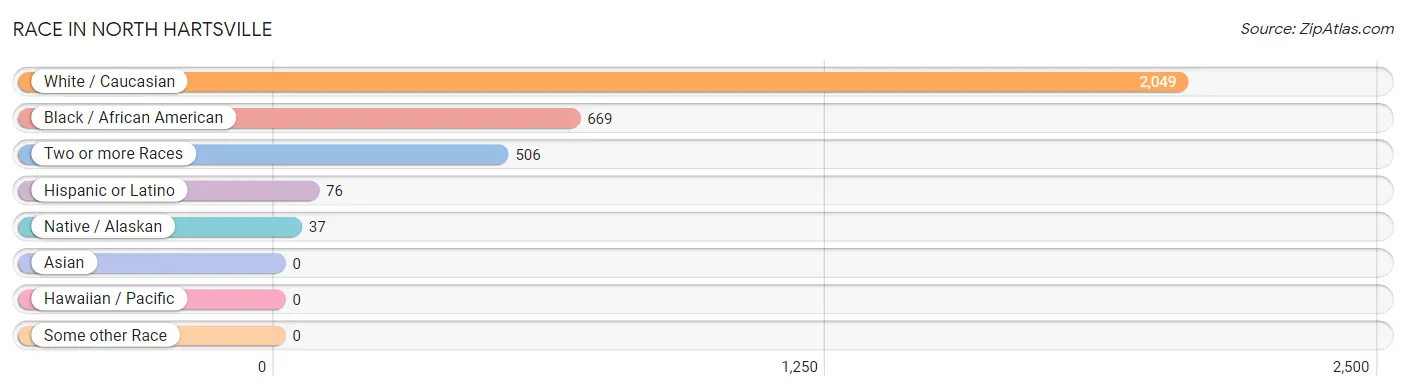
| Race | # Population | % Population |
| Asian | 0 | 0.0% |
| Black / African American | 669 | 20.5% |
| Hawaiian / Pacific | 0 | 0.0% |
| Hispanic or Latino | 76 | 2.3% |
| Native / Alaskan | 37 | 1.1% |
| White / Caucasian | 2,049 | 62.8% |
| Two or more Races | 506 | 15.5% |
| Some other Race | 0 | 0.0% |
| Total | 3,261 | 100.0% |
Ancestry in North Hartsville
The most populous ancestries reported in North Hartsville are Irish (298 | 9.1%), English (286 | 8.8%), German (165 | 5.1%), American (132 | 4.1%), and Scottish (126 | 3.9%), together accounting for 30.9% of all North Hartsville residents.
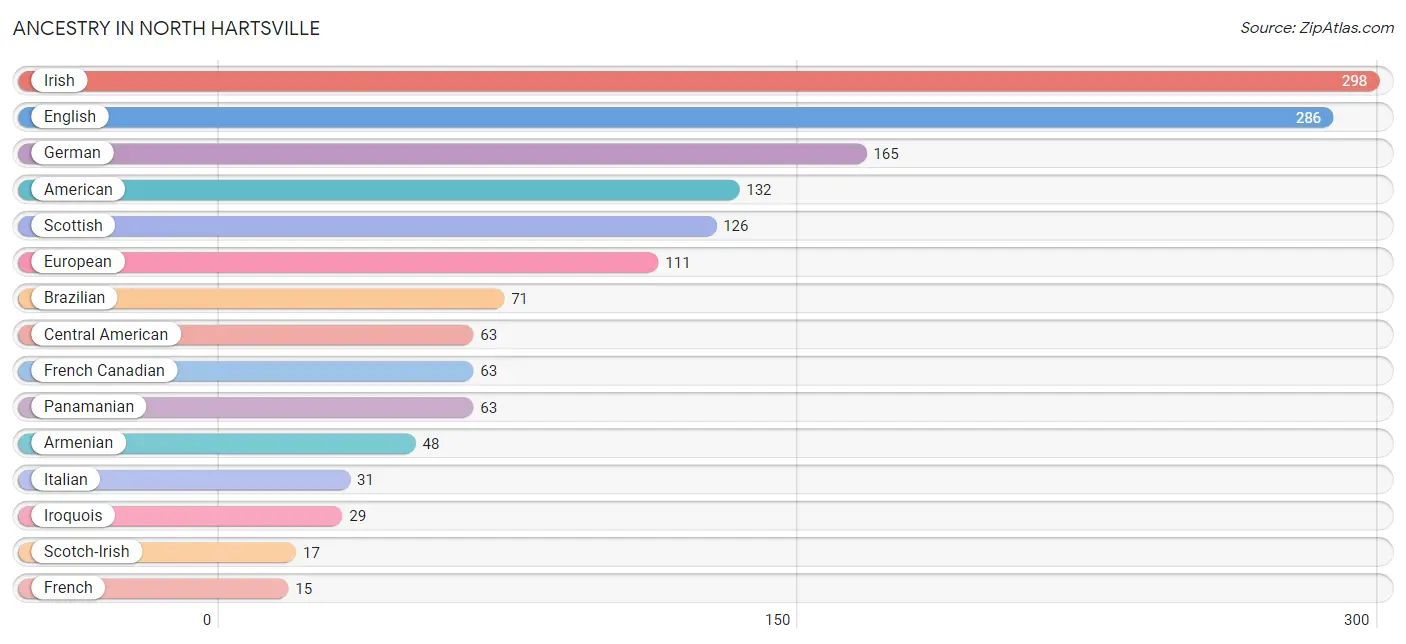
| Ancestry | # Population | % Population |
| American | 132 | 4.1% |
| Armenian | 48 | 1.5% |
| Blackfeet | 2 | 0.1% |
| Brazilian | 71 | 2.2% |
| Central American | 63 | 1.9% |
| Cherokee | 11 | 0.3% |
| English | 286 | 8.8% |
| European | 111 | 3.4% |
| French | 15 | 0.5% |
| French Canadian | 63 | 1.9% |
| German | 165 | 5.1% |
| Irish | 298 | 9.1% |
| Iroquois | 29 | 0.9% |
| Italian | 31 | 0.9% |
| Mexican | 13 | 0.4% |
| Panamanian | 63 | 1.9% |
| Scotch-Irish | 17 | 0.5% |
| Scottish | 126 | 3.9% | View All 18 Rows |
Immigrants in North Hartsville
The most numerous immigrant groups reported in North Hartsville came from Latin America (77 | 2.4%), Brazil (71 | 2.2%), South America (71 | 2.2%), Asia (48 | 1.5%), and Western Asia (48 | 1.5%), together accounting for 9.7% of all North Hartsville residents.
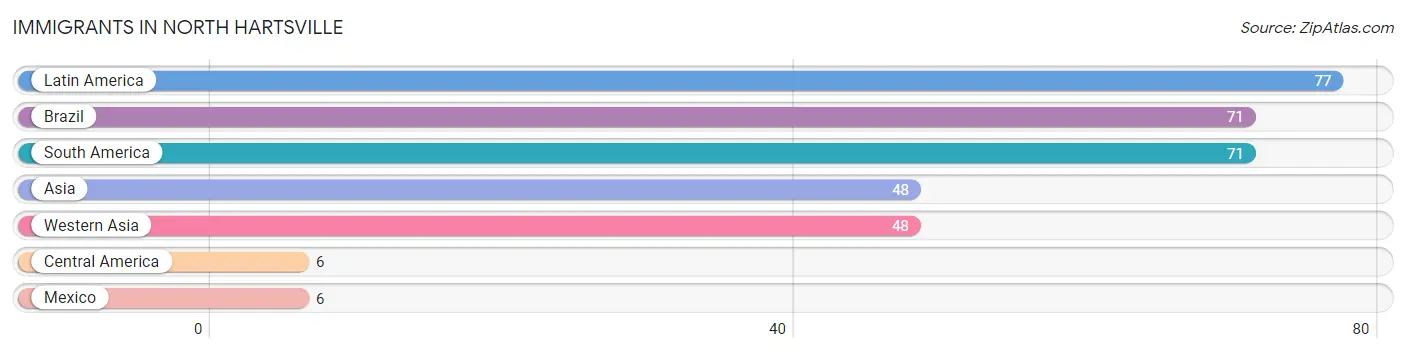
| Immigration Origin | # Population | % Population |
| Asia | 48 | 1.5% |
| Brazil | 71 | 2.2% |
| Central America | 6 | 0.2% |
| Latin America | 77 | 2.4% |
| Mexico | 6 | 0.2% |
| South America | 71 | 2.2% |
| Western Asia | 48 | 1.5% | View All 7 Rows |
Sex and Age in North Hartsville
Sex and Age in North Hartsville
The most populous age groups in North Hartsville are 30 to 34 Years (235 | 17.6%) for men and 5 to 9 Years (342 | 17.7%) for women.
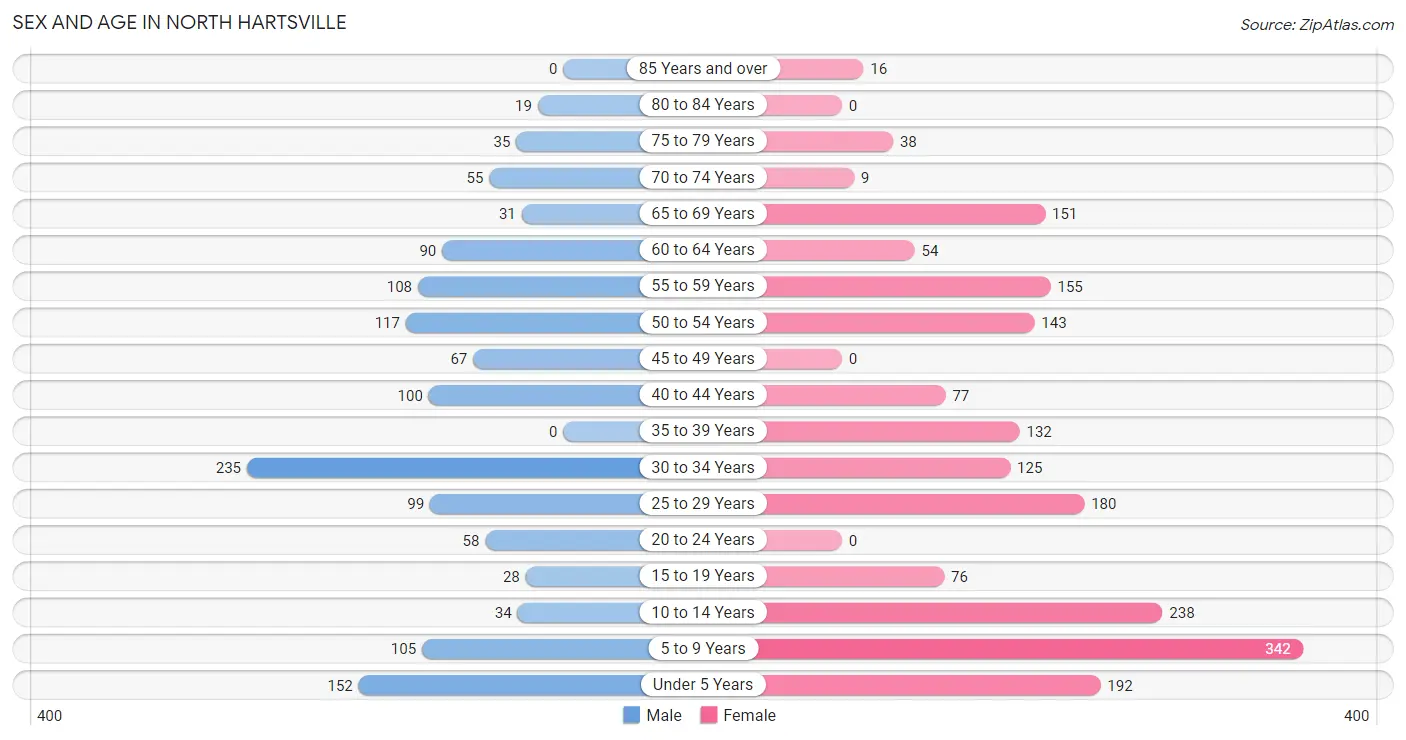
| Age Bracket | Male | Female |
| Under 5 Years | 152 (11.4%) | 192 (10.0%) |
| 5 to 9 Years | 105 (7.9%) | 342 (17.7%) |
| 10 to 14 Years | 34 (2.5%) | 238 (12.3%) |
| 15 to 19 Years | 28 (2.1%) | 76 (3.9%) |
| 20 to 24 Years | 58 (4.3%) | 0 (0.0%) |
| 25 to 29 Years | 99 (7.4%) | 180 (9.3%) |
| 30 to 34 Years | 235 (17.6%) | 125 (6.5%) |
| 35 to 39 Years | 0 (0.0%) | 132 (6.9%) |
| 40 to 44 Years | 100 (7.5%) | 77 (4.0%) |
| 45 to 49 Years | 67 (5.0%) | 0 (0.0%) |
| 50 to 54 Years | 117 (8.8%) | 143 (7.4%) |
| 55 to 59 Years | 108 (8.1%) | 155 (8.0%) |
| 60 to 64 Years | 90 (6.8%) | 54 (2.8%) |
| 65 to 69 Years | 31 (2.3%) | 151 (7.8%) |
| 70 to 74 Years | 55 (4.1%) | 9 (0.5%) |
| 75 to 79 Years | 35 (2.6%) | 38 (2.0%) |
| 80 to 84 Years | 19 (1.4%) | 0 (0.0%) |
| 85 Years and over | 0 (0.0%) | 16 (0.8%) |
| Total | 1,333 (100.0%) | 1,928 (100.0%) |
Families and Households in North Hartsville
Median Family Size in North Hartsville
The median family size in North Hartsville is 3.75 persons per family, with married-couple families (729 | 95.2%) accounting for the largest median family size of 3.83 persons per family. On the other hand, single female/mother families (32 | 4.2%) represent the smallest median family size with 2.00 persons per family.
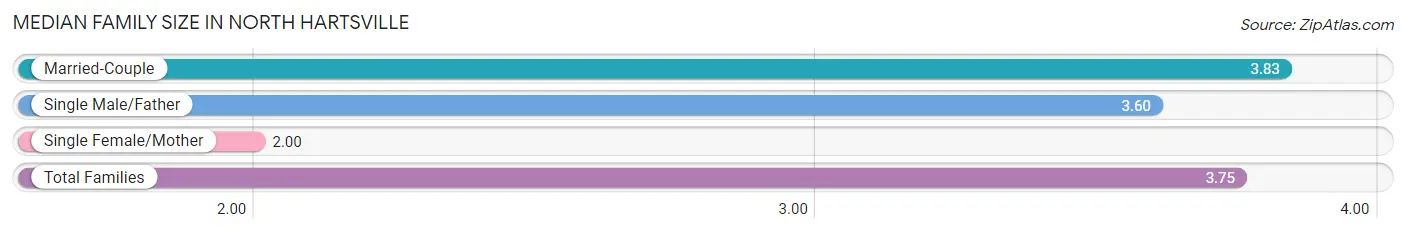
| Family Type | # Families | Family Size |
| Married-Couple | 729 (95.2%) | 3.83 |
| Single Male/Father | 5 (0.6%) | 3.60 |
| Single Female/Mother | 32 (4.2%) | 2.00 |
| Total Families | 766 (100.0%) | 3.75 |
Median Household Size in North Hartsville
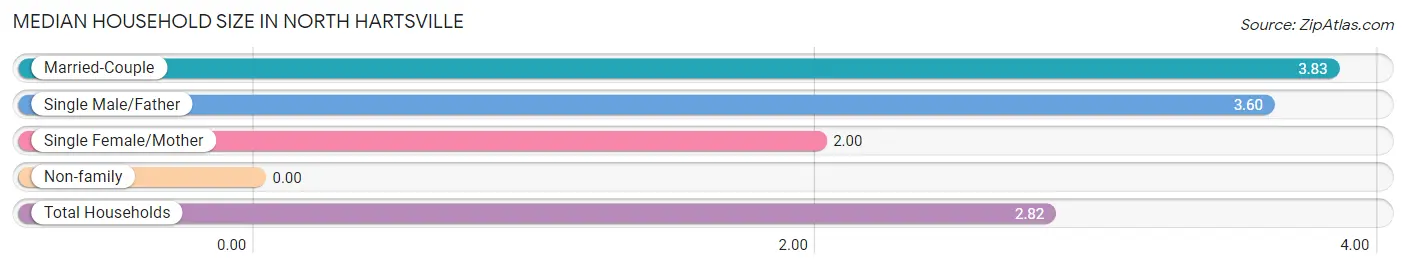
| Household Type | # Households | Household Size |
| Married-Couple | 729 (63.2%) | 3.83 |
| Single Male/Father | 5 (0.4%) | 3.60 |
| Single Female/Mother | 32 (2.8%) | 2.00 |
| Non-family | 388 (33.6%) | - |
| Total Households | 1,154 (100.0%) | 2.82 |
Household Size by Marriage Status in North Hartsville
Out of a total of 1,154 households in North Hartsville, 766 (66.4%) are family households, while 388 (33.6%) are nonfamily households. The most numerous type of family households are 3-person households, comprising 244, and the most common type of nonfamily households are 1-person households, comprising 388.
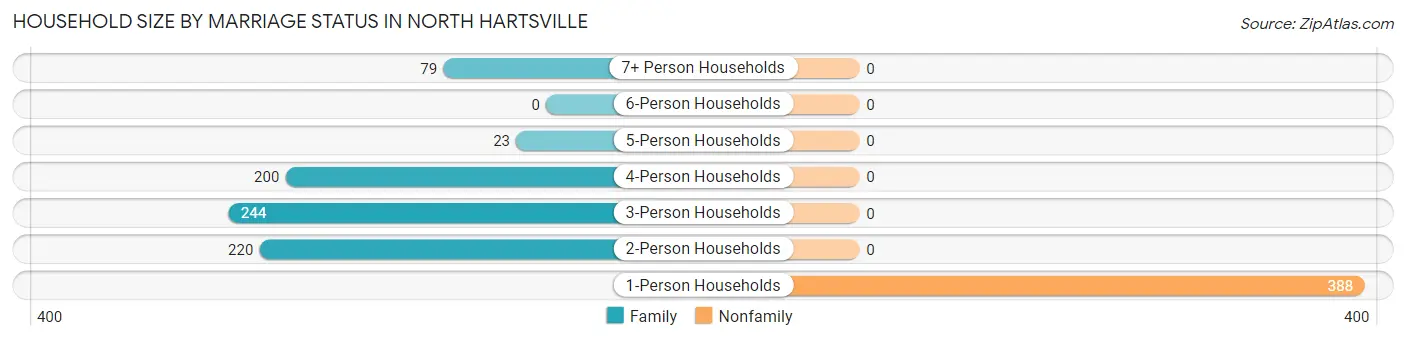
| Household Size | Family Households | Nonfamily Households |
| 1-Person Households | - | 388 (33.6%) |
| 2-Person Households | 220 (19.1%) | 0 (0.0%) |
| 3-Person Households | 244 (21.1%) | 0 (0.0%) |
| 4-Person Households | 200 (17.3%) | 0 (0.0%) |
| 5-Person Households | 23 (2.0%) | 0 (0.0%) |
| 6-Person Households | 0 (0.0%) | 0 (0.0%) |
| 7+ Person Households | 79 (6.9%) | 0 (0.0%) |
| Total | 766 (66.4%) | 388 (33.6%) |
Female Fertility in North Hartsville
Fertility by Age in North Hartsville
Average fertility rate in North Hartsville is 72.0 births per 1,000 women. Women in the age bracket of 20 to 34 years have the highest fertility rate with 151.0 births per 1,000 women. Women in the age bracket of 20 to 34 years acount for 100.0% of all women with births.
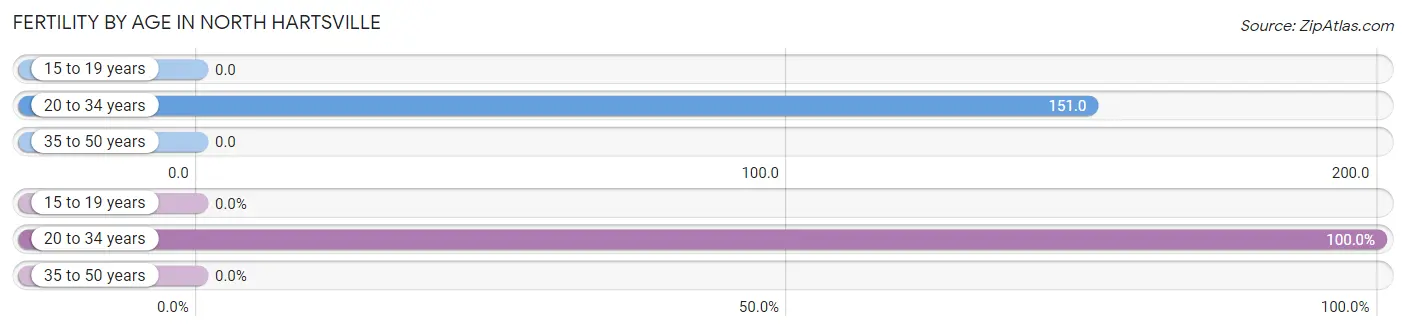
| Age Bracket | Women with Births | Births / 1,000 Women |
| 15 to 19 years | 0 (0.0%) | 0.0 |
| 20 to 34 years | 46 (100.0%) | 151.0 |
| 35 to 50 years | 0 (0.0%) | 0.0 |
| Total | 46 (100.0%) | 72.0 |
Fertility by Age by Marriage Status in North Hartsville
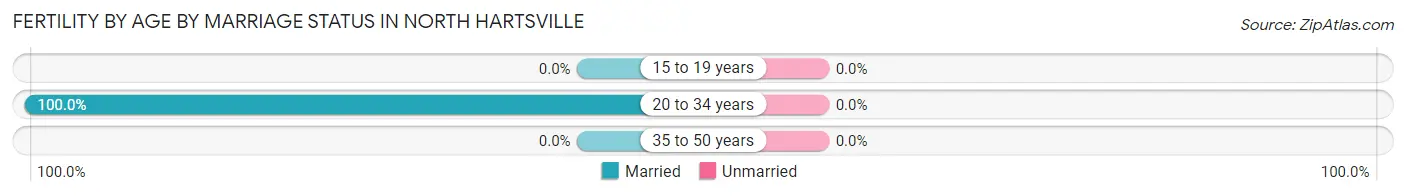
| Age Bracket | Married | Unmarried |
| 15 to 19 years | 0 (0.0%) | 0 (0.0%) |
| 20 to 34 years | 46 (100.0%) | 0 (0.0%) |
| 35 to 50 years | 0 (0.0%) | 0 (0.0%) |
| Total | 46 (100.0%) | 0 (0.0%) |
Fertility by Education in North Hartsville
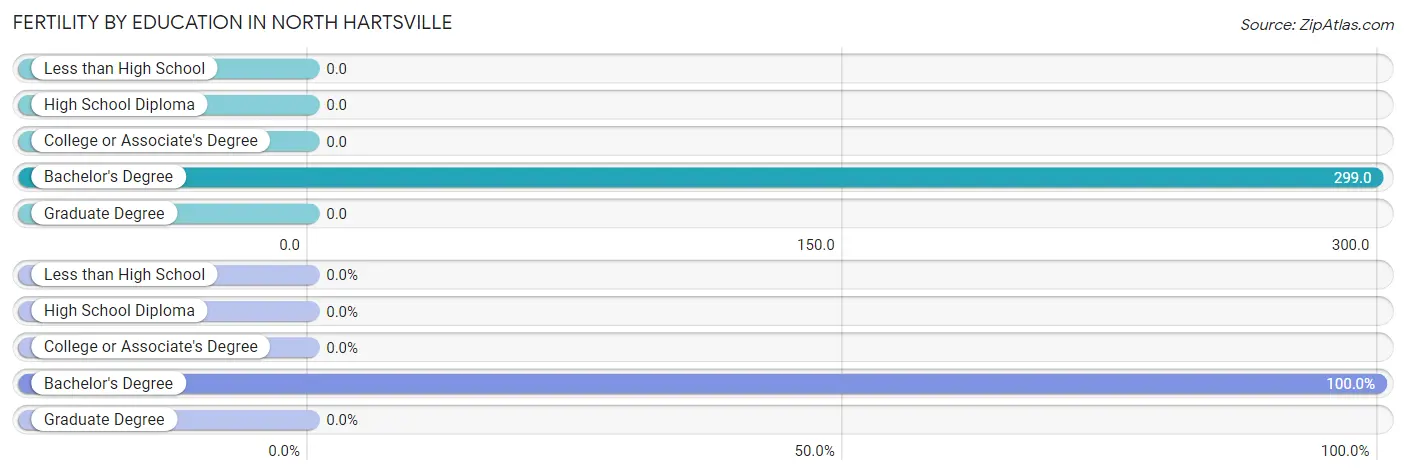
| Educational Attainment | Women with Births | Births / 1,000 Women |
| Less than High School | 0 (0.0%) | 0.0 |
| High School Diploma | 0 (0.0%) | 0.0 |
| College or Associate's Degree | 0 (0.0%) | 0.0 |
| Bachelor's Degree | 46 (100.0%) | 299.0 |
| Graduate Degree | 0 (0.0%) | 0.0 |
| Total | 46 (100.0%) | 72.0 |
Fertility by Education by Marriage Status in North Hartsville
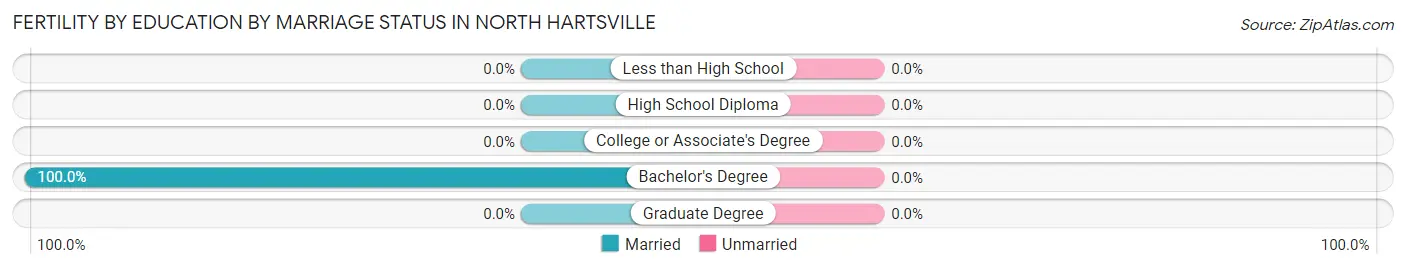
| Educational Attainment | Married | Unmarried |
| Less than High School | 0 (0.0%) | 0 (0.0%) |
| High School Diploma | 0 (0.0%) | 0 (0.0%) |
| College or Associate's Degree | 0 (0.0%) | 0 (0.0%) |
| Bachelor's Degree | 46 (100.0%) | 0 (0.0%) |
| Graduate Degree | 0 (0.0%) | 0 (0.0%) |
| Total | 46 (100.0%) | 0 (0.0%) |
Employment Characteristics in North Hartsville
Employment by Class of Employer in North Hartsville
Among the 1,664 employed individuals in North Hartsville, private company employees (1,091 | 65.6%), local government employees (306 | 18.4%), and state government employees (139 | 8.4%) make up the most common classes of employment.
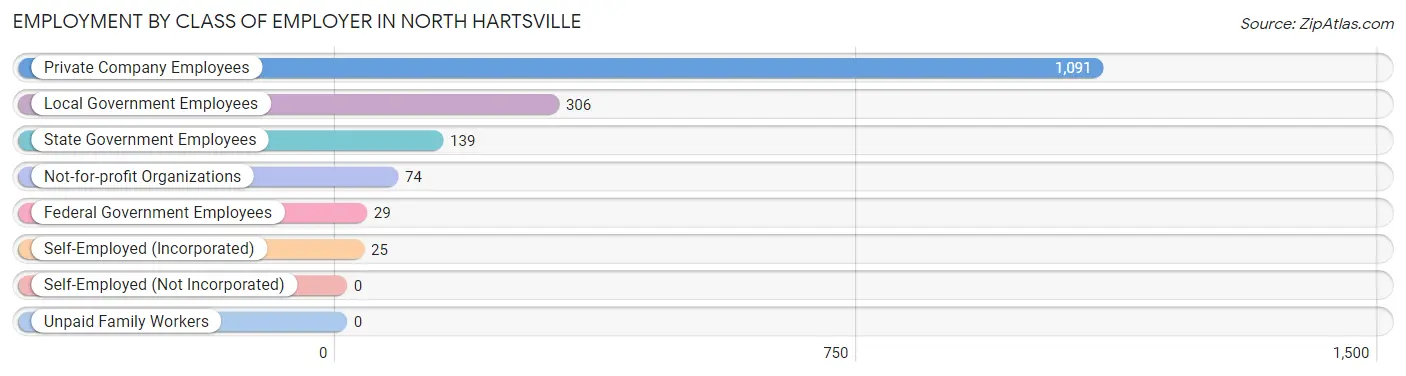
| Employer Class | # Employees | % Employees |
| Private Company Employees | 1,091 | 65.6% |
| Self-Employed (Incorporated) | 25 | 1.5% |
| Self-Employed (Not Incorporated) | 0 | 0.0% |
| Not-for-profit Organizations | 74 | 4.4% |
| Local Government Employees | 306 | 18.4% |
| State Government Employees | 139 | 8.4% |
| Federal Government Employees | 29 | 1.7% |
| Unpaid Family Workers | 0 | 0.0% |
| Total | 1,664 | 100.0% |
Employment Status by Age in North Hartsville
According to the labor force statistics for North Hartsville, out of the total population over 16 years of age (2,172), 77.3% or 1,679 individuals are in the labor force, with 0.9% or 15 of them unemployed. The age group with the highest labor force participation rate is 20 to 24 years, with 100.0% or 58 individuals in the labor force. Within the labor force, the 30 to 34 years age range has the highest percentage of unemployed individuals, with 4.3% or 15 of them being unemployed.
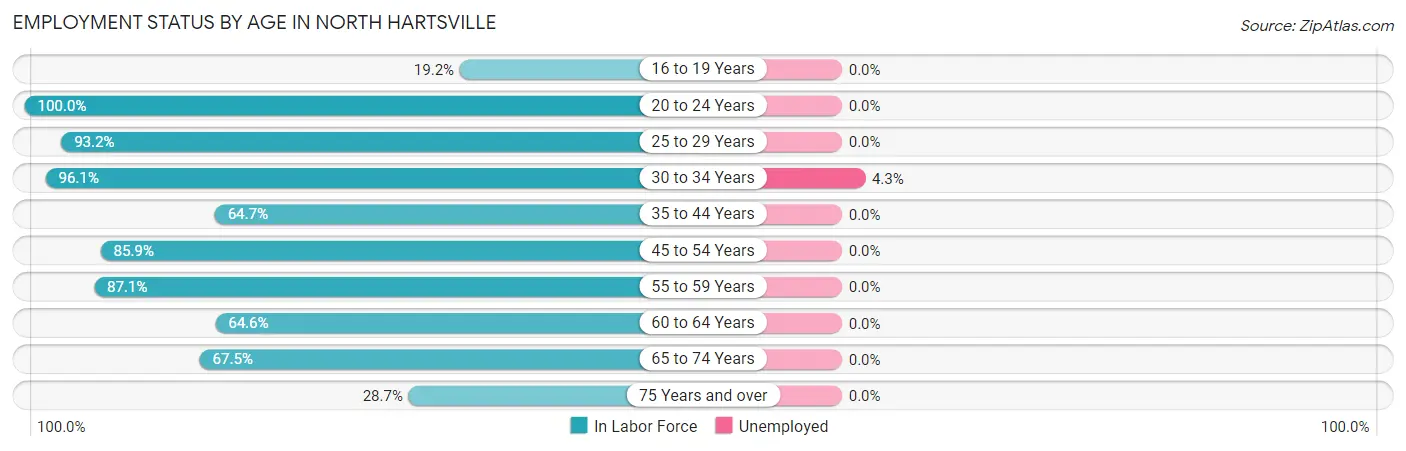
| Age Bracket | In Labor Force | Unemployed |
| 16 to 19 Years | 15 (19.2%) | 0 (0.0%) |
| 20 to 24 Years | 58 (100.0%) | 0 (0.0%) |
| 25 to 29 Years | 260 (93.2%) | 0 (0.0%) |
| 30 to 34 Years | 346 (96.1%) | 15 (4.3%) |
| 35 to 44 Years | 200 (64.7%) | 0 (0.0%) |
| 45 to 54 Years | 281 (85.9%) | 0 (0.0%) |
| 55 to 59 Years | 229 (87.1%) | 0 (0.0%) |
| 60 to 64 Years | 93 (64.6%) | 0 (0.0%) |
| 65 to 74 Years | 166 (67.5%) | 0 (0.0%) |
| 75 Years and over | 31 (28.7%) | 0 (0.0%) |
| Total | 1,679 (77.3%) | 15 (0.9%) |
Employment Status by Educational Attainment in North Hartsville
According to labor force statistics for North Hartsville, 83.8% of individuals (1,410) out of the total population between 25 and 64 years of age (1,682) are in the labor force, with 1.1% or 16 of them being unemployed. The group with the highest labor force participation rate are those with the educational attainment of bachelor's degree or higher, with 87.7% or 634 individuals in the labor force. Within the labor force, individuals with high school diploma education have the highest percentage of unemployment, with 7.4% or 15 of them being unemployed.
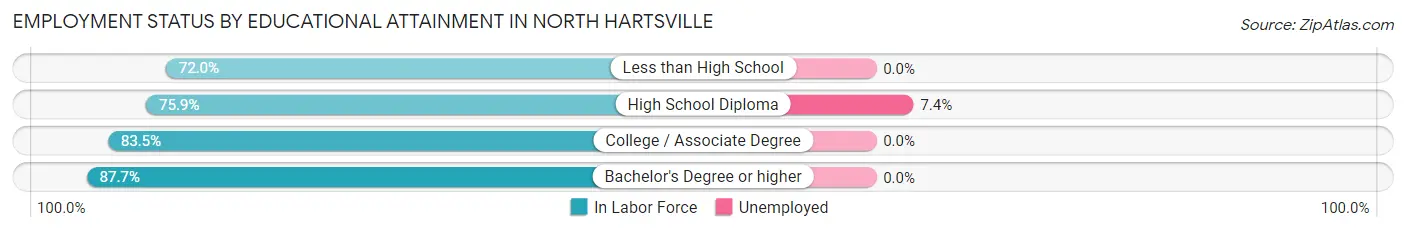
| Educational Attainment | In Labor Force | Unemployed |
| Less than High School | 36 (72.0%) | 0 (0.0%) |
| High School Diploma | 202 (75.9%) | 20 (7.4%) |
| College / Associate Degree | 537 (83.5%) | 0 (0.0%) |
| Bachelor's Degree or higher | 634 (87.7%) | 0 (0.0%) |
| Total | 1,410 (83.8%) | 19 (1.1%) |
Employment Occupations by Sex in North Hartsville
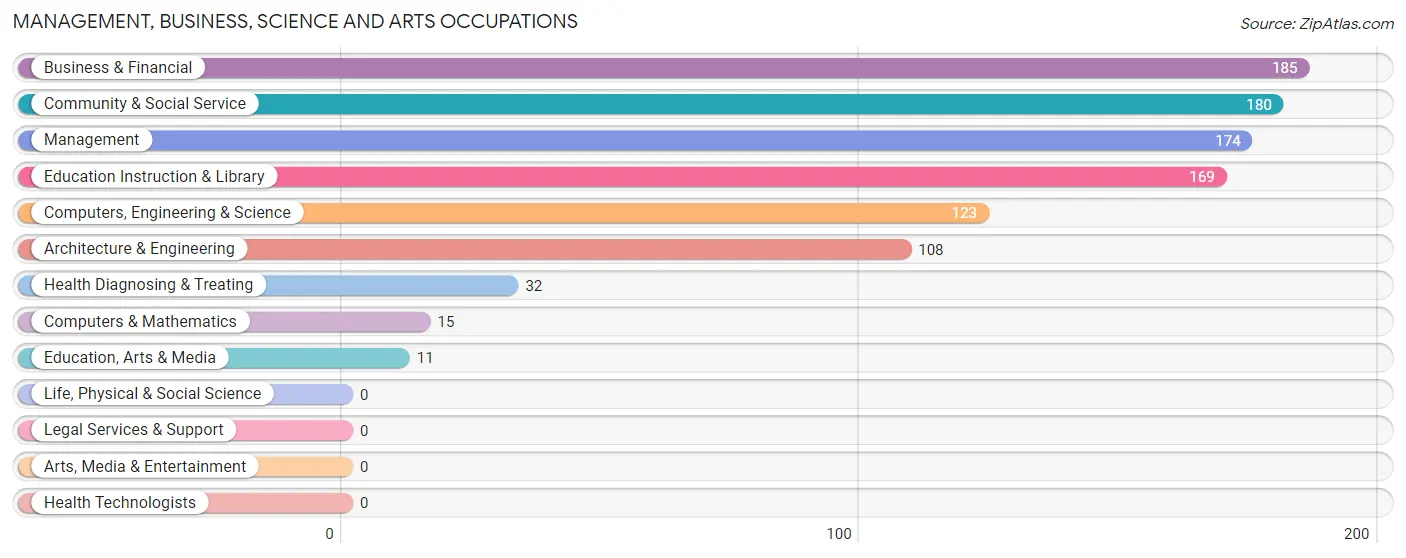
Management, Business, Science and Arts Occupations
The most common Management, Business, Science and Arts occupations in North Hartsville are Business & Financial (185 | 11.1%), Community & Social Service (180 | 10.8%), Management (174 | 10.5%), Education Instruction & Library (169 | 10.2%), and Computers, Engineering & Science (123 | 7.4%).
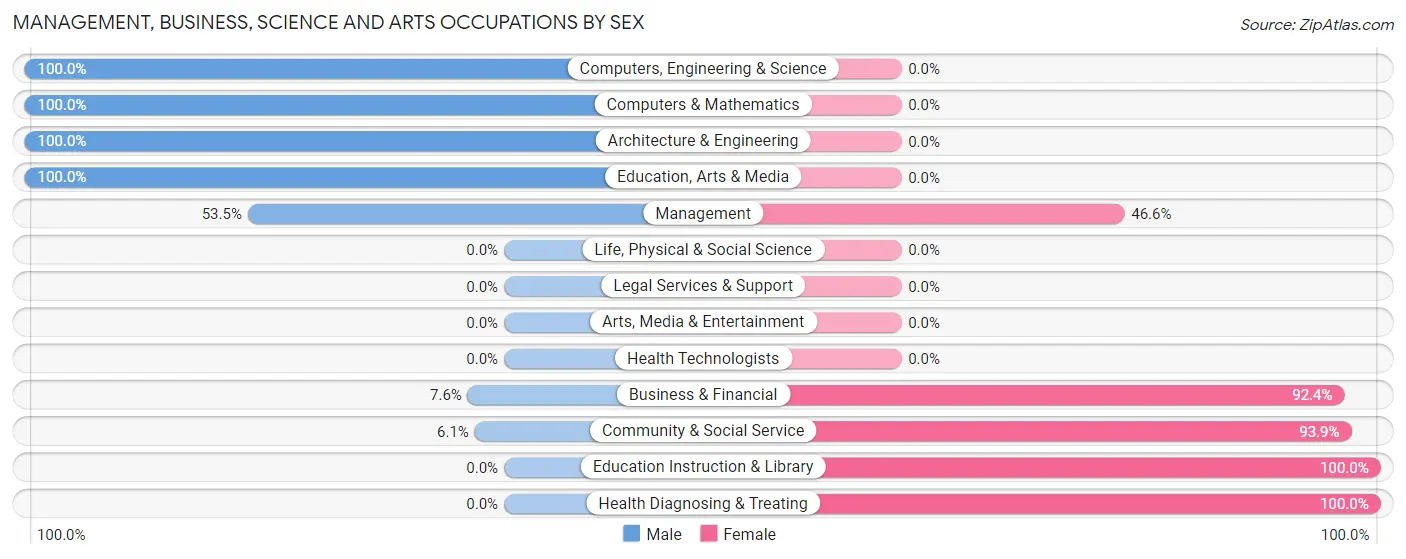
Management, Business, Science and Arts Occupations by Sex
Within the Management, Business, Science and Arts occupations in North Hartsville, the most male-oriented occupations are Computers, Engineering & Science (100.0%), Computers & Mathematics (100.0%), and Architecture & Engineering (100.0%), while the most female-oriented occupations are Education Instruction & Library (100.0%), Health Diagnosing & Treating (100.0%), and Community & Social Service (93.9%).
| Occupation | Male | Female |
| Management | 93 (53.4%) | 81 (46.6%) |
| Business & Financial | 14 (7.6%) | 171 (92.4%) |
| Computers, Engineering & Science | 123 (100.0%) | 0 (0.0%) |
| Computers & Mathematics | 15 (100.0%) | 0 (0.0%) |
| Architecture & Engineering | 108 (100.0%) | 0 (0.0%) |
| Life, Physical & Social Science | 0 (0.0%) | 0 (0.0%) |
| Community & Social Service | 11 (6.1%) | 169 (93.9%) |
| Education, Arts & Media | 11 (100.0%) | 0 (0.0%) |
| Legal Services & Support | 0 (0.0%) | 0 (0.0%) |
| Education Instruction & Library | 0 (0.0%) | 169 (100.0%) |
| Arts, Media & Entertainment | 0 (0.0%) | 0 (0.0%) |
| Health Diagnosing & Treating | 0 (0.0%) | 32 (100.0%) |
| Health Technologists | 0 (0.0%) | 0 (0.0%) |
| Total (Category) | 241 (34.7%) | 453 (65.3%) |
| Total (Overall) | 853 (51.3%) | 811 (48.7%) |
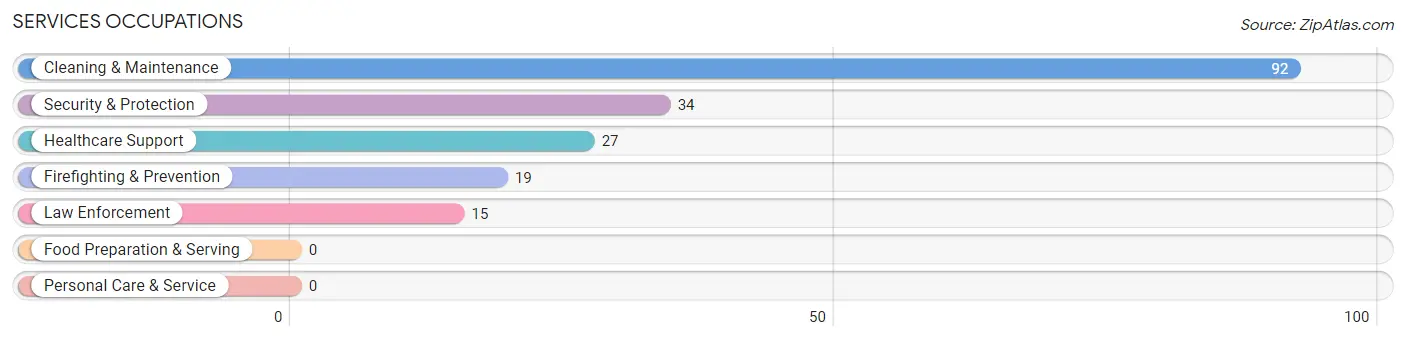
Services Occupations
The most common Services occupations in North Hartsville are Cleaning & Maintenance (92 | 5.5%), Security & Protection (34 | 2.0%), Healthcare Support (27 | 1.6%), Firefighting & Prevention (19 | 1.1%), and Law Enforcement (15 | 0.9%).
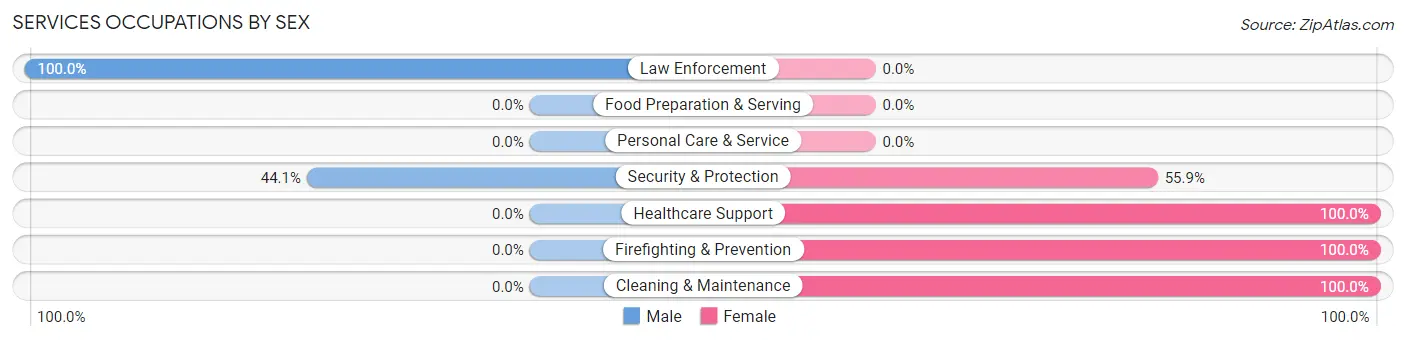
Services Occupations by Sex
Within the Services occupations in North Hartsville, the most male-oriented occupations are Law Enforcement (100.0%), and Security & Protection (44.1%), while the most female-oriented occupations are Healthcare Support (100.0%), Firefighting & Prevention (100.0%), and Cleaning & Maintenance (100.0%).
| Occupation | Male | Female |
| Healthcare Support | 0 (0.0%) | 27 (100.0%) |
| Security & Protection | 15 (44.1%) | 19 (55.9%) |
| Firefighting & Prevention | 0 (0.0%) | 19 (100.0%) |
| Law Enforcement | 15 (100.0%) | 0 (0.0%) |
| Food Preparation & Serving | 0 (0.0%) | 0 (0.0%) |
| Cleaning & Maintenance | 0 (0.0%) | 92 (100.0%) |
| Personal Care & Service | 0 (0.0%) | 0 (0.0%) |
| Total (Category) | 15 (9.8%) | 138 (90.2%) |
| Total (Overall) | 853 (51.3%) | 811 (48.7%) |
Sales and Office Occupations
The most common Sales and Office occupations in North Hartsville are Sales & Related (118 | 7.1%), and Office & Administration (73 | 4.4%).
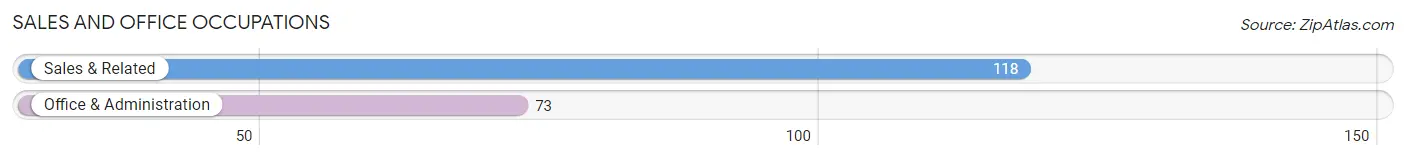
Sales and Office Occupations by Sex
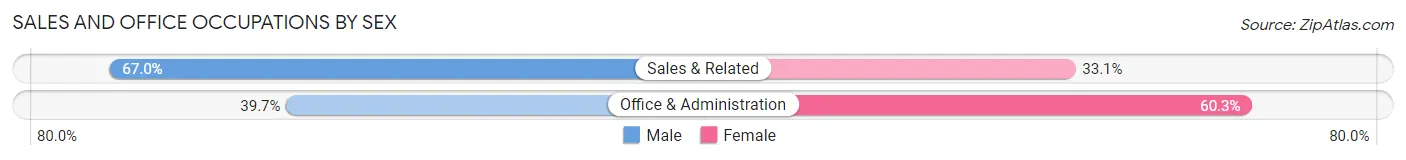
| Occupation | Male | Female |
| Sales & Related | 79 (66.9%) | 39 (33.1%) |
| Office & Administration | 29 (39.7%) | 44 (60.3%) |
| Total (Category) | 108 (56.5%) | 83 (43.5%) |
| Total (Overall) | 853 (51.3%) | 811 (48.7%) |
Natural Resources, Construction and Maintenance Occupations
The most common Natural Resources, Construction and Maintenance occupations in North Hartsville are Installation, Maintenance & Repair (131 | 7.9%), and Construction & Extraction (30 | 1.8%).
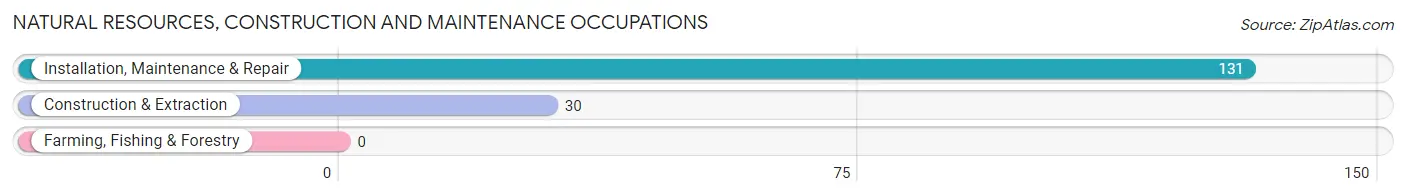
Natural Resources, Construction and Maintenance Occupations by Sex
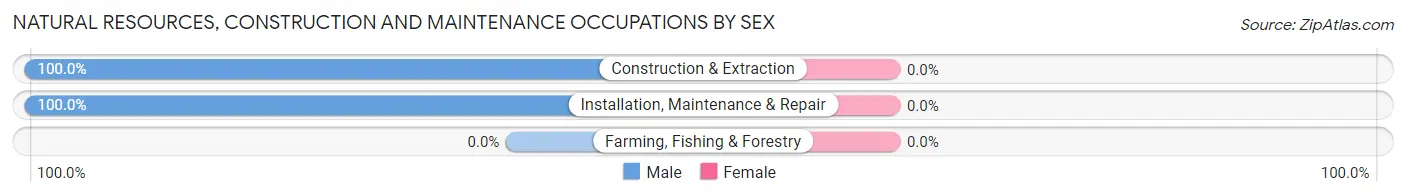
| Occupation | Male | Female |
| Farming, Fishing & Forestry | 0 (0.0%) | 0 (0.0%) |
| Construction & Extraction | 30 (100.0%) | 0 (0.0%) |
| Installation, Maintenance & Repair | 131 (100.0%) | 0 (0.0%) |
| Total (Category) | 161 (100.0%) | 0 (0.0%) |
| Total (Overall) | 853 (51.3%) | 811 (48.7%) |
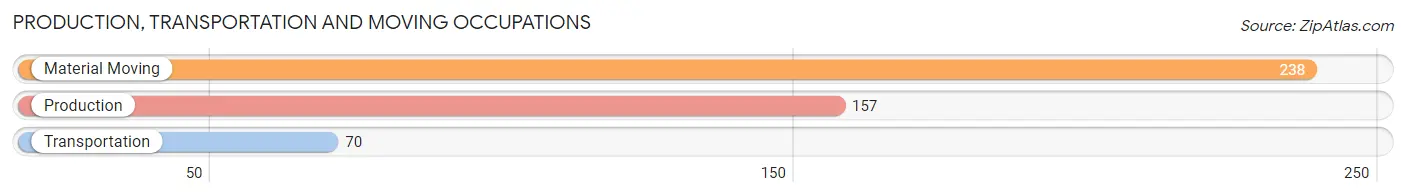
Production, Transportation and Moving Occupations
The most common Production, Transportation and Moving occupations in North Hartsville are Material Moving (238 | 14.3%), Production (157 | 9.4%), and Transportation (70 | 4.2%).
Production, Transportation and Moving Occupations by Sex
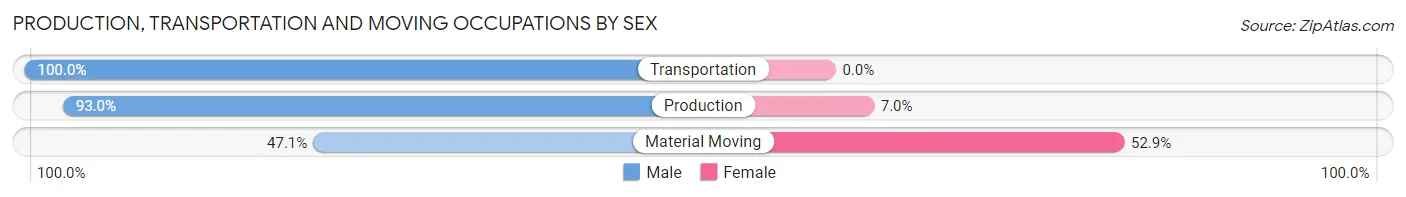
| Occupation | Male | Female |
| Production | 146 (93.0%) | 11 (7.0%) |
| Transportation | 70 (100.0%) | 0 (0.0%) |
| Material Moving | 112 (47.1%) | 126 (52.9%) |
| Total (Category) | 328 (70.5%) | 137 (29.5%) |
| Total (Overall) | 853 (51.3%) | 811 (48.7%) |
Employment Industries by Sex in North Hartsville
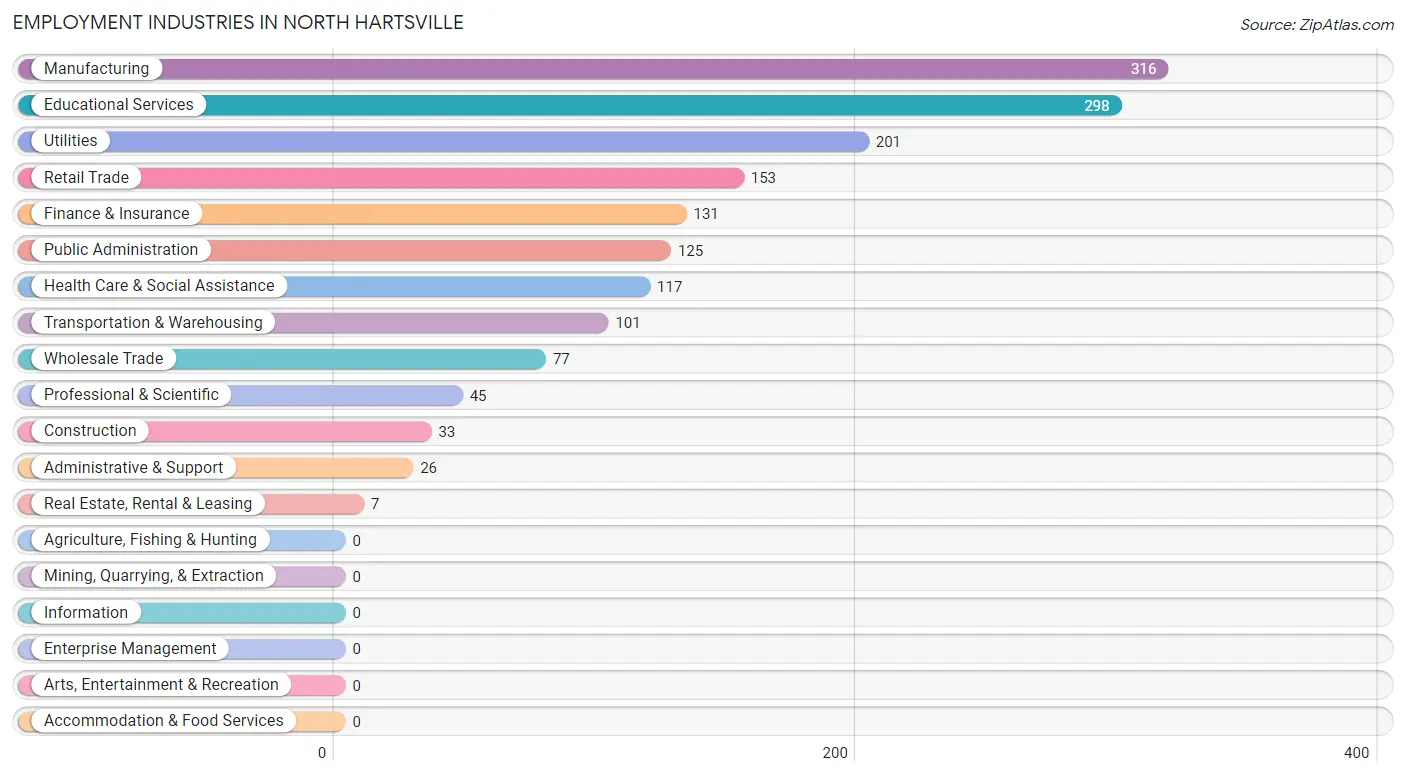
Employment Industries in North Hartsville
The major employment industries in North Hartsville include Manufacturing (316 | 19.0%), Educational Services (298 | 17.9%), Utilities (201 | 12.1%), Retail Trade (153 | 9.2%), and Finance & Insurance (131 | 7.9%).
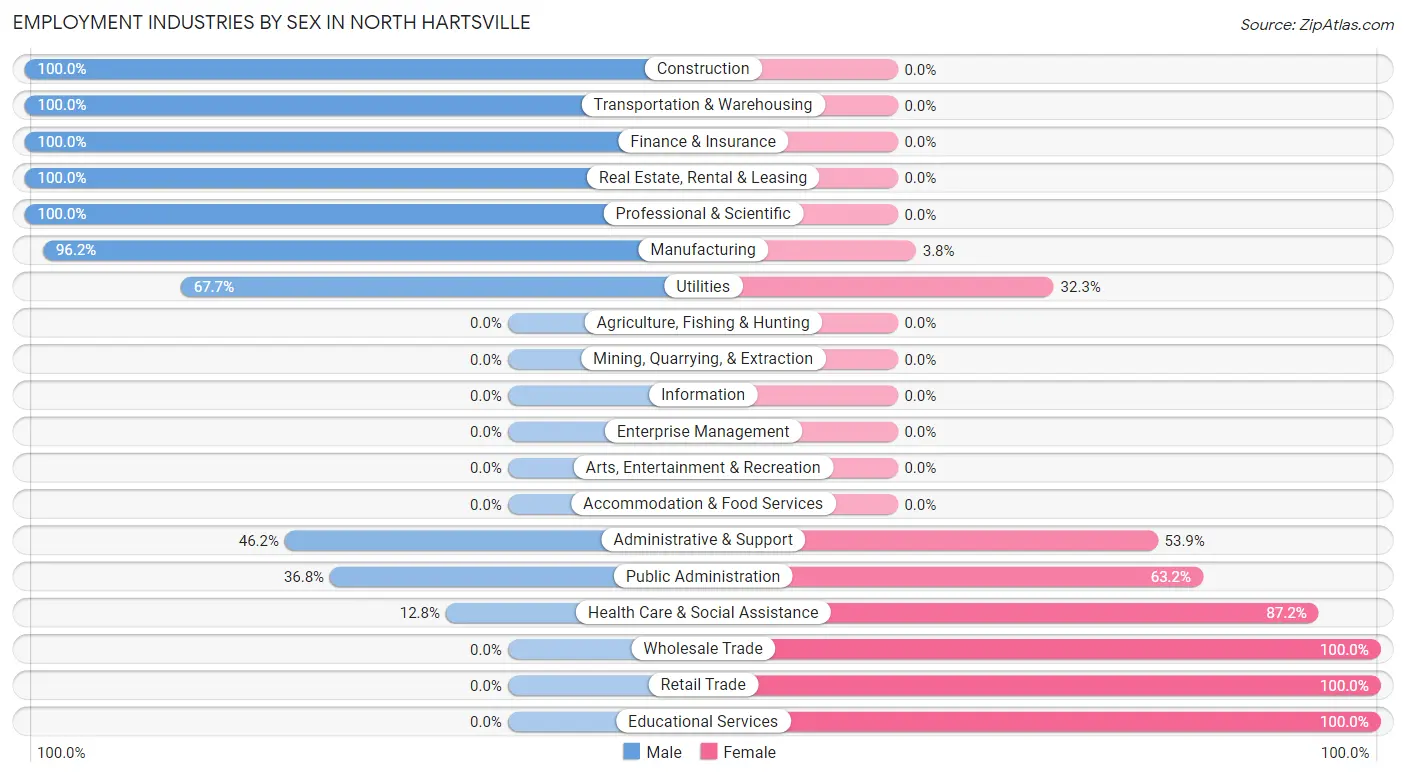
Employment Industries by Sex in North Hartsville
The North Hartsville industries that see more men than women are Construction (100.0%), Transportation & Warehousing (100.0%), and Finance & Insurance (100.0%), whereas the industries that tend to have a higher number of women are Wholesale Trade (100.0%), Retail Trade (100.0%), and Educational Services (100.0%).
| Industry | Male | Female |
| Agriculture, Fishing & Hunting | 0 (0.0%) | 0 (0.0%) |
| Mining, Quarrying, & Extraction | 0 (0.0%) | 0 (0.0%) |
| Construction | 33 (100.0%) | 0 (0.0%) |
| Manufacturing | 304 (96.2%) | 12 (3.8%) |
| Wholesale Trade | 0 (0.0%) | 77 (100.0%) |
| Retail Trade | 0 (0.0%) | 153 (100.0%) |
| Transportation & Warehousing | 101 (100.0%) | 0 (0.0%) |
| Utilities | 136 (67.7%) | 65 (32.3%) |
| Information | 0 (0.0%) | 0 (0.0%) |
| Finance & Insurance | 131 (100.0%) | 0 (0.0%) |
| Real Estate, Rental & Leasing | 7 (100.0%) | 0 (0.0%) |
| Professional & Scientific | 45 (100.0%) | 0 (0.0%) |
| Enterprise Management | 0 (0.0%) | 0 (0.0%) |
| Administrative & Support | 12 (46.2%) | 14 (53.8%) |
| Educational Services | 0 (0.0%) | 298 (100.0%) |
| Health Care & Social Assistance | 15 (12.8%) | 102 (87.2%) |
| Arts, Entertainment & Recreation | 0 (0.0%) | 0 (0.0%) |
| Accommodation & Food Services | 0 (0.0%) | 0 (0.0%) |
| Public Administration | 46 (36.8%) | 79 (63.2%) |
| Total | 853 (51.3%) | 811 (48.7%) |
Education in North Hartsville
School Enrollment in North Hartsville
The most common levels of schooling among the 1,052 students in North Hartsville are elementary school (540 | 51.3%), college / undergraduate (204 | 19.4%), and nursery / preschool (127 | 12.1%).
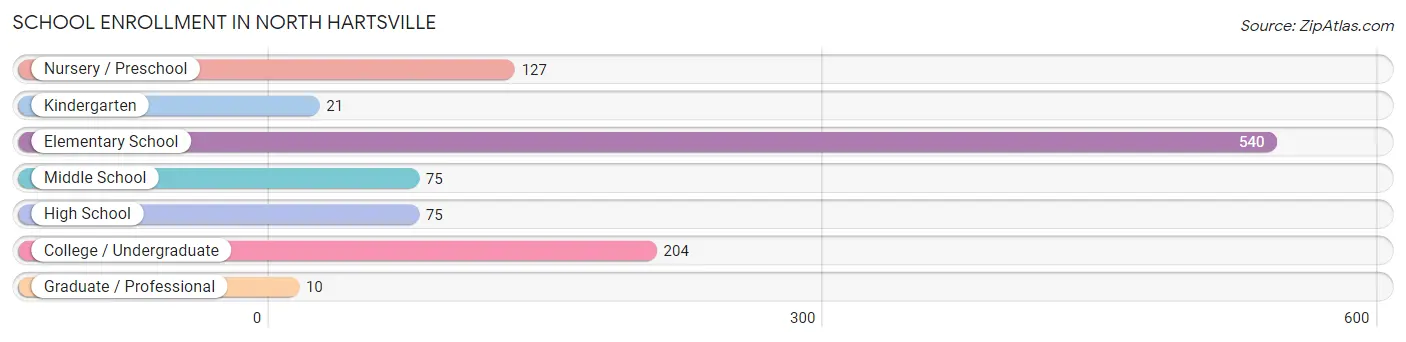
| School Level | # Students | % Students |
| Nursery / Preschool | 127 | 12.1% |
| Kindergarten | 21 | 2.0% |
| Elementary School | 540 | 51.3% |
| Middle School | 75 | 7.1% |
| High School | 75 | 7.1% |
| College / Undergraduate | 204 | 19.4% |
| Graduate / Professional | 10 | 0.9% |
| Total | 1,052 | 100.0% |
School Enrollment by Age by Funding Source in North Hartsville
Out of a total of 1,052 students who are enrolled in schools in North Hartsville, 151 (14.4%) attend a private institution, while the remaining 901 (85.6%) are enrolled in public schools. The age group of 5 to 9 year old has the highest likelihood of being enrolled in private schools, with 140 (31.3% in the age bracket) enrolled. Conversely, the age group of 3 to 4 year olds has the lowest likelihood of being enrolled in a private school, with 69 (100.0% in the age bracket) attending a public institution.
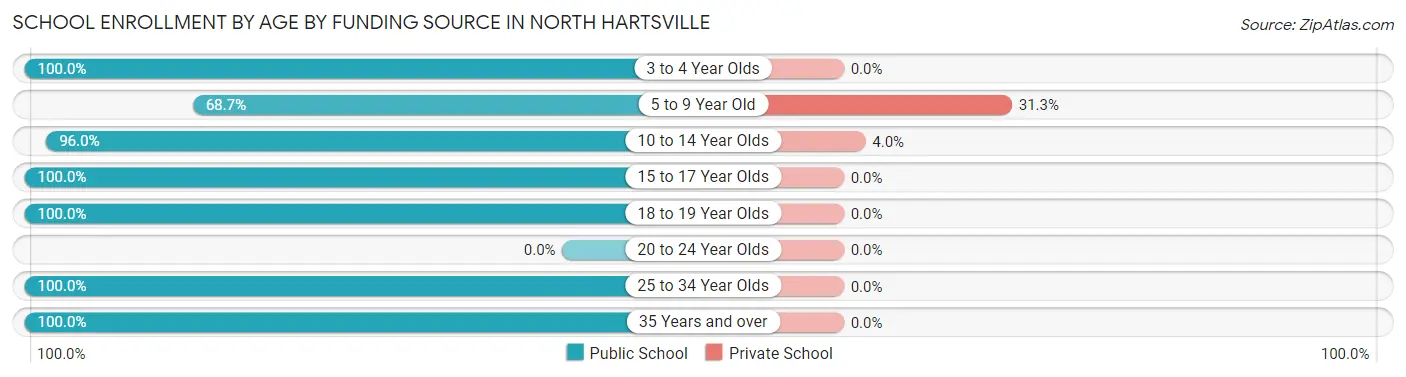
| Age Bracket | Public School | Private School |
| 3 to 4 Year Olds | 69 (100.0%) | 0 (0.0%) |
| 5 to 9 Year Old | 307 (68.7%) | 140 (31.3%) |
| 10 to 14 Year Olds | 261 (96.0%) | 11 (4.0%) |
| 15 to 17 Year Olds | 41 (100.0%) | 0 (0.0%) |
| 18 to 19 Year Olds | 46 (100.0%) | 0 (0.0%) |
| 20 to 24 Year Olds | 0 (0.0%) | 0 (0.0%) |
| 25 to 34 Year Olds | 128 (100.0%) | 0 (0.0%) |
| 35 Years and over | 49 (100.0%) | 0 (0.0%) |
| Total | 901 (85.6%) | 151 (14.4%) |
Educational Attainment by Field of Study in North Hartsville
Physical & health sciences (152 | 21.0%), business (141 | 19.5%), engineering (123 | 17.0%), education (103 | 14.2%), and social sciences (60 | 8.3%) are the most common fields of study among 723 individuals in North Hartsville who have obtained a bachelor's degree or higher.
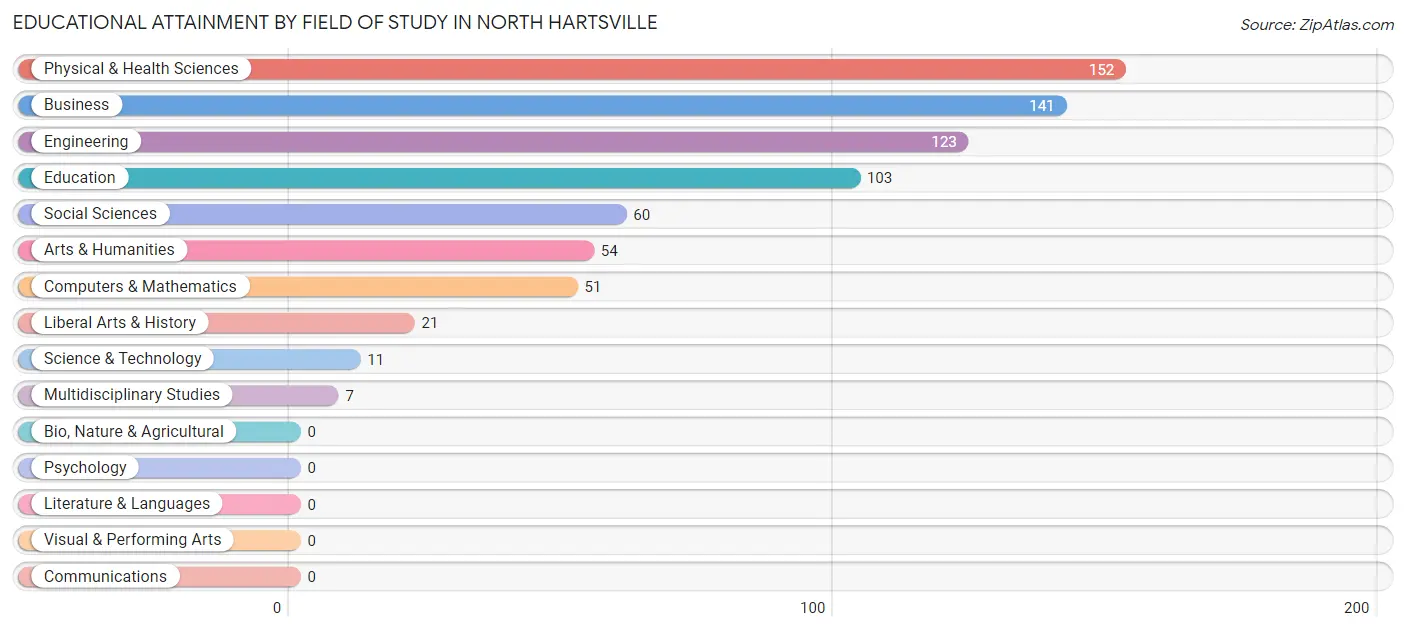
| Field of Study | # Graduates | % Graduates |
| Computers & Mathematics | 51 | 7.0% |
| Bio, Nature & Agricultural | 0 | 0.0% |
| Physical & Health Sciences | 152 | 21.0% |
| Psychology | 0 | 0.0% |
| Social Sciences | 60 | 8.3% |
| Engineering | 123 | 17.0% |
| Multidisciplinary Studies | 7 | 1.0% |
| Science & Technology | 11 | 1.5% |
| Business | 141 | 19.5% |
| Education | 103 | 14.2% |
| Literature & Languages | 0 | 0.0% |
| Liberal Arts & History | 21 | 2.9% |
| Visual & Performing Arts | 0 | 0.0% |
| Communications | 0 | 0.0% |
| Arts & Humanities | 54 | 7.5% |
| Total | 723 | 100.0% |
Transportation & Commute in North Hartsville
Vehicle Availability by Sex in North Hartsville
The most prevalent vehicle ownership categories in North Hartsville are males with 2 vehicles (393, accounting for 46.1%) and females with 2 vehicles (443, making up 48.5%).
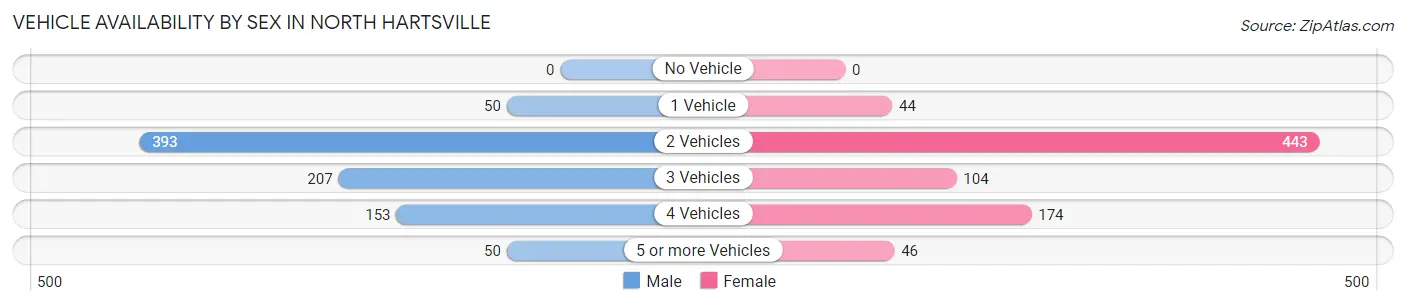
| Vehicles Available | Male | Female |
| No Vehicle | 0 (0.0%) | 0 (0.0%) |
| 1 Vehicle | 50 (5.9%) | 44 (5.4%) |
| 2 Vehicles | 393 (46.1%) | 443 (54.6%) |
| 3 Vehicles | 207 (24.3%) | 104 (12.8%) |
| 4 Vehicles | 153 (17.9%) | 174 (21.4%) |
| 5 or more Vehicles | 50 (5.9%) | 46 (5.7%) |
| Total | 853 (100.0%) | 811 (100.0%) |
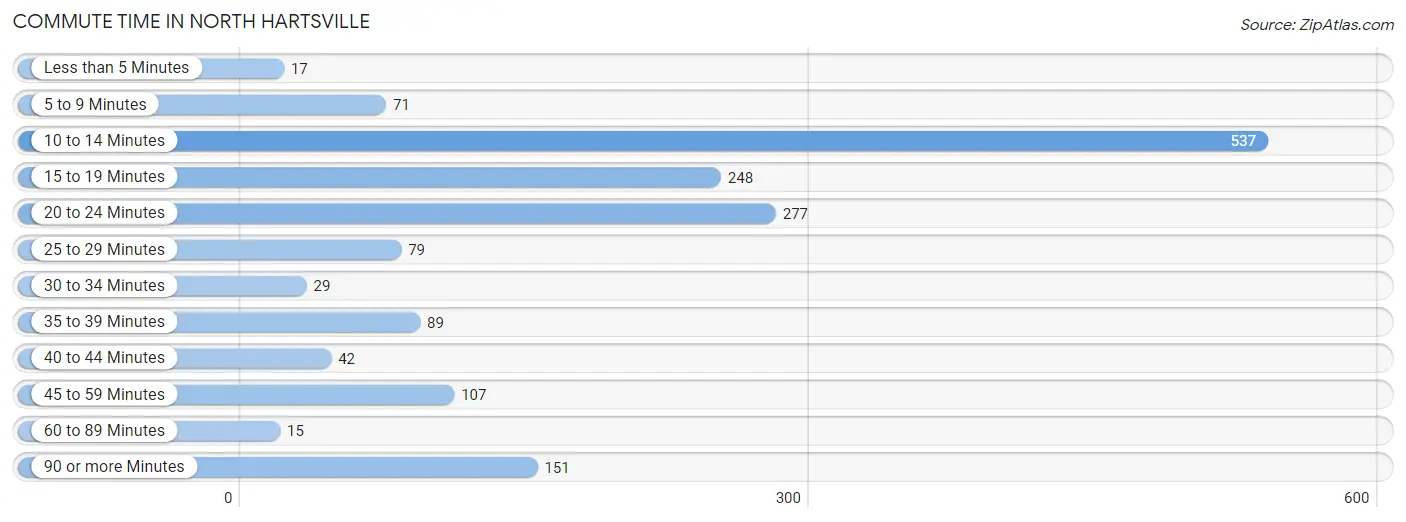
Commute Time in North Hartsville
The most frequently occuring commute durations in North Hartsville are 10 to 14 minutes (537 commuters, 32.3%), 20 to 24 minutes (277 commuters, 16.7%), and 15 to 19 minutes (248 commuters, 14.9%).
| Commute Time | # Commuters | % Commuters |
| Less than 5 Minutes | 17 | 1.0% |
| 5 to 9 Minutes | 71 | 4.3% |
| 10 to 14 Minutes | 537 | 32.3% |
| 15 to 19 Minutes | 248 | 14.9% |
| 20 to 24 Minutes | 277 | 16.7% |
| 25 to 29 Minutes | 79 | 4.8% |
| 30 to 34 Minutes | 29 | 1.7% |
| 35 to 39 Minutes | 89 | 5.3% |
| 40 to 44 Minutes | 42 | 2.5% |
| 45 to 59 Minutes | 107 | 6.4% |
| 60 to 89 Minutes | 15 | 0.9% |
| 90 or more Minutes | 151 | 9.1% |
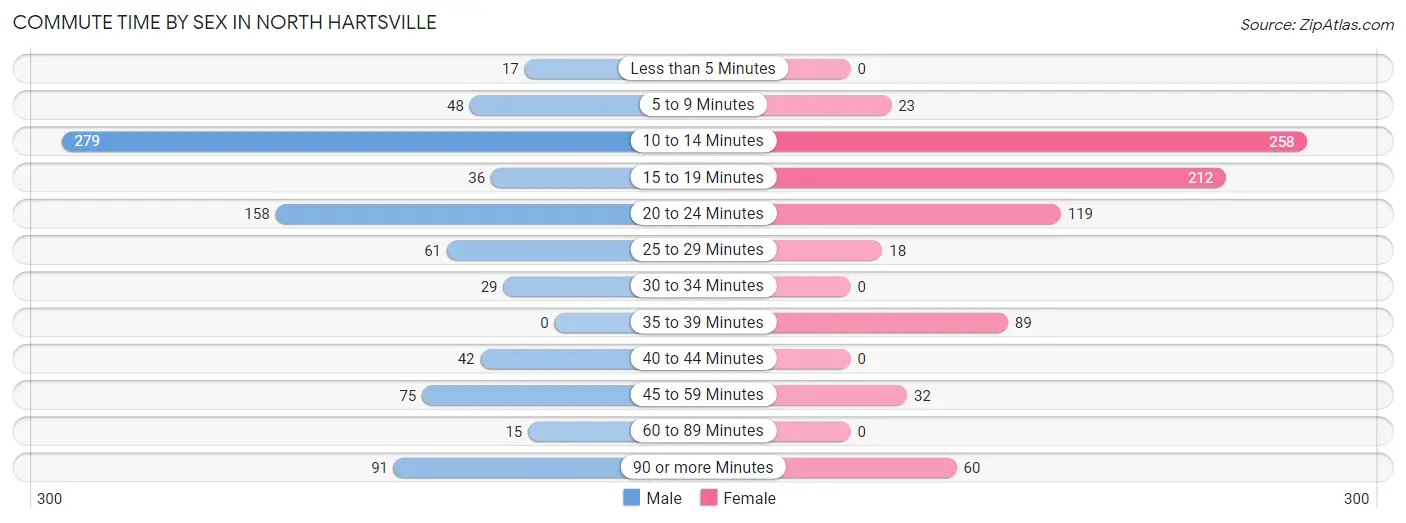
Commute Time by Sex in North Hartsville
The most common commute times in North Hartsville are 10 to 14 minutes (279 commuters, 32.8%) for males and 10 to 14 minutes (258 commuters, 31.8%) for females.
| Commute Time | Male | Female |
| Less than 5 Minutes | 17 (2.0%) | 0 (0.0%) |
| 5 to 9 Minutes | 48 (5.6%) | 23 (2.8%) |
| 10 to 14 Minutes | 279 (32.8%) | 258 (31.8%) |
| 15 to 19 Minutes | 36 (4.2%) | 212 (26.1%) |
| 20 to 24 Minutes | 158 (18.6%) | 119 (14.7%) |
| 25 to 29 Minutes | 61 (7.2%) | 18 (2.2%) |
| 30 to 34 Minutes | 29 (3.4%) | 0 (0.0%) |
| 35 to 39 Minutes | 0 (0.0%) | 89 (11.0%) |
| 40 to 44 Minutes | 42 (4.9%) | 0 (0.0%) |
| 45 to 59 Minutes | 75 (8.8%) | 32 (4.0%) |
| 60 to 89 Minutes | 15 (1.8%) | 0 (0.0%) |
| 90 or more Minutes | 91 (10.7%) | 60 (7.4%) |
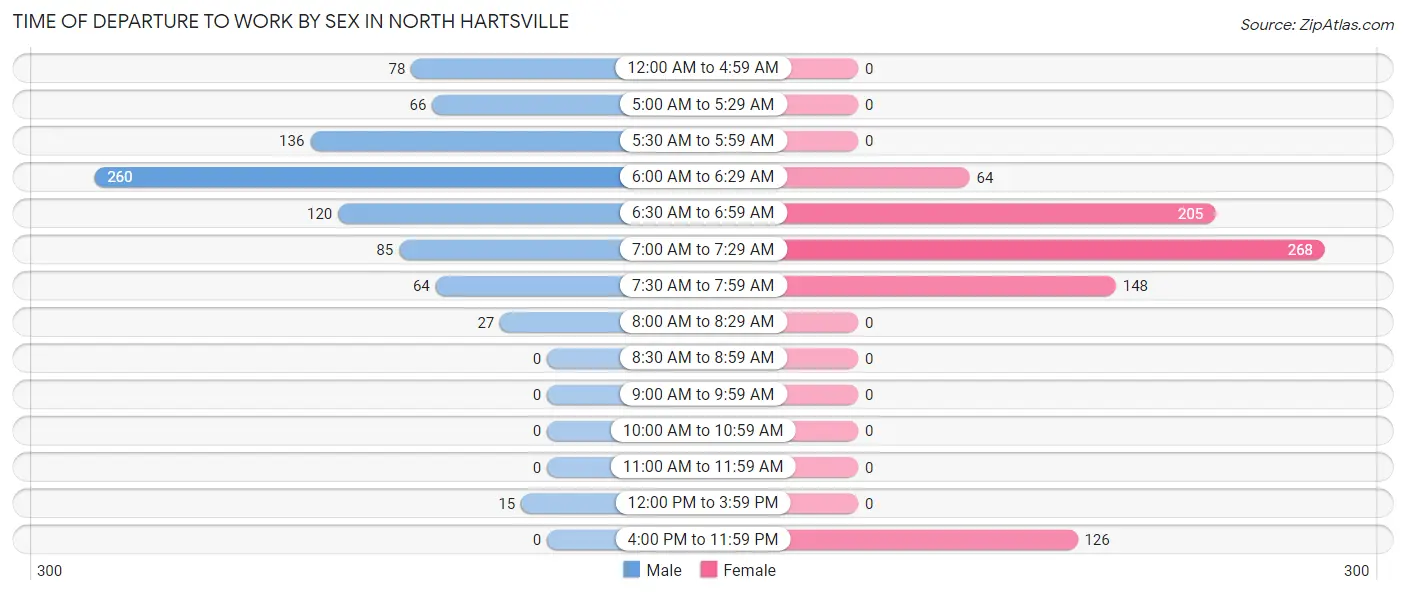
Time of Departure to Work by Sex in North Hartsville
The most frequent times of departure to work in North Hartsville are 6:00 AM to 6:29 AM (260, 30.5%) for males and 7:00 AM to 7:29 AM (268, 33.1%) for females.
| Time of Departure | Male | Female |
| 12:00 AM to 4:59 AM | 78 (9.2%) | 0 (0.0%) |
| 5:00 AM to 5:29 AM | 66 (7.8%) | 0 (0.0%) |
| 5:30 AM to 5:59 AM | 136 (16.0%) | 0 (0.0%) |
| 6:00 AM to 6:29 AM | 260 (30.5%) | 64 (7.9%) |
| 6:30 AM to 6:59 AM | 120 (14.1%) | 205 (25.3%) |
| 7:00 AM to 7:29 AM | 85 (10.0%) | 268 (33.1%) |
| 7:30 AM to 7:59 AM | 64 (7.5%) | 148 (18.2%) |
| 8:00 AM to 8:29 AM | 27 (3.2%) | 0 (0.0%) |
| 8:30 AM to 8:59 AM | 0 (0.0%) | 0 (0.0%) |
| 9:00 AM to 9:59 AM | 0 (0.0%) | 0 (0.0%) |
| 10:00 AM to 10:59 AM | 0 (0.0%) | 0 (0.0%) |
| 11:00 AM to 11:59 AM | 0 (0.0%) | 0 (0.0%) |
| 12:00 PM to 3:59 PM | 15 (1.8%) | 0 (0.0%) |
| 4:00 PM to 11:59 PM | 0 (0.0%) | 126 (15.5%) |
| Total | 851 (100.0%) | 811 (100.0%) |
Housing Occupancy in North Hartsville
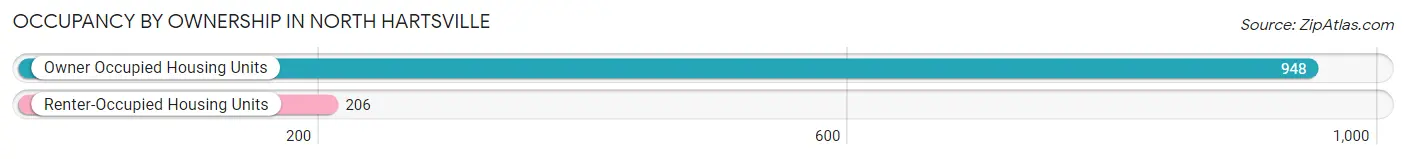
Occupancy by Ownership in North Hartsville
Of the total 1,154 dwellings in North Hartsville, owner-occupied units account for 948 (82.2%), while renter-occupied units make up 206 (17.8%).
| Occupancy | # Housing Units | % Housing Units |
| Owner Occupied Housing Units | 948 | 82.2% |
| Renter-Occupied Housing Units | 206 | 17.8% |
| Total Occupied Housing Units | 1,154 | 100.0% |
Occupancy by Household Size in North Hartsville
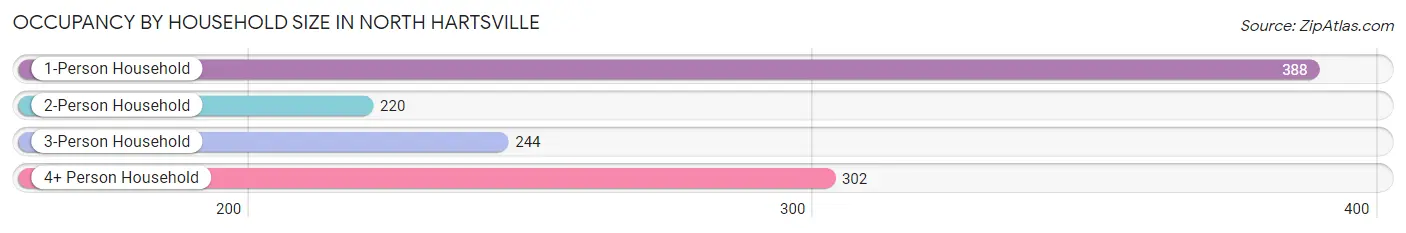
| Household Size | # Housing Units | % Housing Units |
| 1-Person Household | 388 | 33.6% |
| 2-Person Household | 220 | 19.1% |
| 3-Person Household | 244 | 21.1% |
| 4+ Person Household | 302 | 26.2% |
| Total Housing Units | 1,154 | 100.0% |
Occupancy by Ownership by Household Size in North Hartsville
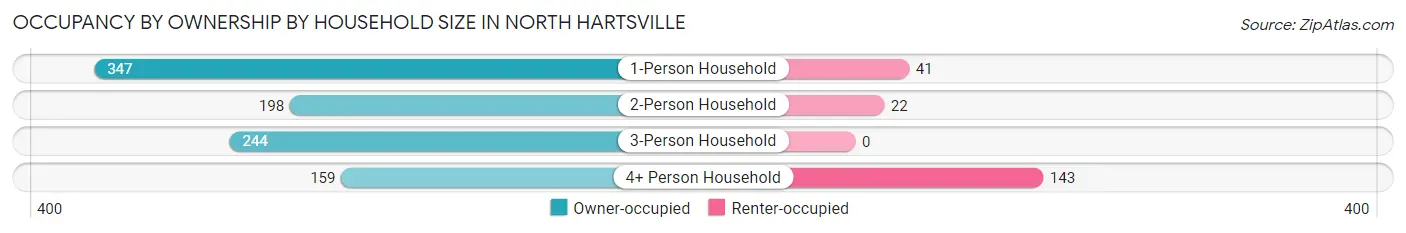
| Household Size | Owner-occupied | Renter-occupied |
| 1-Person Household | 347 (89.4%) | 41 (10.6%) |
| 2-Person Household | 198 (90.0%) | 22 (10.0%) |
| 3-Person Household | 244 (100.0%) | 0 (0.0%) |
| 4+ Person Household | 159 (52.6%) | 143 (47.3%) |
| Total Housing Units | 948 (82.2%) | 206 (17.8%) |
Occupancy by Educational Attainment in North Hartsville
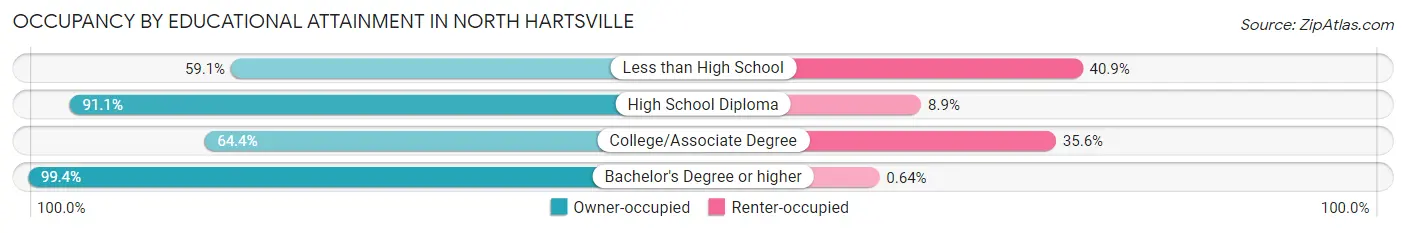
| Household Size | Owner-occupied | Renter-occupied |
| Less than High School | 39 (59.1%) | 27 (40.9%) |
| High School Diploma | 337 (91.1%) | 33 (8.9%) |
| College/Associate Degree | 260 (64.4%) | 144 (35.6%) |
| Bachelor's Degree or higher | 312 (99.4%) | 2 (0.6%) |
Occupancy by Age of Householder in North Hartsville
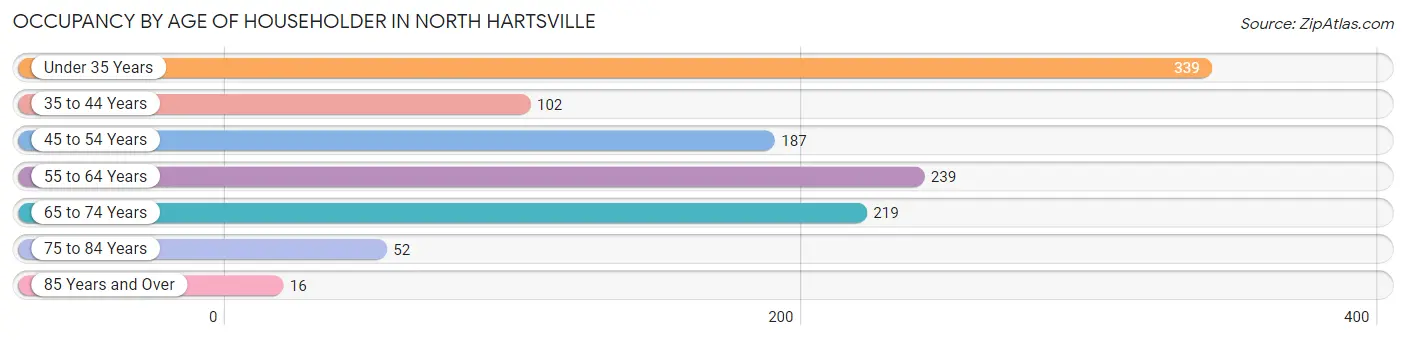
| Age Bracket | # Households | % Households |
| Under 35 Years | 339 | 29.4% |
| 35 to 44 Years | 102 | 8.8% |
| 45 to 54 Years | 187 | 16.2% |
| 55 to 64 Years | 239 | 20.7% |
| 65 to 74 Years | 219 | 19.0% |
| 75 to 84 Years | 52 | 4.5% |
| 85 Years and Over | 16 | 1.4% |
| Total | 1,154 | 100.0% |
Housing Finances in North Hartsville
Median Income by Occupancy in North Hartsville
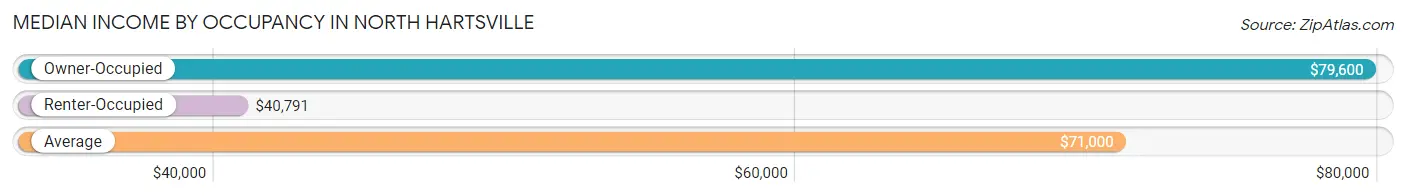
| Occupancy Type | # Households | Median Income |
| Owner-Occupied | 948 (82.2%) | $79,600 |
| Renter-Occupied | 206 (17.8%) | $40,791 |
| Average | 1,154 (100.0%) | $71,000 |
Occupancy by Householder Income Bracket in North Hartsville
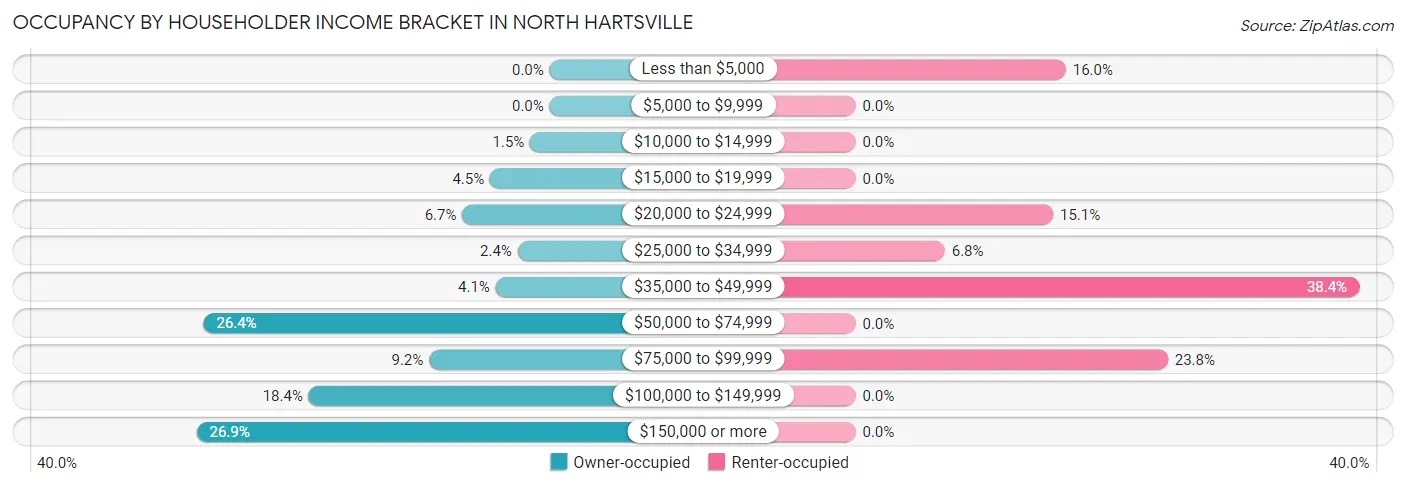
| Income Bracket | Owner-occupied | Renter-occupied |
| Less than $5,000 | 0 (0.0%) | 33 (16.0%) |
| $5,000 to $9,999 | 0 (0.0%) | 0 (0.0%) |
| $10,000 to $14,999 | 14 (1.5%) | 0 (0.0%) |
| $15,000 to $19,999 | 43 (4.5%) | 0 (0.0%) |
| $20,000 to $24,999 | 63 (6.7%) | 31 (15.0%) |
| $25,000 to $34,999 | 23 (2.4%) | 14 (6.8%) |
| $35,000 to $49,999 | 39 (4.1%) | 79 (38.4%) |
| $50,000 to $74,999 | 250 (26.4%) | 0 (0.0%) |
| $75,000 to $99,999 | 87 (9.2%) | 49 (23.8%) |
| $100,000 to $149,999 | 174 (18.3%) | 0 (0.0%) |
| $150,000 or more | 255 (26.9%) | 0 (0.0%) |
| Total | 948 (100.0%) | 206 (100.0%) |
Monthly Housing Cost Tiers in North Hartsville
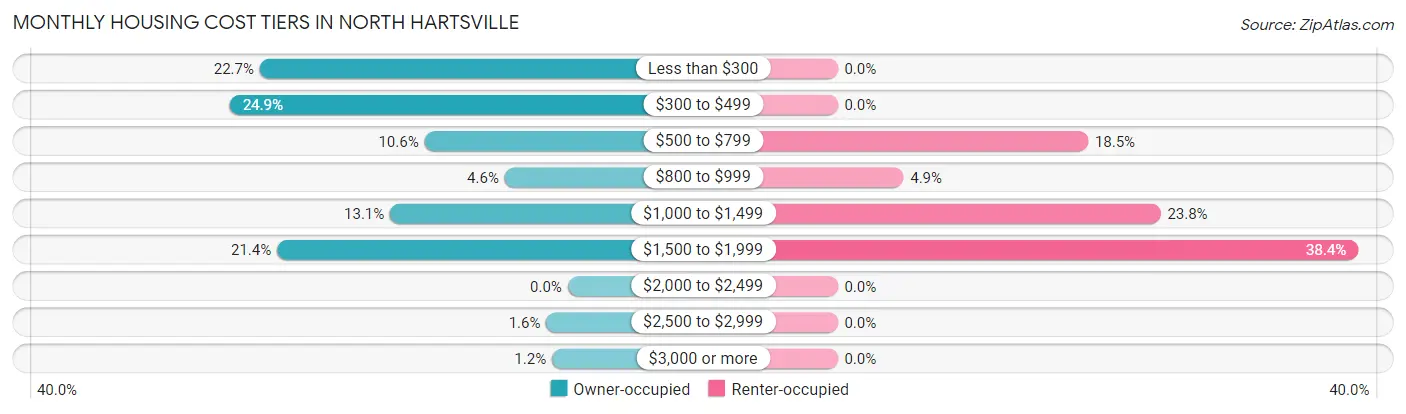
| Monthly Cost | Owner-occupied | Renter-occupied |
| Less than $300 | 215 (22.7%) | 0 (0.0%) |
| $300 to $499 | 236 (24.9%) | 0 (0.0%) |
| $500 to $799 | 100 (10.5%) | 38 (18.4%) |
| $800 to $999 | 44 (4.6%) | 10 (4.9%) |
| $1,000 to $1,499 | 124 (13.1%) | 49 (23.8%) |
| $1,500 to $1,999 | 203 (21.4%) | 79 (38.4%) |
| $2,000 to $2,499 | 0 (0.0%) | 0 (0.0%) |
| $2,500 to $2,999 | 15 (1.6%) | 0 (0.0%) |
| $3,000 or more | 11 (1.2%) | 0 (0.0%) |
| Total | 948 (100.0%) | 206 (100.0%) |
Physical Housing Characteristics in North Hartsville
Housing Structures in North Hartsville
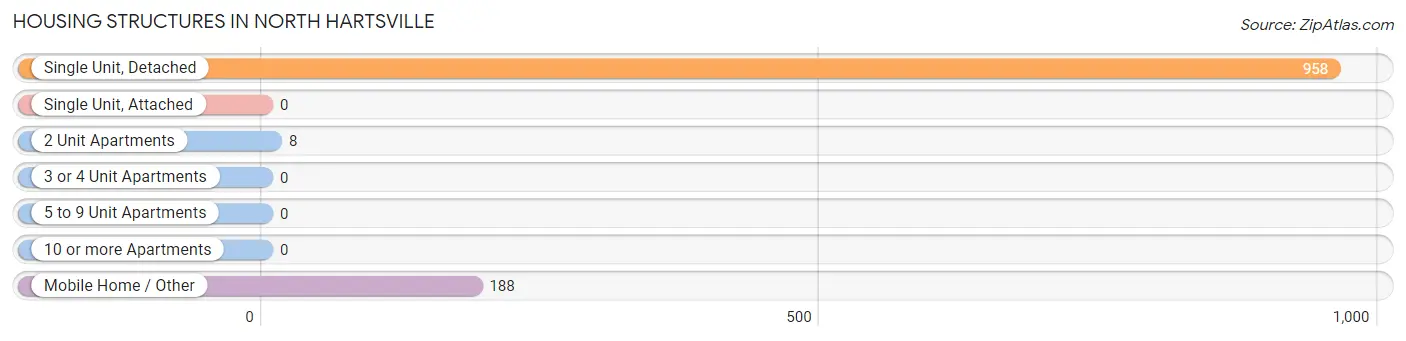
| Structure Type | # Housing Units | % Housing Units |
| Single Unit, Detached | 958 | 83.0% |
| Single Unit, Attached | 0 | 0.0% |
| 2 Unit Apartments | 8 | 0.7% |
| 3 or 4 Unit Apartments | 0 | 0.0% |
| 5 to 9 Unit Apartments | 0 | 0.0% |
| 10 or more Apartments | 0 | 0.0% |
| Mobile Home / Other | 188 | 16.3% |
| Total | 1,154 | 100.0% |
Housing Structures by Occupancy in North Hartsville
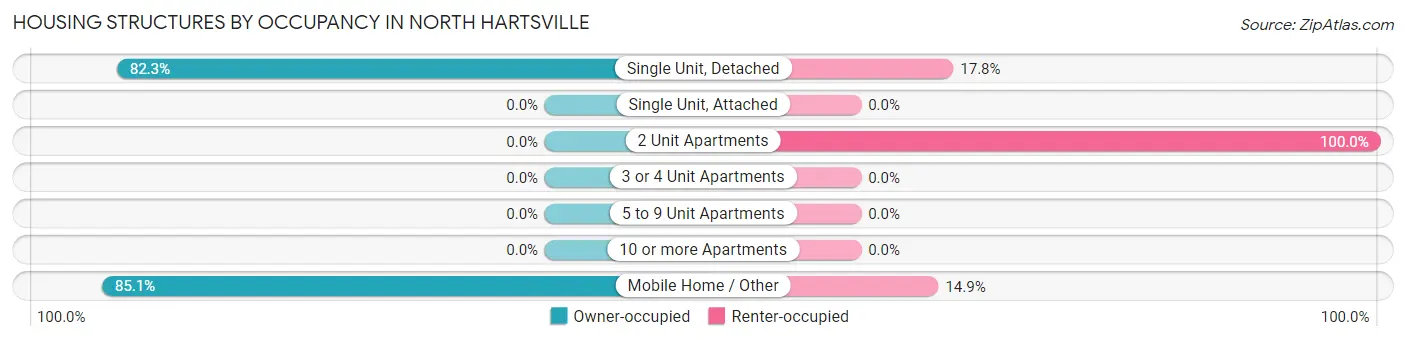
| Structure Type | Owner-occupied | Renter-occupied |
| Single Unit, Detached | 788 (82.3%) | 170 (17.7%) |
| Single Unit, Attached | 0 (0.0%) | 0 (0.0%) |
| 2 Unit Apartments | 0 (0.0%) | 8 (100.0%) |
| 3 or 4 Unit Apartments | 0 (0.0%) | 0 (0.0%) |
| 5 to 9 Unit Apartments | 0 (0.0%) | 0 (0.0%) |
| 10 or more Apartments | 0 (0.0%) | 0 (0.0%) |
| Mobile Home / Other | 160 (85.1%) | 28 (14.9%) |
| Total | 948 (82.2%) | 206 (17.8%) |
Housing Structures by Number of Rooms in North Hartsville
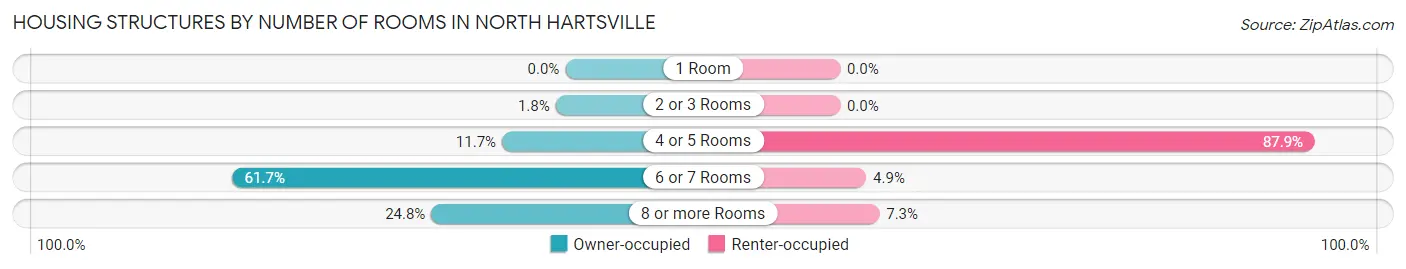
| Number of Rooms | Owner-occupied | Renter-occupied |
| 1 Room | 0 (0.0%) | 0 (0.0%) |
| 2 or 3 Rooms | 17 (1.8%) | 0 (0.0%) |
| 4 or 5 Rooms | 111 (11.7%) | 181 (87.9%) |
| 6 or 7 Rooms | 585 (61.7%) | 10 (4.9%) |
| 8 or more Rooms | 235 (24.8%) | 15 (7.3%) |
| Total | 948 (100.0%) | 206 (100.0%) |
Housing Structure by Heating Type in North Hartsville
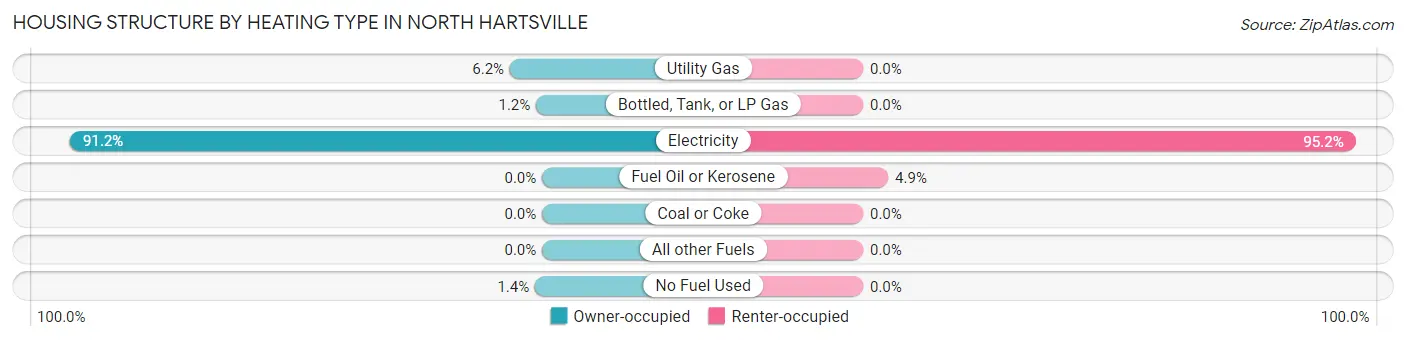
| Heating Type | Owner-occupied | Renter-occupied |
| Utility Gas | 59 (6.2%) | 0 (0.0%) |
| Bottled, Tank, or LP Gas | 11 (1.2%) | 0 (0.0%) |
| Electricity | 865 (91.2%) | 196 (95.2%) |
| Fuel Oil or Kerosene | 0 (0.0%) | 10 (4.9%) |
| Coal or Coke | 0 (0.0%) | 0 (0.0%) |
| All other Fuels | 0 (0.0%) | 0 (0.0%) |
| No Fuel Used | 13 (1.4%) | 0 (0.0%) |
| Total | 948 (100.0%) | 206 (100.0%) |
Household Vehicle Usage in North Hartsville
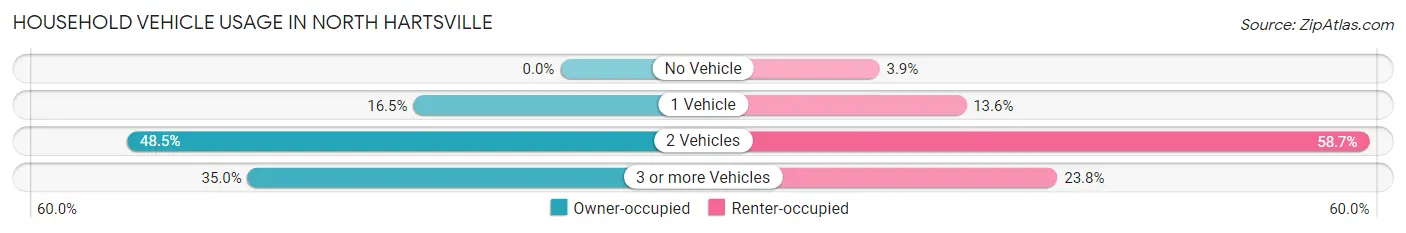
| Vehicles per Household | Owner-occupied | Renter-occupied |
| No Vehicle | 0 (0.0%) | 8 (3.9%) |
| 1 Vehicle | 156 (16.5%) | 28 (13.6%) |
| 2 Vehicles | 460 (48.5%) | 121 (58.7%) |
| 3 or more Vehicles | 332 (35.0%) | 49 (23.8%) |
| Total | 948 (100.0%) | 206 (100.0%) |
Real Estate & Mortgages in North Hartsville
Real Estate and Mortgage Overview in North Hartsville
| Characteristic | Without Mortgage | With Mortgage |
| Housing Units | 500 | 448 |
| Median Property Value | $78,000 | $259,000 |
| Median Household Income | $57,163 | $234 |
| Monthly Housing Costs | $317 | $0 |
| Real Estate Taxes | $363 | $44 |
Property Value by Mortgage Status in North Hartsville
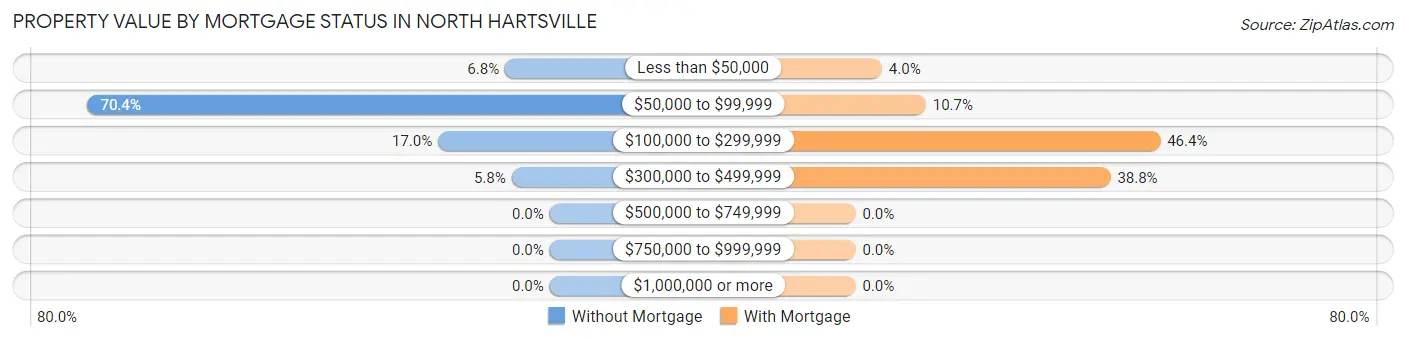
| Property Value | Without Mortgage | With Mortgage |
| Less than $50,000 | 34 (6.8%) | 18 (4.0%) |
| $50,000 to $99,999 | 352 (70.4%) | 48 (10.7%) |
| $100,000 to $299,999 | 85 (17.0%) | 208 (46.4%) |
| $300,000 to $499,999 | 29 (5.8%) | 174 (38.8%) |
| $500,000 to $749,999 | 0 (0.0%) | 0 (0.0%) |
| $750,000 to $999,999 | 0 (0.0%) | 0 (0.0%) |
| $1,000,000 or more | 0 (0.0%) | 0 (0.0%) |
| Total | 500 (100.0%) | 448 (100.0%) |
Household Income by Mortgage Status in North Hartsville
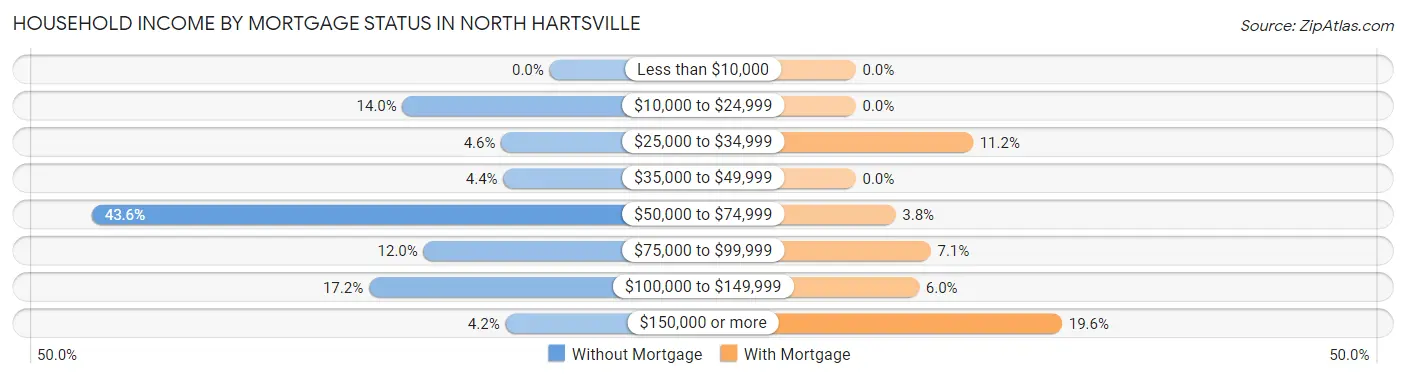
| Household Income | Without Mortgage | With Mortgage |
| Less than $10,000 | 0 (0.0%) | 0 (0.0%) |
| $10,000 to $24,999 | 70 (14.0%) | 0 (0.0%) |
| $25,000 to $34,999 | 23 (4.6%) | 50 (11.2%) |
| $35,000 to $49,999 | 22 (4.4%) | 0 (0.0%) |
| $50,000 to $74,999 | 218 (43.6%) | 17 (3.8%) |
| $75,000 to $99,999 | 60 (12.0%) | 32 (7.1%) |
| $100,000 to $149,999 | 86 (17.2%) | 27 (6.0%) |
| $150,000 or more | 21 (4.2%) | 88 (19.6%) |
| Total | 500 (100.0%) | 448 (100.0%) |
Property Value to Household Income Ratio in North Hartsville
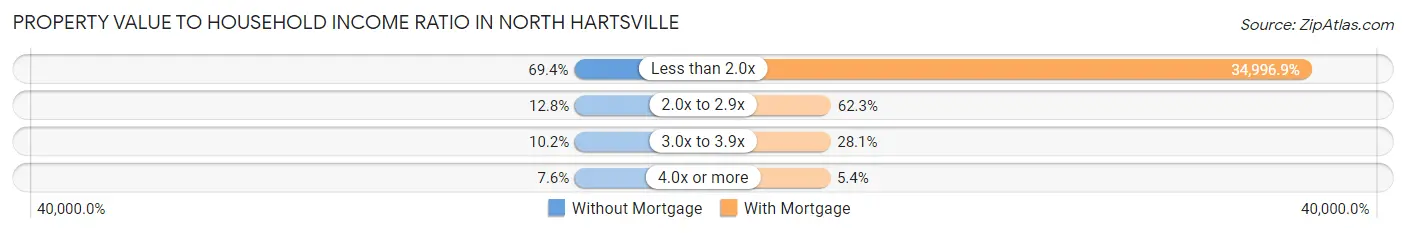
| Value-to-Income Ratio | Without Mortgage | With Mortgage |
| Less than 2.0x | 347 (69.4%) | 156,786 (34,996.9%) |
| 2.0x to 2.9x | 64 (12.8%) | 279 (62.3%) |
| 3.0x to 3.9x | 51 (10.2%) | 126 (28.1%) |
| 4.0x or more | 38 (7.6%) | 24 (5.4%) |
| Total | 500 (100.0%) | 448 (100.0%) |
Real Estate Taxes by Mortgage Status in North Hartsville
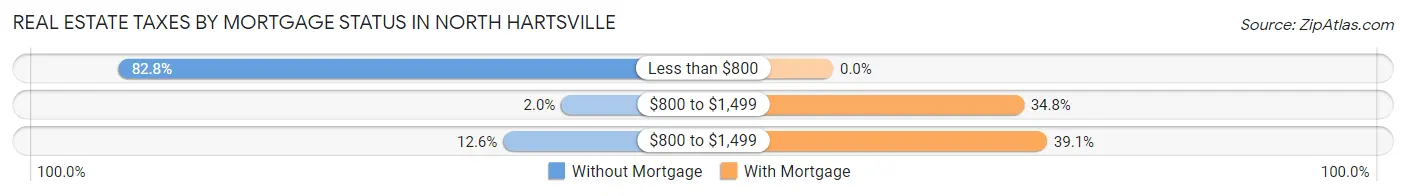
| Property Taxes | Without Mortgage | With Mortgage |
| Less than $800 | 414 (82.8%) | 0 (0.0%) |
| $800 to $1,499 | 10 (2.0%) | 156 (34.8%) |
| $800 to $1,499 | 63 (12.6%) | 175 (39.1%) |
| Total | 500 (100.0%) | 448 (100.0%) |
Health & Disability in North Hartsville
Health Insurance Coverage by Age in North Hartsville
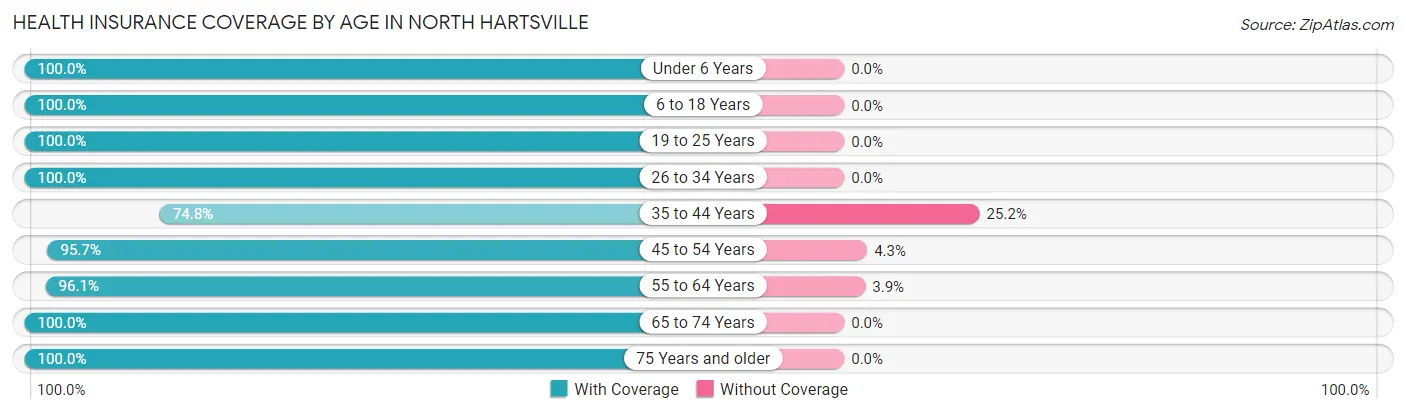
| Age Bracket | With Coverage | Without Coverage |
| Under 6 Years | 423 (100.0%) | 0 (0.0%) |
| 6 to 18 Years | 698 (100.0%) | 0 (0.0%) |
| 19 to 25 Years | 123 (100.0%) | 0 (0.0%) |
| 26 to 34 Years | 620 (100.0%) | 0 (0.0%) |
| 35 to 44 Years | 231 (74.8%) | 78 (25.2%) |
| 45 to 54 Years | 313 (95.7%) | 14 (4.3%) |
| 55 to 64 Years | 391 (96.1%) | 16 (3.9%) |
| 65 to 74 Years | 246 (100.0%) | 0 (0.0%) |
| 75 Years and older | 108 (100.0%) | 0 (0.0%) |
| Total | 3,153 (96.7%) | 108 (3.3%) |
Health Insurance Coverage by Citizenship Status in North Hartsville
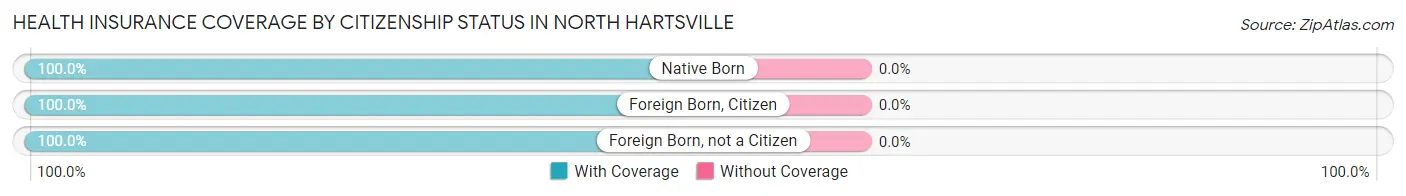
| Citizenship Status | With Coverage | Without Coverage |
| Native Born | 423 (100.0%) | 0 (0.0%) |
| Foreign Born, Citizen | 698 (100.0%) | 0 (0.0%) |
| Foreign Born, not a Citizen | 123 (100.0%) | 0 (0.0%) |
Health Insurance Coverage by Household Income in North Hartsville
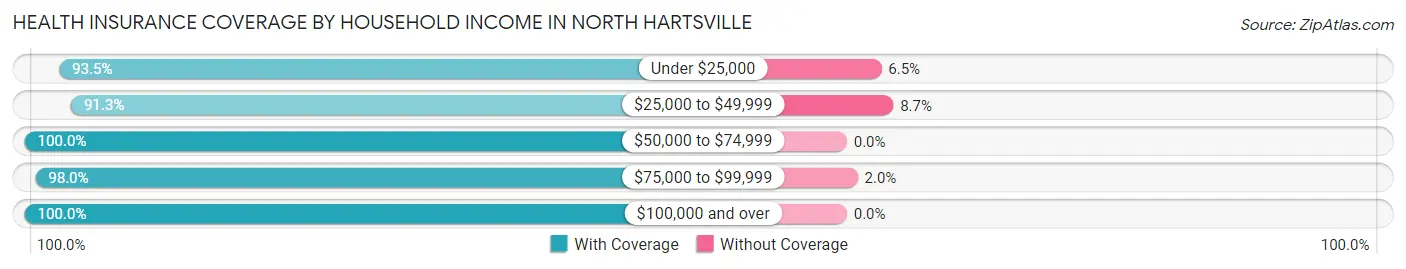
| Household Income | With Coverage | Without Coverage |
| Under $25,000 | 318 (93.5%) | 22 (6.5%) |
| $25,000 to $49,999 | 819 (91.3%) | 78 (8.7%) |
| $50,000 to $74,999 | 313 (100.0%) | 0 (0.0%) |
| $75,000 to $99,999 | 388 (98.0%) | 8 (2.0%) |
| $100,000 and over | 1,313 (100.0%) | 0 (0.0%) |
Public vs Private Health Insurance Coverage by Age in North Hartsville
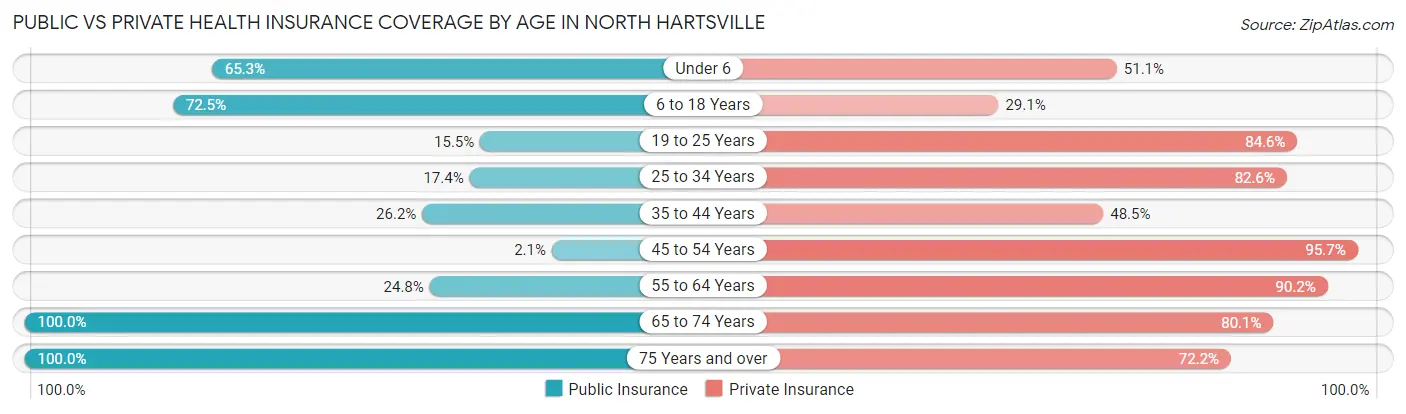
| Age Bracket | Public Insurance | Private Insurance |
| Under 6 | 276 (65.2%) | 216 (51.1%) |
| 6 to 18 Years | 506 (72.5%) | 203 (29.1%) |
| 19 to 25 Years | 19 (15.4%) | 104 (84.6%) |
| 25 to 34 Years | 108 (17.4%) | 512 (82.6%) |
| 35 to 44 Years | 81 (26.2%) | 150 (48.5%) |
| 45 to 54 Years | 7 (2.1%) | 313 (95.7%) |
| 55 to 64 Years | 101 (24.8%) | 367 (90.2%) |
| 65 to 74 Years | 246 (100.0%) | 197 (80.1%) |
| 75 Years and over | 108 (100.0%) | 78 (72.2%) |
| Total | 1,452 (44.5%) | 2,140 (65.6%) |
Disability Status by Sex by Age in North Hartsville
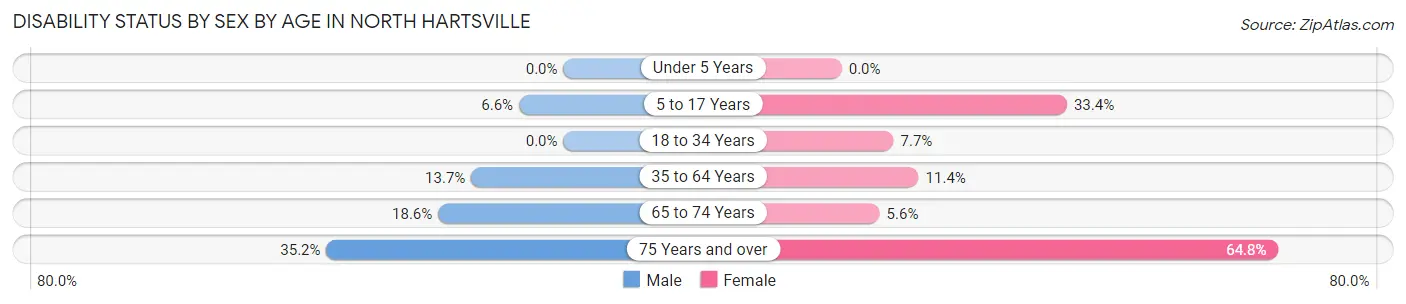
| Age Bracket | Male | Female |
| Under 5 Years | 0 (0.0%) | 0 (0.0%) |
| 5 to 17 Years | 11 (6.6%) | 204 (33.4%) |
| 18 to 34 Years | 0 (0.0%) | 27 (7.7%) |
| 35 to 64 Years | 66 (13.7%) | 64 (11.4%) |
| 65 to 74 Years | 16 (18.6%) | 9 (5.6%) |
| 75 Years and over | 19 (35.2%) | 35 (64.8%) |
Disability Class by Sex by Age in North Hartsville
Disability Class: Hearing Difficulty
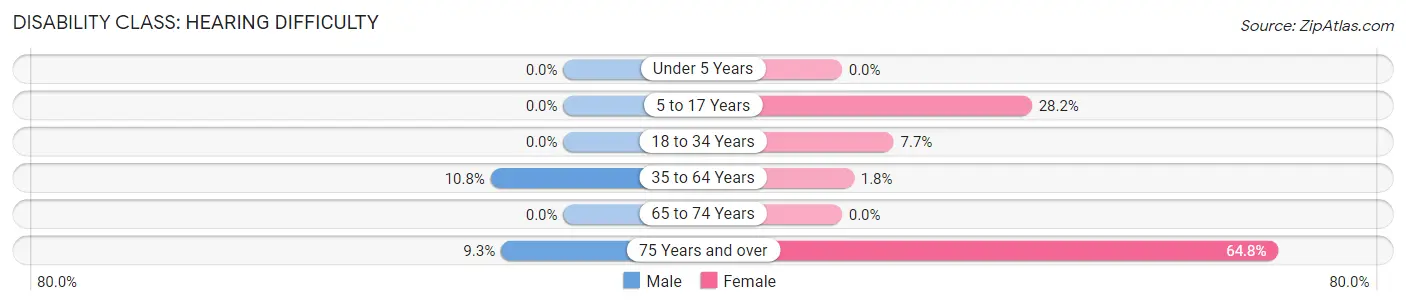
| Age Bracket | Male | Female |
| Under 5 Years | 0 (0.0%) | 0 (0.0%) |
| 5 to 17 Years | 0 (0.0%) | 172 (28.2%) |
| 18 to 34 Years | 0 (0.0%) | 27 (7.7%) |
| 35 to 64 Years | 52 (10.8%) | 10 (1.8%) |
| 65 to 74 Years | 0 (0.0%) | 0 (0.0%) |
| 75 Years and over | 5 (9.3%) | 35 (64.8%) |
Disability Class: Vision Difficulty
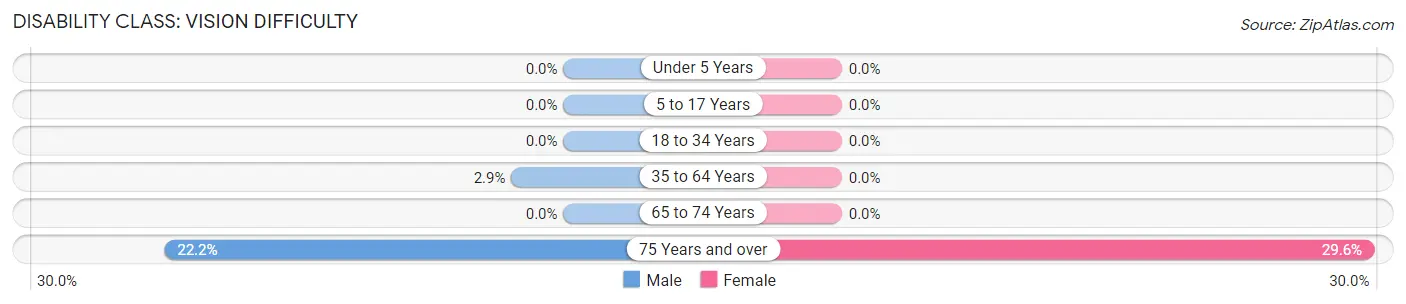
| Age Bracket | Male | Female |
| Under 5 Years | 0 (0.0%) | 0 (0.0%) |
| 5 to 17 Years | 0 (0.0%) | 0 (0.0%) |
| 18 to 34 Years | 0 (0.0%) | 0 (0.0%) |
| 35 to 64 Years | 14 (2.9%) | 0 (0.0%) |
| 65 to 74 Years | 0 (0.0%) | 0 (0.0%) |
| 75 Years and over | 12 (22.2%) | 16 (29.6%) |
Disability Class: Cognitive Difficulty
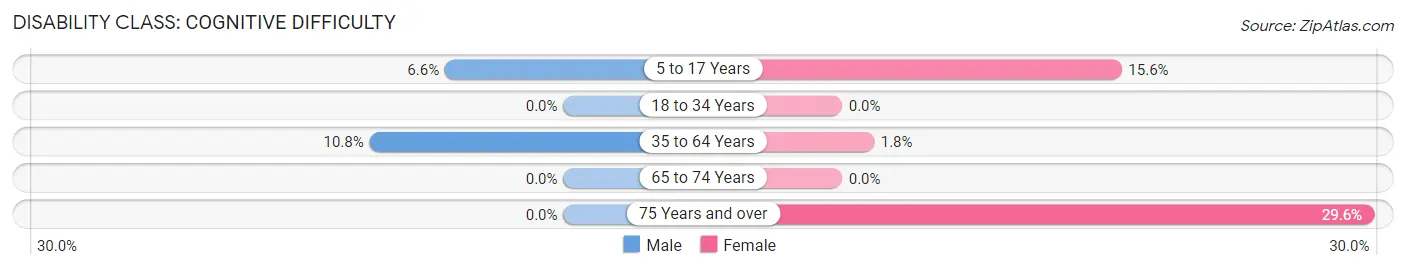
| Age Bracket | Male | Female |
| 5 to 17 Years | 11 (6.6%) | 95 (15.6%) |
| 18 to 34 Years | 0 (0.0%) | 0 (0.0%) |
| 35 to 64 Years | 52 (10.8%) | 10 (1.8%) |
| 65 to 74 Years | 0 (0.0%) | 0 (0.0%) |
| 75 Years and over | 0 (0.0%) | 16 (29.6%) |
Disability Class: Ambulatory Difficulty
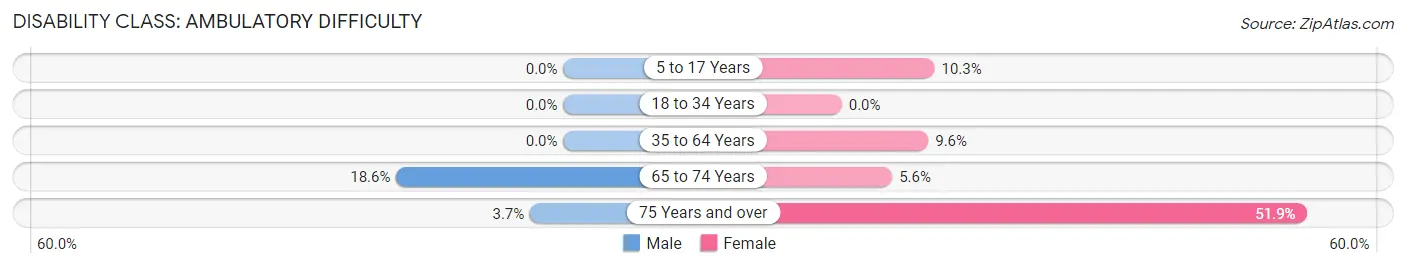
| Age Bracket | Male | Female |
| 5 to 17 Years | 0 (0.0%) | 63 (10.3%) |
| 18 to 34 Years | 0 (0.0%) | 0 (0.0%) |
| 35 to 64 Years | 0 (0.0%) | 54 (9.6%) |
| 65 to 74 Years | 16 (18.6%) | 9 (5.6%) |
| 75 Years and over | 2 (3.7%) | 28 (51.8%) |
Disability Class: Self-Care Difficulty
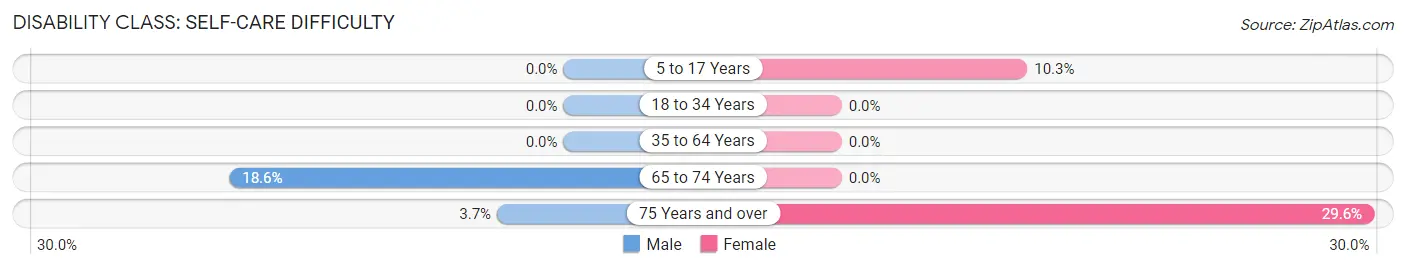
| Age Bracket | Male | Female |
| 5 to 17 Years | 0 (0.0%) | 63 (10.3%) |
| 18 to 34 Years | 0 (0.0%) | 0 (0.0%) |
| 35 to 64 Years | 0 (0.0%) | 0 (0.0%) |
| 65 to 74 Years | 16 (18.6%) | 0 (0.0%) |
| 75 Years and over | 2 (3.7%) | 16 (29.6%) |
Technology Access in North Hartsville
Computing Device Access in North Hartsville
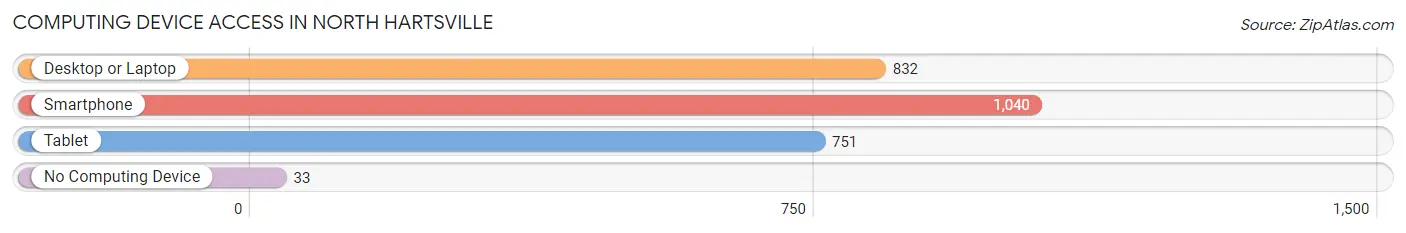
| Device Type | # Households | % Households |
| Desktop or Laptop | 832 | 72.1% |
| Smartphone | 1,040 | 90.1% |
| Tablet | 751 | 65.1% |
| No Computing Device | 33 | 2.9% |
| Total | 1,154 | 100.0% |
Internet Access in North Hartsville
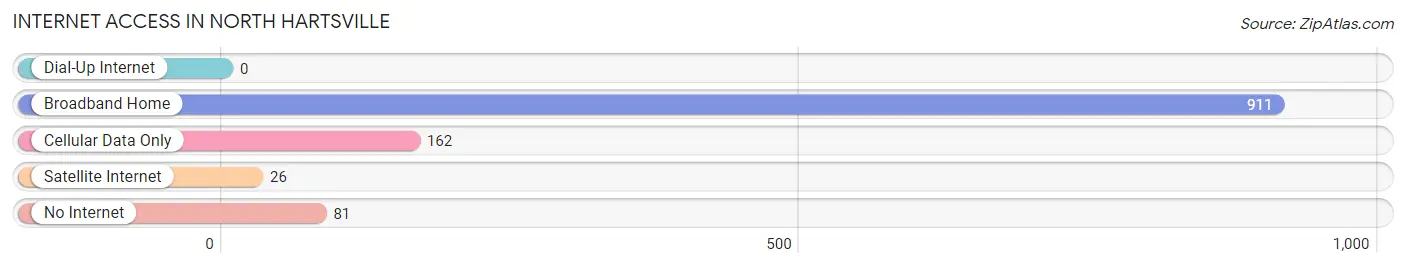
| Internet Type | # Households | % Households |
| Dial-Up Internet | 0 | 0.0% |
| Broadband Home | 911 | 78.9% |
| Cellular Data Only | 162 | 14.0% |
| Satellite Internet | 26 | 2.2% |
| No Internet | 81 | 7.0% |
| Total | 1,154 | 100.0% |
North Hartsville Summary
North Hartsville is a small town located in the Pee Dee region of South Carolina. It is situated in the northeastern corner of Darlington County, approximately 20 miles from the county seat of Darlington. The town is bordered by the towns of Hartsville, Lamar, and Society Hill. North Hartsville is part of the Hartsville Micropolitan Statistical Area, which includes all of Darlington County.
History
North Hartsville was founded in 1891 by the Hartsville Land and Improvement Company. The company was formed by a group of local businessmen who wanted to create a new town in the area. The town was named after the nearby town of Hartsville, which had been established in 1817. The town was originally intended to be a residential and commercial center for the surrounding area.
The town grew slowly but steadily over the years, and by the early 1900s, it had become a thriving community. The town was home to several businesses, including a cotton mill, a sawmill, a grist mill, and a general store. The town also had a post office, a bank, and a hotel.
In the 1920s, the town experienced a period of growth and prosperity. The population increased from around 500 in 1920 to over 1,000 by 1930. During this time, the town was home to several churches, a movie theater, and a number of stores and businesses.
Geography
North Hartsville is located in the Pee Dee region of South Carolina. The town is situated in the northeastern corner of Darlington County, approximately 20 miles from the county seat of Darlington. The town is bordered by the towns of Hartsville, Lamar, and Society Hill. North Hartsville is part of the Hartsville Micropolitan Statistical Area, which includes all of Darlington County.
The town is located in a rural area, and the landscape is mostly flat. The town is situated on the banks of the Great Pee Dee River, which flows through the area. The town is also located near several lakes, including Lake Robinson, Lake Pauline, and Lake Marion.
Economy
North Hartsville is a small town with a population of just over 1,000 people. The town is home to several businesses, including a cotton mill, a sawmill, a grist mill, and a general store. The town also has a post office, a bank, and a hotel.
The town is also home to several manufacturing companies, including a furniture manufacturer, a plastics manufacturer, and a paper mill. The town is also home to several agricultural businesses, including a poultry farm and a dairy farm.
Demographics
As of the 2010 census, North Hartsville had a population of 1,072. The racial makeup of the town was 79.2% White, 17.7% African American, 0.3% Native American, 0.7% Asian, 0.1% Pacific Islander, 0.7% from other races, and 1.2% from two or more races. Hispanic or Latino of any race were 2.2% of the population.
The median income for a household in the town was $30,000, and the median income for a family was $35,000. The per capita income for the town was $14,000. About 18.2% of the population was below the poverty line.
Common Questions
What is Per Capita Income in North Hartsville?
Per Capita income in North Hartsville is $35,577.
What is the Median Family Income in North Hartsville?
Median Family Income in North Hartsville is $92,639.
What is the Median Household income in North Hartsville?
Median Household Income in North Hartsville is $71,000.
What is Family Income Deficit in North Hartsville?
Family Income Deficit in North Hartsville is $5,413.
Families that are below poverty line in North Hartsville earn $5,413 less on average than the poverty threshold level.
What is Inequality or Gini Index in North Hartsville?
Inequality or Gini Index in North Hartsville is 0.41.
What is the Total Population of North Hartsville?
Total Population of North Hartsville is 3,261.
What is the Total Male Population of North Hartsville?
Total Male Population of North Hartsville is 1,333.
What is the Total Female Population of North Hartsville?
Total Female Population of North Hartsville is 1,928.
What is the Ratio of Males per 100 Females in North Hartsville?
There are 69.14 Males per 100 Females in North Hartsville.
What is the Ratio of Females per 100 Males in North Hartsville?
There are 144.64 Females per 100 Males in North Hartsville.
What is the Median Population Age in North Hartsville?
Median Population Age in North Hartsville is 32.0 Years.
What is the Average Family Size in North Hartsville
Average Family Size in North Hartsville is 3.8 People.
What is the Average Household Size in North Hartsville
Average Household Size in North Hartsville is 2.8 People.
How Large is the Labor Force in North Hartsville?
There are 1,679 People in the Labor Forcein in North Hartsville.
What is the Percentage of People in the Labor Force in North Hartsville?
77.3% of People are in the Labor Force in North Hartsville.
What is the Unemployment Rate in North Hartsville?
Unemployment Rate in North Hartsville is 0.9%.