Zip Codes with the Highest Percentage of Population Employed in Computer, Engineering & Science in Seneca, SC
RELATED REPORTS & OPTIONS
Computer, Engineering & Science
Seneca
Compare Zip Codes
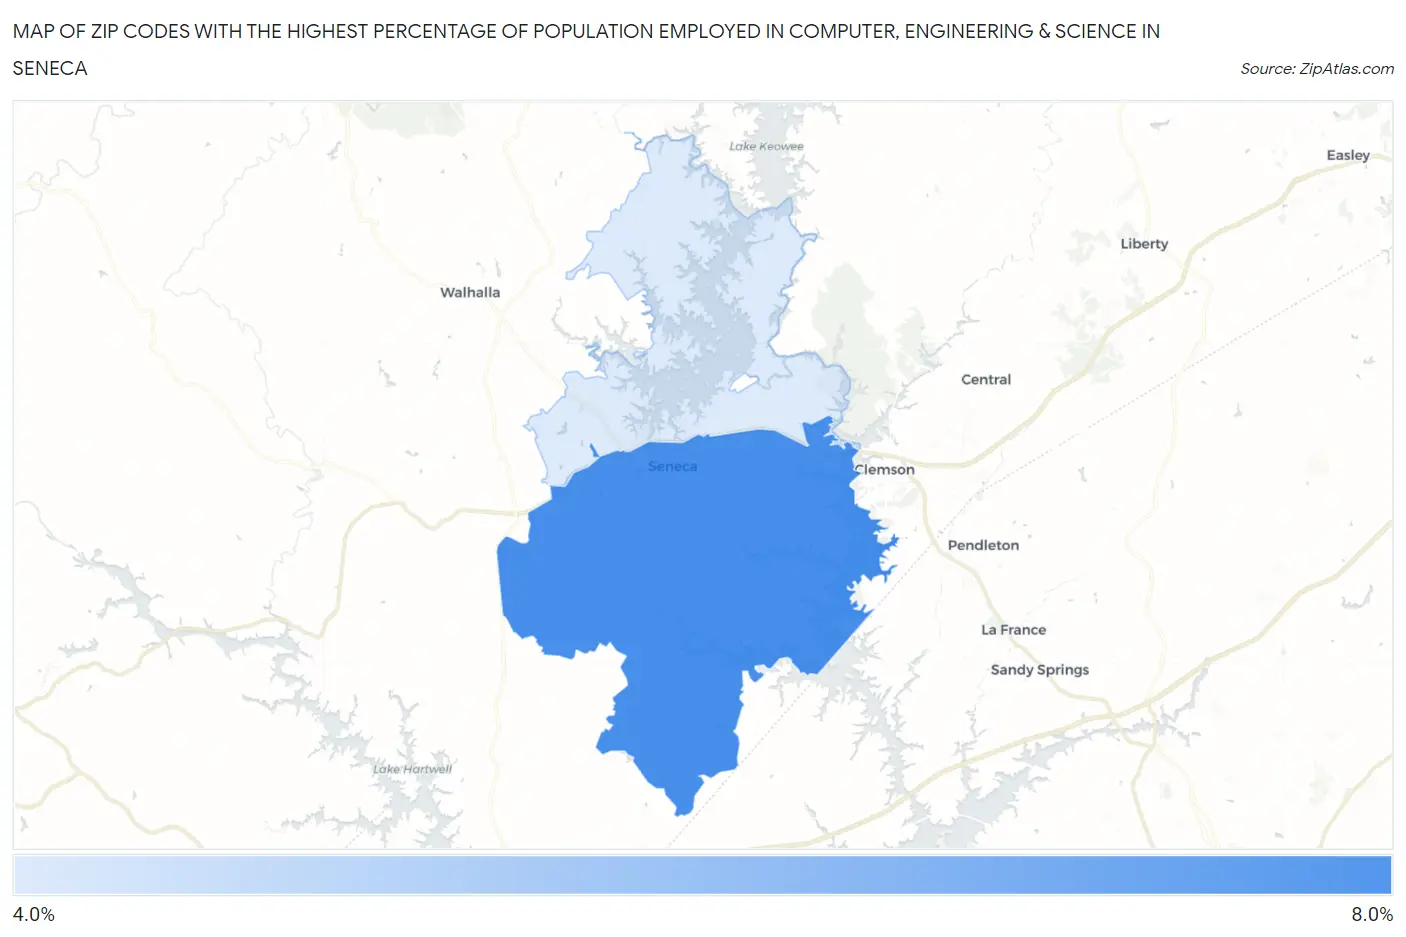
Map of Zip Codes with the Highest Percentage of Population Employed in Computer, Engineering & Science in Seneca
4.7%
6.5%
Zip Codes with the Highest Percentage of Population Employed in Computer, Engineering & Science in Seneca, SC
| Zip Code | % Employed | vs State | vs National | |
| 1. | 29678 | 6.5% | 5.3%(+1.20)#63 | 6.8%(-0.220)#7,655 |
| 2. | 29672 | 4.7% | 5.3%(-0.632)#127 | 6.8%(-2.05)#12,174 |
1
Common Questions
What are the Top Zip Codes with the Highest Percentage of Population Employed in Computer, Engineering & Science in Seneca, SC?
Top Zip Codes with the Highest Percentage of Population Employed in Computer, Engineering & Science in Seneca, SC are:
What zip code has the Highest Percentage of Population Employed in Computer, Engineering & Science in Seneca, SC?
29678 has the Highest Percentage of Population Employed in Computer, Engineering & Science in Seneca, SC with 6.5%.
What is the Percentage of Population Employed in Computer, Engineering & Science in Seneca, SC?
Percentage of Population Employed in Computer, Engineering & Science in Seneca is 5.3%.
What is the Percentage of Population Employed in Computer, Engineering & Science in South Carolina?
Percentage of Population Employed in Computer, Engineering & Science in South Carolina is 5.3%.
What is the Percentage of Population Employed in Computer, Engineering & Science in the United States?
Percentage of Population Employed in Computer, Engineering & Science in the United States is 6.8%.