Riverview, SC Map & Demographics
Riverview Map
Riverview Overview
$43,849
PER CAPITA INCOME
$126,427
AVG FAMILY INCOME
$125,897
AVG HOUSEHOLD INCOME
8.3%
WAGE / INCOME GAP [ % ]
91.7¢/ $1
WAGE / INCOME GAP [ $ ]
0.29
INEQUALITY / GINI INDEX
2,010
TOTAL POPULATION
937
MALE POPULATION
1,073
FEMALE POPULATION
87.33
MALES / 100 FEMALES
114.51
FEMALES / 100 MALES
40.5
MEDIAN AGE
3.2
AVG FAMILY SIZE
2.9
AVG HOUSEHOLD SIZE
1,379
LABOR FORCE [ PEOPLE ]
80.9%
PERCENT IN LABOR FORCE
16.3%
UNEMPLOYMENT RATE
Income in Riverview
Income Overview in Riverview
Per Capita Income in Riverview is $43,849, while median incomes of families and households are $126,427 and $125,897 respectively.
| Characteristic | Number | Measure |
| Per Capita Income | 2,010 | $43,849 |
| Median Family Income | 595 | $126,427 |
| Mean Family Income | 595 | $132,315 |
| Median Household Income | 706 | $125,897 |
| Mean Household Income | 706 | $121,015 |
| Income Deficit | 595 | $0 |
| Wage / Income Gap (%) | 2,010 | 8.30% |
| Wage / Income Gap ($) | 2,010 | 91.70¢ per $1 |
| Gini / Inequality Index | 2,010 | 0.29 |
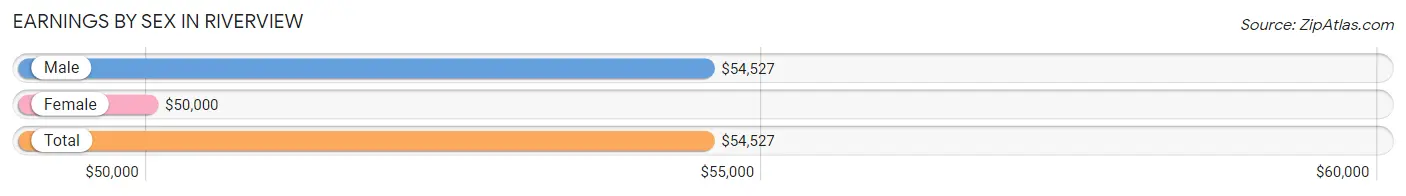
Earnings by Sex in Riverview
Average Earnings in Riverview are $54,527, $54,527 for men and $50,000 for women, a difference of 8.3%.
| Sex | Number | Average Earnings |
| Male | 690 (48.9%) | $54,527 |
| Female | 720 (51.1%) | $50,000 |
| Total | 1,410 (100.0%) | $54,527 |
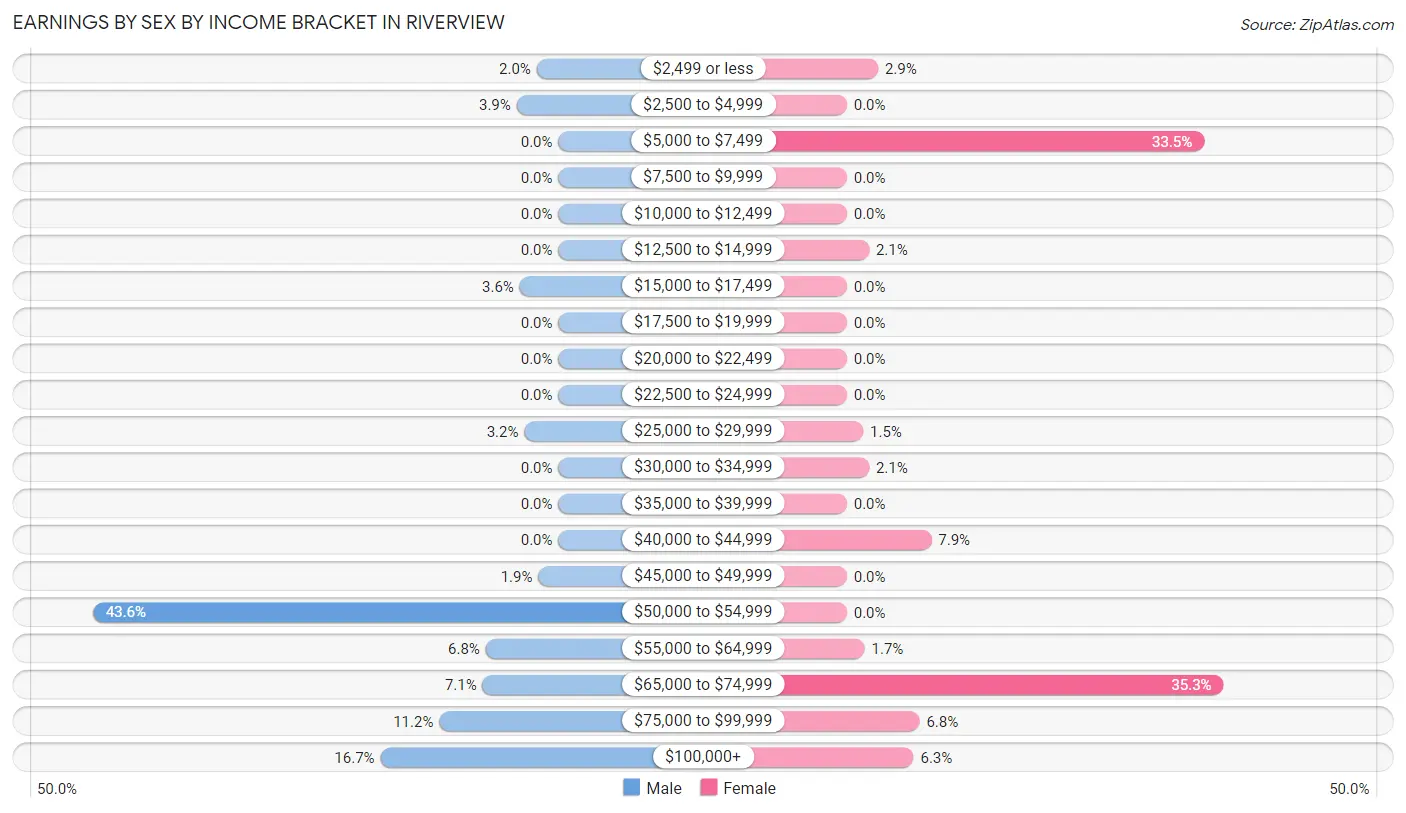
Earnings by Sex by Income Bracket in Riverview
The most common earnings brackets in Riverview are $50,000 to $54,999 for men (301 | 43.6%) and $65,000 to $74,999 for women (254 | 35.3%).
| Income | Male | Female |
| $2,499 or less | 14 (2.0%) | 21 (2.9%) |
| $2,500 to $4,999 | 27 (3.9%) | 0 (0.0%) |
| $5,000 to $7,499 | 0 (0.0%) | 241 (33.5%) |
| $7,500 to $9,999 | 0 (0.0%) | 0 (0.0%) |
| $10,000 to $12,499 | 0 (0.0%) | 0 (0.0%) |
| $12,500 to $14,999 | 0 (0.0%) | 15 (2.1%) |
| $15,000 to $17,499 | 25 (3.6%) | 0 (0.0%) |
| $17,500 to $19,999 | 0 (0.0%) | 0 (0.0%) |
| $20,000 to $22,499 | 0 (0.0%) | 0 (0.0%) |
| $22,500 to $24,999 | 0 (0.0%) | 0 (0.0%) |
| $25,000 to $29,999 | 22 (3.2%) | 11 (1.5%) |
| $30,000 to $34,999 | 0 (0.0%) | 15 (2.1%) |
| $35,000 to $39,999 | 0 (0.0%) | 0 (0.0%) |
| $40,000 to $44,999 | 0 (0.0%) | 57 (7.9%) |
| $45,000 to $49,999 | 13 (1.9%) | 0 (0.0%) |
| $50,000 to $54,999 | 301 (43.6%) | 0 (0.0%) |
| $55,000 to $64,999 | 47 (6.8%) | 12 (1.7%) |
| $65,000 to $74,999 | 49 (7.1%) | 254 (35.3%) |
| $75,000 to $99,999 | 77 (11.2%) | 49 (6.8%) |
| $100,000+ | 115 (16.7%) | 45 (6.2%) |
| Total | 690 (100.0%) | 720 (100.0%) |
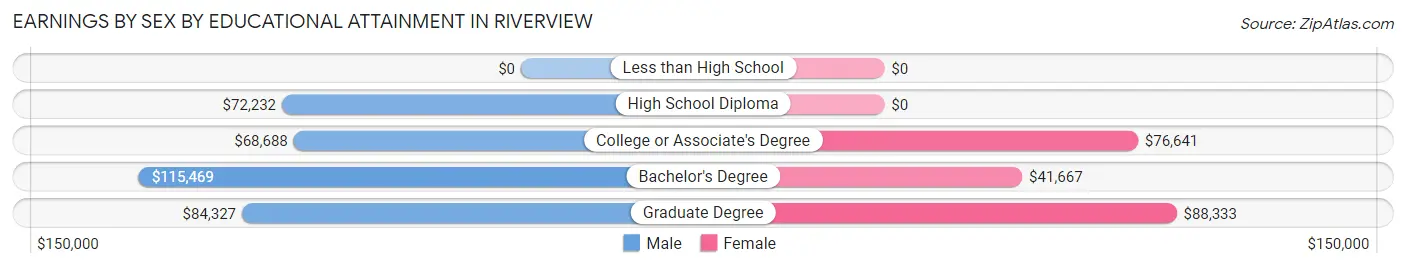
Earnings by Sex by Educational Attainment in Riverview
Average earnings in Riverview are $54,614 for men and $66,035 for women, a difference of 17.3%. Men with an educational attainment of bachelor's degree enjoy the highest average annual earnings of $115,469, while those with college or associate's degree education earn the least with $68,688. Women with an educational attainment of graduate degree earn the most with the average annual earnings of $88,333, while those with bachelor's degree education have the smallest earnings of $41,667.
| Educational Attainment | Male Income | Female Income |
| Less than High School | - | - |
| High School Diploma | $72,232 | $0 |
| College or Associate's Degree | $68,688 | $76,641 |
| Bachelor's Degree | $115,469 | $41,667 |
| Graduate Degree | $84,327 | $88,333 |
| Total | $54,614 | $66,035 |
Family Income in Riverview
Family Income Brackets in Riverview
According to the Riverview family income data, there are 298 families falling into the $100,000 to $149,999 income range, which is the most common income bracket and makes up 50.1% of all families.
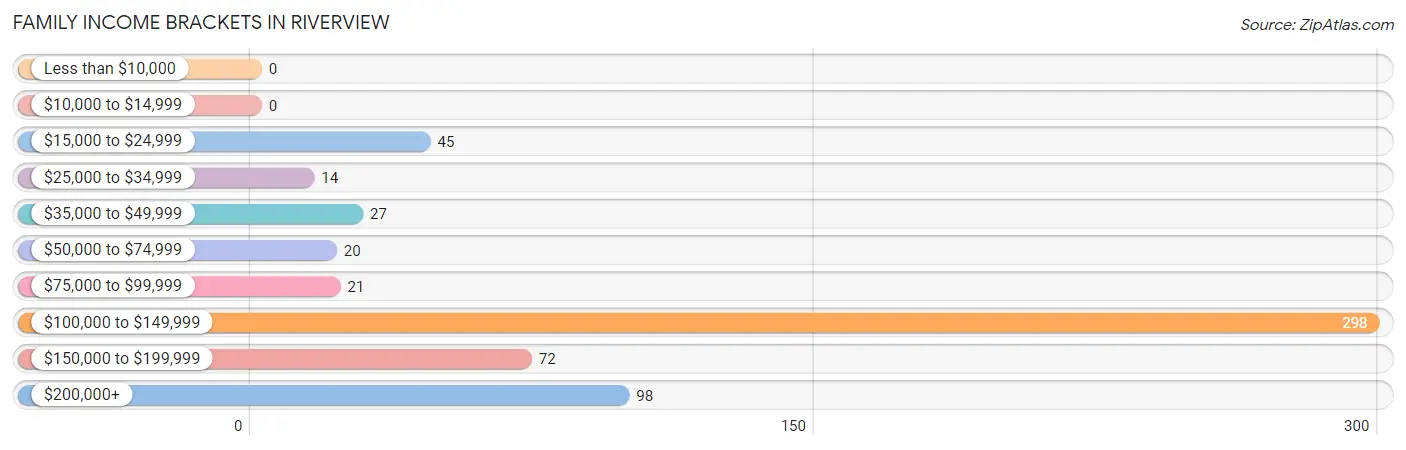
| Income Bracket | # Families | % Families |
| Less than $10,000 | 0 | 0.0% |
| $10,000 to $14,999 | 0 | 0.0% |
| $15,000 to $24,999 | 45 | 7.6% |
| $25,000 to $34,999 | 14 | 2.4% |
| $35,000 to $49,999 | 27 | 4.5% |
| $50,000 to $74,999 | 20 | 3.4% |
| $75,000 to $99,999 | 21 | 3.5% |
| $100,000 to $149,999 | 298 | 50.1% |
| $150,000 to $199,999 | 72 | 12.1% |
| $200,000+ | 98 | 16.5% |
Family Income by Famaliy Size in Riverview
4-person families (88 | 14.8%) account for the highest median family income in Riverview with $214,375 per family, while 4-person families (88 | 14.8%) have the highest median income of $53,594 per family member.
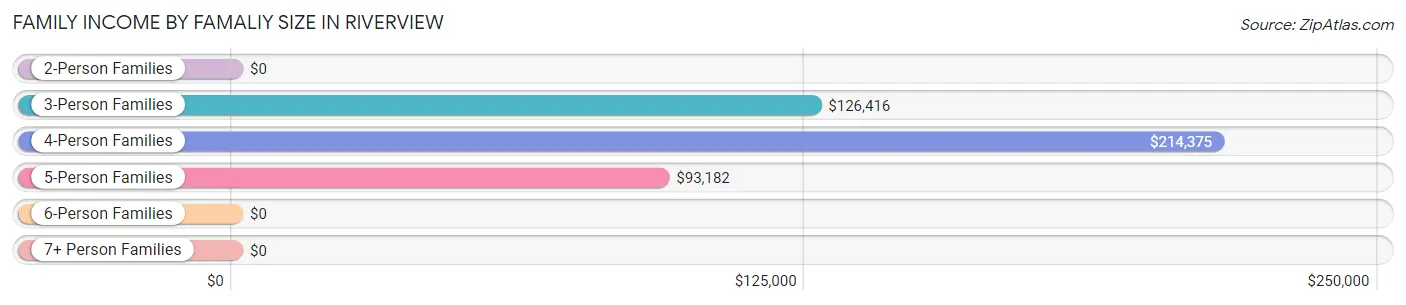
| Income Bracket | # Families | Median Income |
| 2-Person Families | 140 (23.5%) | $0 |
| 3-Person Families | 302 (50.8%) | $126,416 |
| 4-Person Families | 88 (14.8%) | $214,375 |
| 5-Person Families | 46 (7.7%) | $93,182 |
| 6-Person Families | 19 (3.2%) | $0 |
| 7+ Person Families | 0 (0.0%) | $0 |
| Total | 595 (100.0%) | $126,427 |
Family Income by Number of Earners in Riverview
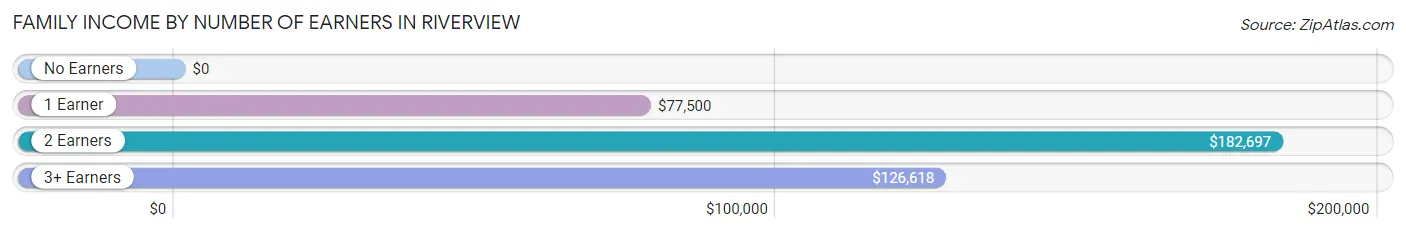
| Number of Earners | # Families | Median Income |
| No Earners | 72 (12.1%) | $0 |
| 1 Earner | 68 (11.4%) | $77,500 |
| 2 Earners | 147 (24.7%) | $182,697 |
| 3+ Earners | 308 (51.8%) | $126,618 |
| Total | 595 (100.0%) | $126,427 |
Household Income in Riverview
Household Income Brackets in Riverview
With 315 households falling in the category, the $100,000 to $149,999 income range is the most frequent in Riverview, accounting for 44.6% of all households.
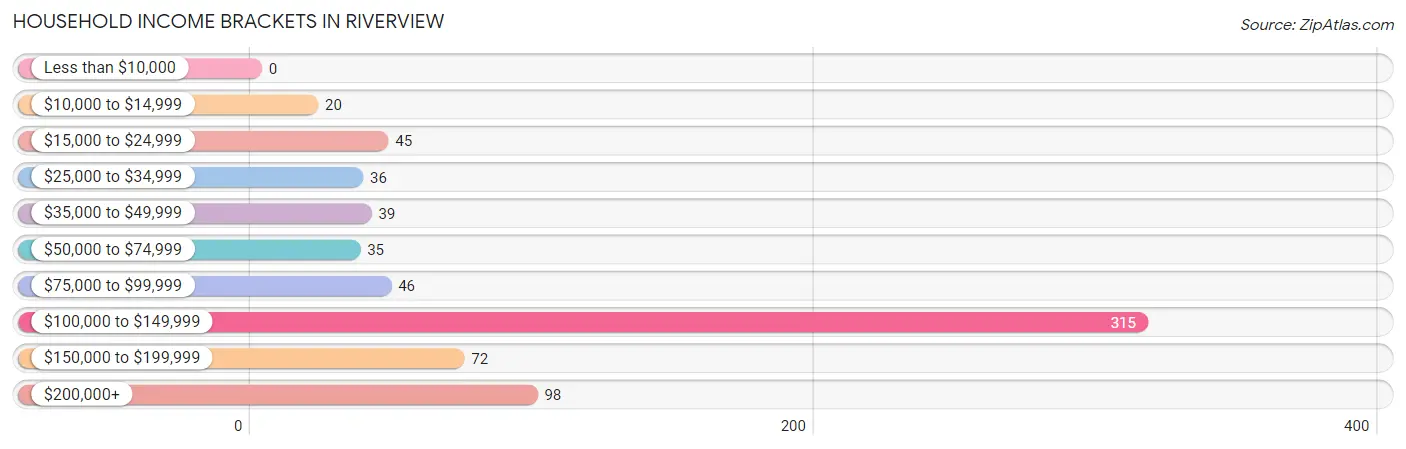
| Income Bracket | # Households | % Households |
| Less than $10,000 | 0 | 0.0% |
| $10,000 to $14,999 | 20 | 2.8% |
| $15,000 to $24,999 | 45 | 6.4% |
| $25,000 to $34,999 | 36 | 5.1% |
| $35,000 to $49,999 | 39 | 5.5% |
| $50,000 to $74,999 | 35 | 5.0% |
| $75,000 to $99,999 | 46 | 6.5% |
| $100,000 to $149,999 | 315 | 44.6% |
| $150,000 to $199,999 | 72 | 10.2% |
| $200,000+ | 98 | 13.9% |
Household Income by Householder Age in Riverview
The median household income in Riverview is $125,897, with the highest median household income of $149,333 found in the 45 to 64 years age bracket for the primary householder. A total of 170 households (24.1%) fall into this category.
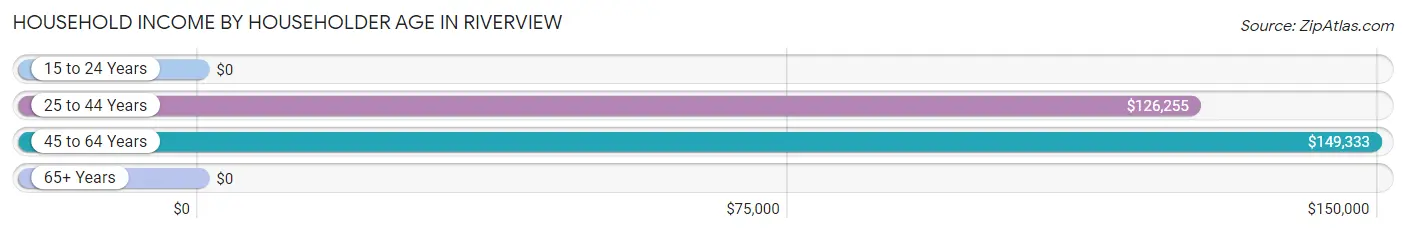
| Income Bracket | # Households | Median Income |
| 15 to 24 Years | 0 (0.0%) | $0 |
| 25 to 44 Years | 376 (53.3%) | $126,255 |
| 45 to 64 Years | 170 (24.1%) | $149,333 |
| 65+ Years | 160 (22.7%) | $0 |
| Total | 706 (100.0%) | $125,897 |
Poverty in Riverview
Income Below Poverty by Sex and Age in Riverview
With 4.8% poverty level for males and 3.8% for females among the residents of Riverview, 75 year old and over males and 75 year old and over females are the most vulnerable to poverty, with 45 males (100.0%) and 41 females (100.0%) in their respective age groups living below the poverty level.
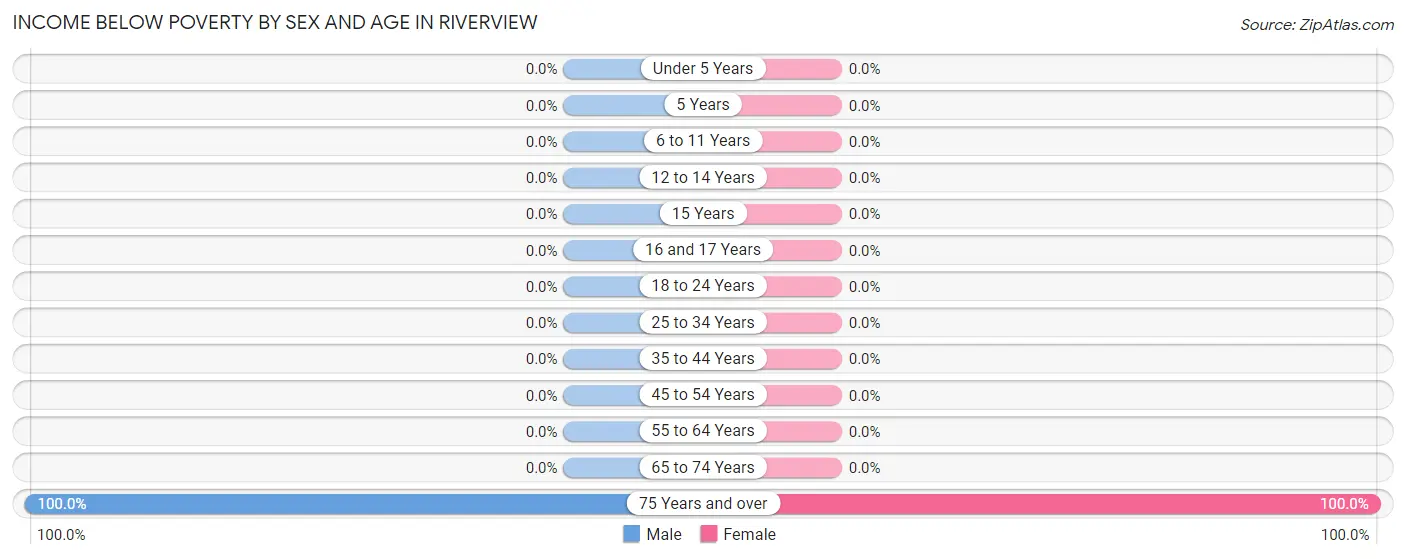
| Age Bracket | Male | Female |
| Under 5 Years | 0 (0.0%) | 0 (0.0%) |
| 5 Years | 0 (0.0%) | 0 (0.0%) |
| 6 to 11 Years | 0 (0.0%) | 0 (0.0%) |
| 12 to 14 Years | 0 (0.0%) | 0 (0.0%) |
| 15 Years | 0 (0.0%) | 0 (0.0%) |
| 16 and 17 Years | 0 (0.0%) | 0 (0.0%) |
| 18 to 24 Years | 0 (0.0%) | 0 (0.0%) |
| 25 to 34 Years | 0 (0.0%) | 0 (0.0%) |
| 35 to 44 Years | 0 (0.0%) | 0 (0.0%) |
| 45 to 54 Years | 0 (0.0%) | 0 (0.0%) |
| 55 to 64 Years | 0 (0.0%) | 0 (0.0%) |
| 65 to 74 Years | 0 (0.0%) | 0 (0.0%) |
| 75 Years and over | 45 (100.0%) | 41 (100.0%) |
| Total | 45 (4.8%) | 41 (3.8%) |
Income Above Poverty by Sex and Age in Riverview
According to the poverty statistics in Riverview, males aged under 5 years and females aged under 5 years are the age groups that are most secure financially, with 100.0% of males and 100.0% of females in these age groups living above the poverty line.
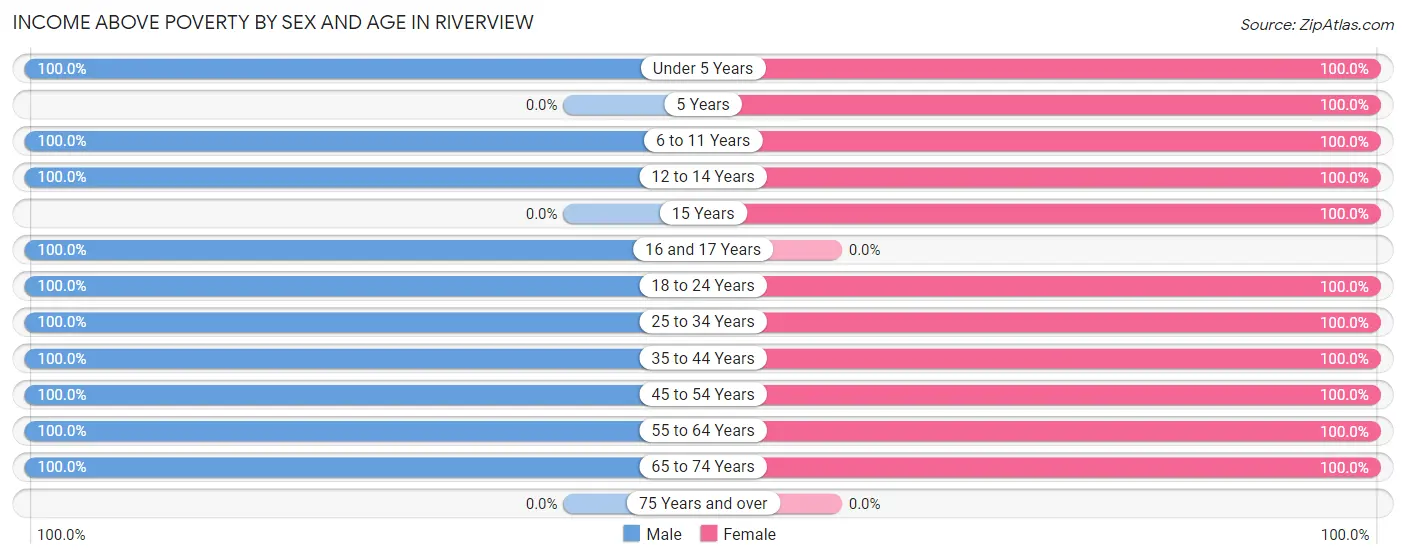
| Age Bracket | Male | Female |
| Under 5 Years | 13 (100.0%) | 79 (100.0%) |
| 5 Years | 0 (0.0%) | 21 (100.0%) |
| 6 to 11 Years | 63 (100.0%) | 57 (100.0%) |
| 12 to 14 Years | 47 (100.0%) | 12 (100.0%) |
| 15 Years | 0 (0.0%) | 13 (100.0%) |
| 16 and 17 Years | 42 (100.0%) | 0 (0.0%) |
| 18 to 24 Years | 35 (100.0%) | 221 (100.0%) |
| 25 to 34 Years | 47 (100.0%) | 68 (100.0%) |
| 35 to 44 Years | 455 (100.0%) | 321 (100.0%) |
| 45 to 54 Years | 79 (100.0%) | 72 (100.0%) |
| 55 to 64 Years | 58 (100.0%) | 84 (100.0%) |
| 65 to 74 Years | 53 (100.0%) | 84 (100.0%) |
| 75 Years and over | 0 (0.0%) | 0 (0.0%) |
| Total | 892 (95.2%) | 1,032 (96.2%) |
Income Below Poverty Among Married-Couple Families in Riverview
The poverty statistics for married-couple families in Riverview show that 8.0% or 45 of the total 560 families live below the poverty line. Families with no children have the highest poverty rate of 11.4%, comprising of 45 families. On the other hand, families with 1 or 2 children have the lowest poverty rate of 0.0%, which includes 0 families.
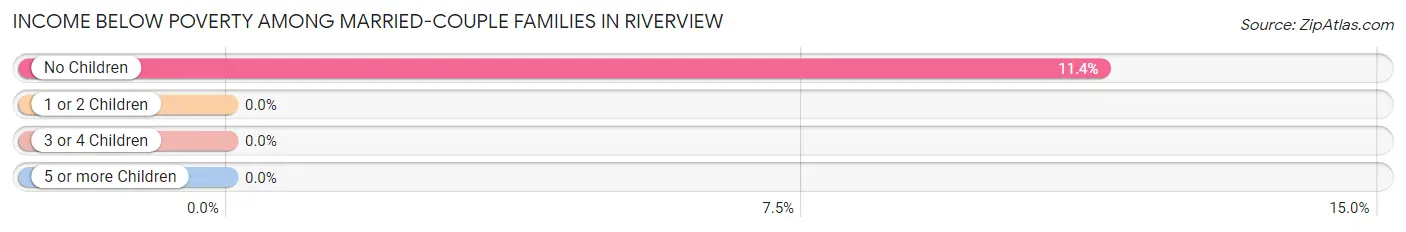
| Children | Above Poverty | Below Poverty |
| No Children | 350 (88.6%) | 45 (11.4%) |
| 1 or 2 Children | 115 (100.0%) | 0 (0.0%) |
| 3 or 4 Children | 50 (100.0%) | 0 (0.0%) |
| 5 or more Children | 0 (0.0%) | 0 (0.0%) |
| Total | 515 (92.0%) | 45 (8.0%) |
Income Below Poverty Among Single-Parent Households in Riverview
| Children | Single Father | Single Mother |
| No Children | 0 (0.0%) | 0 (0.0%) |
| 1 or 2 Children | 0 (0.0%) | 0 (0.0%) |
| 3 or 4 Children | 0 (0.0%) | 0 (0.0%) |
| 5 or more Children | 0 (0.0%) | 0 (0.0%) |
| Total | 0 (0.0%) | 0 (0.0%) |
Income Below Poverty Among Married-Couple vs Single-Parent Households in Riverview
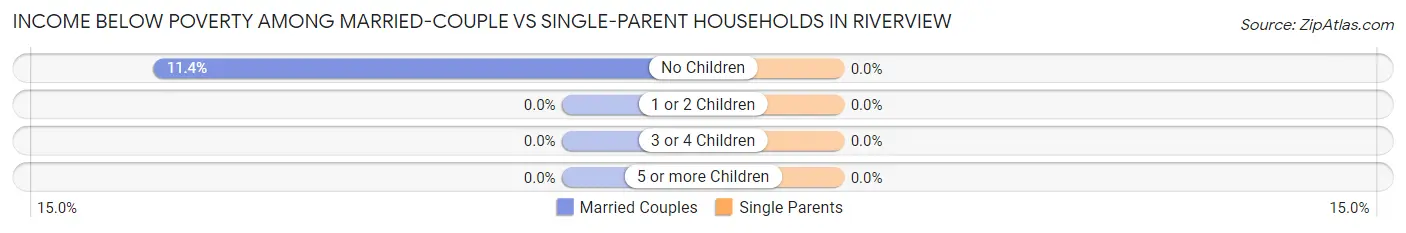
| Children | Married-Couple Families | Single-Parent Households |
| No Children | 45 (11.4%) | 0 (0.0%) |
| 1 or 2 Children | 0 (0.0%) | 0 (0.0%) |
| 3 or 4 Children | 0 (0.0%) | 0 (0.0%) |
| 5 or more Children | 0 (0.0%) | 0 (0.0%) |
| Total | 45 (8.0%) | 0 (0.0%) |
Race in Riverview
The most populous races in Riverview are White / Caucasian (1,714 | 85.3%), Black / African American (108 | 5.4%), and Asian (93 | 4.6%).
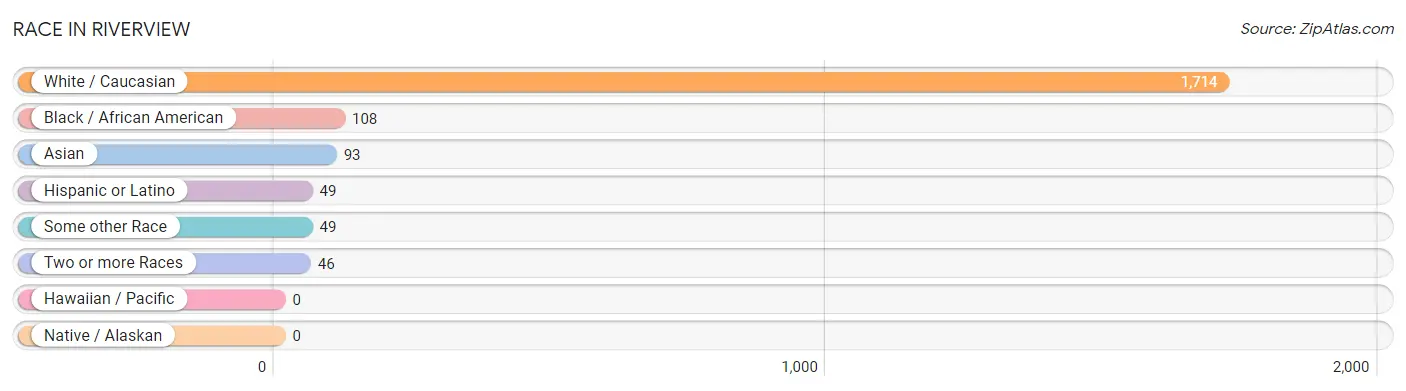
| Race | # Population | % Population |
| Asian | 93 | 4.6% |
| Black / African American | 108 | 5.4% |
| Hawaiian / Pacific | 0 | 0.0% |
| Hispanic or Latino | 49 | 2.4% |
| Native / Alaskan | 0 | 0.0% |
| White / Caucasian | 1,714 | 85.3% |
| Two or more Races | 46 | 2.3% |
| Some other Race | 49 | 2.4% |
| Total | 2,010 | 100.0% |
Ancestry in Riverview
The most populous ancestries reported in Riverview are Irish (219 | 10.9%), German (190 | 9.5%), Italian (122 | 6.1%), Danish (110 | 5.5%), and Swedish (103 | 5.1%), together accounting for 37.0% of all Riverview residents.
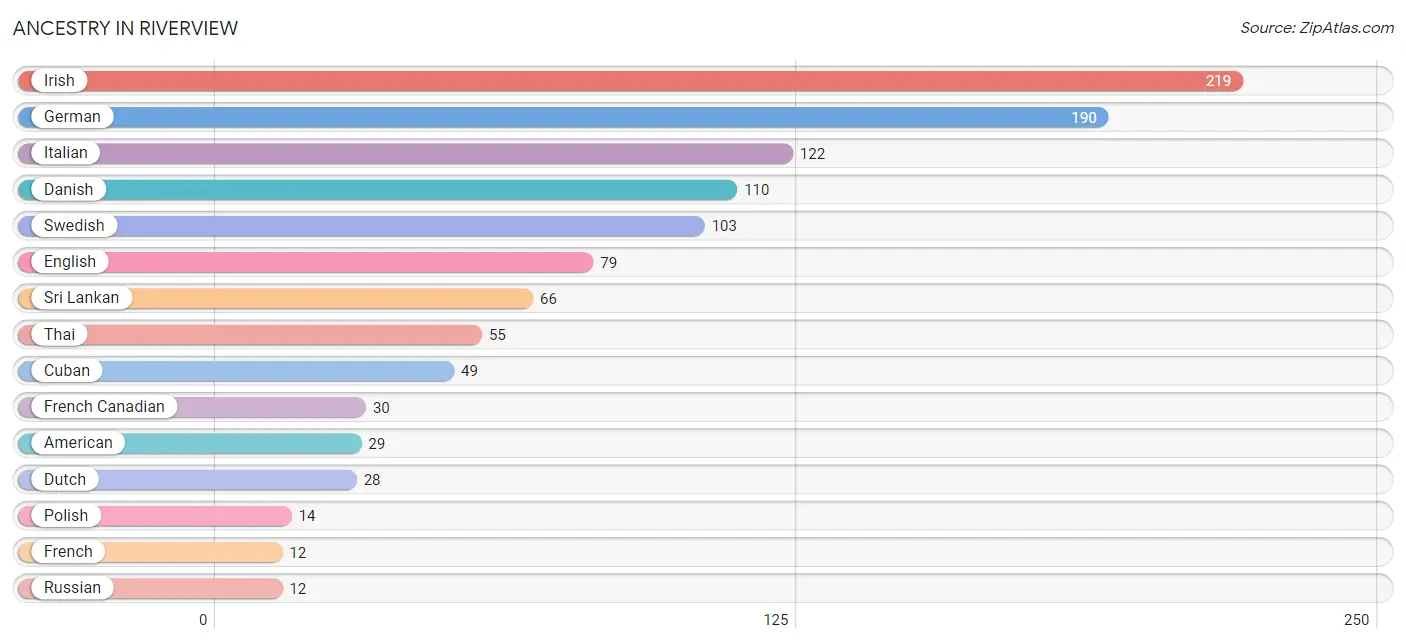
| Ancestry | # Population | % Population |
| American | 29 | 1.4% |
| Cherokee | 7 | 0.4% |
| Cuban | 49 | 2.4% |
| Danish | 110 | 5.5% |
| Dutch | 28 | 1.4% |
| English | 79 | 3.9% |
| French | 12 | 0.6% |
| French Canadian | 30 | 1.5% |
| German | 190 | 9.5% |
| Irish | 219 | 10.9% |
| Italian | 122 | 6.1% |
| Polish | 14 | 0.7% |
| Russian | 12 | 0.6% |
| Scottish | 12 | 0.6% |
| Sri Lankan | 66 | 3.3% |
| Swedish | 103 | 5.1% |
| Thai | 55 | 2.7% | View All 17 Rows |
Immigrants in Riverview
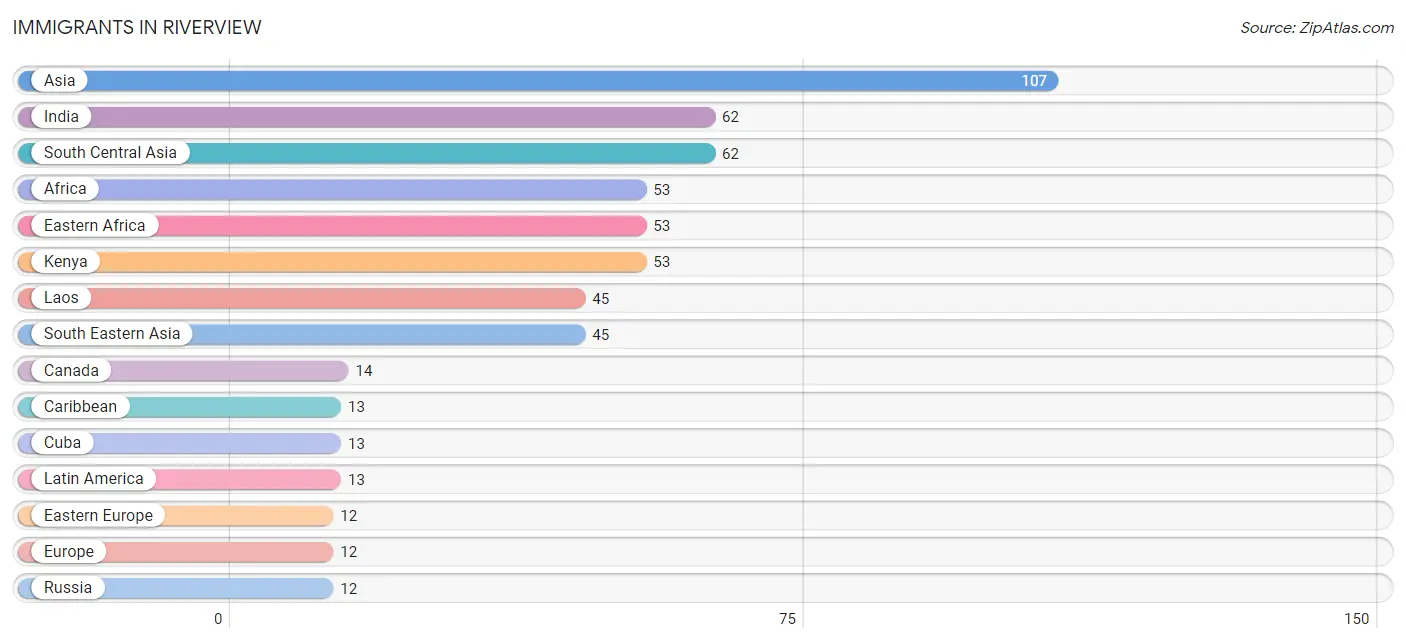
The most numerous immigrant groups reported in Riverview came from Asia (107 | 5.3%), India (62 | 3.1%), South Central Asia (62 | 3.1%), Africa (53 | 2.6%), and Eastern Africa (53 | 2.6%), together accounting for 16.8% of all Riverview residents.
| Immigration Origin | # Population | % Population |
| Africa | 53 | 2.6% |
| Asia | 107 | 5.3% |
| Canada | 14 | 0.7% |
| Caribbean | 13 | 0.6% |
| Cuba | 13 | 0.6% |
| Eastern Africa | 53 | 2.6% |
| Eastern Europe | 12 | 0.6% |
| Europe | 12 | 0.6% |
| India | 62 | 3.1% |
| Kenya | 53 | 2.6% |
| Laos | 45 | 2.2% |
| Latin America | 13 | 0.6% |
| Russia | 12 | 0.6% |
| South Central Asia | 62 | 3.1% |
| South Eastern Asia | 45 | 2.2% | View All 15 Rows |
Sex and Age in Riverview
Sex and Age in Riverview
The most populous age groups in Riverview are 40 to 44 Years (374 | 39.9%) for men and 40 to 44 Years (264 | 24.6%) for women.
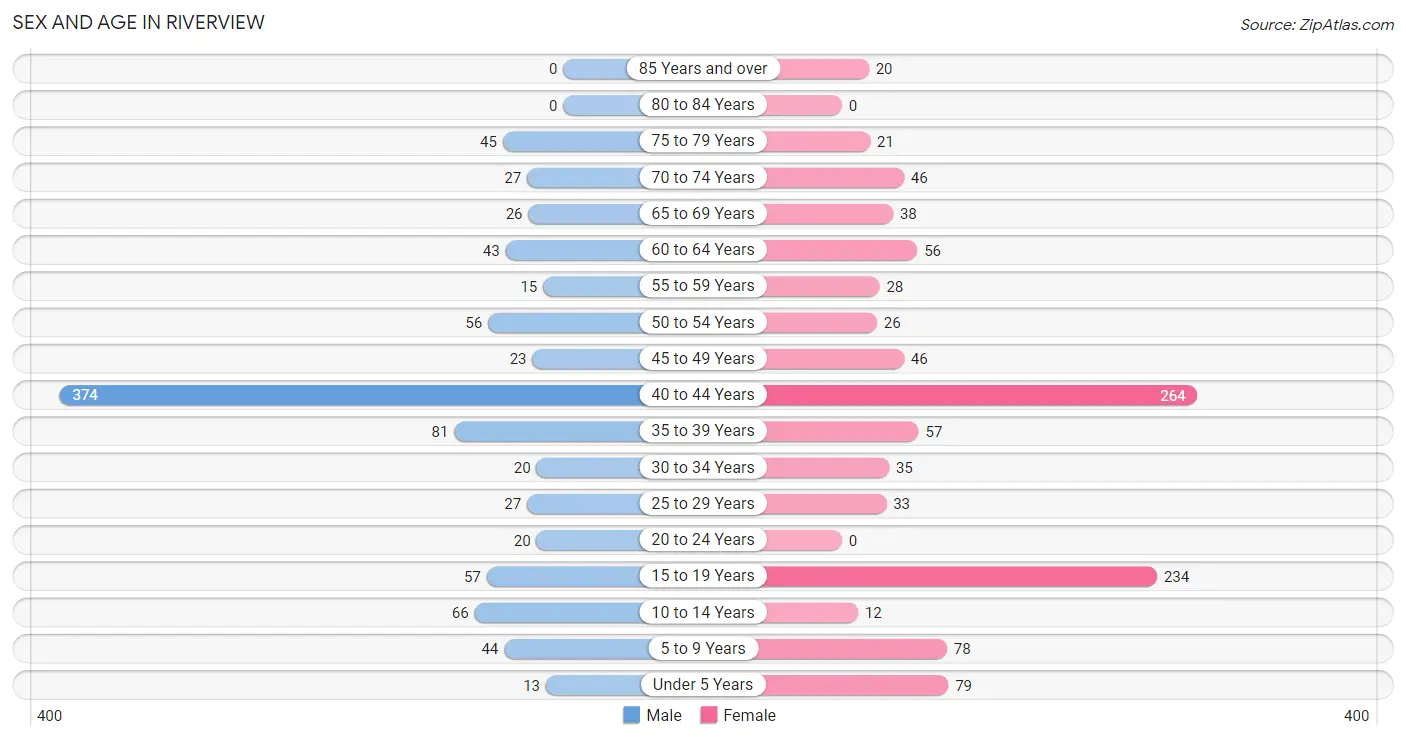
| Age Bracket | Male | Female |
| Under 5 Years | 13 (1.4%) | 79 (7.4%) |
| 5 to 9 Years | 44 (4.7%) | 78 (7.3%) |
| 10 to 14 Years | 66 (7.0%) | 12 (1.1%) |
| 15 to 19 Years | 57 (6.1%) | 234 (21.8%) |
| 20 to 24 Years | 20 (2.1%) | 0 (0.0%) |
| 25 to 29 Years | 27 (2.9%) | 33 (3.1%) |
| 30 to 34 Years | 20 (2.1%) | 35 (3.3%) |
| 35 to 39 Years | 81 (8.6%) | 57 (5.3%) |
| 40 to 44 Years | 374 (39.9%) | 264 (24.6%) |
| 45 to 49 Years | 23 (2.5%) | 46 (4.3%) |
| 50 to 54 Years | 56 (6.0%) | 26 (2.4%) |
| 55 to 59 Years | 15 (1.6%) | 28 (2.6%) |
| 60 to 64 Years | 43 (4.6%) | 56 (5.2%) |
| 65 to 69 Years | 26 (2.8%) | 38 (3.5%) |
| 70 to 74 Years | 27 (2.9%) | 46 (4.3%) |
| 75 to 79 Years | 45 (4.8%) | 21 (2.0%) |
| 80 to 84 Years | 0 (0.0%) | 0 (0.0%) |
| 85 Years and over | 0 (0.0%) | 20 (1.9%) |
| Total | 937 (100.0%) | 1,073 (100.0%) |
Families and Households in Riverview
Median Family Size in Riverview
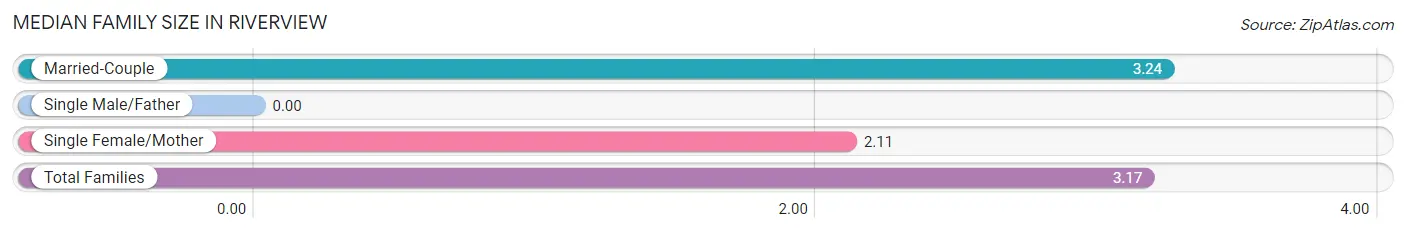
| Family Type | # Families | Family Size |
| Married-Couple | 560 (94.1%) | 3.24 |
| Single Male/Father | 0 (0.0%) | - |
| Single Female/Mother | 35 (5.9%) | 2.11 |
| Total Families | 595 (100.0%) | 3.17 |
Median Household Size in Riverview
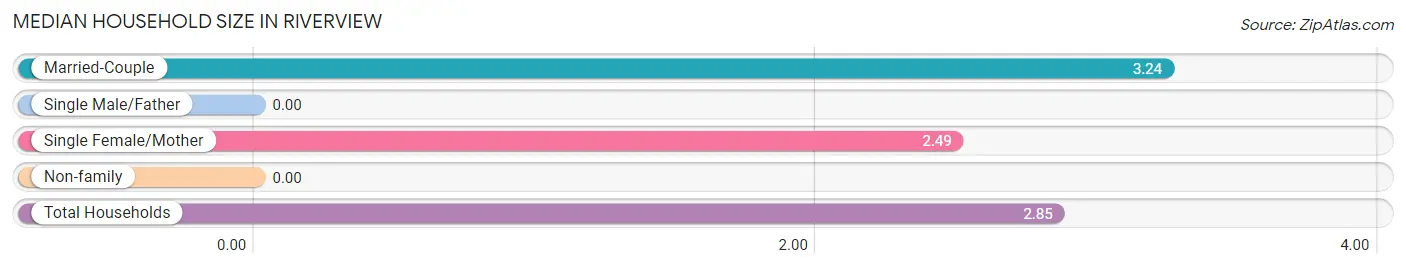
| Household Type | # Households | Household Size |
| Married-Couple | 560 (79.3%) | 3.24 |
| Single Male/Father | 0 (0.0%) | - |
| Single Female/Mother | 35 (5.0%) | 2.49 |
| Non-family | 111 (15.7%) | - |
| Total Households | 706 (100.0%) | 2.85 |
Household Size by Marriage Status in Riverview
Out of a total of 706 households in Riverview, 595 (84.3%) are family households, while 111 (15.7%) are nonfamily households. The most numerous type of family households are 3-person households, comprising 316, and the most common type of nonfamily households are 1-person households, comprising 111.
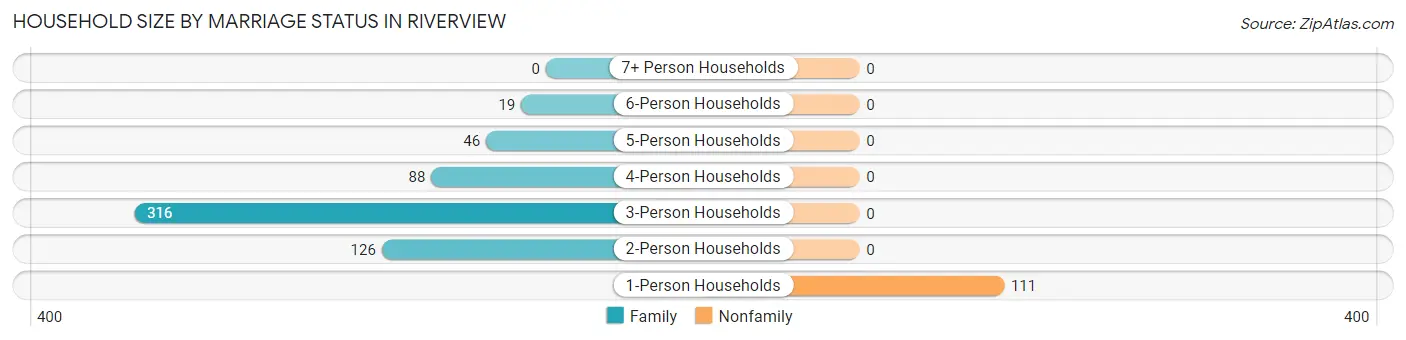
| Household Size | Family Households | Nonfamily Households |
| 1-Person Households | - | 111 (15.7%) |
| 2-Person Households | 126 (17.8%) | 0 (0.0%) |
| 3-Person Households | 316 (44.8%) | 0 (0.0%) |
| 4-Person Households | 88 (12.5%) | 0 (0.0%) |
| 5-Person Households | 46 (6.5%) | 0 (0.0%) |
| 6-Person Households | 19 (2.7%) | 0 (0.0%) |
| 7+ Person Households | 0 (0.0%) | 0 (0.0%) |
| Total | 595 (84.3%) | 111 (15.7%) |
Female Fertility in Riverview
Fertility by Age in Riverview
Average fertility rate in Riverview is 17.0 births per 1,000 women. Women in the age bracket of 35 to 50 years have the highest fertility rate with 31.0 births per 1,000 women. Women in the age bracket of 35 to 50 years acount for 100.0% of all women with births.
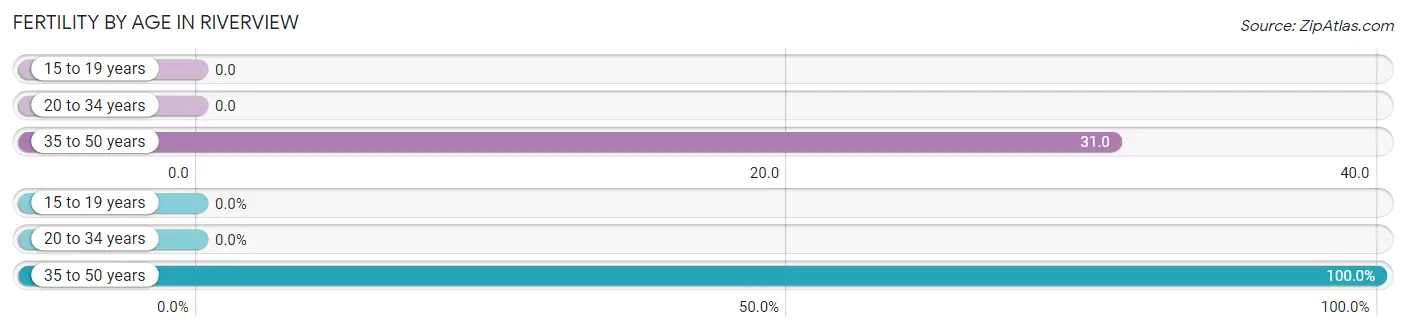
| Age Bracket | Women with Births | Births / 1,000 Women |
| 15 to 19 years | 0 (0.0%) | 0.0 |
| 20 to 34 years | 0 (0.0%) | 0.0 |
| 35 to 50 years | 12 (100.0%) | 31.0 |
| Total | 12 (100.0%) | 17.0 |
Fertility by Age by Marriage Status in Riverview
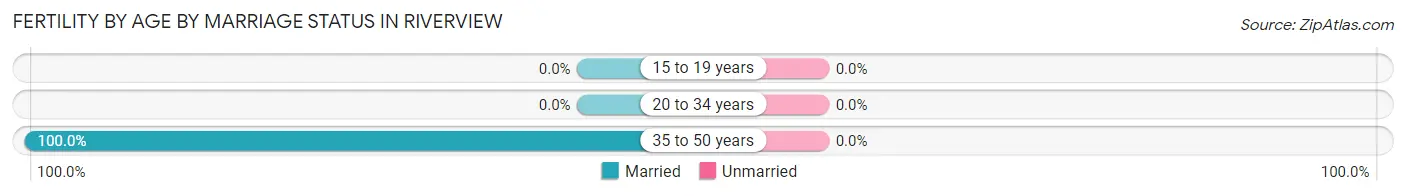
| Age Bracket | Married | Unmarried |
| 15 to 19 years | 0 (0.0%) | 0 (0.0%) |
| 20 to 34 years | 0 (0.0%) | 0 (0.0%) |
| 35 to 50 years | 12 (100.0%) | 0 (0.0%) |
| Total | 12 (100.0%) | 0 (0.0%) |
Fertility by Education in Riverview
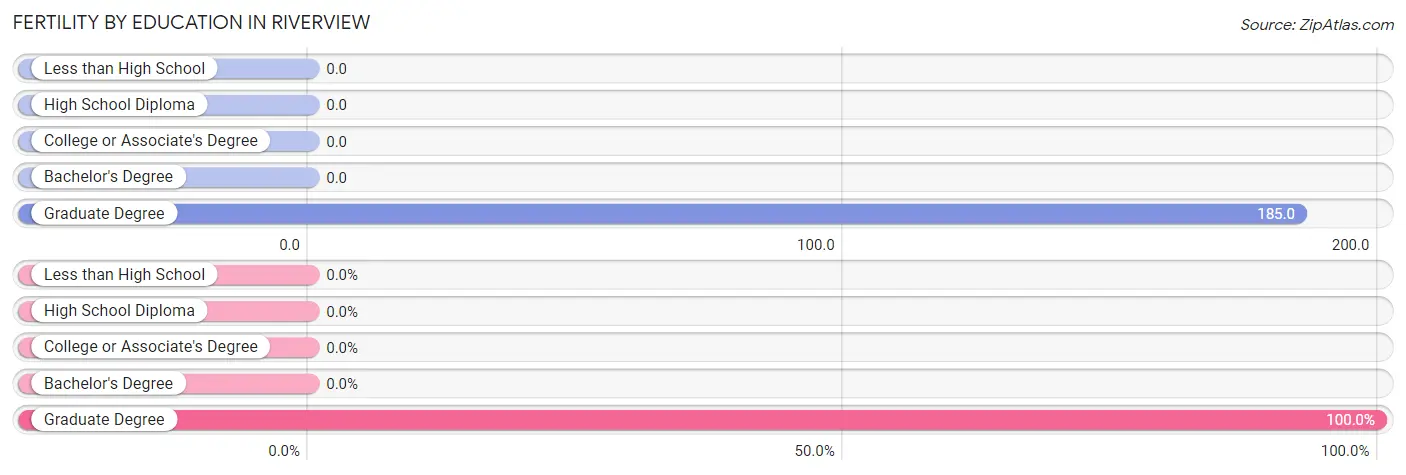
| Educational Attainment | Women with Births | Births / 1,000 Women |
| Less than High School | 0 (0.0%) | 0.0 |
| High School Diploma | 0 (0.0%) | 0.0 |
| College or Associate's Degree | 0 (0.0%) | 0.0 |
| Bachelor's Degree | 0 (0.0%) | 0.0 |
| Graduate Degree | 12 (100.0%) | 185.0 |
| Total | 12 (100.0%) | 17.0 |
Fertility by Education by Marriage Status in Riverview
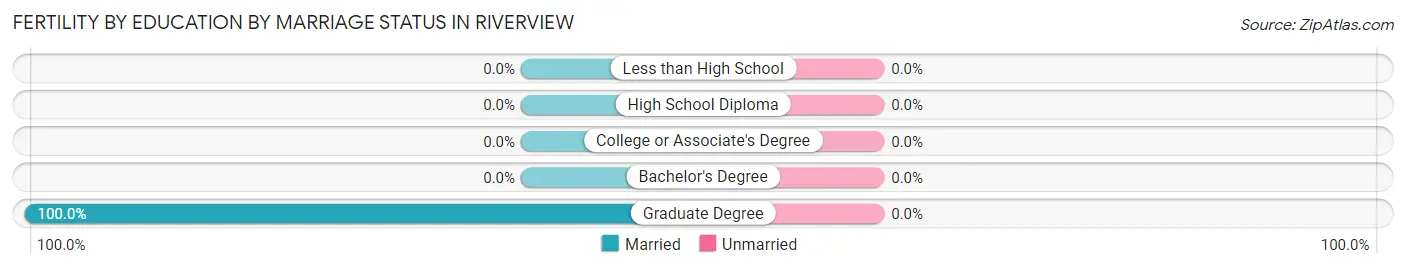
| Educational Attainment | Married | Unmarried |
| Less than High School | 0 (0.0%) | 0 (0.0%) |
| High School Diploma | 0 (0.0%) | 0 (0.0%) |
| College or Associate's Degree | 0 (0.0%) | 0 (0.0%) |
| Bachelor's Degree | 0 (0.0%) | 0 (0.0%) |
| Graduate Degree | 12 (100.0%) | 0 (0.0%) |
| Total | 12 (100.0%) | 0 (0.0%) |
Employment Characteristics in Riverview
Employment by Class of Employer in Riverview
Among the 1,158 employed individuals in Riverview, private company employees (783 | 67.6%), not-for-profit organizations (246 | 21.2%), and self-employed (not incorporated) (67 | 5.8%) make up the most common classes of employment.
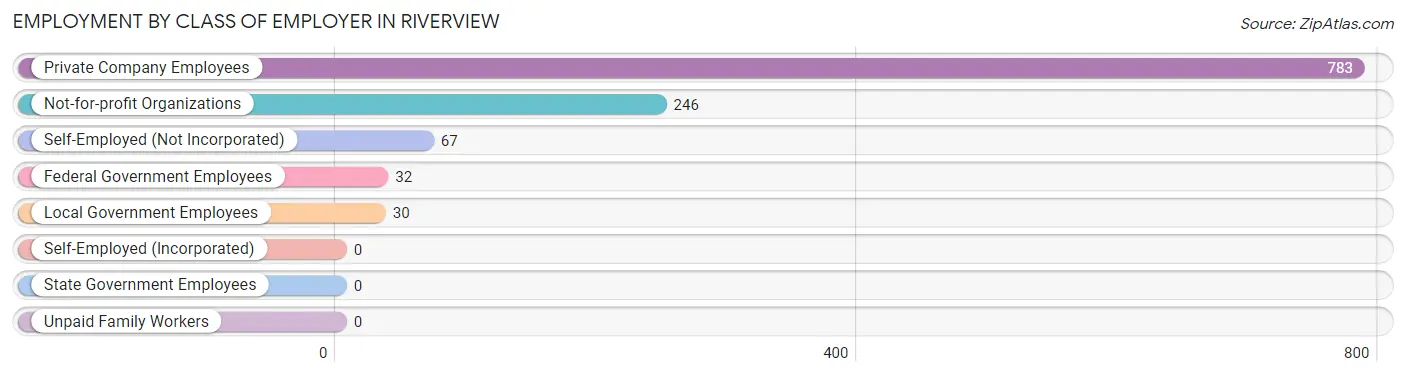
| Employer Class | # Employees | % Employees |
| Private Company Employees | 783 | 67.6% |
| Self-Employed (Incorporated) | 0 | 0.0% |
| Self-Employed (Not Incorporated) | 67 | 5.8% |
| Not-for-profit Organizations | 246 | 21.2% |
| Local Government Employees | 30 | 2.6% |
| State Government Employees | 0 | 0.0% |
| Federal Government Employees | 32 | 2.8% |
| Unpaid Family Workers | 0 | 0.0% |
| Total | 1,158 | 100.0% |
Employment Status by Age in Riverview
According to the labor force statistics for Riverview, out of the total population over 16 years of age (1,705), 80.9% or 1,379 individuals are in the labor force, with 16.3% or 225 of them unemployed. The age group with the highest labor force participation rate is 20 to 24 years, with 100.0% or 20 individuals in the labor force. Within the labor force, the 16 to 19 years age range has the highest percentage of unemployed individuals, with 84.4% or 221 of them being unemployed.
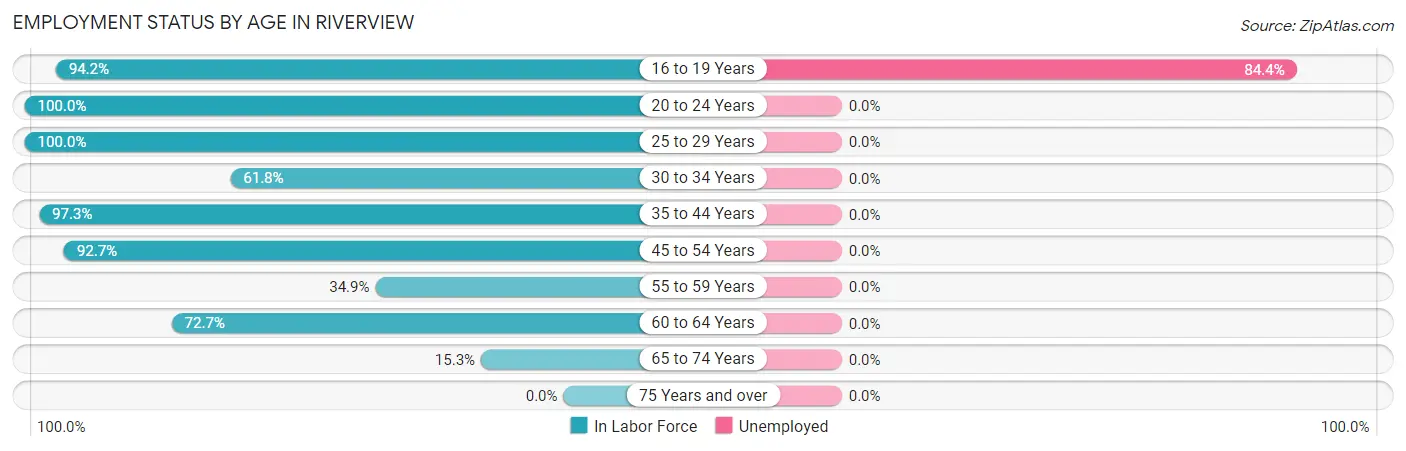
| Age Bracket | In Labor Force | Unemployed |
| 16 to 19 Years | 262 (94.2%) | 221 (84.4%) |
| 20 to 24 Years | 20 (100.0%) | 0 (0.0%) |
| 25 to 29 Years | 60 (100.0%) | 0 (0.0%) |
| 30 to 34 Years | 34 (61.8%) | 0 (0.0%) |
| 35 to 44 Years | 755 (97.3%) | 0 (0.0%) |
| 45 to 54 Years | 140 (92.7%) | 0 (0.0%) |
| 55 to 59 Years | 15 (34.9%) | 0 (0.0%) |
| 60 to 64 Years | 72 (72.7%) | 0 (0.0%) |
| 65 to 74 Years | 21 (15.3%) | 0 (0.0%) |
| 75 Years and over | 0 (0.0%) | 0 (0.0%) |
| Total | 1,379 (80.9%) | 225 (16.3%) |
Employment Status by Educational Attainment in Riverview
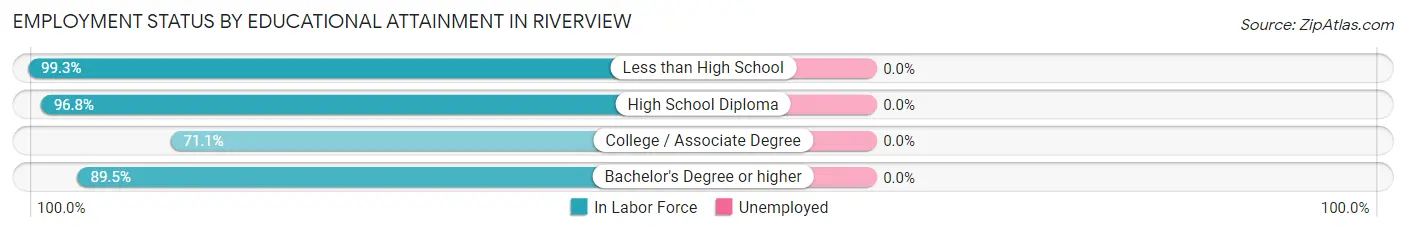
| Educational Attainment | In Labor Force | Unemployed |
| Less than High School | 301 (99.3%) | 0 (0.0%) |
| High School Diploma | 303 (96.8%) | 0 (0.0%) |
| College / Associate Degree | 140 (71.1%) | 0 (0.0%) |
| Bachelor's Degree or higher | 332 (89.5%) | 0 (0.0%) |
| Total | 1,076 (90.9%) | 0 (0.0%) |
Employment Occupations by Sex in Riverview
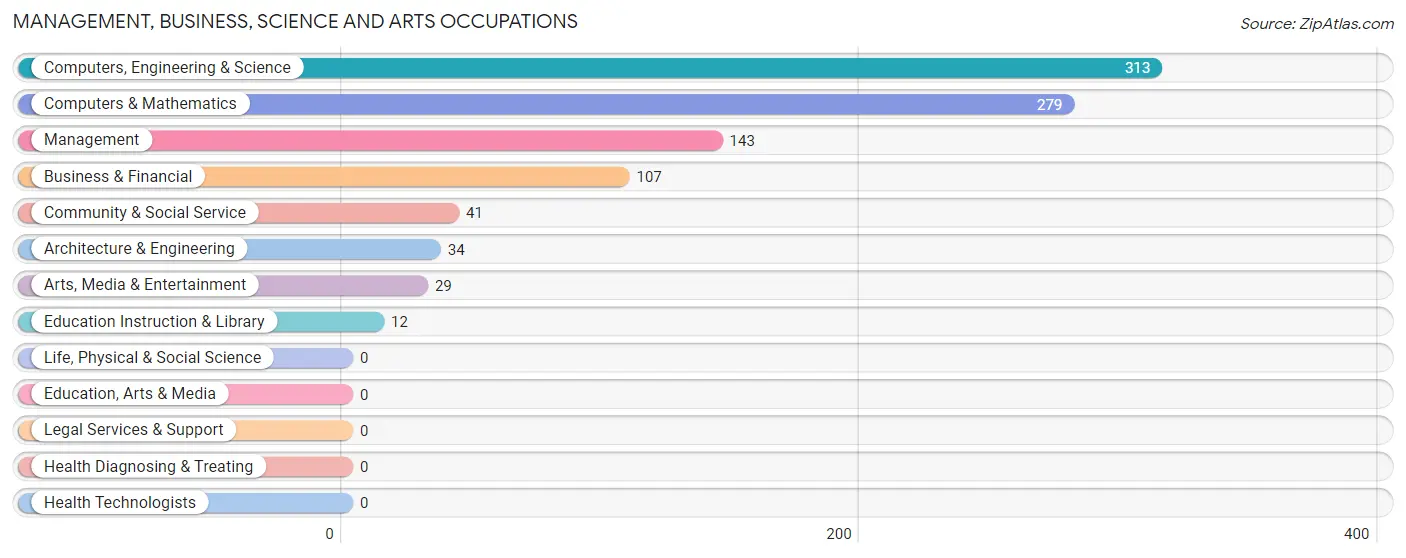
Management, Business, Science and Arts Occupations
The most common Management, Business, Science and Arts occupations in Riverview are Computers, Engineering & Science (313 | 27.5%), Computers & Mathematics (279 | 24.5%), Management (143 | 12.6%), Business & Financial (107 | 9.4%), and Community & Social Service (41 | 3.6%).
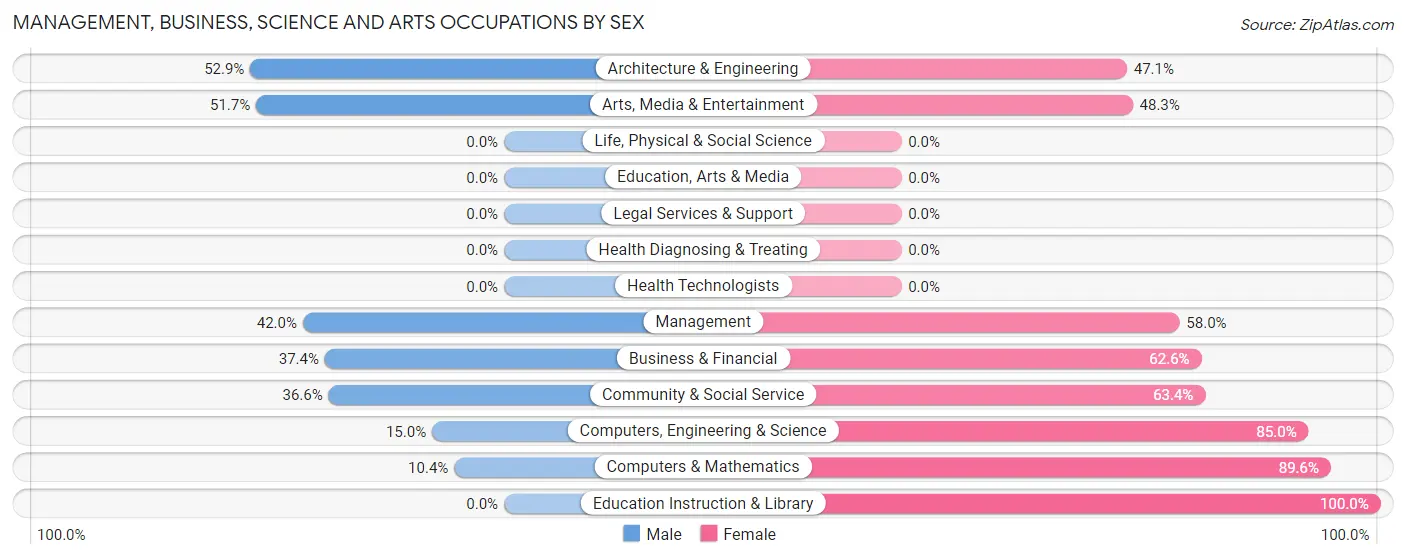
Management, Business, Science and Arts Occupations by Sex
Within the Management, Business, Science and Arts occupations in Riverview, the most male-oriented occupations are Architecture & Engineering (52.9%), Arts, Media & Entertainment (51.7%), and Management (42.0%), while the most female-oriented occupations are Education Instruction & Library (100.0%), Computers & Mathematics (89.6%), and Computers, Engineering & Science (85.0%).
| Occupation | Male | Female |
| Management | 60 (42.0%) | 83 (58.0%) |
| Business & Financial | 40 (37.4%) | 67 (62.6%) |
| Computers, Engineering & Science | 47 (15.0%) | 266 (85.0%) |
| Computers & Mathematics | 29 (10.4%) | 250 (89.6%) |
| Architecture & Engineering | 18 (52.9%) | 16 (47.1%) |
| Life, Physical & Social Science | 0 (0.0%) | 0 (0.0%) |
| Community & Social Service | 15 (36.6%) | 26 (63.4%) |
| Education, Arts & Media | 0 (0.0%) | 0 (0.0%) |
| Legal Services & Support | 0 (0.0%) | 0 (0.0%) |
| Education Instruction & Library | 0 (0.0%) | 12 (100.0%) |
| Arts, Media & Entertainment | 15 (51.7%) | 14 (48.3%) |
| Health Diagnosing & Treating | 0 (0.0%) | 0 (0.0%) |
| Health Technologists | 0 (0.0%) | 0 (0.0%) |
| Total (Category) | 162 (26.8%) | 442 (73.2%) |
| Total (Overall) | 670 (58.9%) | 468 (41.1%) |
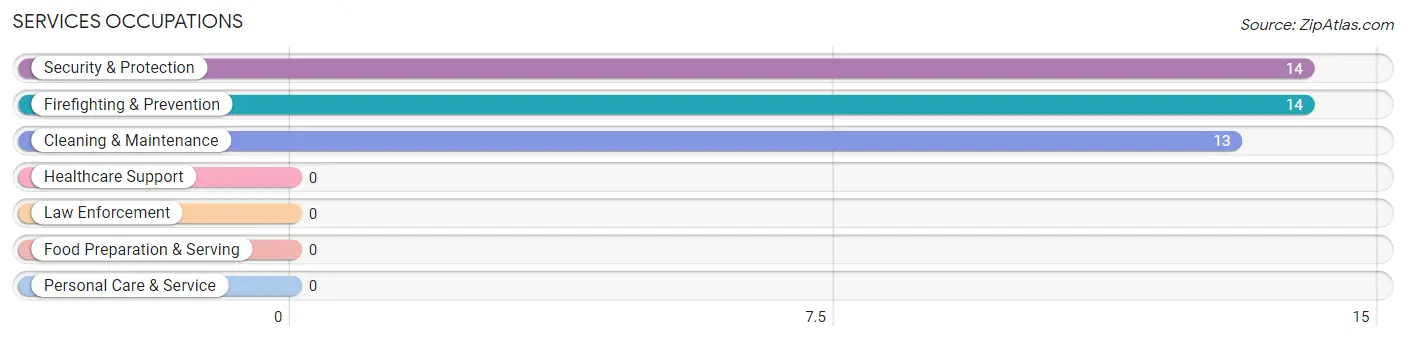
Services Occupations
The most common Services occupations in Riverview are Security & Protection (14 | 1.2%), Firefighting & Prevention (14 | 1.2%), and Cleaning & Maintenance (13 | 1.1%).
Services Occupations by Sex
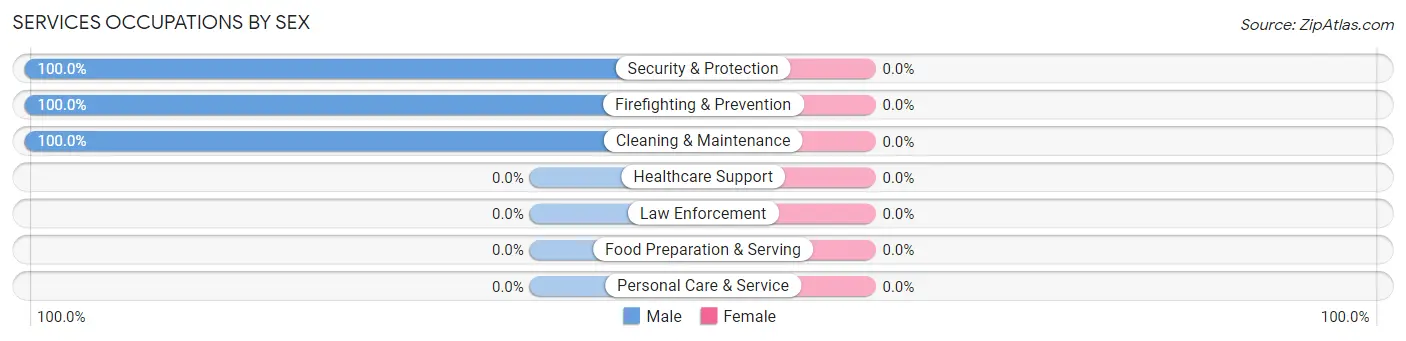
| Occupation | Male | Female |
| Healthcare Support | 0 (0.0%) | 0 (0.0%) |
| Security & Protection | 14 (100.0%) | 0 (0.0%) |
| Firefighting & Prevention | 14 (100.0%) | 0 (0.0%) |
| Law Enforcement | 0 (0.0%) | 0 (0.0%) |
| Food Preparation & Serving | 0 (0.0%) | 0 (0.0%) |
| Cleaning & Maintenance | 13 (100.0%) | 0 (0.0%) |
| Personal Care & Service | 0 (0.0%) | 0 (0.0%) |
| Total (Category) | 27 (100.0%) | 0 (0.0%) |
| Total (Overall) | 670 (58.9%) | 468 (41.1%) |
Sales and Office Occupations
The most common Sales and Office occupations in Riverview are Sales & Related (66 | 5.8%), and Office & Administration (15 | 1.3%).

Sales and Office Occupations by Sex

| Occupation | Male | Female |
| Sales & Related | 40 (60.6%) | 26 (39.4%) |
| Office & Administration | 15 (100.0%) | 0 (0.0%) |
| Total (Category) | 55 (67.9%) | 26 (32.1%) |
| Total (Overall) | 670 (58.9%) | 468 (41.1%) |
Natural Resources, Construction and Maintenance Occupations
The most common Natural Resources, Construction and Maintenance occupations in Riverview are Construction & Extraction (301 | 26.5%), and Installation, Maintenance & Repair (34 | 3.0%).

Natural Resources, Construction and Maintenance Occupations by Sex
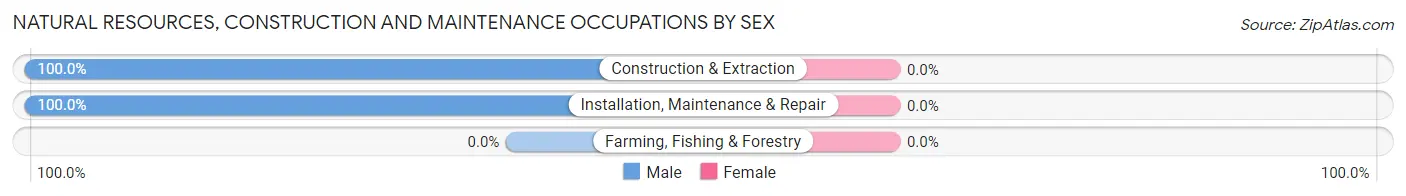
| Occupation | Male | Female |
| Farming, Fishing & Forestry | 0 (0.0%) | 0 (0.0%) |
| Construction & Extraction | 301 (100.0%) | 0 (0.0%) |
| Installation, Maintenance & Repair | 34 (100.0%) | 0 (0.0%) |
| Total (Category) | 335 (100.0%) | 0 (0.0%) |
| Total (Overall) | 670 (58.9%) | 468 (41.1%) |
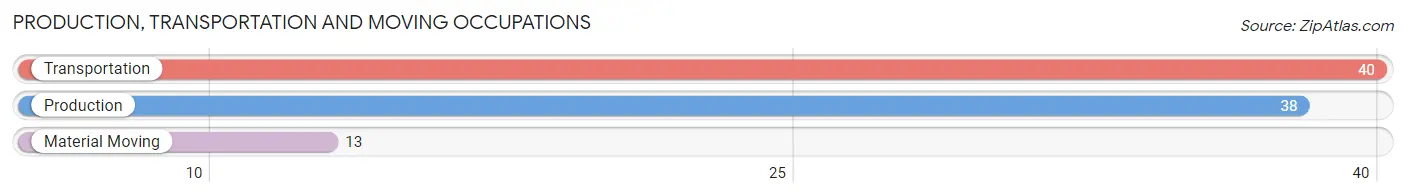
Production, Transportation and Moving Occupations
The most common Production, Transportation and Moving occupations in Riverview are Transportation (40 | 3.5%), Production (38 | 3.3%), and Material Moving (13 | 1.1%).
Production, Transportation and Moving Occupations by Sex
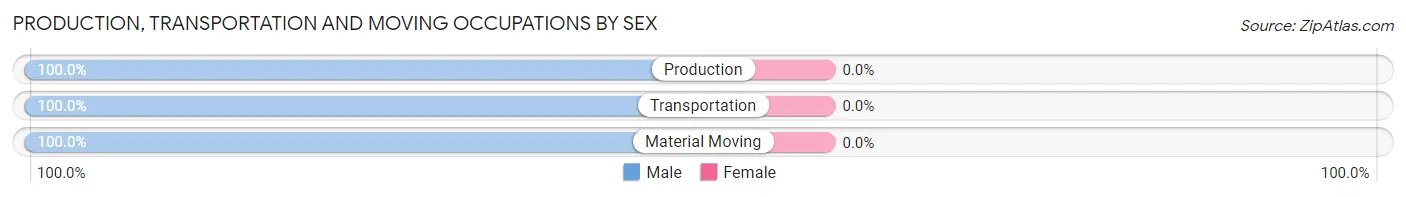
| Occupation | Male | Female |
| Production | 38 (100.0%) | 0 (0.0%) |
| Transportation | 40 (100.0%) | 0 (0.0%) |
| Material Moving | 13 (100.0%) | 0 (0.0%) |
| Total (Category) | 91 (100.0%) | 0 (0.0%) |
| Total (Overall) | 670 (58.9%) | 468 (41.1%) |
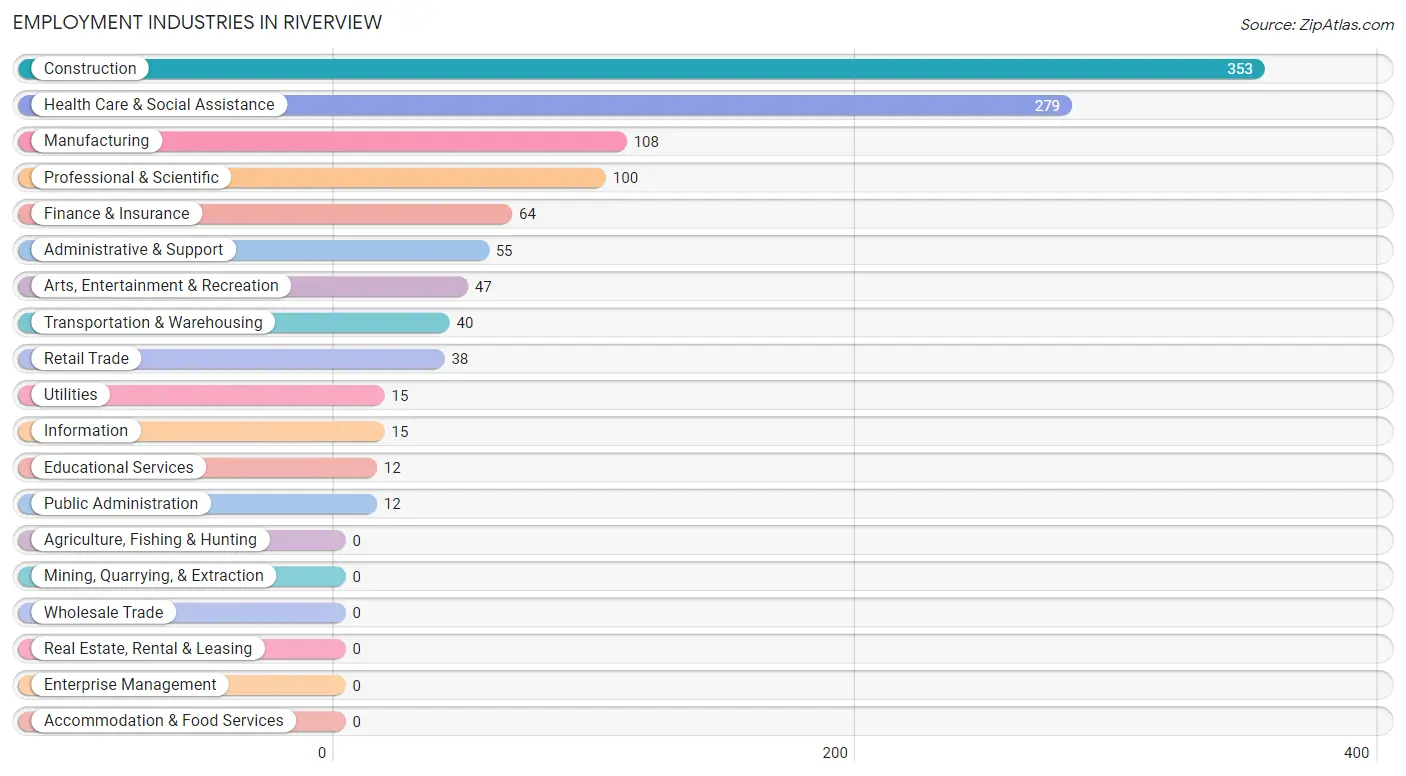
Employment Industries by Sex in Riverview
Employment Industries in Riverview
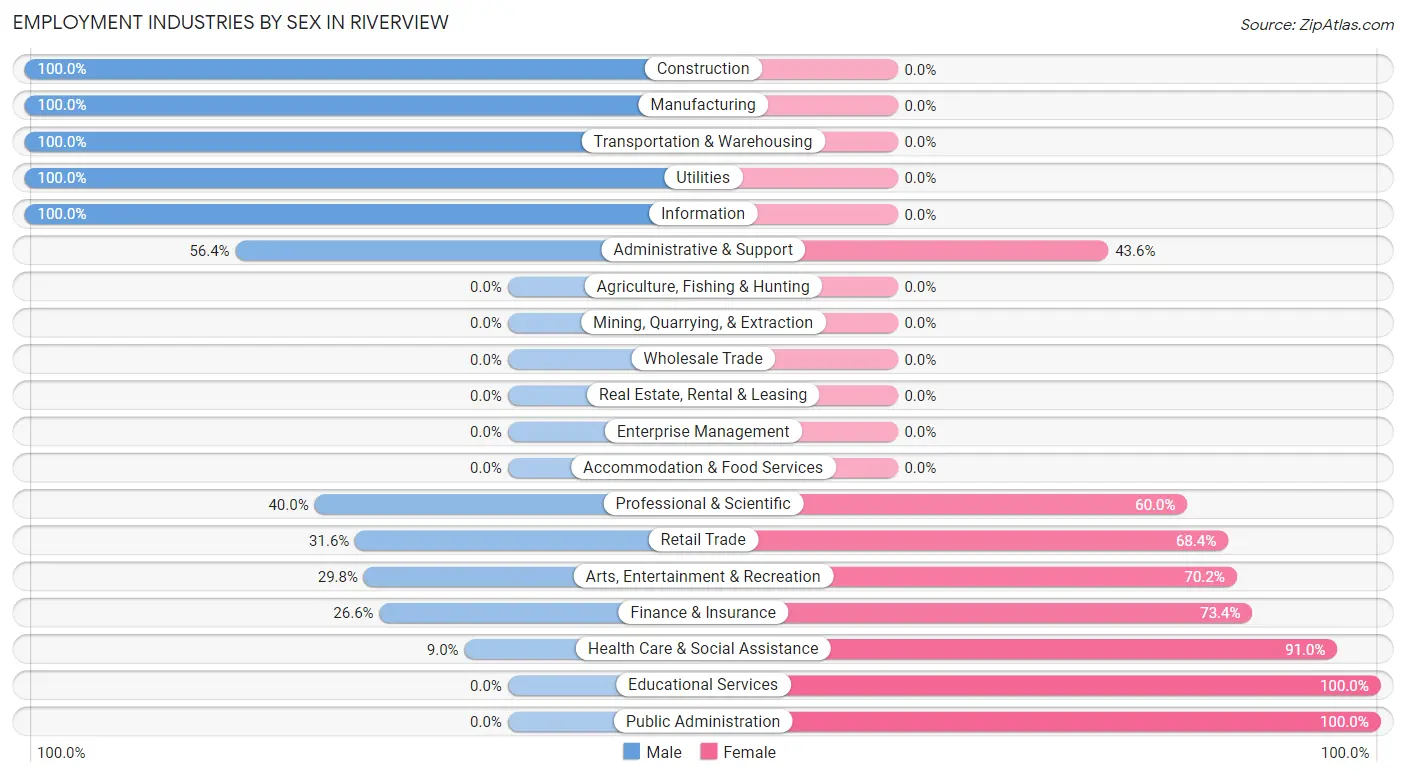
The major employment industries in Riverview include Construction (353 | 31.0%), Health Care & Social Assistance (279 | 24.5%), Manufacturing (108 | 9.5%), Professional & Scientific (100 | 8.8%), and Finance & Insurance (64 | 5.6%).
Employment Industries by Sex in Riverview
The Riverview industries that see more men than women are Construction (100.0%), Manufacturing (100.0%), and Transportation & Warehousing (100.0%), whereas the industries that tend to have a higher number of women are Educational Services (100.0%), Public Administration (100.0%), and Health Care & Social Assistance (91.0%).
| Industry | Male | Female |
| Agriculture, Fishing & Hunting | 0 (0.0%) | 0 (0.0%) |
| Mining, Quarrying, & Extraction | 0 (0.0%) | 0 (0.0%) |
| Construction | 353 (100.0%) | 0 (0.0%) |
| Manufacturing | 108 (100.0%) | 0 (0.0%) |
| Wholesale Trade | 0 (0.0%) | 0 (0.0%) |
| Retail Trade | 12 (31.6%) | 26 (68.4%) |
| Transportation & Warehousing | 40 (100.0%) | 0 (0.0%) |
| Utilities | 15 (100.0%) | 0 (0.0%) |
| Information | 15 (100.0%) | 0 (0.0%) |
| Finance & Insurance | 17 (26.6%) | 47 (73.4%) |
| Real Estate, Rental & Leasing | 0 (0.0%) | 0 (0.0%) |
| Professional & Scientific | 40 (40.0%) | 60 (60.0%) |
| Enterprise Management | 0 (0.0%) | 0 (0.0%) |
| Administrative & Support | 31 (56.4%) | 24 (43.6%) |
| Educational Services | 0 (0.0%) | 12 (100.0%) |
| Health Care & Social Assistance | 25 (9.0%) | 254 (91.0%) |
| Arts, Entertainment & Recreation | 14 (29.8%) | 33 (70.2%) |
| Accommodation & Food Services | 0 (0.0%) | 0 (0.0%) |
| Public Administration | 0 (0.0%) | 12 (100.0%) |
| Total | 670 (58.9%) | 468 (41.1%) |
Education in Riverview
School Enrollment in Riverview
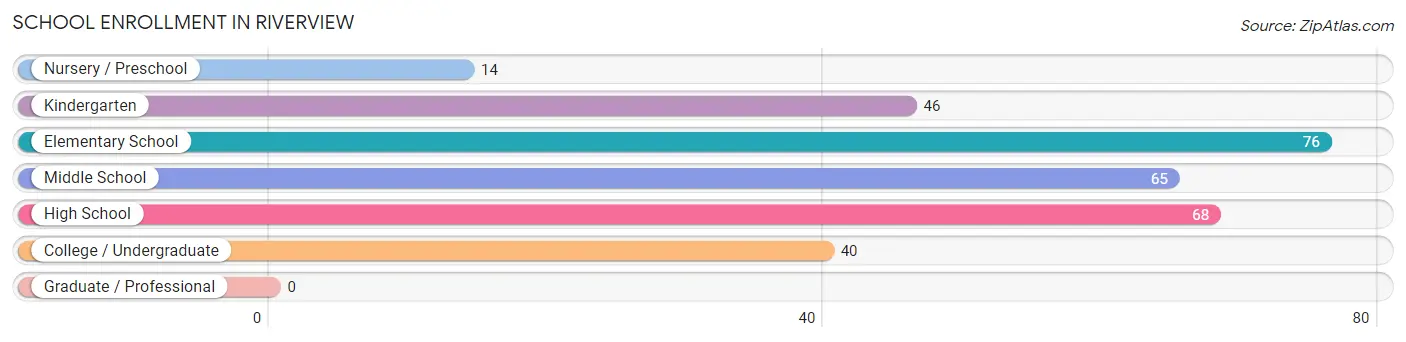
The most common levels of schooling among the 309 students in Riverview are elementary school (76 | 24.6%), high school (68 | 22.0%), and middle school (65 | 21.0%).
| School Level | # Students | % Students |
| Nursery / Preschool | 14 | 4.5% |
| Kindergarten | 46 | 14.9% |
| Elementary School | 76 | 24.6% |
| Middle School | 65 | 21.0% |
| High School | 68 | 22.0% |
| College / Undergraduate | 40 | 12.9% |
| Graduate / Professional | 0 | 0.0% |
| Total | 309 | 100.0% |
School Enrollment by Age by Funding Source in Riverview
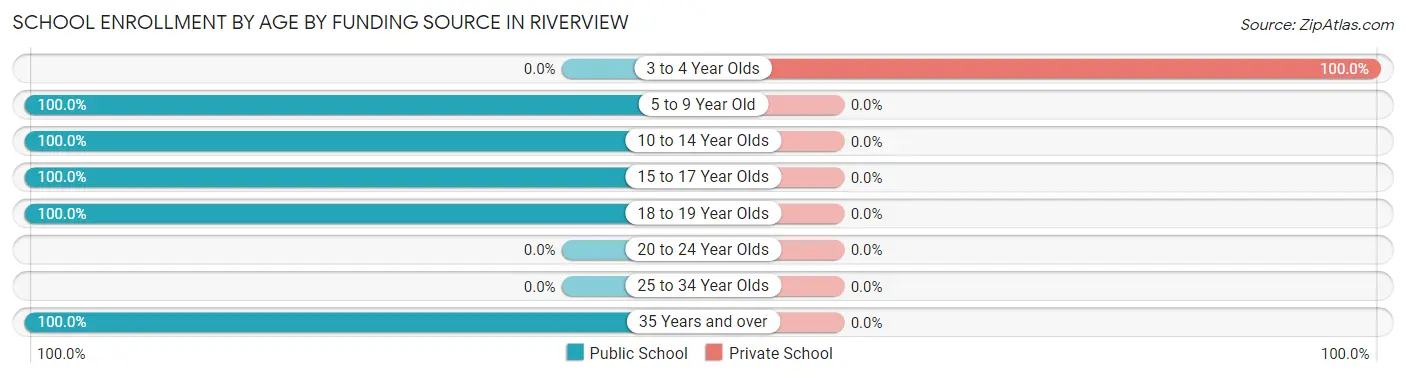
Out of a total of 309 students who are enrolled in schools in Riverview, 14 (4.5%) attend a private institution, while the remaining 295 (95.5%) are enrolled in public schools. The age group of 3 to 4 year olds has the highest likelihood of being enrolled in private schools, with 14 (100.0% in the age bracket) enrolled. Conversely, the age group of 5 to 9 year old has the lowest likelihood of being enrolled in a private school, with 122 (100.0% in the age bracket) attending a public institution.
| Age Bracket | Public School | Private School |
| 3 to 4 Year Olds | 0 (0.0%) | 14 (100.0%) |
| 5 to 9 Year Old | 122 (100.0%) | 0 (0.0%) |
| 10 to 14 Year Olds | 78 (100.0%) | 0 (0.0%) |
| 15 to 17 Year Olds | 55 (100.0%) | 0 (0.0%) |
| 18 to 19 Year Olds | 15 (100.0%) | 0 (0.0%) |
| 20 to 24 Year Olds | 0 (0.0%) | 0 (0.0%) |
| 25 to 34 Year Olds | 0 (0.0%) | 0 (0.0%) |
| 35 Years and over | 25 (100.0%) | 0 (0.0%) |
| Total | 295 (95.5%) | 14 (4.5%) |
Educational Attainment by Field of Study in Riverview
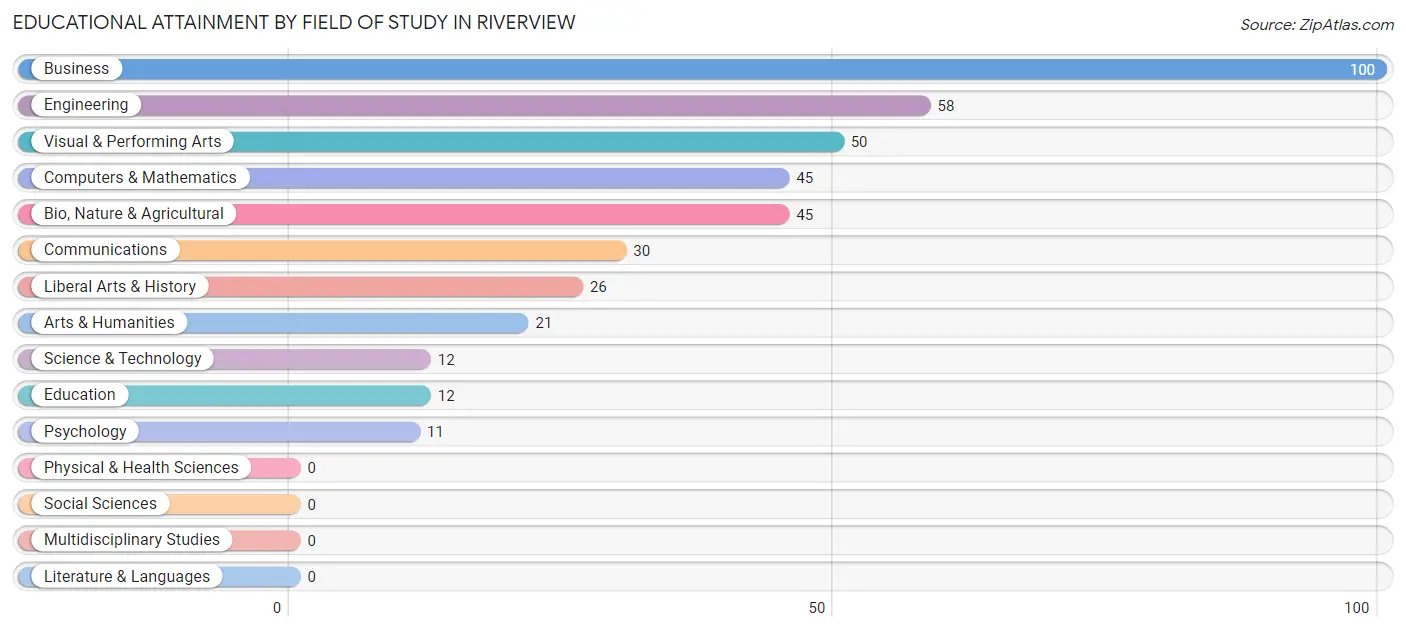
Business (100 | 24.4%), engineering (58 | 14.1%), visual & performing arts (50 | 12.2%), computers & mathematics (45 | 11.0%), and bio, nature & agricultural (45 | 11.0%) are the most common fields of study among 410 individuals in Riverview who have obtained a bachelor's degree or higher.
| Field of Study | # Graduates | % Graduates |
| Computers & Mathematics | 45 | 11.0% |
| Bio, Nature & Agricultural | 45 | 11.0% |
| Physical & Health Sciences | 0 | 0.0% |
| Psychology | 11 | 2.7% |
| Social Sciences | 0 | 0.0% |
| Engineering | 58 | 14.1% |
| Multidisciplinary Studies | 0 | 0.0% |
| Science & Technology | 12 | 2.9% |
| Business | 100 | 24.4% |
| Education | 12 | 2.9% |
| Literature & Languages | 0 | 0.0% |
| Liberal Arts & History | 26 | 6.3% |
| Visual & Performing Arts | 50 | 12.2% |
| Communications | 30 | 7.3% |
| Arts & Humanities | 21 | 5.1% |
| Total | 410 | 100.0% |
Transportation & Commute in Riverview
Vehicle Availability by Sex in Riverview
The most prevalent vehicle ownership categories in Riverview are males with 5 or more vehicles (301, accounting for 43.6%) and females with 5 or more vehicles (238, making up 64.3%).
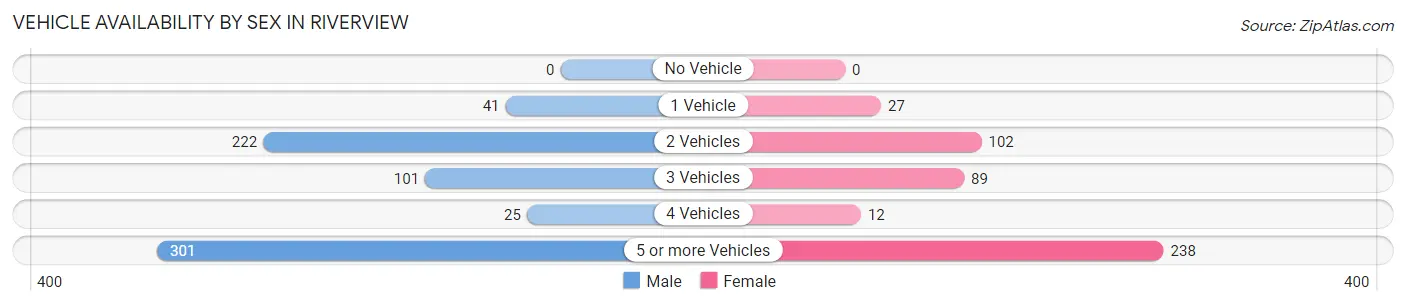
| Vehicles Available | Male | Female |
| No Vehicle | 0 (0.0%) | 0 (0.0%) |
| 1 Vehicle | 41 (5.9%) | 27 (5.8%) |
| 2 Vehicles | 222 (32.2%) | 102 (21.8%) |
| 3 Vehicles | 101 (14.6%) | 89 (19.0%) |
| 4 Vehicles | 25 (3.6%) | 12 (2.6%) |
| 5 or more Vehicles | 301 (43.6%) | 238 (50.8%) |
| Total | 690 (100.0%) | 468 (100.0%) |
Commute Time in Riverview
The most frequently occuring commute durations in Riverview are 20 to 24 minutes (356 commuters, 37.1%), 15 to 19 minutes (274 commuters, 28.5%), and 10 to 14 minutes (78 commuters, 8.1%).
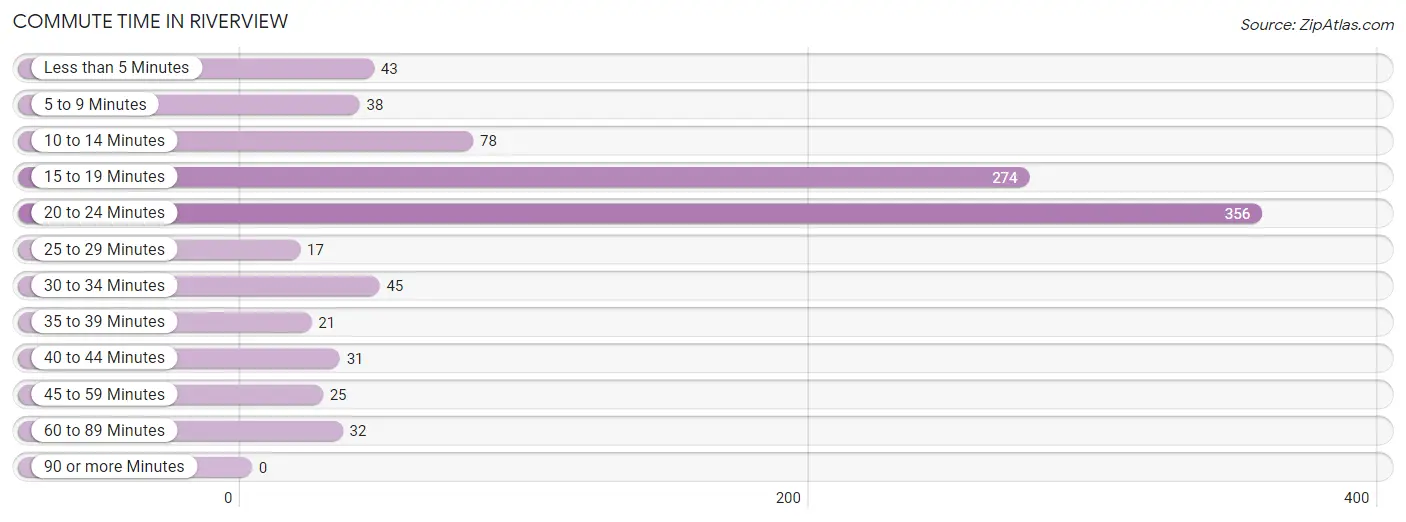
| Commute Time | # Commuters | % Commuters |
| Less than 5 Minutes | 43 | 4.5% |
| 5 to 9 Minutes | 38 | 4.0% |
| 10 to 14 Minutes | 78 | 8.1% |
| 15 to 19 Minutes | 274 | 28.5% |
| 20 to 24 Minutes | 356 | 37.1% |
| 25 to 29 Minutes | 17 | 1.8% |
| 30 to 34 Minutes | 45 | 4.7% |
| 35 to 39 Minutes | 21 | 2.2% |
| 40 to 44 Minutes | 31 | 3.2% |
| 45 to 59 Minutes | 25 | 2.6% |
| 60 to 89 Minutes | 32 | 3.3% |
| 90 or more Minutes | 0 | 0.0% |
Commute Time by Sex in Riverview
The most common commute times in Riverview are 20 to 24 minutes (337 commuters, 57.4%) for males and 15 to 19 minutes (274 commuters, 73.5%) for females.
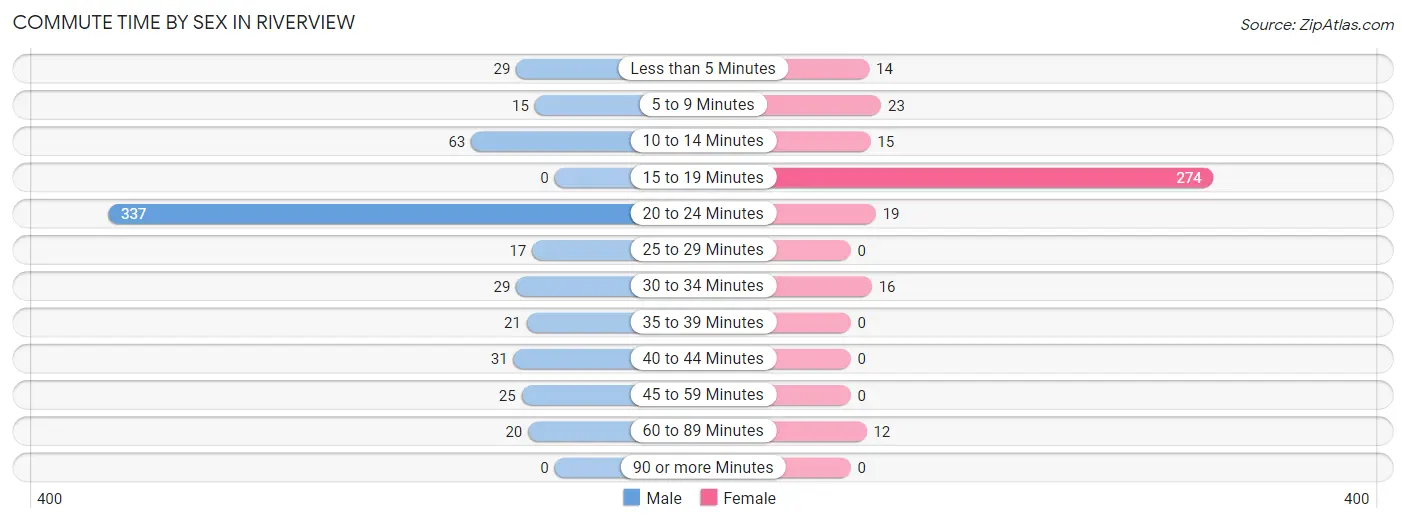
| Commute Time | Male | Female |
| Less than 5 Minutes | 29 (4.9%) | 14 (3.7%) |
| 5 to 9 Minutes | 15 (2.6%) | 23 (6.2%) |
| 10 to 14 Minutes | 63 (10.7%) | 15 (4.0%) |
| 15 to 19 Minutes | 0 (0.0%) | 274 (73.5%) |
| 20 to 24 Minutes | 337 (57.4%) | 19 (5.1%) |
| 25 to 29 Minutes | 17 (2.9%) | 0 (0.0%) |
| 30 to 34 Minutes | 29 (4.9%) | 16 (4.3%) |
| 35 to 39 Minutes | 21 (3.6%) | 0 (0.0%) |
| 40 to 44 Minutes | 31 (5.3%) | 0 (0.0%) |
| 45 to 59 Minutes | 25 (4.3%) | 0 (0.0%) |
| 60 to 89 Minutes | 20 (3.4%) | 12 (3.2%) |
| 90 or more Minutes | 0 (0.0%) | 0 (0.0%) |
Time of Departure to Work by Sex in Riverview
The most frequent times of departure to work in Riverview are 6:30 AM to 6:59 AM (329, 56.0%) for males and 8:00 AM to 8:29 AM (250, 67.0%) for females.
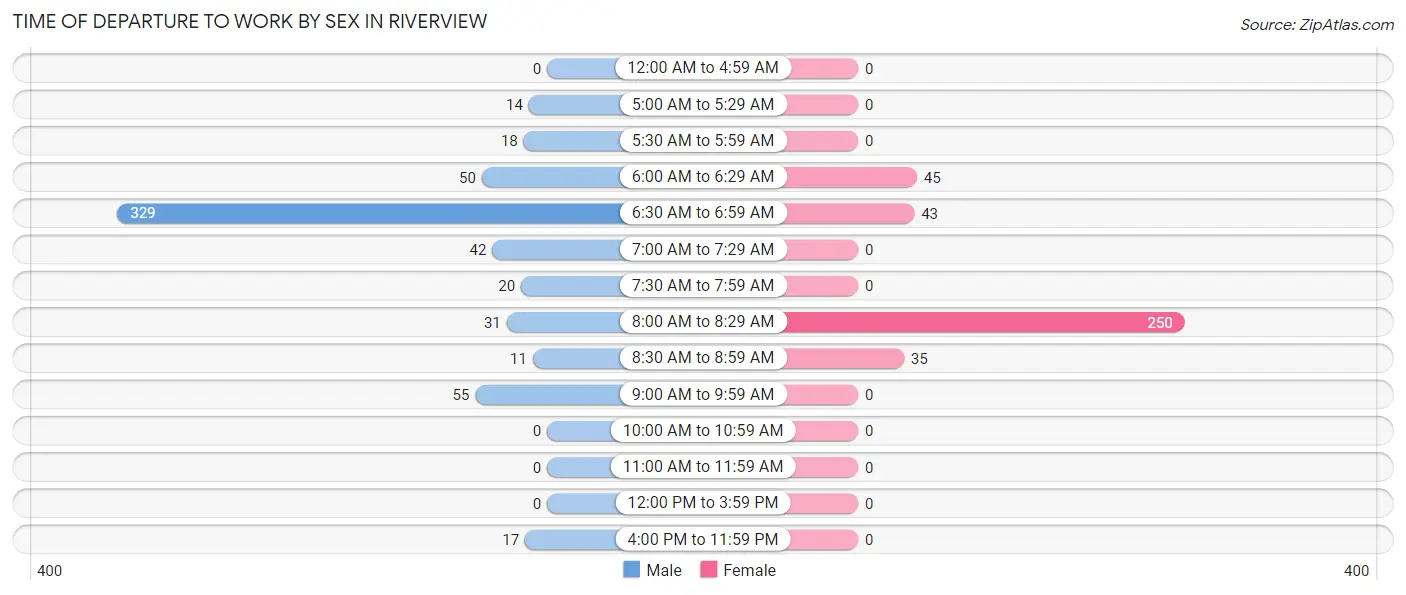
| Time of Departure | Male | Female |
| 12:00 AM to 4:59 AM | 0 (0.0%) | 0 (0.0%) |
| 5:00 AM to 5:29 AM | 14 (2.4%) | 0 (0.0%) |
| 5:30 AM to 5:59 AM | 18 (3.1%) | 0 (0.0%) |
| 6:00 AM to 6:29 AM | 50 (8.5%) | 45 (12.1%) |
| 6:30 AM to 6:59 AM | 329 (56.0%) | 43 (11.5%) |
| 7:00 AM to 7:29 AM | 42 (7.2%) | 0 (0.0%) |
| 7:30 AM to 7:59 AM | 20 (3.4%) | 0 (0.0%) |
| 8:00 AM to 8:29 AM | 31 (5.3%) | 250 (67.0%) |
| 8:30 AM to 8:59 AM | 11 (1.9%) | 35 (9.4%) |
| 9:00 AM to 9:59 AM | 55 (9.4%) | 0 (0.0%) |
| 10:00 AM to 10:59 AM | 0 (0.0%) | 0 (0.0%) |
| 11:00 AM to 11:59 AM | 0 (0.0%) | 0 (0.0%) |
| 12:00 PM to 3:59 PM | 0 (0.0%) | 0 (0.0%) |
| 4:00 PM to 11:59 PM | 17 (2.9%) | 0 (0.0%) |
| Total | 587 (100.0%) | 373 (100.0%) |
Housing Occupancy in Riverview
Occupancy by Ownership in Riverview
Of the total 706 dwellings in Riverview, owner-occupied units account for 421 (59.6%), while renter-occupied units make up 285 (40.4%).
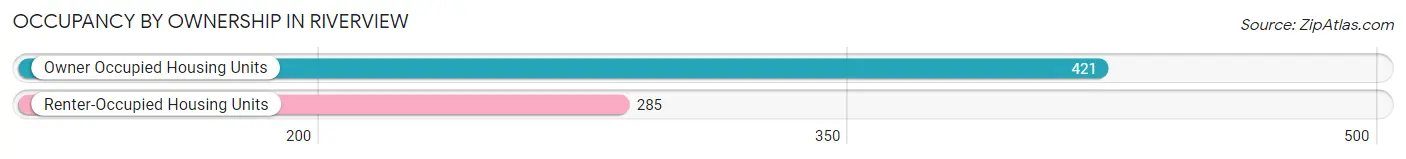
| Occupancy | # Housing Units | % Housing Units |
| Owner Occupied Housing Units | 421 | 59.6% |
| Renter-Occupied Housing Units | 285 | 40.4% |
| Total Occupied Housing Units | 706 | 100.0% |
Occupancy by Household Size in Riverview
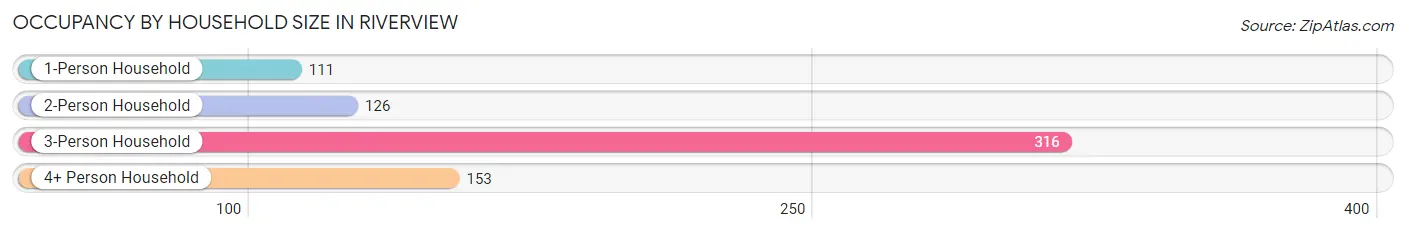
| Household Size | # Housing Units | % Housing Units |
| 1-Person Household | 111 | 15.7% |
| 2-Person Household | 126 | 17.8% |
| 3-Person Household | 316 | 44.8% |
| 4+ Person Household | 153 | 21.7% |
| Total Housing Units | 706 | 100.0% |
Occupancy by Ownership by Household Size in Riverview
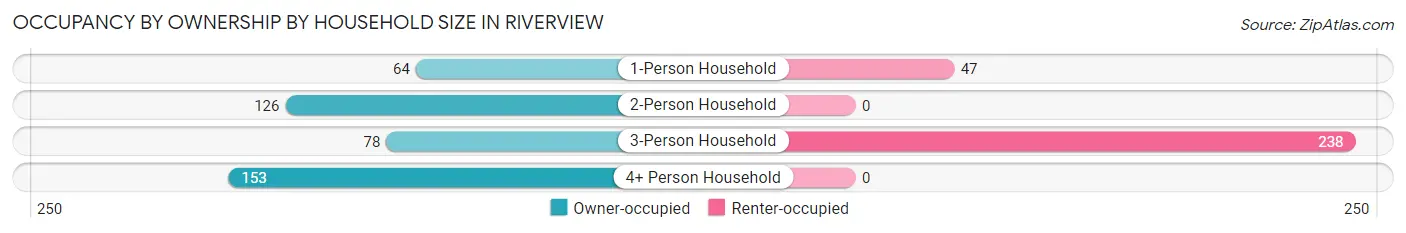
| Household Size | Owner-occupied | Renter-occupied |
| 1-Person Household | 64 (57.7%) | 47 (42.3%) |
| 2-Person Household | 126 (100.0%) | 0 (0.0%) |
| 3-Person Household | 78 (24.7%) | 238 (75.3%) |
| 4+ Person Household | 153 (100.0%) | 0 (0.0%) |
| Total Housing Units | 421 (59.6%) | 285 (40.4%) |
Occupancy by Educational Attainment in Riverview
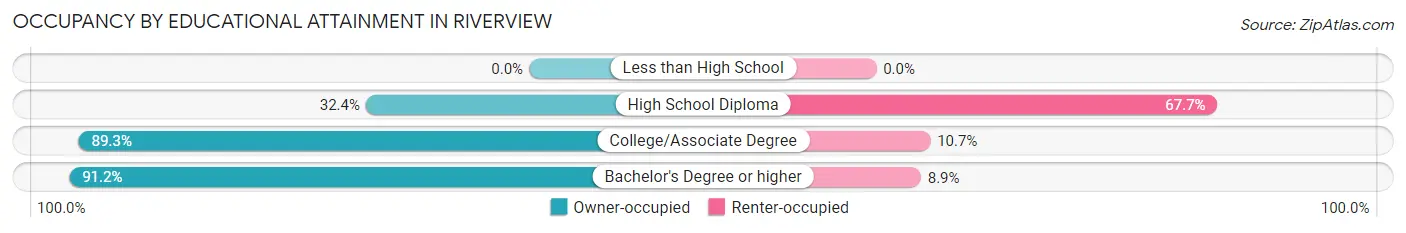
| Household Size | Owner-occupied | Renter-occupied |
| Less than High School | 0 (0.0%) | 0 (0.0%) |
| High School Diploma | 121 (32.4%) | 253 (67.6%) |
| College/Associate Degree | 125 (89.3%) | 15 (10.7%) |
| Bachelor's Degree or higher | 175 (91.1%) | 17 (8.8%) |
Occupancy by Age of Householder in Riverview
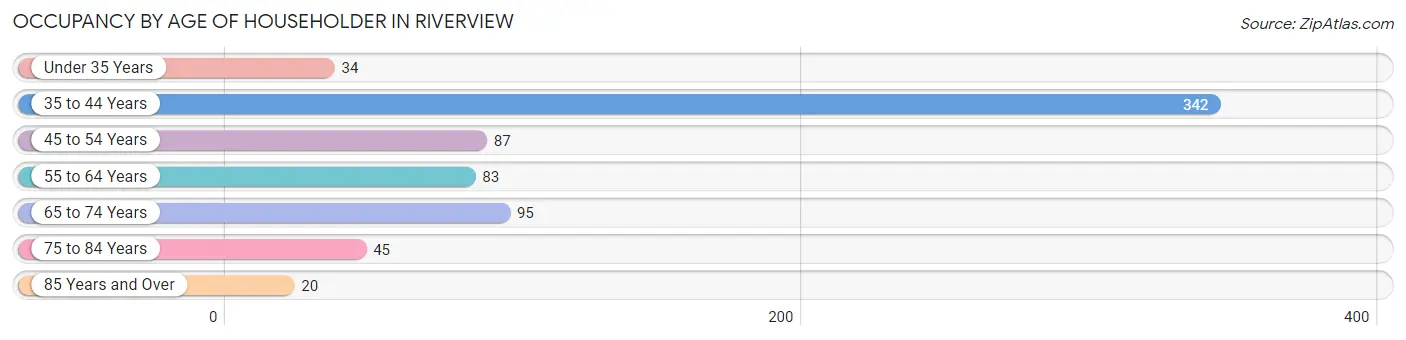
| Age Bracket | # Households | % Households |
| Under 35 Years | 34 | 4.8% |
| 35 to 44 Years | 342 | 48.4% |
| 45 to 54 Years | 87 | 12.3% |
| 55 to 64 Years | 83 | 11.8% |
| 65 to 74 Years | 95 | 13.5% |
| 75 to 84 Years | 45 | 6.4% |
| 85 Years and Over | 20 | 2.8% |
| Total | 706 | 100.0% |
Housing Finances in Riverview
Median Income by Occupancy in Riverview
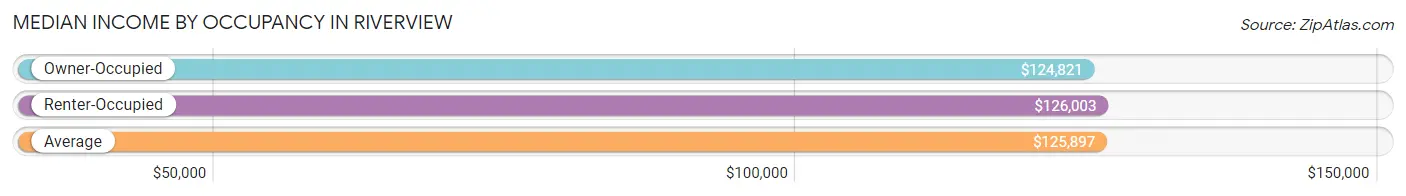
| Occupancy Type | # Households | Median Income |
| Owner-Occupied | 421 (59.6%) | $124,821 |
| Renter-Occupied | 285 (40.4%) | $126,003 |
| Average | 706 (100.0%) | $125,897 |
Occupancy by Householder Income Bracket in Riverview
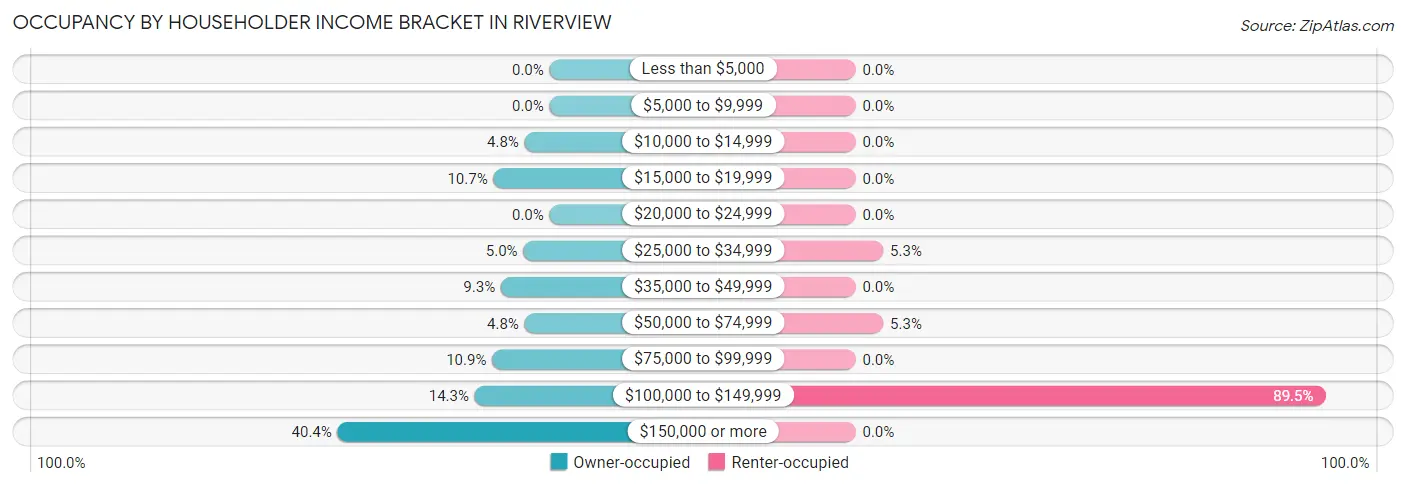
| Income Bracket | Owner-occupied | Renter-occupied |
| Less than $5,000 | 0 (0.0%) | 0 (0.0%) |
| $5,000 to $9,999 | 0 (0.0%) | 0 (0.0%) |
| $10,000 to $14,999 | 20 (4.8%) | 0 (0.0%) |
| $15,000 to $19,999 | 45 (10.7%) | 0 (0.0%) |
| $20,000 to $24,999 | 0 (0.0%) | 0 (0.0%) |
| $25,000 to $34,999 | 21 (5.0%) | 15 (5.3%) |
| $35,000 to $49,999 | 39 (9.3%) | 0 (0.0%) |
| $50,000 to $74,999 | 20 (4.8%) | 15 (5.3%) |
| $75,000 to $99,999 | 46 (10.9%) | 0 (0.0%) |
| $100,000 to $149,999 | 60 (14.2%) | 255 (89.5%) |
| $150,000 or more | 170 (40.4%) | 0 (0.0%) |
| Total | 421 (100.0%) | 285 (100.0%) |
Monthly Housing Cost Tiers in Riverview
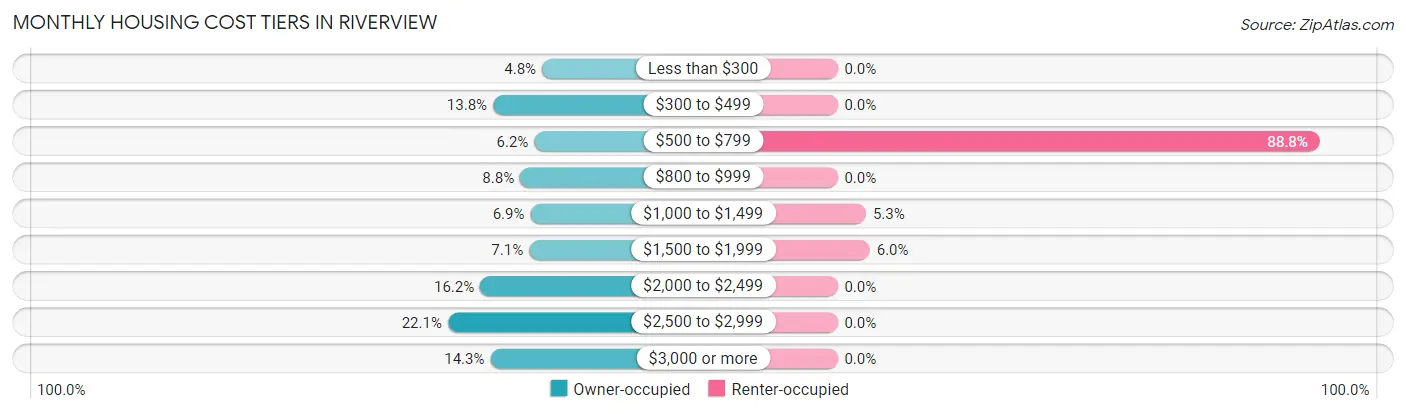
| Monthly Cost | Owner-occupied | Renter-occupied |
| Less than $300 | 20 (4.8%) | 0 (0.0%) |
| $300 to $499 | 58 (13.8%) | 0 (0.0%) |
| $500 to $799 | 26 (6.2%) | 253 (88.8%) |
| $800 to $999 | 37 (8.8%) | 0 (0.0%) |
| $1,000 to $1,499 | 29 (6.9%) | 15 (5.3%) |
| $1,500 to $1,999 | 30 (7.1%) | 17 (6.0%) |
| $2,000 to $2,499 | 68 (16.2%) | 0 (0.0%) |
| $2,500 to $2,999 | 93 (22.1%) | 0 (0.0%) |
| $3,000 or more | 60 (14.2%) | 0 (0.0%) |
| Total | 421 (100.0%) | 285 (100.0%) |
Physical Housing Characteristics in Riverview
Housing Structures in Riverview
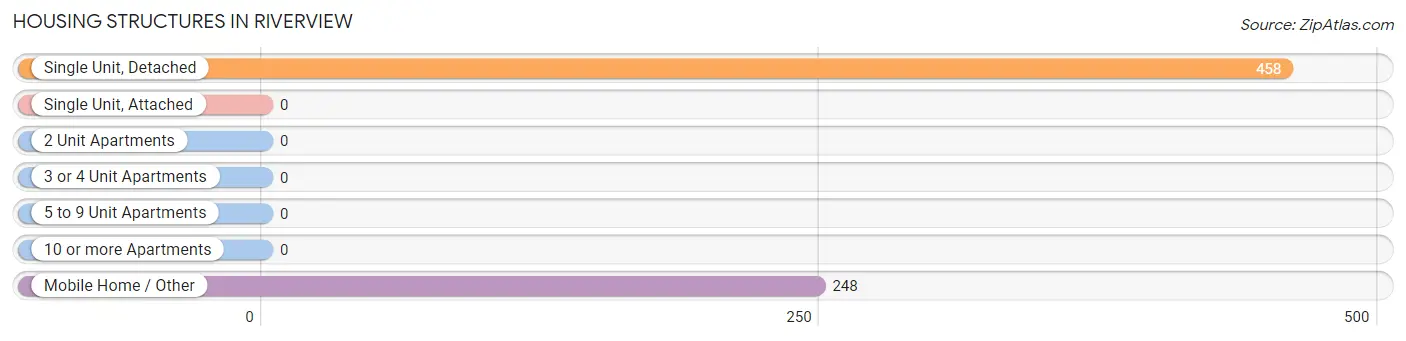
| Structure Type | # Housing Units | % Housing Units |
| Single Unit, Detached | 458 | 64.9% |
| Single Unit, Attached | 0 | 0.0% |
| 2 Unit Apartments | 0 | 0.0% |
| 3 or 4 Unit Apartments | 0 | 0.0% |
| 5 to 9 Unit Apartments | 0 | 0.0% |
| 10 or more Apartments | 0 | 0.0% |
| Mobile Home / Other | 248 | 35.1% |
| Total | 706 | 100.0% |
Housing Structures by Occupancy in Riverview
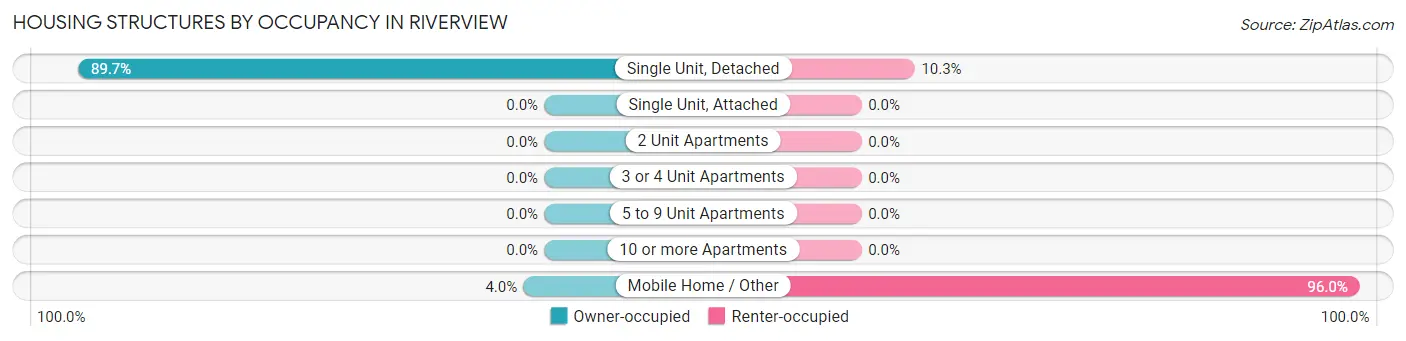
| Structure Type | Owner-occupied | Renter-occupied |
| Single Unit, Detached | 411 (89.7%) | 47 (10.3%) |
| Single Unit, Attached | 0 (0.0%) | 0 (0.0%) |
| 2 Unit Apartments | 0 (0.0%) | 0 (0.0%) |
| 3 or 4 Unit Apartments | 0 (0.0%) | 0 (0.0%) |
| 5 to 9 Unit Apartments | 0 (0.0%) | 0 (0.0%) |
| 10 or more Apartments | 0 (0.0%) | 0 (0.0%) |
| Mobile Home / Other | 10 (4.0%) | 238 (96.0%) |
| Total | 421 (59.6%) | 285 (40.4%) |
Housing Structures by Number of Rooms in Riverview
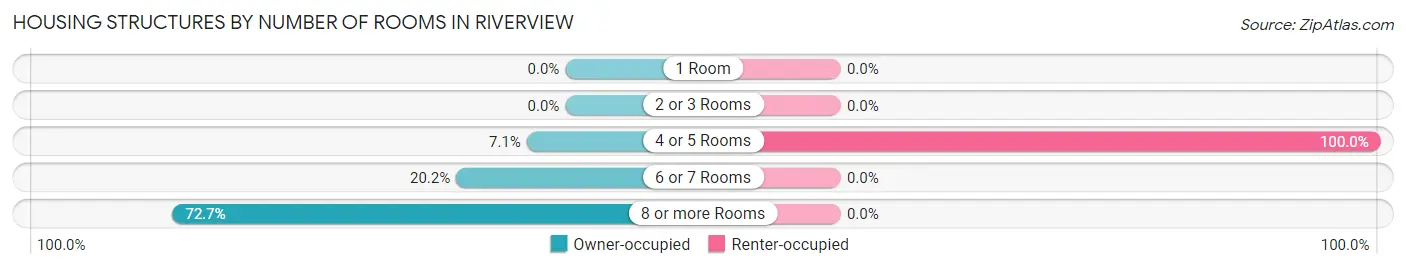
| Number of Rooms | Owner-occupied | Renter-occupied |
| 1 Room | 0 (0.0%) | 0 (0.0%) |
| 2 or 3 Rooms | 0 (0.0%) | 0 (0.0%) |
| 4 or 5 Rooms | 30 (7.1%) | 285 (100.0%) |
| 6 or 7 Rooms | 85 (20.2%) | 0 (0.0%) |
| 8 or more Rooms | 306 (72.7%) | 0 (0.0%) |
| Total | 421 (100.0%) | 285 (100.0%) |
Housing Structure by Heating Type in Riverview
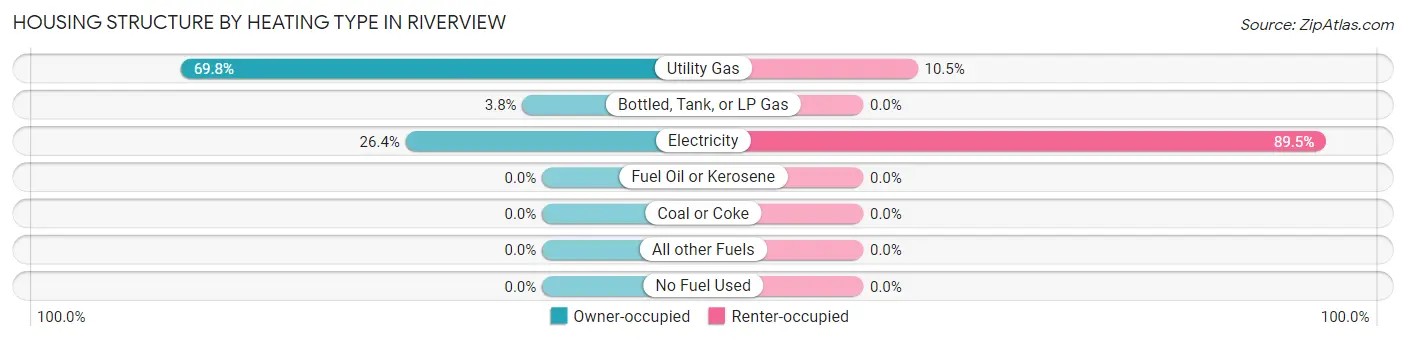
| Heating Type | Owner-occupied | Renter-occupied |
| Utility Gas | 294 (69.8%) | 30 (10.5%) |
| Bottled, Tank, or LP Gas | 16 (3.8%) | 0 (0.0%) |
| Electricity | 111 (26.4%) | 255 (89.5%) |
| Fuel Oil or Kerosene | 0 (0.0%) | 0 (0.0%) |
| Coal or Coke | 0 (0.0%) | 0 (0.0%) |
| All other Fuels | 0 (0.0%) | 0 (0.0%) |
| No Fuel Used | 0 (0.0%) | 0 (0.0%) |
| Total | 421 (100.0%) | 285 (100.0%) |
Household Vehicle Usage in Riverview
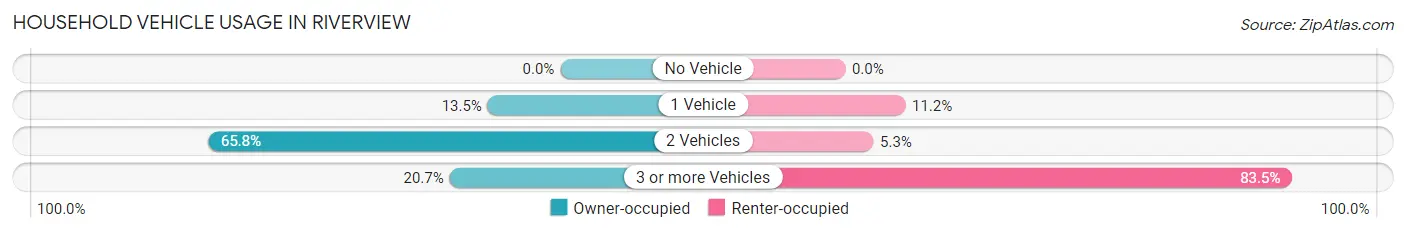
| Vehicles per Household | Owner-occupied | Renter-occupied |
| No Vehicle | 0 (0.0%) | 0 (0.0%) |
| 1 Vehicle | 57 (13.5%) | 32 (11.2%) |
| 2 Vehicles | 277 (65.8%) | 15 (5.3%) |
| 3 or more Vehicles | 87 (20.7%) | 238 (83.5%) |
| Total | 421 (100.0%) | 285 (100.0%) |
Real Estate & Mortgages in Riverview
Real Estate and Mortgage Overview in Riverview
| Characteristic | Without Mortgage | With Mortgage |
| Housing Units | 120 | 301 |
| Median Property Value | $314,300 | $536,600 |
| Median Household Income | - | - |
| Monthly Housing Costs | $388 | $60 |
| Real Estate Taxes | - | - |
Property Value by Mortgage Status in Riverview
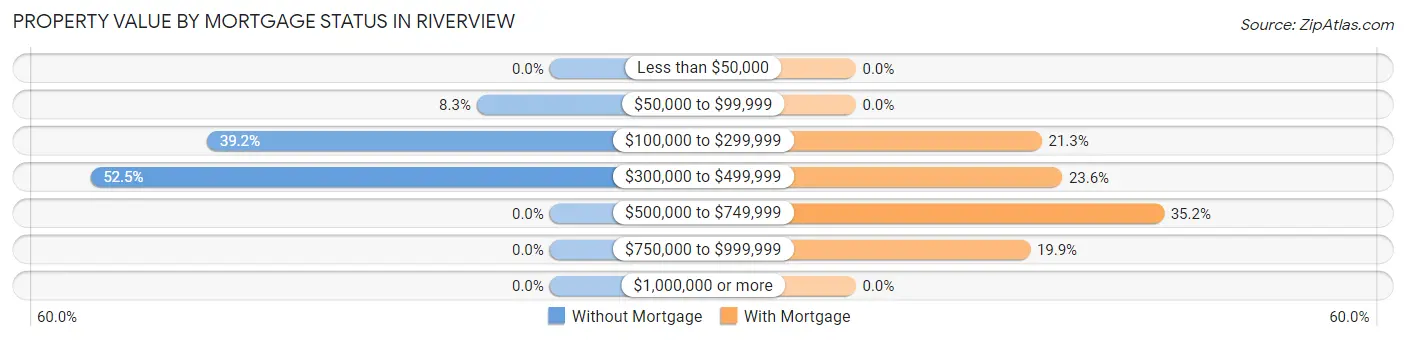
| Property Value | Without Mortgage | With Mortgage |
| Less than $50,000 | 0 (0.0%) | 0 (0.0%) |
| $50,000 to $99,999 | 10 (8.3%) | 0 (0.0%) |
| $100,000 to $299,999 | 47 (39.2%) | 64 (21.3%) |
| $300,000 to $499,999 | 63 (52.5%) | 71 (23.6%) |
| $500,000 to $749,999 | 0 (0.0%) | 106 (35.2%) |
| $750,000 to $999,999 | 0 (0.0%) | 60 (19.9%) |
| $1,000,000 or more | 0 (0.0%) | 0 (0.0%) |
| Total | 120 (100.0%) | 301 (100.0%) |
Household Income by Mortgage Status in Riverview
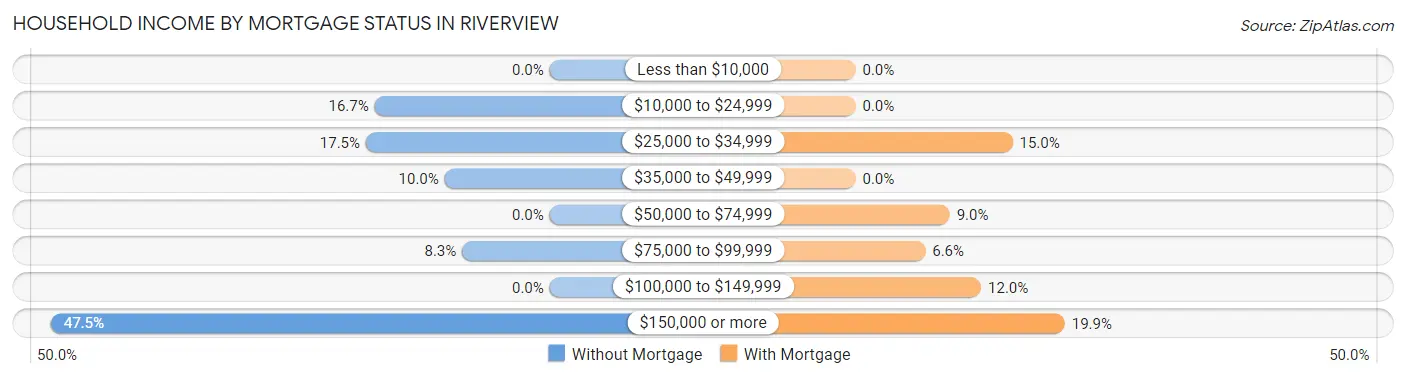
| Household Income | Without Mortgage | With Mortgage |
| Less than $10,000 | 0 (0.0%) | 0 (0.0%) |
| $10,000 to $24,999 | 20 (16.7%) | 0 (0.0%) |
| $25,000 to $34,999 | 21 (17.5%) | 45 (14.9%) |
| $35,000 to $49,999 | 12 (10.0%) | 0 (0.0%) |
| $50,000 to $74,999 | 0 (0.0%) | 27 (9.0%) |
| $75,000 to $99,999 | 10 (8.3%) | 20 (6.6%) |
| $100,000 to $149,999 | 0 (0.0%) | 36 (12.0%) |
| $150,000 or more | 57 (47.5%) | 60 (19.9%) |
| Total | 120 (100.0%) | 301 (100.0%) |
Property Value to Household Income Ratio in Riverview
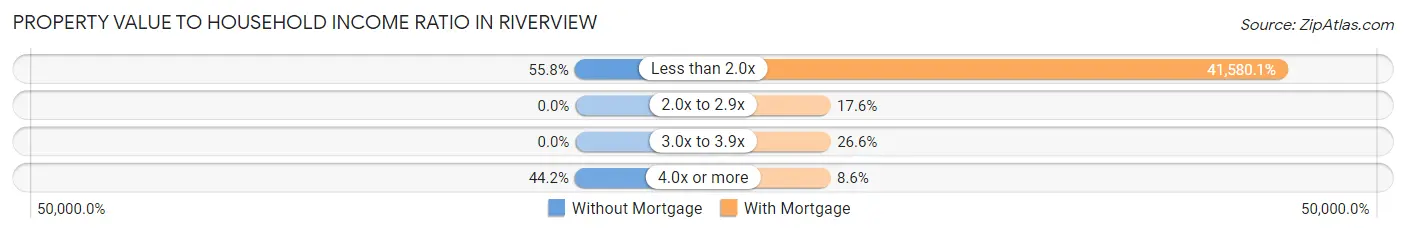
| Value-to-Income Ratio | Without Mortgage | With Mortgage |
| Less than 2.0x | 67 (55.8%) | 125,156 (41,580.1%) |
| 2.0x to 2.9x | 0 (0.0%) | 53 (17.6%) |
| 3.0x to 3.9x | 0 (0.0%) | 80 (26.6%) |
| 4.0x or more | 53 (44.2%) | 26 (8.6%) |
| Total | 120 (100.0%) | 301 (100.0%) |
Real Estate Taxes by Mortgage Status in Riverview
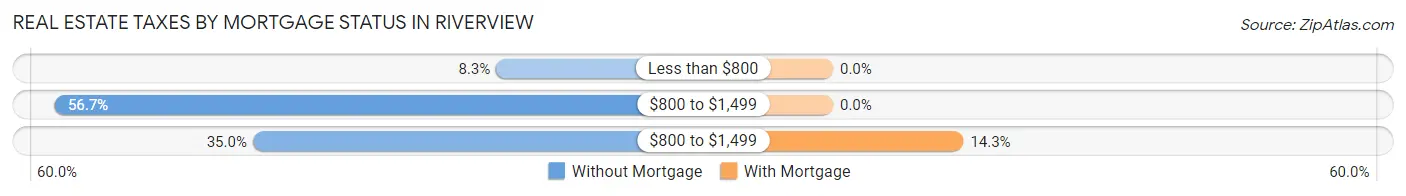
| Property Taxes | Without Mortgage | With Mortgage |
| Less than $800 | 10 (8.3%) | 0 (0.0%) |
| $800 to $1,499 | 68 (56.7%) | 0 (0.0%) |
| $800 to $1,499 | 42 (35.0%) | 43 (14.3%) |
| Total | 120 (100.0%) | 301 (100.0%) |
Health & Disability in Riverview
Health Insurance Coverage by Age in Riverview
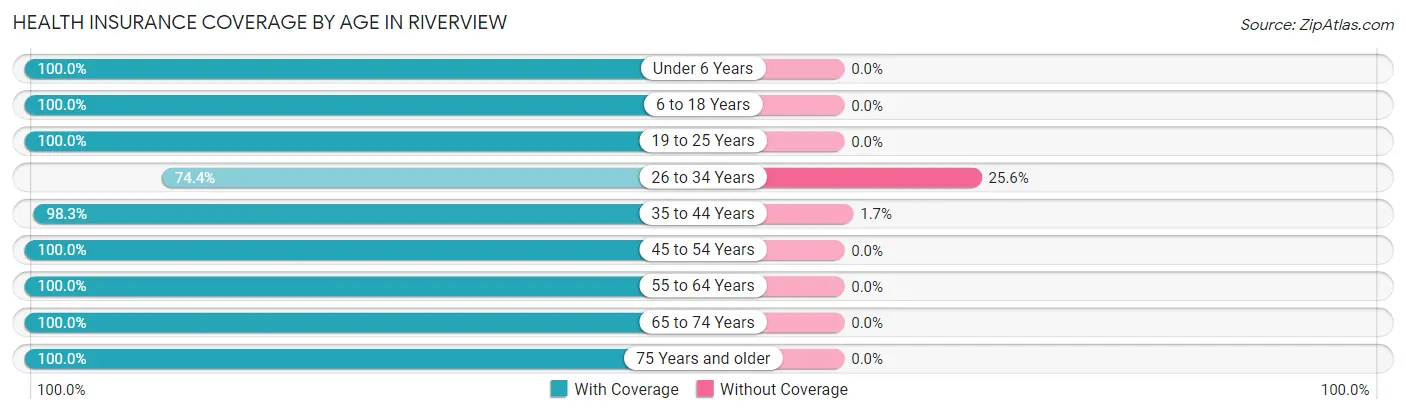
| Age Bracket | With Coverage | Without Coverage |
| Under 6 Years | 113 (100.0%) | 0 (0.0%) |
| 6 to 18 Years | 449 (100.0%) | 0 (0.0%) |
| 19 to 25 Years | 54 (100.0%) | 0 (0.0%) |
| 26 to 34 Years | 61 (74.4%) | 21 (25.6%) |
| 35 to 44 Years | 763 (98.3%) | 13 (1.7%) |
| 45 to 54 Years | 151 (100.0%) | 0 (0.0%) |
| 55 to 64 Years | 142 (100.0%) | 0 (0.0%) |
| 65 to 74 Years | 137 (100.0%) | 0 (0.0%) |
| 75 Years and older | 86 (100.0%) | 0 (0.0%) |
| Total | 1,956 (98.3%) | 34 (1.7%) |
Health Insurance Coverage by Citizenship Status in Riverview
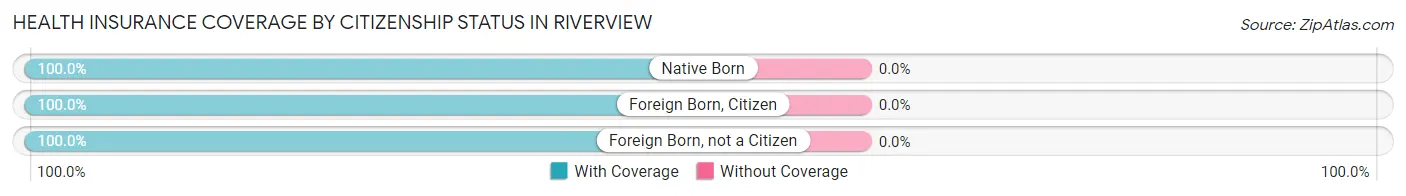
| Citizenship Status | With Coverage | Without Coverage |
| Native Born | 113 (100.0%) | 0 (0.0%) |
| Foreign Born, Citizen | 449 (100.0%) | 0 (0.0%) |
| Foreign Born, not a Citizen | 54 (100.0%) | 0 (0.0%) |
Health Insurance Coverage by Household Income in Riverview
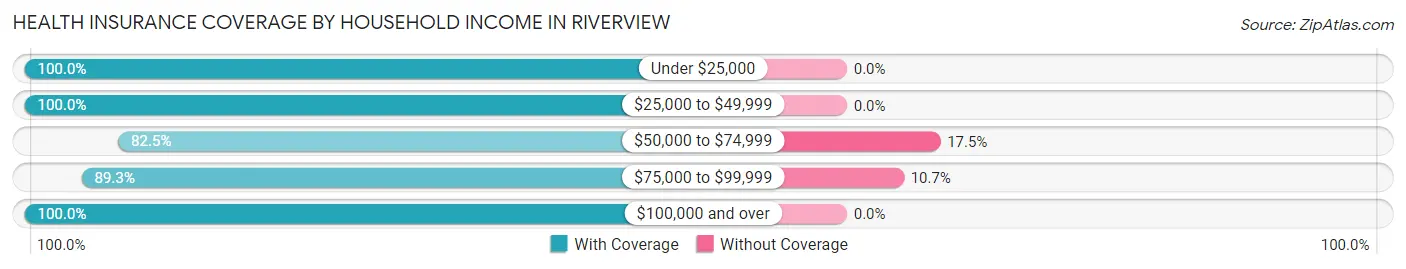
| Household Income | With Coverage | Without Coverage |
| Under $25,000 | 86 (100.0%) | 0 (0.0%) |
| $25,000 to $49,999 | 100 (100.0%) | 0 (0.0%) |
| $50,000 to $74,999 | 99 (82.5%) | 21 (17.5%) |
| $75,000 to $99,999 | 109 (89.3%) | 13 (10.7%) |
| $100,000 and over | 1,562 (100.0%) | 0 (0.0%) |
Public vs Private Health Insurance Coverage by Age in Riverview
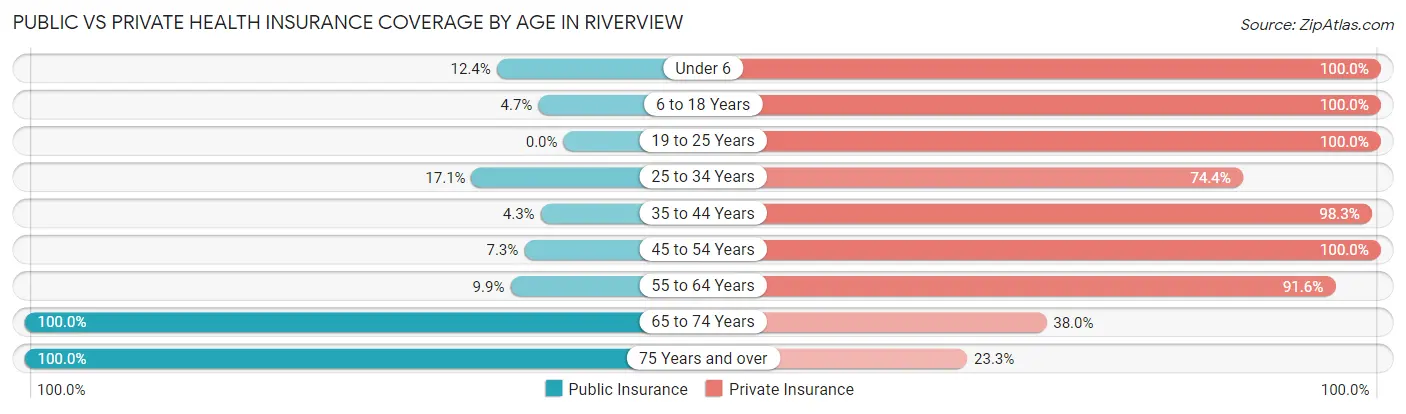
| Age Bracket | Public Insurance | Private Insurance |
| Under 6 | 14 (12.4%) | 113 (100.0%) |
| 6 to 18 Years | 21 (4.7%) | 449 (100.0%) |
| 19 to 25 Years | 0 (0.0%) | 54 (100.0%) |
| 25 to 34 Years | 14 (17.1%) | 61 (74.4%) |
| 35 to 44 Years | 33 (4.3%) | 763 (98.3%) |
| 45 to 54 Years | 11 (7.3%) | 151 (100.0%) |
| 55 to 64 Years | 14 (9.9%) | 130 (91.5%) |
| 65 to 74 Years | 137 (100.0%) | 52 (38.0%) |
| 75 Years and over | 86 (100.0%) | 20 (23.3%) |
| Total | 330 (16.6%) | 1,793 (90.1%) |
Disability Status by Sex by Age in Riverview
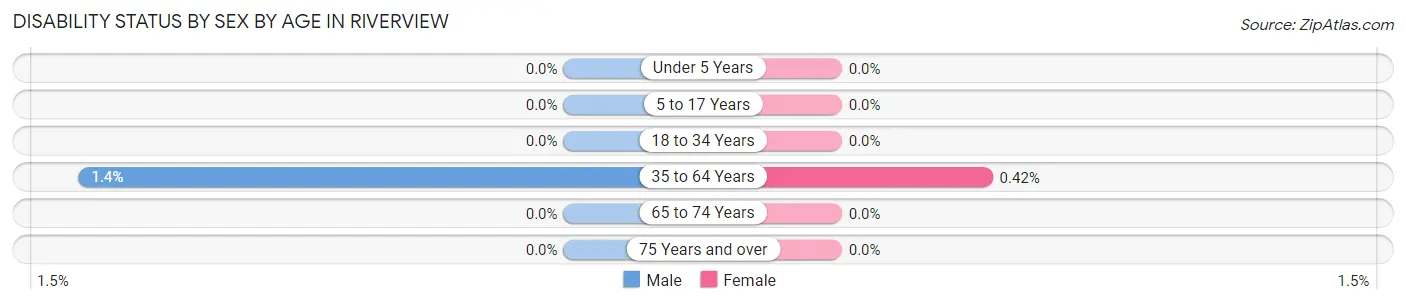
| Age Bracket | Male | Female |
| Under 5 Years | 0 (0.0%) | 0 (0.0%) |
| 5 to 17 Years | 0 (0.0%) | 0 (0.0%) |
| 18 to 34 Years | 0 (0.0%) | 0 (0.0%) |
| 35 to 64 Years | 8 (1.3%) | 2 (0.4%) |
| 65 to 74 Years | 0 (0.0%) | 0 (0.0%) |
| 75 Years and over | 0 (0.0%) | 0 (0.0%) |
Disability Class by Sex by Age in Riverview
Disability Class: Hearing Difficulty
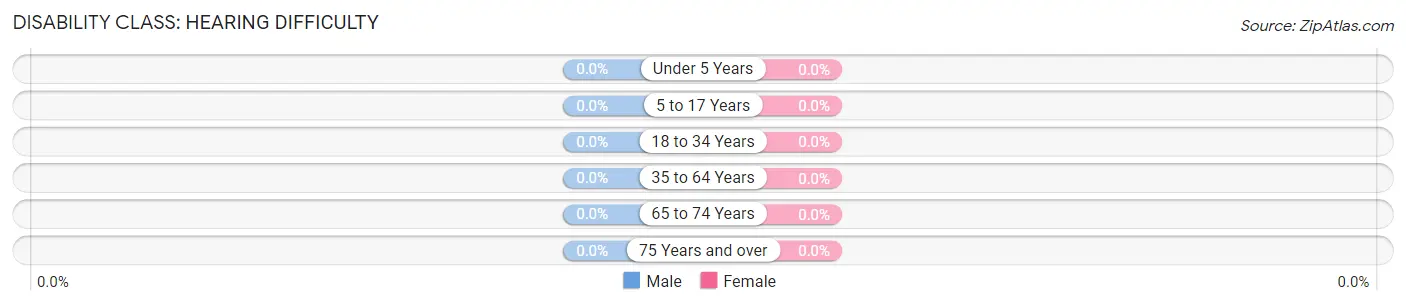
| Age Bracket | Male | Female |
| Under 5 Years | 0 (0.0%) | 0 (0.0%) |
| 5 to 17 Years | 0 (0.0%) | 0 (0.0%) |
| 18 to 34 Years | 0 (0.0%) | 0 (0.0%) |
| 35 to 64 Years | 0 (0.0%) | 0 (0.0%) |
| 65 to 74 Years | 0 (0.0%) | 0 (0.0%) |
| 75 Years and over | 0 (0.0%) | 0 (0.0%) |
Disability Class: Vision Difficulty
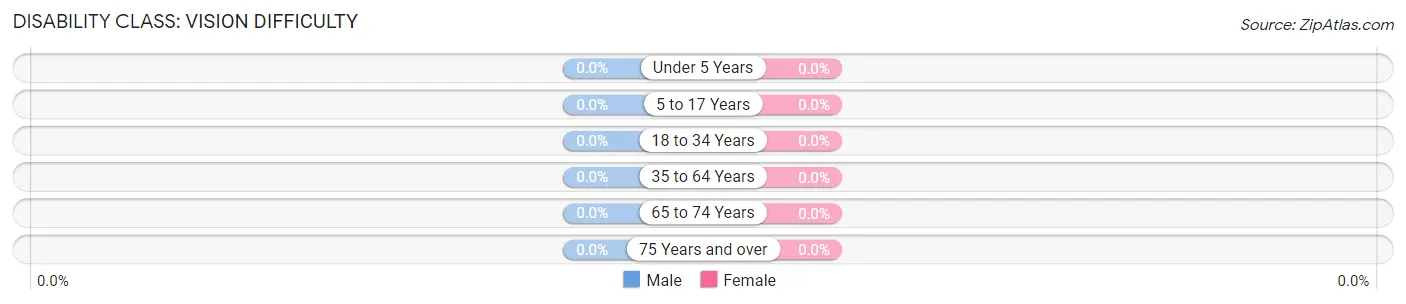
| Age Bracket | Male | Female |
| Under 5 Years | 0 (0.0%) | 0 (0.0%) |
| 5 to 17 Years | 0 (0.0%) | 0 (0.0%) |
| 18 to 34 Years | 0 (0.0%) | 0 (0.0%) |
| 35 to 64 Years | 0 (0.0%) | 0 (0.0%) |
| 65 to 74 Years | 0 (0.0%) | 0 (0.0%) |
| 75 Years and over | 0 (0.0%) | 0 (0.0%) |
Disability Class: Cognitive Difficulty
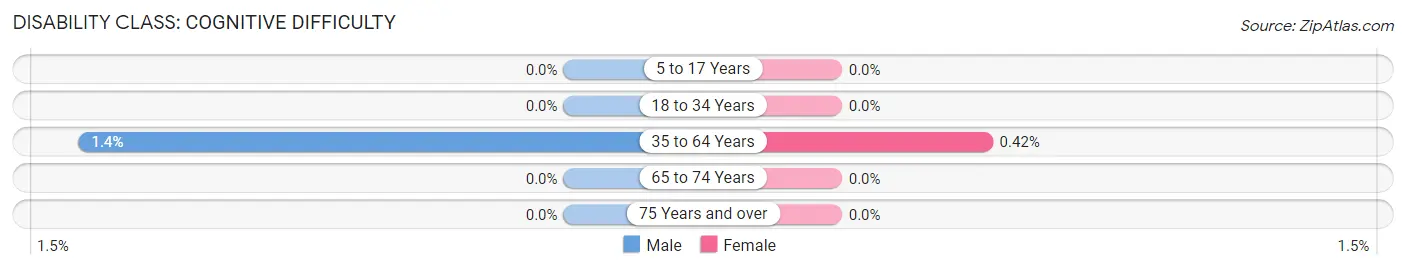
| Age Bracket | Male | Female |
| 5 to 17 Years | 0 (0.0%) | 0 (0.0%) |
| 18 to 34 Years | 0 (0.0%) | 0 (0.0%) |
| 35 to 64 Years | 8 (1.3%) | 2 (0.4%) |
| 65 to 74 Years | 0 (0.0%) | 0 (0.0%) |
| 75 Years and over | 0 (0.0%) | 0 (0.0%) |
Disability Class: Ambulatory Difficulty
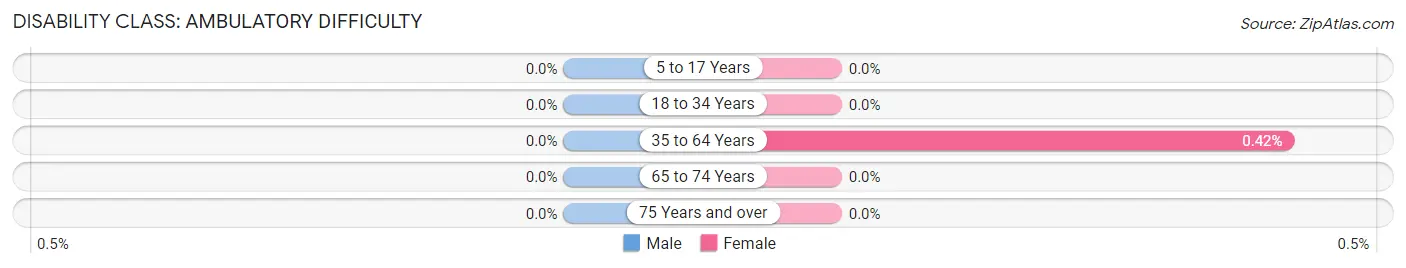
| Age Bracket | Male | Female |
| 5 to 17 Years | 0 (0.0%) | 0 (0.0%) |
| 18 to 34 Years | 0 (0.0%) | 0 (0.0%) |
| 35 to 64 Years | 0 (0.0%) | 2 (0.4%) |
| 65 to 74 Years | 0 (0.0%) | 0 (0.0%) |
| 75 Years and over | 0 (0.0%) | 0 (0.0%) |
Disability Class: Self-Care Difficulty
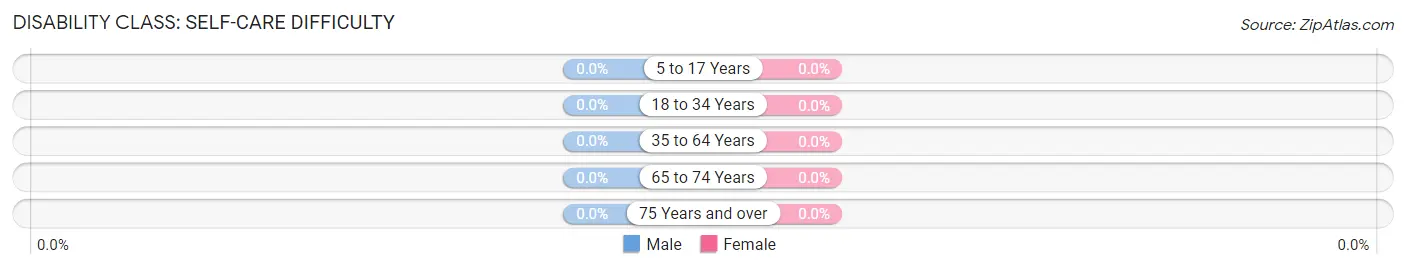
| Age Bracket | Male | Female |
| 5 to 17 Years | 0 (0.0%) | 0 (0.0%) |
| 18 to 34 Years | 0 (0.0%) | 0 (0.0%) |
| 35 to 64 Years | 0 (0.0%) | 0 (0.0%) |
| 65 to 74 Years | 0 (0.0%) | 0 (0.0%) |
| 75 Years and over | 0 (0.0%) | 0 (0.0%) |
Technology Access in Riverview
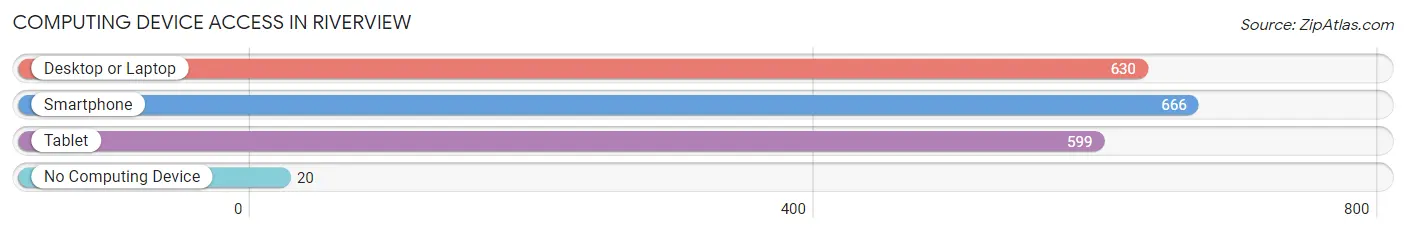
Computing Device Access in Riverview
| Device Type | # Households | % Households |
| Desktop or Laptop | 630 | 89.2% |
| Smartphone | 666 | 94.3% |
| Tablet | 599 | 84.8% |
| No Computing Device | 20 | 2.8% |
| Total | 706 | 100.0% |
Internet Access in Riverview
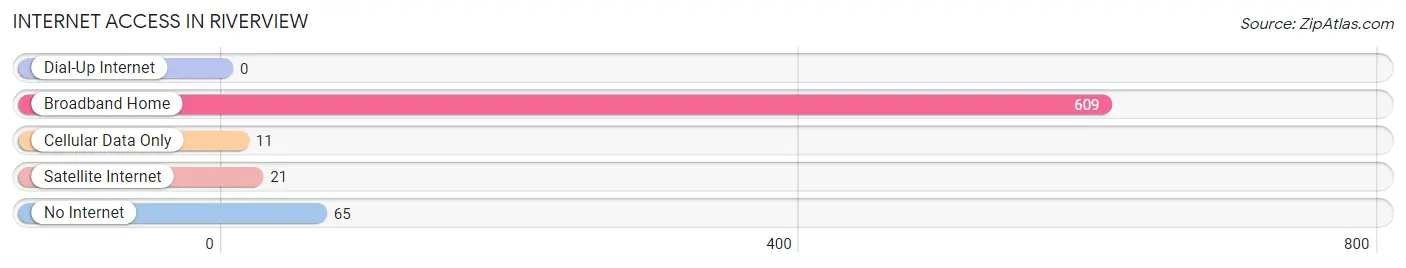
| Internet Type | # Households | % Households |
| Dial-Up Internet | 0 | 0.0% |
| Broadband Home | 609 | 86.3% |
| Cellular Data Only | 11 | 1.6% |
| Satellite Internet | 21 | 3.0% |
| No Internet | 65 | 9.2% |
| Total | 706 | 100.0% |
Riverview Summary
Riverview, SC is a small town located in the Midlands region of South Carolina. It is situated in the northern part of Richland County, approximately 20 miles northeast of the state capital, Columbia. The town was founded in 1891 and has a population of approximately 1,500 people.
History
The town of Riverview was founded in 1891 by a group of settlers from the nearby town of Columbia. The settlers were looking for a place to settle and start a new life. The town was named after the nearby Congaree River, which was a major source of transportation and commerce for the area. The town was incorporated in 1895 and has remained a small, rural community ever since.
The town was originally a farming community, with cotton and tobacco being the main crops. In the early 1900s, the town began to diversify its economy by adding a sawmill, a grist mill, and a cotton gin. The town also had a general store, a post office, and a school.
In the 1950s, the town began to experience a population boom as people moved to the area to take advantage of the new jobs created by the industrialization of the area. The town also experienced a growth in tourism as people began to visit the nearby Congaree National Park.
Geography
Riverview is located in the Midlands region of South Carolina. It is situated in the northern part of Richland County, approximately 20 miles northeast of the state capital, Columbia. The town is located on the banks of the Congaree River, which is a major source of transportation and commerce for the area.
The town is surrounded by rolling hills and forests, making it a popular destination for outdoor activities such as fishing, hunting, and camping. The town is also home to several parks, including Congaree National Park, which is a popular destination for bird watching and hiking.
Economy
The economy of Riverview is largely based on agriculture and tourism. The town is home to several farms, which produce a variety of crops, including cotton, tobacco, and soybeans. The town also has a sawmill, a grist mill, and a cotton gin.
The town is also a popular destination for tourists, who come to visit the nearby Congaree National Park. The park is a popular destination for bird watching and hiking. The town also has several restaurants, shops, and other businesses that cater to tourists.
Demographics
As of the 2010 census, the population of Riverview was 1,500 people. The town is predominantly white, with African Americans making up approximately 10% of the population. The median household income is $37,000, and the median age is 38 years old. The town has a high rate of homeownership, with approximately 75% of the population owning their own homes.
Common Questions
What is Per Capita Income in Riverview?
Per Capita income in Riverview is $43,849.
What is the Median Family Income in Riverview?
Median Family Income in Riverview is $126,427.
What is the Median Household income in Riverview?
Median Household Income in Riverview is $125,897.
What is Income or Wage Gap in Riverview?
Income or Wage Gap in Riverview is 8.3%.
Women in Riverview earn 91.7 cents for every dollar earned by a man.
What is Inequality or Gini Index in Riverview?
Inequality or Gini Index in Riverview is 0.29.
What is the Total Population of Riverview?
Total Population of Riverview is 2,010.
What is the Total Male Population of Riverview?
Total Male Population of Riverview is 937.
What is the Total Female Population of Riverview?
Total Female Population of Riverview is 1,073.
What is the Ratio of Males per 100 Females in Riverview?
There are 87.33 Males per 100 Females in Riverview.
What is the Ratio of Females per 100 Males in Riverview?
There are 114.51 Females per 100 Males in Riverview.
What is the Median Population Age in Riverview?
Median Population Age in Riverview is 40.5 Years.
What is the Average Family Size in Riverview
Average Family Size in Riverview is 3.2 People.
What is the Average Household Size in Riverview
Average Household Size in Riverview is 2.9 People.
How Large is the Labor Force in Riverview?
There are 1,379 People in the Labor Forcein in Riverview.
What is the Percentage of People in the Labor Force in Riverview?
80.9% of People are in the Labor Force in Riverview.
What is the Unemployment Rate in Riverview?
Unemployment Rate in Riverview is 16.3%.