Hanahan, SC Map & Demographics
Hanahan Map
Hanahan Overview
$35,980
PER CAPITA INCOME
$94,400
AVG FAMILY INCOME
$79,305
AVG HOUSEHOLD INCOME
22.6%
WAGE / INCOME GAP [ % ]
77.4¢/ $1
WAGE / INCOME GAP [ $ ]
$7,790
FAMILY INCOME DEFICIT
0.40
INEQUALITY / GINI INDEX
20,731
TOTAL POPULATION
10,534
MALE POPULATION
10,197
FEMALE POPULATION
103.30
MALES / 100 FEMALES
96.80
FEMALES / 100 MALES
35.0
MEDIAN AGE
3.4
AVG FAMILY SIZE
2.8
AVG HOUSEHOLD SIZE
10,687
LABOR FORCE [ PEOPLE ]
68.3%
PERCENT IN LABOR FORCE
2.1%
UNEMPLOYMENT RATE
Hanahan Zip Codes
Hanahan Area Codes
Income in Hanahan
Income Overview in Hanahan
Per Capita Income in Hanahan is $35,980, while median incomes of families and households are $94,400 and $79,305 respectively.
| Characteristic | Number | Measure |
| Per Capita Income | 20,731 | $35,980 |
| Median Family Income | 4,985 | $94,400 |
| Mean Family Income | 4,985 | $107,429 |
| Median Household Income | 7,360 | $79,305 |
| Mean Household Income | 7,360 | $95,237 |
| Income Deficit | 4,985 | $7,790 |
| Wage / Income Gap (%) | 20,731 | 22.55% |
| Wage / Income Gap ($) | 20,731 | 77.45¢ per $1 |
| Gini / Inequality Index | 20,731 | 0.40 |
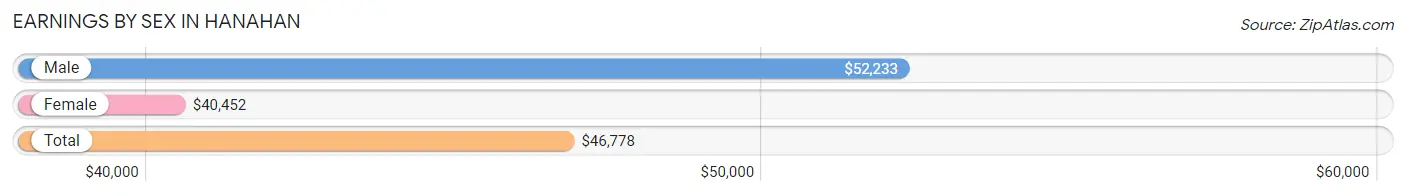
Earnings by Sex in Hanahan
Average Earnings in Hanahan are $46,778, $52,233 for men and $40,452 for women, a difference of 22.6%.
| Sex | Number | Average Earnings |
| Male | 6,161 (55.6%) | $52,233 |
| Female | 4,911 (44.4%) | $40,452 |
| Total | 11,072 (100.0%) | $46,778 |
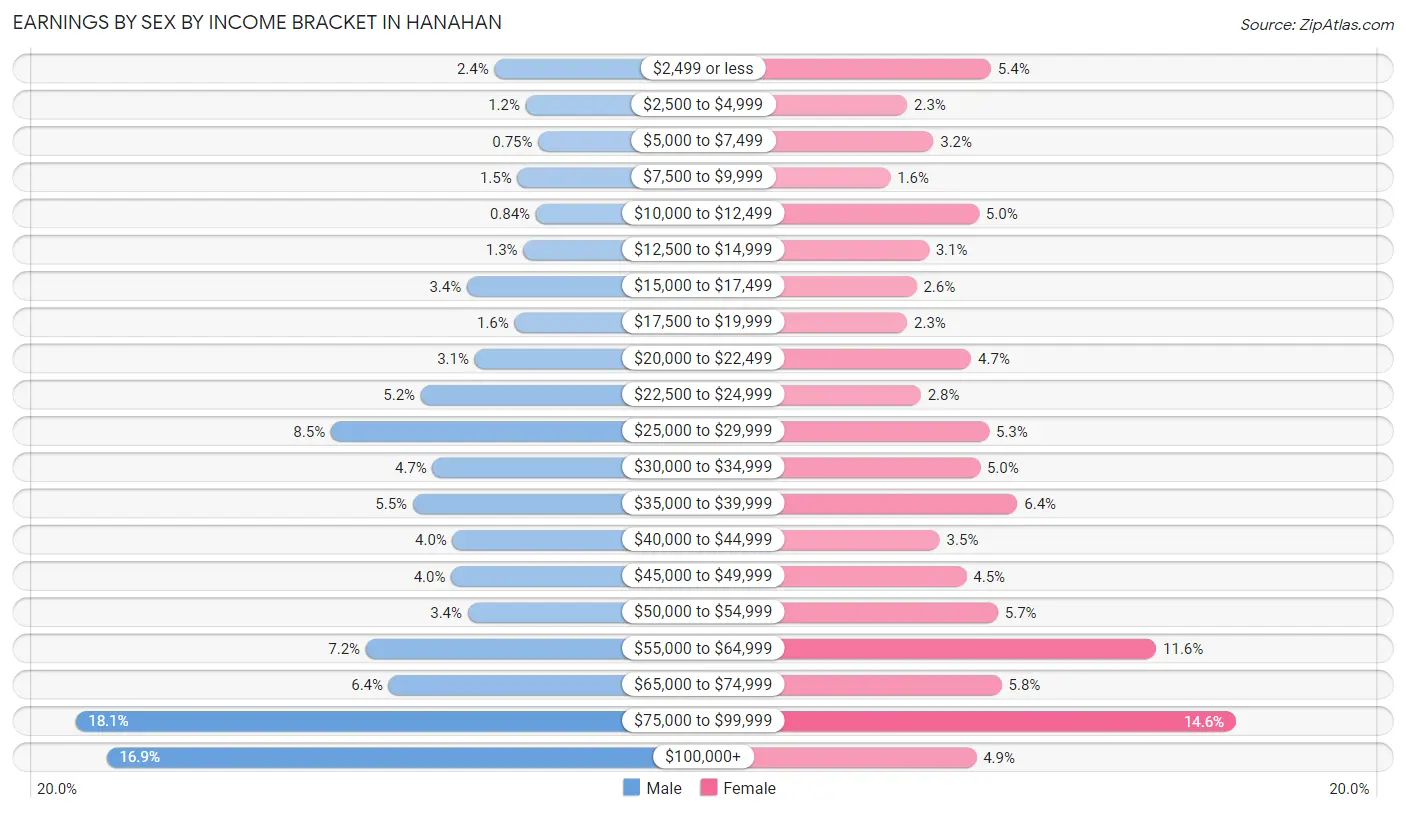
Earnings by Sex by Income Bracket in Hanahan
The most common earnings brackets in Hanahan are $75,000 to $99,999 for men (1,115 | 18.1%) and $75,000 to $99,999 for women (716 | 14.6%).
| Income | Male | Female |
| $2,499 or less | 147 (2.4%) | 265 (5.4%) |
| $2,500 to $4,999 | 75 (1.2%) | 111 (2.3%) |
| $5,000 to $7,499 | 46 (0.7%) | 159 (3.2%) |
| $7,500 to $9,999 | 94 (1.5%) | 80 (1.6%) |
| $10,000 to $12,499 | 52 (0.8%) | 243 (5.0%) |
| $12,500 to $14,999 | 81 (1.3%) | 151 (3.1%) |
| $15,000 to $17,499 | 211 (3.4%) | 128 (2.6%) |
| $17,500 to $19,999 | 101 (1.6%) | 111 (2.3%) |
| $20,000 to $22,499 | 193 (3.1%) | 229 (4.7%) |
| $22,500 to $24,999 | 317 (5.1%) | 136 (2.8%) |
| $25,000 to $29,999 | 525 (8.5%) | 262 (5.3%) |
| $30,000 to $34,999 | 290 (4.7%) | 245 (5.0%) |
| $35,000 to $39,999 | 336 (5.4%) | 314 (6.4%) |
| $40,000 to $44,999 | 244 (4.0%) | 171 (3.5%) |
| $45,000 to $49,999 | 247 (4.0%) | 220 (4.5%) |
| $50,000 to $54,999 | 209 (3.4%) | 278 (5.7%) |
| $55,000 to $64,999 | 444 (7.2%) | 569 (11.6%) |
| $65,000 to $74,999 | 391 (6.4%) | 285 (5.8%) |
| $75,000 to $99,999 | 1,115 (18.1%) | 716 (14.6%) |
| $100,000+ | 1,043 (16.9%) | 238 (4.9%) |
| Total | 6,161 (100.0%) | 4,911 (100.0%) |
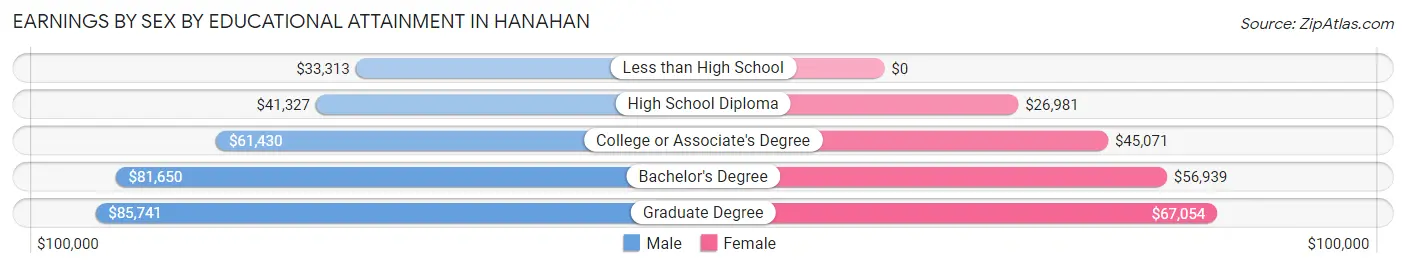
Earnings by Sex by Educational Attainment in Hanahan
Average earnings in Hanahan are $61,792 for men and $48,003 for women, a difference of 22.3%. Men with an educational attainment of graduate degree enjoy the highest average annual earnings of $85,741, while those with less than high school education earn the least with $33,313. Women with an educational attainment of graduate degree earn the most with the average annual earnings of $67,054, while those with high school diploma education have the smallest earnings of $26,981.
| Educational Attainment | Male Income | Female Income |
| Less than High School | $33,313 | $0 |
| High School Diploma | $41,327 | $26,981 |
| College or Associate's Degree | $61,430 | $45,071 |
| Bachelor's Degree | $81,650 | $56,939 |
| Graduate Degree | $85,741 | $67,054 |
| Total | $61,792 | $48,003 |
Family Income in Hanahan
Family Income Brackets in Hanahan
According to the Hanahan family income data, there are 1,216 families falling into the $100,000 to $149,999 income range, which is the most common income bracket and makes up 24.4% of all families. Conversely, the $10,000 to $14,999 income bracket is the least frequent group with only 85 families (1.7%) belonging to this category.
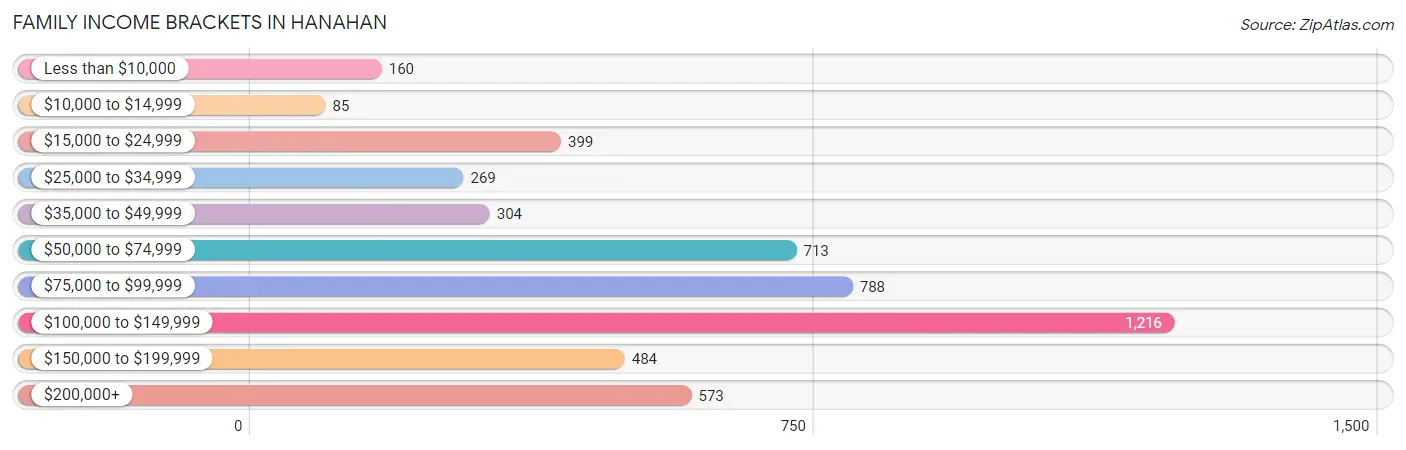
| Income Bracket | # Families | % Families |
| Less than $10,000 | 160 | 3.2% |
| $10,000 to $14,999 | 85 | 1.7% |
| $15,000 to $24,999 | 399 | 8.0% |
| $25,000 to $34,999 | 269 | 5.4% |
| $35,000 to $49,999 | 304 | 6.1% |
| $50,000 to $74,999 | 713 | 14.3% |
| $75,000 to $99,999 | 788 | 15.8% |
| $100,000 to $149,999 | 1,216 | 24.4% |
| $150,000 to $199,999 | 484 | 9.7% |
| $200,000+ | 573 | 11.5% |
Family Income by Famaliy Size in Hanahan
6-person families (73 | 1.5%) account for the highest median family income in Hanahan with $123,229 per family, while 2-person families (2,015 | 40.4%) have the highest median income of $46,534 per family member.
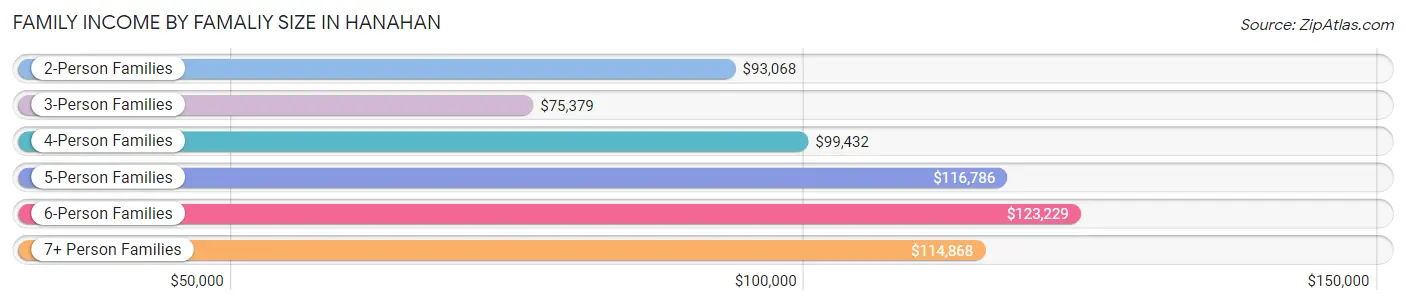
| Income Bracket | # Families | Median Income |
| 2-Person Families | 2,015 (40.4%) | $93,068 |
| 3-Person Families | 1,322 (26.5%) | $75,379 |
| 4-Person Families | 907 (18.2%) | $99,432 |
| 5-Person Families | 576 (11.6%) | $116,786 |
| 6-Person Families | 73 (1.5%) | $123,229 |
| 7+ Person Families | 92 (1.8%) | $114,868 |
| Total | 4,985 (100.0%) | $94,400 |
Family Income by Number of Earners in Hanahan
The median family income in Hanahan is $94,400, with families comprising 3+ earners (494) having the highest median family income of $128,409, while families with no earners (599) have the lowest median family income of $47,188, accounting for 9.9% and 12.0% of families, respectively.
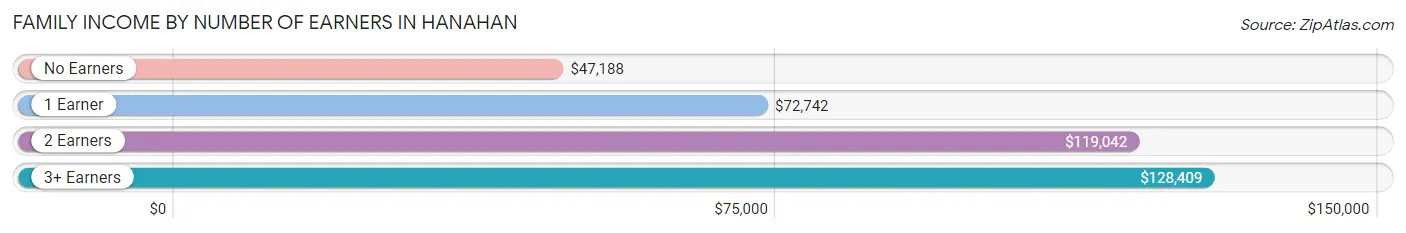
| Number of Earners | # Families | Median Income |
| No Earners | 599 (12.0%) | $47,188 |
| 1 Earner | 1,780 (35.7%) | $72,742 |
| 2 Earners | 2,112 (42.4%) | $119,042 |
| 3+ Earners | 494 (9.9%) | $128,409 |
| Total | 4,985 (100.0%) | $94,400 |
Household Income in Hanahan
Household Income Brackets in Hanahan
With 1,597 households falling in the category, the $100,000 to $149,999 income range is the most frequent in Hanahan, accounting for 21.7% of all households. In contrast, only 169 households (2.3%) fall into the $10,000 to $14,999 income bracket, making it the least populous group.
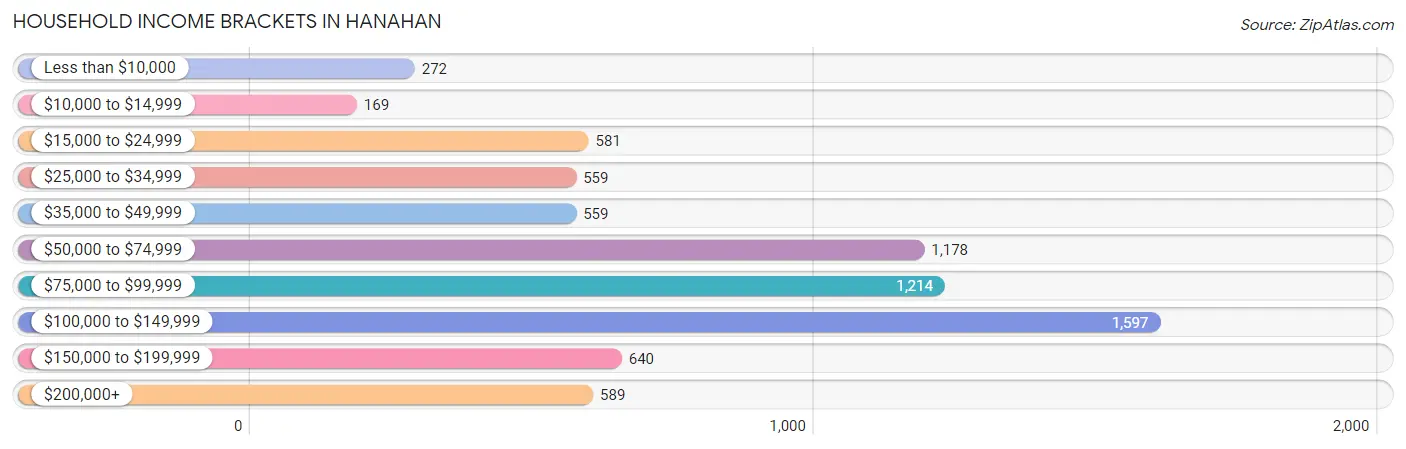
| Income Bracket | # Households | % Households |
| Less than $10,000 | 272 | 3.7% |
| $10,000 to $14,999 | 169 | 2.3% |
| $15,000 to $24,999 | 581 | 7.9% |
| $25,000 to $34,999 | 559 | 7.6% |
| $35,000 to $49,999 | 559 | 7.6% |
| $50,000 to $74,999 | 1,178 | 16.0% |
| $75,000 to $99,999 | 1,214 | 16.5% |
| $100,000 to $149,999 | 1,597 | 21.7% |
| $150,000 to $199,999 | 640 | 8.7% |
| $200,000+ | 589 | 8.0% |
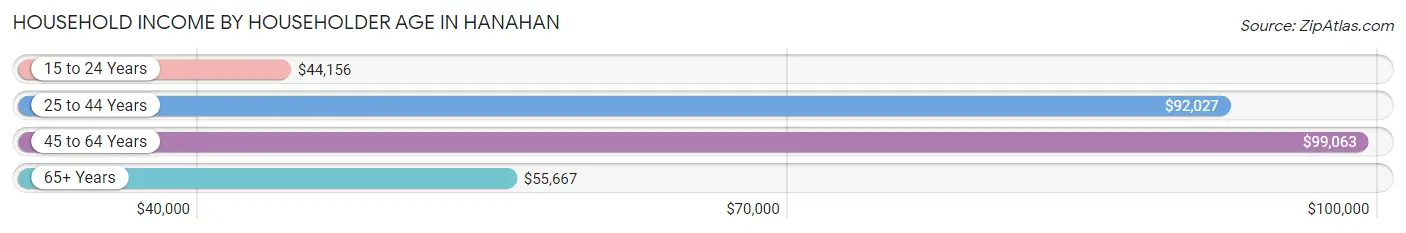
Household Income by Householder Age in Hanahan
The median household income in Hanahan is $79,305, with the highest median household income of $99,063 found in the 45 to 64 years age bracket for the primary householder. A total of 2,427 households (33.0%) fall into this category. Meanwhile, the 15 to 24 years age bracket for the primary householder has the lowest median household income of $44,156, with 515 households (7.0%) in this group.
| Income Bracket | # Households | Median Income |
| 15 to 24 Years | 515 (7.0%) | $44,156 |
| 25 to 44 Years | 2,758 (37.5%) | $92,027 |
| 45 to 64 Years | 2,427 (33.0%) | $99,063 |
| 65+ Years | 1,660 (22.6%) | $55,667 |
| Total | 7,360 (100.0%) | $79,305 |
Poverty in Hanahan
Income Below Poverty by Sex and Age in Hanahan
With 11.4% poverty level for males and 14.6% for females among the residents of Hanahan, under 5 year old males and under 5 year old females are the most vulnerable to poverty, with 346 males (36.8%) and 266 females (35.7%) in their respective age groups living below the poverty level.
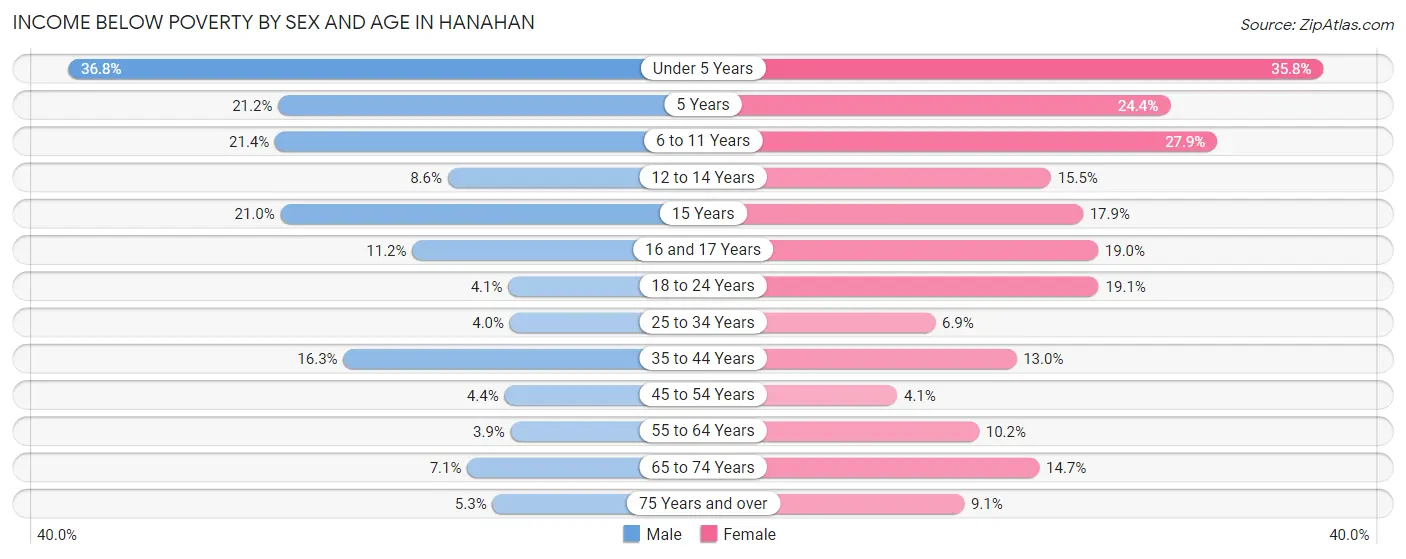
| Age Bracket | Male | Female |
| Under 5 Years | 346 (36.8%) | 266 (35.7%) |
| 5 Years | 65 (21.2%) | 29 (24.4%) |
| 6 to 11 Years | 147 (21.4%) | 294 (27.9%) |
| 12 to 14 Years | 37 (8.6%) | 74 (15.5%) |
| 15 Years | 42 (21.0%) | 22 (17.9%) |
| 16 and 17 Years | 26 (11.2%) | 46 (19.0%) |
| 18 to 24 Years | 35 (4.1%) | 143 (19.1%) |
| 25 to 34 Years | 65 (4.0%) | 99 (6.9%) |
| 35 to 44 Years | 256 (16.3%) | 183 (13.0%) |
| 45 to 54 Years | 49 (4.4%) | 57 (4.1%) |
| 55 to 64 Years | 50 (3.9%) | 102 (10.2%) |
| 65 to 74 Years | 33 (7.1%) | 109 (14.6%) |
| 75 Years and over | 36 (5.3%) | 64 (9.1%) |
| Total | 1,187 (11.4%) | 1,488 (14.6%) |
Income Above Poverty by Sex and Age in Hanahan
According to the poverty statistics in Hanahan, males aged 55 to 64 years and females aged 45 to 54 years are the age groups that are most secure financially, with 96.1% of males and 95.9% of females in these age groups living above the poverty line.
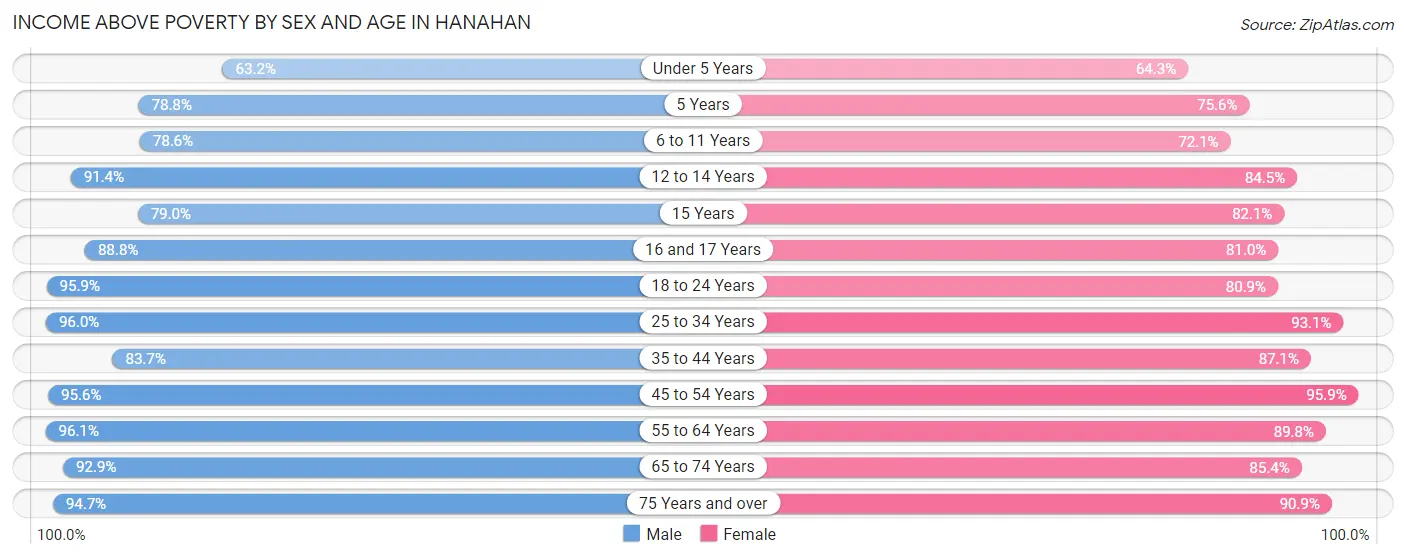
| Age Bracket | Male | Female |
| Under 5 Years | 595 (63.2%) | 478 (64.2%) |
| 5 Years | 242 (78.8%) | 90 (75.6%) |
| 6 to 11 Years | 540 (78.6%) | 761 (72.1%) |
| 12 to 14 Years | 394 (91.4%) | 403 (84.5%) |
| 15 Years | 158 (79.0%) | 101 (82.1%) |
| 16 and 17 Years | 206 (88.8%) | 196 (81.0%) |
| 18 to 24 Years | 821 (95.9%) | 607 (80.9%) |
| 25 to 34 Years | 1,572 (96.0%) | 1,332 (93.1%) |
| 35 to 44 Years | 1,312 (83.7%) | 1,230 (87.1%) |
| 45 to 54 Years | 1,072 (95.6%) | 1,333 (95.9%) |
| 55 to 64 Years | 1,229 (96.1%) | 901 (89.8%) |
| 65 to 74 Years | 430 (92.9%) | 635 (85.4%) |
| 75 Years and over | 648 (94.7%) | 642 (90.9%) |
| Total | 9,219 (88.6%) | 8,709 (85.4%) |
Income Below Poverty Among Married-Couple Families in Hanahan
The poverty statistics for married-couple families in Hanahan show that 5.7% or 210 of the total 3,660 families live below the poverty line. Families with 3 or 4 children have the highest poverty rate of 17.3%, comprising of 68 families. On the other hand, families with 5 or more children have the lowest poverty rate of 0.0%, which includes 0 families.
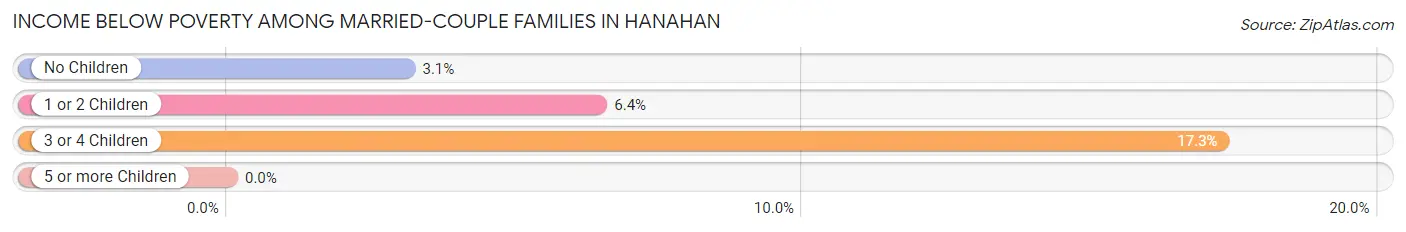
| Children | Above Poverty | Below Poverty |
| No Children | 1,915 (96.9%) | 61 (3.1%) |
| 1 or 2 Children | 1,178 (93.6%) | 81 (6.4%) |
| 3 or 4 Children | 326 (82.7%) | 68 (17.3%) |
| 5 or more Children | 31 (100.0%) | 0 (0.0%) |
| Total | 3,450 (94.3%) | 210 (5.7%) |
Income Below Poverty Among Single-Parent Households in Hanahan
According to the poverty data in Hanahan, 34.3% or 182 single-father households and 27.2% or 216 single-mother households are living below the poverty line. Among single-father households, those with 1 or 2 children have the highest poverty rate, with 171 households (79.9%) experiencing poverty. Likewise, among single-mother households, those with 3 or 4 children have the highest poverty rate, with 83 households (64.8%) falling below the poverty line.
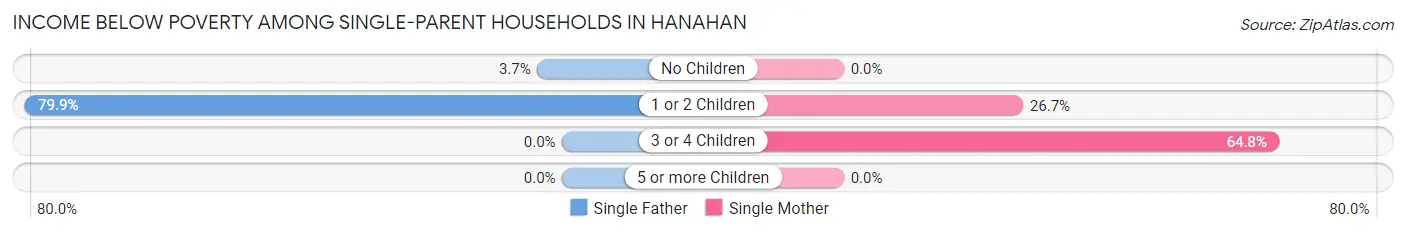
| Children | Single Father | Single Mother |
| No Children | 11 (3.7%) | 0 (0.0%) |
| 1 or 2 Children | 171 (79.9%) | 133 (26.7%) |
| 3 or 4 Children | 0 (0.0%) | 83 (64.8%) |
| 5 or more Children | 0 (0.0%) | 0 (0.0%) |
| Total | 182 (34.3%) | 216 (27.2%) |
Income Below Poverty Among Married-Couple vs Single-Parent Households in Hanahan
The poverty data for Hanahan shows that 210 of the married-couple family households (5.7%) and 398 of the single-parent households (30.0%) are living below the poverty level. Within the married-couple family households, those with 3 or 4 children have the highest poverty rate, with 68 households (17.3%) falling below the poverty line. Among the single-parent households, those with 3 or 4 children have the highest poverty rate, with 83 household (56.5%) living below poverty.
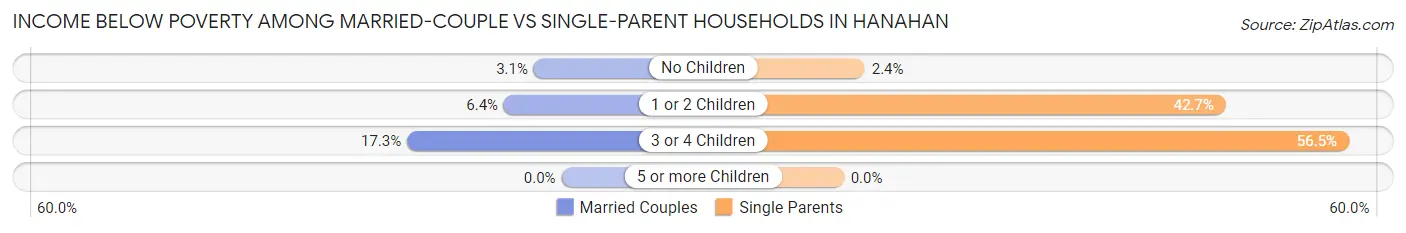
| Children | Married-Couple Families | Single-Parent Households |
| No Children | 61 (3.1%) | 11 (2.4%) |
| 1 or 2 Children | 81 (6.4%) | 304 (42.7%) |
| 3 or 4 Children | 68 (17.3%) | 83 (56.5%) |
| 5 or more Children | 0 (0.0%) | 0 (0.0%) |
| Total | 210 (5.7%) | 398 (30.0%) |
Race in Hanahan
The most populous races in Hanahan are White / Caucasian (15,480 | 74.7%), Hispanic or Latino (2,605 | 12.6%), and Black / African American (2,175 | 10.5%).
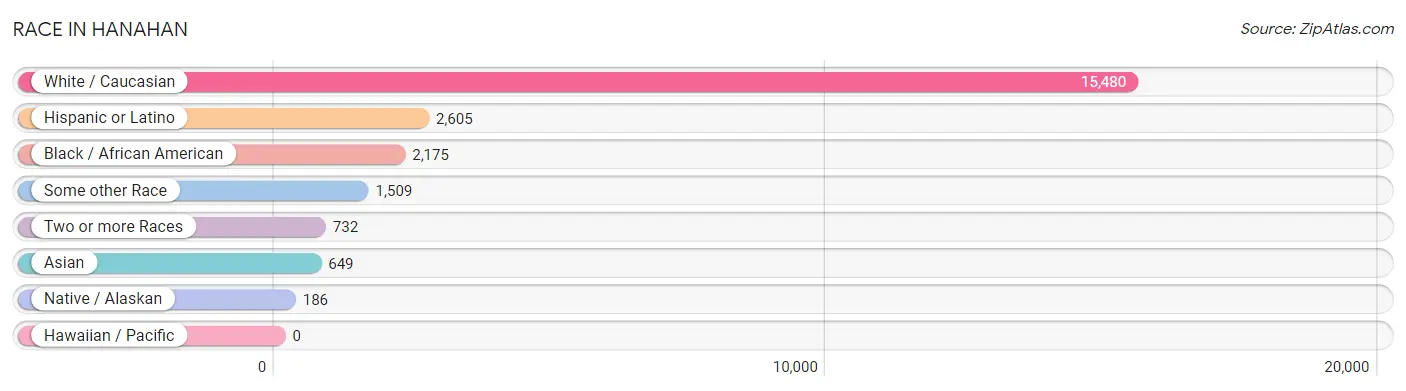
| Race | # Population | % Population |
| Asian | 649 | 3.1% |
| Black / African American | 2,175 | 10.5% |
| Hawaiian / Pacific | 0 | 0.0% |
| Hispanic or Latino | 2,605 | 12.6% |
| Native / Alaskan | 186 | 0.9% |
| White / Caucasian | 15,480 | 74.7% |
| Two or more Races | 732 | 3.5% |
| Some other Race | 1,509 | 7.3% |
| Total | 20,731 | 100.0% |
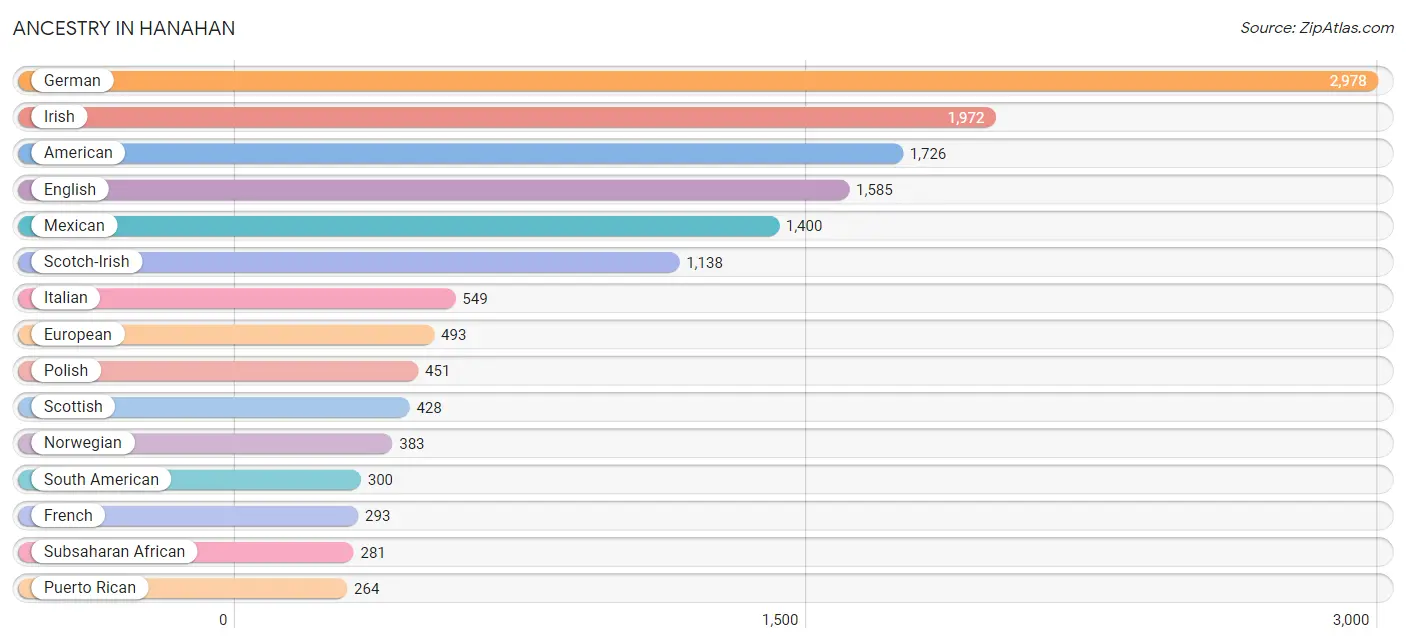
Ancestry in Hanahan
The most populous ancestries reported in Hanahan are German (2,978 | 14.4%), Irish (1,972 | 9.5%), American (1,726 | 8.3%), English (1,585 | 7.6%), and Mexican (1,400 | 6.8%), together accounting for 46.6% of all Hanahan residents.
| Ancestry | # Population | % Population |
| African | 61 | 0.3% |
| Alaska Native | 2 | 0.0% |
| Albanian | 13 | 0.1% |
| American | 1,726 | 8.3% |
| Arab | 101 | 0.5% |
| Australian | 24 | 0.1% |
| Austrian | 16 | 0.1% |
| Belgian | 27 | 0.1% |
| Bhutanese | 80 | 0.4% |
| Blackfeet | 11 | 0.1% |
| Brazilian | 125 | 0.6% |
| British | 128 | 0.6% |
| Burmese | 190 | 0.9% |
| Cajun | 31 | 0.2% |
| Canadian | 7 | 0.0% |
| Celtic | 15 | 0.1% |
| Central American | 126 | 0.6% |
| Central American Indian | 33 | 0.2% |
| Cherokee | 40 | 0.2% |
| Cheyenne | 8 | 0.0% |
| Chilean | 59 | 0.3% |
| Choctaw | 6 | 0.0% |
| Colombian | 40 | 0.2% |
| Costa Rican | 11 | 0.1% |
| Creek | 6 | 0.0% |
| Cuban | 142 | 0.7% |
| Danish | 15 | 0.1% |
| Dominican | 46 | 0.2% |
| Dutch | 259 | 1.3% |
| Eastern European | 13 | 0.1% |
| Ecuadorian | 21 | 0.1% |
| Egyptian | 59 | 0.3% |
| English | 1,585 | 7.6% |
| European | 493 | 2.4% |
| Finnish | 24 | 0.1% |
| French | 293 | 1.4% |
| French Canadian | 40 | 0.2% |
| German | 2,978 | 14.4% |
| Greek | 43 | 0.2% |
| Guatemalan | 22 | 0.1% |
| Honduran | 63 | 0.3% |
| Hungarian | 25 | 0.1% |
| Indian (Asian) | 1 | 0.0% |
| Iranian | 30 | 0.1% |
| Irish | 1,972 | 9.5% |
| Israeli | 24 | 0.1% |
| Italian | 549 | 2.6% |
| Jamaican | 8 | 0.0% |
| Japanese | 6 | 0.0% |
| Kenyan | 58 | 0.3% |
| Korean | 221 | 1.1% |
| Lebanese | 20 | 0.1% |
| Lithuanian | 10 | 0.1% |
| Luxembourger | 14 | 0.1% |
| Mexican | 1,400 | 6.8% |
| Mexican American Indian | 156 | 0.7% |
| Moroccan | 14 | 0.1% |
| Nicaraguan | 30 | 0.1% |
| Nigerian | 162 | 0.8% |
| Northern European | 21 | 0.1% |
| Norwegian | 383 | 1.8% |
| Pakistani | 79 | 0.4% |
| Polish | 451 | 2.2% |
| Portuguese | 14 | 0.1% |
| Puerto Rican | 264 | 1.3% |
| Russian | 8 | 0.0% |
| Scandinavian | 62 | 0.3% |
| Scotch-Irish | 1,138 | 5.5% |
| Scottish | 428 | 2.1% |
| Seminole | 9 | 0.0% |
| Slovak | 8 | 0.0% |
| South American | 300 | 1.5% |
| Sri Lankan | 223 | 1.1% |
| Subsaharan African | 281 | 1.4% |
| Swedish | 42 | 0.2% |
| Thai | 68 | 0.3% |
| Trinidadian and Tobagonian | 1 | 0.0% |
| Turkish | 39 | 0.2% |
| Ukrainian | 96 | 0.5% |
| Venezuelan | 180 | 0.9% |
| Welsh | 119 | 0.6% | View All 81 Rows |
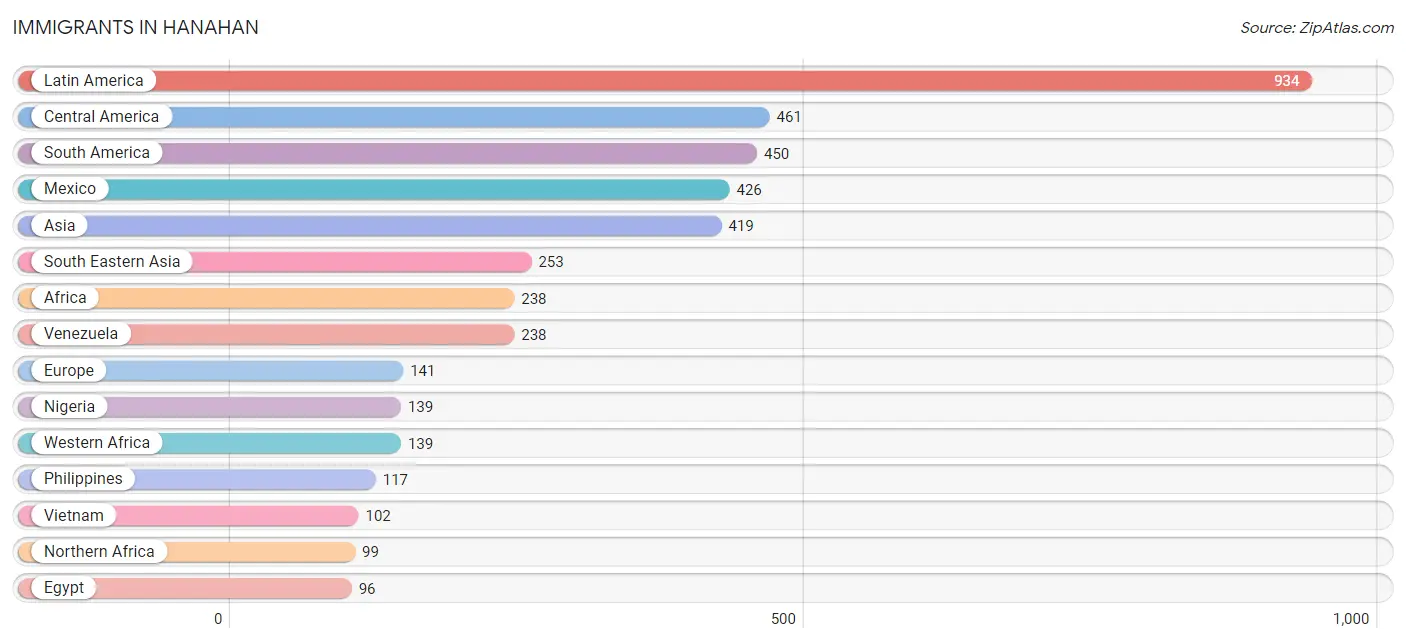
Immigrants in Hanahan
The most numerous immigrant groups reported in Hanahan came from Latin America (934 | 4.5%), Central America (461 | 2.2%), South America (450 | 2.2%), Mexico (426 | 2.1%), and Asia (419 | 2.0%), together accounting for 13.0% of all Hanahan residents.
| Immigration Origin | # Population | % Population |
| Africa | 238 | 1.1% |
| Asia | 419 | 2.0% |
| Brazil | 91 | 0.4% |
| Canada | 21 | 0.1% |
| Caribbean | 23 | 0.1% |
| Central America | 461 | 2.2% |
| Chile | 25 | 0.1% |
| China | 14 | 0.1% |
| Colombia | 75 | 0.4% |
| Cuba | 14 | 0.1% |
| Eastern Asia | 45 | 0.2% |
| Eastern Europe | 57 | 0.3% |
| Ecuador | 21 | 0.1% |
| Egypt | 96 | 0.5% |
| Europe | 141 | 0.7% |
| France | 23 | 0.1% |
| Germany | 46 | 0.2% |
| Guatemala | 22 | 0.1% |
| Honduras | 13 | 0.1% |
| Hong Kong | 14 | 0.1% |
| India | 44 | 0.2% |
| Iran | 8 | 0.0% |
| Jamaica | 8 | 0.0% |
| Japan | 12 | 0.1% |
| Jordan | 40 | 0.2% |
| Korea | 19 | 0.1% |
| Latin America | 934 | 4.5% |
| Mexico | 426 | 2.1% |
| Morocco | 3 | 0.0% |
| Nigeria | 139 | 0.7% |
| Northern Africa | 99 | 0.5% |
| Philippines | 117 | 0.6% |
| Poland | 11 | 0.1% |
| Portugal | 15 | 0.1% |
| South America | 450 | 2.2% |
| South Central Asia | 52 | 0.3% |
| South Eastern Asia | 253 | 1.2% |
| Southern Europe | 15 | 0.1% |
| Thailand | 34 | 0.2% |
| Trinidad and Tobago | 1 | 0.0% |
| Turkey | 29 | 0.1% |
| Ukraine | 46 | 0.2% |
| Venezuela | 238 | 1.1% |
| Vietnam | 102 | 0.5% |
| Western Africa | 139 | 0.7% |
| Western Asia | 69 | 0.3% |
| Western Europe | 69 | 0.3% | View All 47 Rows |
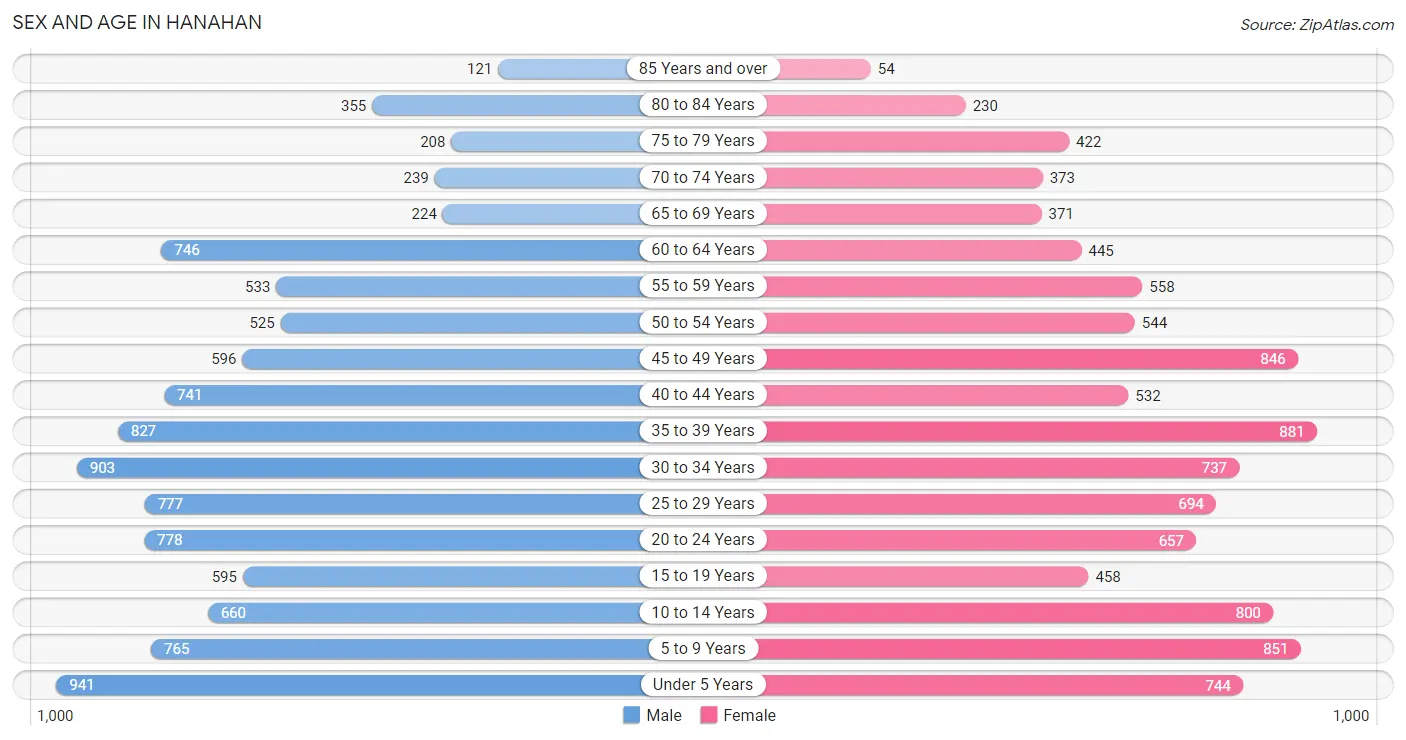
Sex and Age in Hanahan
Sex and Age in Hanahan
The most populous age groups in Hanahan are Under 5 Years (941 | 8.9%) for men and 35 to 39 Years (881 | 8.6%) for women.
| Age Bracket | Male | Female |
| Under 5 Years | 941 (8.9%) | 744 (7.3%) |
| 5 to 9 Years | 765 (7.3%) | 851 (8.4%) |
| 10 to 14 Years | 660 (6.3%) | 800 (7.9%) |
| 15 to 19 Years | 595 (5.7%) | 458 (4.5%) |
| 20 to 24 Years | 778 (7.4%) | 657 (6.4%) |
| 25 to 29 Years | 777 (7.4%) | 694 (6.8%) |
| 30 to 34 Years | 903 (8.6%) | 737 (7.2%) |
| 35 to 39 Years | 827 (7.9%) | 881 (8.6%) |
| 40 to 44 Years | 741 (7.0%) | 532 (5.2%) |
| 45 to 49 Years | 596 (5.7%) | 846 (8.3%) |
| 50 to 54 Years | 525 (5.0%) | 544 (5.3%) |
| 55 to 59 Years | 533 (5.1%) | 558 (5.5%) |
| 60 to 64 Years | 746 (7.1%) | 445 (4.4%) |
| 65 to 69 Years | 224 (2.1%) | 371 (3.6%) |
| 70 to 74 Years | 239 (2.3%) | 373 (3.7%) |
| 75 to 79 Years | 208 (2.0%) | 422 (4.1%) |
| 80 to 84 Years | 355 (3.4%) | 230 (2.3%) |
| 85 Years and over | 121 (1.1%) | 54 (0.5%) |
| Total | 10,534 (100.0%) | 10,197 (100.0%) |
Families and Households in Hanahan
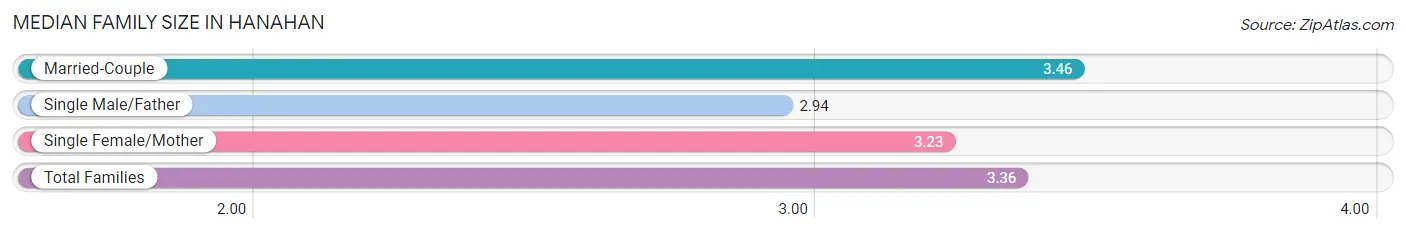
Median Family Size in Hanahan
The median family size in Hanahan is 3.36 persons per family, with married-couple families (3,660 | 73.4%) accounting for the largest median family size of 3.46 persons per family. On the other hand, single male/father families (530 | 10.6%) represent the smallest median family size with 2.94 persons per family.
| Family Type | # Families | Family Size |
| Married-Couple | 3,660 (73.4%) | 3.46 |
| Single Male/Father | 530 (10.6%) | 2.94 |
| Single Female/Mother | 795 (16.0%) | 3.23 |
| Total Families | 4,985 (100.0%) | 3.36 |
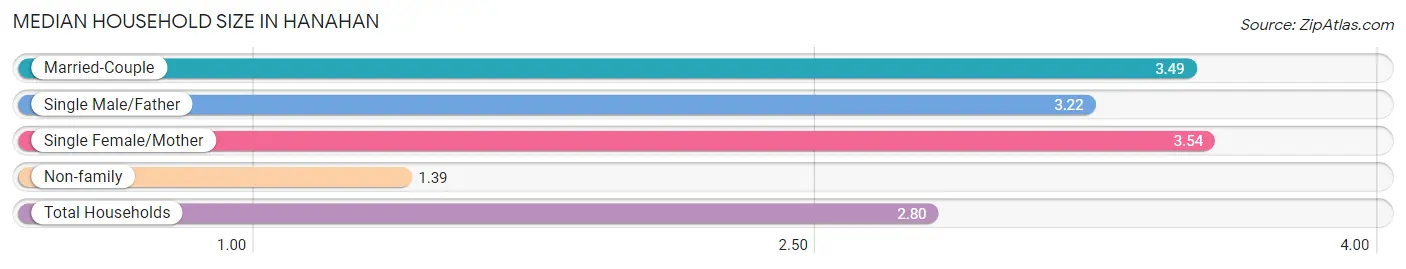
Median Household Size in Hanahan
The median household size in Hanahan is 2.80 persons per household, with single female/mother households (795 | 10.8%) accounting for the largest median household size of 3.54 persons per household. non-family households (2,375 | 32.3%) represent the smallest median household size with 1.39 persons per household.
| Household Type | # Households | Household Size |
| Married-Couple | 3,660 (49.7%) | 3.49 |
| Single Male/Father | 530 (7.2%) | 3.22 |
| Single Female/Mother | 795 (10.8%) | 3.54 |
| Non-family | 2,375 (32.3%) | 1.39 |
| Total Households | 7,360 (100.0%) | 2.80 |
Household Size by Marriage Status in Hanahan
Out of a total of 7,360 households in Hanahan, 4,985 (67.7%) are family households, while 2,375 (32.3%) are nonfamily households. The most numerous type of family households are 2-person households, comprising 1,915, and the most common type of nonfamily households are 1-person households, comprising 1,743.
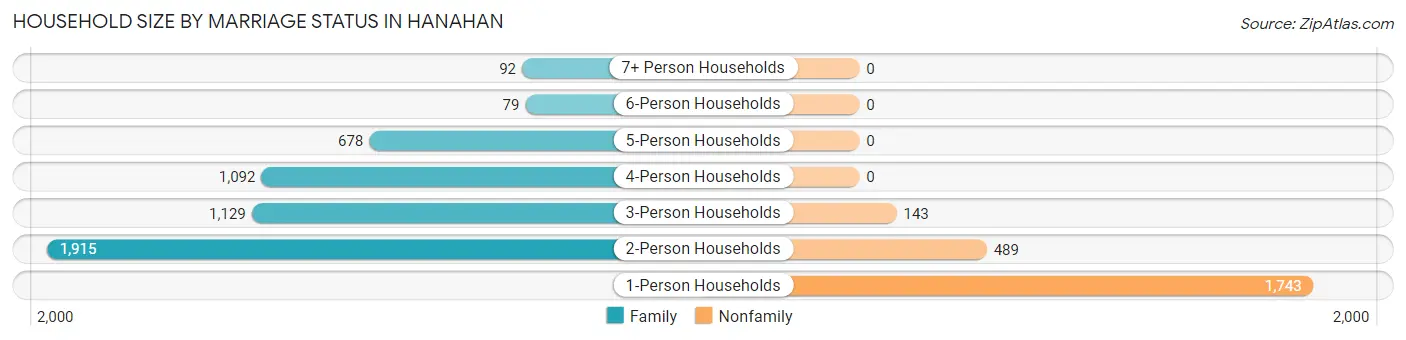
| Household Size | Family Households | Nonfamily Households |
| 1-Person Households | - | 1,743 (23.7%) |
| 2-Person Households | 1,915 (26.0%) | 489 (6.6%) |
| 3-Person Households | 1,129 (15.3%) | 143 (1.9%) |
| 4-Person Households | 1,092 (14.8%) | 0 (0.0%) |
| 5-Person Households | 678 (9.2%) | 0 (0.0%) |
| 6-Person Households | 79 (1.1%) | 0 (0.0%) |
| 7+ Person Households | 92 (1.3%) | 0 (0.0%) |
| Total | 4,985 (67.7%) | 2,375 (32.3%) |
Female Fertility in Hanahan
Fertility by Age in Hanahan
Average fertility rate in Hanahan is 48.0 births per 1,000 women. Women in the age bracket of 20 to 34 years have the highest fertility rate with 83.0 births per 1,000 women. Women in the age bracket of 20 to 34 years acount for 74.0% of all women with births.
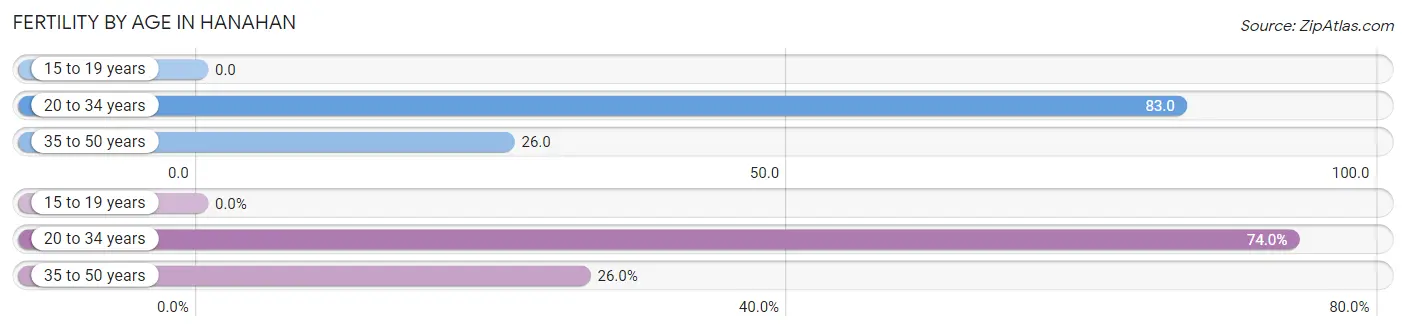
| Age Bracket | Women with Births | Births / 1,000 Women |
| 15 to 19 years | 0 (0.0%) | 0.0 |
| 20 to 34 years | 174 (74.0%) | 83.0 |
| 35 to 50 years | 61 (26.0%) | 26.0 |
| Total | 235 (100.0%) | 48.0 |
Fertility by Age by Marriage Status in Hanahan
70.6% of women with births (235) in Hanahan are married. The highest percentage of unmarried women with births falls into 35 to 50 years age bracket with 31.1% of them unmarried at the time of birth, while the lowest percentage of unmarried women with births belong to 20 to 34 years age bracket with 28.7% of them unmarried.
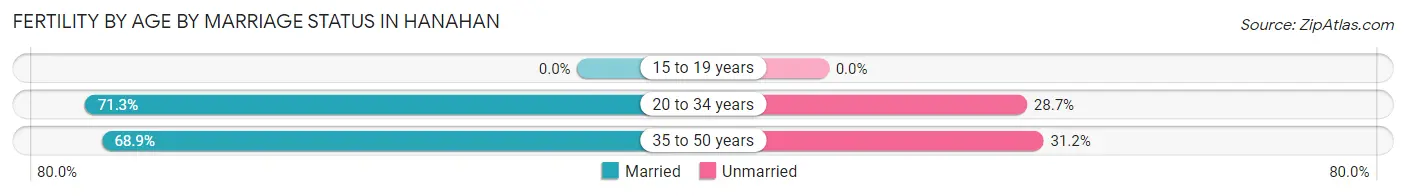
| Age Bracket | Married | Unmarried |
| 15 to 19 years | 0 (0.0%) | 0 (0.0%) |
| 20 to 34 years | 124 (71.3%) | 50 (28.7%) |
| 35 to 50 years | 42 (68.9%) | 19 (31.1%) |
| Total | 166 (70.6%) | 69 (29.4%) |
Fertility by Education in Hanahan
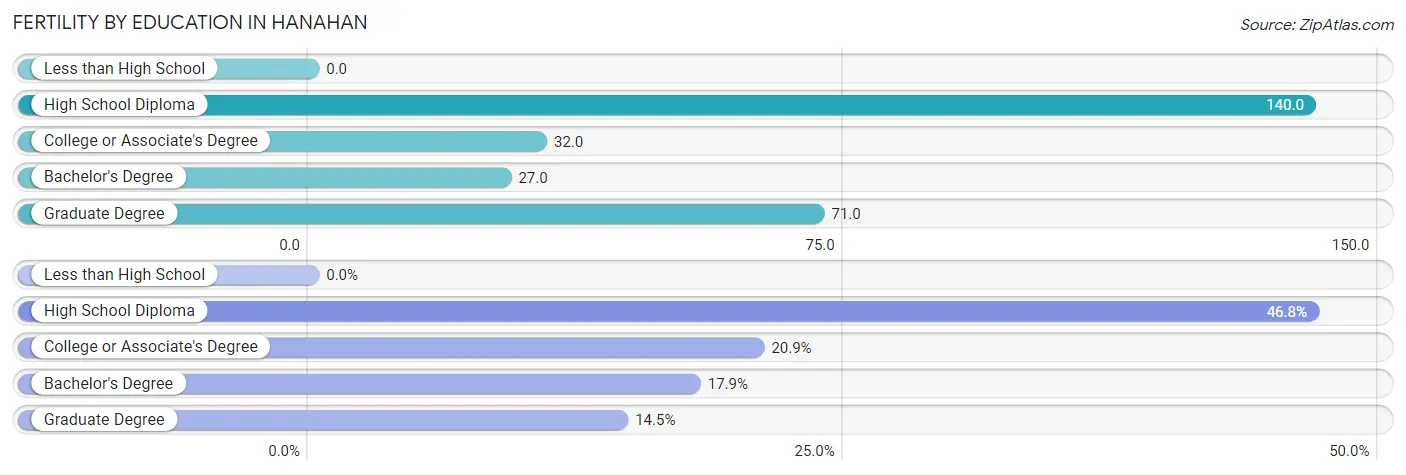
| Educational Attainment | Women with Births | Births / 1,000 Women |
| Less than High School | 0 (0.0%) | 0.0 |
| High School Diploma | 110 (46.8%) | 140.0 |
| College or Associate's Degree | 49 (20.8%) | 32.0 |
| Bachelor's Degree | 42 (17.9%) | 27.0 |
| Graduate Degree | 34 (14.5%) | 71.0 |
| Total | 235 (100.0%) | 48.0 |
Fertility by Education by Marriage Status in Hanahan
29.4% of women with births in Hanahan are unmarried. Women with the educational attainment of bachelor's degree are most likely to be married with 100.0% of them married at childbirth, while women with the educational attainment of graduate degree are least likely to be married with 55.9% of them unmarried at childbirth.
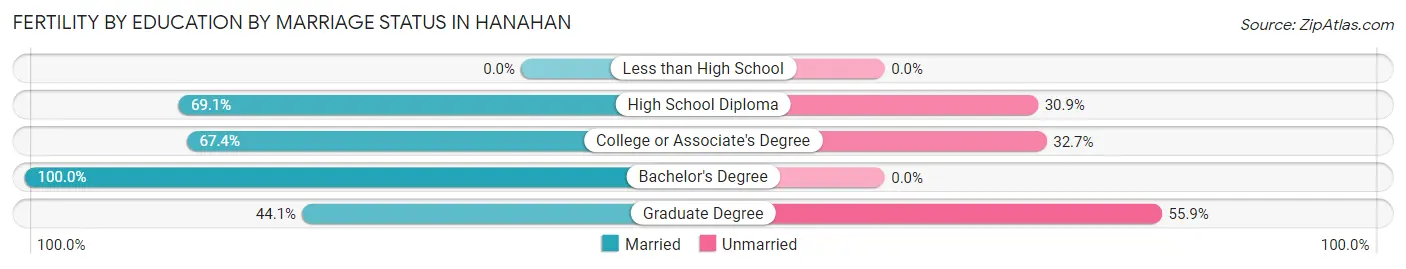
| Educational Attainment | Married | Unmarried |
| Less than High School | 0 (0.0%) | 0 (0.0%) |
| High School Diploma | 76 (69.1%) | 34 (30.9%) |
| College or Associate's Degree | 33 (67.3%) | 16 (32.7%) |
| Bachelor's Degree | 42 (100.0%) | 0 (0.0%) |
| Graduate Degree | 15 (44.1%) | 19 (55.9%) |
| Total | 166 (70.6%) | 69 (29.4%) |
Employment Characteristics in Hanahan
Employment by Class of Employer in Hanahan
Among the 10,325 employed individuals in Hanahan, private company employees (6,598 | 63.9%), federal government employees (1,218 | 11.8%), and local government employees (626 | 6.1%) make up the most common classes of employment.
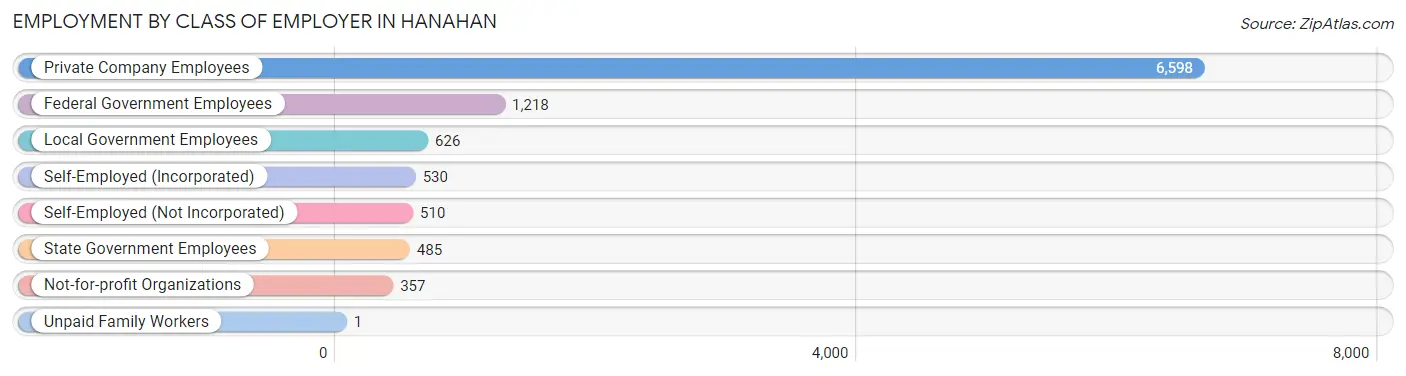
| Employer Class | # Employees | % Employees |
| Private Company Employees | 6,598 | 63.9% |
| Self-Employed (Incorporated) | 530 | 5.1% |
| Self-Employed (Not Incorporated) | 510 | 4.9% |
| Not-for-profit Organizations | 357 | 3.5% |
| Local Government Employees | 626 | 6.1% |
| State Government Employees | 485 | 4.7% |
| Federal Government Employees | 1,218 | 11.8% |
| Unpaid Family Workers | 1 | 0.0% |
| Total | 10,325 | 100.0% |
Employment Status by Age in Hanahan
According to the labor force statistics for Hanahan, out of the total population over 16 years of age (15,647), 68.3% or 10,687 individuals are in the labor force, with 2.1% or 224 of them unemployed. The age group with the highest labor force participation rate is 35 to 44 years, with 90.9% or 2,710 individuals in the labor force. Within the labor force, the 16 to 19 years age range has the highest percentage of unemployed individuals, with 10.7% or 32 of them being unemployed.
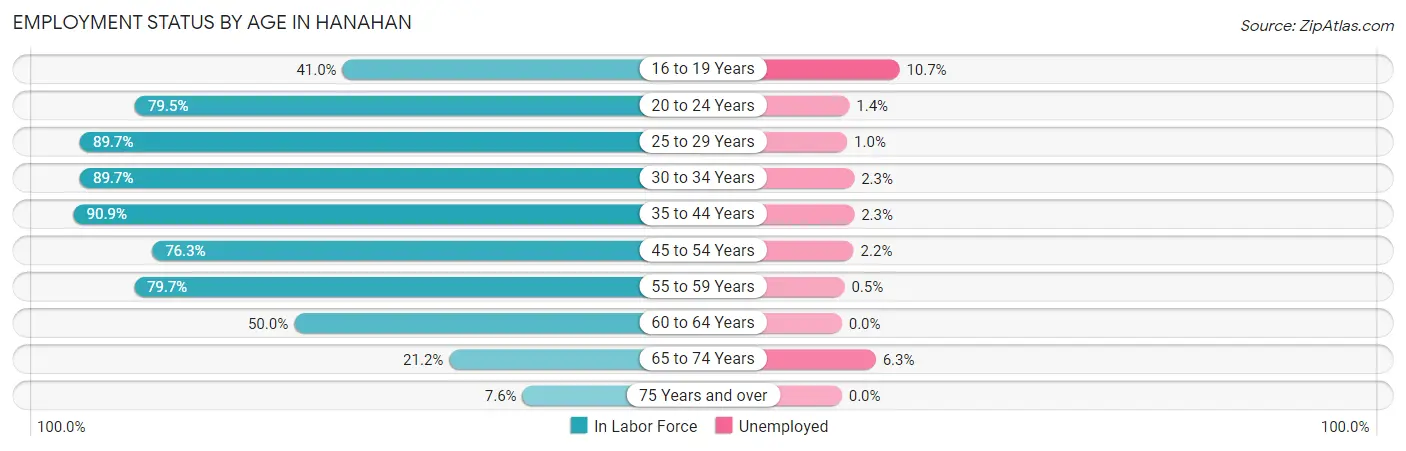
| Age Bracket | In Labor Force | Unemployed |
| 16 to 19 Years | 299 (41.0%) | 32 (10.7%) |
| 20 to 24 Years | 1,141 (79.5%) | 16 (1.4%) |
| 25 to 29 Years | 1,319 (89.7%) | 13 (1.0%) |
| 30 to 34 Years | 1,471 (89.7%) | 34 (2.3%) |
| 35 to 44 Years | 2,710 (90.9%) | 62 (2.3%) |
| 45 to 54 Years | 1,916 (76.3%) | 42 (2.2%) |
| 55 to 59 Years | 870 (79.7%) | 4 (0.5%) |
| 60 to 64 Years | 596 (50.0%) | 0 (0.0%) |
| 65 to 74 Years | 256 (21.2%) | 16 (6.3%) |
| 75 Years and over | 106 (7.6%) | 0 (0.0%) |
| Total | 10,687 (68.3%) | 224 (2.1%) |
Employment Status by Educational Attainment in Hanahan
According to labor force statistics for Hanahan, 81.6% of individuals (8,882) out of the total population between 25 and 64 years of age (10,885) are in the labor force, with 1.8% or 160 of them being unemployed. The group with the highest labor force participation rate are those with the educational attainment of bachelor's degree or higher, with 86.7% or 3,917 individuals in the labor force. Within the labor force, individuals with bachelor's degree or higher education have the highest percentage of unemployment, with 2.9% or 114 of them being unemployed.
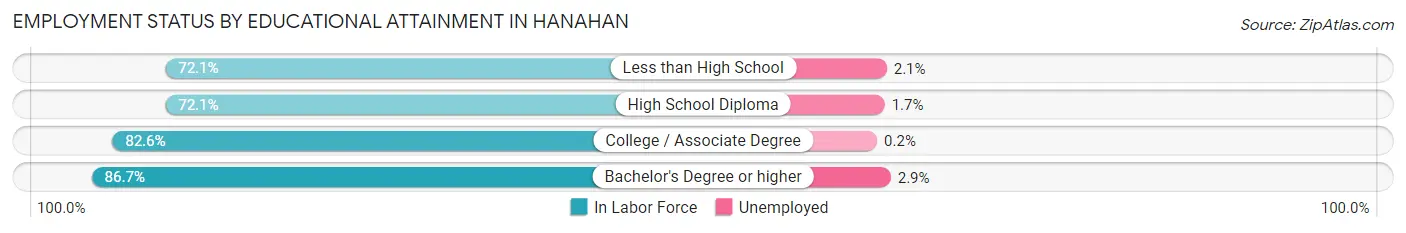
| Educational Attainment | In Labor Force | Unemployed |
| Less than High School | 564 (72.1%) | 16 (2.1%) |
| High School Diploma | 1,459 (72.1%) | 34 (1.7%) |
| College / Associate Degree | 2,941 (82.6%) | 7 (0.2%) |
| Bachelor's Degree or higher | 3,917 (86.7%) | 131 (2.9%) |
| Total | 8,882 (81.6%) | 196 (1.8%) |
Employment Occupations by Sex in Hanahan
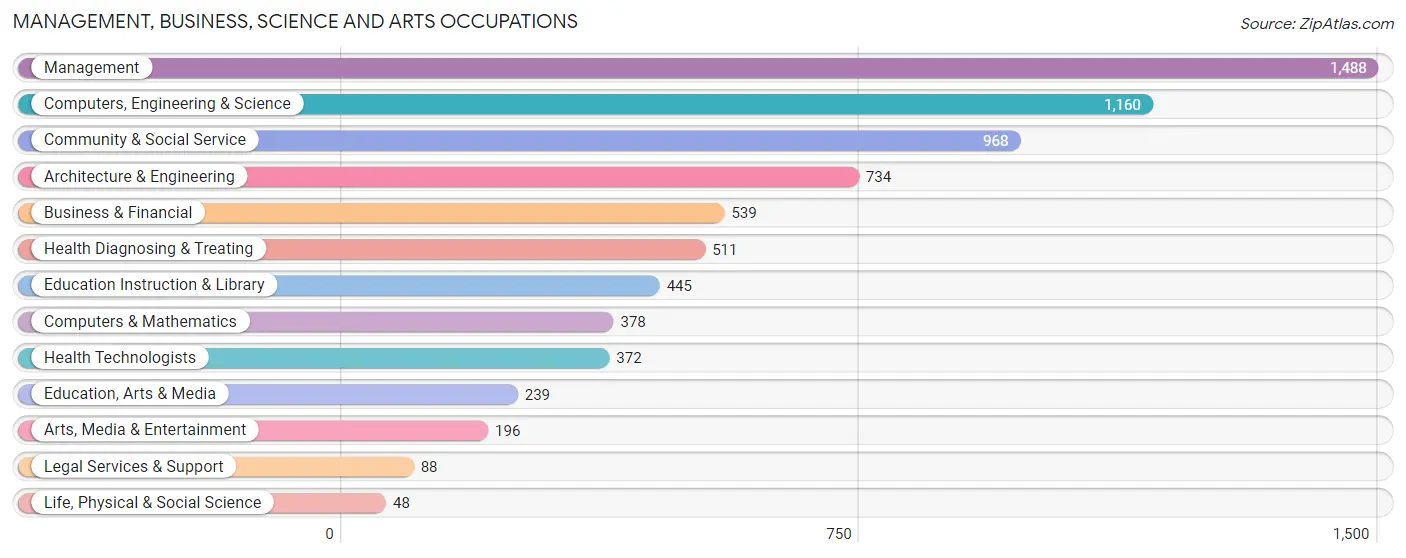
Management, Business, Science and Arts Occupations
The most common Management, Business, Science and Arts occupations in Hanahan are Management (1,488 | 14.7%), Computers, Engineering & Science (1,160 | 11.4%), Community & Social Service (968 | 9.5%), Architecture & Engineering (734 | 7.2%), and Business & Financial (539 | 5.3%).
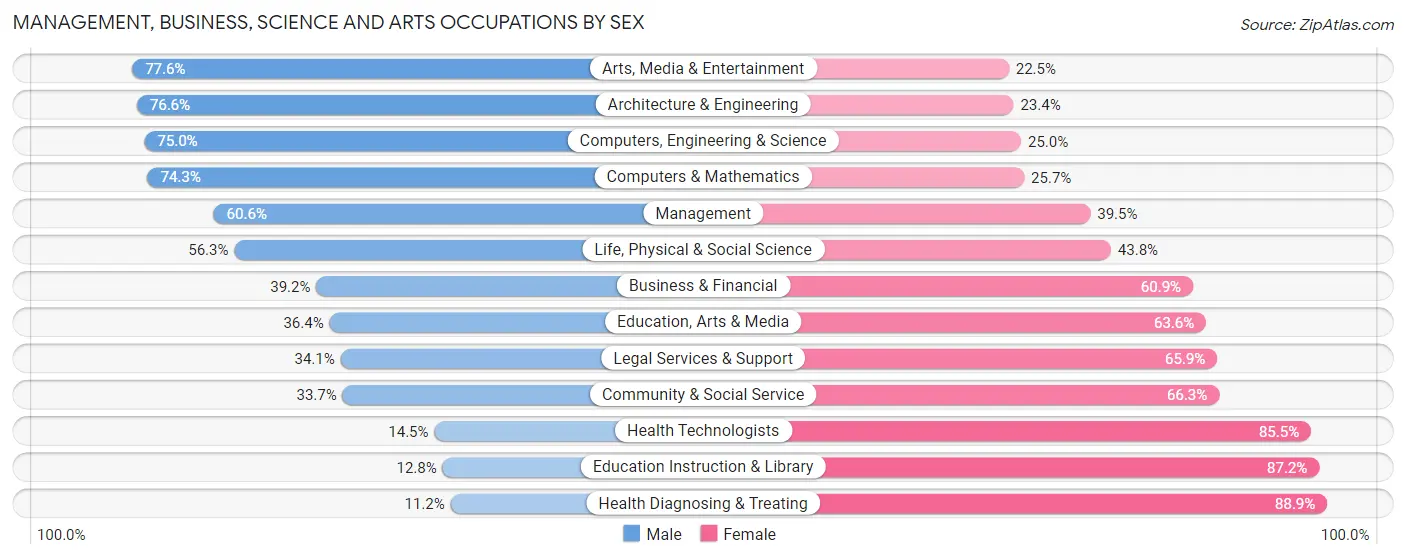
Management, Business, Science and Arts Occupations by Sex
Within the Management, Business, Science and Arts occupations in Hanahan, the most male-oriented occupations are Arts, Media & Entertainment (77.5%), Architecture & Engineering (76.6%), and Computers, Engineering & Science (75.0%), while the most female-oriented occupations are Health Diagnosing & Treating (88.8%), Education Instruction & Library (87.2%), and Health Technologists (85.5%).
| Occupation | Male | Female |
| Management | 901 (60.6%) | 587 (39.5%) |
| Business & Financial | 211 (39.2%) | 328 (60.9%) |
| Computers, Engineering & Science | 870 (75.0%) | 290 (25.0%) |
| Computers & Mathematics | 281 (74.3%) | 97 (25.7%) |
| Architecture & Engineering | 562 (76.6%) | 172 (23.4%) |
| Life, Physical & Social Science | 27 (56.2%) | 21 (43.8%) |
| Community & Social Service | 326 (33.7%) | 642 (66.3%) |
| Education, Arts & Media | 87 (36.4%) | 152 (63.6%) |
| Legal Services & Support | 30 (34.1%) | 58 (65.9%) |
| Education Instruction & Library | 57 (12.8%) | 388 (87.2%) |
| Arts, Media & Entertainment | 152 (77.5%) | 44 (22.5%) |
| Health Diagnosing & Treating | 57 (11.2%) | 454 (88.8%) |
| Health Technologists | 54 (14.5%) | 318 (85.5%) |
| Total (Category) | 2,365 (50.7%) | 2,301 (49.3%) |
| Total (Overall) | 5,474 (53.9%) | 4,678 (46.1%) |
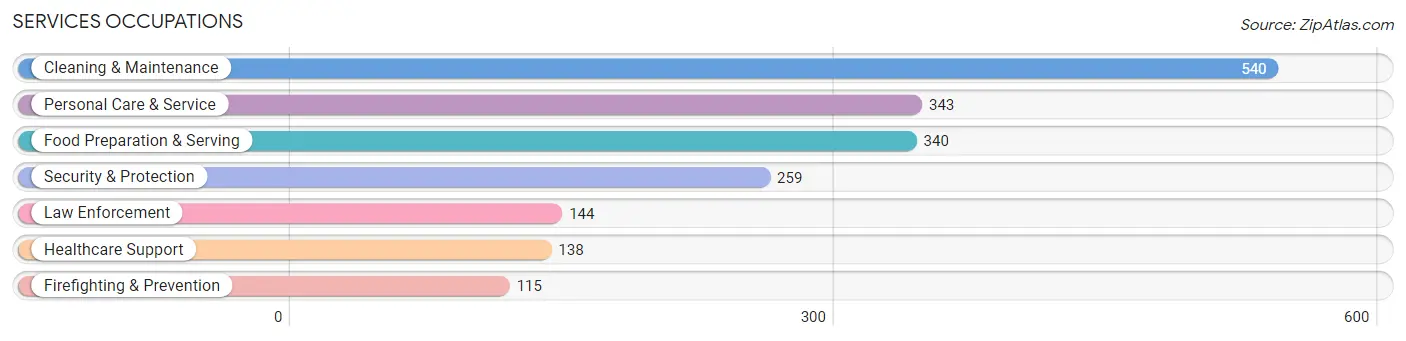
Services Occupations
The most common Services occupations in Hanahan are Cleaning & Maintenance (540 | 5.3%), Personal Care & Service (343 | 3.4%), Food Preparation & Serving (340 | 3.4%), Security & Protection (259 | 2.5%), and Law Enforcement (144 | 1.4%).
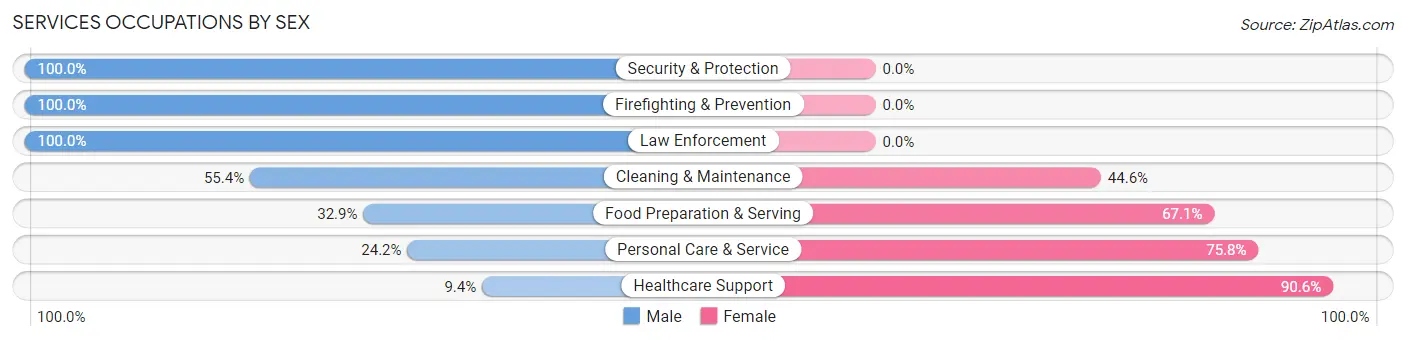
Services Occupations by Sex
Within the Services occupations in Hanahan, the most male-oriented occupations are Security & Protection (100.0%), Firefighting & Prevention (100.0%), and Law Enforcement (100.0%), while the most female-oriented occupations are Healthcare Support (90.6%), Personal Care & Service (75.8%), and Food Preparation & Serving (67.1%).
| Occupation | Male | Female |
| Healthcare Support | 13 (9.4%) | 125 (90.6%) |
| Security & Protection | 259 (100.0%) | 0 (0.0%) |
| Firefighting & Prevention | 115 (100.0%) | 0 (0.0%) |
| Law Enforcement | 144 (100.0%) | 0 (0.0%) |
| Food Preparation & Serving | 112 (32.9%) | 228 (67.1%) |
| Cleaning & Maintenance | 299 (55.4%) | 241 (44.6%) |
| Personal Care & Service | 83 (24.2%) | 260 (75.8%) |
| Total (Category) | 766 (47.3%) | 854 (52.7%) |
| Total (Overall) | 5,474 (53.9%) | 4,678 (46.1%) |
Sales and Office Occupations
The most common Sales and Office occupations in Hanahan are Office & Administration (966 | 9.5%), and Sales & Related (839 | 8.3%).
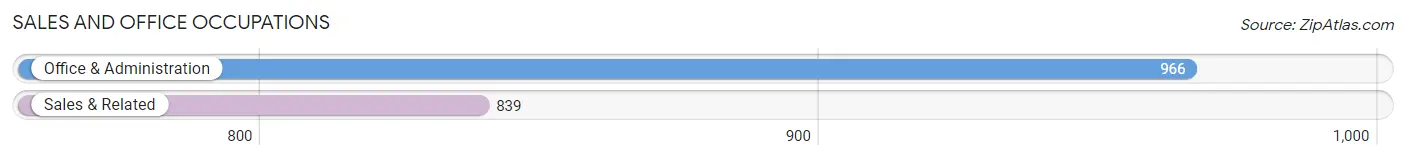
Sales and Office Occupations by Sex
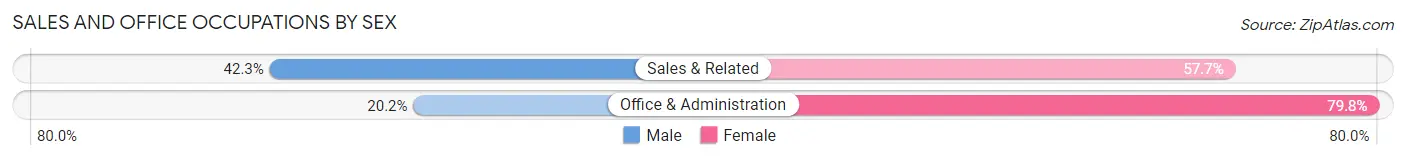
| Occupation | Male | Female |
| Sales & Related | 355 (42.3%) | 484 (57.7%) |
| Office & Administration | 195 (20.2%) | 771 (79.8%) |
| Total (Category) | 550 (30.5%) | 1,255 (69.5%) |
| Total (Overall) | 5,474 (53.9%) | 4,678 (46.1%) |
Natural Resources, Construction and Maintenance Occupations
The most common Natural Resources, Construction and Maintenance occupations in Hanahan are Construction & Extraction (650 | 6.4%), and Installation, Maintenance & Repair (293 | 2.9%).
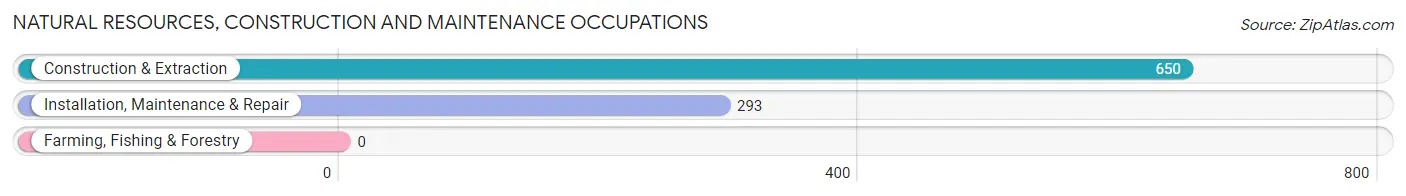
Natural Resources, Construction and Maintenance Occupations by Sex
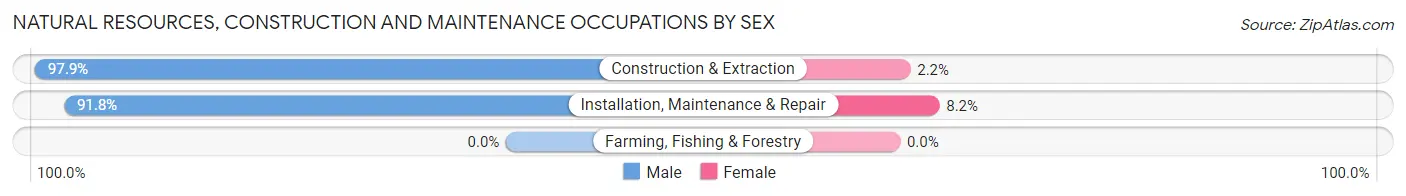
| Occupation | Male | Female |
| Farming, Fishing & Forestry | 0 (0.0%) | 0 (0.0%) |
| Construction & Extraction | 636 (97.9%) | 14 (2.1%) |
| Installation, Maintenance & Repair | 269 (91.8%) | 24 (8.2%) |
| Total (Category) | 905 (96.0%) | 38 (4.0%) |
| Total (Overall) | 5,474 (53.9%) | 4,678 (46.1%) |
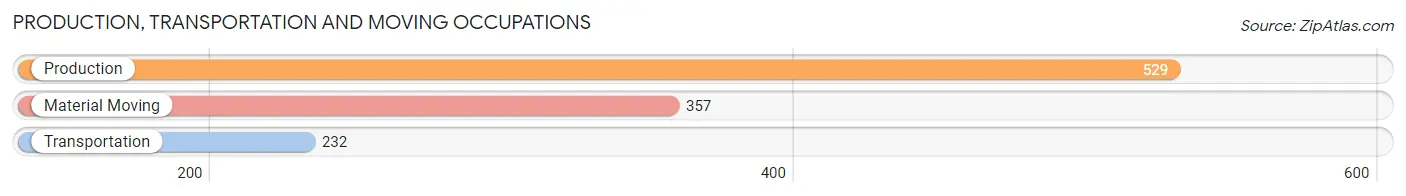
Production, Transportation and Moving Occupations
The most common Production, Transportation and Moving occupations in Hanahan are Production (529 | 5.2%), Material Moving (357 | 3.5%), and Transportation (232 | 2.3%).
Production, Transportation and Moving Occupations by Sex
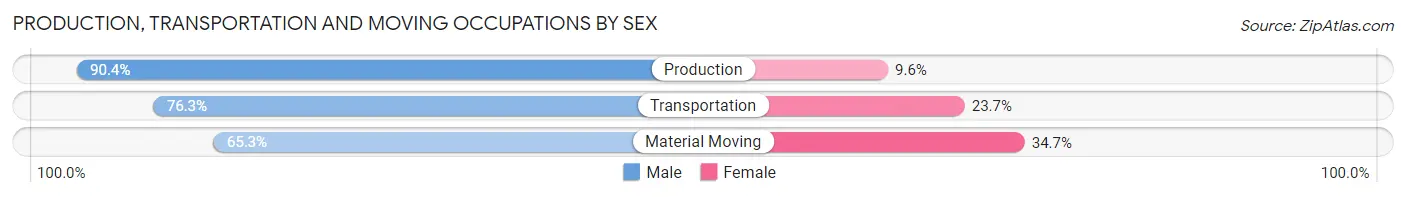
| Occupation | Male | Female |
| Production | 478 (90.4%) | 51 (9.6%) |
| Transportation | 177 (76.3%) | 55 (23.7%) |
| Material Moving | 233 (65.3%) | 124 (34.7%) |
| Total (Category) | 888 (79.4%) | 230 (20.6%) |
| Total (Overall) | 5,474 (53.9%) | 4,678 (46.1%) |
Employment Industries by Sex in Hanahan
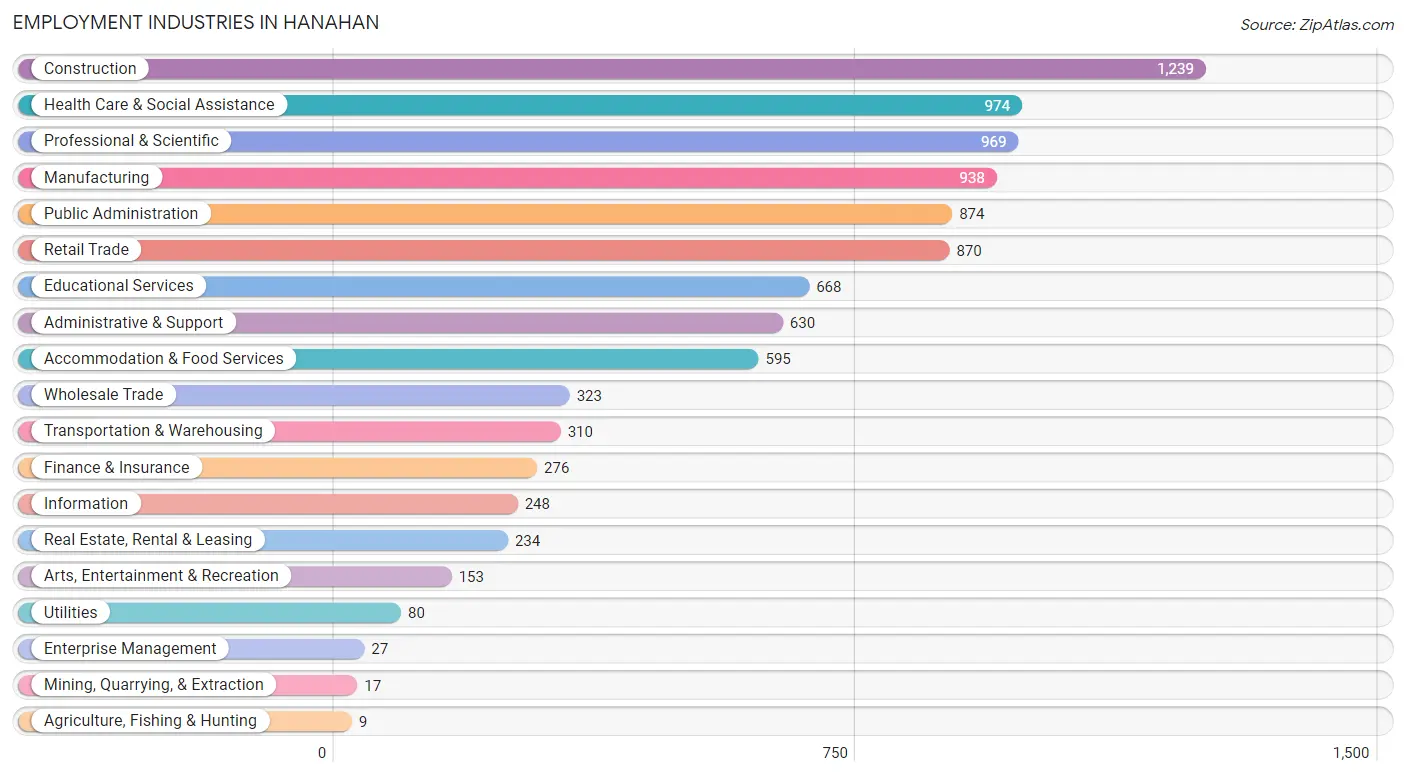
Employment Industries in Hanahan
The major employment industries in Hanahan include Construction (1,239 | 12.2%), Health Care & Social Assistance (974 | 9.6%), Professional & Scientific (969 | 9.5%), Manufacturing (938 | 9.2%), and Public Administration (874 | 8.6%).
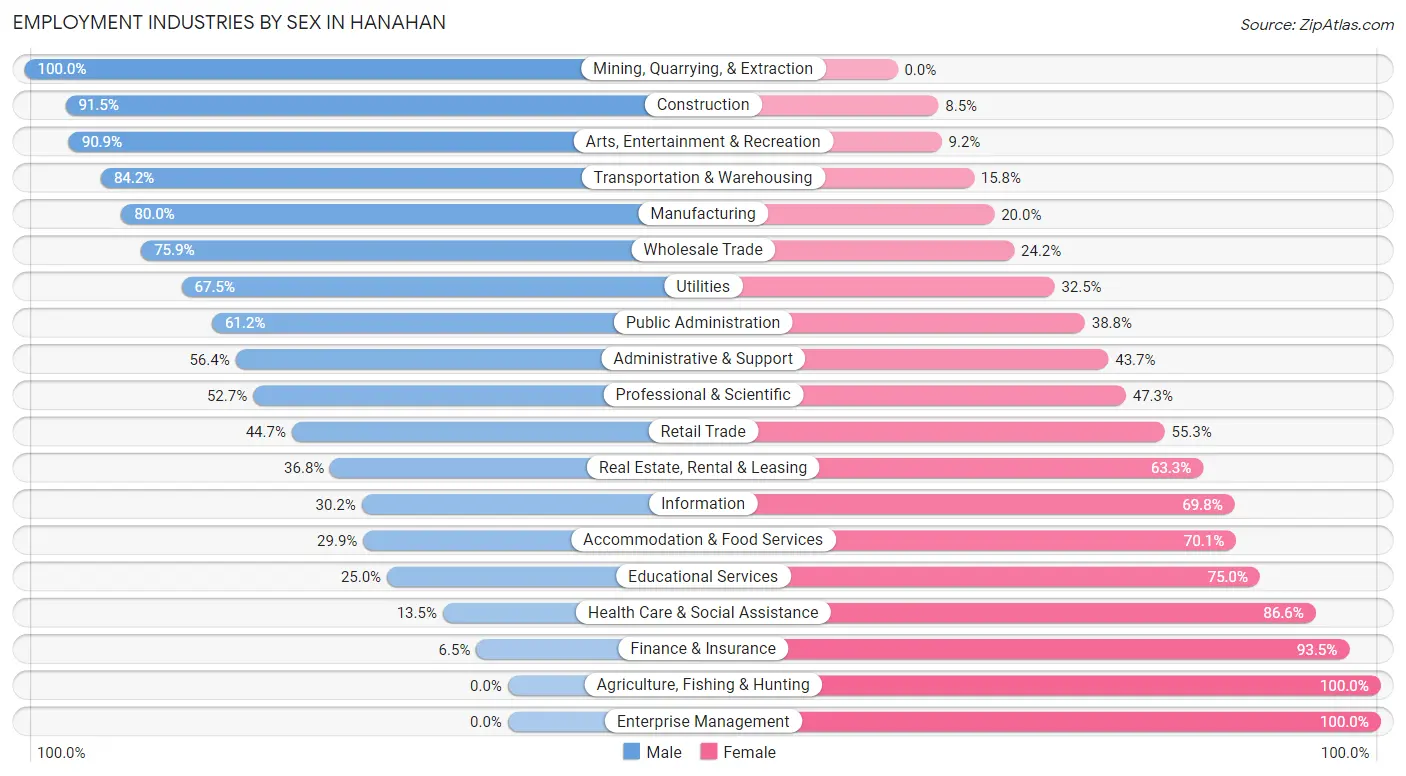
Employment Industries by Sex in Hanahan
The Hanahan industries that see more men than women are Mining, Quarrying, & Extraction (100.0%), Construction (91.5%), and Arts, Entertainment & Recreation (90.8%), whereas the industries that tend to have a higher number of women are Agriculture, Fishing & Hunting (100.0%), Enterprise Management (100.0%), and Finance & Insurance (93.5%).
| Industry | Male | Female |
| Agriculture, Fishing & Hunting | 0 (0.0%) | 9 (100.0%) |
| Mining, Quarrying, & Extraction | 17 (100.0%) | 0 (0.0%) |
| Construction | 1,134 (91.5%) | 105 (8.5%) |
| Manufacturing | 750 (80.0%) | 188 (20.0%) |
| Wholesale Trade | 245 (75.8%) | 78 (24.1%) |
| Retail Trade | 389 (44.7%) | 481 (55.3%) |
| Transportation & Warehousing | 261 (84.2%) | 49 (15.8%) |
| Utilities | 54 (67.5%) | 26 (32.5%) |
| Information | 75 (30.2%) | 173 (69.8%) |
| Finance & Insurance | 18 (6.5%) | 258 (93.5%) |
| Real Estate, Rental & Leasing | 86 (36.7%) | 148 (63.2%) |
| Professional & Scientific | 511 (52.7%) | 458 (47.3%) |
| Enterprise Management | 0 (0.0%) | 27 (100.0%) |
| Administrative & Support | 355 (56.4%) | 275 (43.6%) |
| Educational Services | 167 (25.0%) | 501 (75.0%) |
| Health Care & Social Assistance | 131 (13.5%) | 843 (86.6%) |
| Arts, Entertainment & Recreation | 139 (90.8%) | 14 (9.1%) |
| Accommodation & Food Services | 178 (29.9%) | 417 (70.1%) |
| Public Administration | 535 (61.2%) | 339 (38.8%) |
| Total | 5,474 (53.9%) | 4,678 (46.1%) |
Education in Hanahan
School Enrollment in Hanahan
The most common levels of schooling among the 5,404 students in Hanahan are middle school (1,142 | 21.1%), high school (1,048 | 19.4%), and elementary school (998 | 18.5%).
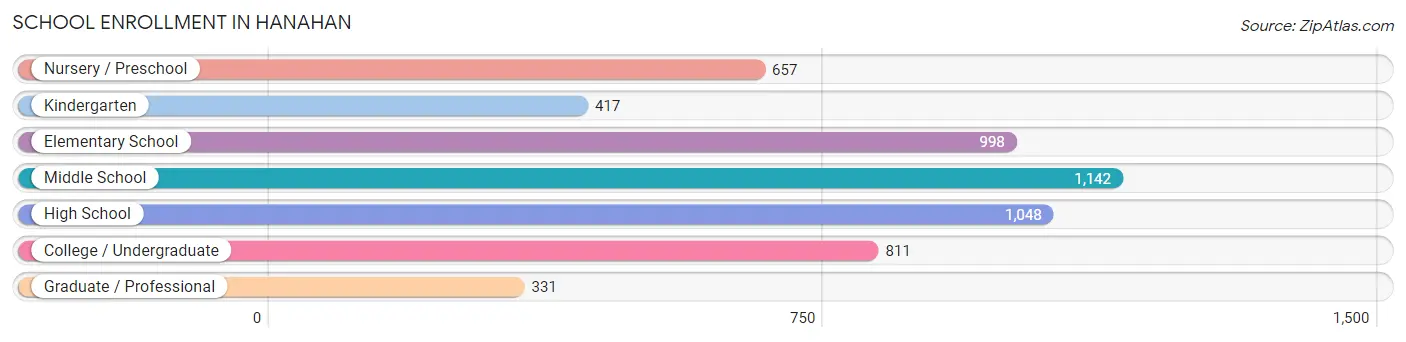
| School Level | # Students | % Students |
| Nursery / Preschool | 657 | 12.2% |
| Kindergarten | 417 | 7.7% |
| Elementary School | 998 | 18.5% |
| Middle School | 1,142 | 21.1% |
| High School | 1,048 | 19.4% |
| College / Undergraduate | 811 | 15.0% |
| Graduate / Professional | 331 | 6.1% |
| Total | 5,404 | 100.0% |
School Enrollment by Age by Funding Source in Hanahan
Out of a total of 5,404 students who are enrolled in schools in Hanahan, 1,200 (22.2%) attend a private institution, while the remaining 4,204 (77.8%) are enrolled in public schools. The age group of 3 to 4 year olds has the highest likelihood of being enrolled in private schools, with 347 (62.0% in the age bracket) enrolled. Conversely, the age group of 15 to 17 year olds has the lowest likelihood of being enrolled in a private school, with 733 (97.1% in the age bracket) attending a public institution.
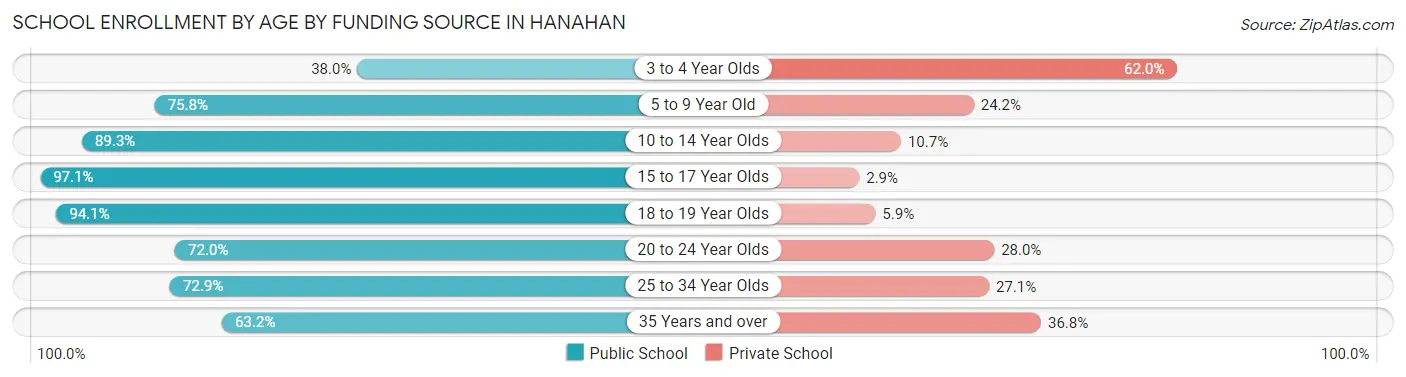
| Age Bracket | Public School | Private School |
| 3 to 4 Year Olds | 213 (38.0%) | 347 (62.0%) |
| 5 to 9 Year Old | 1,028 (75.8%) | 329 (24.2%) |
| 10 to 14 Year Olds | 1,304 (89.3%) | 156 (10.7%) |
| 15 to 17 Year Olds | 733 (97.1%) | 22 (2.9%) |
| 18 to 19 Year Olds | 175 (94.1%) | 11 (5.9%) |
| 20 to 24 Year Olds | 231 (72.0%) | 90 (28.0%) |
| 25 to 34 Year Olds | 296 (72.9%) | 110 (27.1%) |
| 35 Years and over | 227 (63.2%) | 132 (36.8%) |
| Total | 4,204 (77.8%) | 1,200 (22.2%) |
Educational Attainment by Field of Study in Hanahan
Business (1,292 | 24.5%), engineering (582 | 11.1%), science & technology (562 | 10.7%), education (536 | 10.2%), and bio, nature & agricultural (334 | 6.3%) are the most common fields of study among 5,268 individuals in Hanahan who have obtained a bachelor's degree or higher.
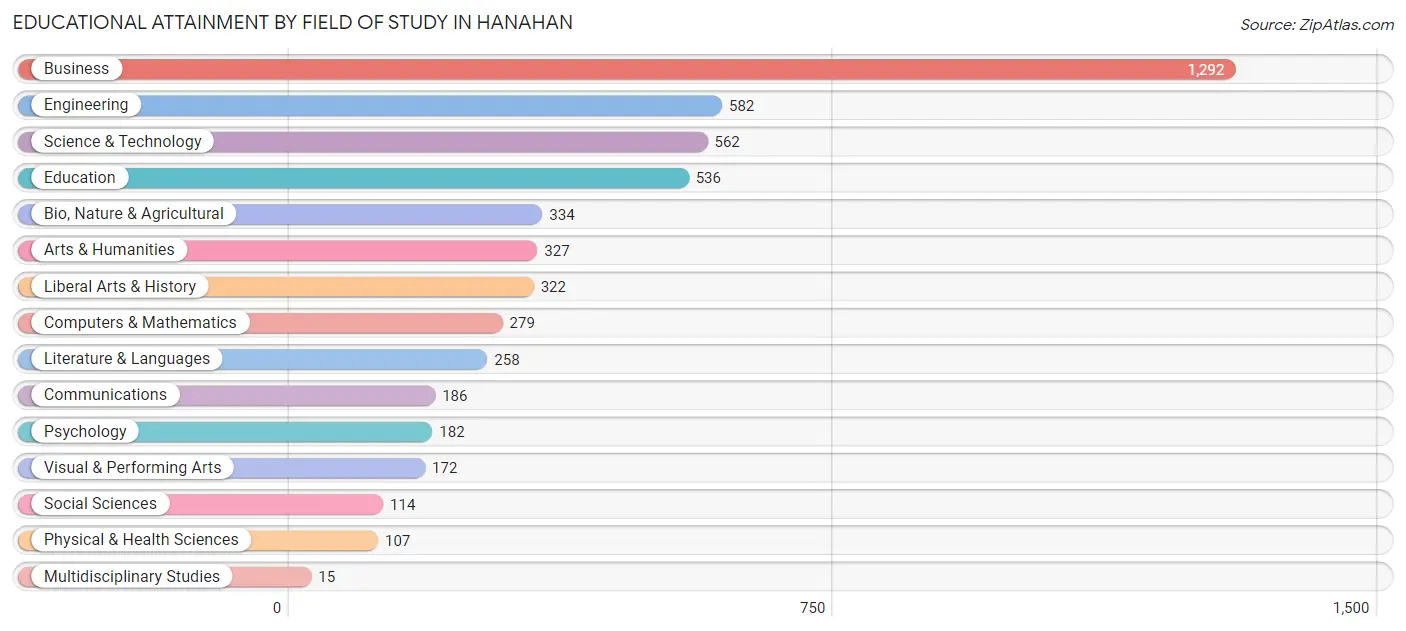
| Field of Study | # Graduates | % Graduates |
| Computers & Mathematics | 279 | 5.3% |
| Bio, Nature & Agricultural | 334 | 6.3% |
| Physical & Health Sciences | 107 | 2.0% |
| Psychology | 182 | 3.5% |
| Social Sciences | 114 | 2.2% |
| Engineering | 582 | 11.1% |
| Multidisciplinary Studies | 15 | 0.3% |
| Science & Technology | 562 | 10.7% |
| Business | 1,292 | 24.5% |
| Education | 536 | 10.2% |
| Literature & Languages | 258 | 4.9% |
| Liberal Arts & History | 322 | 6.1% |
| Visual & Performing Arts | 172 | 3.3% |
| Communications | 186 | 3.5% |
| Arts & Humanities | 327 | 6.2% |
| Total | 5,268 | 100.0% |
Transportation & Commute in Hanahan
Vehicle Availability by Sex in Hanahan
The most prevalent vehicle ownership categories in Hanahan are males with 2 vehicles (2,644, accounting for 46.3%) and females with 2 vehicles (2,093, making up 57.4%).
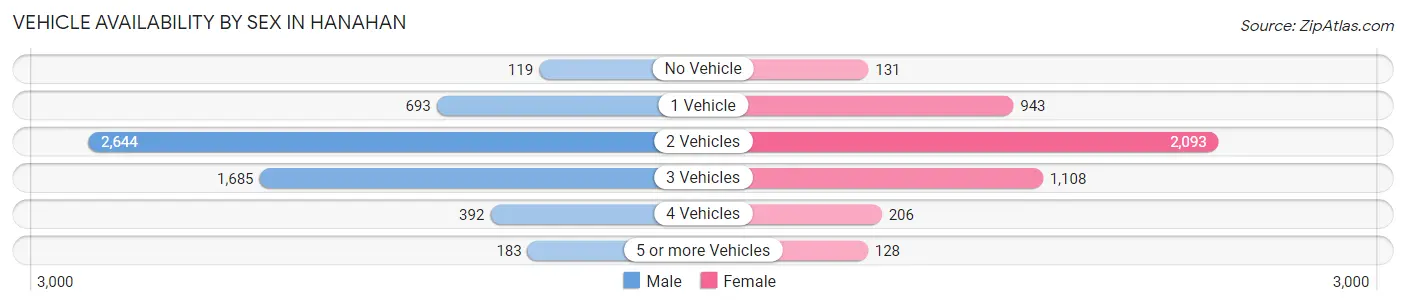
| Vehicles Available | Male | Female |
| No Vehicle | 119 (2.1%) | 131 (2.8%) |
| 1 Vehicle | 693 (12.1%) | 943 (20.5%) |
| 2 Vehicles | 2,644 (46.3%) | 2,093 (45.4%) |
| 3 Vehicles | 1,685 (29.5%) | 1,108 (24.0%) |
| 4 Vehicles | 392 (6.9%) | 206 (4.5%) |
| 5 or more Vehicles | 183 (3.2%) | 128 (2.8%) |
| Total | 5,716 (100.0%) | 4,609 (100.0%) |
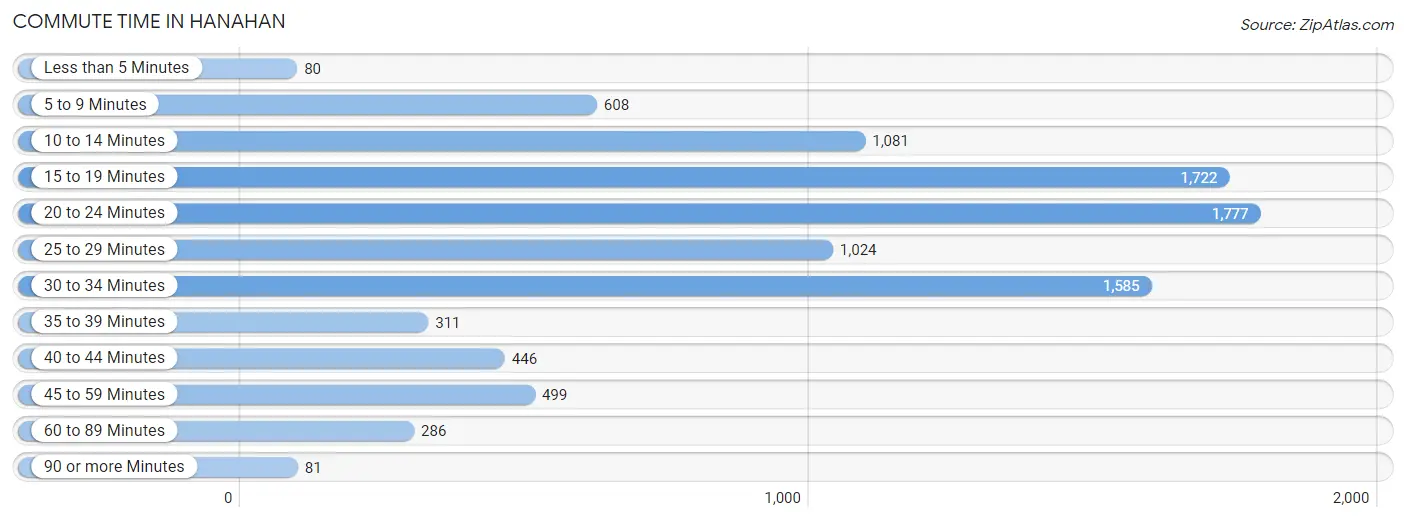
Commute Time in Hanahan
The most frequently occuring commute durations in Hanahan are 20 to 24 minutes (1,777 commuters, 18.7%), 15 to 19 minutes (1,722 commuters, 18.1%), and 30 to 34 minutes (1,585 commuters, 16.7%).
| Commute Time | # Commuters | % Commuters |
| Less than 5 Minutes | 80 | 0.8% |
| 5 to 9 Minutes | 608 | 6.4% |
| 10 to 14 Minutes | 1,081 | 11.4% |
| 15 to 19 Minutes | 1,722 | 18.1% |
| 20 to 24 Minutes | 1,777 | 18.7% |
| 25 to 29 Minutes | 1,024 | 10.8% |
| 30 to 34 Minutes | 1,585 | 16.7% |
| 35 to 39 Minutes | 311 | 3.3% |
| 40 to 44 Minutes | 446 | 4.7% |
| 45 to 59 Minutes | 499 | 5.2% |
| 60 to 89 Minutes | 286 | 3.0% |
| 90 or more Minutes | 81 | 0.9% |
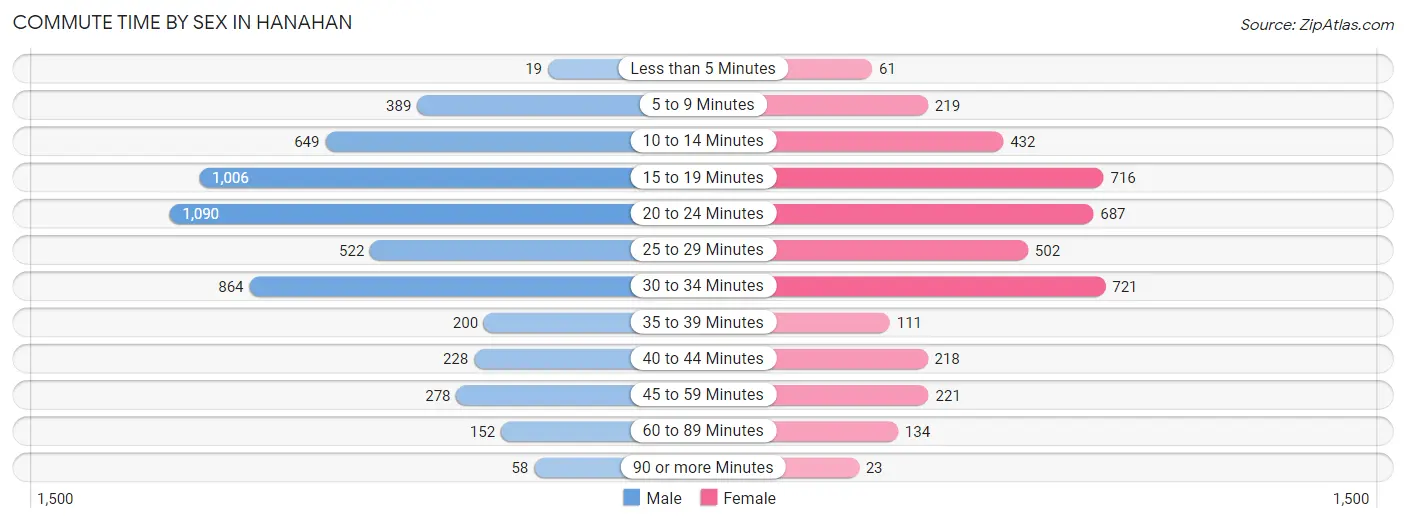
Commute Time by Sex in Hanahan
The most common commute times in Hanahan are 20 to 24 minutes (1,090 commuters, 20.0%) for males and 30 to 34 minutes (721 commuters, 17.8%) for females.
| Commute Time | Male | Female |
| Less than 5 Minutes | 19 (0.4%) | 61 (1.5%) |
| 5 to 9 Minutes | 389 (7.1%) | 219 (5.4%) |
| 10 to 14 Minutes | 649 (11.9%) | 432 (10.7%) |
| 15 to 19 Minutes | 1,006 (18.4%) | 716 (17.7%) |
| 20 to 24 Minutes | 1,090 (20.0%) | 687 (17.0%) |
| 25 to 29 Minutes | 522 (9.6%) | 502 (12.4%) |
| 30 to 34 Minutes | 864 (15.8%) | 721 (17.8%) |
| 35 to 39 Minutes | 200 (3.7%) | 111 (2.7%) |
| 40 to 44 Minutes | 228 (4.2%) | 218 (5.4%) |
| 45 to 59 Minutes | 278 (5.1%) | 221 (5.5%) |
| 60 to 89 Minutes | 152 (2.8%) | 134 (3.3%) |
| 90 or more Minutes | 58 (1.1%) | 23 (0.6%) |
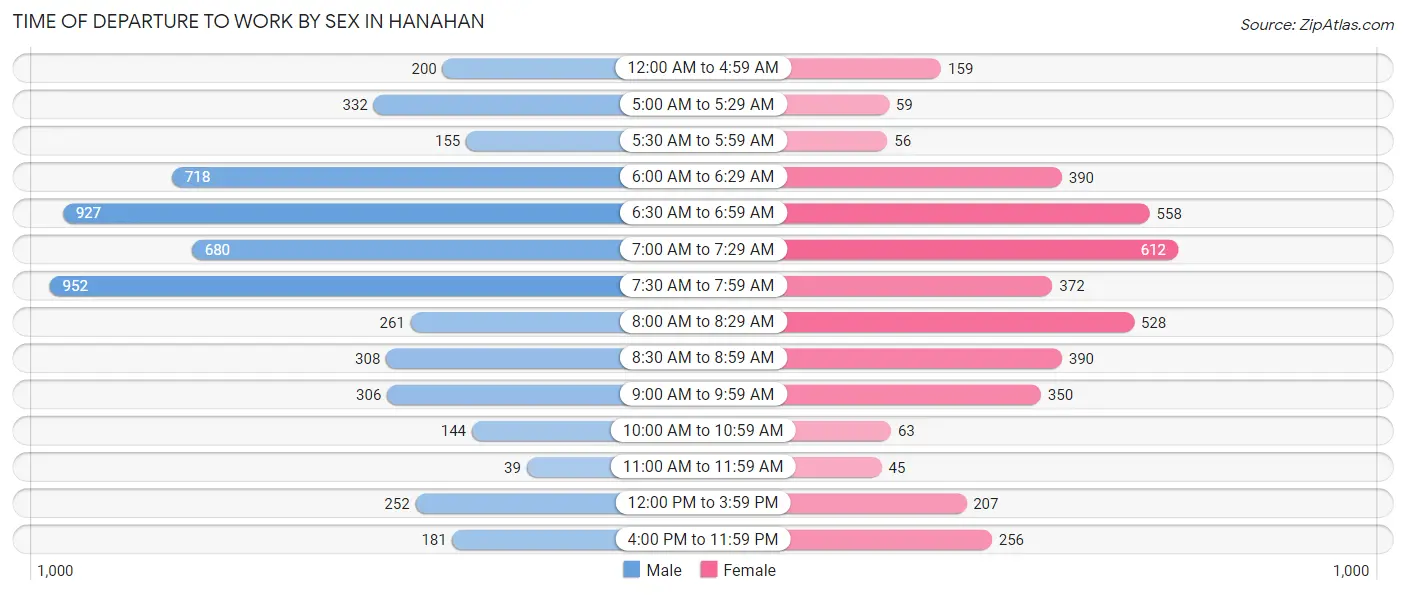
Time of Departure to Work by Sex in Hanahan
The most frequent times of departure to work in Hanahan are 7:30 AM to 7:59 AM (952, 17.4%) for males and 7:00 AM to 7:29 AM (612, 15.1%) for females.
| Time of Departure | Male | Female |
| 12:00 AM to 4:59 AM | 200 (3.7%) | 159 (3.9%) |
| 5:00 AM to 5:29 AM | 332 (6.1%) | 59 (1.5%) |
| 5:30 AM to 5:59 AM | 155 (2.8%) | 56 (1.4%) |
| 6:00 AM to 6:29 AM | 718 (13.2%) | 390 (9.6%) |
| 6:30 AM to 6:59 AM | 927 (17.0%) | 558 (13.8%) |
| 7:00 AM to 7:29 AM | 680 (12.5%) | 612 (15.1%) |
| 7:30 AM to 7:59 AM | 952 (17.4%) | 372 (9.2%) |
| 8:00 AM to 8:29 AM | 261 (4.8%) | 528 (13.1%) |
| 8:30 AM to 8:59 AM | 308 (5.7%) | 390 (9.6%) |
| 9:00 AM to 9:59 AM | 306 (5.6%) | 350 (8.6%) |
| 10:00 AM to 10:59 AM | 144 (2.6%) | 63 (1.6%) |
| 11:00 AM to 11:59 AM | 39 (0.7%) | 45 (1.1%) |
| 12:00 PM to 3:59 PM | 252 (4.6%) | 207 (5.1%) |
| 4:00 PM to 11:59 PM | 181 (3.3%) | 256 (6.3%) |
| Total | 5,455 (100.0%) | 4,045 (100.0%) |
Housing Occupancy in Hanahan
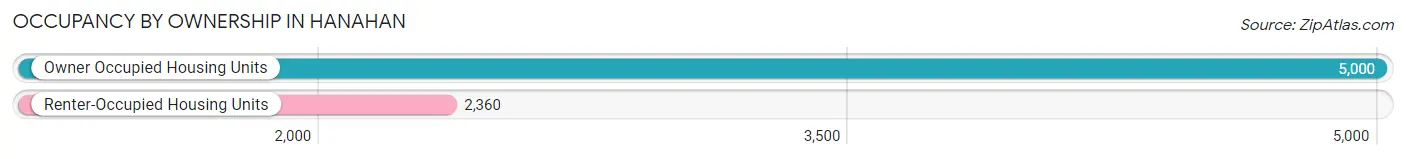
Occupancy by Ownership in Hanahan
Of the total 7,360 dwellings in Hanahan, owner-occupied units account for 5,000 (67.9%), while renter-occupied units make up 2,360 (32.1%).
| Occupancy | # Housing Units | % Housing Units |
| Owner Occupied Housing Units | 5,000 | 67.9% |
| Renter-Occupied Housing Units | 2,360 | 32.1% |
| Total Occupied Housing Units | 7,360 | 100.0% |
Occupancy by Household Size in Hanahan
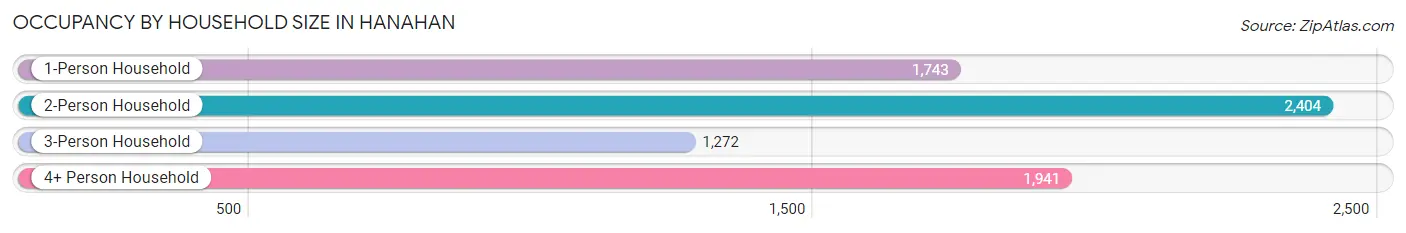
| Household Size | # Housing Units | % Housing Units |
| 1-Person Household | 1,743 | 23.7% |
| 2-Person Household | 2,404 | 32.7% |
| 3-Person Household | 1,272 | 17.3% |
| 4+ Person Household | 1,941 | 26.4% |
| Total Housing Units | 7,360 | 100.0% |
Occupancy by Ownership by Household Size in Hanahan
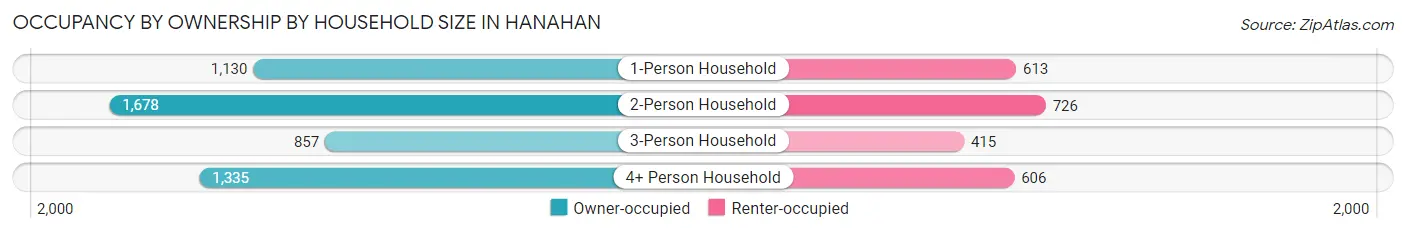
| Household Size | Owner-occupied | Renter-occupied |
| 1-Person Household | 1,130 (64.8%) | 613 (35.2%) |
| 2-Person Household | 1,678 (69.8%) | 726 (30.2%) |
| 3-Person Household | 857 (67.4%) | 415 (32.6%) |
| 4+ Person Household | 1,335 (68.8%) | 606 (31.2%) |
| Total Housing Units | 5,000 (67.9%) | 2,360 (32.1%) |
Occupancy by Educational Attainment in Hanahan
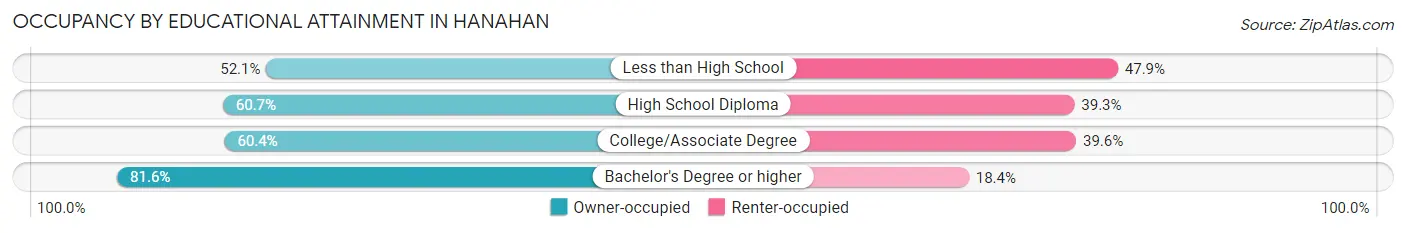
| Household Size | Owner-occupied | Renter-occupied |
| Less than High School | 225 (52.1%) | 207 (47.9%) |
| High School Diploma | 899 (60.7%) | 582 (39.3%) |
| College/Associate Degree | 1,621 (60.4%) | 1,064 (39.6%) |
| Bachelor's Degree or higher | 2,255 (81.6%) | 507 (18.4%) |
Occupancy by Age of Householder in Hanahan
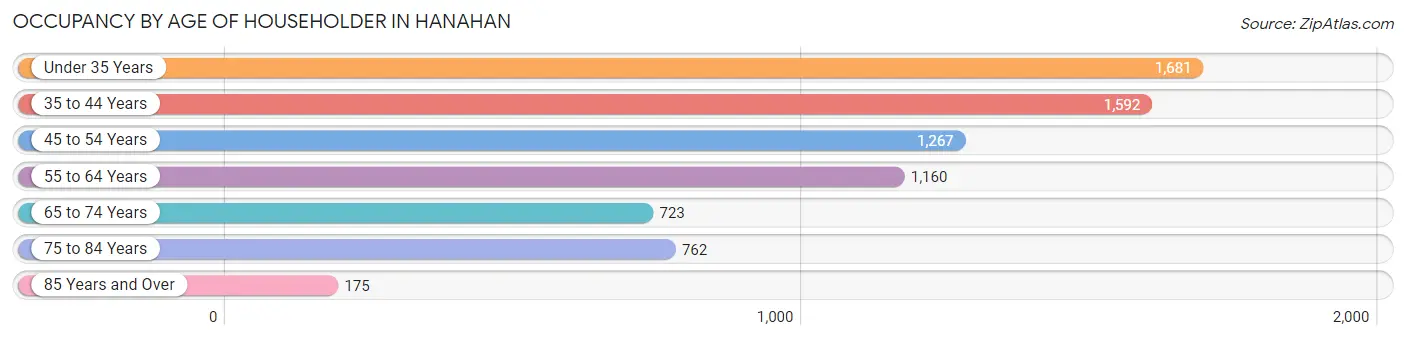
| Age Bracket | # Households | % Households |
| Under 35 Years | 1,681 | 22.8% |
| 35 to 44 Years | 1,592 | 21.6% |
| 45 to 54 Years | 1,267 | 17.2% |
| 55 to 64 Years | 1,160 | 15.8% |
| 65 to 74 Years | 723 | 9.8% |
| 75 to 84 Years | 762 | 10.3% |
| 85 Years and Over | 175 | 2.4% |
| Total | 7,360 | 100.0% |
Housing Finances in Hanahan
Median Income by Occupancy in Hanahan
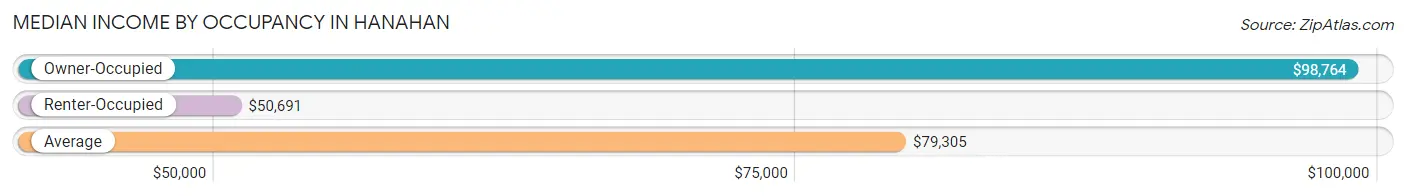
| Occupancy Type | # Households | Median Income |
| Owner-Occupied | 5,000 (67.9%) | $98,764 |
| Renter-Occupied | 2,360 (32.1%) | $50,691 |
| Average | 7,360 (100.0%) | $79,305 |
Occupancy by Householder Income Bracket in Hanahan
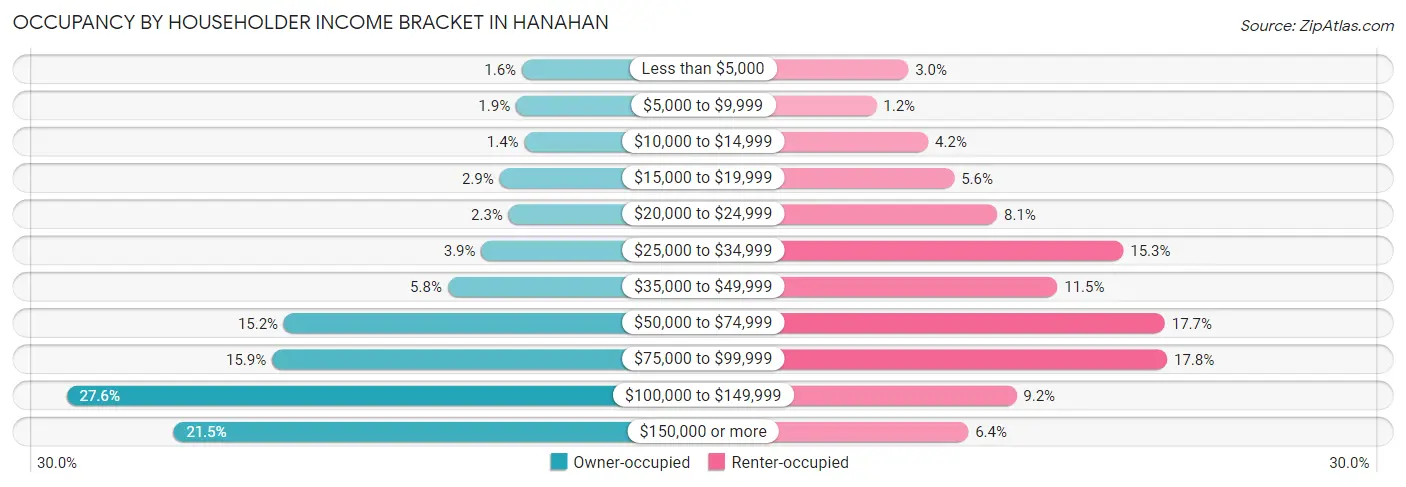
| Income Bracket | Owner-occupied | Renter-occupied |
| Less than $5,000 | 79 (1.6%) | 71 (3.0%) |
| $5,000 to $9,999 | 96 (1.9%) | 28 (1.2%) |
| $10,000 to $14,999 | 72 (1.4%) | 98 (4.2%) |
| $15,000 to $19,999 | 143 (2.9%) | 133 (5.6%) |
| $20,000 to $24,999 | 117 (2.3%) | 191 (8.1%) |
| $25,000 to $34,999 | 195 (3.9%) | 361 (15.3%) |
| $35,000 to $49,999 | 291 (5.8%) | 272 (11.5%) |
| $50,000 to $74,999 | 759 (15.2%) | 417 (17.7%) |
| $75,000 to $99,999 | 793 (15.9%) | 420 (17.8%) |
| $100,000 to $149,999 | 1,380 (27.6%) | 217 (9.2%) |
| $150,000 or more | 1,075 (21.5%) | 152 (6.4%) |
| Total | 5,000 (100.0%) | 2,360 (100.0%) |
Monthly Housing Cost Tiers in Hanahan
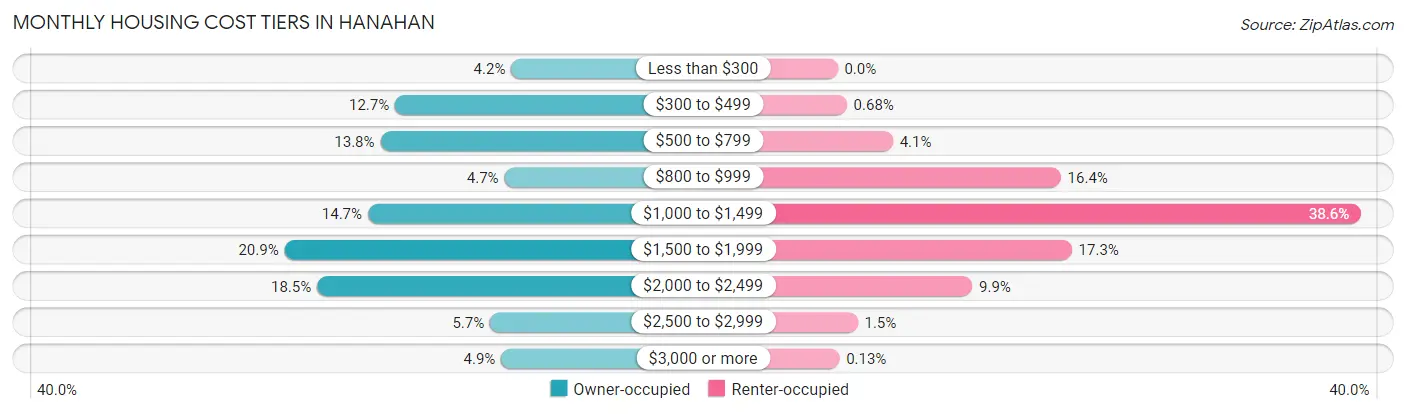
| Monthly Cost | Owner-occupied | Renter-occupied |
| Less than $300 | 208 (4.2%) | 0 (0.0%) |
| $300 to $499 | 636 (12.7%) | 16 (0.7%) |
| $500 to $799 | 690 (13.8%) | 96 (4.1%) |
| $800 to $999 | 233 (4.7%) | 388 (16.4%) |
| $1,000 to $1,499 | 736 (14.7%) | 910 (38.6%) |
| $1,500 to $1,999 | 1,043 (20.9%) | 407 (17.2%) |
| $2,000 to $2,499 | 923 (18.5%) | 234 (9.9%) |
| $2,500 to $2,999 | 286 (5.7%) | 35 (1.5%) |
| $3,000 or more | 245 (4.9%) | 3 (0.1%) |
| Total | 5,000 (100.0%) | 2,360 (100.0%) |
Physical Housing Characteristics in Hanahan
Housing Structures in Hanahan
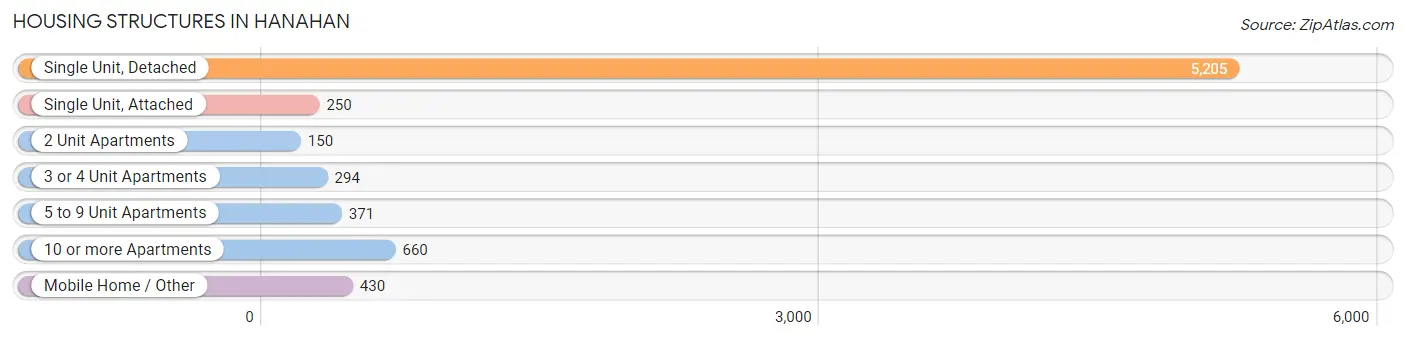
| Structure Type | # Housing Units | % Housing Units |
| Single Unit, Detached | 5,205 | 70.7% |
| Single Unit, Attached | 250 | 3.4% |
| 2 Unit Apartments | 150 | 2.0% |
| 3 or 4 Unit Apartments | 294 | 4.0% |
| 5 to 9 Unit Apartments | 371 | 5.0% |
| 10 or more Apartments | 660 | 9.0% |
| Mobile Home / Other | 430 | 5.8% |
| Total | 7,360 | 100.0% |
Housing Structures by Occupancy in Hanahan
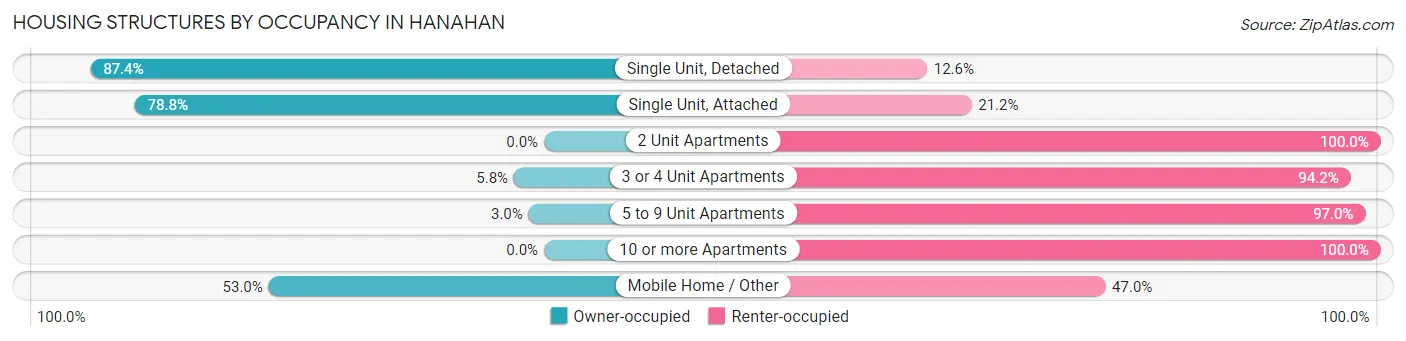
| Structure Type | Owner-occupied | Renter-occupied |
| Single Unit, Detached | 4,547 (87.4%) | 658 (12.6%) |
| Single Unit, Attached | 197 (78.8%) | 53 (21.2%) |
| 2 Unit Apartments | 0 (0.0%) | 150 (100.0%) |
| 3 or 4 Unit Apartments | 17 (5.8%) | 277 (94.2%) |
| 5 to 9 Unit Apartments | 11 (3.0%) | 360 (97.0%) |
| 10 or more Apartments | 0 (0.0%) | 660 (100.0%) |
| Mobile Home / Other | 228 (53.0%) | 202 (47.0%) |
| Total | 5,000 (67.9%) | 2,360 (32.1%) |
Housing Structures by Number of Rooms in Hanahan
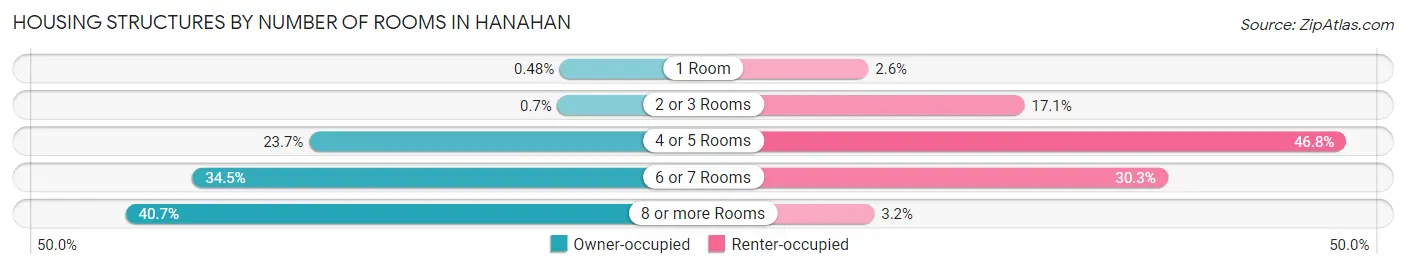
| Number of Rooms | Owner-occupied | Renter-occupied |
| 1 Room | 24 (0.5%) | 62 (2.6%) |
| 2 or 3 Rooms | 35 (0.7%) | 403 (17.1%) |
| 4 or 5 Rooms | 1,184 (23.7%) | 1,105 (46.8%) |
| 6 or 7 Rooms | 1,724 (34.5%) | 715 (30.3%) |
| 8 or more Rooms | 2,033 (40.7%) | 75 (3.2%) |
| Total | 5,000 (100.0%) | 2,360 (100.0%) |
Housing Structure by Heating Type in Hanahan
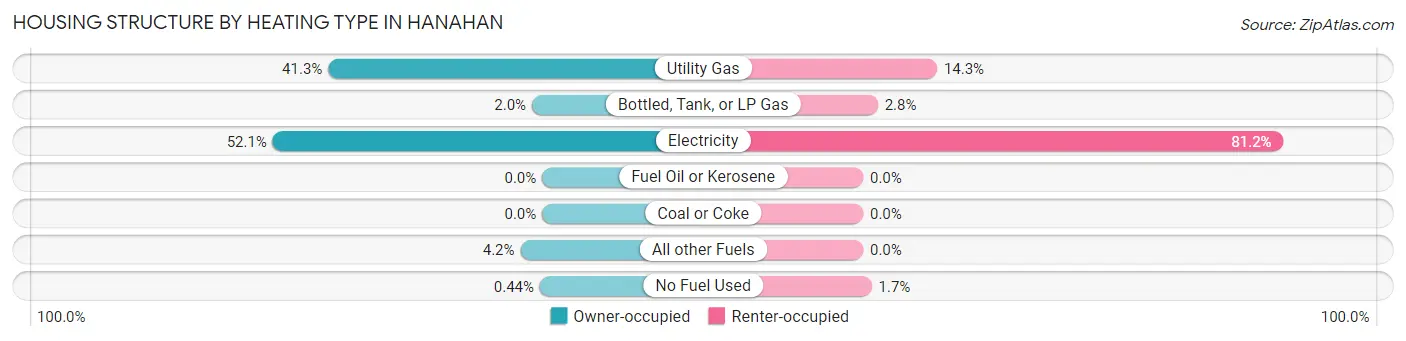
| Heating Type | Owner-occupied | Renter-occupied |
| Utility Gas | 2,067 (41.3%) | 337 (14.3%) |
| Bottled, Tank, or LP Gas | 98 (2.0%) | 67 (2.8%) |
| Electricity | 2,603 (52.1%) | 1,917 (81.2%) |
| Fuel Oil or Kerosene | 0 (0.0%) | 0 (0.0%) |
| Coal or Coke | 0 (0.0%) | 0 (0.0%) |
| All other Fuels | 210 (4.2%) | 0 (0.0%) |
| No Fuel Used | 22 (0.4%) | 39 (1.7%) |
| Total | 5,000 (100.0%) | 2,360 (100.0%) |
Household Vehicle Usage in Hanahan
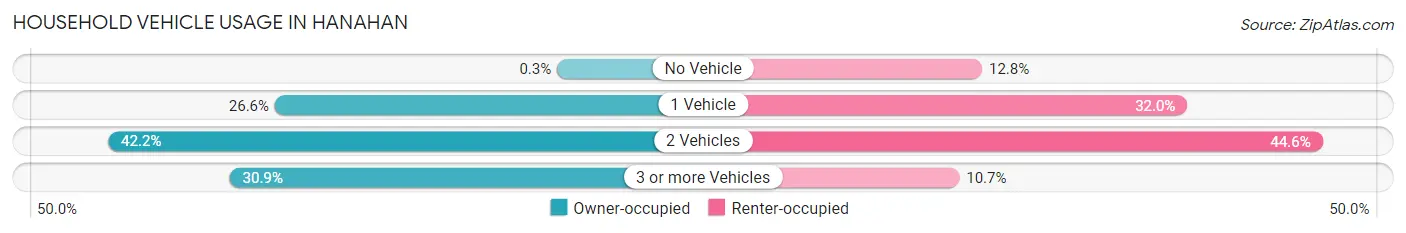
| Vehicles per Household | Owner-occupied | Renter-occupied |
| No Vehicle | 15 (0.3%) | 302 (12.8%) |
| 1 Vehicle | 1,332 (26.6%) | 754 (32.0%) |
| 2 Vehicles | 2,110 (42.2%) | 1,052 (44.6%) |
| 3 or more Vehicles | 1,543 (30.9%) | 252 (10.7%) |
| Total | 5,000 (100.0%) | 2,360 (100.0%) |
Real Estate & Mortgages in Hanahan
Real Estate and Mortgage Overview in Hanahan
| Characteristic | Without Mortgage | With Mortgage |
| Housing Units | 1,618 | 3,382 |
| Median Property Value | $242,200 | $343,700 |
| Median Household Income | $60,726 | $851 |
| Monthly Housing Costs | $497 | $245 |
| Real Estate Taxes | $1,061 | $57 |
Property Value by Mortgage Status in Hanahan
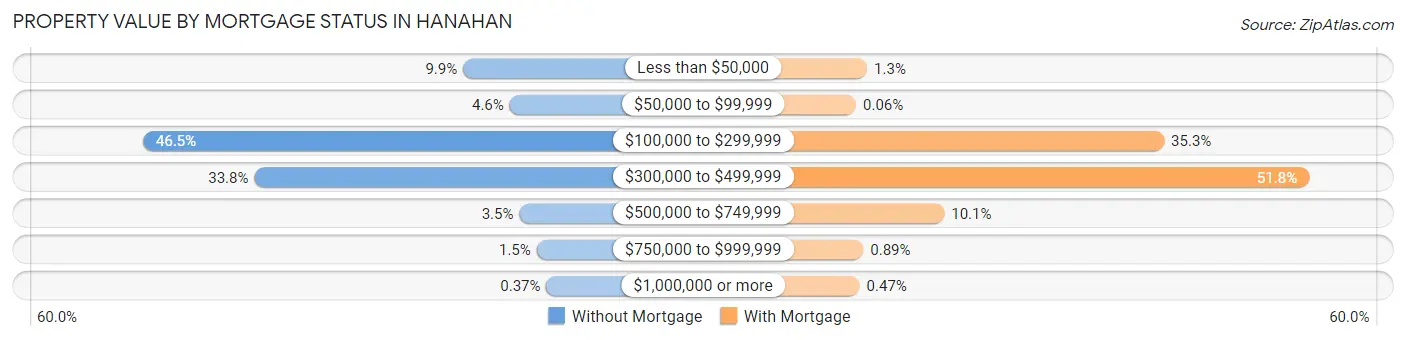
| Property Value | Without Mortgage | With Mortgage |
| Less than $50,000 | 160 (9.9%) | 45 (1.3%) |
| $50,000 to $99,999 | 74 (4.6%) | 2 (0.1%) |
| $100,000 to $299,999 | 752 (46.5%) | 1,193 (35.3%) |
| $300,000 to $499,999 | 546 (33.8%) | 1,753 (51.8%) |
| $500,000 to $749,999 | 56 (3.5%) | 343 (10.1%) |
| $750,000 to $999,999 | 24 (1.5%) | 30 (0.9%) |
| $1,000,000 or more | 6 (0.4%) | 16 (0.5%) |
| Total | 1,618 (100.0%) | 3,382 (100.0%) |
Household Income by Mortgage Status in Hanahan
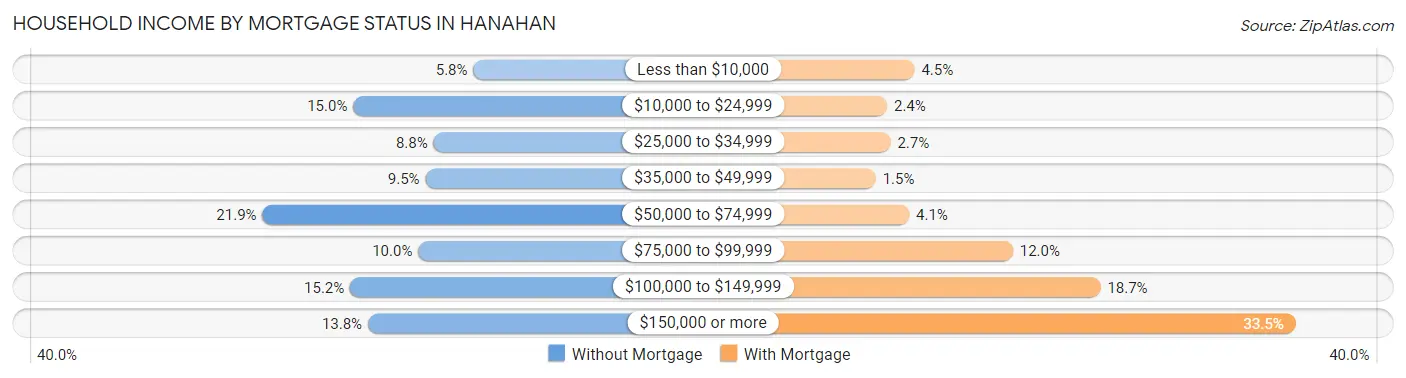
| Household Income | Without Mortgage | With Mortgage |
| Less than $10,000 | 94 (5.8%) | 152 (4.5%) |
| $10,000 to $24,999 | 242 (15.0%) | 81 (2.4%) |
| $25,000 to $34,999 | 143 (8.8%) | 90 (2.7%) |
| $35,000 to $49,999 | 153 (9.5%) | 52 (1.5%) |
| $50,000 to $74,999 | 354 (21.9%) | 138 (4.1%) |
| $75,000 to $99,999 | 162 (10.0%) | 405 (12.0%) |
| $100,000 to $149,999 | 246 (15.2%) | 631 (18.7%) |
| $150,000 or more | 224 (13.8%) | 1,134 (33.5%) |
| Total | 1,618 (100.0%) | 3,382 (100.0%) |
Property Value to Household Income Ratio in Hanahan
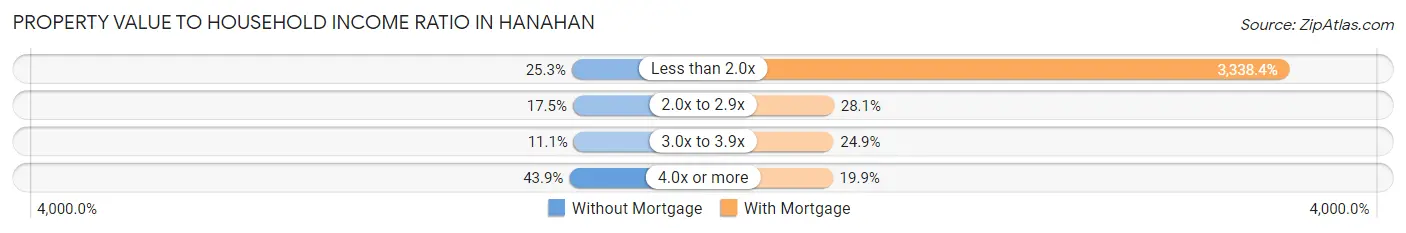
| Value-to-Income Ratio | Without Mortgage | With Mortgage |
| Less than 2.0x | 409 (25.3%) | 112,903 (3,338.3%) |
| 2.0x to 2.9x | 283 (17.5%) | 951 (28.1%) |
| 3.0x to 3.9x | 179 (11.1%) | 842 (24.9%) |
| 4.0x or more | 711 (43.9%) | 674 (19.9%) |
| Total | 1,618 (100.0%) | 3,382 (100.0%) |
Real Estate Taxes by Mortgage Status in Hanahan
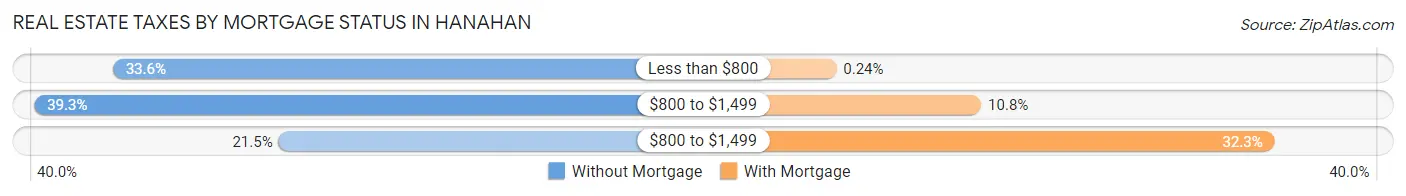
| Property Taxes | Without Mortgage | With Mortgage |
| Less than $800 | 543 (33.6%) | 8 (0.2%) |
| $800 to $1,499 | 636 (39.3%) | 366 (10.8%) |
| $800 to $1,499 | 347 (21.4%) | 1,091 (32.3%) |
| Total | 1,618 (100.0%) | 3,382 (100.0%) |
Health & Disability in Hanahan
Health Insurance Coverage by Age in Hanahan
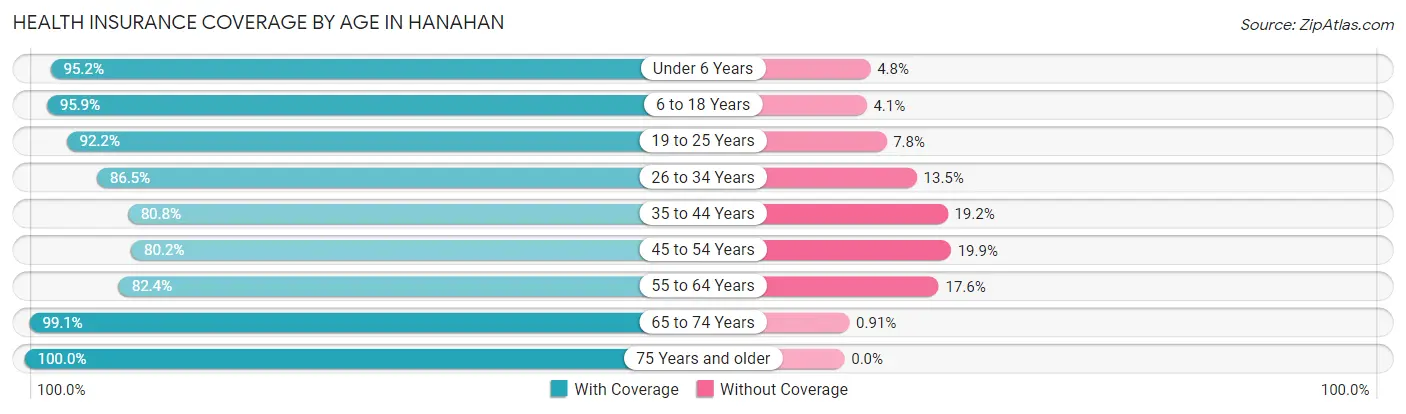
| Age Bracket | With Coverage | Without Coverage |
| Under 6 Years | 2,009 (95.2%) | 102 (4.8%) |
| 6 to 18 Years | 3,453 (95.9%) | 149 (4.1%) |
| 19 to 25 Years | 1,449 (92.2%) | 123 (7.8%) |
| 26 to 34 Years | 2,337 (86.5%) | 364 (13.5%) |
| 35 to 44 Years | 2,389 (80.8%) | 569 (19.2%) |
| 45 to 54 Years | 1,975 (80.1%) | 489 (19.9%) |
| 55 to 64 Years | 1,881 (82.4%) | 401 (17.6%) |
| 65 to 74 Years | 1,196 (99.1%) | 11 (0.9%) |
| 75 Years and older | 1,390 (100.0%) | 0 (0.0%) |
| Total | 18,079 (89.1%) | 2,208 (10.9%) |
Health Insurance Coverage by Citizenship Status in Hanahan
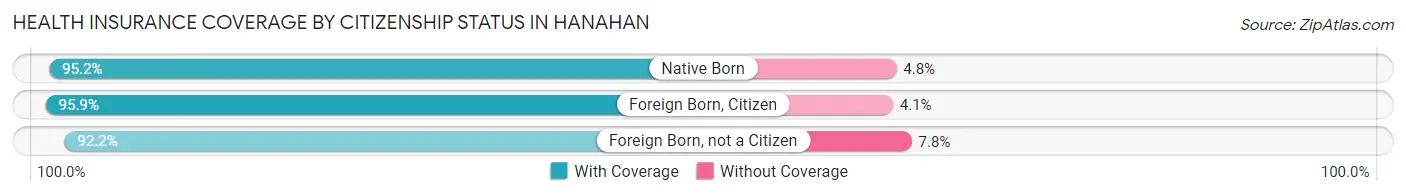
| Citizenship Status | With Coverage | Without Coverage |
| Native Born | 2,009 (95.2%) | 102 (4.8%) |
| Foreign Born, Citizen | 3,453 (95.9%) | 149 (4.1%) |
| Foreign Born, not a Citizen | 1,449 (92.2%) | 123 (7.8%) |
Health Insurance Coverage by Household Income in Hanahan
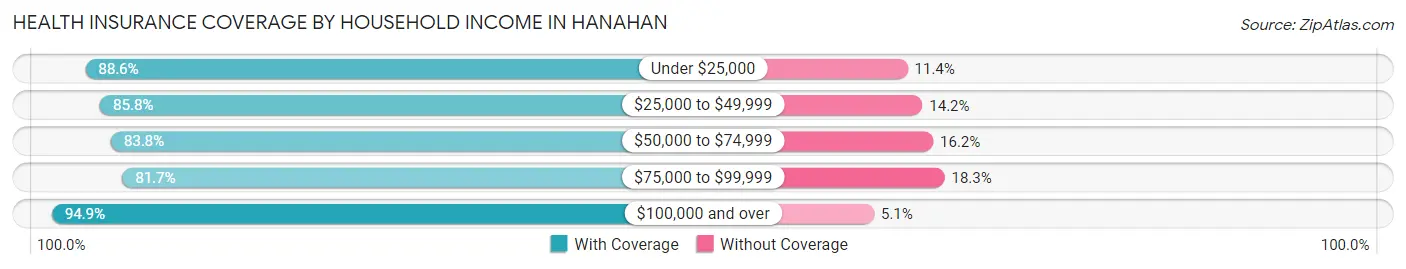
| Household Income | With Coverage | Without Coverage |
| Under $25,000 | 1,680 (88.6%) | 216 (11.4%) |
| $25,000 to $49,999 | 2,419 (85.8%) | 399 (14.2%) |
| $50,000 to $74,999 | 2,758 (83.8%) | 532 (16.2%) |
| $75,000 to $99,999 | 2,685 (81.7%) | 602 (18.3%) |
| $100,000 and over | 8,537 (94.9%) | 459 (5.1%) |
Public vs Private Health Insurance Coverage by Age in Hanahan
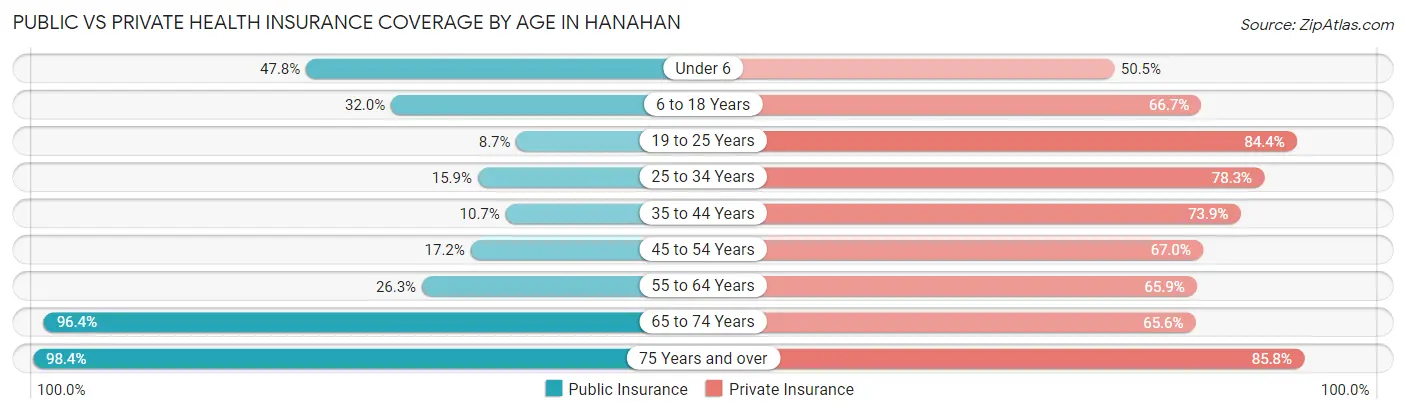
| Age Bracket | Public Insurance | Private Insurance |
| Under 6 | 1,008 (47.7%) | 1,066 (50.5%) |
| 6 to 18 Years | 1,152 (32.0%) | 2,402 (66.7%) |
| 19 to 25 Years | 137 (8.7%) | 1,327 (84.4%) |
| 25 to 34 Years | 429 (15.9%) | 2,116 (78.3%) |
| 35 to 44 Years | 317 (10.7%) | 2,187 (73.9%) |
| 45 to 54 Years | 424 (17.2%) | 1,651 (67.0%) |
| 55 to 64 Years | 599 (26.3%) | 1,503 (65.9%) |
| 65 to 74 Years | 1,164 (96.4%) | 792 (65.6%) |
| 75 Years and over | 1,368 (98.4%) | 1,192 (85.8%) |
| Total | 6,598 (32.5%) | 14,236 (70.2%) |
Disability Status by Sex by Age in Hanahan
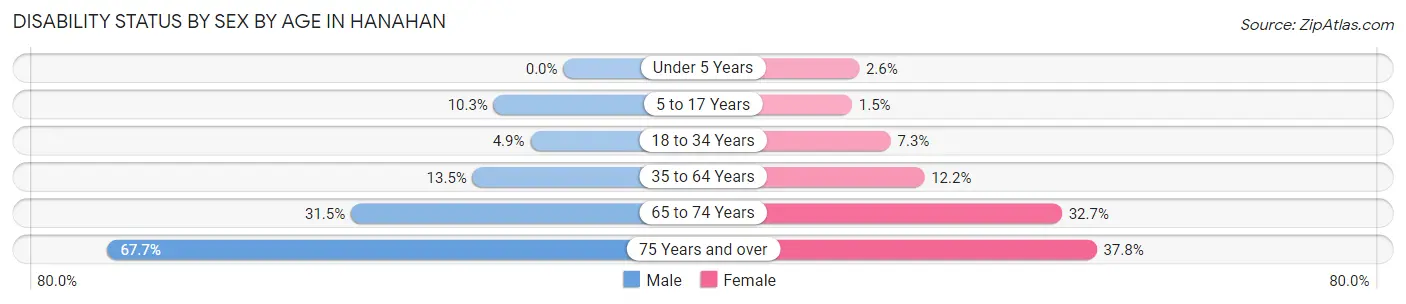
| Age Bracket | Male | Female |
| Under 5 Years | 0 (0.0%) | 19 (2.5%) |
| 5 to 17 Years | 192 (10.3%) | 30 (1.5%) |
| 18 to 34 Years | 111 (4.9%) | 157 (7.2%) |
| 35 to 64 Years | 525 (13.5%) | 466 (12.2%) |
| 65 to 74 Years | 146 (31.5%) | 243 (32.7%) |
| 75 Years and over | 463 (67.7%) | 267 (37.8%) |
Disability Class by Sex by Age in Hanahan
Disability Class: Hearing Difficulty
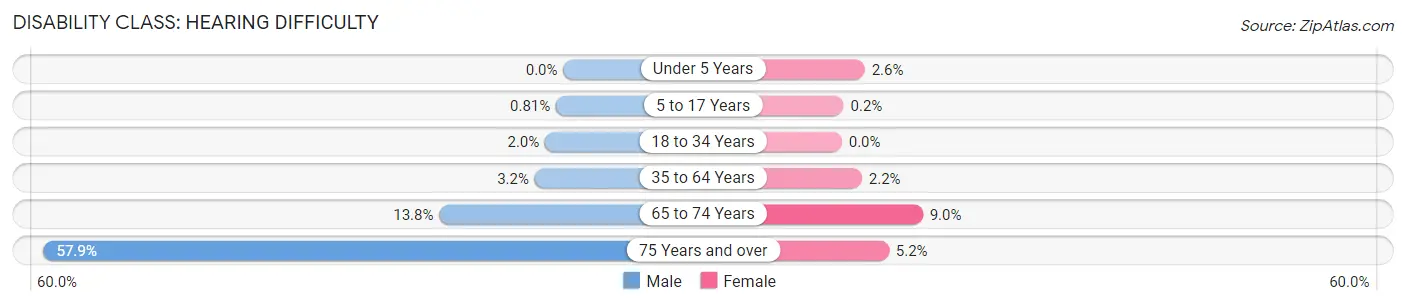
| Age Bracket | Male | Female |
| Under 5 Years | 0 (0.0%) | 19 (2.5%) |
| 5 to 17 Years | 15 (0.8%) | 4 (0.2%) |
| 18 to 34 Years | 46 (2.0%) | 0 (0.0%) |
| 35 to 64 Years | 124 (3.2%) | 85 (2.2%) |
| 65 to 74 Years | 64 (13.8%) | 67 (9.0%) |
| 75 Years and over | 396 (57.9%) | 37 (5.2%) |
Disability Class: Vision Difficulty
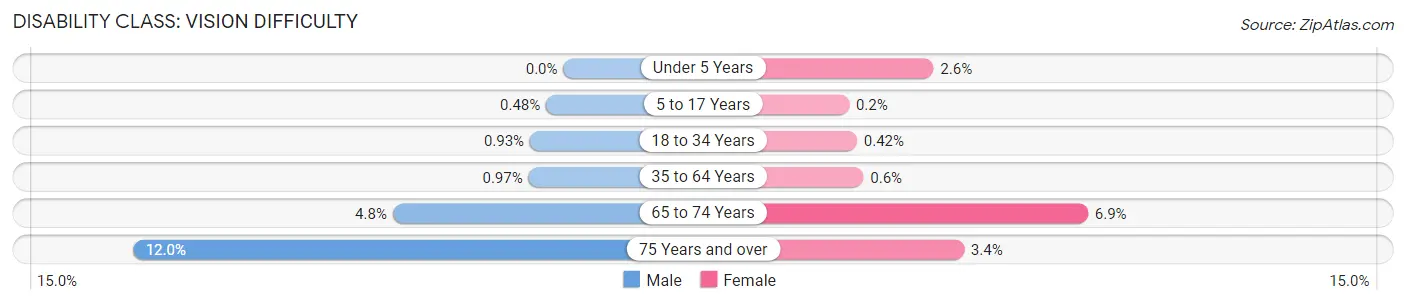
| Age Bracket | Male | Female |
| Under 5 Years | 0 (0.0%) | 19 (2.5%) |
| 5 to 17 Years | 9 (0.5%) | 4 (0.2%) |
| 18 to 34 Years | 21 (0.9%) | 9 (0.4%) |
| 35 to 64 Years | 38 (1.0%) | 23 (0.6%) |
| 65 to 74 Years | 22 (4.8%) | 51 (6.9%) |
| 75 Years and over | 82 (12.0%) | 24 (3.4%) |
Disability Class: Cognitive Difficulty
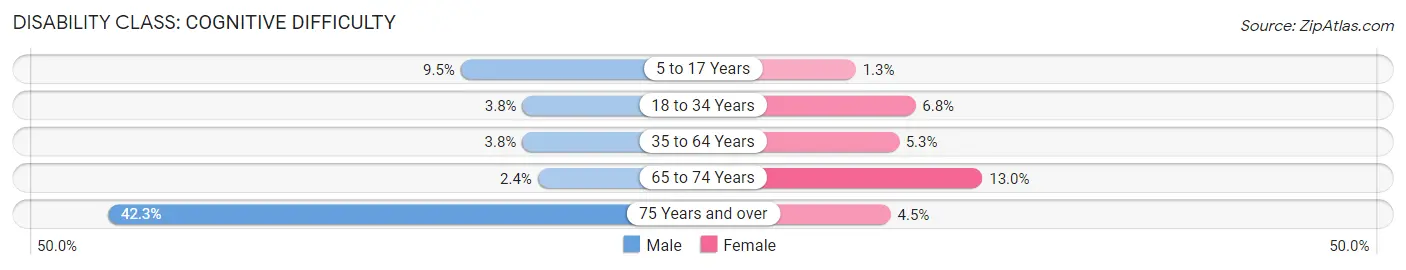
| Age Bracket | Male | Female |
| 5 to 17 Years | 177 (9.5%) | 26 (1.3%) |
| 18 to 34 Years | 86 (3.8%) | 148 (6.8%) |
| 35 to 64 Years | 149 (3.8%) | 201 (5.3%) |
| 65 to 74 Years | 11 (2.4%) | 97 (13.0%) |
| 75 Years and over | 289 (42.2%) | 32 (4.5%) |
Disability Class: Ambulatory Difficulty
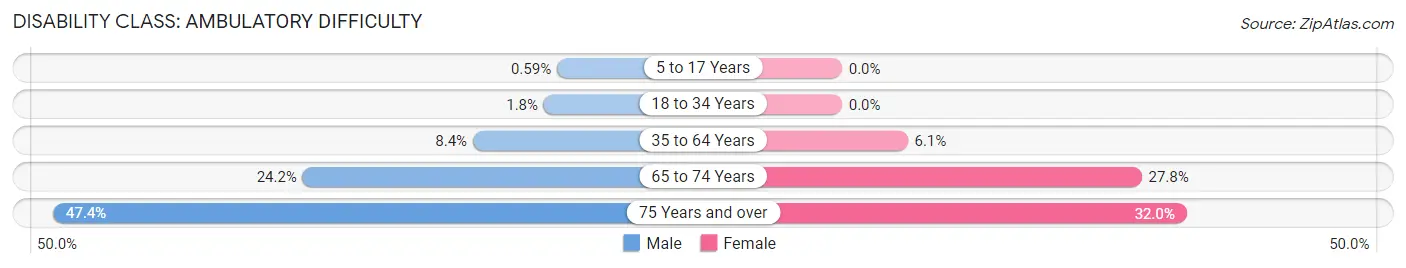
| Age Bracket | Male | Female |
| 5 to 17 Years | 11 (0.6%) | 0 (0.0%) |
| 18 to 34 Years | 41 (1.8%) | 0 (0.0%) |
| 35 to 64 Years | 327 (8.4%) | 232 (6.1%) |
| 65 to 74 Years | 112 (24.2%) | 207 (27.8%) |
| 75 Years and over | 324 (47.4%) | 226 (32.0%) |
Disability Class: Self-Care Difficulty
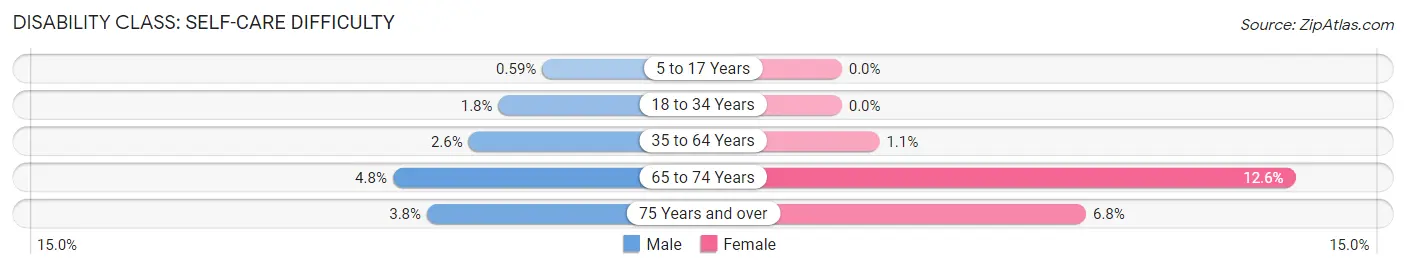
| Age Bracket | Male | Female |
| 5 to 17 Years | 11 (0.6%) | 0 (0.0%) |
| 18 to 34 Years | 41 (1.8%) | 0 (0.0%) |
| 35 to 64 Years | 103 (2.6%) | 40 (1.1%) |
| 65 to 74 Years | 22 (4.8%) | 94 (12.6%) |
| 75 Years and over | 26 (3.8%) | 48 (6.8%) |
Technology Access in Hanahan
Computing Device Access in Hanahan
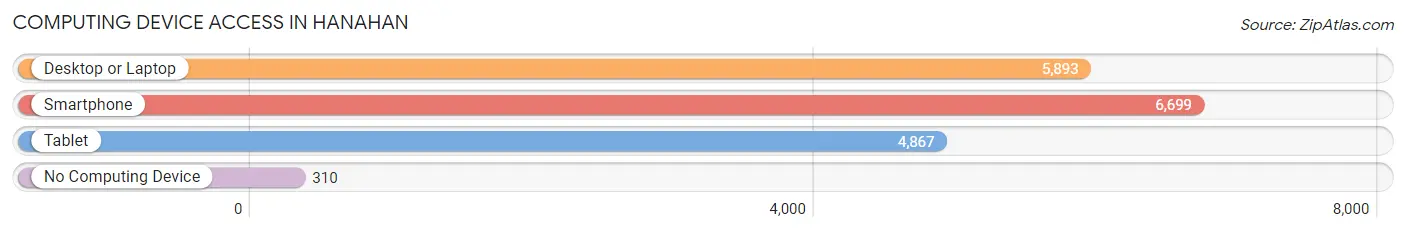
| Device Type | # Households | % Households |
| Desktop or Laptop | 5,893 | 80.1% |
| Smartphone | 6,699 | 91.0% |
| Tablet | 4,867 | 66.1% |
| No Computing Device | 310 | 4.2% |
| Total | 7,360 | 100.0% |
Internet Access in Hanahan
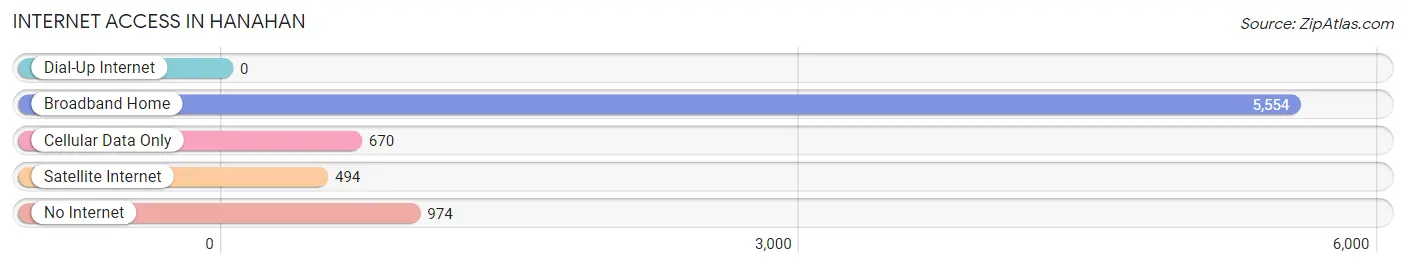
| Internet Type | # Households | % Households |
| Dial-Up Internet | 0 | 0.0% |
| Broadband Home | 5,554 | 75.5% |
| Cellular Data Only | 670 | 9.1% |
| Satellite Internet | 494 | 6.7% |
| No Internet | 974 | 13.2% |
| Total | 7,360 | 100.0% |
Hanahan Summary
Hanahan, South Carolina is a small city located in Berkeley County, South Carolina. It is situated along the Cooper River, just north of Charleston. The city has a population of approximately 20,000 people and is part of the Charleston-North Charleston-Summerville Metropolitan Statistical Area.
Geography
Hanahan is located in Berkeley County, South Carolina, and is situated along the Cooper River. The city is located just north of Charleston, and is bordered by Goose Creek to the west, North Charleston to the south, and the Francis Marion National Forest to the east. The city has a total area of 8.3 square miles, of which 8.2 square miles is land and 0.1 square miles is water.
The city is located in the Lowcountry region of South Carolina, and is characterized by its humid subtropical climate. The average temperature in Hanahan is around 70 degrees Fahrenheit, with temperatures ranging from the mid-50s in the winter to the mid-80s in the summer. The city receives an average of 48 inches of precipitation per year, with most of it occurring in the summer months.
Economy
Hanahan’s economy is largely based on the service industry, with many of its residents employed in retail, hospitality, and healthcare. The city is also home to several manufacturing and industrial companies, including Boeing, Bosch, and Volvo. The city is also home to several military installations, including the Naval Weapons Station Charleston and the Charleston Air Force Base.
Demographics
As of the 2010 census, Hanahan had a population of 19,997 people. The racial makeup of the city was 79.2% White, 15.2% African American, 0.5% Native American, 1.7% Asian, 0.1% Pacific Islander, 1.3% from other races, and 2.1% from two or more races. Hispanic or Latino of any race were 4.2% of the population.
The median household income in Hanahan was $50,945, and the median family income was $60,945. The per capita income for the city was $25,945. About 8.2% of families and 10.2% of the population were below the poverty line, including 14.2% of those under age 18 and 8.2% of those age 65 or over.
Conclusion
Hanahan, South Carolina is a small city located in Berkeley County, South Carolina. It is situated along the Cooper River, just north of Charleston. The city has a population of approximately 20,000 people and is part of the Charleston-North Charleston-Summerville Metropolitan Statistical Area. The city is characterized by its humid subtropical climate and is home to several military installations, including the Naval Weapons Station Charleston and the Charleston Air Force Base. The economy of Hanahan is largely based on the service industry, with many of its residents employed in retail, hospitality, and healthcare. The racial makeup of the city is 79.2% White, 15.2% African American, 0.5% Native American, 1.7% Asian, 0.1% Pacific Islander, 1.3% from other races, and 2.1% from two or more races. The median household income in Hanahan was $50,945, and the median family income was $60,945.
Common Questions
What is Per Capita Income in Hanahan?
Per Capita income in Hanahan is $35,980.
What is the Median Family Income in Hanahan?
Median Family Income in Hanahan is $94,400.
What is the Median Household income in Hanahan?
Median Household Income in Hanahan is $79,305.
What is Income or Wage Gap in Hanahan?
Income or Wage Gap in Hanahan is 22.6%.
Women in Hanahan earn 77.4 cents for every dollar earned by a man.
What is Family Income Deficit in Hanahan?
Family Income Deficit in Hanahan is $7,790.
Families that are below poverty line in Hanahan earn $7,790 less on average than the poverty threshold level.
What is Inequality or Gini Index in Hanahan?
Inequality or Gini Index in Hanahan is 0.40.
What is the Total Population of Hanahan?
Total Population of Hanahan is 20,731.
What is the Total Male Population of Hanahan?
Total Male Population of Hanahan is 10,534.
What is the Total Female Population of Hanahan?
Total Female Population of Hanahan is 10,197.
What is the Ratio of Males per 100 Females in Hanahan?
There are 103.30 Males per 100 Females in Hanahan.
What is the Ratio of Females per 100 Males in Hanahan?
There are 96.80 Females per 100 Males in Hanahan.
What is the Median Population Age in Hanahan?
Median Population Age in Hanahan is 35.0 Years.
What is the Average Family Size in Hanahan
Average Family Size in Hanahan is 3.4 People.
What is the Average Household Size in Hanahan
Average Household Size in Hanahan is 2.8 People.
How Large is the Labor Force in Hanahan?
There are 10,687 People in the Labor Forcein in Hanahan.
What is the Percentage of People in the Labor Force in Hanahan?
68.3% of People are in the Labor Force in Hanahan.
What is the Unemployment Rate in Hanahan?
Unemployment Rate in Hanahan is 2.1%.