Seabrook Island, SC Map & Demographics
Seabrook Island Map
Seabrook Island Overview
$115,125
PER CAPITA INCOME
$162,171
AVG FAMILY INCOME
$117,386
AVG HOUSEHOLD INCOME
18.8%
WAGE / INCOME GAP [ % ]
81.2¢/ $1
WAGE / INCOME GAP [ $ ]
0.53
INEQUALITY / GINI INDEX
2,062
TOTAL POPULATION
1,020
MALE POPULATION
1,042
FEMALE POPULATION
97.89
MALES / 100 FEMALES
102.16
FEMALES / 100 MALES
68.1
MEDIAN AGE
2.0
AVG FAMILY SIZE
1.7
AVG HOUSEHOLD SIZE
666
LABOR FORCE [ PEOPLE ]
32.4%
PERCENT IN LABOR FORCE
0.7%
UNEMPLOYMENT RATE
Seabrook Island Area Codes
Income in Seabrook Island
Income Overview in Seabrook Island
Per Capita Income in Seabrook Island is $115,125, while median incomes of families and households are $162,171 and $117,386 respectively.
| Characteristic | Number | Measure |
| Per Capita Income | 2,062 | $115,125 |
| Median Family Income | 839 | $162,171 |
| Mean Family Income | 839 | $247,056 |
| Median Household Income | 1,192 | $117,386 |
| Mean Household Income | 1,192 | $197,995 |
| Income Deficit | 839 | $0 |
| Wage / Income Gap (%) | 2,062 | 18.79% |
| Wage / Income Gap ($) | 2,062 | 81.21¢ per $1 |
| Gini / Inequality Index | 2,062 | 0.53 |
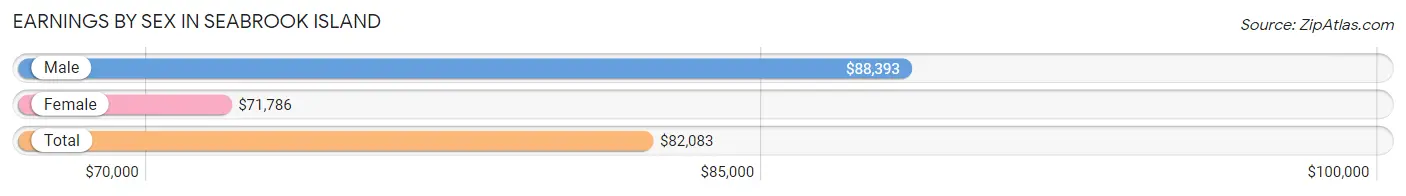
Earnings by Sex in Seabrook Island
Average Earnings in Seabrook Island are $82,083, $88,393 for men and $71,786 for women, a difference of 18.8%.
| Sex | Number | Average Earnings |
| Male | 481 (63.0%) | $88,393 |
| Female | 282 (37.0%) | $71,786 |
| Total | 763 (100.0%) | $82,083 |
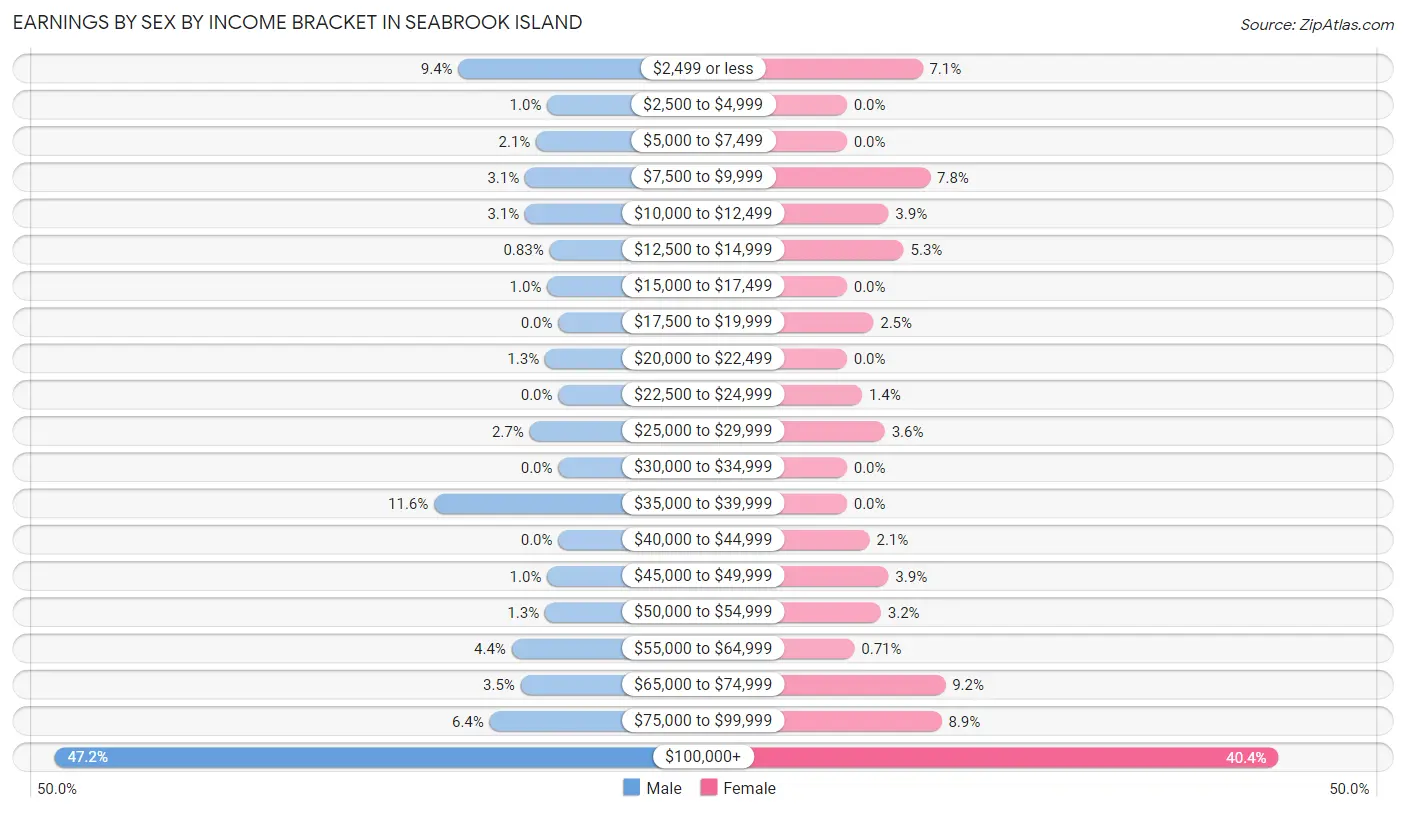
Earnings by Sex by Income Bracket in Seabrook Island
The most common earnings brackets in Seabrook Island are $100,000+ for men (227 | 47.2%) and $100,000+ for women (114 | 40.4%).
| Income | Male | Female |
| $2,499 or less | 45 (9.4%) | 20 (7.1%) |
| $2,500 to $4,999 | 5 (1.0%) | 0 (0.0%) |
| $5,000 to $7,499 | 10 (2.1%) | 0 (0.0%) |
| $7,500 to $9,999 | 15 (3.1%) | 22 (7.8%) |
| $10,000 to $12,499 | 15 (3.1%) | 11 (3.9%) |
| $12,500 to $14,999 | 4 (0.8%) | 15 (5.3%) |
| $15,000 to $17,499 | 5 (1.0%) | 0 (0.0%) |
| $17,500 to $19,999 | 0 (0.0%) | 7 (2.5%) |
| $20,000 to $22,499 | 6 (1.3%) | 0 (0.0%) |
| $22,500 to $24,999 | 0 (0.0%) | 4 (1.4%) |
| $25,000 to $29,999 | 13 (2.7%) | 10 (3.5%) |
| $30,000 to $34,999 | 0 (0.0%) | 0 (0.0%) |
| $35,000 to $39,999 | 56 (11.6%) | 0 (0.0%) |
| $40,000 to $44,999 | 0 (0.0%) | 6 (2.1%) |
| $45,000 to $49,999 | 5 (1.0%) | 11 (3.9%) |
| $50,000 to $54,999 | 6 (1.3%) | 9 (3.2%) |
| $55,000 to $64,999 | 21 (4.4%) | 2 (0.7%) |
| $65,000 to $74,999 | 17 (3.5%) | 26 (9.2%) |
| $75,000 to $99,999 | 31 (6.4%) | 25 (8.9%) |
| $100,000+ | 227 (47.2%) | 114 (40.4%) |
| Total | 481 (100.0%) | 282 (100.0%) |
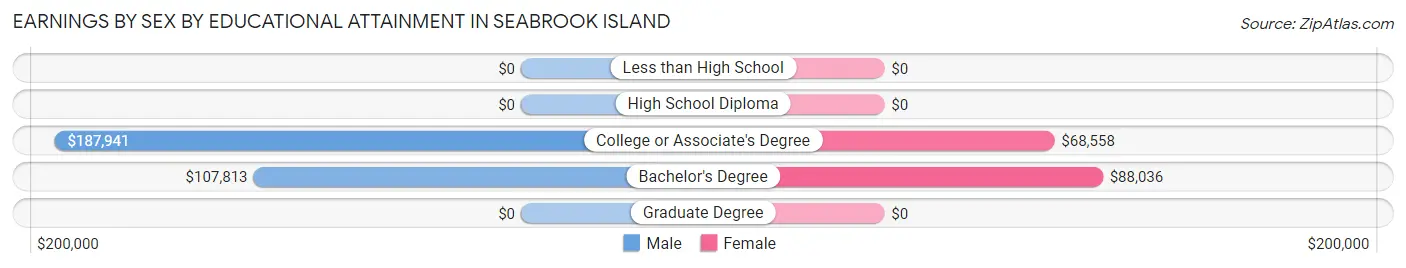
Earnings by Sex by Educational Attainment in Seabrook Island
Average earnings in Seabrook Island are $89,286 for men and $71,786 for women, a difference of 19.6%. Men with an educational attainment of college or associate's degree enjoy the highest average annual earnings of $187,941, while those with bachelor's degree education earn the least with $107,813. Women with an educational attainment of bachelor's degree earn the most with the average annual earnings of $88,036, while those with college or associate's degree education have the smallest earnings of $68,558.
| Educational Attainment | Male Income | Female Income |
| Less than High School | - | - |
| High School Diploma | - | - |
| College or Associate's Degree | $187,941 | $68,558 |
| Bachelor's Degree | $107,813 | $88,036 |
| Graduate Degree | - | - |
| Total | $89,286 | $71,786 |
Family Income in Seabrook Island
Family Income Brackets in Seabrook Island
According to the Seabrook Island family income data, there are 311 families falling into the $200,000+ income range, which is the most common income bracket and makes up 37.1% of all families.
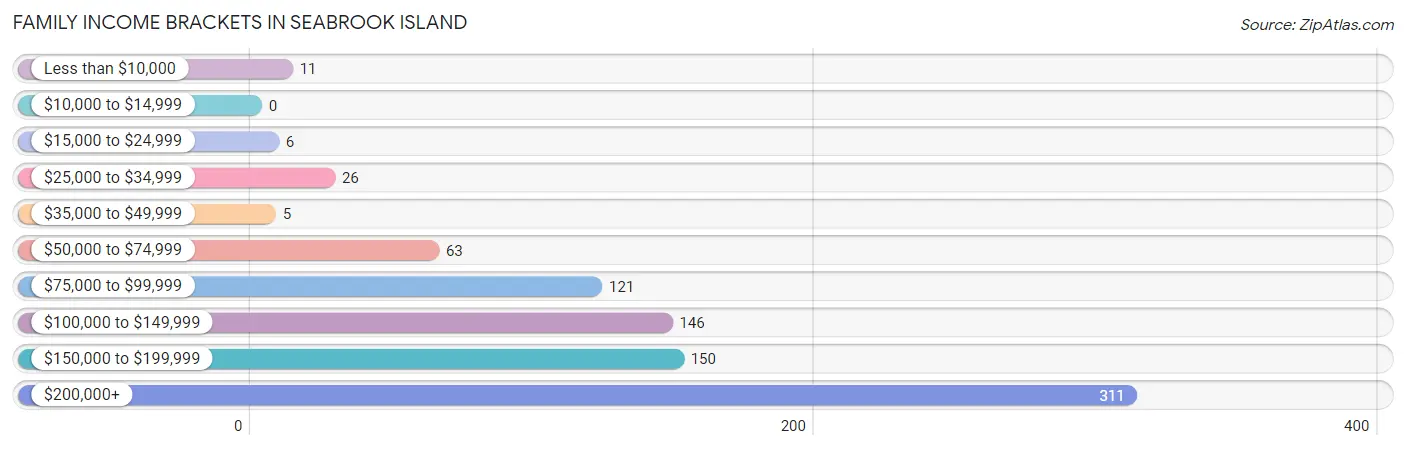
| Income Bracket | # Families | % Families |
| Less than $10,000 | 11 | 1.3% |
| $10,000 to $14,999 | 0 | 0.0% |
| $15,000 to $24,999 | 6 | 0.7% |
| $25,000 to $34,999 | 26 | 3.1% |
| $35,000 to $49,999 | 5 | 0.6% |
| $50,000 to $74,999 | 63 | 7.5% |
| $75,000 to $99,999 | 121 | 14.4% |
| $100,000 to $149,999 | 146 | 17.4% |
| $150,000 to $199,999 | 150 | 17.9% |
| $200,000+ | 311 | 37.1% |
Family Income by Famaliy Size in Seabrook Island
2-person families (826 | 98.5%) account for the highest median family income in Seabrook Island with $161,316 per family, while 2-person families (826 | 98.5%) have the highest median income of $80,658 per family member.
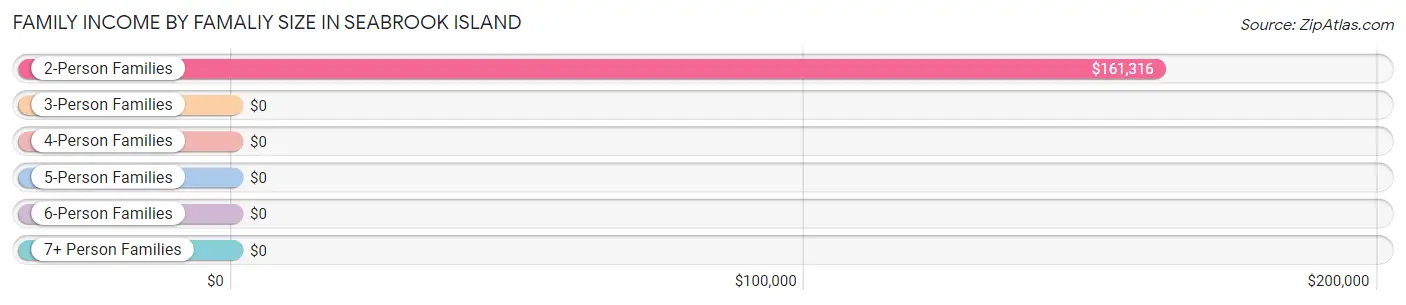
| Income Bracket | # Families | Median Income |
| 2-Person Families | 826 (98.5%) | $161,316 |
| 3-Person Families | 8 (0.9%) | $0 |
| 4-Person Families | 0 (0.0%) | $0 |
| 5-Person Families | 5 (0.6%) | $0 |
| 6-Person Families | 0 (0.0%) | $0 |
| 7+ Person Families | 0 (0.0%) | $0 |
| Total | 839 (100.0%) | $162,171 |
Family Income by Number of Earners in Seabrook Island
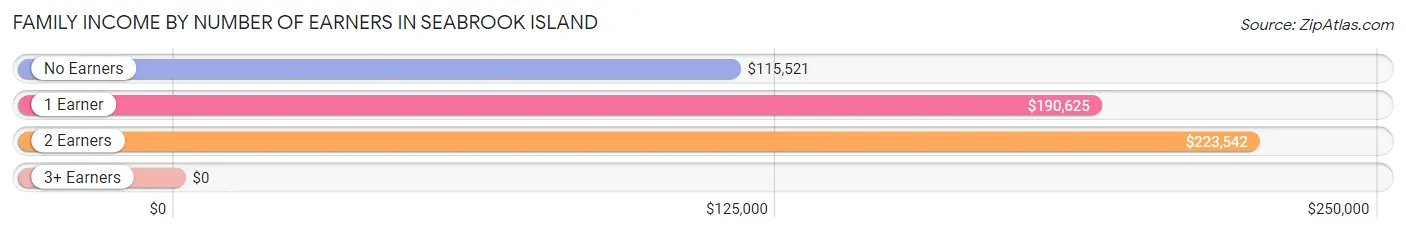
| Number of Earners | # Families | Median Income |
| No Earners | 379 (45.2%) | $115,521 |
| 1 Earner | 290 (34.6%) | $190,625 |
| 2 Earners | 165 (19.7%) | $223,542 |
| 3+ Earners | 5 (0.6%) | $0 |
| Total | 839 (100.0%) | $162,171 |
Household Income in Seabrook Island
Household Income Brackets in Seabrook Island
With 337 households falling in the category, the $200,000+ income range is the most frequent in Seabrook Island, accounting for 28.3% of all households. In contrast, only 10 households (0.8%) fall into the $15,000 to $24,999 income bracket, making it the least populous group.
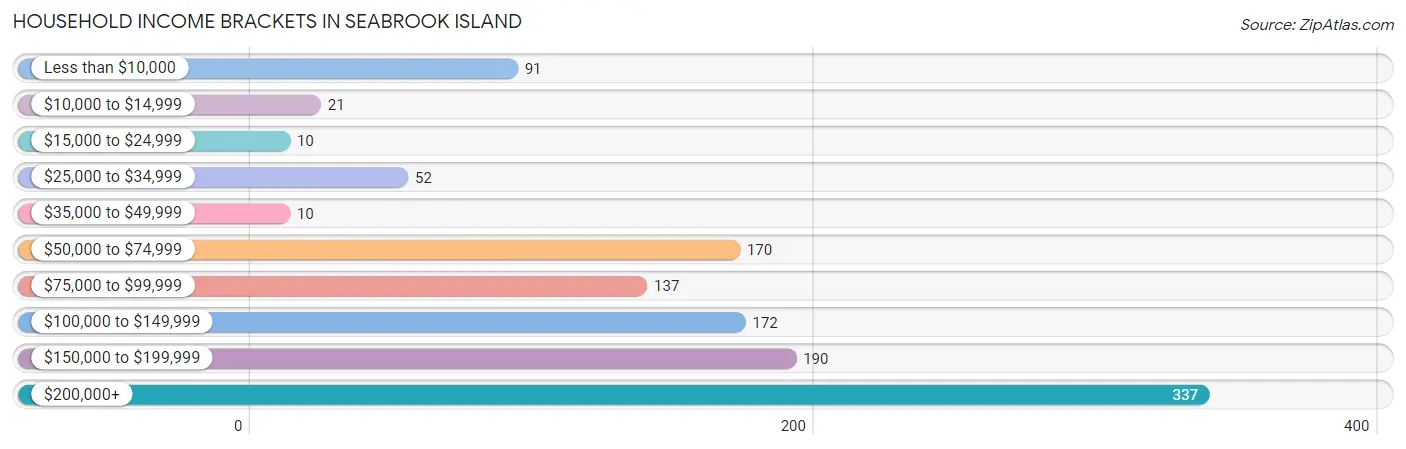
| Income Bracket | # Households | % Households |
| Less than $10,000 | 91 | 7.6% |
| $10,000 to $14,999 | 21 | 1.8% |
| $15,000 to $24,999 | 10 | 0.8% |
| $25,000 to $34,999 | 52 | 4.4% |
| $35,000 to $49,999 | 10 | 0.8% |
| $50,000 to $74,999 | 170 | 14.3% |
| $75,000 to $99,999 | 137 | 11.5% |
| $100,000 to $149,999 | 172 | 14.4% |
| $150,000 to $199,999 | 190 | 15.9% |
| $200,000+ | 337 | 28.3% |
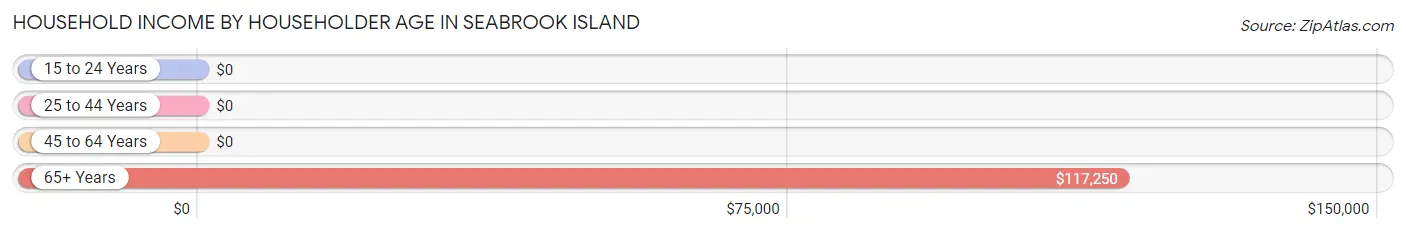
Household Income by Householder Age in Seabrook Island
The median household income in Seabrook Island is $117,386, with the highest median household income of $117,250 found in the 65+ years age bracket for the primary householder. A total of 765 households (64.2%) fall into this category.
| Income Bracket | # Households | Median Income |
| 15 to 24 Years | 0 (0.0%) | $0 |
| 25 to 44 Years | 39 (3.3%) | $0 |
| 45 to 64 Years | 388 (32.6%) | $0 |
| 65+ Years | 765 (64.2%) | $117,250 |
| Total | 1,192 (100.0%) | $117,386 |
Poverty in Seabrook Island
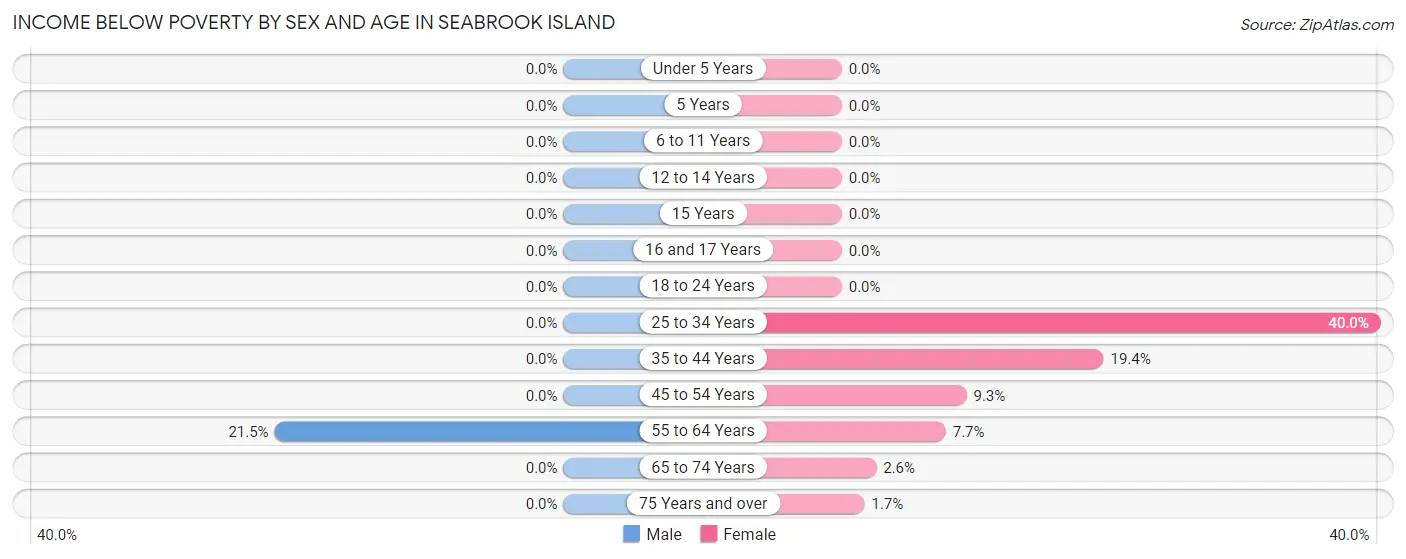
Income Below Poverty by Sex and Age in Seabrook Island
With 6.4% poverty level for males and 5.2% for females among the residents of Seabrook Island, 55 to 64 year old males and 25 to 34 year old females are the most vulnerable to poverty, with 65 males (21.4%) and 4 females (40.0%) in their respective age groups living below the poverty level.
| Age Bracket | Male | Female |
| Under 5 Years | 0 (0.0%) | 0 (0.0%) |
| 5 Years | 0 (0.0%) | 0 (0.0%) |
| 6 to 11 Years | 0 (0.0%) | 0 (0.0%) |
| 12 to 14 Years | 0 (0.0%) | 0 (0.0%) |
| 15 Years | 0 (0.0%) | 0 (0.0%) |
| 16 and 17 Years | 0 (0.0%) | 0 (0.0%) |
| 18 to 24 Years | 0 (0.0%) | 0 (0.0%) |
| 25 to 34 Years | 0 (0.0%) | 4 (40.0%) |
| 35 to 44 Years | 0 (0.0%) | 7 (19.4%) |
| 45 to 54 Years | 0 (0.0%) | 5 (9.3%) |
| 55 to 64 Years | 65 (21.4%) | 24 (7.7%) |
| 65 to 74 Years | 0 (0.0%) | 10 (2.6%) |
| 75 Years and over | 0 (0.0%) | 4 (1.7%) |
| Total | 65 (6.4%) | 54 (5.2%) |
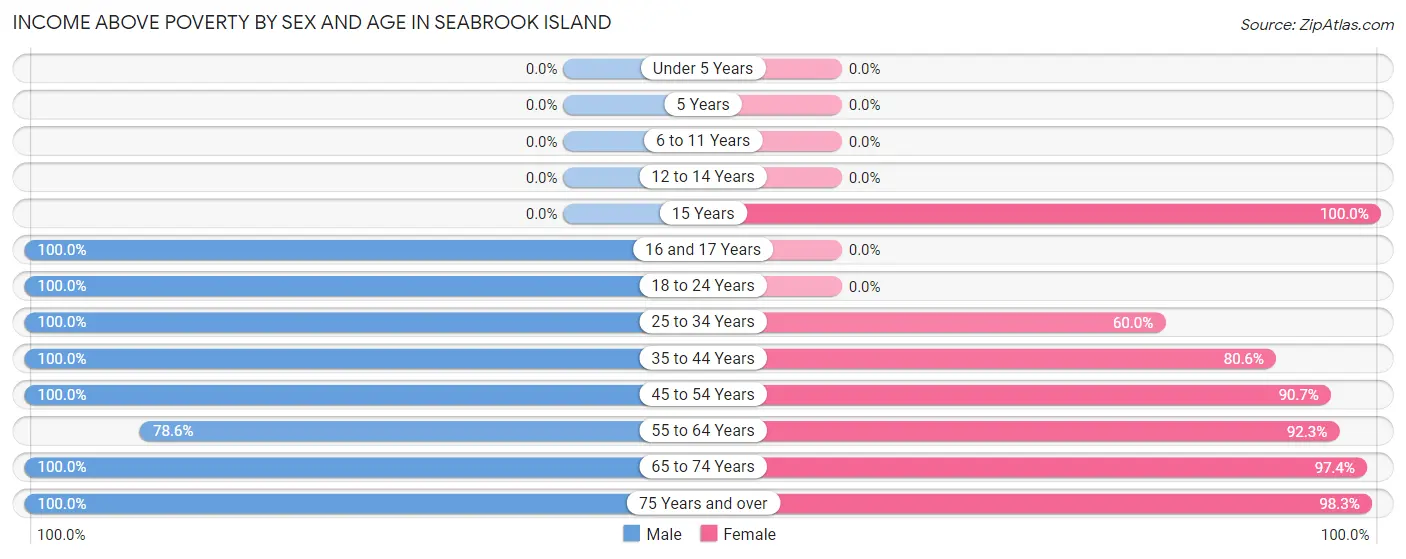
Income Above Poverty by Sex and Age in Seabrook Island
According to the poverty statistics in Seabrook Island, males aged 16 and 17 years and females aged 15 years are the age groups that are most secure financially, with 100.0% of males and 100.0% of females in these age groups living above the poverty line.
| Age Bracket | Male | Female |
| Under 5 Years | 0 (0.0%) | 0 (0.0%) |
| 5 Years | 0 (0.0%) | 0 (0.0%) |
| 6 to 11 Years | 0 (0.0%) | 0 (0.0%) |
| 12 to 14 Years | 0 (0.0%) | 0 (0.0%) |
| 15 Years | 0 (0.0%) | 5 (100.0%) |
| 16 and 17 Years | 5 (100.0%) | 0 (0.0%) |
| 18 to 24 Years | 5 (100.0%) | 0 (0.0%) |
| 25 to 34 Years | 10 (100.0%) | 6 (60.0%) |
| 35 to 44 Years | 17 (100.0%) | 29 (80.6%) |
| 45 to 54 Years | 33 (100.0%) | 49 (90.7%) |
| 55 to 64 Years | 238 (78.5%) | 287 (92.3%) |
| 65 to 74 Years | 409 (100.0%) | 380 (97.4%) |
| 75 Years and over | 238 (100.0%) | 232 (98.3%) |
| Total | 955 (93.6%) | 988 (94.8%) |
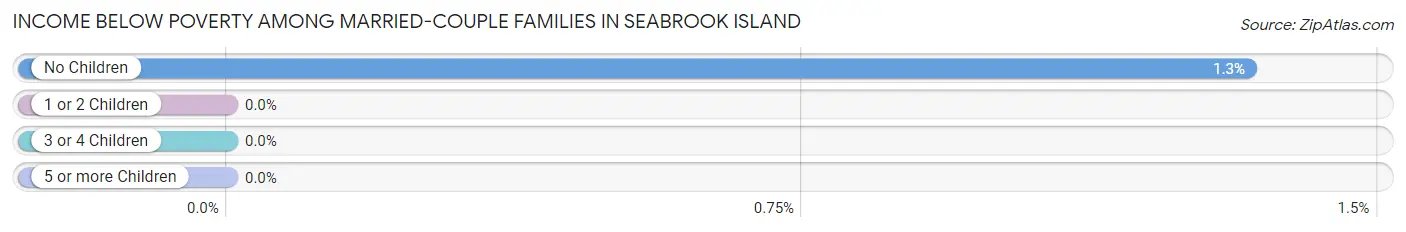
Income Below Poverty Among Married-Couple Families in Seabrook Island
The poverty statistics for married-couple families in Seabrook Island show that 1.3% or 11 of the total 834 families live below the poverty line. Families with no children have the highest poverty rate of 1.3%, comprising of 11 families. On the other hand, families with 1 or 2 children have the lowest poverty rate of 0.0%, which includes 0 families.
| Children | Above Poverty | Below Poverty |
| No Children | 818 (98.7%) | 11 (1.3%) |
| 1 or 2 Children | 5 (100.0%) | 0 (0.0%) |
| 3 or 4 Children | 0 (0.0%) | 0 (0.0%) |
| 5 or more Children | 0 (0.0%) | 0 (0.0%) |
| Total | 823 (98.7%) | 11 (1.3%) |
Income Below Poverty Among Single-Parent Households in Seabrook Island
| Children | Single Father | Single Mother |
| No Children | 0 (0.0%) | 0 (0.0%) |
| 1 or 2 Children | 0 (0.0%) | 0 (0.0%) |
| 3 or 4 Children | 0 (0.0%) | 0 (0.0%) |
| 5 or more Children | 0 (0.0%) | 0 (0.0%) |
| Total | 0 (0.0%) | 0 (0.0%) |
Income Below Poverty Among Married-Couple vs Single-Parent Households in Seabrook Island
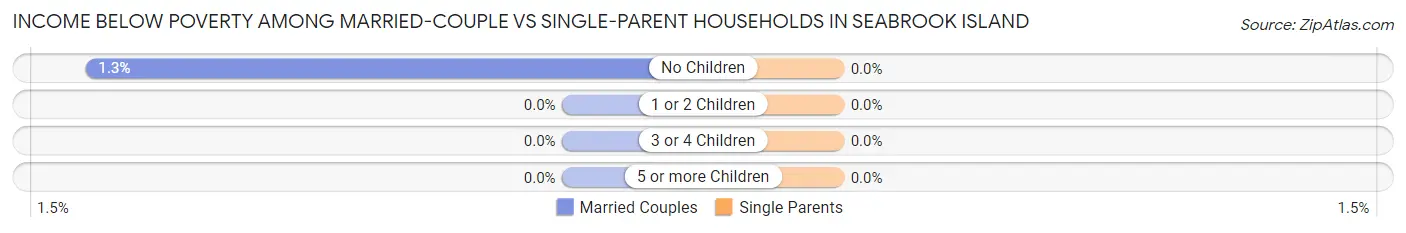
| Children | Married-Couple Families | Single-Parent Households |
| No Children | 11 (1.3%) | 0 (0.0%) |
| 1 or 2 Children | 0 (0.0%) | 0 (0.0%) |
| 3 or 4 Children | 0 (0.0%) | 0 (0.0%) |
| 5 or more Children | 0 (0.0%) | 0 (0.0%) |
| Total | 11 (1.3%) | 0 (0.0%) |
Race in Seabrook Island
The most populous races in Seabrook Island are White / Caucasian (2,011 | 97.5%), Two or more Races (36 | 1.8%), and Hispanic or Latino (20 | 1.0%).
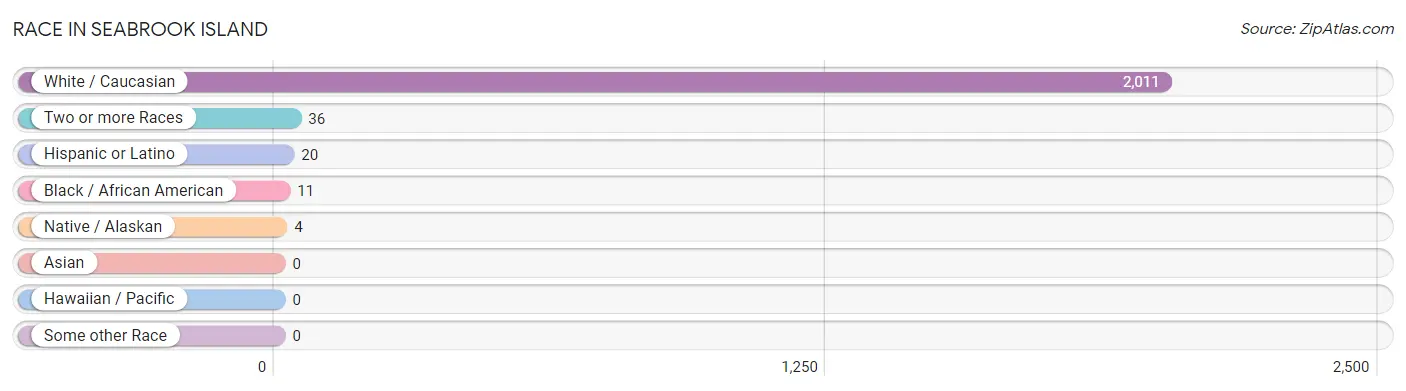
| Race | # Population | % Population |
| Asian | 0 | 0.0% |
| Black / African American | 11 | 0.5% |
| Hawaiian / Pacific | 0 | 0.0% |
| Hispanic or Latino | 20 | 1.0% |
| Native / Alaskan | 4 | 0.2% |
| White / Caucasian | 2,011 | 97.5% |
| Two or more Races | 36 | 1.8% |
| Some other Race | 0 | 0.0% |
| Total | 2,062 | 100.0% |
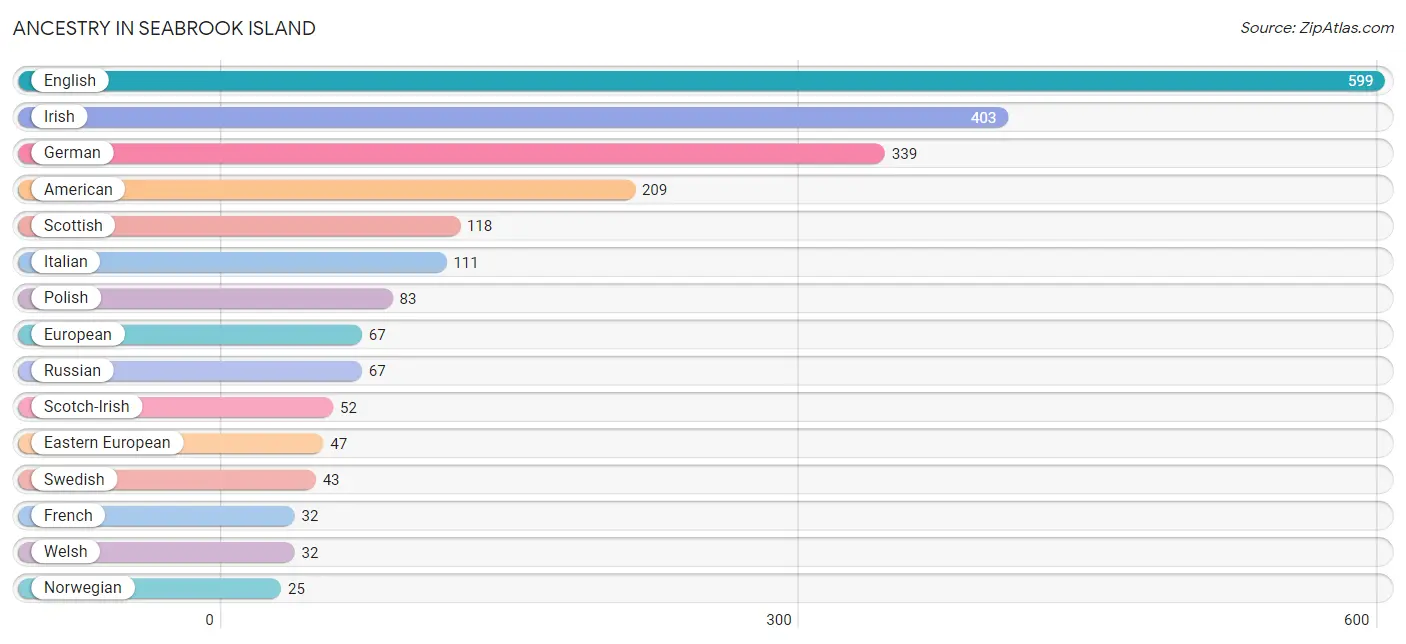
Ancestry in Seabrook Island
The most populous ancestries reported in Seabrook Island are English (599 | 29.0%), Irish (403 | 19.5%), German (339 | 16.4%), American (209 | 10.1%), and Scottish (118 | 5.7%), together accounting for 80.9% of all Seabrook Island residents.
| Ancestry | # Population | % Population |
| American | 209 | 10.1% |
| Arab | 14 | 0.7% |
| Armenian | 6 | 0.3% |
| Austrian | 8 | 0.4% |
| Belgian | 9 | 0.4% |
| Bermudan | 5 | 0.2% |
| British | 22 | 1.1% |
| Canadian | 3 | 0.2% |
| Cherokee | 4 | 0.2% |
| Cuban | 11 | 0.5% |
| Czech | 5 | 0.2% |
| Danish | 15 | 0.7% |
| Dutch | 5 | 0.2% |
| Eastern European | 47 | 2.3% |
| English | 599 | 29.0% |
| European | 67 | 3.3% |
| French | 32 | 1.5% |
| German | 339 | 16.4% |
| Greek | 17 | 0.8% |
| Hungarian | 10 | 0.5% |
| Irish | 403 | 19.5% |
| Italian | 111 | 5.4% |
| Lebanese | 10 | 0.5% |
| Lithuanian | 4 | 0.2% |
| Northern European | 19 | 0.9% |
| Norwegian | 25 | 1.2% |
| Polish | 83 | 4.0% |
| Portuguese | 6 | 0.3% |
| Russian | 67 | 3.3% |
| Scotch-Irish | 52 | 2.5% |
| Scottish | 118 | 5.7% |
| Serbian | 3 | 0.2% |
| Slovak | 16 | 0.8% |
| Spaniard | 3 | 0.2% |
| Spanish | 6 | 0.3% |
| Swedish | 43 | 2.1% |
| Swiss | 18 | 0.9% |
| Syrian | 4 | 0.2% |
| Ukrainian | 10 | 0.5% |
| Welsh | 32 | 1.5% |
| Yugoslavian | 4 | 0.2% | View All 41 Rows |
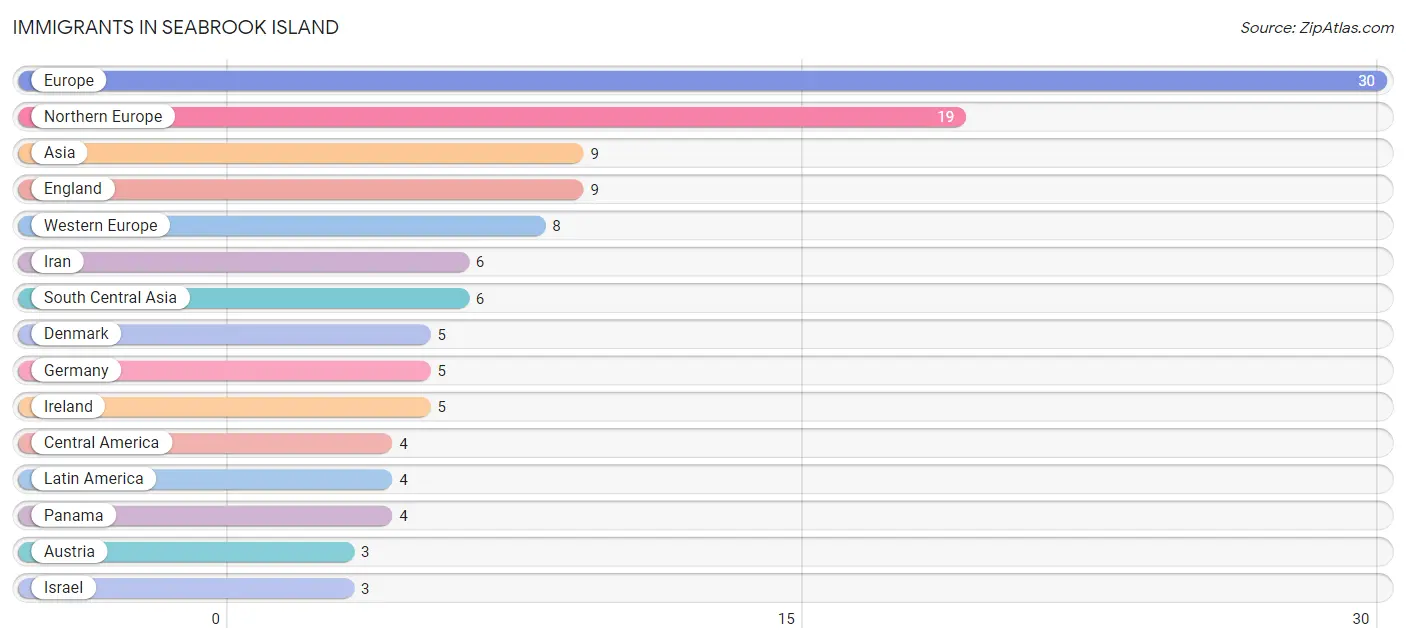
Immigrants in Seabrook Island
The most numerous immigrant groups reported in Seabrook Island came from Europe (30 | 1.5%), Northern Europe (19 | 0.9%), Asia (9 | 0.4%), England (9 | 0.4%), and Western Europe (8 | 0.4%), together accounting for 3.6% of all Seabrook Island residents.
| Immigration Origin | # Population | % Population |
| Asia | 9 | 0.4% |
| Austria | 3 | 0.2% |
| Central America | 4 | 0.2% |
| Denmark | 5 | 0.2% |
| England | 9 | 0.4% |
| Europe | 30 | 1.5% |
| Germany | 5 | 0.2% |
| Iran | 6 | 0.3% |
| Ireland | 5 | 0.2% |
| Israel | 3 | 0.2% |
| Latin America | 4 | 0.2% |
| Northern Europe | 19 | 0.9% |
| Panama | 4 | 0.2% |
| South Central Asia | 6 | 0.3% |
| Southern Europe | 3 | 0.2% |
| Spain | 3 | 0.2% |
| Western Asia | 3 | 0.2% |
| Western Europe | 8 | 0.4% | View All 18 Rows |
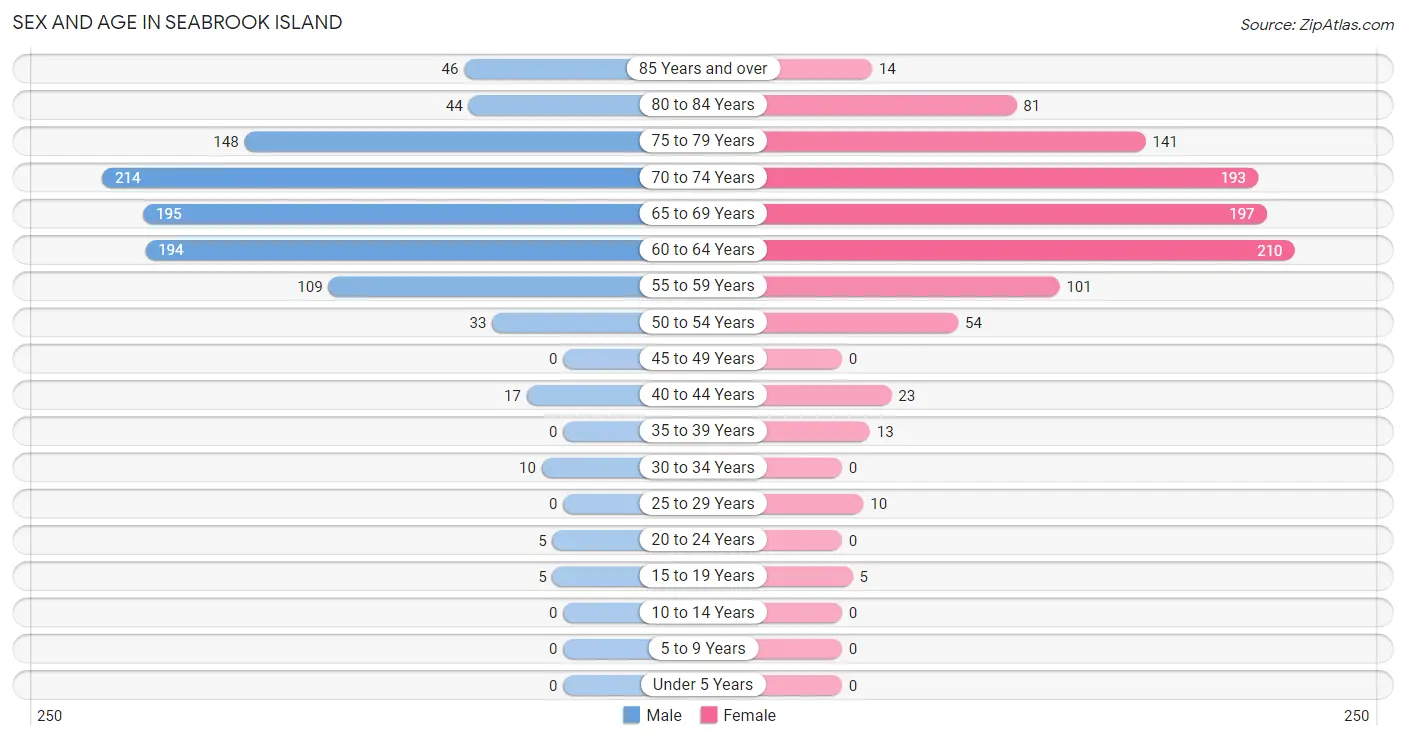
Sex and Age in Seabrook Island
Sex and Age in Seabrook Island
The most populous age groups in Seabrook Island are 70 to 74 Years (214 | 21.0%) for men and 60 to 64 Years (210 | 20.2%) for women.
| Age Bracket | Male | Female |
| Under 5 Years | 0 (0.0%) | 0 (0.0%) |
| 5 to 9 Years | 0 (0.0%) | 0 (0.0%) |
| 10 to 14 Years | 0 (0.0%) | 0 (0.0%) |
| 15 to 19 Years | 5 (0.5%) | 5 (0.5%) |
| 20 to 24 Years | 5 (0.5%) | 0 (0.0%) |
| 25 to 29 Years | 0 (0.0%) | 10 (1.0%) |
| 30 to 34 Years | 10 (1.0%) | 0 (0.0%) |
| 35 to 39 Years | 0 (0.0%) | 13 (1.3%) |
| 40 to 44 Years | 17 (1.7%) | 23 (2.2%) |
| 45 to 49 Years | 0 (0.0%) | 0 (0.0%) |
| 50 to 54 Years | 33 (3.2%) | 54 (5.2%) |
| 55 to 59 Years | 109 (10.7%) | 101 (9.7%) |
| 60 to 64 Years | 194 (19.0%) | 210 (20.2%) |
| 65 to 69 Years | 195 (19.1%) | 197 (18.9%) |
| 70 to 74 Years | 214 (21.0%) | 193 (18.5%) |
| 75 to 79 Years | 148 (14.5%) | 141 (13.5%) |
| 80 to 84 Years | 44 (4.3%) | 81 (7.8%) |
| 85 Years and over | 46 (4.5%) | 14 (1.3%) |
| Total | 1,020 (100.0%) | 1,042 (100.0%) |
Families and Households in Seabrook Island
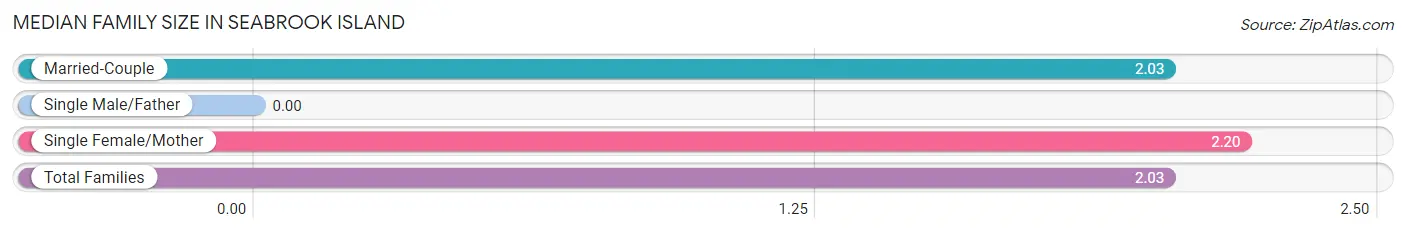
Median Family Size in Seabrook Island
| Family Type | # Families | Family Size |
| Married-Couple | 834 (99.4%) | 2.03 |
| Single Male/Father | 0 (0.0%) | - |
| Single Female/Mother | 5 (0.6%) | 2.20 |
| Total Families | 839 (100.0%) | 2.03 |
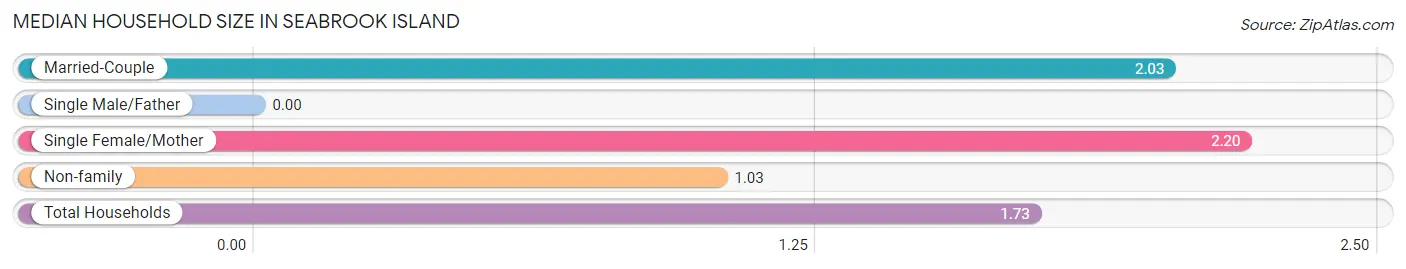
Median Household Size in Seabrook Island
| Household Type | # Households | Household Size |
| Married-Couple | 834 (70.0%) | 2.03 |
| Single Male/Father | 0 (0.0%) | - |
| Single Female/Mother | 5 (0.4%) | 2.20 |
| Non-family | 353 (29.6%) | 1.03 |
| Total Households | 1,192 (100.0%) | 1.73 |
Household Size by Marriage Status in Seabrook Island
Out of a total of 1,192 households in Seabrook Island, 839 (70.4%) are family households, while 353 (29.6%) are nonfamily households. The most numerous type of family households are 2-person households, comprising 826, and the most common type of nonfamily households are 1-person households, comprising 344.
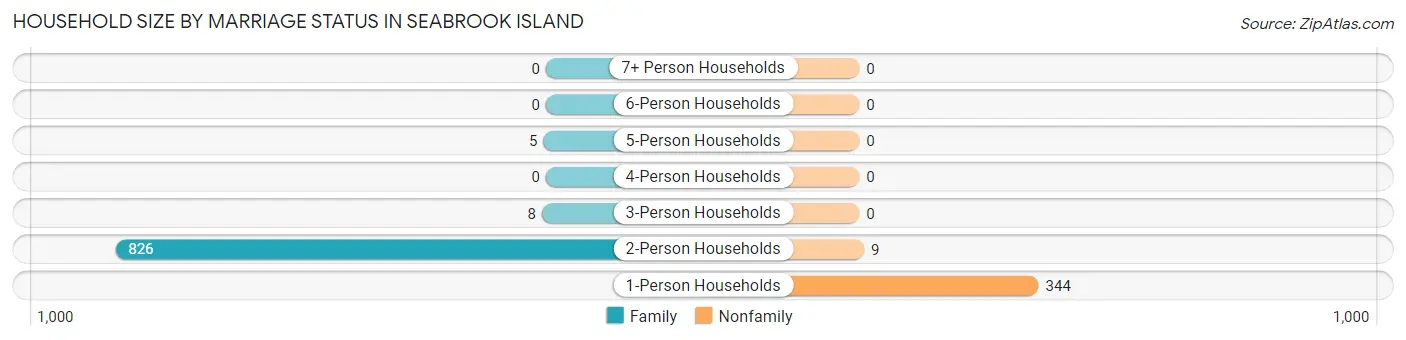
| Household Size | Family Households | Nonfamily Households |
| 1-Person Households | - | 344 (28.9%) |
| 2-Person Households | 826 (69.3%) | 9 (0.8%) |
| 3-Person Households | 8 (0.7%) | 0 (0.0%) |
| 4-Person Households | 0 (0.0%) | 0 (0.0%) |
| 5-Person Households | 5 (0.4%) | 0 (0.0%) |
| 6-Person Households | 0 (0.0%) | 0 (0.0%) |
| 7+ Person Households | 0 (0.0%) | 0 (0.0%) |
| Total | 839 (70.4%) | 353 (29.6%) |
Female Fertility in Seabrook Island
Fertility by Age in Seabrook Island
| Age Bracket | Women with Births | Births / 1,000 Women |
| 15 to 19 years | 0 (0.0%) | 0.0 |
| 20 to 34 years | 0 (0.0%) | 0.0 |
| 35 to 50 years | 0 (0.0%) | 0.0 |
| Total | 0 (0.0%) | 0.0 |
Fertility by Age by Marriage Status in Seabrook Island
| Age Bracket | Married | Unmarried |
| 15 to 19 years | 0 (0.0%) | 0 (0.0%) |
| 20 to 34 years | 0 (0.0%) | 0 (0.0%) |
| 35 to 50 years | 0 (0.0%) | 0 (0.0%) |
| Total | 0 (0.0%) | 0 (0.0%) |
Fertility by Education in Seabrook Island
| Educational Attainment | Women with Births | Births / 1,000 Women |
| Less than High School | 0 (0.0%) | 0.0 |
| High School Diploma | 0 (0.0%) | 0.0 |
| College or Associate's Degree | 0 (0.0%) | 0.0 |
| Bachelor's Degree | 0 (0.0%) | 0.0 |
| Graduate Degree | 0 (0.0%) | 0.0 |
| Total | 0 (0.0%) | 0.0 |
Fertility by Education by Marriage Status in Seabrook Island
| Educational Attainment | Married | Unmarried |
| Less than High School | 0 (0.0%) | 0 (0.0%) |
| High School Diploma | 0 (0.0%) | 0 (0.0%) |
| College or Associate's Degree | 0 (0.0%) | 0 (0.0%) |
| Bachelor's Degree | 0 (0.0%) | 0 (0.0%) |
| Graduate Degree | 0 (0.0%) | 0 (0.0%) |
| Total | 0 (0.0%) | 0 (0.0%) |
Employment Characteristics in Seabrook Island
Employment by Class of Employer in Seabrook Island
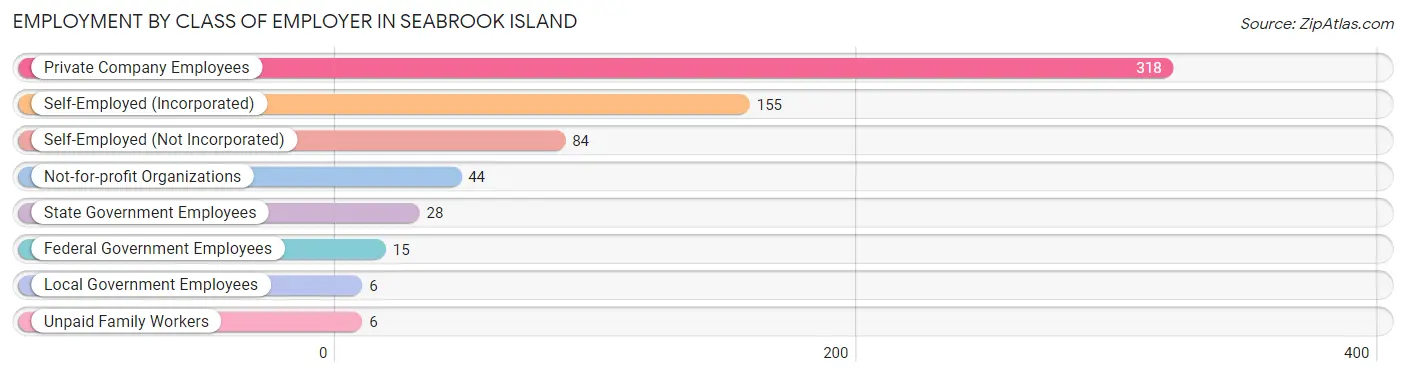
Among the 656 employed individuals in Seabrook Island, private company employees (318 | 48.5%), self-employed (incorporated) (155 | 23.6%), and self-employed (not incorporated) (84 | 12.8%) make up the most common classes of employment.
| Employer Class | # Employees | % Employees |
| Private Company Employees | 318 | 48.5% |
| Self-Employed (Incorporated) | 155 | 23.6% |
| Self-Employed (Not Incorporated) | 84 | 12.8% |
| Not-for-profit Organizations | 44 | 6.7% |
| Local Government Employees | 6 | 0.9% |
| State Government Employees | 28 | 4.3% |
| Federal Government Employees | 15 | 2.3% |
| Unpaid Family Workers | 6 | 0.9% |
| Total | 656 | 100.0% |
Employment Status by Age in Seabrook Island
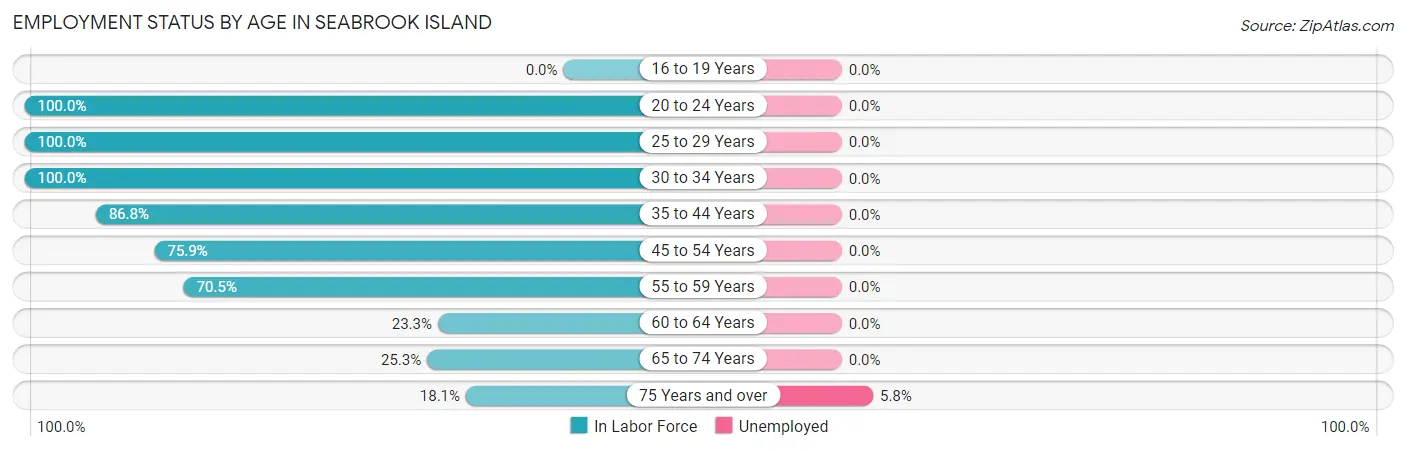
According to the labor force statistics for Seabrook Island, out of the total population over 16 years of age (2,057), 32.4% or 666 individuals are in the labor force, with 0.7% or 5 of them unemployed. The age group with the highest labor force participation rate is 20 to 24 years, with 100.0% or 5 individuals in the labor force. Within the labor force, the 75 years and over age range has the highest percentage of unemployed individuals, with 5.8% or 5 of them being unemployed.
| Age Bracket | In Labor Force | Unemployed |
| 16 to 19 Years | 0 (0.0%) | 0 (0.0%) |
| 20 to 24 Years | 5 (100.0%) | 0 (0.0%) |
| 25 to 29 Years | 10 (100.0%) | 0 (0.0%) |
| 30 to 34 Years | 10 (100.0%) | 0 (0.0%) |
| 35 to 44 Years | 46 (86.8%) | 0 (0.0%) |
| 45 to 54 Years | 66 (75.9%) | 0 (0.0%) |
| 55 to 59 Years | 148 (70.5%) | 0 (0.0%) |
| 60 to 64 Years | 94 (23.3%) | 0 (0.0%) |
| 65 to 74 Years | 202 (25.3%) | 0 (0.0%) |
| 75 Years and over | 86 (18.1%) | 5 (5.8%) |
| Total | 666 (32.4%) | 5 (0.7%) |
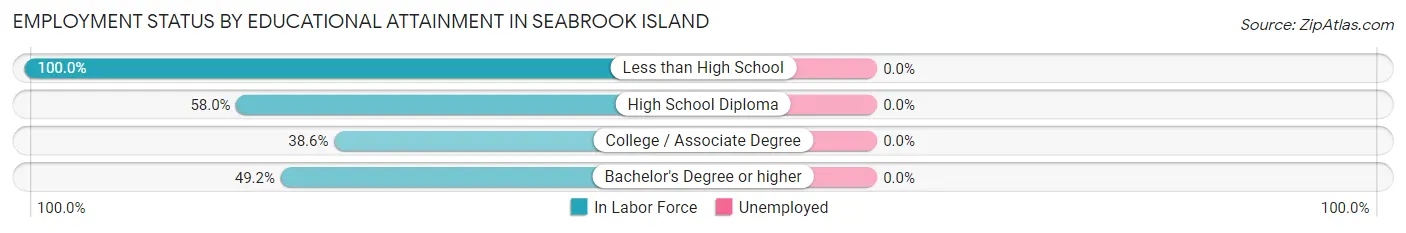
Employment Status by Educational Attainment in Seabrook Island
| Educational Attainment | In Labor Force | Unemployed |
| Less than High School | 10 (100.0%) | 0 (0.0%) |
| High School Diploma | 29 (58.0%) | 0 (0.0%) |
| College / Associate Degree | 59 (38.6%) | 0 (0.0%) |
| Bachelor's Degree or higher | 276 (49.2%) | 0 (0.0%) |
| Total | 374 (48.3%) | 0 (0.0%) |
Employment Occupations by Sex in Seabrook Island
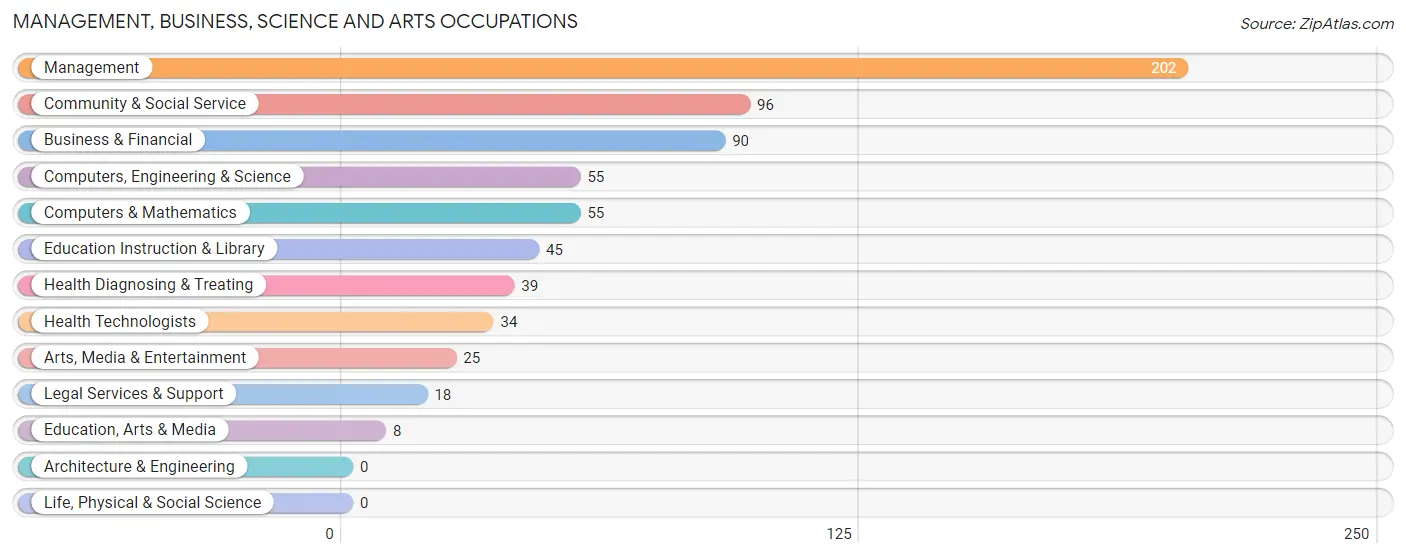
Management, Business, Science and Arts Occupations
The most common Management, Business, Science and Arts occupations in Seabrook Island are Management (202 | 30.5%), Community & Social Service (96 | 14.5%), Business & Financial (90 | 13.6%), Computers, Engineering & Science (55 | 8.3%), and Computers & Mathematics (55 | 8.3%).
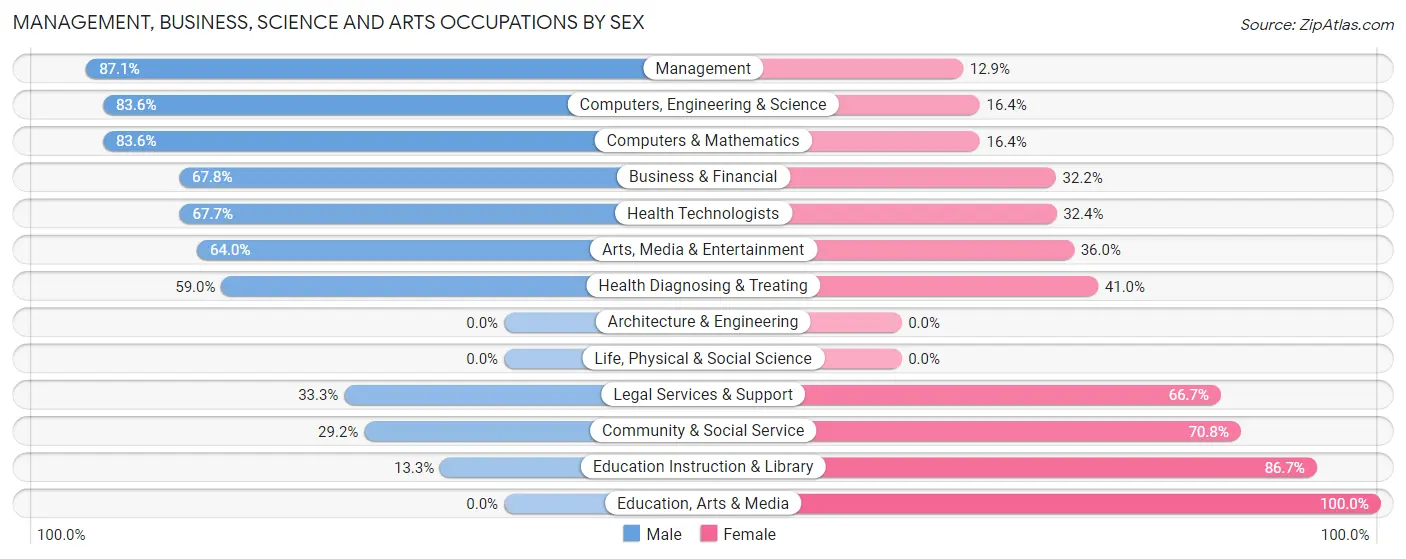
Management, Business, Science and Arts Occupations by Sex
Within the Management, Business, Science and Arts occupations in Seabrook Island, the most male-oriented occupations are Management (87.1%), Computers, Engineering & Science (83.6%), and Computers & Mathematics (83.6%), while the most female-oriented occupations are Education, Arts & Media (100.0%), Education Instruction & Library (86.7%), and Community & Social Service (70.8%).
| Occupation | Male | Female |
| Management | 176 (87.1%) | 26 (12.9%) |
| Business & Financial | 61 (67.8%) | 29 (32.2%) |
| Computers, Engineering & Science | 46 (83.6%) | 9 (16.4%) |
| Computers & Mathematics | 46 (83.6%) | 9 (16.4%) |
| Architecture & Engineering | 0 (0.0%) | 0 (0.0%) |
| Life, Physical & Social Science | 0 (0.0%) | 0 (0.0%) |
| Community & Social Service | 28 (29.2%) | 68 (70.8%) |
| Education, Arts & Media | 0 (0.0%) | 8 (100.0%) |
| Legal Services & Support | 6 (33.3%) | 12 (66.7%) |
| Education Instruction & Library | 6 (13.3%) | 39 (86.7%) |
| Arts, Media & Entertainment | 16 (64.0%) | 9 (36.0%) |
| Health Diagnosing & Treating | 23 (59.0%) | 16 (41.0%) |
| Health Technologists | 23 (67.6%) | 11 (32.4%) |
| Total (Category) | 334 (69.3%) | 148 (30.7%) |
| Total (Overall) | 406 (61.3%) | 256 (38.7%) |
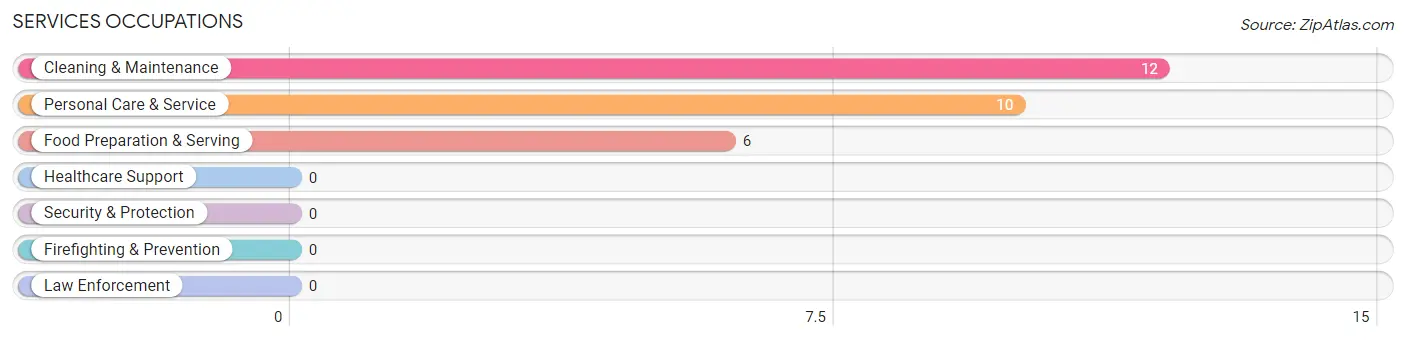
Services Occupations
The most common Services occupations in Seabrook Island are Cleaning & Maintenance (12 | 1.8%), Personal Care & Service (10 | 1.5%), and Food Preparation & Serving (6 | 0.9%).
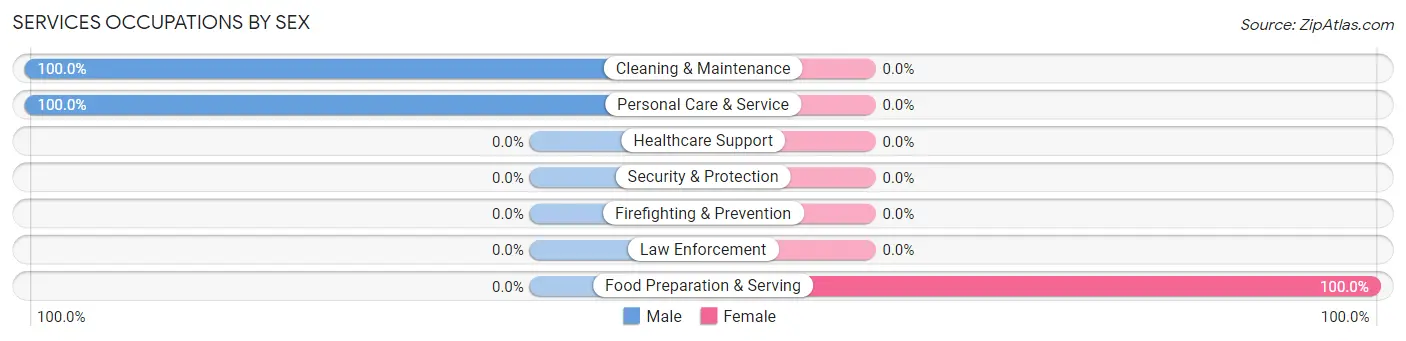
Services Occupations by Sex
| Occupation | Male | Female |
| Healthcare Support | 0 (0.0%) | 0 (0.0%) |
| Security & Protection | 0 (0.0%) | 0 (0.0%) |
| Firefighting & Prevention | 0 (0.0%) | 0 (0.0%) |
| Law Enforcement | 0 (0.0%) | 0 (0.0%) |
| Food Preparation & Serving | 0 (0.0%) | 6 (100.0%) |
| Cleaning & Maintenance | 12 (100.0%) | 0 (0.0%) |
| Personal Care & Service | 10 (100.0%) | 0 (0.0%) |
| Total (Category) | 22 (78.6%) | 6 (21.4%) |
| Total (Overall) | 406 (61.3%) | 256 (38.7%) |
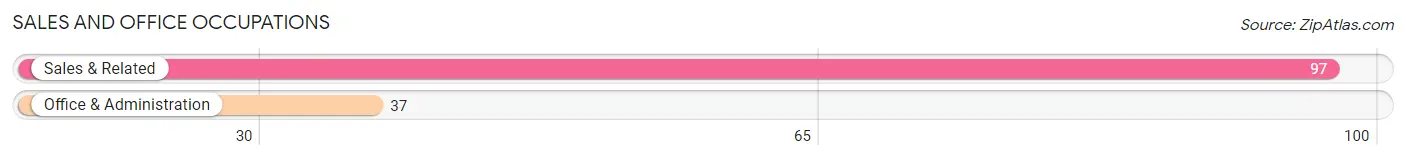
Sales and Office Occupations
The most common Sales and Office occupations in Seabrook Island are Sales & Related (97 | 14.6%), and Office & Administration (37 | 5.6%).
Sales and Office Occupations by Sex
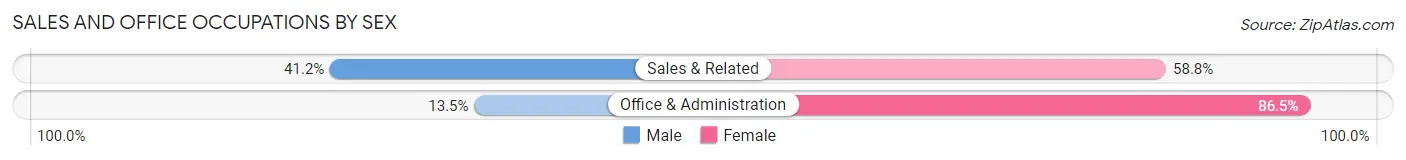
| Occupation | Male | Female |
| Sales & Related | 40 (41.2%) | 57 (58.8%) |
| Office & Administration | 5 (13.5%) | 32 (86.5%) |
| Total (Category) | 45 (33.6%) | 89 (66.4%) |
| Total (Overall) | 406 (61.3%) | 256 (38.7%) |
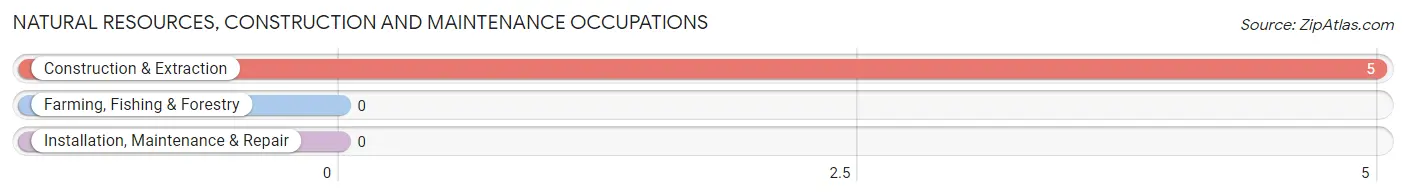
Natural Resources, Construction and Maintenance Occupations
The most common Natural Resources, Construction and Maintenance occupations in Seabrook Island are , and Construction & Extraction (5 | 0.8%).
Natural Resources, Construction and Maintenance Occupations by Sex
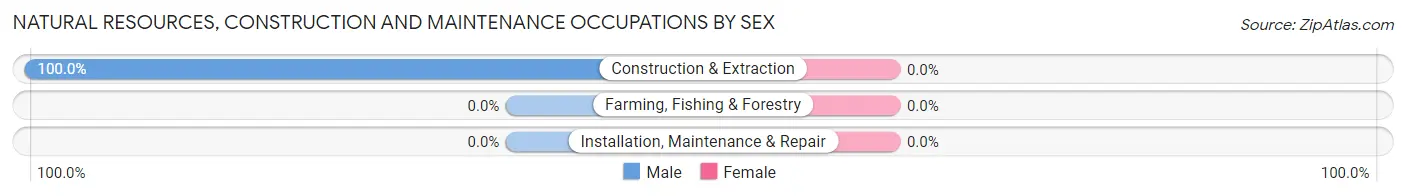
| Occupation | Male | Female |
| Farming, Fishing & Forestry | 0 (0.0%) | 0 (0.0%) |
| Construction & Extraction | 5 (100.0%) | 0 (0.0%) |
| Installation, Maintenance & Repair | 0 (0.0%) | 0 (0.0%) |
| Total (Category) | 5 (100.0%) | 0 (0.0%) |
| Total (Overall) | 406 (61.3%) | 256 (38.7%) |
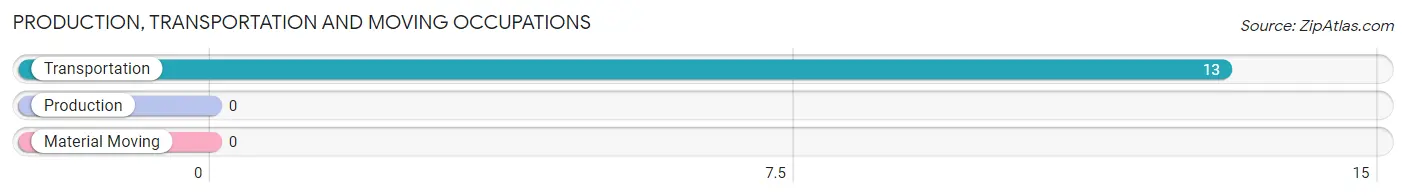
Production, Transportation and Moving Occupations
The most common Production, Transportation and Moving occupations in Seabrook Island are , and Transportation (13 | 2.0%).
Production, Transportation and Moving Occupations by Sex
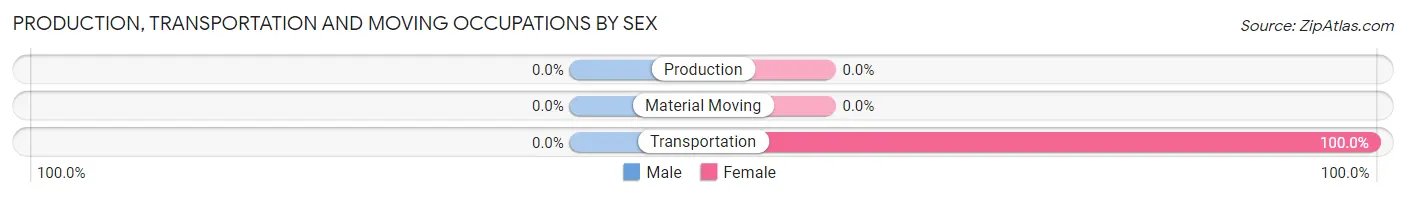
| Occupation | Male | Female |
| Production | 0 (0.0%) | 0 (0.0%) |
| Transportation | 0 (0.0%) | 13 (100.0%) |
| Material Moving | 0 (0.0%) | 0 (0.0%) |
| Total (Category) | 0 (0.0%) | 13 (100.0%) |
| Total (Overall) | 406 (61.3%) | 256 (38.7%) |
Employment Industries by Sex in Seabrook Island
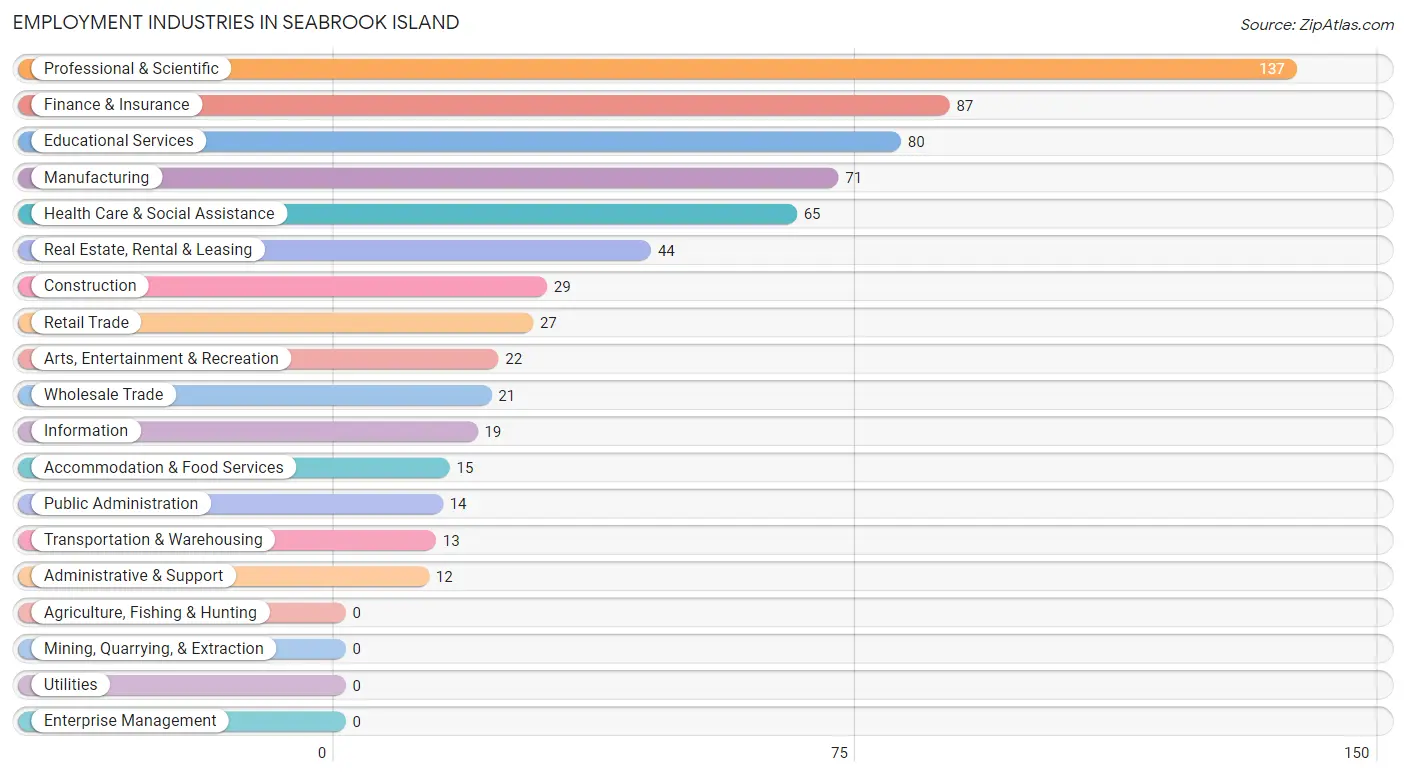
Employment Industries in Seabrook Island
The major employment industries in Seabrook Island include Professional & Scientific (137 | 20.7%), Finance & Insurance (87 | 13.1%), Educational Services (80 | 12.1%), Manufacturing (71 | 10.7%), and Health Care & Social Assistance (65 | 9.8%).
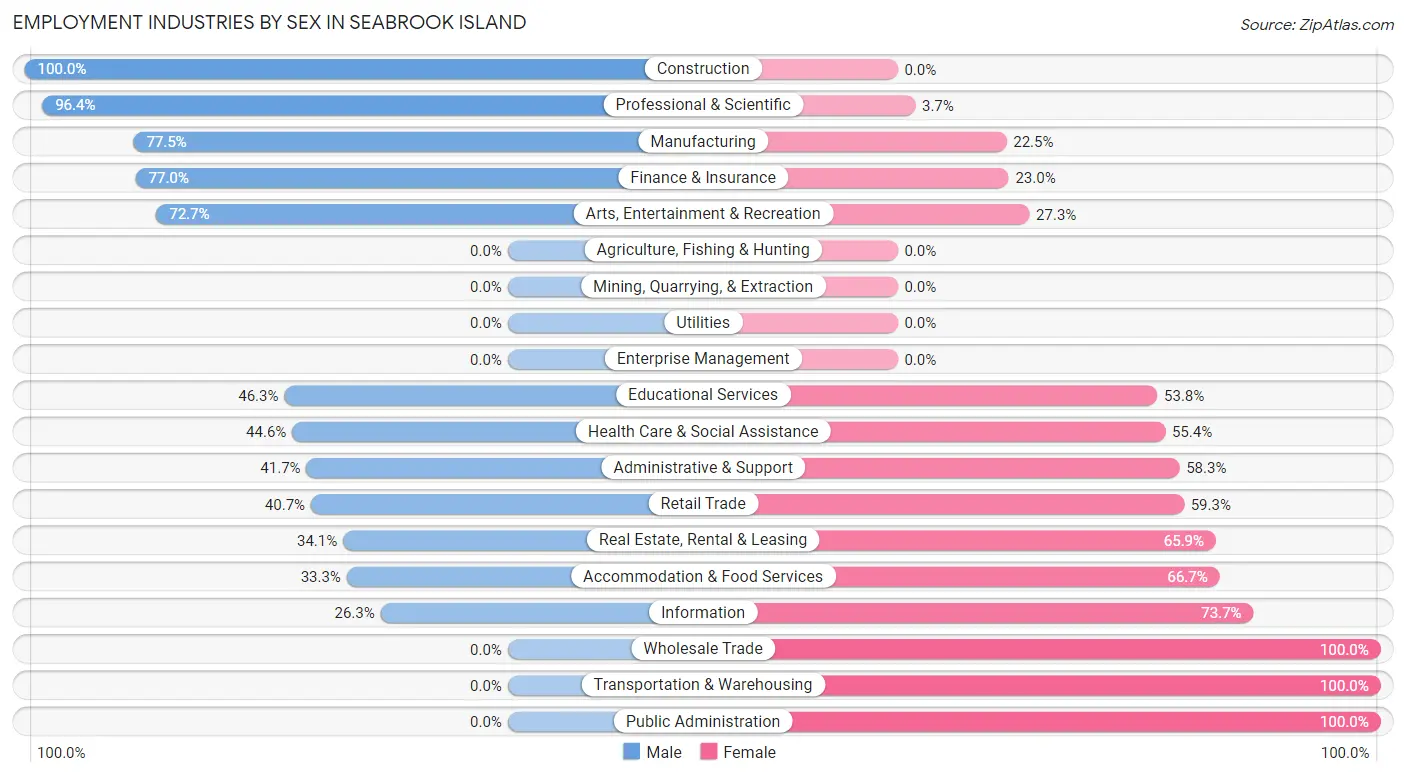
Employment Industries by Sex in Seabrook Island
The Seabrook Island industries that see more men than women are Construction (100.0%), Professional & Scientific (96.4%), and Manufacturing (77.5%), whereas the industries that tend to have a higher number of women are Wholesale Trade (100.0%), Transportation & Warehousing (100.0%), and Public Administration (100.0%).
| Industry | Male | Female |
| Agriculture, Fishing & Hunting | 0 (0.0%) | 0 (0.0%) |
| Mining, Quarrying, & Extraction | 0 (0.0%) | 0 (0.0%) |
| Construction | 29 (100.0%) | 0 (0.0%) |
| Manufacturing | 55 (77.5%) | 16 (22.5%) |
| Wholesale Trade | 0 (0.0%) | 21 (100.0%) |
| Retail Trade | 11 (40.7%) | 16 (59.3%) |
| Transportation & Warehousing | 0 (0.0%) | 13 (100.0%) |
| Utilities | 0 (0.0%) | 0 (0.0%) |
| Information | 5 (26.3%) | 14 (73.7%) |
| Finance & Insurance | 67 (77.0%) | 20 (23.0%) |
| Real Estate, Rental & Leasing | 15 (34.1%) | 29 (65.9%) |
| Professional & Scientific | 132 (96.4%) | 5 (3.6%) |
| Enterprise Management | 0 (0.0%) | 0 (0.0%) |
| Administrative & Support | 5 (41.7%) | 7 (58.3%) |
| Educational Services | 37 (46.3%) | 43 (53.7%) |
| Health Care & Social Assistance | 29 (44.6%) | 36 (55.4%) |
| Arts, Entertainment & Recreation | 16 (72.7%) | 6 (27.3%) |
| Accommodation & Food Services | 5 (33.3%) | 10 (66.7%) |
| Public Administration | 0 (0.0%) | 14 (100.0%) |
| Total | 406 (61.3%) | 256 (38.7%) |
Education in Seabrook Island
School Enrollment in Seabrook Island
The most common levels of schooling among the 44 students in Seabrook Island are college / undergraduate (25 | 56.8%), high school (14 | 31.8%), and graduate / professional (5 | 11.4%).
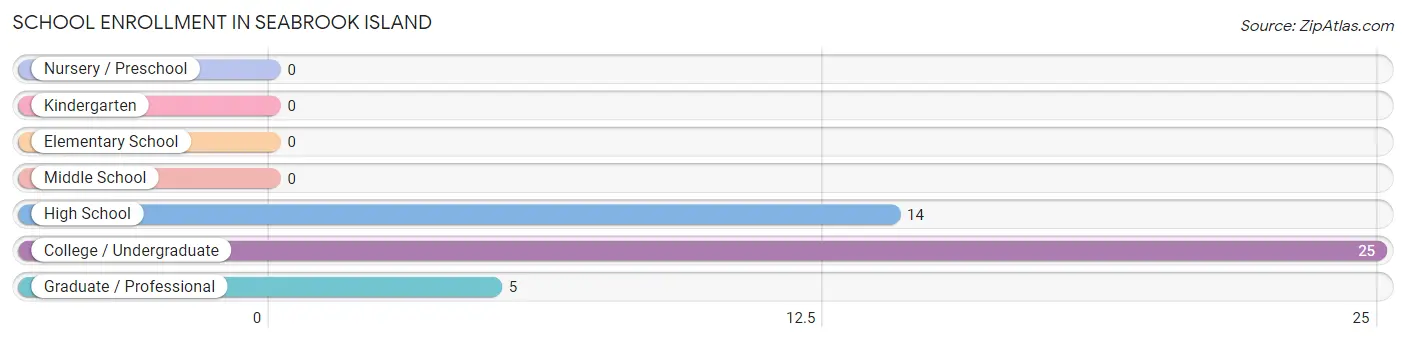
| School Level | # Students | % Students |
| Nursery / Preschool | 0 | 0.0% |
| Kindergarten | 0 | 0.0% |
| Elementary School | 0 | 0.0% |
| Middle School | 0 | 0.0% |
| High School | 14 | 31.8% |
| College / Undergraduate | 25 | 56.8% |
| Graduate / Professional | 5 | 11.4% |
| Total | 44 | 100.0% |
School Enrollment by Age by Funding Source in Seabrook Island
Out of a total of 44 students who are enrolled in schools in Seabrook Island, 17 (38.6%) attend a private institution, while the remaining 27 (61.4%) are enrolled in public schools. The age group of 15 to 17 year olds has the highest likelihood of being enrolled in private schools, with 10 (100.0% in the age bracket) enrolled. Conversely, the age group of 20 to 24 year olds has the lowest likelihood of being enrolled in a private school, with 5 (100.0% in the age bracket) attending a public institution.
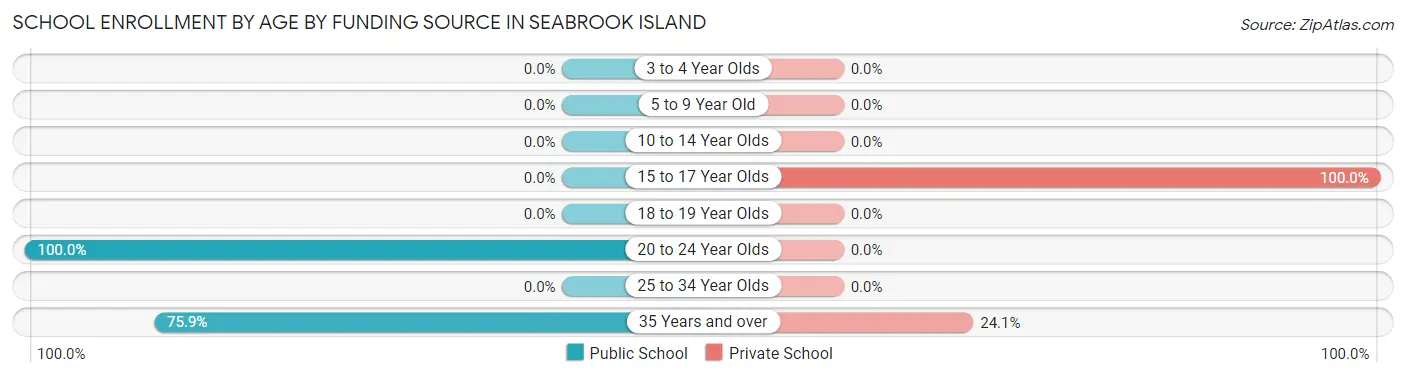
| Age Bracket | Public School | Private School |
| 3 to 4 Year Olds | 0 (0.0%) | 0 (0.0%) |
| 5 to 9 Year Old | 0 (0.0%) | 0 (0.0%) |
| 10 to 14 Year Olds | 0 (0.0%) | 0 (0.0%) |
| 15 to 17 Year Olds | 0 (0.0%) | 10 (100.0%) |
| 18 to 19 Year Olds | 0 (0.0%) | 0 (0.0%) |
| 20 to 24 Year Olds | 5 (100.0%) | 0 (0.0%) |
| 25 to 34 Year Olds | 0 (0.0%) | 0 (0.0%) |
| 35 Years and over | 22 (75.9%) | 7 (24.1%) |
| Total | 27 (61.4%) | 17 (38.6%) |
Educational Attainment by Field of Study in Seabrook Island
Business (395 | 21.8%), social sciences (272 | 15.0%), education (242 | 13.4%), engineering (167 | 9.2%), and science & technology (148 | 8.2%) are the most common fields of study among 1,810 individuals in Seabrook Island who have obtained a bachelor's degree or higher.
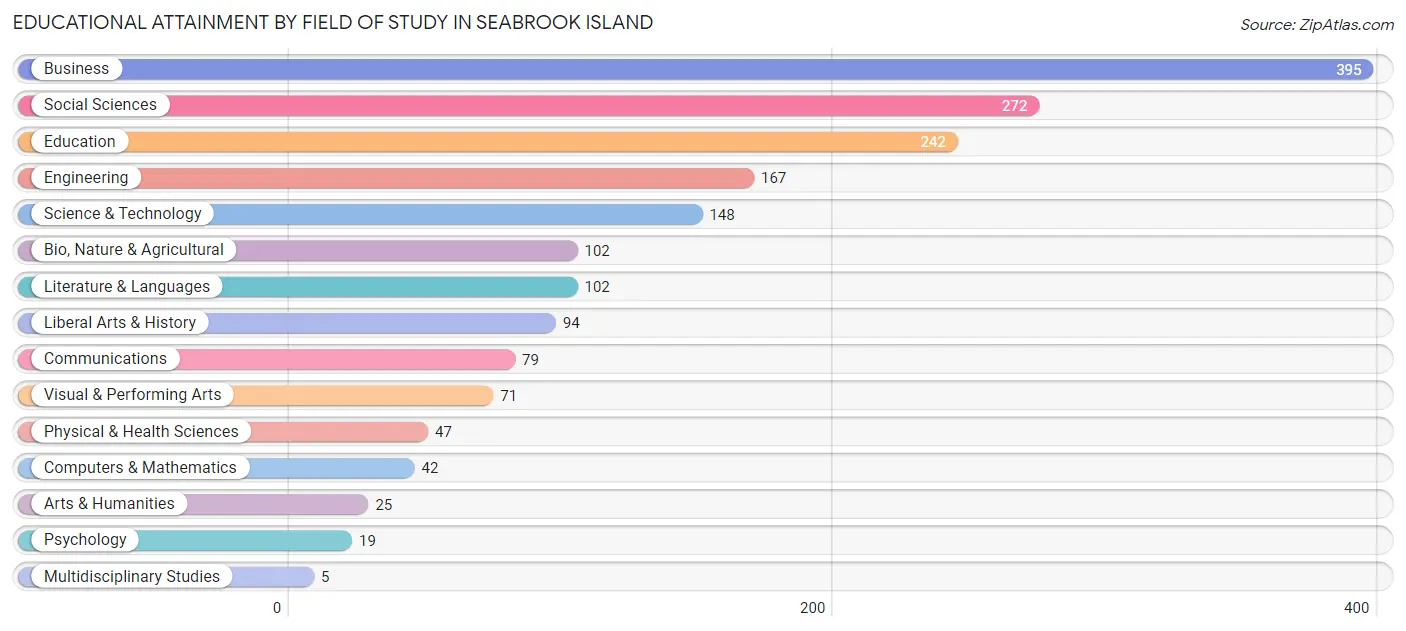
| Field of Study | # Graduates | % Graduates |
| Computers & Mathematics | 42 | 2.3% |
| Bio, Nature & Agricultural | 102 | 5.6% |
| Physical & Health Sciences | 47 | 2.6% |
| Psychology | 19 | 1.1% |
| Social Sciences | 272 | 15.0% |
| Engineering | 167 | 9.2% |
| Multidisciplinary Studies | 5 | 0.3% |
| Science & Technology | 148 | 8.2% |
| Business | 395 | 21.8% |
| Education | 242 | 13.4% |
| Literature & Languages | 102 | 5.6% |
| Liberal Arts & History | 94 | 5.2% |
| Visual & Performing Arts | 71 | 3.9% |
| Communications | 79 | 4.4% |
| Arts & Humanities | 25 | 1.4% |
| Total | 1,810 | 100.0% |
Transportation & Commute in Seabrook Island
Vehicle Availability by Sex in Seabrook Island
The most prevalent vehicle ownership categories in Seabrook Island are males with 2 vehicles (226, accounting for 55.7%) and females with 2 vehicles (174, making up 90.4%).
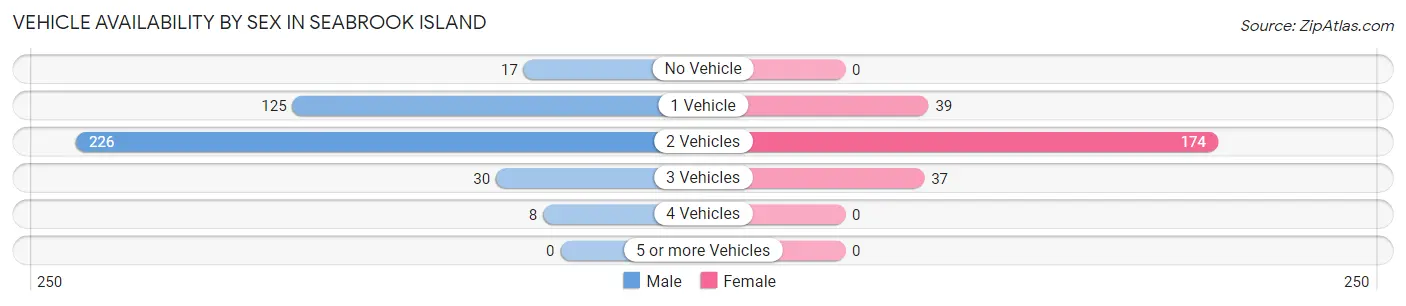
| Vehicles Available | Male | Female |
| No Vehicle | 17 (4.2%) | 0 (0.0%) |
| 1 Vehicle | 125 (30.8%) | 39 (15.6%) |
| 2 Vehicles | 226 (55.7%) | 174 (69.6%) |
| 3 Vehicles | 30 (7.4%) | 37 (14.8%) |
| 4 Vehicles | 8 (2.0%) | 0 (0.0%) |
| 5 or more Vehicles | 0 (0.0%) | 0 (0.0%) |
| Total | 406 (100.0%) | 250 (100.0%) |
Commute Time in Seabrook Island
The most frequently occuring commute durations in Seabrook Island are 45 to 59 minutes (86 commuters, 22.1%), 5 to 9 minutes (68 commuters, 17.4%), and 10 to 14 minutes (57 commuters, 14.6%).
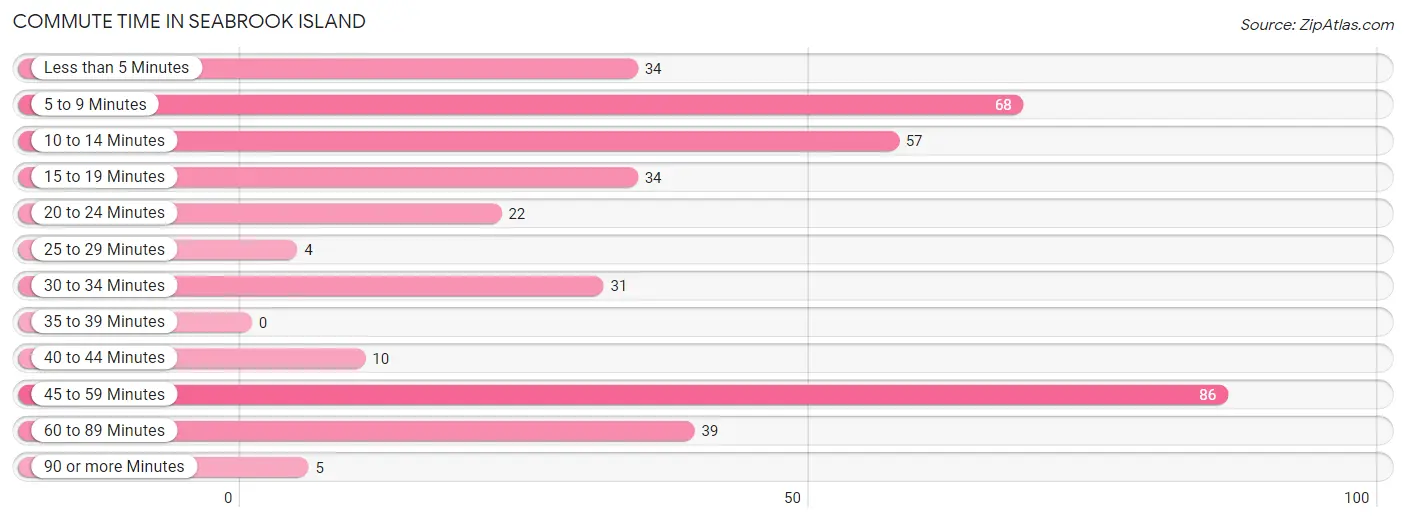
| Commute Time | # Commuters | % Commuters |
| Less than 5 Minutes | 34 | 8.7% |
| 5 to 9 Minutes | 68 | 17.4% |
| 10 to 14 Minutes | 57 | 14.6% |
| 15 to 19 Minutes | 34 | 8.7% |
| 20 to 24 Minutes | 22 | 5.6% |
| 25 to 29 Minutes | 4 | 1.0% |
| 30 to 34 Minutes | 31 | 8.0% |
| 35 to 39 Minutes | 0 | 0.0% |
| 40 to 44 Minutes | 10 | 2.6% |
| 45 to 59 Minutes | 86 | 22.1% |
| 60 to 89 Minutes | 39 | 10.0% |
| 90 or more Minutes | 5 | 1.3% |
Commute Time by Sex in Seabrook Island
The most common commute times in Seabrook Island are 45 to 59 minutes (75 commuters, 30.1%) for males and 5 to 9 minutes (35 commuters, 24.8%) for females.
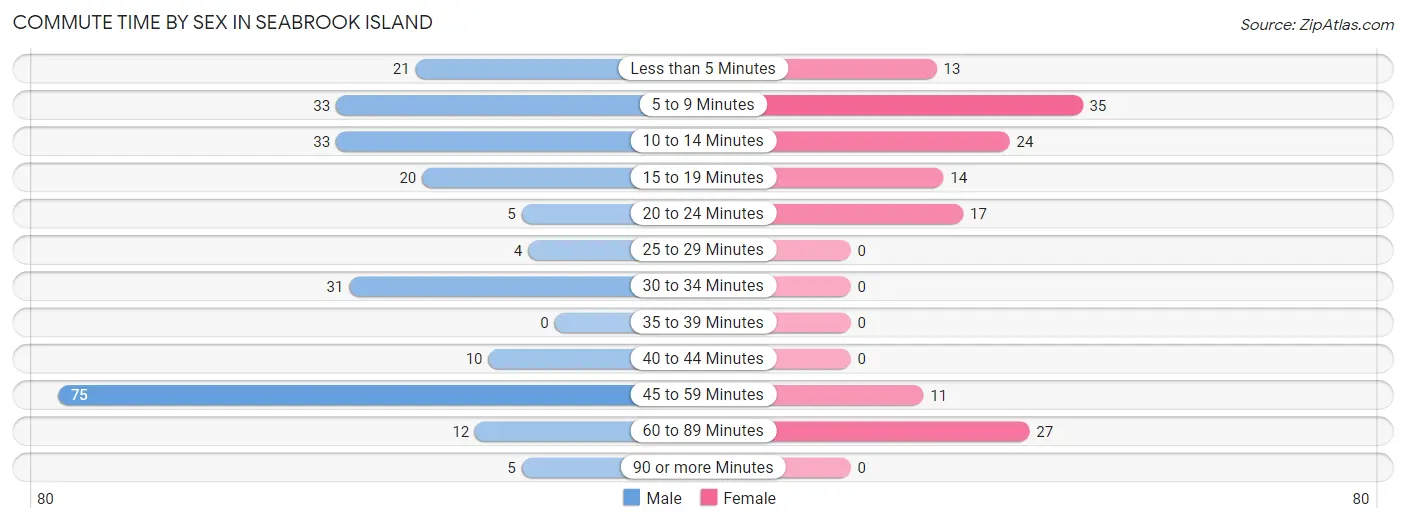
| Commute Time | Male | Female |
| Less than 5 Minutes | 21 (8.4%) | 13 (9.2%) |
| 5 to 9 Minutes | 33 (13.3%) | 35 (24.8%) |
| 10 to 14 Minutes | 33 (13.3%) | 24 (17.0%) |
| 15 to 19 Minutes | 20 (8.0%) | 14 (9.9%) |
| 20 to 24 Minutes | 5 (2.0%) | 17 (12.1%) |
| 25 to 29 Minutes | 4 (1.6%) | 0 (0.0%) |
| 30 to 34 Minutes | 31 (12.4%) | 0 (0.0%) |
| 35 to 39 Minutes | 0 (0.0%) | 0 (0.0%) |
| 40 to 44 Minutes | 10 (4.0%) | 0 (0.0%) |
| 45 to 59 Minutes | 75 (30.1%) | 11 (7.8%) |
| 60 to 89 Minutes | 12 (4.8%) | 27 (19.2%) |
| 90 or more Minutes | 5 (2.0%) | 0 (0.0%) |
Time of Departure to Work by Sex in Seabrook Island
The most frequent times of departure to work in Seabrook Island are 10:00 AM to 10:59 AM (58, 23.3%) for males and 7:00 AM to 7:29 AM (33, 23.4%) for females.
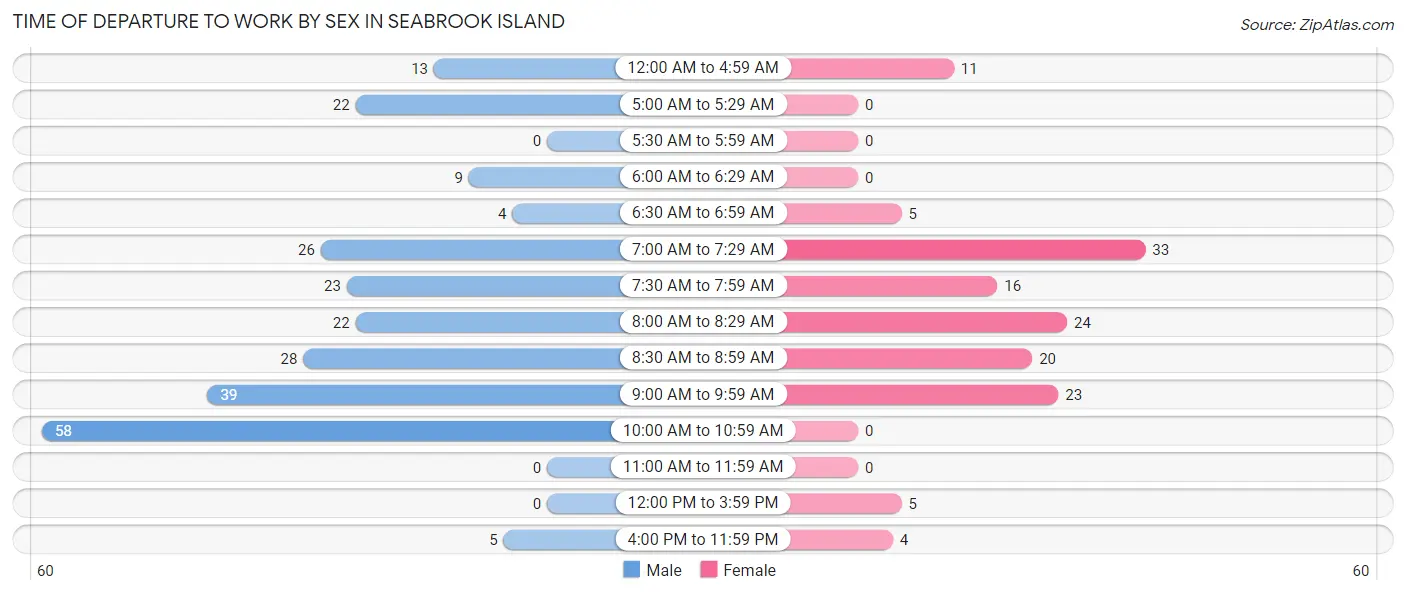
| Time of Departure | Male | Female |
| 12:00 AM to 4:59 AM | 13 (5.2%) | 11 (7.8%) |
| 5:00 AM to 5:29 AM | 22 (8.8%) | 0 (0.0%) |
| 5:30 AM to 5:59 AM | 0 (0.0%) | 0 (0.0%) |
| 6:00 AM to 6:29 AM | 9 (3.6%) | 0 (0.0%) |
| 6:30 AM to 6:59 AM | 4 (1.6%) | 5 (3.5%) |
| 7:00 AM to 7:29 AM | 26 (10.4%) | 33 (23.4%) |
| 7:30 AM to 7:59 AM | 23 (9.2%) | 16 (11.4%) |
| 8:00 AM to 8:29 AM | 22 (8.8%) | 24 (17.0%) |
| 8:30 AM to 8:59 AM | 28 (11.2%) | 20 (14.2%) |
| 9:00 AM to 9:59 AM | 39 (15.7%) | 23 (16.3%) |
| 10:00 AM to 10:59 AM | 58 (23.3%) | 0 (0.0%) |
| 11:00 AM to 11:59 AM | 0 (0.0%) | 0 (0.0%) |
| 12:00 PM to 3:59 PM | 0 (0.0%) | 5 (3.5%) |
| 4:00 PM to 11:59 PM | 5 (2.0%) | 4 (2.8%) |
| Total | 249 (100.0%) | 141 (100.0%) |
Housing Occupancy in Seabrook Island
Occupancy by Ownership in Seabrook Island
Of the total 1,192 dwellings in Seabrook Island, owner-occupied units account for 1,121 (94.0%), while renter-occupied units make up 71 (6.0%).
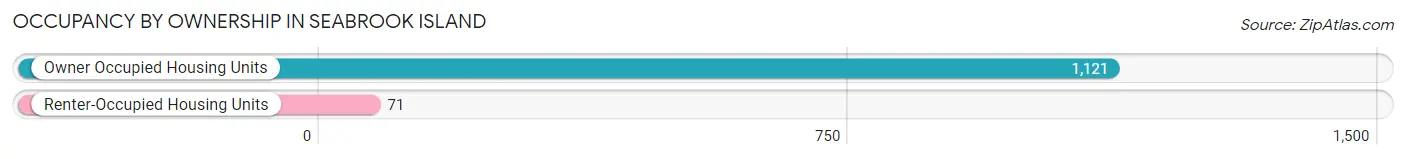
| Occupancy | # Housing Units | % Housing Units |
| Owner Occupied Housing Units | 1,121 | 94.0% |
| Renter-Occupied Housing Units | 71 | 6.0% |
| Total Occupied Housing Units | 1,192 | 100.0% |
Occupancy by Household Size in Seabrook Island
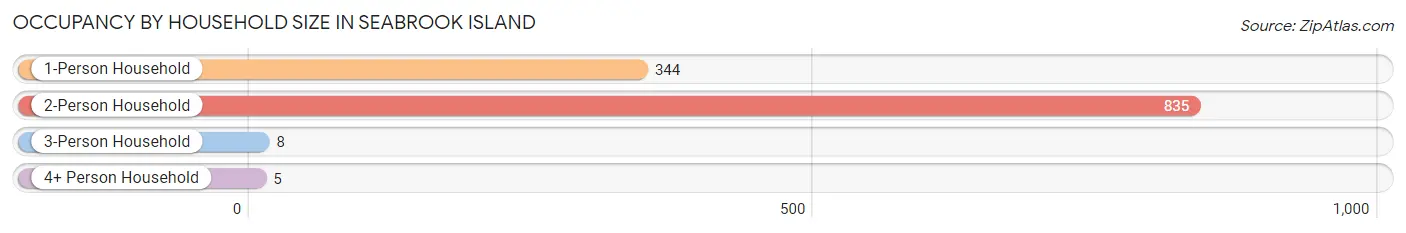
| Household Size | # Housing Units | % Housing Units |
| 1-Person Household | 344 | 28.9% |
| 2-Person Household | 835 | 70.1% |
| 3-Person Household | 8 | 0.7% |
| 4+ Person Household | 5 | 0.4% |
| Total Housing Units | 1,192 | 100.0% |
Occupancy by Ownership by Household Size in Seabrook Island
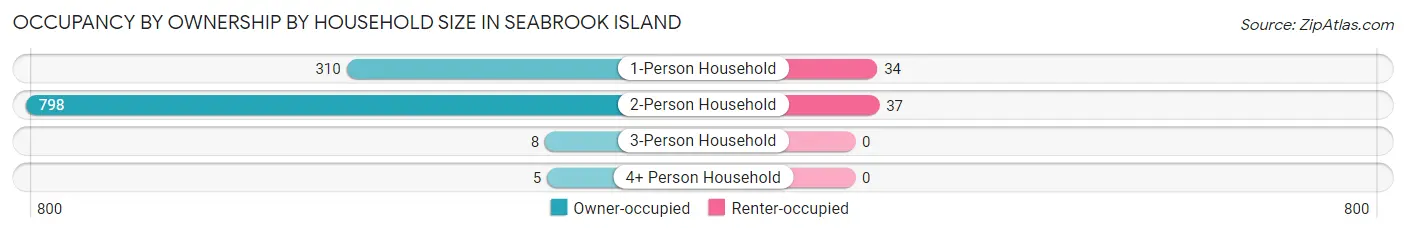
| Household Size | Owner-occupied | Renter-occupied |
| 1-Person Household | 310 (90.1%) | 34 (9.9%) |
| 2-Person Household | 798 (95.6%) | 37 (4.4%) |
| 3-Person Household | 8 (100.0%) | 0 (0.0%) |
| 4+ Person Household | 5 (100.0%) | 0 (0.0%) |
| Total Housing Units | 1,121 (94.0%) | 71 (6.0%) |
Occupancy by Educational Attainment in Seabrook Island
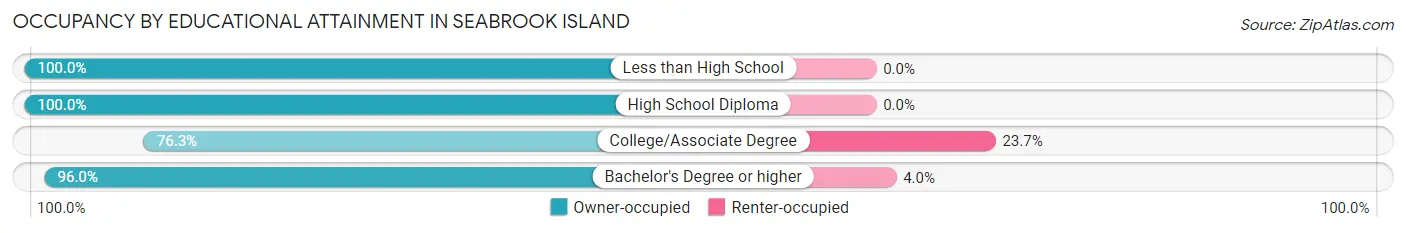
| Household Size | Owner-occupied | Renter-occupied |
| Less than High School | 5 (100.0%) | 0 (0.0%) |
| High School Diploma | 49 (100.0%) | 0 (0.0%) |
| College/Associate Degree | 100 (76.3%) | 31 (23.7%) |
| Bachelor's Degree or higher | 967 (96.0%) | 40 (4.0%) |
Occupancy by Age of Householder in Seabrook Island
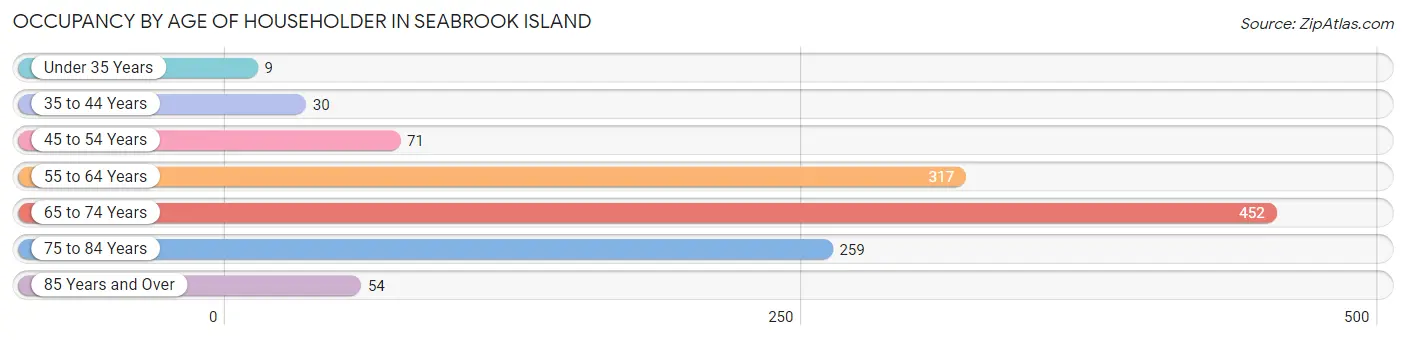
| Age Bracket | # Households | % Households |
| Under 35 Years | 9 | 0.8% |
| 35 to 44 Years | 30 | 2.5% |
| 45 to 54 Years | 71 | 6.0% |
| 55 to 64 Years | 317 | 26.6% |
| 65 to 74 Years | 452 | 37.9% |
| 75 to 84 Years | 259 | 21.7% |
| 85 Years and Over | 54 | 4.5% |
| Total | 1,192 | 100.0% |
Housing Finances in Seabrook Island
Median Income by Occupancy in Seabrook Island
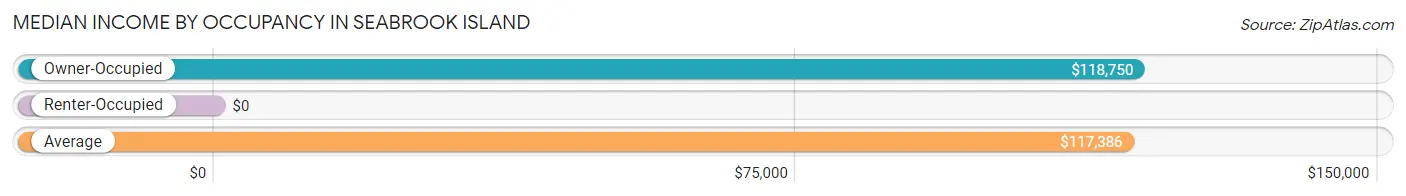
| Occupancy Type | # Households | Median Income |
| Owner-Occupied | 1,121 (94.0%) | $118,750 |
| Renter-Occupied | 71 (6.0%) | $0 |
| Average | 1,192 (100.0%) | $117,386 |
Occupancy by Householder Income Bracket in Seabrook Island
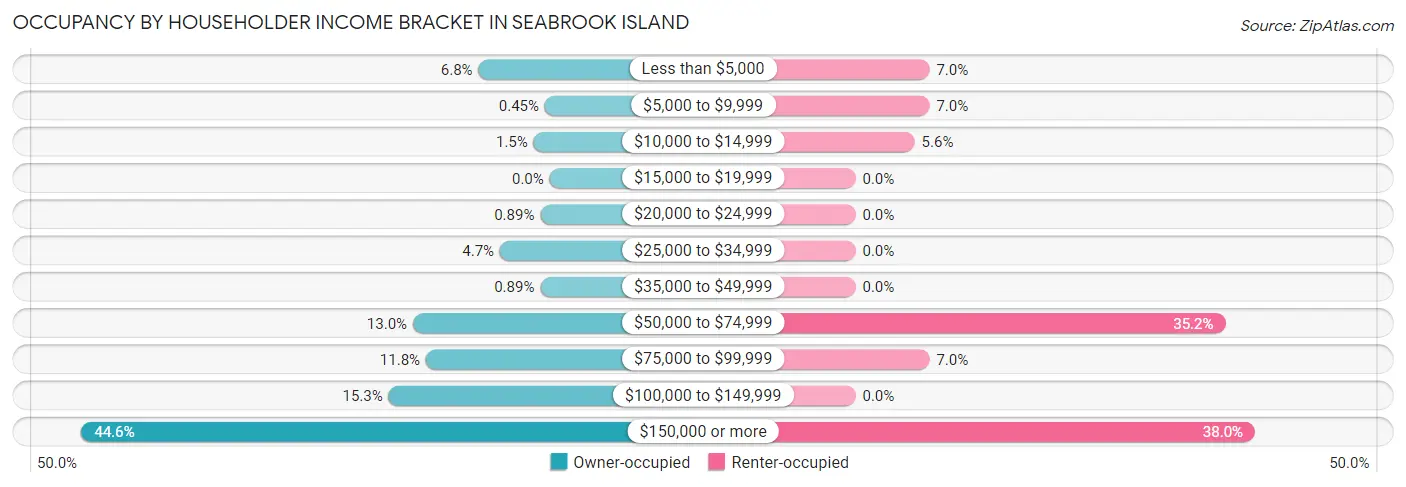
| Income Bracket | Owner-occupied | Renter-occupied |
| Less than $5,000 | 76 (6.8%) | 5 (7.0%) |
| $5,000 to $9,999 | 5 (0.4%) | 5 (7.0%) |
| $10,000 to $14,999 | 17 (1.5%) | 4 (5.6%) |
| $15,000 to $19,999 | 0 (0.0%) | 0 (0.0%) |
| $20,000 to $24,999 | 10 (0.9%) | 0 (0.0%) |
| $25,000 to $34,999 | 53 (4.7%) | 0 (0.0%) |
| $35,000 to $49,999 | 10 (0.9%) | 0 (0.0%) |
| $50,000 to $74,999 | 146 (13.0%) | 25 (35.2%) |
| $75,000 to $99,999 | 132 (11.8%) | 5 (7.0%) |
| $100,000 to $149,999 | 172 (15.3%) | 0 (0.0%) |
| $150,000 or more | 500 (44.6%) | 27 (38.0%) |
| Total | 1,121 (100.0%) | 71 (100.0%) |
Monthly Housing Cost Tiers in Seabrook Island
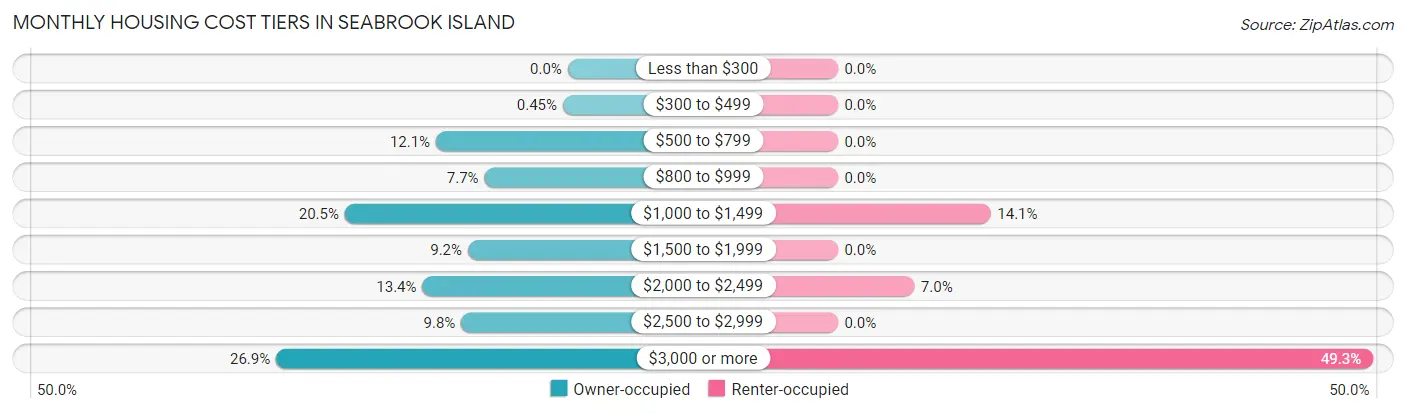
| Monthly Cost | Owner-occupied | Renter-occupied |
| Less than $300 | 0 (0.0%) | 0 (0.0%) |
| $300 to $499 | 5 (0.4%) | 0 (0.0%) |
| $500 to $799 | 136 (12.1%) | 0 (0.0%) |
| $800 to $999 | 86 (7.7%) | 0 (0.0%) |
| $1,000 to $1,499 | 230 (20.5%) | 10 (14.1%) |
| $1,500 to $1,999 | 103 (9.2%) | 0 (0.0%) |
| $2,000 to $2,499 | 150 (13.4%) | 5 (7.0%) |
| $2,500 to $2,999 | 110 (9.8%) | 0 (0.0%) |
| $3,000 or more | 301 (26.9%) | 35 (49.3%) |
| Total | 1,121 (100.0%) | 71 (100.0%) |
Physical Housing Characteristics in Seabrook Island
Housing Structures in Seabrook Island
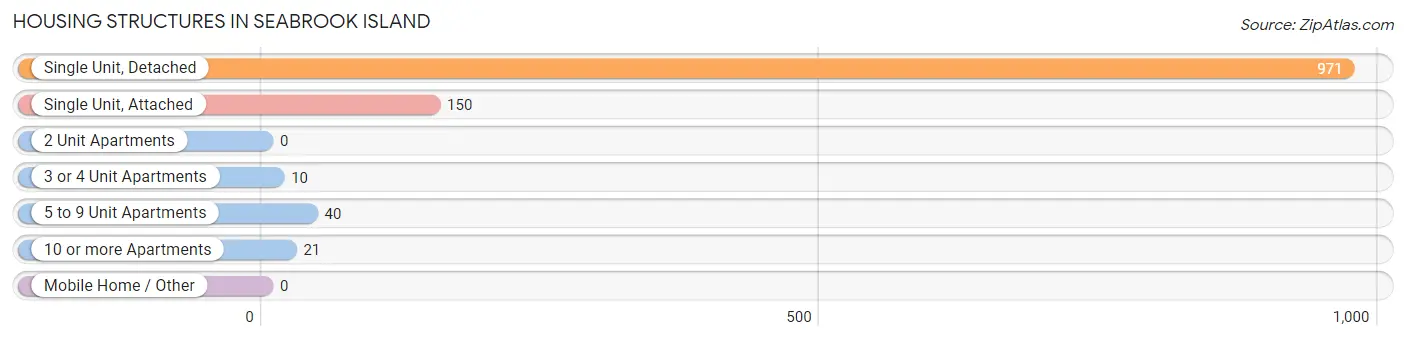
| Structure Type | # Housing Units | % Housing Units |
| Single Unit, Detached | 971 | 81.5% |
| Single Unit, Attached | 150 | 12.6% |
| 2 Unit Apartments | 0 | 0.0% |
| 3 or 4 Unit Apartments | 10 | 0.8% |
| 5 to 9 Unit Apartments | 40 | 3.4% |
| 10 or more Apartments | 21 | 1.8% |
| Mobile Home / Other | 0 | 0.0% |
| Total | 1,192 | 100.0% |
Housing Structures by Occupancy in Seabrook Island
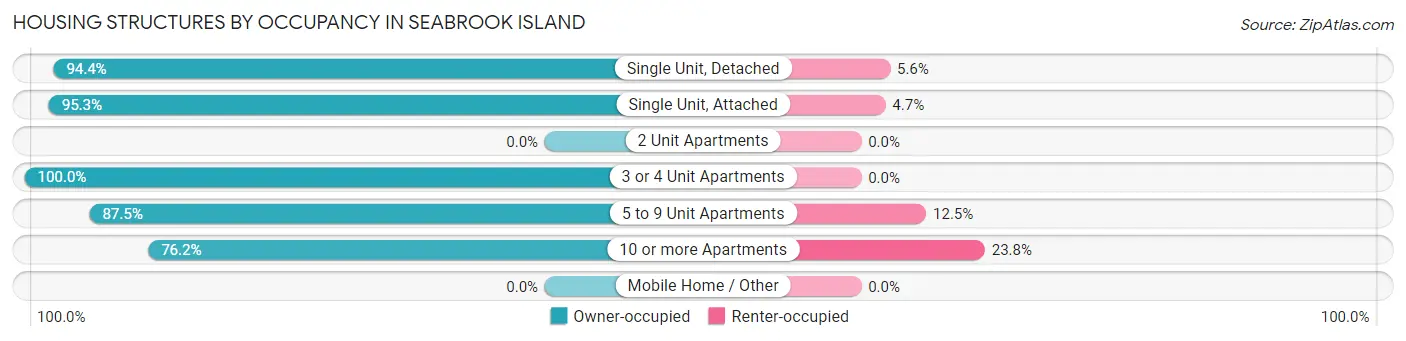
| Structure Type | Owner-occupied | Renter-occupied |
| Single Unit, Detached | 917 (94.4%) | 54 (5.6%) |
| Single Unit, Attached | 143 (95.3%) | 7 (4.7%) |
| 2 Unit Apartments | 0 (0.0%) | 0 (0.0%) |
| 3 or 4 Unit Apartments | 10 (100.0%) | 0 (0.0%) |
| 5 to 9 Unit Apartments | 35 (87.5%) | 5 (12.5%) |
| 10 or more Apartments | 16 (76.2%) | 5 (23.8%) |
| Mobile Home / Other | 0 (0.0%) | 0 (0.0%) |
| Total | 1,121 (94.0%) | 71 (6.0%) |
Housing Structures by Number of Rooms in Seabrook Island
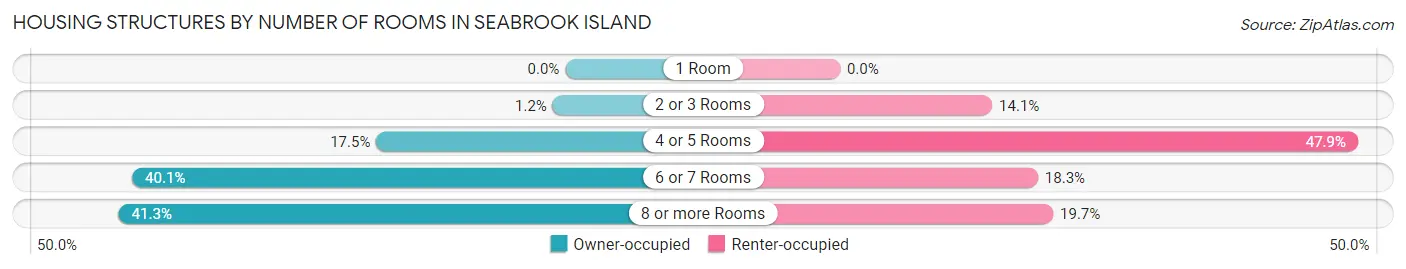
| Number of Rooms | Owner-occupied | Renter-occupied |
| 1 Room | 0 (0.0%) | 0 (0.0%) |
| 2 or 3 Rooms | 13 (1.2%) | 10 (14.1%) |
| 4 or 5 Rooms | 196 (17.5%) | 34 (47.9%) |
| 6 or 7 Rooms | 449 (40.1%) | 13 (18.3%) |
| 8 or more Rooms | 463 (41.3%) | 14 (19.7%) |
| Total | 1,121 (100.0%) | 71 (100.0%) |
Housing Structure by Heating Type in Seabrook Island
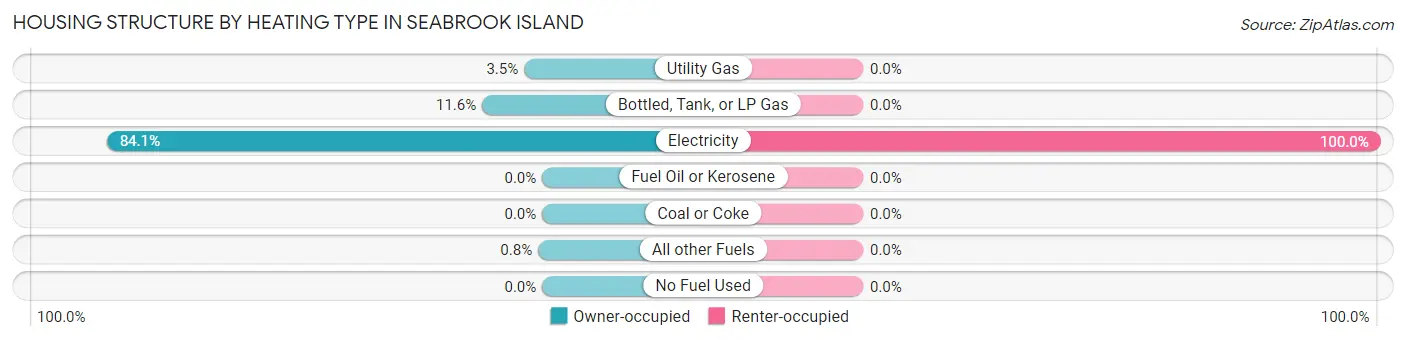
| Heating Type | Owner-occupied | Renter-occupied |
| Utility Gas | 39 (3.5%) | 0 (0.0%) |
| Bottled, Tank, or LP Gas | 130 (11.6%) | 0 (0.0%) |
| Electricity | 943 (84.1%) | 71 (100.0%) |
| Fuel Oil or Kerosene | 0 (0.0%) | 0 (0.0%) |
| Coal or Coke | 0 (0.0%) | 0 (0.0%) |
| All other Fuels | 9 (0.8%) | 0 (0.0%) |
| No Fuel Used | 0 (0.0%) | 0 (0.0%) |
| Total | 1,121 (100.0%) | 71 (100.0%) |
Household Vehicle Usage in Seabrook Island
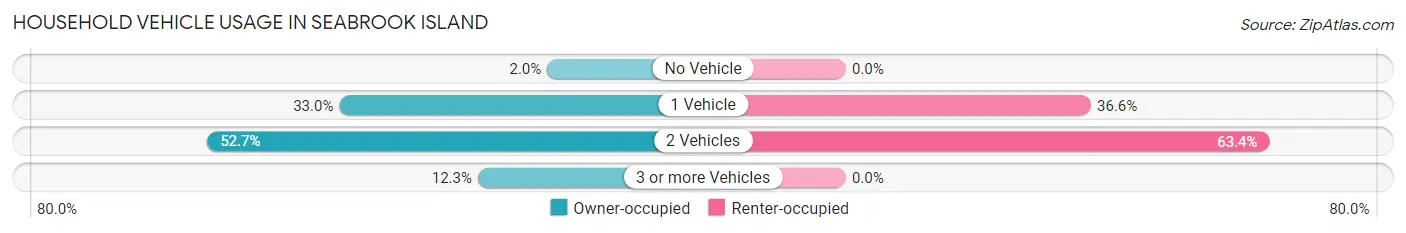
| Vehicles per Household | Owner-occupied | Renter-occupied |
| No Vehicle | 22 (2.0%) | 0 (0.0%) |
| 1 Vehicle | 370 (33.0%) | 26 (36.6%) |
| 2 Vehicles | 591 (52.7%) | 45 (63.4%) |
| 3 or more Vehicles | 138 (12.3%) | 0 (0.0%) |
| Total | 1,121 (100.0%) | 71 (100.0%) |
Real Estate & Mortgages in Seabrook Island
Real Estate and Mortgage Overview in Seabrook Island
| Characteristic | Without Mortgage | With Mortgage |
| Housing Units | 543 | 578 |
| Median Property Value | $659,200 | $859,300 |
| Median Household Income | $110,982 | $327 |
| Monthly Housing Costs | $1,069 | $293 |
| Real Estate Taxes | $4,088 | $0 |
Property Value by Mortgage Status in Seabrook Island
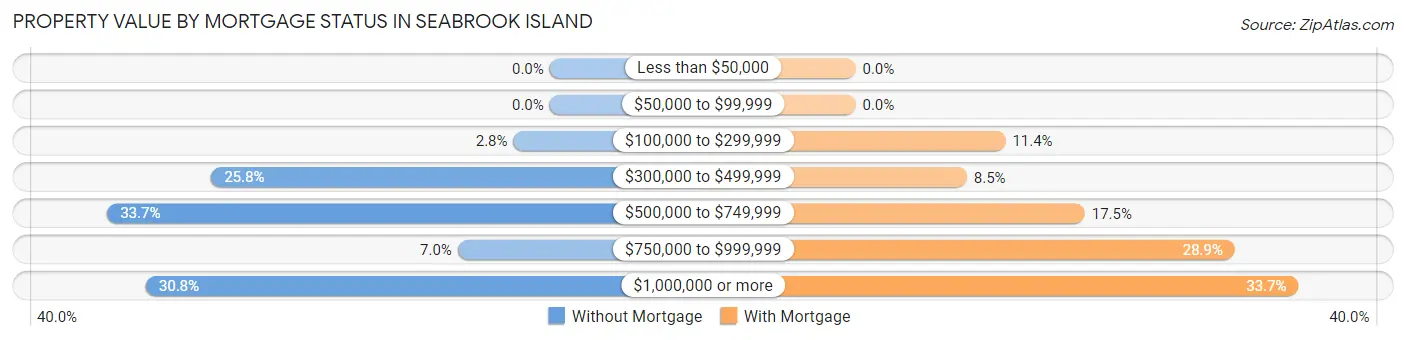
| Property Value | Without Mortgage | With Mortgage |
| Less than $50,000 | 0 (0.0%) | 0 (0.0%) |
| $50,000 to $99,999 | 0 (0.0%) | 0 (0.0%) |
| $100,000 to $299,999 | 15 (2.8%) | 66 (11.4%) |
| $300,000 to $499,999 | 140 (25.8%) | 49 (8.5%) |
| $500,000 to $749,999 | 183 (33.7%) | 101 (17.5%) |
| $750,000 to $999,999 | 38 (7.0%) | 167 (28.9%) |
| $1,000,000 or more | 167 (30.8%) | 195 (33.7%) |
| Total | 543 (100.0%) | 578 (100.0%) |
Household Income by Mortgage Status in Seabrook Island
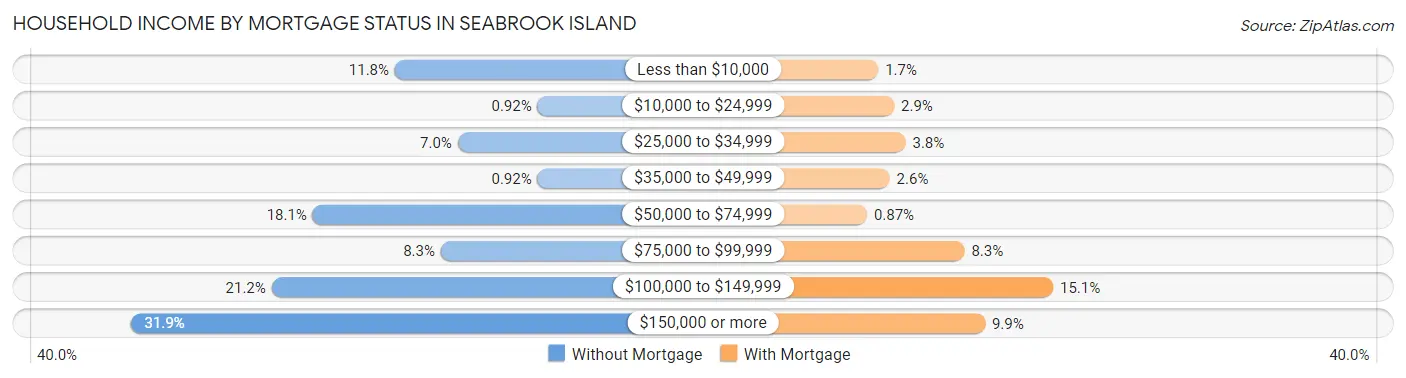
| Household Income | Without Mortgage | With Mortgage |
| Less than $10,000 | 64 (11.8%) | 10 (1.7%) |
| $10,000 to $24,999 | 5 (0.9%) | 17 (2.9%) |
| $25,000 to $34,999 | 38 (7.0%) | 22 (3.8%) |
| $35,000 to $49,999 | 5 (0.9%) | 15 (2.6%) |
| $50,000 to $74,999 | 98 (18.0%) | 5 (0.9%) |
| $75,000 to $99,999 | 45 (8.3%) | 48 (8.3%) |
| $100,000 to $149,999 | 115 (21.2%) | 87 (15.0%) |
| $150,000 or more | 173 (31.9%) | 57 (9.9%) |
| Total | 543 (100.0%) | 578 (100.0%) |
Property Value to Household Income Ratio in Seabrook Island
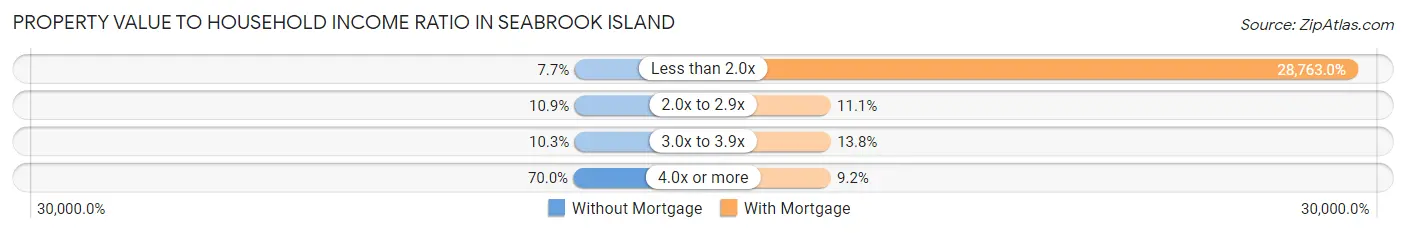
| Value-to-Income Ratio | Without Mortgage | With Mortgage |
| Less than 2.0x | 42 (7.7%) | 166,250 (28,763.0%) |
| 2.0x to 2.9x | 59 (10.9%) | 64 (11.1%) |
| 3.0x to 3.9x | 56 (10.3%) | 80 (13.8%) |
| 4.0x or more | 380 (70.0%) | 53 (9.2%) |
| Total | 543 (100.0%) | 578 (100.0%) |
Real Estate Taxes by Mortgage Status in Seabrook Island
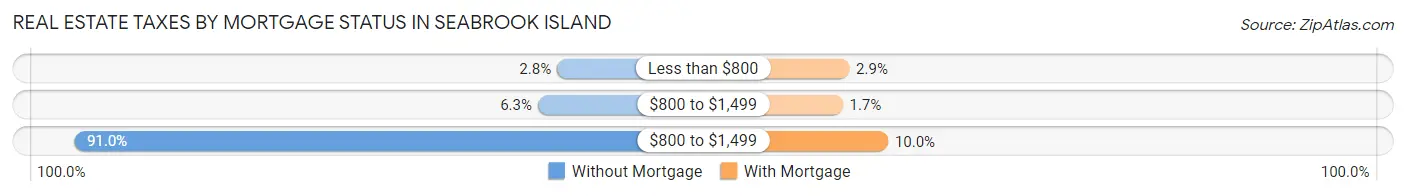
| Property Taxes | Without Mortgage | With Mortgage |
| Less than $800 | 15 (2.8%) | 17 (2.9%) |
| $800 to $1,499 | 34 (6.3%) | 10 (1.7%) |
| $800 to $1,499 | 494 (91.0%) | 58 (10.0%) |
| Total | 543 (100.0%) | 578 (100.0%) |
Health & Disability in Seabrook Island
Health Insurance Coverage by Age in Seabrook Island
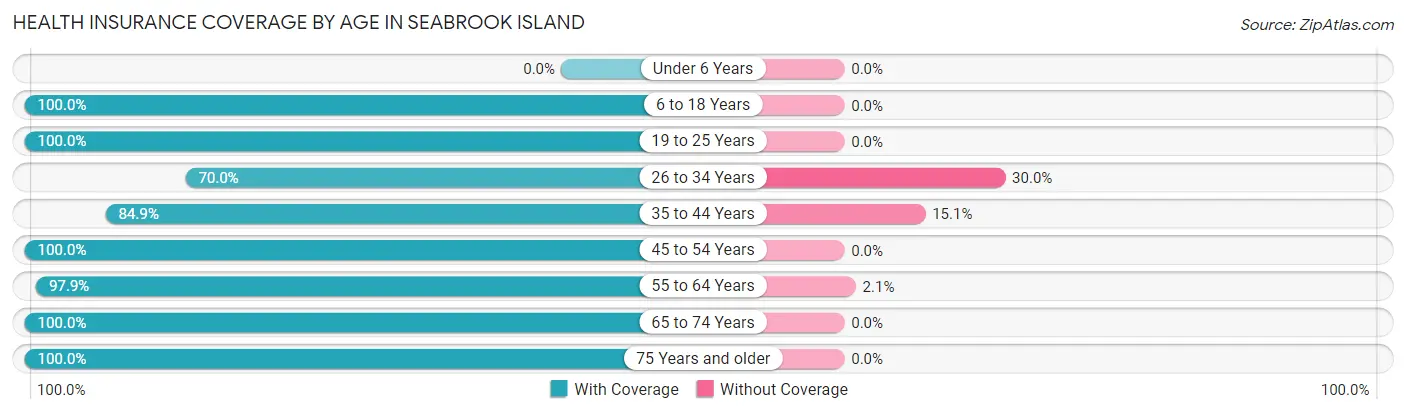
| Age Bracket | With Coverage | Without Coverage |
| Under 6 Years | 0 (0.0%) | 0 (0.0%) |
| 6 to 18 Years | 10 (100.0%) | 0 (0.0%) |
| 19 to 25 Years | 5 (100.0%) | 0 (0.0%) |
| 26 to 34 Years | 14 (70.0%) | 6 (30.0%) |
| 35 to 44 Years | 45 (84.9%) | 8 (15.1%) |
| 45 to 54 Years | 87 (100.0%) | 0 (0.0%) |
| 55 to 64 Years | 601 (97.9%) | 13 (2.1%) |
| 65 to 74 Years | 799 (100.0%) | 0 (0.0%) |
| 75 Years and older | 474 (100.0%) | 0 (0.0%) |
| Total | 2,035 (98.7%) | 27 (1.3%) |
Health Insurance Coverage by Citizenship Status in Seabrook Island
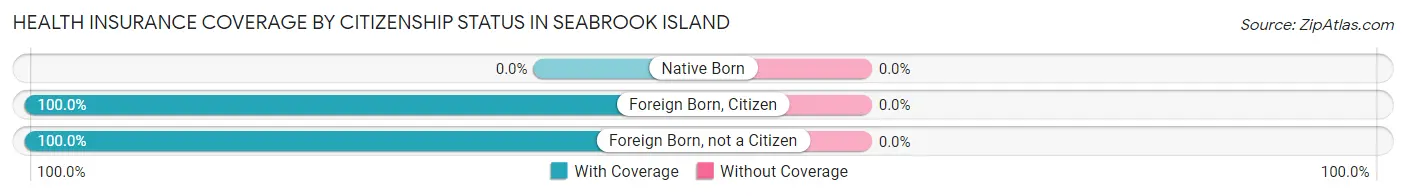
| Citizenship Status | With Coverage | Without Coverage |
| Native Born | 0 (0.0%) | 0 (0.0%) |
| Foreign Born, Citizen | 10 (100.0%) | 0 (0.0%) |
| Foreign Born, not a Citizen | 5 (100.0%) | 0 (0.0%) |
Health Insurance Coverage by Household Income in Seabrook Island
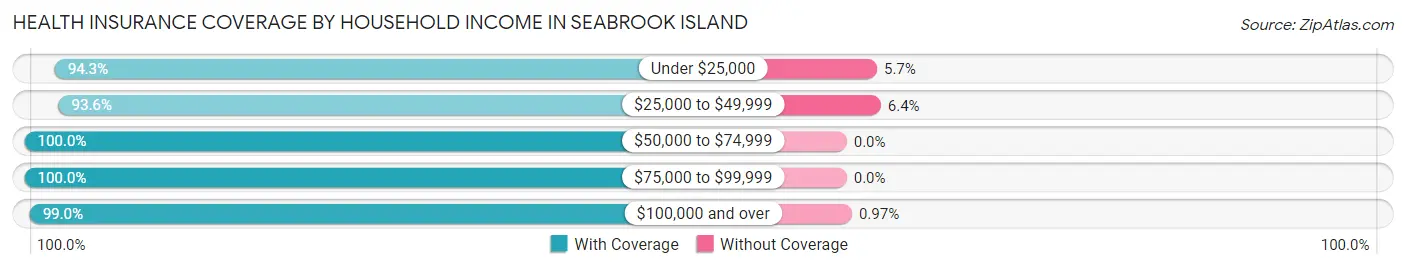
| Household Income | With Coverage | Without Coverage |
| Under $25,000 | 133 (94.3%) | 8 (5.7%) |
| $25,000 to $49,999 | 88 (93.6%) | 6 (6.4%) |
| $50,000 to $74,999 | 233 (100.0%) | 0 (0.0%) |
| $75,000 to $99,999 | 252 (100.0%) | 0 (0.0%) |
| $100,000 and over | 1,329 (99.0%) | 13 (1.0%) |
Public vs Private Health Insurance Coverage by Age in Seabrook Island
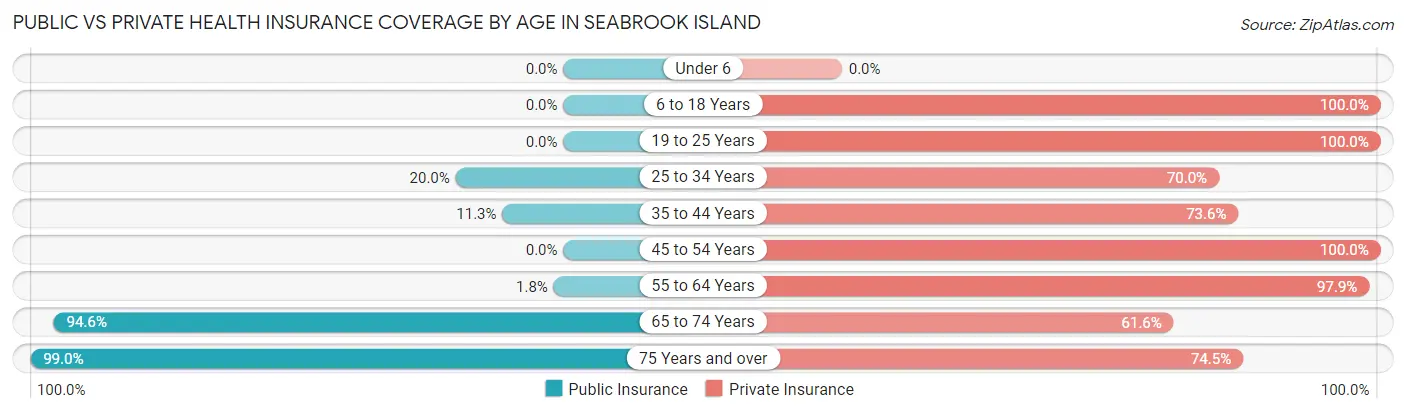
| Age Bracket | Public Insurance | Private Insurance |
| Under 6 | 0 (0.0%) | 0 (0.0%) |
| 6 to 18 Years | 0 (0.0%) | 10 (100.0%) |
| 19 to 25 Years | 0 (0.0%) | 5 (100.0%) |
| 25 to 34 Years | 4 (20.0%) | 14 (70.0%) |
| 35 to 44 Years | 6 (11.3%) | 39 (73.6%) |
| 45 to 54 Years | 0 (0.0%) | 87 (100.0%) |
| 55 to 64 Years | 11 (1.8%) | 601 (97.9%) |
| 65 to 74 Years | 756 (94.6%) | 492 (61.6%) |
| 75 Years and over | 469 (99.0%) | 353 (74.5%) |
| Total | 1,246 (60.4%) | 1,601 (77.6%) |
Disability Status by Sex by Age in Seabrook Island
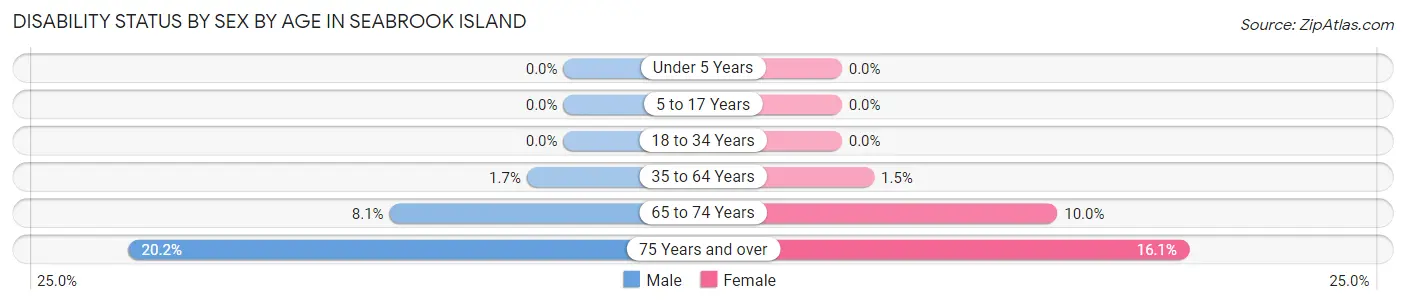
| Age Bracket | Male | Female |
| Under 5 Years | 0 (0.0%) | 0 (0.0%) |
| 5 to 17 Years | 0 (0.0%) | 0 (0.0%) |
| 18 to 34 Years | 0 (0.0%) | 0 (0.0%) |
| 35 to 64 Years | 6 (1.7%) | 6 (1.5%) |
| 65 to 74 Years | 33 (8.1%) | 39 (10.0%) |
| 75 Years and over | 48 (20.2%) | 38 (16.1%) |
Disability Class by Sex by Age in Seabrook Island
Disability Class: Hearing Difficulty
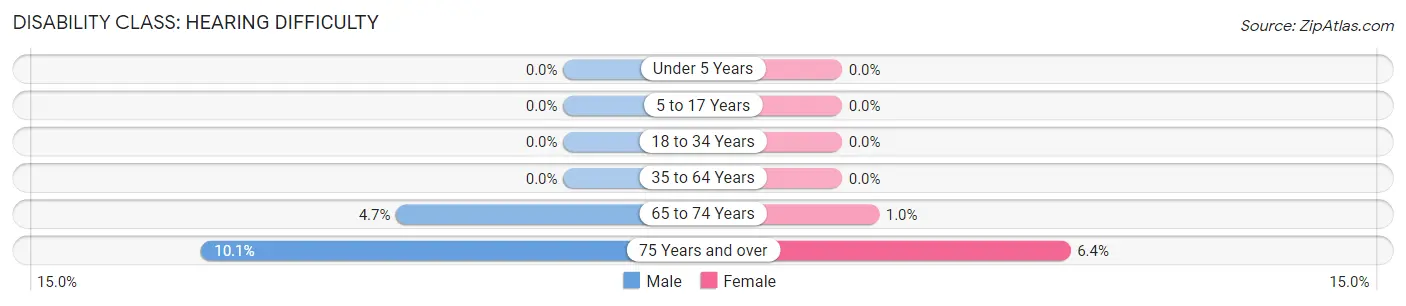
| Age Bracket | Male | Female |
| Under 5 Years | 0 (0.0%) | 0 (0.0%) |
| 5 to 17 Years | 0 (0.0%) | 0 (0.0%) |
| 18 to 34 Years | 0 (0.0%) | 0 (0.0%) |
| 35 to 64 Years | 0 (0.0%) | 0 (0.0%) |
| 65 to 74 Years | 19 (4.6%) | 4 (1.0%) |
| 75 Years and over | 24 (10.1%) | 15 (6.4%) |
Disability Class: Vision Difficulty
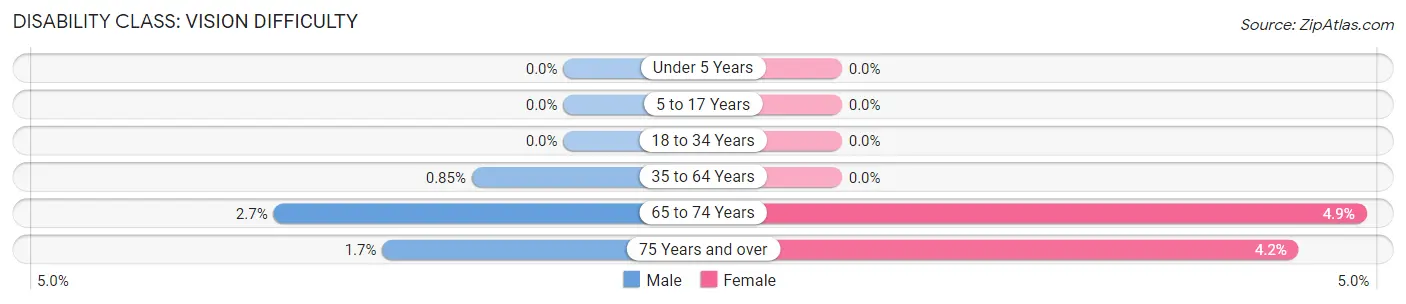
| Age Bracket | Male | Female |
| Under 5 Years | 0 (0.0%) | 0 (0.0%) |
| 5 to 17 Years | 0 (0.0%) | 0 (0.0%) |
| 18 to 34 Years | 0 (0.0%) | 0 (0.0%) |
| 35 to 64 Years | 3 (0.9%) | 0 (0.0%) |
| 65 to 74 Years | 11 (2.7%) | 19 (4.9%) |
| 75 Years and over | 4 (1.7%) | 10 (4.2%) |
Disability Class: Cognitive Difficulty
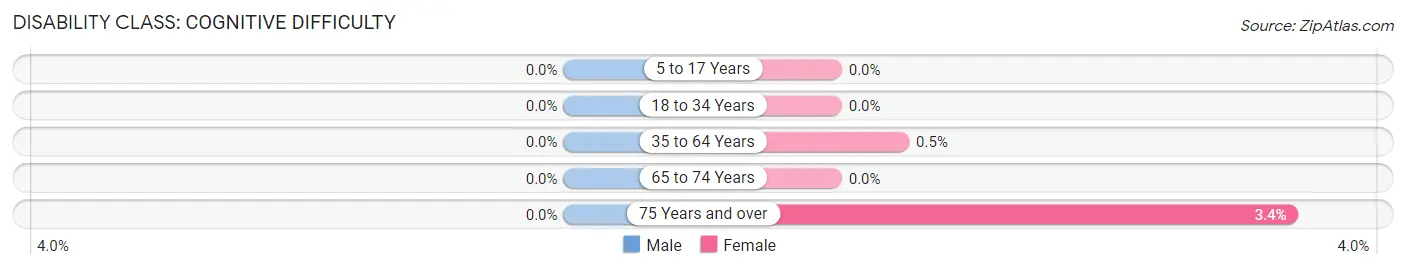
| Age Bracket | Male | Female |
| 5 to 17 Years | 0 (0.0%) | 0 (0.0%) |
| 18 to 34 Years | 0 (0.0%) | 0 (0.0%) |
| 35 to 64 Years | 0 (0.0%) | 2 (0.5%) |
| 65 to 74 Years | 0 (0.0%) | 0 (0.0%) |
| 75 Years and over | 0 (0.0%) | 8 (3.4%) |
Disability Class: Ambulatory Difficulty
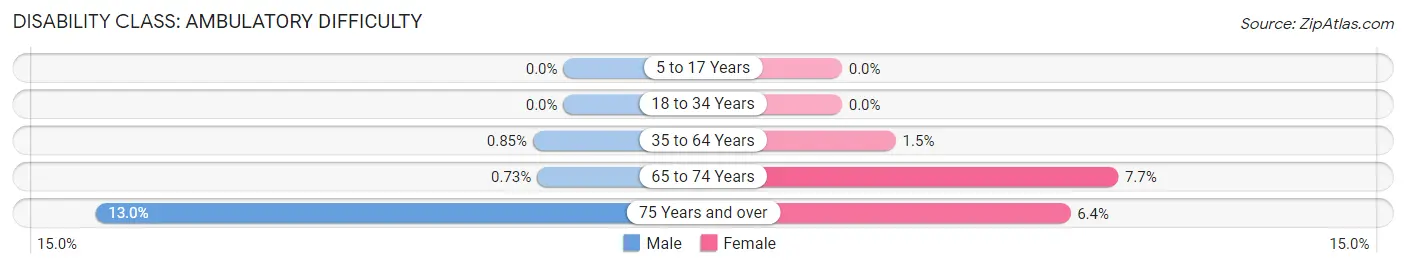
| Age Bracket | Male | Female |
| 5 to 17 Years | 0 (0.0%) | 0 (0.0%) |
| 18 to 34 Years | 0 (0.0%) | 0 (0.0%) |
| 35 to 64 Years | 3 (0.9%) | 6 (1.5%) |
| 65 to 74 Years | 3 (0.7%) | 30 (7.7%) |
| 75 Years and over | 31 (13.0%) | 15 (6.4%) |
Disability Class: Self-Care Difficulty
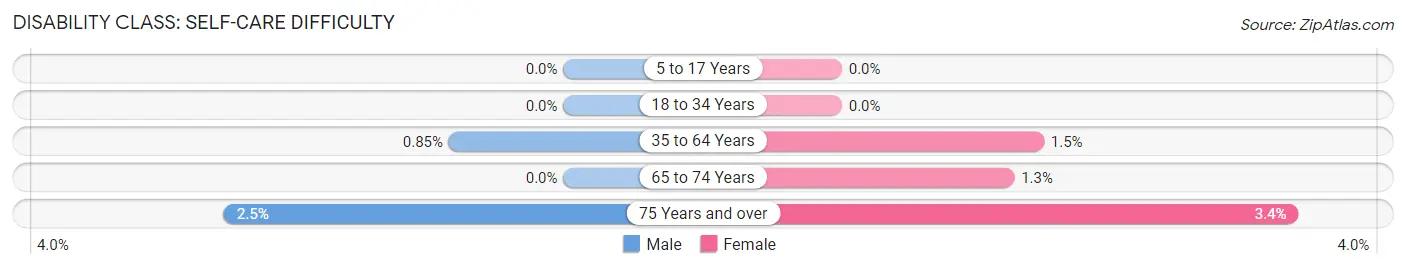
| Age Bracket | Male | Female |
| 5 to 17 Years | 0 (0.0%) | 0 (0.0%) |
| 18 to 34 Years | 0 (0.0%) | 0 (0.0%) |
| 35 to 64 Years | 3 (0.9%) | 6 (1.5%) |
| 65 to 74 Years | 0 (0.0%) | 5 (1.3%) |
| 75 Years and over | 6 (2.5%) | 8 (3.4%) |
Technology Access in Seabrook Island
Computing Device Access in Seabrook Island
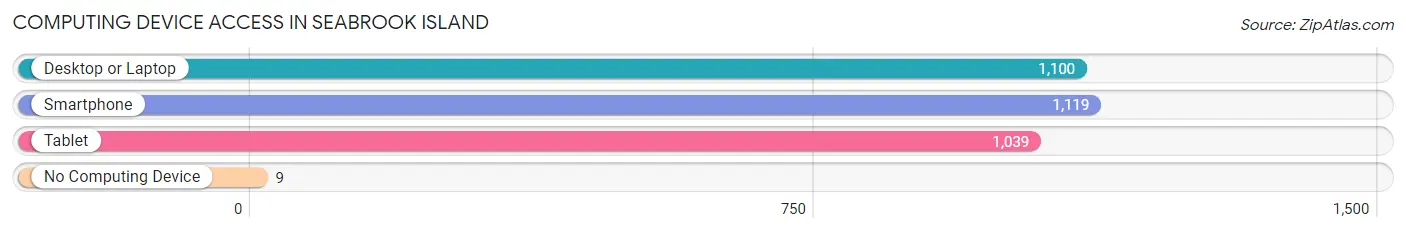
| Device Type | # Households | % Households |
| Desktop or Laptop | 1,100 | 92.3% |
| Smartphone | 1,119 | 93.9% |
| Tablet | 1,039 | 87.2% |
| No Computing Device | 9 | 0.8% |
| Total | 1,192 | 100.0% |
Internet Access in Seabrook Island
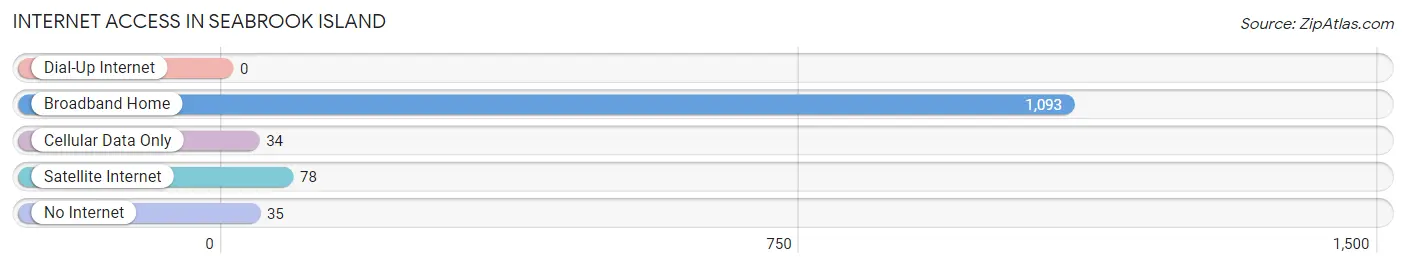
| Internet Type | # Households | % Households |
| Dial-Up Internet | 0 | 0.0% |
| Broadband Home | 1,093 | 91.7% |
| Cellular Data Only | 34 | 2.9% |
| Satellite Internet | 78 | 6.5% |
| No Internet | 35 | 2.9% |
| Total | 1,192 | 100.0% |
Seabrook Island Summary
Seabrook Island is a barrier island located in Charleston County, South Carolina. It is situated between the Kiawah and Edisto Islands, and is approximately 30 miles south of Charleston. The island is a popular vacation destination, and is home to a variety of wildlife, including loggerhead turtles, dolphins, and a variety of birds.
History
The history of Seabrook Island dates back to the early 1700s, when it was inhabited by the Sewee Indians. The island was later purchased by the Seabrook family in 1719, and the family held the island until the early 1900s. In the early 1900s, the island was purchased by the Seabrook Island Company, which developed the island into a resort destination. The island was later purchased by the Seabrook Island Club in the 1950s, and the club has since developed the island into a premier vacation destination.
Geography
Seabrook Island is located in Charleston County, South Carolina. It is situated between the Kiawah and Edisto Islands, and is approximately 30 miles south of Charleston. The island is approximately 4 miles long and 2 miles wide, and is bordered by the Atlantic Ocean to the east and the North Edisto River to the west. The island is composed of a variety of habitats, including salt marshes, maritime forests, and beaches.
Economy
The economy of Seabrook Island is largely driven by tourism. The island is home to a variety of resorts, restaurants, and other attractions, which attract visitors from all over the world. The island is also home to a variety of businesses, including real estate companies, construction companies, and retail stores.
Demographics
As of the 2010 census, the population of Seabrook Island was 1,719. The population is largely composed of white (90.2%) and African American (7.2%) residents. The median household income is $90,000, and the median age is 54. The island is home to a variety of religious denominations, including Catholic (25.2%), Protestant (19.2%), and Other (55.6%). The island is also home to a variety of educational institutions, including Seabrook Island Elementary School and Seabrook Island High School.
Common Questions
What is Per Capita Income in Seabrook Island?
Per Capita income in Seabrook Island is $115,125.
What is the Median Family Income in Seabrook Island?
Median Family Income in Seabrook Island is $162,171.
What is the Median Household income in Seabrook Island?
Median Household Income in Seabrook Island is $117,386.
What is Income or Wage Gap in Seabrook Island?
Income or Wage Gap in Seabrook Island is 18.8%.
Women in Seabrook Island earn 81.2 cents for every dollar earned by a man.
What is Inequality or Gini Index in Seabrook Island?
Inequality or Gini Index in Seabrook Island is 0.53.
What is the Total Population of Seabrook Island?
Total Population of Seabrook Island is 2,062.
What is the Total Male Population of Seabrook Island?
Total Male Population of Seabrook Island is 1,020.
What is the Total Female Population of Seabrook Island?
Total Female Population of Seabrook Island is 1,042.
What is the Ratio of Males per 100 Females in Seabrook Island?
There are 97.89 Males per 100 Females in Seabrook Island.
What is the Ratio of Females per 100 Males in Seabrook Island?
There are 102.16 Females per 100 Males in Seabrook Island.
What is the Median Population Age in Seabrook Island?
Median Population Age in Seabrook Island is 68.1 Years.
What is the Average Family Size in Seabrook Island
Average Family Size in Seabrook Island is 2.0 People.
What is the Average Household Size in Seabrook Island
Average Household Size in Seabrook Island is 1.7 People.
How Large is the Labor Force in Seabrook Island?
There are 666 People in the Labor Forcein in Seabrook Island.
What is the Percentage of People in the Labor Force in Seabrook Island?
32.4% of People are in the Labor Force in Seabrook Island.
What is the Unemployment Rate in Seabrook Island?
Unemployment Rate in Seabrook Island is 0.7%.