Guaynabo Municipio, PR Map & Demographics
Guaynabo Municipio Map
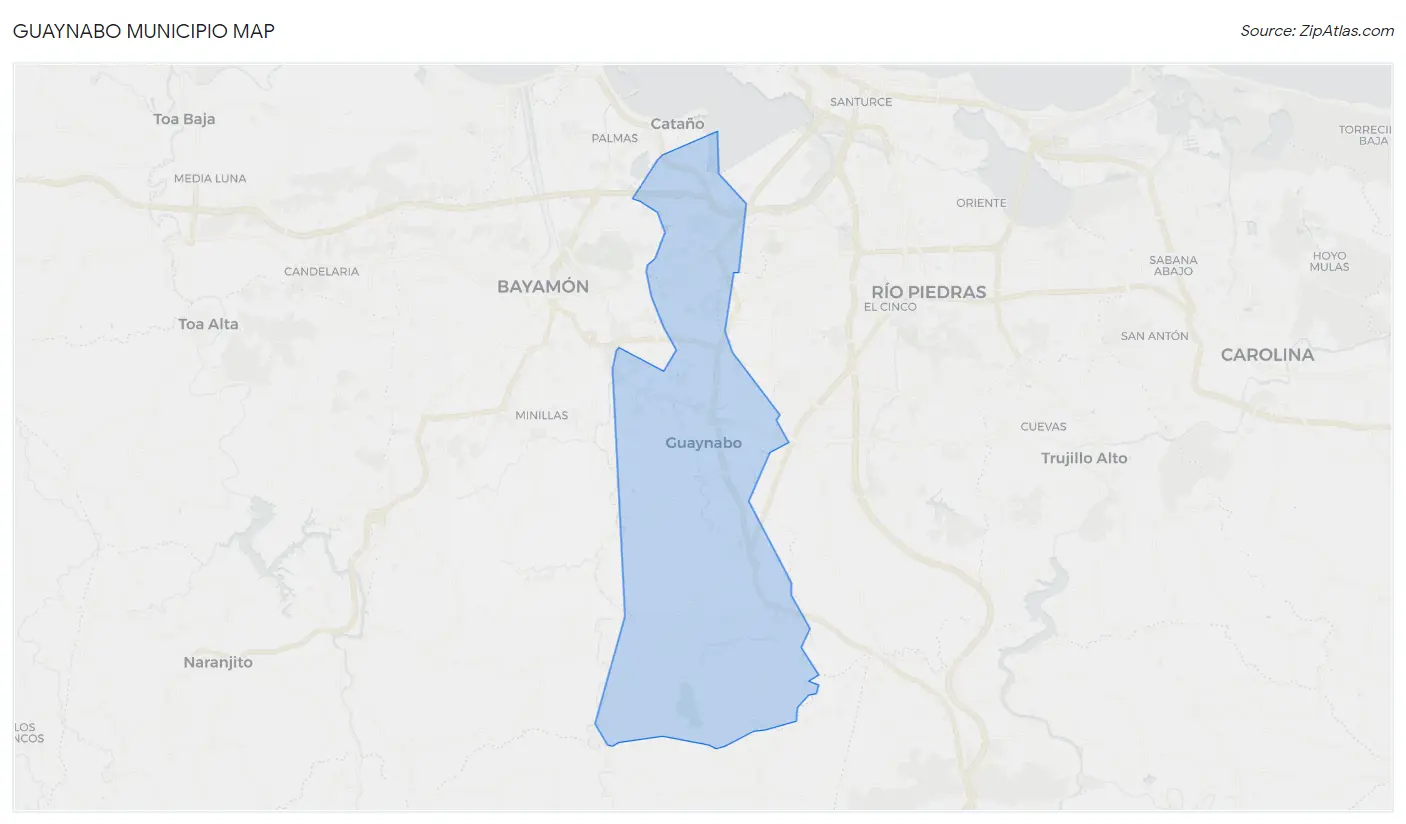
Guaynabo Municipio Overview
$28,637
PER CAPITA INCOME
$55,704
AVG FAMILY INCOME
$43,304
AVG HOUSEHOLD INCOME
9.0%
WAGE / INCOME GAP [ % ]
91.0¢/ $1
WAGE / INCOME GAP [ $ ]
$10,368
FAMILY INCOME DEFICIT
0.55
INEQUALITY / GINI INDEX
89,554
TOTAL POPULATION
42,015
MALE POPULATION
47,539
FEMALE POPULATION
88.38
MALES / 100 FEMALES
113.15
FEMALES / 100 MALES
46.3
MEDIAN AGE
3.4
AVG FAMILY SIZE
2.7
AVG HOUSEHOLD SIZE
40,772
LABOR FORCE [ PEOPLE ]
52.1%
PERCENT IN LABOR FORCE
8.2%
UNEMPLOYMENT RATE
Income in Guaynabo Municipio
Income Overview in Guaynabo Municipio
Per Capita Income in Guaynabo Municipio is $28,637, while median incomes of families and households are $55,704 and $43,304 respectively.
| Characteristic | Number | Measure |
| Per Capita Income | 89,554 | $28,637 |
| Median Family Income | 21,296 | $55,704 |
| Mean Family Income | 21,296 | $85,383 |
| Median Household Income | 33,464 | $43,304 |
| Mean Household Income | 33,464 | $71,552 |
| Income Deficit | 21,296 | $10,368 |
| Wage / Income Gap (%) | 89,554 | 9.01% |
| Wage / Income Gap ($) | 89,554 | 90.99¢ per $1 |
| Gini / Inequality Index | 89,554 | 0.55 |
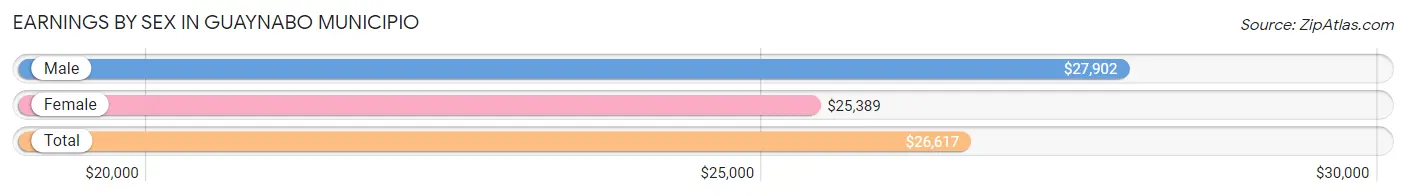
Earnings by Sex in Guaynabo Municipio
Average Earnings in Guaynabo Municipio are $26,617, $27,902 for men and $25,389 for women, a difference of 9.0%.
| Sex | Number | Average Earnings |
| Male | 20,846 (51.9%) | $27,902 |
| Female | 19,284 (48.0%) | $25,389 |
| Total | 40,130 (100.0%) | $26,617 |
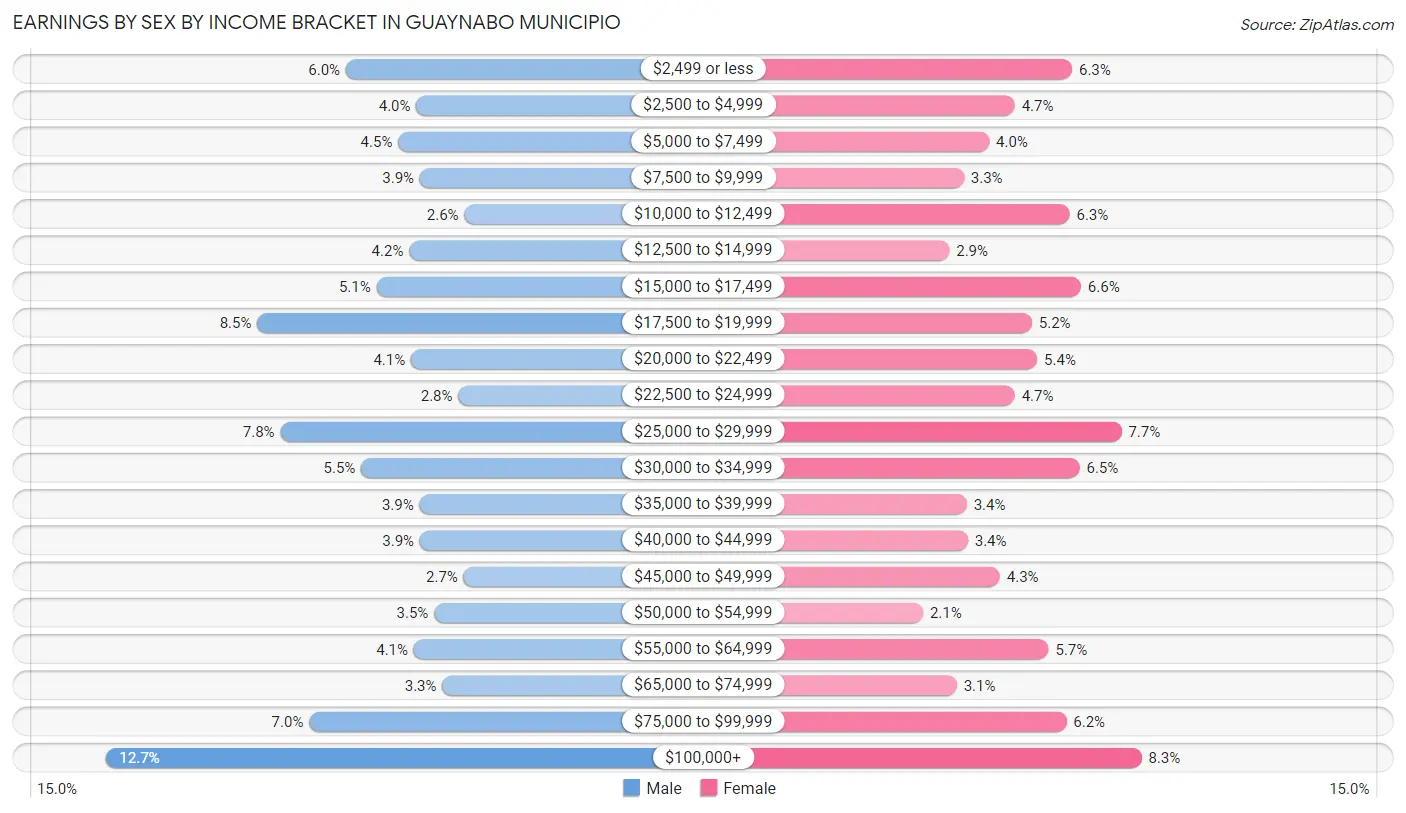
Earnings by Sex by Income Bracket in Guaynabo Municipio
The most common earnings brackets in Guaynabo Municipio are $100,000+ for men (2,648 | 12.7%) and $100,000+ for women (1,596 | 8.3%).
| Income | Male | Female |
| $2,499 or less | 1,244 (6.0%) | 1,221 (6.3%) |
| $2,500 to $4,999 | 832 (4.0%) | 911 (4.7%) |
| $5,000 to $7,499 | 938 (4.5%) | 771 (4.0%) |
| $7,500 to $9,999 | 810 (3.9%) | 634 (3.3%) |
| $10,000 to $12,499 | 551 (2.6%) | 1,207 (6.3%) |
| $12,500 to $14,999 | 873 (4.2%) | 555 (2.9%) |
| $15,000 to $17,499 | 1,066 (5.1%) | 1,269 (6.6%) |
| $17,500 to $19,999 | 1,764 (8.5%) | 1,003 (5.2%) |
| $20,000 to $22,499 | 863 (4.1%) | 1,032 (5.3%) |
| $22,500 to $24,999 | 585 (2.8%) | 910 (4.7%) |
| $25,000 to $29,999 | 1,628 (7.8%) | 1,489 (7.7%) |
| $30,000 to $34,999 | 1,155 (5.5%) | 1,262 (6.5%) |
| $35,000 to $39,999 | 813 (3.9%) | 650 (3.4%) |
| $40,000 to $44,999 | 810 (3.9%) | 655 (3.4%) |
| $45,000 to $49,999 | 554 (2.7%) | 829 (4.3%) |
| $50,000 to $54,999 | 727 (3.5%) | 412 (2.1%) |
| $55,000 to $64,999 | 846 (4.1%) | 1,093 (5.7%) |
| $65,000 to $74,999 | 680 (3.3%) | 596 (3.1%) |
| $75,000 to $99,999 | 1,459 (7.0%) | 1,189 (6.2%) |
| $100,000+ | 2,648 (12.7%) | 1,596 (8.3%) |
| Total | 20,846 (100.0%) | 19,284 (100.0%) |
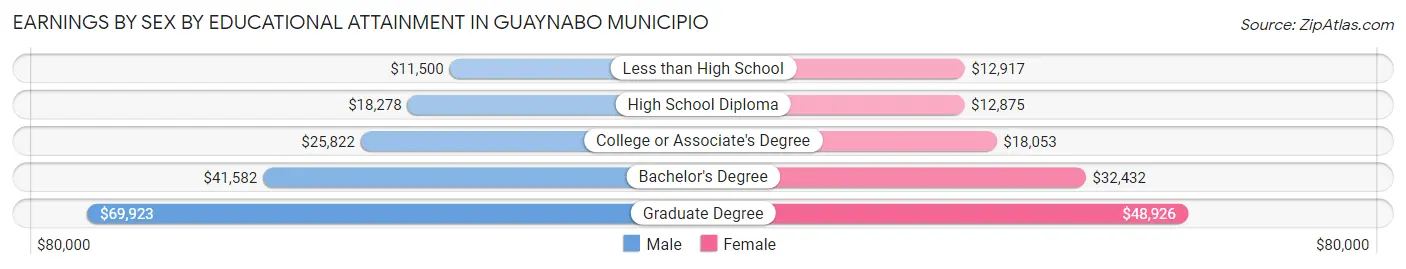
Earnings by Sex by Educational Attainment in Guaynabo Municipio
Average earnings in Guaynabo Municipio are $30,328 for men and $27,684 for women, a difference of 8.7%. Men with an educational attainment of graduate degree enjoy the highest average annual earnings of $69,923, while those with less than high school education earn the least with $11,500. Women with an educational attainment of graduate degree earn the most with the average annual earnings of $48,926, while those with high school diploma education have the smallest earnings of $12,875.
| Educational Attainment | Male Income | Female Income |
| Less than High School | $11,500 | $12,917 |
| High School Diploma | $18,278 | $12,875 |
| College or Associate's Degree | $25,822 | $18,053 |
| Bachelor's Degree | $41,582 | $32,432 |
| Graduate Degree | $69,923 | $48,926 |
| Total | $30,328 | $27,684 |
Family Income in Guaynabo Municipio
Family Income Brackets in Guaynabo Municipio
According to the Guaynabo Municipio family income data, there are 3,407 families falling into the $50,000 to $74,999 income range, which is the most common income bracket and makes up 16.0% of all families. Conversely, the $10,000 to $14,999 income bracket is the least frequent group with only 1,086 families (5.1%) belonging to this category.
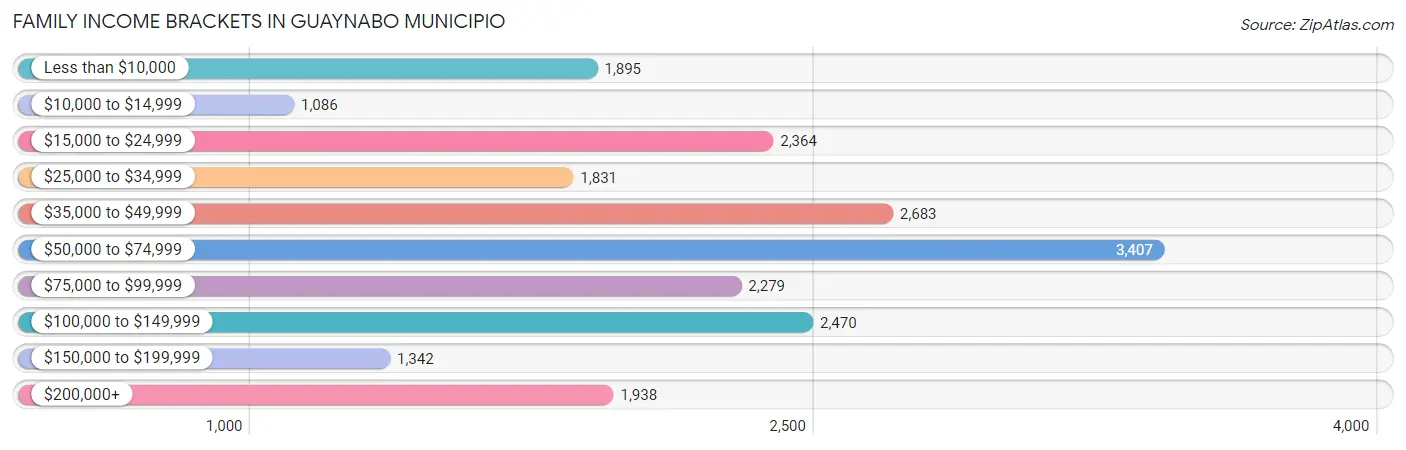
| Income Bracket | # Families | % Families |
| Less than $10,000 | 1,895 | 8.9% |
| $10,000 to $14,999 | 1,086 | 5.1% |
| $15,000 to $24,999 | 2,364 | 11.1% |
| $25,000 to $34,999 | 1,831 | 8.6% |
| $35,000 to $49,999 | 2,683 | 12.6% |
| $50,000 to $74,999 | 3,407 | 16.0% |
| $75,000 to $99,999 | 2,279 | 10.7% |
| $100,000 to $149,999 | 2,470 | 11.6% |
| $150,000 to $199,999 | 1,342 | 6.3% |
| $200,000+ | 1,938 | 9.1% |
Family Income by Famaliy Size in Guaynabo Municipio
5-person families (780 | 3.7%) account for the highest median family income in Guaynabo Municipio with $98,971 per family, while 2-person families (11,101 | 52.1%) have the highest median income of $23,872 per family member.
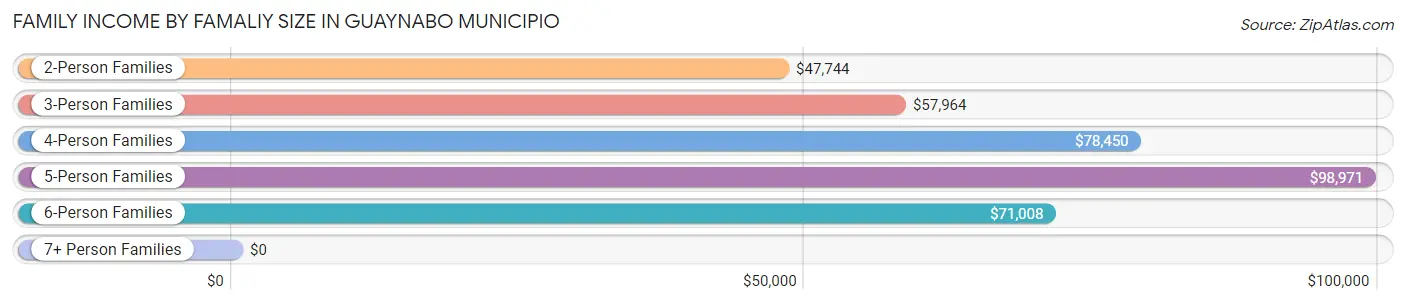
| Income Bracket | # Families | Median Income |
| 2-Person Families | 11,101 (52.1%) | $47,744 |
| 3-Person Families | 5,807 (27.3%) | $57,964 |
| 4-Person Families | 3,211 (15.1%) | $78,450 |
| 5-Person Families | 780 (3.7%) | $98,971 |
| 6-Person Families | 245 (1.1%) | $71,008 |
| 7+ Person Families | 152 (0.7%) | $0 |
| Total | 21,296 (100.0%) | $55,704 |
Family Income by Number of Earners in Guaynabo Municipio
The median family income in Guaynabo Municipio is $55,704, with families comprising 3+ earners (1,595) having the highest median family income of $106,391, while families with no earners (5,174) have the lowest median family income of $28,862, accounting for 7.5% and 24.3% of families, respectively.
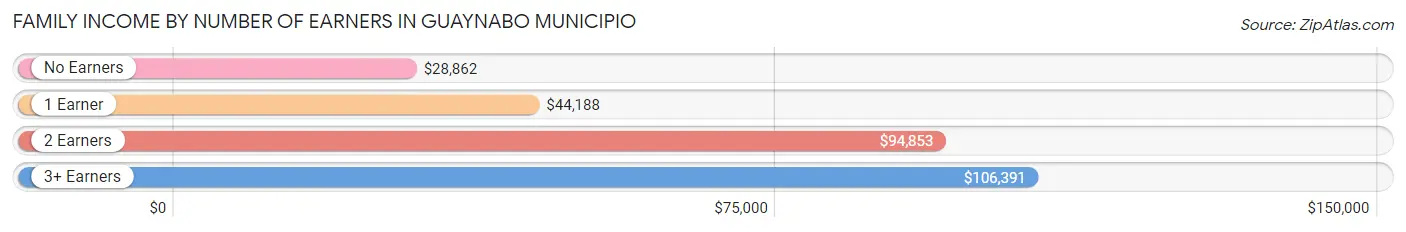
| Number of Earners | # Families | Median Income |
| No Earners | 5,174 (24.3%) | $28,862 |
| 1 Earner | 8,375 (39.3%) | $44,188 |
| 2 Earners | 6,152 (28.9%) | $94,853 |
| 3+ Earners | 1,595 (7.5%) | $106,391 |
| Total | 21,296 (100.0%) | $55,704 |
Household Income in Guaynabo Municipio
Household Income Brackets in Guaynabo Municipio
With 5,020 households falling in the category, the $50,000 to $74,999 income range is the most frequent in Guaynabo Municipio, accounting for 15.0% of all households. In contrast, only 1,640 households (4.9%) fall into the $150,000 to $199,999 income bracket, making it the least populous group.
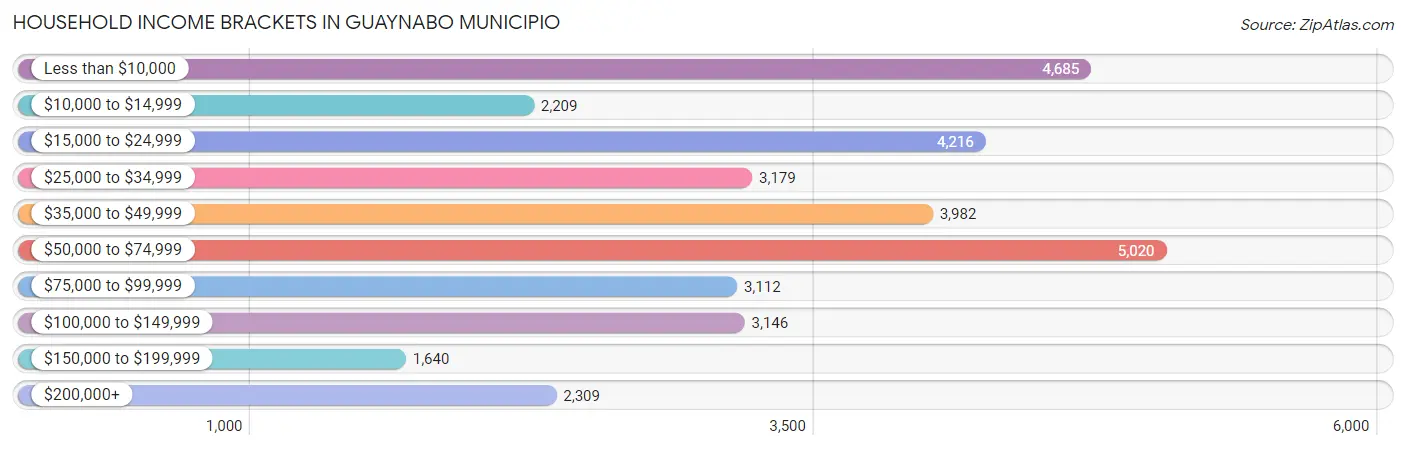
| Income Bracket | # Households | % Households |
| Less than $10,000 | 4,685 | 14.0% |
| $10,000 to $14,999 | 2,209 | 6.6% |
| $15,000 to $24,999 | 4,216 | 12.6% |
| $25,000 to $34,999 | 3,179 | 9.5% |
| $35,000 to $49,999 | 3,982 | 11.9% |
| $50,000 to $74,999 | 5,020 | 15.0% |
| $75,000 to $99,999 | 3,112 | 9.3% |
| $100,000 to $149,999 | 3,146 | 9.4% |
| $150,000 to $199,999 | 1,640 | 4.9% |
| $200,000+ | 2,309 | 6.9% |
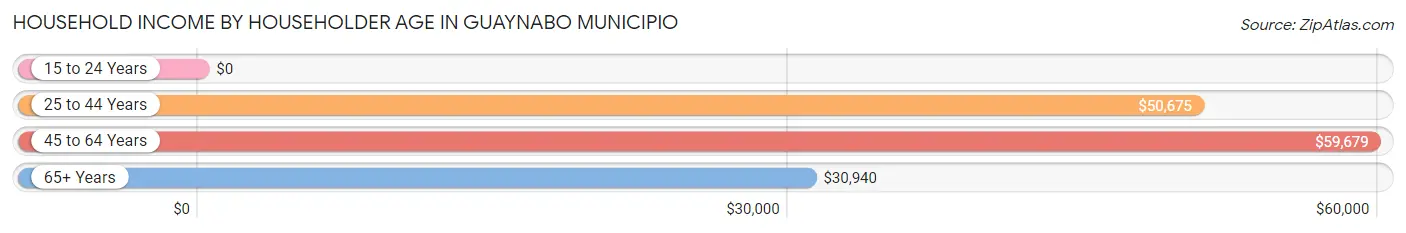
Household Income by Householder Age in Guaynabo Municipio
The median household income in Guaynabo Municipio is $43,304, with the highest median household income of $59,679 found in the 45 to 64 years age bracket for the primary householder. A total of 13,130 households (39.2%) fall into this category. Meanwhile, the 15 to 24 years age bracket for the primary householder has the lowest median household income of $0, with 254 households (0.8%) in this group.
| Income Bracket | # Households | Median Income |
| 15 to 24 Years | 254 (0.8%) | $0 |
| 25 to 44 Years | 6,989 (20.9%) | $50,675 |
| 45 to 64 Years | 13,130 (39.2%) | $59,679 |
| 65+ Years | 13,091 (39.1%) | $30,940 |
| Total | 33,464 (100.0%) | $43,304 |
Poverty in Guaynabo Municipio
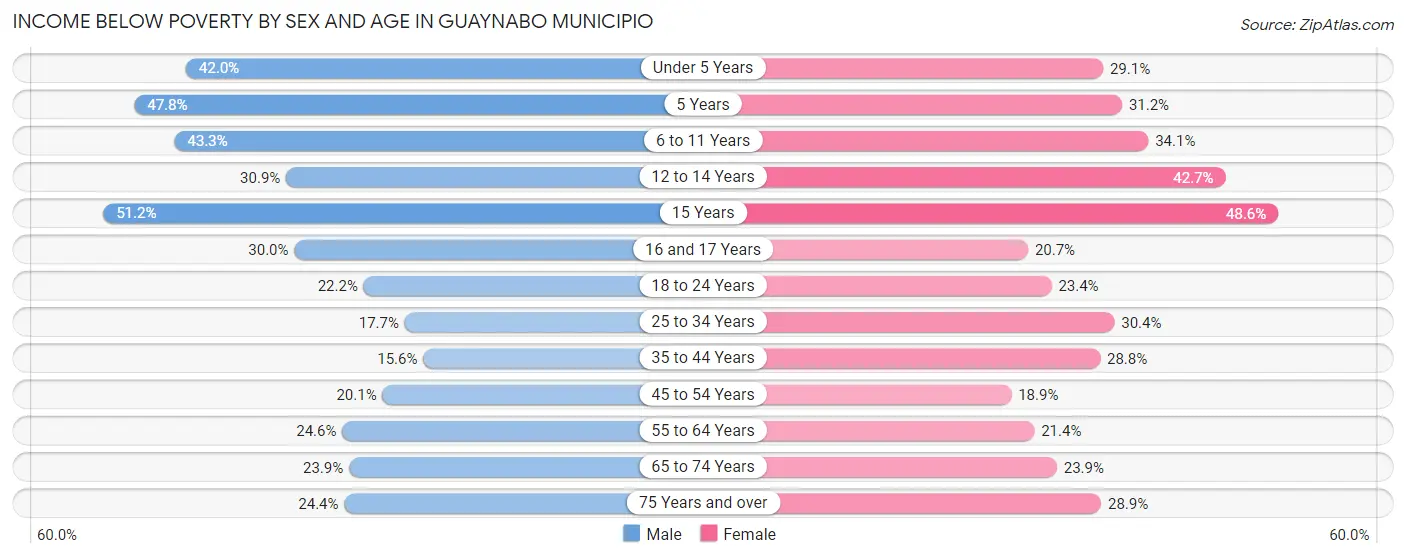
Income Below Poverty by Sex and Age in Guaynabo Municipio
With 24.0% poverty level for males and 26.1% for females among the residents of Guaynabo Municipio, 15 year old males and 15 year old females are the most vulnerable to poverty, with 207 males (51.2%) and 172 females (48.6%) in their respective age groups living below the poverty level.
| Age Bracket | Male | Female |
| Under 5 Years | 609 (42.0%) | 400 (29.1%) |
| 5 Years | 97 (47.8%) | 107 (31.2%) |
| 6 to 11 Years | 1,103 (43.3%) | 728 (34.1%) |
| 12 to 14 Years | 355 (30.9%) | 546 (42.7%) |
| 15 Years | 207 (51.2%) | 172 (48.6%) |
| 16 and 17 Years | 302 (30.0%) | 211 (20.7%) |
| 18 to 24 Years | 877 (22.2%) | 819 (23.4%) |
| 25 to 34 Years | 1,090 (17.7%) | 1,725 (30.3%) |
| 35 to 44 Years | 820 (15.6%) | 1,601 (28.8%) |
| 45 to 54 Years | 1,062 (20.1%) | 1,170 (18.9%) |
| 55 to 64 Years | 1,394 (24.6%) | 1,568 (21.4%) |
| 65 to 74 Years | 1,146 (23.9%) | 1,499 (23.9%) |
| 75 Years and over | 966 (24.4%) | 1,822 (28.9%) |
| Total | 10,028 (24.0%) | 12,368 (26.1%) |
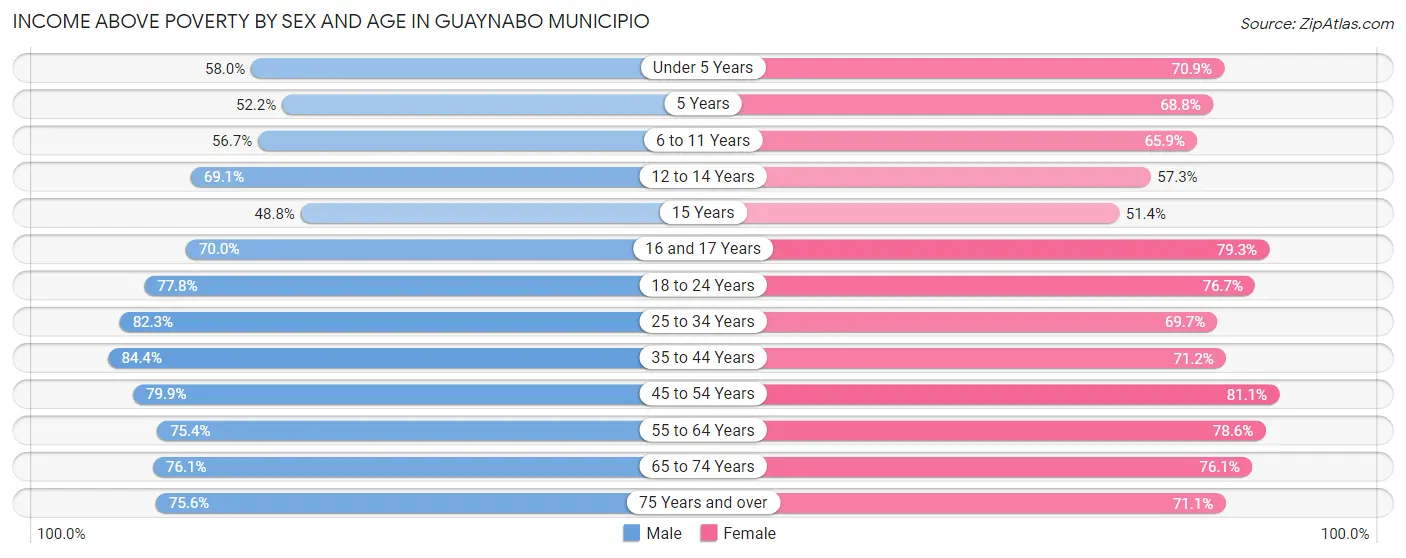
Income Above Poverty by Sex and Age in Guaynabo Municipio
According to the poverty statistics in Guaynabo Municipio, males aged 35 to 44 years and females aged 45 to 54 years are the age groups that are most secure financially, with 84.4% of males and 81.1% of females in these age groups living above the poverty line.
| Age Bracket | Male | Female |
| Under 5 Years | 840 (58.0%) | 975 (70.9%) |
| 5 Years | 106 (52.2%) | 236 (68.8%) |
| 6 to 11 Years | 1,443 (56.7%) | 1,405 (65.9%) |
| 12 to 14 Years | 795 (69.1%) | 732 (57.3%) |
| 15 Years | 197 (48.8%) | 182 (51.4%) |
| 16 and 17 Years | 706 (70.0%) | 807 (79.3%) |
| 18 to 24 Years | 3,069 (77.8%) | 2,688 (76.6%) |
| 25 to 34 Years | 5,083 (82.3%) | 3,958 (69.7%) |
| 35 to 44 Years | 4,437 (84.4%) | 3,966 (71.2%) |
| 45 to 54 Years | 4,210 (79.9%) | 5,030 (81.1%) |
| 55 to 64 Years | 4,268 (75.4%) | 5,748 (78.6%) |
| 65 to 74 Years | 3,655 (76.1%) | 4,763 (76.1%) |
| 75 Years and over | 2,994 (75.6%) | 4,489 (71.1%) |
| Total | 31,803 (76.0%) | 34,979 (73.9%) |
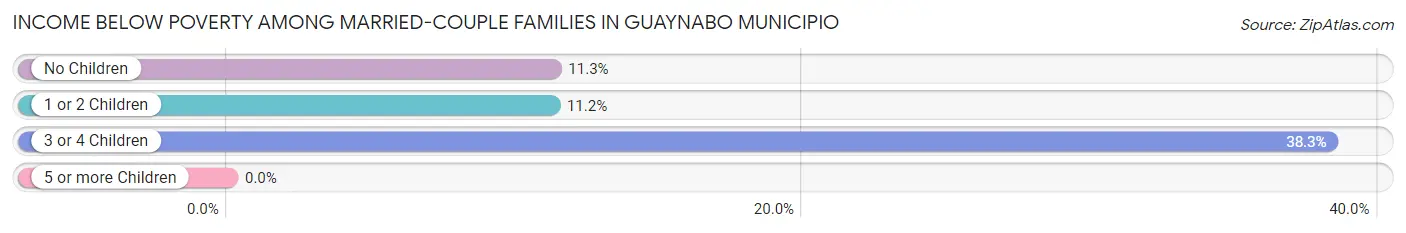
Income Below Poverty Among Married-Couple Families in Guaynabo Municipio
The poverty statistics for married-couple families in Guaynabo Municipio show that 11.7% or 1,556 of the total 13,350 families live below the poverty line. Families with 3 or 4 children have the highest poverty rate of 38.3%, comprising of 77 families. On the other hand, families with 1 or 2 children have the lowest poverty rate of 11.2%, which includes 384 families.
| Children | Above Poverty | Below Poverty |
| No Children | 8,630 (88.7%) | 1,095 (11.3%) |
| 1 or 2 Children | 3,040 (88.8%) | 384 (11.2%) |
| 3 or 4 Children | 124 (61.7%) | 77 (38.3%) |
| 5 or more Children | 0 (0.0%) | 0 (0.0%) |
| Total | 11,794 (88.3%) | 1,556 (11.7%) |
Income Below Poverty Among Single-Parent Households in Guaynabo Municipio
According to the poverty data in Guaynabo Municipio, 34.9% or 670 single-father households and 38.8% or 2,340 single-mother households are living below the poverty line. Among single-father households, those with 1 or 2 children have the highest poverty rate, with 539 households (61.1%) experiencing poverty. Likewise, among single-mother households, those with 5 or more children have the highest poverty rate, with 17 households (100.0%) falling below the poverty line.
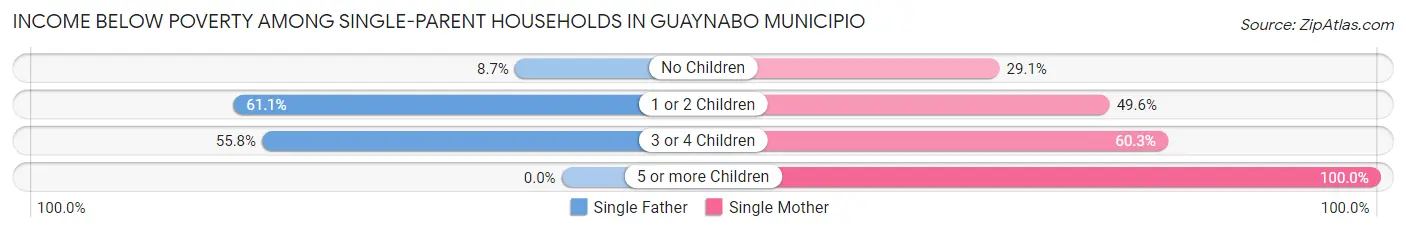
| Children | Single Father | Single Mother |
| No Children | 83 (8.7%) | 946 (29.0%) |
| 1 or 2 Children | 539 (61.1%) | 1,307 (49.6%) |
| 3 or 4 Children | 48 (55.8%) | 70 (60.3%) |
| 5 or more Children | 0 (0.0%) | 17 (100.0%) |
| Total | 670 (34.9%) | 2,340 (38.8%) |
Income Below Poverty Among Married-Couple vs Single-Parent Households in Guaynabo Municipio
The poverty data for Guaynabo Municipio shows that 1,556 of the married-couple family households (11.7%) and 3,010 of the single-parent households (37.9%) are living below the poverty level. Within the married-couple family households, those with 3 or 4 children have the highest poverty rate, with 77 households (38.3%) falling below the poverty line. Among the single-parent households, those with 5 or more children have the highest poverty rate, with 17 household (100.0%) living below poverty.
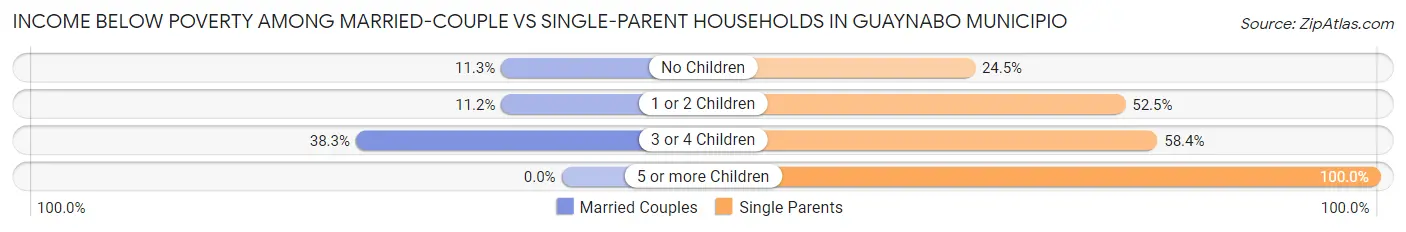
| Children | Married-Couple Families | Single-Parent Households |
| No Children | 1,095 (11.3%) | 1,029 (24.4%) |
| 1 or 2 Children | 384 (11.2%) | 1,846 (52.5%) |
| 3 or 4 Children | 77 (38.3%) | 118 (58.4%) |
| 5 or more Children | 0 (0.0%) | 17 (100.0%) |
| Total | 1,556 (11.7%) | 3,010 (37.9%) |
Race in Guaynabo Municipio
The most populous races in Guaynabo Municipio are Hispanic or Latino (88,184 | 98.5%), White / Caucasian (34,987 | 39.1%), and Two or more Races (32,855 | 36.7%).
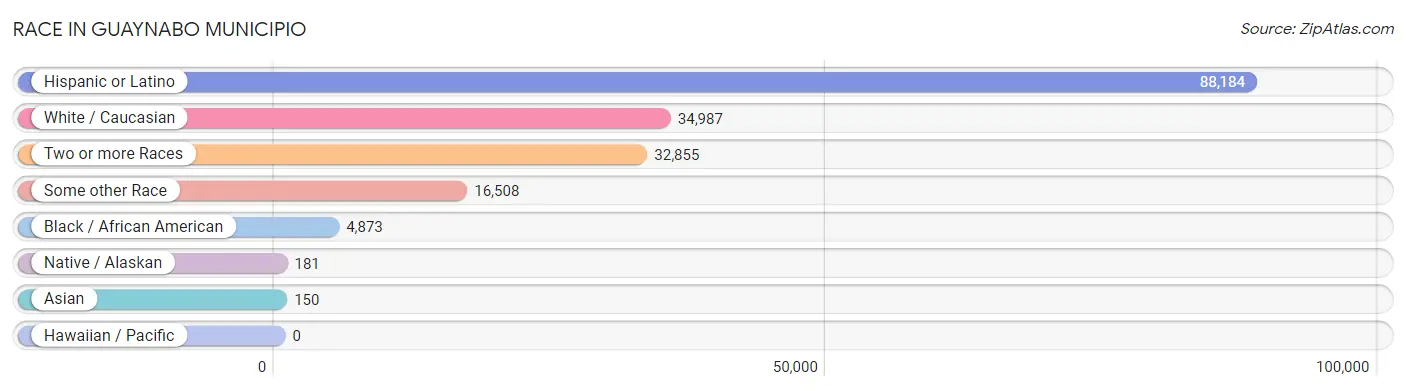
| Race | # Population | % Population |
| Asian | 150 | 0.2% |
| Black / African American | 4,873 | 5.4% |
| Hawaiian / Pacific | 0 | 0.0% |
| Hispanic or Latino | 88,184 | 98.5% |
| Native / Alaskan | 181 | 0.2% |
| White / Caucasian | 34,987 | 39.1% |
| Two or more Races | 32,855 | 36.7% |
| Some other Race | 16,508 | 18.4% |
| Total | 89,554 | 100.0% |
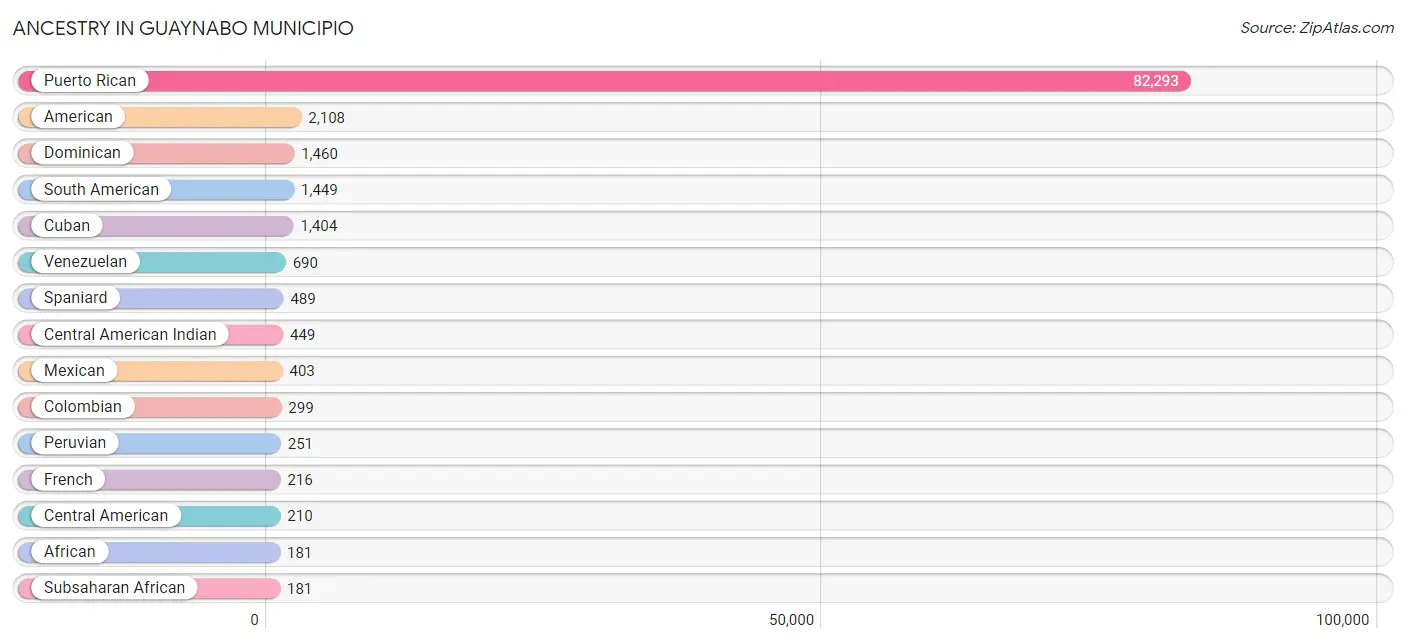
Ancestry in Guaynabo Municipio
The most populous ancestries reported in Guaynabo Municipio are Puerto Rican (82,293 | 91.9%), American (2,108 | 2.4%), Dominican (1,460 | 1.6%), South American (1,449 | 1.6%), and Cuban (1,404 | 1.6%), together accounting for 99.1% of all Guaynabo Municipio residents.
| Ancestry | # Population | % Population |
| African | 181 | 0.2% |
| American | 2,108 | 2.4% |
| Apache | 14 | 0.0% |
| Arab | 101 | 0.1% |
| Argentinean | 77 | 0.1% |
| Austrian | 25 | 0.0% |
| Belgian | 11 | 0.0% |
| Brazilian | 17 | 0.0% |
| British | 34 | 0.0% |
| British West Indian | 75 | 0.1% |
| Central American | 210 | 0.2% |
| Central American Indian | 449 | 0.5% |
| Chilean | 30 | 0.0% |
| Colombian | 299 | 0.3% |
| Costa Rican | 53 | 0.1% |
| Cuban | 1,404 | 1.6% |
| Danish | 9 | 0.0% |
| Dominican | 1,460 | 1.6% |
| Ecuadorian | 63 | 0.1% |
| English | 32 | 0.0% |
| European | 64 | 0.1% |
| Finnish | 11 | 0.0% |
| French | 216 | 0.2% |
| French Canadian | 4 | 0.0% |
| German | 78 | 0.1% |
| Greek | 68 | 0.1% |
| Guatemalan | 50 | 0.1% |
| Haitian | 91 | 0.1% |
| Indian (Asian) | 85 | 0.1% |
| Iraqi | 19 | 0.0% |
| Irish | 68 | 0.1% |
| Italian | 134 | 0.2% |
| Korean | 90 | 0.1% |
| Lebanese | 82 | 0.1% |
| Mexican | 403 | 0.4% |
| Native Hawaiian | 44 | 0.1% |
| Nicaraguan | 48 | 0.1% |
| Osage | 16 | 0.0% |
| Panamanian | 26 | 0.0% |
| Paraguayan | 18 | 0.0% |
| Peruvian | 251 | 0.3% |
| Polish | 27 | 0.0% |
| Portuguese | 11 | 0.0% |
| Puerto Rican | 82,293 | 91.9% |
| Romanian | 21 | 0.0% |
| Salvadoran | 33 | 0.0% |
| South American | 1,449 | 1.6% |
| South American Indian | 43 | 0.1% |
| Spaniard | 489 | 0.5% |
| Spanish American Indian | 8 | 0.0% |
| Subsaharan African | 181 | 0.2% |
| Thai | 69 | 0.1% |
| Uruguayan | 21 | 0.0% |
| Venezuelan | 690 | 0.8% |
| Welsh | 4 | 0.0% |
| West Indian | 64 | 0.1% | View All 56 Rows |
Immigrants in Guaynabo Municipio

| Immigration Origin | # Population | % Population | View All 0 Rows |
Sex and Age in Guaynabo Municipio
Sex and Age in Guaynabo Municipio
The most populous age groups in Guaynabo Municipio are 25 to 29 Years (3,279 | 7.8%) for men and 55 to 59 Years (3,727 | 7.8%) for women.
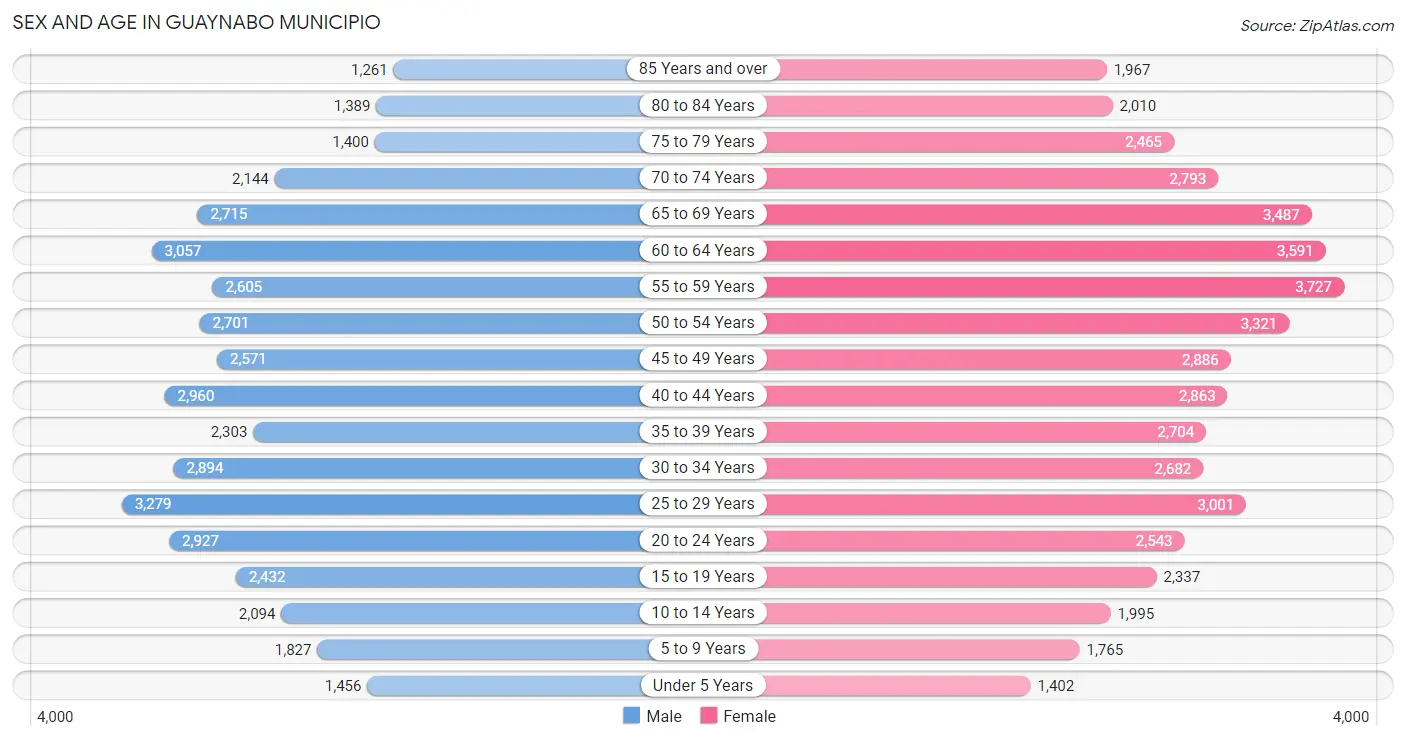
| Age Bracket | Male | Female |
| Under 5 Years | 1,456 (3.5%) | 1,402 (2.9%) |
| 5 to 9 Years | 1,827 (4.3%) | 1,765 (3.7%) |
| 10 to 14 Years | 2,094 (5.0%) | 1,995 (4.2%) |
| 15 to 19 Years | 2,432 (5.8%) | 2,337 (4.9%) |
| 20 to 24 Years | 2,927 (7.0%) | 2,543 (5.3%) |
| 25 to 29 Years | 3,279 (7.8%) | 3,001 (6.3%) |
| 30 to 34 Years | 2,894 (6.9%) | 2,682 (5.6%) |
| 35 to 39 Years | 2,303 (5.5%) | 2,704 (5.7%) |
| 40 to 44 Years | 2,960 (7.0%) | 2,863 (6.0%) |
| 45 to 49 Years | 2,571 (6.1%) | 2,886 (6.1%) |
| 50 to 54 Years | 2,701 (6.4%) | 3,321 (7.0%) |
| 55 to 59 Years | 2,605 (6.2%) | 3,727 (7.8%) |
| 60 to 64 Years | 3,057 (7.3%) | 3,591 (7.5%) |
| 65 to 69 Years | 2,715 (6.5%) | 3,487 (7.3%) |
| 70 to 74 Years | 2,144 (5.1%) | 2,793 (5.9%) |
| 75 to 79 Years | 1,400 (3.3%) | 2,465 (5.2%) |
| 80 to 84 Years | 1,389 (3.3%) | 2,010 (4.2%) |
| 85 Years and over | 1,261 (3.0%) | 1,967 (4.1%) |
| Total | 42,015 (100.0%) | 47,539 (100.0%) |
Families and Households in Guaynabo Municipio
Median Family Size in Guaynabo Municipio
The median family size in Guaynabo Municipio is 3.40 persons per family, with single male/father families (1,920 | 9.0%) accounting for the largest median family size of 3.52 persons per family. On the other hand, married-couple families (13,350 | 62.7%) represent the smallest median family size with 3.35 persons per family.
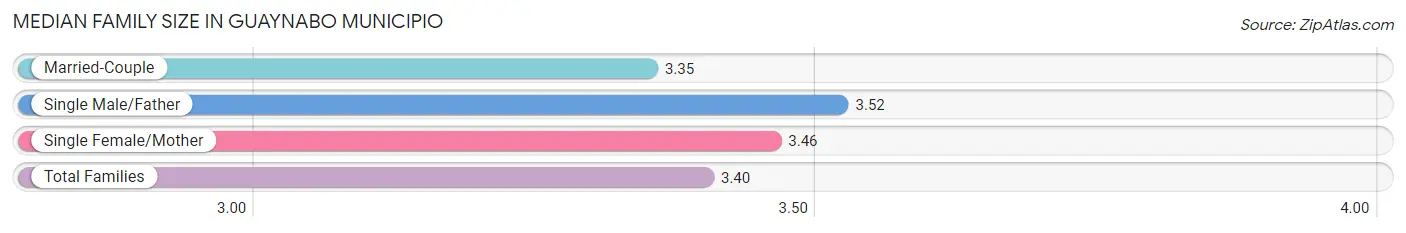
| Family Type | # Families | Family Size |
| Married-Couple | 13,350 (62.7%) | 3.35 |
| Single Male/Father | 1,920 (9.0%) | 3.52 |
| Single Female/Mother | 6,026 (28.3%) | 3.46 |
| Total Families | 21,296 (100.0%) | 3.40 |
Median Household Size in Guaynabo Municipio
The median household size in Guaynabo Municipio is 2.66 persons per household, with single male/father households (1,920 | 5.7%) accounting for the largest median household size of 3.95 persons per household. non-family households (12,168 | 36.4%) represent the smallest median household size with 1.17 persons per household.
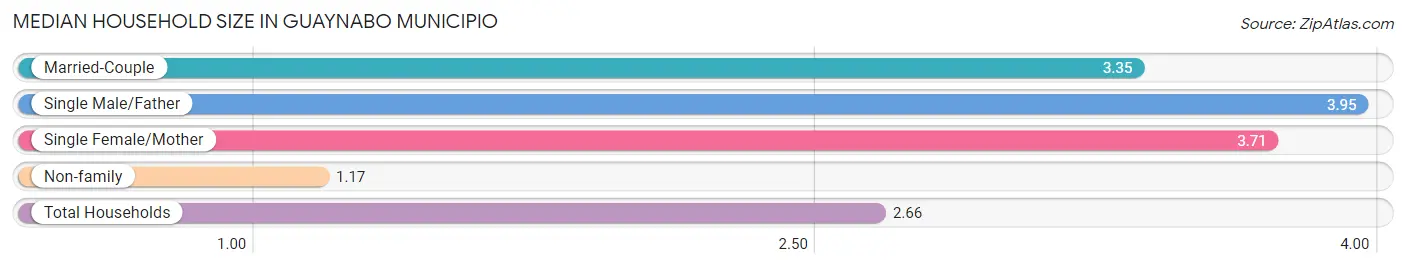
| Household Type | # Households | Household Size |
| Married-Couple | 13,350 (39.9%) | 3.35 |
| Single Male/Father | 1,920 (5.7%) | 3.95 |
| Single Female/Mother | 6,026 (18.0%) | 3.71 |
| Non-family | 12,168 (36.4%) | 1.17 |
| Total Households | 33,464 (100.0%) | 2.66 |
Household Size by Marriage Status in Guaynabo Municipio
Out of a total of 33,464 households in Guaynabo Municipio, 21,296 (63.6%) are family households, while 12,168 (36.4%) are nonfamily households. The most numerous type of family households are 2-person households, comprising 9,935, and the most common type of nonfamily households are 1-person households, comprising 10,414.
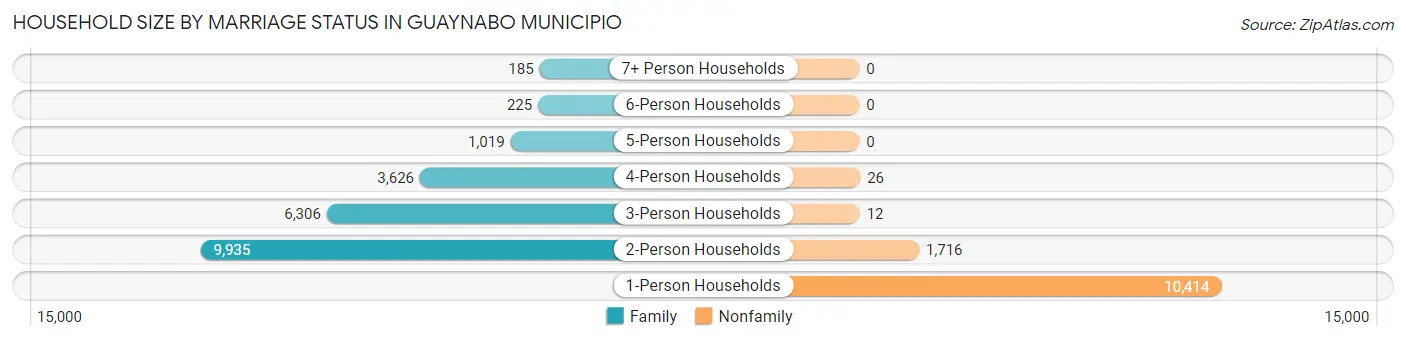
| Household Size | Family Households | Nonfamily Households |
| 1-Person Households | - | 10,414 (31.1%) |
| 2-Person Households | 9,935 (29.7%) | 1,716 (5.1%) |
| 3-Person Households | 6,306 (18.8%) | 12 (0.0%) |
| 4-Person Households | 3,626 (10.8%) | 26 (0.1%) |
| 5-Person Households | 1,019 (3.0%) | 0 (0.0%) |
| 6-Person Households | 225 (0.7%) | 0 (0.0%) |
| 7+ Person Households | 185 (0.5%) | 0 (0.0%) |
| Total | 21,296 (63.6%) | 12,168 (36.4%) |
Female Fertility in Guaynabo Municipio
Fertility by Age in Guaynabo Municipio
Average fertility rate in Guaynabo Municipio is 14.0 births per 1,000 women. Women in the age bracket of 20 to 34 years have the highest fertility rate with 25.0 births per 1,000 women. Women in the age bracket of 20 to 34 years acount for 75.3% of all women with births.
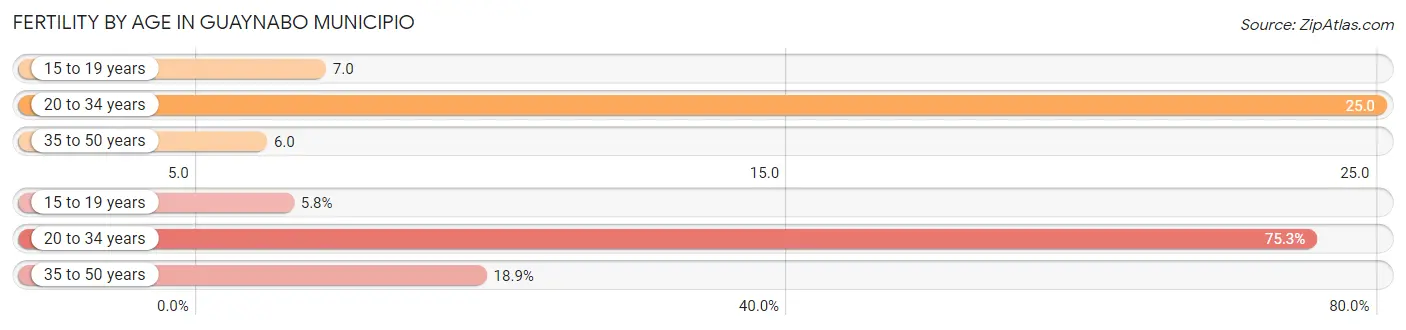
| Age Bracket | Women with Births | Births / 1,000 Women |
| 15 to 19 years | 16 (5.8%) | 7.0 |
| 20 to 34 years | 207 (75.3%) | 25.0 |
| 35 to 50 years | 52 (18.9%) | 6.0 |
| Total | 275 (100.0%) | 14.0 |
Fertility by Age by Marriage Status in Guaynabo Municipio
39.6% of women with births (275) in Guaynabo Municipio are married. The highest percentage of unmarried women with births falls into 15 to 19 years age bracket with 100.0% of them unmarried at the time of birth, while the lowest percentage of unmarried women with births belong to 35 to 50 years age bracket with 46.2% of them unmarried.
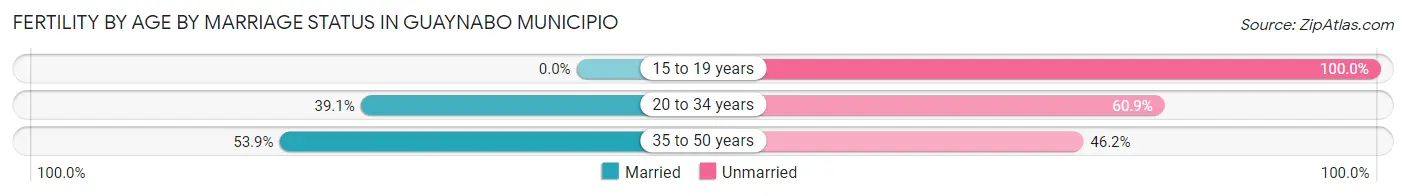
| Age Bracket | Married | Unmarried |
| 15 to 19 years | 0 (0.0%) | 16 (100.0%) |
| 20 to 34 years | 81 (39.1%) | 126 (60.9%) |
| 35 to 50 years | 28 (53.8%) | 24 (46.2%) |
| Total | 109 (39.6%) | 166 (60.4%) |
Fertility by Education in Guaynabo Municipio
Average fertility rate in Guaynabo Municipio is 14.0 births per 1,000 women. Women with the education attainment of high school diploma have the highest fertility rate of 21.0 births per 1,000 women, while women with the education attainment of college or associate's degree have the lowest fertility at 7.0 births per 1,000 women. Women with the education attainment of bachelor's degree represent 29.1% of all women with births.
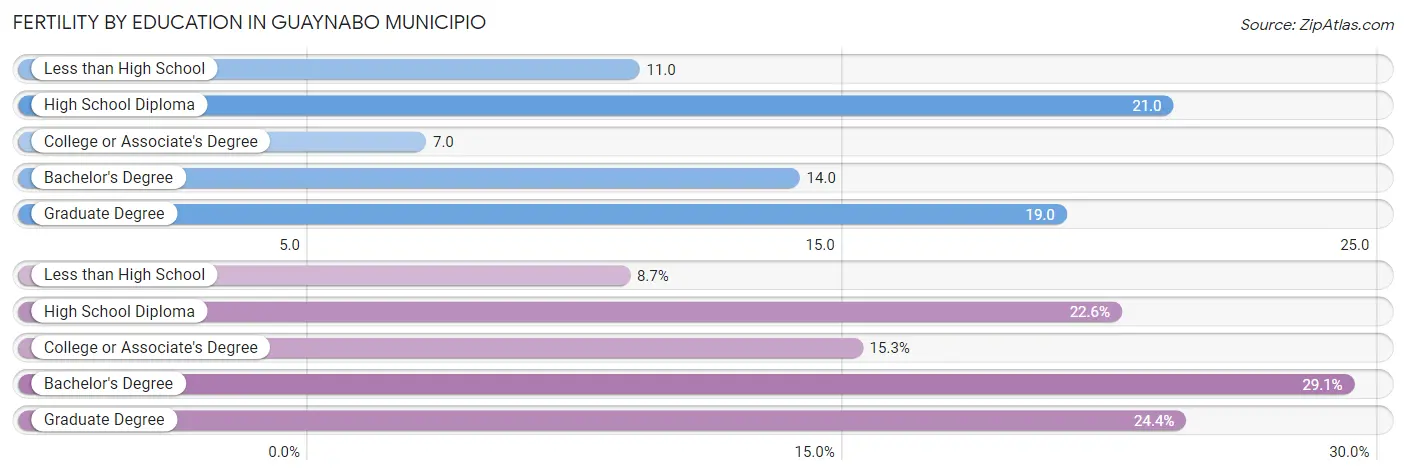
| Educational Attainment | Women with Births | Births / 1,000 Women |
| Less than High School | 24 (8.7%) | 11.0 |
| High School Diploma | 62 (22.6%) | 21.0 |
| College or Associate's Degree | 42 (15.3%) | 7.0 |
| Bachelor's Degree | 80 (29.1%) | 14.0 |
| Graduate Degree | 67 (24.4%) | 19.0 |
| Total | 275 (100.0%) | 14.0 |
Fertility by Education by Marriage Status in Guaynabo Municipio
60.4% of women with births in Guaynabo Municipio are unmarried. Women with the educational attainment of graduate degree are most likely to be married with 100.0% of them married at childbirth, while women with the educational attainment of less than high school are least likely to be married with 100.0% of them unmarried at childbirth.
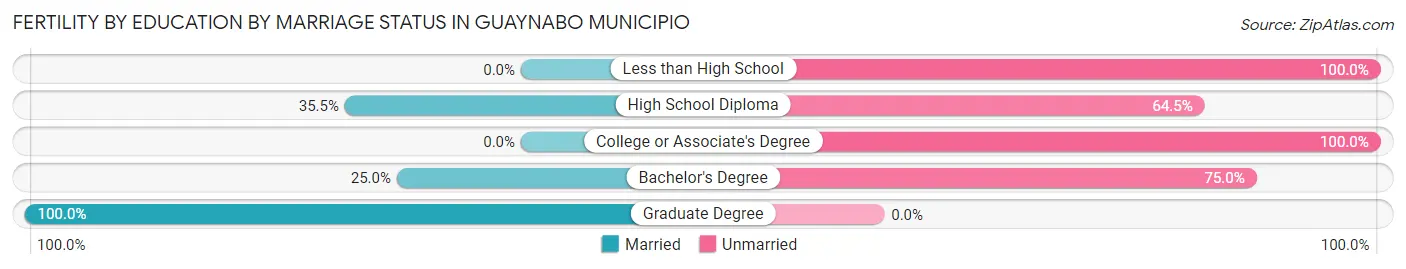
| Educational Attainment | Married | Unmarried |
| Less than High School | 0 (0.0%) | 24 (100.0%) |
| High School Diploma | 22 (35.5%) | 40 (64.5%) |
| College or Associate's Degree | 0 (0.0%) | 42 (100.0%) |
| Bachelor's Degree | 20 (25.0%) | 60 (75.0%) |
| Graduate Degree | 67 (100.0%) | 0 (0.0%) |
| Total | 109 (39.6%) | 166 (60.4%) |
Employment Characteristics in Guaynabo Municipio
Employment by Class of Employer in Guaynabo Municipio
Among the 36,585 employed individuals in Guaynabo Municipio, private company employees (22,219 | 60.7%), self-employed (not incorporated) (4,404 | 12.0%), and state government employees (2,724 | 7.4%) make up the most common classes of employment.

| Employer Class | # Employees | % Employees |
| Private Company Employees | 22,219 | 60.7% |
| Self-Employed (Incorporated) | 1,965 | 5.4% |
| Self-Employed (Not Incorporated) | 4,404 | 12.0% |
| Not-for-profit Organizations | 1,455 | 4.0% |
| Local Government Employees | 2,153 | 5.9% |
| State Government Employees | 2,724 | 7.4% |
| Federal Government Employees | 1,554 | 4.3% |
| Unpaid Family Workers | 111 | 0.3% |
| Total | 36,585 | 100.0% |
Employment Status by Age in Guaynabo Municipio
According to the labor force statistics for Guaynabo Municipio, out of the total population over 16 years of age (78,257), 52.1% or 40,772 individuals are in the labor force, with 8.2% or 3,343 of them unemployed. The age group with the highest labor force participation rate is 30 to 34 years, with 85.3% or 4,756 individuals in the labor force. Within the labor force, the 16 to 19 years age range has the highest percentage of unemployed individuals, with 37.2% or 180 of them being unemployed.
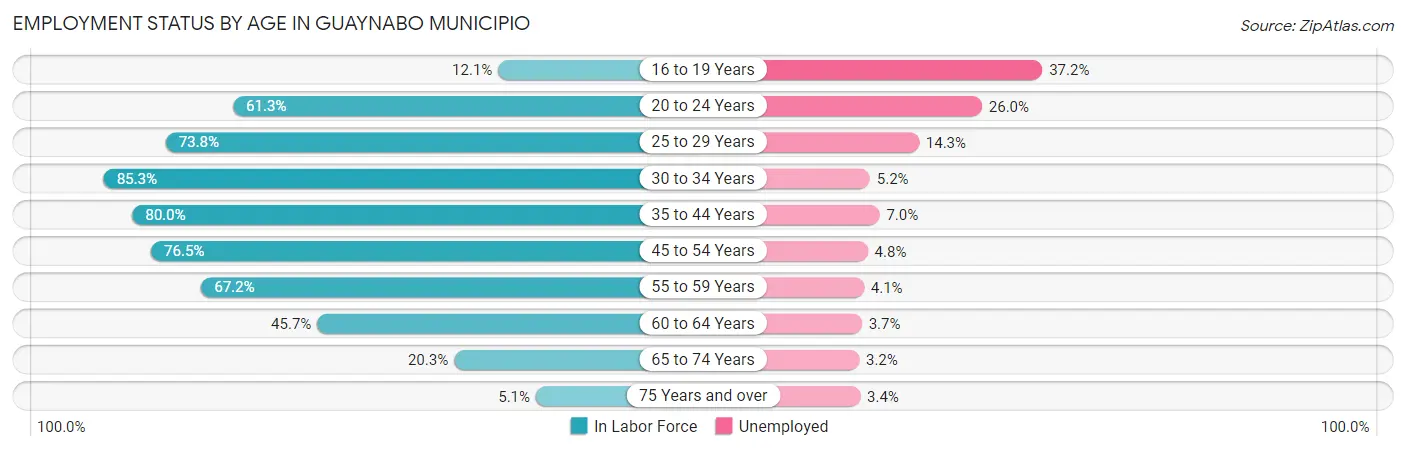
| Age Bracket | In Labor Force | Unemployed |
| 16 to 19 Years | 485 (12.1%) | 180 (37.2%) |
| 20 to 24 Years | 3,353 (61.3%) | 872 (26.0%) |
| 25 to 29 Years | 4,635 (73.8%) | 663 (14.3%) |
| 30 to 34 Years | 4,756 (85.3%) | 247 (5.2%) |
| 35 to 44 Years | 8,664 (80.0%) | 606 (7.0%) |
| 45 to 54 Years | 8,781 (76.5%) | 421 (4.8%) |
| 55 to 59 Years | 4,255 (67.2%) | 174 (4.1%) |
| 60 to 64 Years | 3,038 (45.7%) | 112 (3.7%) |
| 65 to 74 Years | 2,261 (20.3%) | 72 (3.2%) |
| 75 Years and over | 535 (5.1%) | 18 (3.4%) |
| Total | 40,772 (52.1%) | 3,343 (8.2%) |
Employment Status by Educational Attainment in Guaynabo Municipio
According to labor force statistics for Guaynabo Municipio, 72.4% of individuals (34,133) out of the total population between 25 and 64 years of age (47,145) are in the labor force, with 6.5% or 2,219 of them being unemployed. The group with the highest labor force participation rate are those with the educational attainment of bachelor's degree or higher, with 81.4% or 20,028 individuals in the labor force. Within the labor force, individuals with less than high school education have the highest percentage of unemployment, with 23.7% or 347 of them being unemployed.
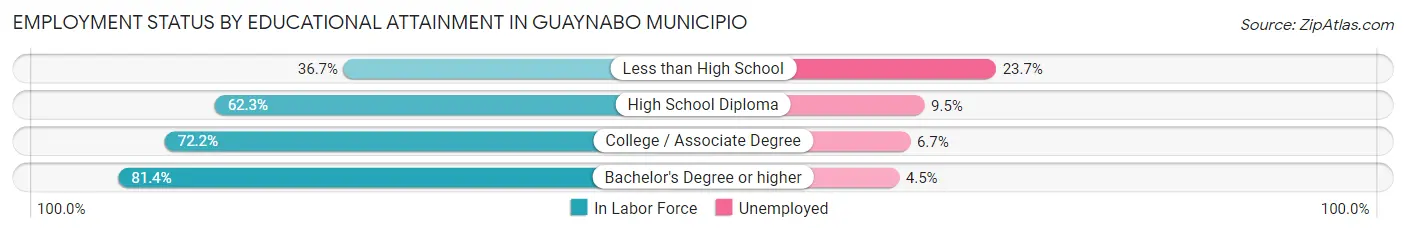
| Educational Attainment | In Labor Force | Unemployed |
| Less than High School | 1,463 (36.7%) | 945 (23.7%) |
| High School Diploma | 4,767 (62.3%) | 727 (9.5%) |
| College / Associate Degree | 7,872 (72.2%) | 731 (6.7%) |
| Bachelor's Degree or higher | 20,028 (81.4%) | 1,107 (4.5%) |
| Total | 34,133 (72.4%) | 3,064 (6.5%) |
Employment Occupations by Sex in Guaynabo Municipio
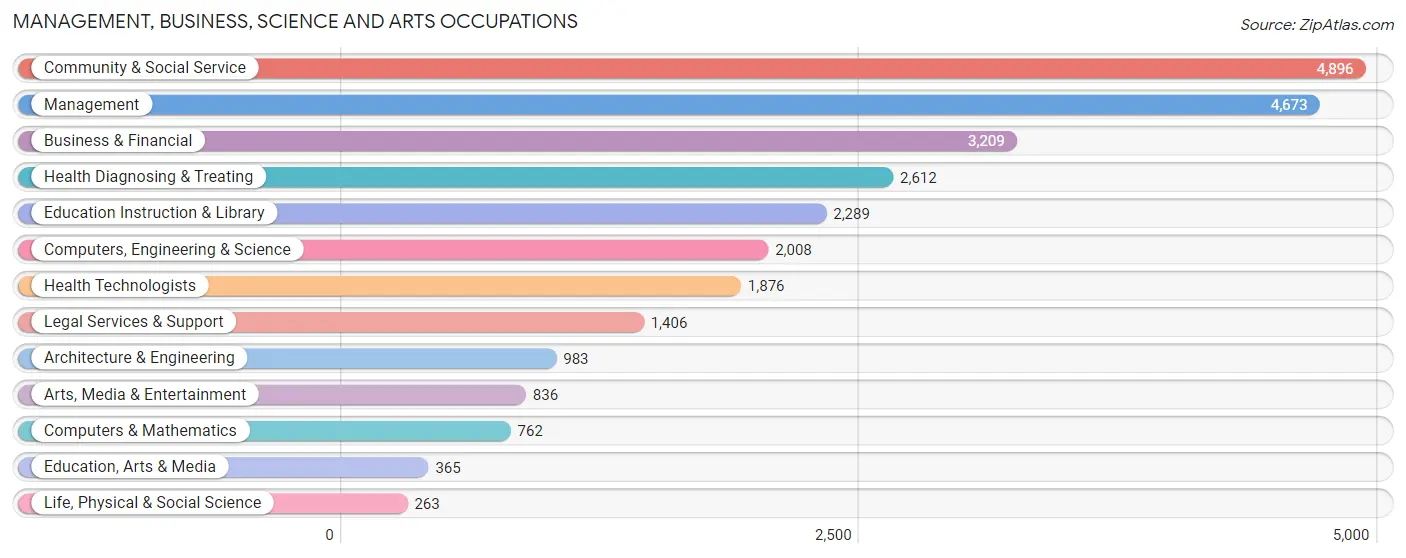
Management, Business, Science and Arts Occupations
The most common Management, Business, Science and Arts occupations in Guaynabo Municipio are Community & Social Service (4,896 | 13.2%), Management (4,673 | 12.6%), Business & Financial (3,209 | 8.6%), Health Diagnosing & Treating (2,612 | 7.0%), and Education Instruction & Library (2,289 | 6.2%).
Management, Business, Science and Arts Occupations by Sex
Within the Management, Business, Science and Arts occupations in Guaynabo Municipio, the most male-oriented occupations are Architecture & Engineering (81.9%), Computers, Engineering & Science (74.0%), and Computers & Mathematics (68.9%), while the most female-oriented occupations are Education Instruction & Library (74.7%), Education, Arts & Media (63.8%), and Community & Social Service (60.4%).
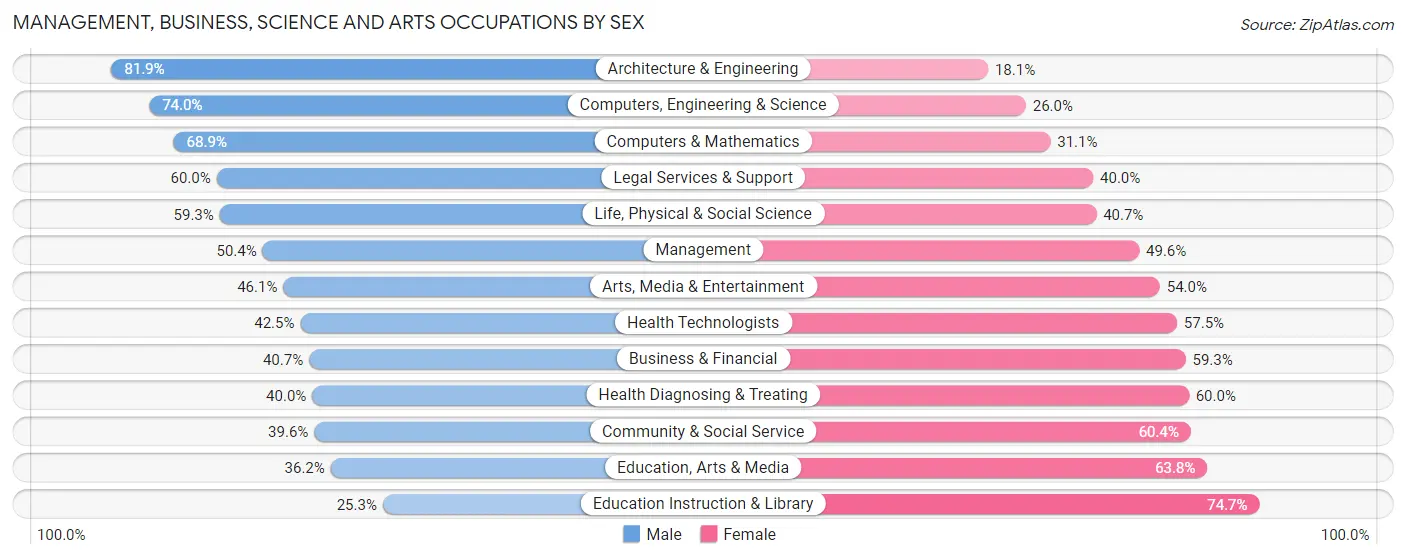
| Occupation | Male | Female |
| Management | 2,354 (50.4%) | 2,319 (49.6%) |
| Business & Financial | 1,305 (40.7%) | 1,904 (59.3%) |
| Computers, Engineering & Science | 1,486 (74.0%) | 522 (26.0%) |
| Computers & Mathematics | 525 (68.9%) | 237 (31.1%) |
| Architecture & Engineering | 805 (81.9%) | 178 (18.1%) |
| Life, Physical & Social Science | 156 (59.3%) | 107 (40.7%) |
| Community & Social Service | 1,939 (39.6%) | 2,957 (60.4%) |
| Education, Arts & Media | 132 (36.2%) | 233 (63.8%) |
| Legal Services & Support | 843 (60.0%) | 563 (40.0%) |
| Education Instruction & Library | 579 (25.3%) | 1,710 (74.7%) |
| Arts, Media & Entertainment | 385 (46.1%) | 451 (53.9%) |
| Health Diagnosing & Treating | 1,045 (40.0%) | 1,567 (60.0%) |
| Health Technologists | 797 (42.5%) | 1,079 (57.5%) |
| Total (Category) | 8,129 (46.7%) | 9,269 (53.3%) |
| Total (Overall) | 19,176 (51.6%) | 18,011 (48.4%) |
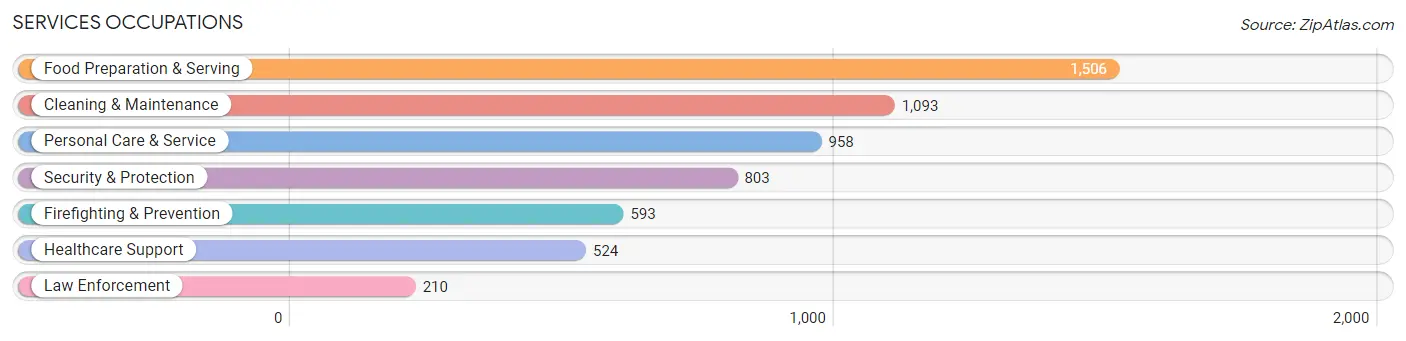
Services Occupations
The most common Services occupations in Guaynabo Municipio are Food Preparation & Serving (1,506 | 4.1%), Cleaning & Maintenance (1,093 | 2.9%), Personal Care & Service (958 | 2.6%), Security & Protection (803 | 2.2%), and Firefighting & Prevention (593 | 1.6%).
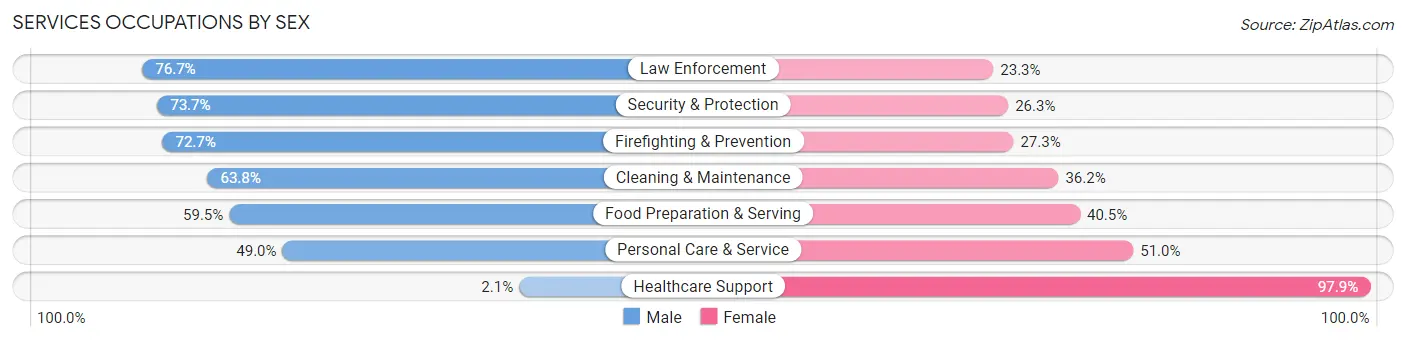
Services Occupations by Sex
Within the Services occupations in Guaynabo Municipio, the most male-oriented occupations are Law Enforcement (76.7%), Security & Protection (73.7%), and Firefighting & Prevention (72.7%), while the most female-oriented occupations are Healthcare Support (97.9%), Personal Care & Service (51.0%), and Food Preparation & Serving (40.5%).
| Occupation | Male | Female |
| Healthcare Support | 11 (2.1%) | 513 (97.9%) |
| Security & Protection | 592 (73.7%) | 211 (26.3%) |
| Firefighting & Prevention | 431 (72.7%) | 162 (27.3%) |
| Law Enforcement | 161 (76.7%) | 49 (23.3%) |
| Food Preparation & Serving | 896 (59.5%) | 610 (40.5%) |
| Cleaning & Maintenance | 697 (63.8%) | 396 (36.2%) |
| Personal Care & Service | 469 (49.0%) | 489 (51.0%) |
| Total (Category) | 2,665 (54.6%) | 2,219 (45.4%) |
| Total (Overall) | 19,176 (51.6%) | 18,011 (48.4%) |
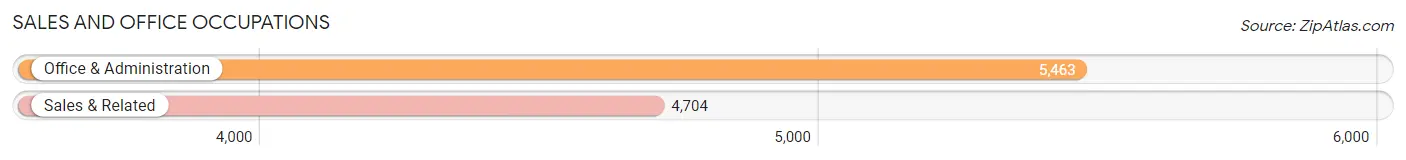
Sales and Office Occupations
The most common Sales and Office occupations in Guaynabo Municipio are Office & Administration (5,463 | 14.7%), and Sales & Related (4,704 | 12.7%).
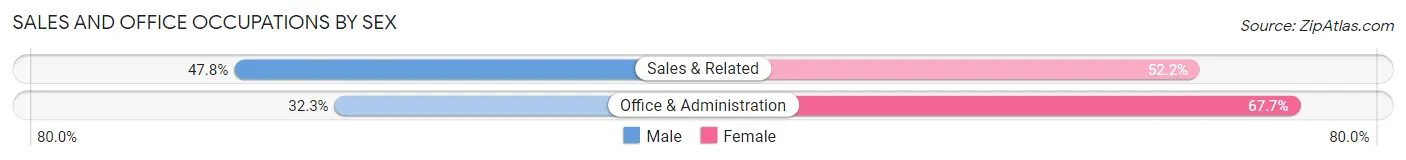
Sales and Office Occupations by Sex
| Occupation | Male | Female |
| Sales & Related | 2,248 (47.8%) | 2,456 (52.2%) |
| Office & Administration | 1,767 (32.3%) | 3,696 (67.7%) |
| Total (Category) | 4,015 (39.5%) | 6,152 (60.5%) |
| Total (Overall) | 19,176 (51.6%) | 18,011 (48.4%) |
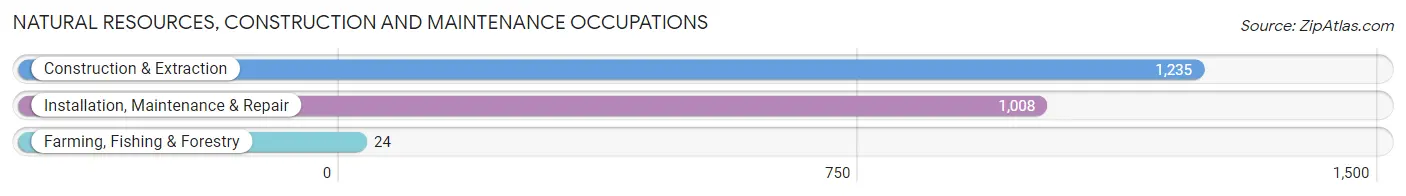
Natural Resources, Construction and Maintenance Occupations
The most common Natural Resources, Construction and Maintenance occupations in Guaynabo Municipio are Construction & Extraction (1,235 | 3.3%), Installation, Maintenance & Repair (1,008 | 2.7%), and Farming, Fishing & Forestry (24 | 0.1%).
Natural Resources, Construction and Maintenance Occupations by Sex
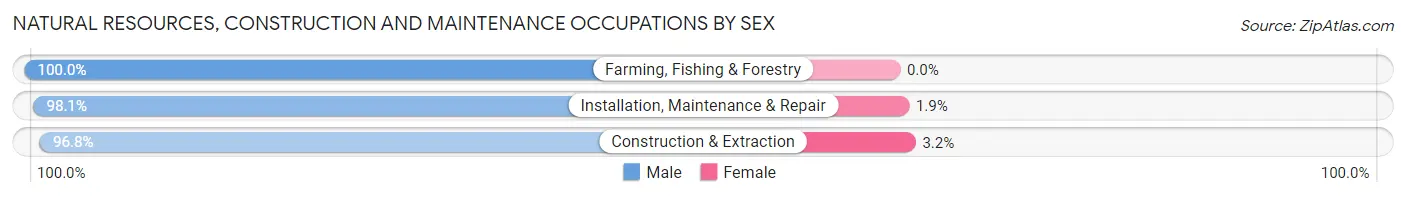
| Occupation | Male | Female |
| Farming, Fishing & Forestry | 24 (100.0%) | 0 (0.0%) |
| Construction & Extraction | 1,195 (96.8%) | 40 (3.2%) |
| Installation, Maintenance & Repair | 989 (98.1%) | 19 (1.9%) |
| Total (Category) | 2,208 (97.4%) | 59 (2.6%) |
| Total (Overall) | 19,176 (51.6%) | 18,011 (48.4%) |
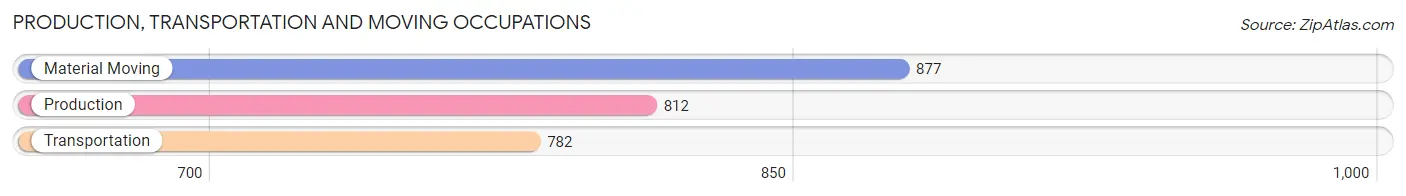
Production, Transportation and Moving Occupations
The most common Production, Transportation and Moving occupations in Guaynabo Municipio are Material Moving (877 | 2.4%), Production (812 | 2.2%), and Transportation (782 | 2.1%).
Production, Transportation and Moving Occupations by Sex
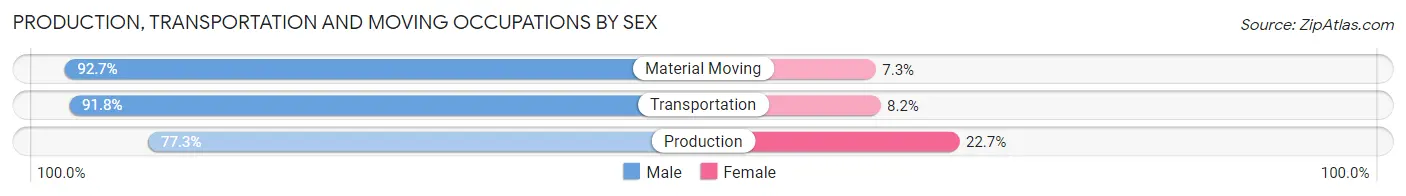
| Occupation | Male | Female |
| Production | 628 (77.3%) | 184 (22.7%) |
| Transportation | 718 (91.8%) | 64 (8.2%) |
| Material Moving | 813 (92.7%) | 64 (7.3%) |
| Total (Category) | 2,159 (87.4%) | 312 (12.6%) |
| Total (Overall) | 19,176 (51.6%) | 18,011 (48.4%) |
Employment Industries by Sex in Guaynabo Municipio
Employment Industries in Guaynabo Municipio
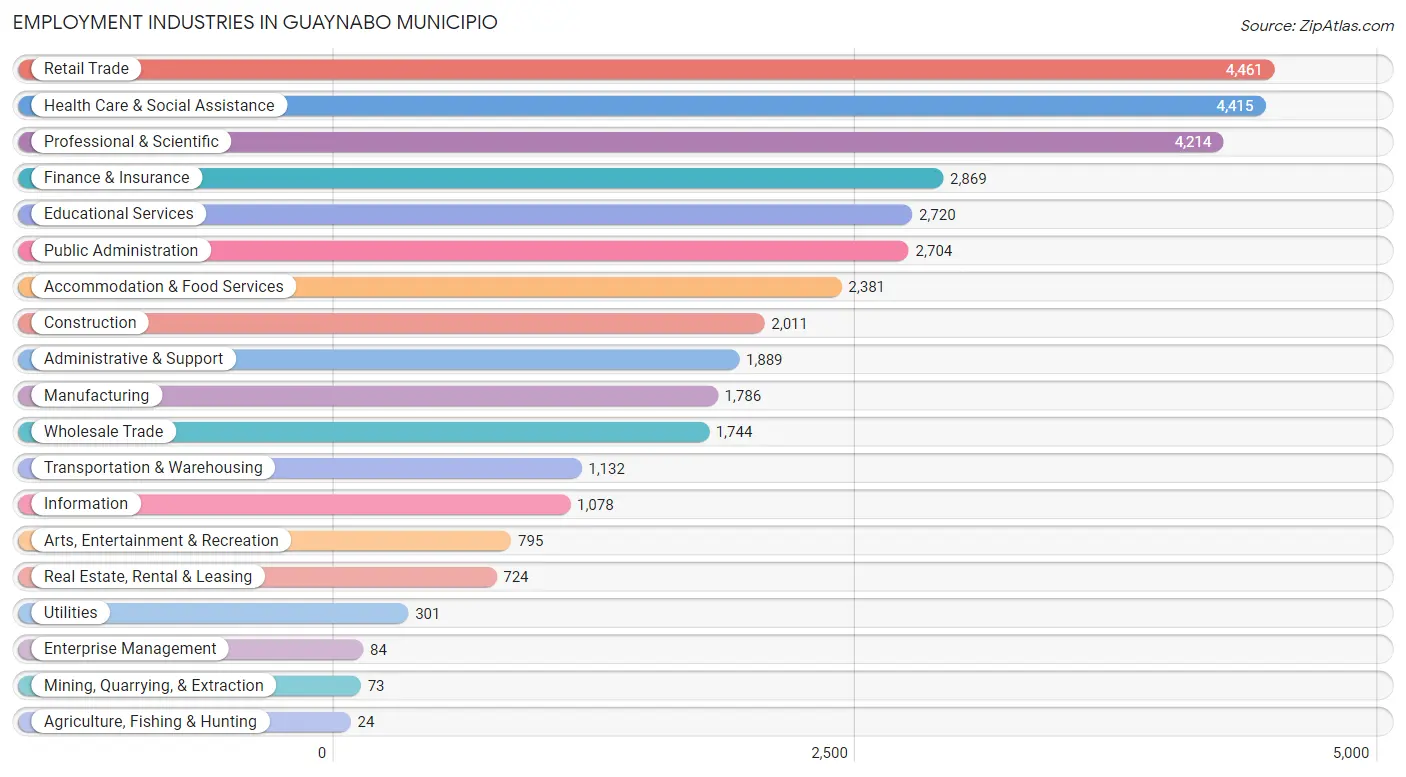
The major employment industries in Guaynabo Municipio include Retail Trade (4,461 | 12.0%), Health Care & Social Assistance (4,415 | 11.9%), Professional & Scientific (4,214 | 11.3%), Finance & Insurance (2,869 | 7.7%), and Educational Services (2,720 | 7.3%).
Employment Industries by Sex in Guaynabo Municipio
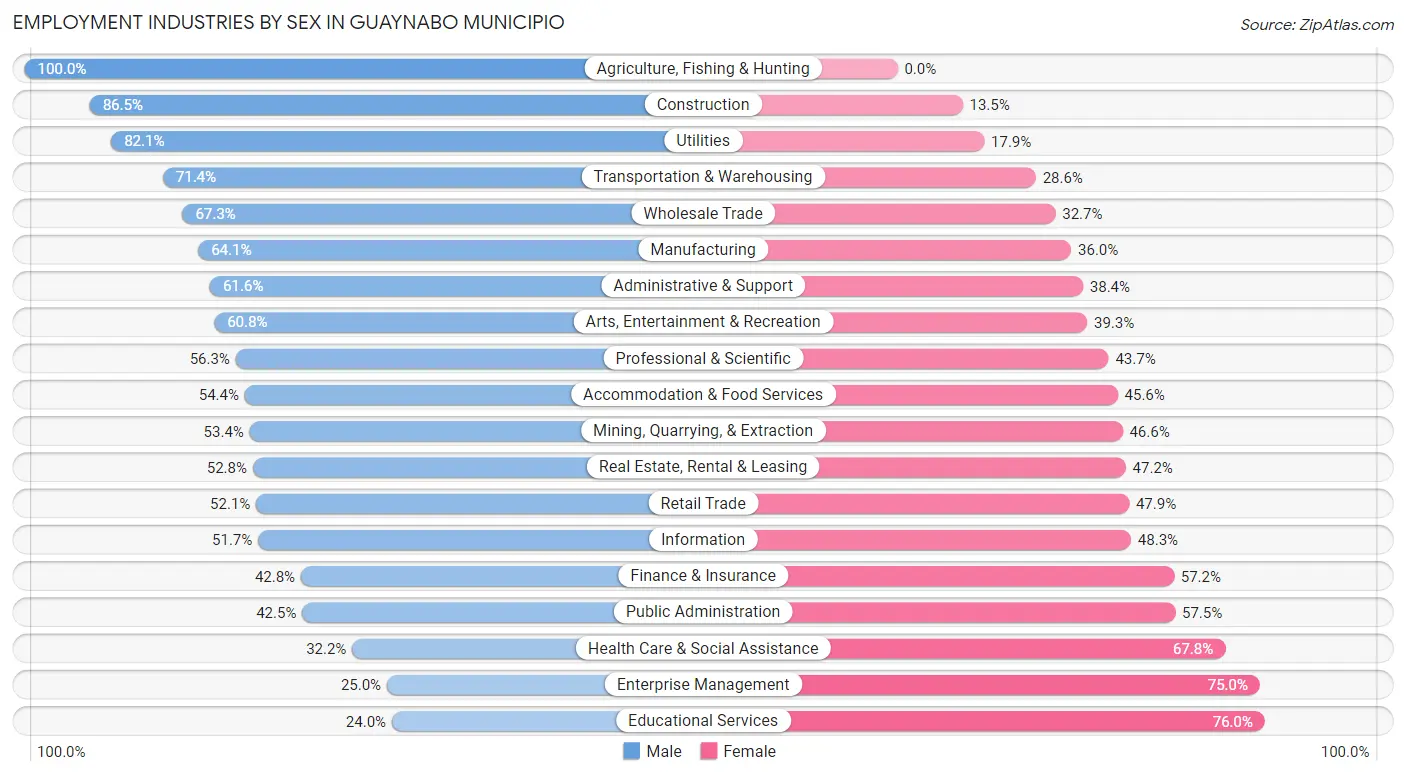
The Guaynabo Municipio industries that see more men than women are Agriculture, Fishing & Hunting (100.0%), Construction (86.5%), and Utilities (82.1%), whereas the industries that tend to have a higher number of women are Educational Services (76.0%), Enterprise Management (75.0%), and Health Care & Social Assistance (67.8%).
| Industry | Male | Female |
| Agriculture, Fishing & Hunting | 24 (100.0%) | 0 (0.0%) |
| Mining, Quarrying, & Extraction | 39 (53.4%) | 34 (46.6%) |
| Construction | 1,740 (86.5%) | 271 (13.5%) |
| Manufacturing | 1,144 (64.0%) | 642 (35.9%) |
| Wholesale Trade | 1,174 (67.3%) | 570 (32.7%) |
| Retail Trade | 2,323 (52.1%) | 2,138 (47.9%) |
| Transportation & Warehousing | 808 (71.4%) | 324 (28.6%) |
| Utilities | 247 (82.1%) | 54 (17.9%) |
| Information | 557 (51.7%) | 521 (48.3%) |
| Finance & Insurance | 1,228 (42.8%) | 1,641 (57.2%) |
| Real Estate, Rental & Leasing | 382 (52.8%) | 342 (47.2%) |
| Professional & Scientific | 2,373 (56.3%) | 1,841 (43.7%) |
| Enterprise Management | 21 (25.0%) | 63 (75.0%) |
| Administrative & Support | 1,164 (61.6%) | 725 (38.4%) |
| Educational Services | 652 (24.0%) | 2,068 (76.0%) |
| Health Care & Social Assistance | 1,421 (32.2%) | 2,994 (67.8%) |
| Arts, Entertainment & Recreation | 483 (60.8%) | 312 (39.3%) |
| Accommodation & Food Services | 1,296 (54.4%) | 1,085 (45.6%) |
| Public Administration | 1,150 (42.5%) | 1,554 (57.5%) |
| Total | 19,176 (51.6%) | 18,011 (48.4%) |
Education in Guaynabo Municipio
School Enrollment in Guaynabo Municipio
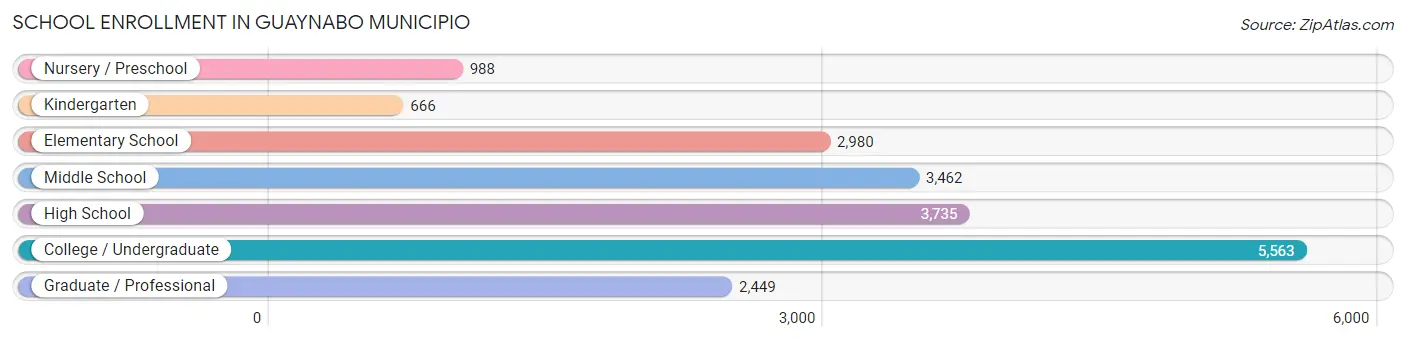
The most common levels of schooling among the 19,843 students in Guaynabo Municipio are college / undergraduate (5,563 | 28.0%), high school (3,735 | 18.8%), and middle school (3,462 | 17.4%).
| School Level | # Students | % Students |
| Nursery / Preschool | 988 | 5.0% |
| Kindergarten | 666 | 3.4% |
| Elementary School | 2,980 | 15.0% |
| Middle School | 3,462 | 17.4% |
| High School | 3,735 | 18.8% |
| College / Undergraduate | 5,563 | 28.0% |
| Graduate / Professional | 2,449 | 12.3% |
| Total | 19,843 | 100.0% |
School Enrollment by Age by Funding Source in Guaynabo Municipio
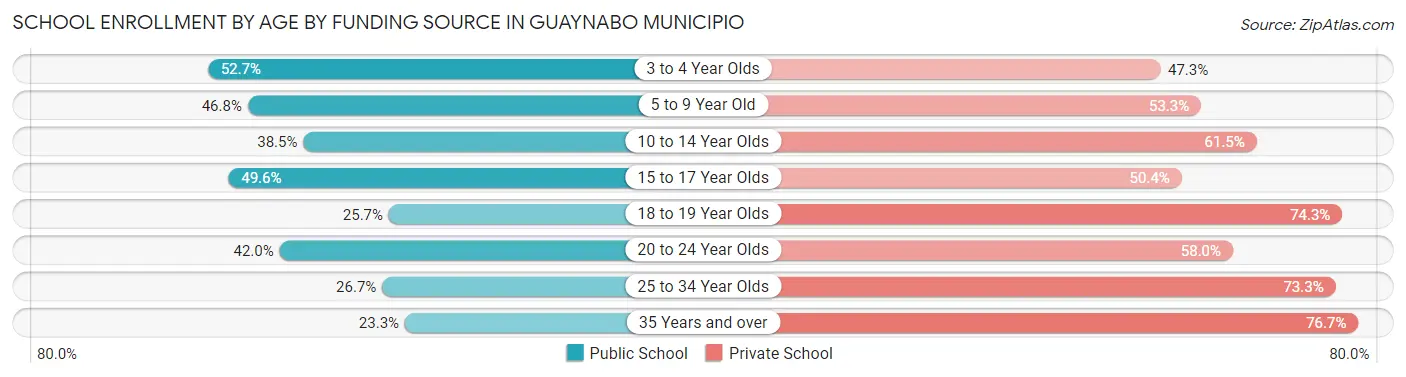
Out of a total of 19,843 students who are enrolled in schools in Guaynabo Municipio, 12,065 (60.8%) attend a private institution, while the remaining 7,778 (39.2%) are enrolled in public schools. The age group of 35 years and over has the highest likelihood of being enrolled in private schools, with 907 (76.7% in the age bracket) enrolled. Conversely, the age group of 3 to 4 year olds has the lowest likelihood of being enrolled in a private school, with 428 (52.7% in the age bracket) attending a public institution.
| Age Bracket | Public School | Private School |
| 3 to 4 Year Olds | 428 (52.7%) | 384 (47.3%) |
| 5 to 9 Year Old | 1,674 (46.8%) | 1,907 (53.2%) |
| 10 to 14 Year Olds | 1,573 (38.5%) | 2,516 (61.5%) |
| 15 to 17 Year Olds | 1,364 (49.6%) | 1,384 (50.4%) |
| 18 to 19 Year Olds | 436 (25.7%) | 1,259 (74.3%) |
| 20 to 24 Year Olds | 1,370 (42.0%) | 1,891 (58.0%) |
| 25 to 34 Year Olds | 661 (26.7%) | 1,813 (73.3%) |
| 35 Years and over | 276 (23.3%) | 907 (76.7%) |
| Total | 7,778 (39.2%) | 12,065 (60.8%) |
Educational Attainment by Field of Study in Guaynabo Municipio
Business (11,150 | 33.3%), science & technology (3,105 | 9.3%), education (3,032 | 9.0%), bio, nature & agricultural (2,600 | 7.8%), and engineering (2,473 | 7.4%) are the most common fields of study among 33,526 individuals in Guaynabo Municipio who have obtained a bachelor's degree or higher.
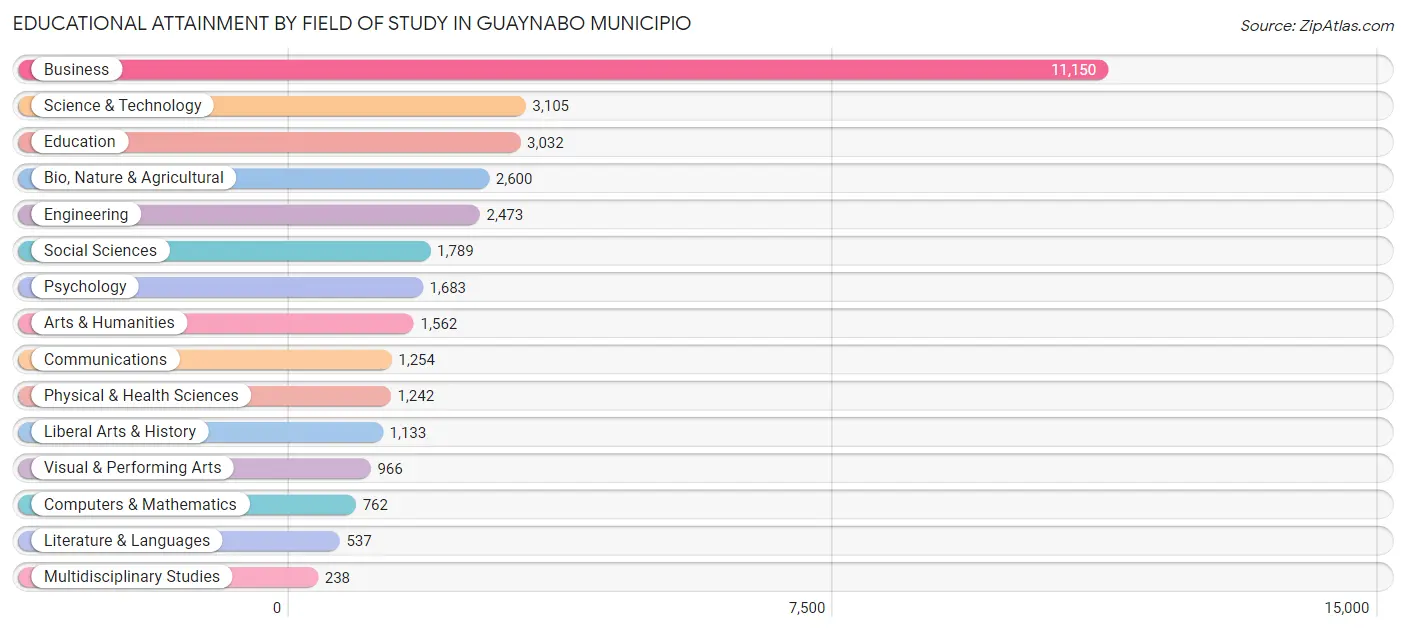
| Field of Study | # Graduates | % Graduates |
| Computers & Mathematics | 762 | 2.3% |
| Bio, Nature & Agricultural | 2,600 | 7.8% |
| Physical & Health Sciences | 1,242 | 3.7% |
| Psychology | 1,683 | 5.0% |
| Social Sciences | 1,789 | 5.3% |
| Engineering | 2,473 | 7.4% |
| Multidisciplinary Studies | 238 | 0.7% |
| Science & Technology | 3,105 | 9.3% |
| Business | 11,150 | 33.3% |
| Education | 3,032 | 9.0% |
| Literature & Languages | 537 | 1.6% |
| Liberal Arts & History | 1,133 | 3.4% |
| Visual & Performing Arts | 966 | 2.9% |
| Communications | 1,254 | 3.7% |
| Arts & Humanities | 1,562 | 4.7% |
| Total | 33,526 | 100.0% |
Transportation & Commute in Guaynabo Municipio
Vehicle Availability by Sex in Guaynabo Municipio
The most prevalent vehicle ownership categories in Guaynabo Municipio are males with 2 vehicles (7,978, accounting for 42.2%) and females with 2 vehicles (7,369, making up 45.2%).
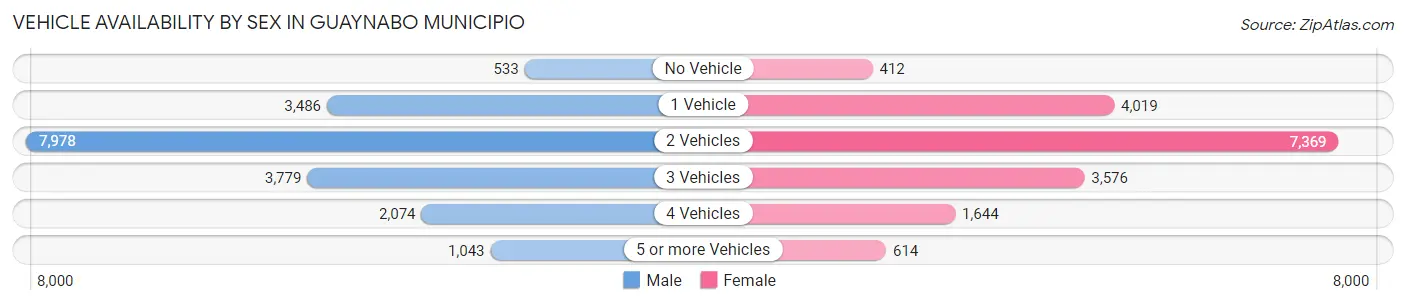
| Vehicles Available | Male | Female |
| No Vehicle | 533 (2.8%) | 412 (2.3%) |
| 1 Vehicle | 3,486 (18.4%) | 4,019 (22.8%) |
| 2 Vehicles | 7,978 (42.2%) | 7,369 (41.8%) |
| 3 Vehicles | 3,779 (20.0%) | 3,576 (20.3%) |
| 4 Vehicles | 2,074 (11.0%) | 1,644 (9.3%) |
| 5 or more Vehicles | 1,043 (5.5%) | 614 (3.5%) |
| Total | 18,893 (100.0%) | 17,634 (100.0%) |
Commute Time in Guaynabo Municipio
The most frequently occuring commute durations in Guaynabo Municipio are 30 to 34 minutes (7,352 commuters, 21.8%), 15 to 19 minutes (6,613 commuters, 19.6%), and 20 to 24 minutes (6,068 commuters, 18.0%).
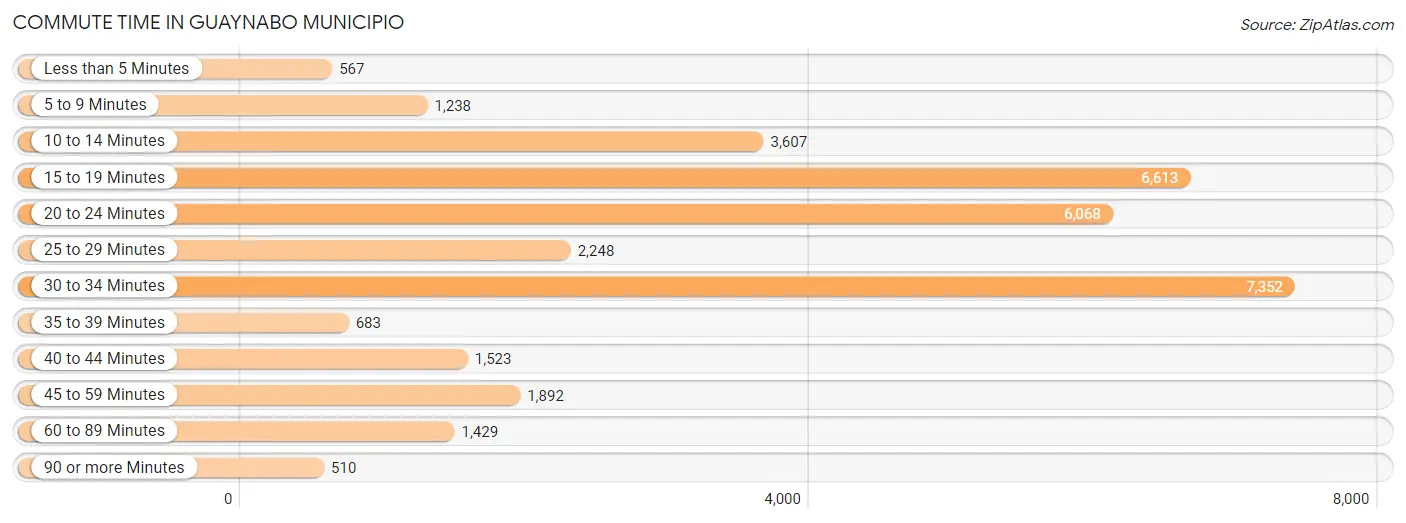
| Commute Time | # Commuters | % Commuters |
| Less than 5 Minutes | 567 | 1.7% |
| 5 to 9 Minutes | 1,238 | 3.7% |
| 10 to 14 Minutes | 3,607 | 10.7% |
| 15 to 19 Minutes | 6,613 | 19.6% |
| 20 to 24 Minutes | 6,068 | 18.0% |
| 25 to 29 Minutes | 2,248 | 6.7% |
| 30 to 34 Minutes | 7,352 | 21.8% |
| 35 to 39 Minutes | 683 | 2.0% |
| 40 to 44 Minutes | 1,523 | 4.5% |
| 45 to 59 Minutes | 1,892 | 5.6% |
| 60 to 89 Minutes | 1,429 | 4.2% |
| 90 or more Minutes | 510 | 1.5% |
Commute Time by Sex in Guaynabo Municipio
The most common commute times in Guaynabo Municipio are 30 to 34 minutes (4,157 commuters, 23.9%) for males and 15 to 19 minutes (3,405 commuters, 20.8%) for females.
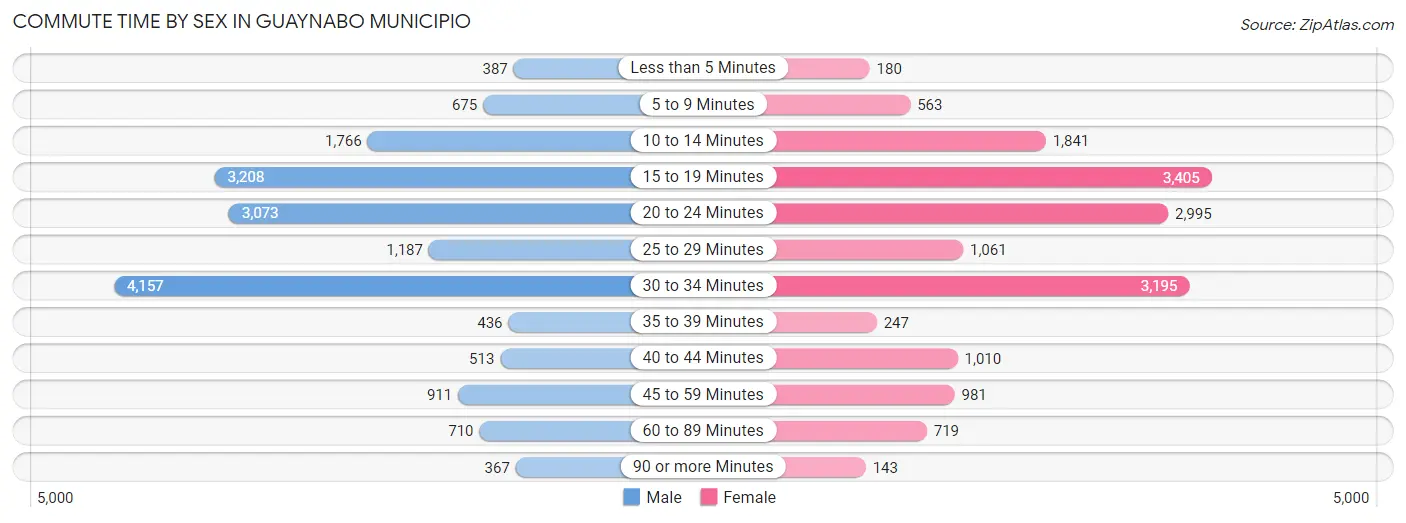
| Commute Time | Male | Female |
| Less than 5 Minutes | 387 (2.2%) | 180 (1.1%) |
| 5 to 9 Minutes | 675 (3.9%) | 563 (3.5%) |
| 10 to 14 Minutes | 1,766 (10.2%) | 1,841 (11.3%) |
| 15 to 19 Minutes | 3,208 (18.4%) | 3,405 (20.8%) |
| 20 to 24 Minutes | 3,073 (17.7%) | 2,995 (18.3%) |
| 25 to 29 Minutes | 1,187 (6.8%) | 1,061 (6.5%) |
| 30 to 34 Minutes | 4,157 (23.9%) | 3,195 (19.6%) |
| 35 to 39 Minutes | 436 (2.5%) | 247 (1.5%) |
| 40 to 44 Minutes | 513 (2.9%) | 1,010 (6.2%) |
| 45 to 59 Minutes | 911 (5.2%) | 981 (6.0%) |
| 60 to 89 Minutes | 710 (4.1%) | 719 (4.4%) |
| 90 or more Minutes | 367 (2.1%) | 143 (0.9%) |
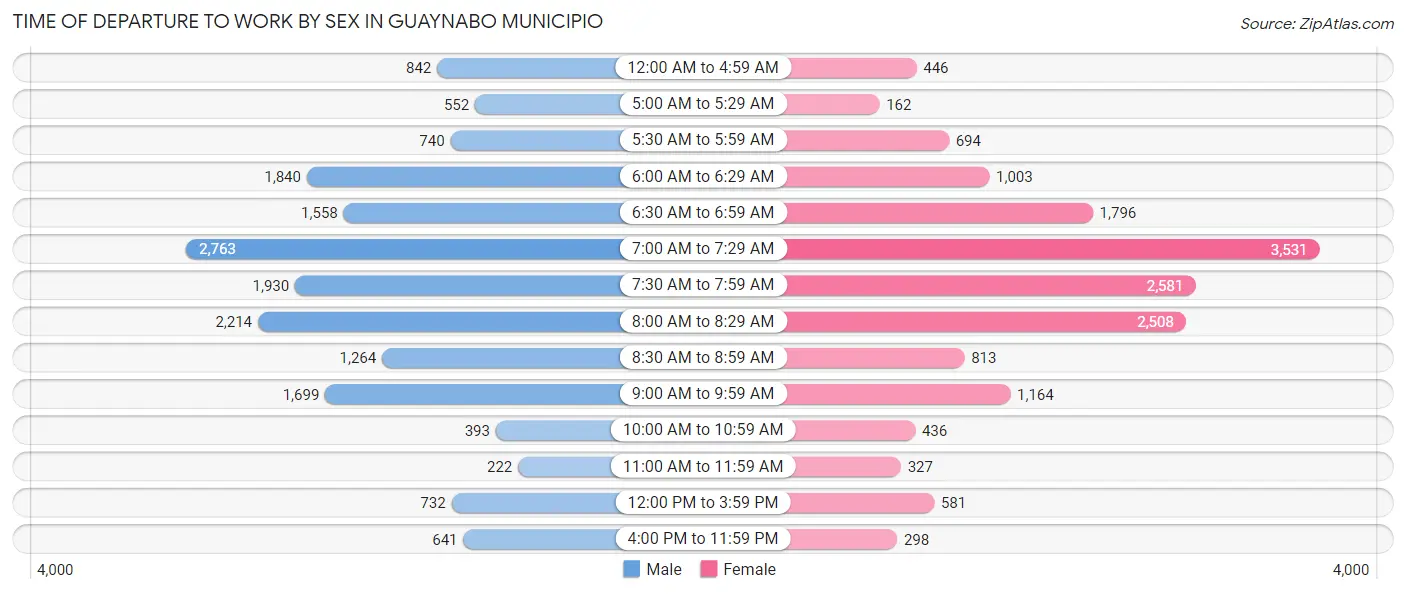
Time of Departure to Work by Sex in Guaynabo Municipio
The most frequent times of departure to work in Guaynabo Municipio are 7:00 AM to 7:29 AM (2,763, 15.9%) for males and 7:00 AM to 7:29 AM (3,531, 21.6%) for females.
| Time of Departure | Male | Female |
| 12:00 AM to 4:59 AM | 842 (4.8%) | 446 (2.7%) |
| 5:00 AM to 5:29 AM | 552 (3.2%) | 162 (1.0%) |
| 5:30 AM to 5:59 AM | 740 (4.3%) | 694 (4.3%) |
| 6:00 AM to 6:29 AM | 1,840 (10.6%) | 1,003 (6.1%) |
| 6:30 AM to 6:59 AM | 1,558 (9.0%) | 1,796 (11.0%) |
| 7:00 AM to 7:29 AM | 2,763 (15.9%) | 3,531 (21.6%) |
| 7:30 AM to 7:59 AM | 1,930 (11.1%) | 2,581 (15.8%) |
| 8:00 AM to 8:29 AM | 2,214 (12.7%) | 2,508 (15.3%) |
| 8:30 AM to 8:59 AM | 1,264 (7.3%) | 813 (5.0%) |
| 9:00 AM to 9:59 AM | 1,699 (9.8%) | 1,164 (7.1%) |
| 10:00 AM to 10:59 AM | 393 (2.3%) | 436 (2.7%) |
| 11:00 AM to 11:59 AM | 222 (1.3%) | 327 (2.0%) |
| 12:00 PM to 3:59 PM | 732 (4.2%) | 581 (3.6%) |
| 4:00 PM to 11:59 PM | 641 (3.7%) | 298 (1.8%) |
| Total | 17,390 (100.0%) | 16,340 (100.0%) |
Housing Occupancy in Guaynabo Municipio
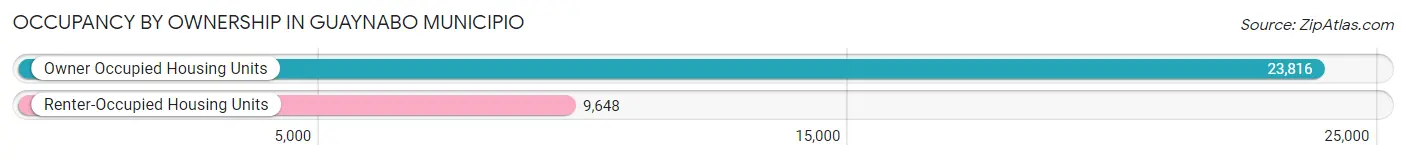
Occupancy by Ownership in Guaynabo Municipio
Of the total 33,464 dwellings in Guaynabo Municipio, owner-occupied units account for 23,816 (71.2%), while renter-occupied units make up 9,648 (28.8%).
| Occupancy | # Housing Units | % Housing Units |
| Owner Occupied Housing Units | 23,816 | 71.2% |
| Renter-Occupied Housing Units | 9,648 | 28.8% |
| Total Occupied Housing Units | 33,464 | 100.0% |
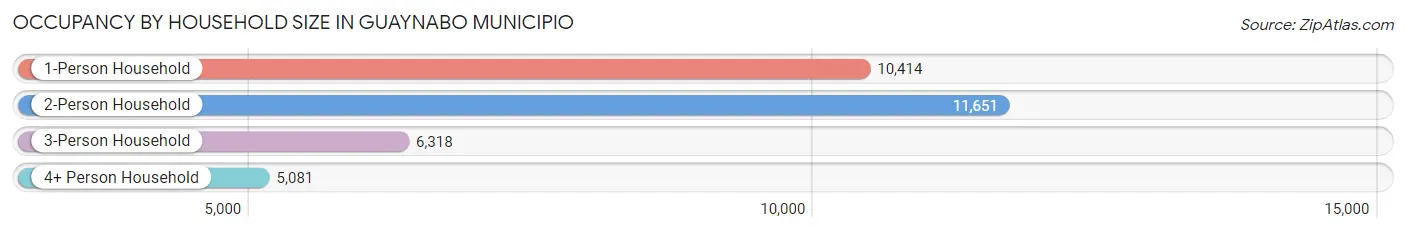
Occupancy by Household Size in Guaynabo Municipio
| Household Size | # Housing Units | % Housing Units |
| 1-Person Household | 10,414 | 31.1% |
| 2-Person Household | 11,651 | 34.8% |
| 3-Person Household | 6,318 | 18.9% |
| 4+ Person Household | 5,081 | 15.2% |
| Total Housing Units | 33,464 | 100.0% |
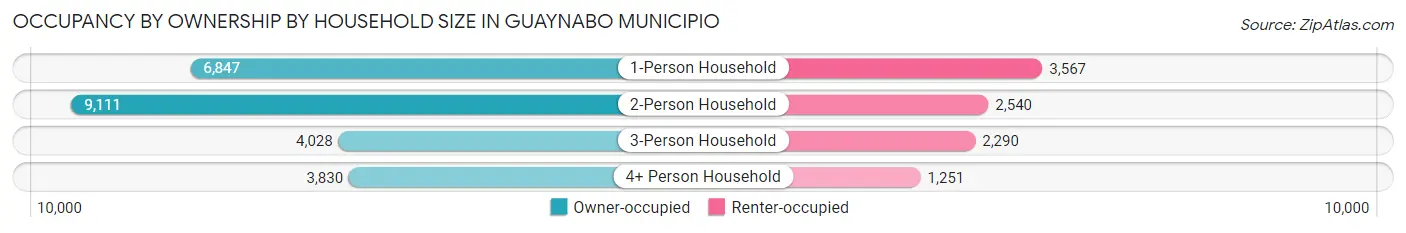
Occupancy by Ownership by Household Size in Guaynabo Municipio
| Household Size | Owner-occupied | Renter-occupied |
| 1-Person Household | 6,847 (65.7%) | 3,567 (34.3%) |
| 2-Person Household | 9,111 (78.2%) | 2,540 (21.8%) |
| 3-Person Household | 4,028 (63.7%) | 2,290 (36.2%) |
| 4+ Person Household | 3,830 (75.4%) | 1,251 (24.6%) |
| Total Housing Units | 23,816 (71.2%) | 9,648 (28.8%) |
Occupancy by Educational Attainment in Guaynabo Municipio
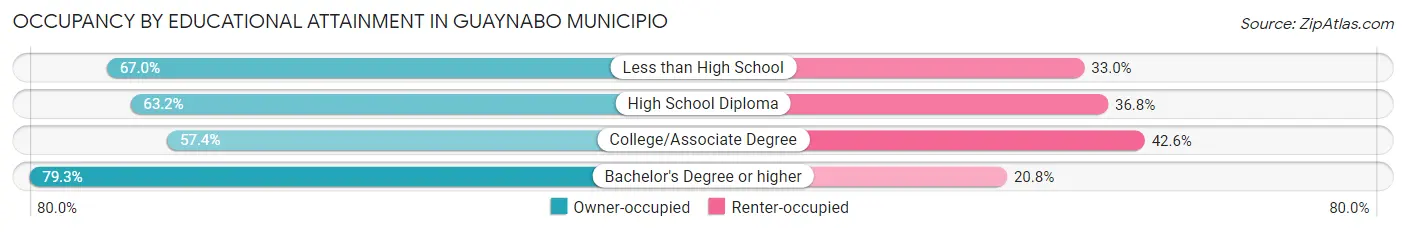
| Household Size | Owner-occupied | Renter-occupied |
| Less than High School | 3,053 (67.0%) | 1,506 (33.0%) |
| High School Diploma | 3,157 (63.2%) | 1,837 (36.8%) |
| College/Associate Degree | 3,531 (57.4%) | 2,620 (42.6%) |
| Bachelor's Degree or higher | 14,075 (79.2%) | 3,685 (20.7%) |
Occupancy by Age of Householder in Guaynabo Municipio
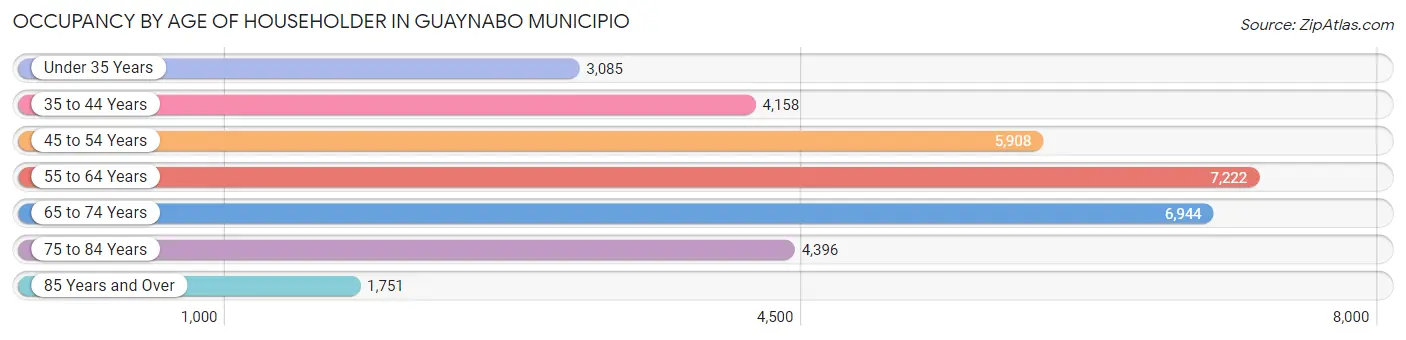
| Age Bracket | # Households | % Households |
| Under 35 Years | 3,085 | 9.2% |
| 35 to 44 Years | 4,158 | 12.4% |
| 45 to 54 Years | 5,908 | 17.6% |
| 55 to 64 Years | 7,222 | 21.6% |
| 65 to 74 Years | 6,944 | 20.7% |
| 75 to 84 Years | 4,396 | 13.1% |
| 85 Years and Over | 1,751 | 5.2% |
| Total | 33,464 | 100.0% |
Housing Finances in Guaynabo Municipio
Median Income by Occupancy in Guaynabo Municipio
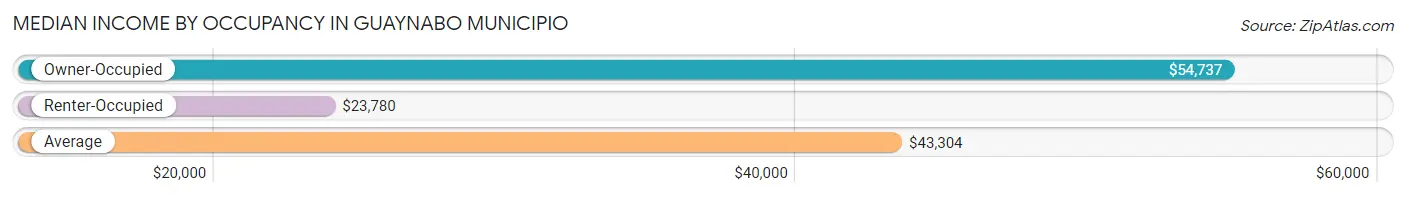
| Occupancy Type | # Households | Median Income |
| Owner-Occupied | 23,816 (71.2%) | $54,737 |
| Renter-Occupied | 9,648 (28.8%) | $23,780 |
| Average | 33,464 (100.0%) | $43,304 |
Occupancy by Householder Income Bracket in Guaynabo Municipio
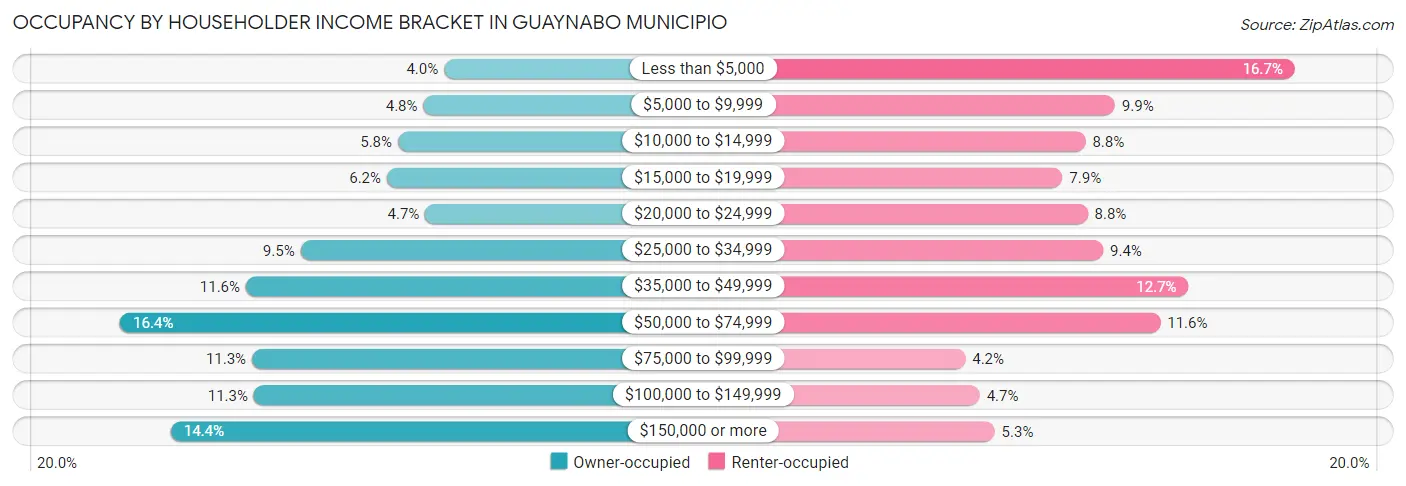
| Income Bracket | Owner-occupied | Renter-occupied |
| Less than $5,000 | 957 (4.0%) | 1,614 (16.7%) |
| $5,000 to $9,999 | 1,146 (4.8%) | 953 (9.9%) |
| $10,000 to $14,999 | 1,377 (5.8%) | 845 (8.8%) |
| $15,000 to $19,999 | 1,476 (6.2%) | 760 (7.9%) |
| $20,000 to $24,999 | 1,128 (4.7%) | 853 (8.8%) |
| $25,000 to $34,999 | 2,261 (9.5%) | 910 (9.4%) |
| $35,000 to $49,999 | 2,755 (11.6%) | 1,223 (12.7%) |
| $50,000 to $74,999 | 3,897 (16.4%) | 1,120 (11.6%) |
| $75,000 to $99,999 | 2,700 (11.3%) | 403 (4.2%) |
| $100,000 to $149,999 | 2,683 (11.3%) | 456 (4.7%) |
| $150,000 or more | 3,436 (14.4%) | 511 (5.3%) |
| Total | 23,816 (100.0%) | 9,648 (100.0%) |
Monthly Housing Cost Tiers in Guaynabo Municipio
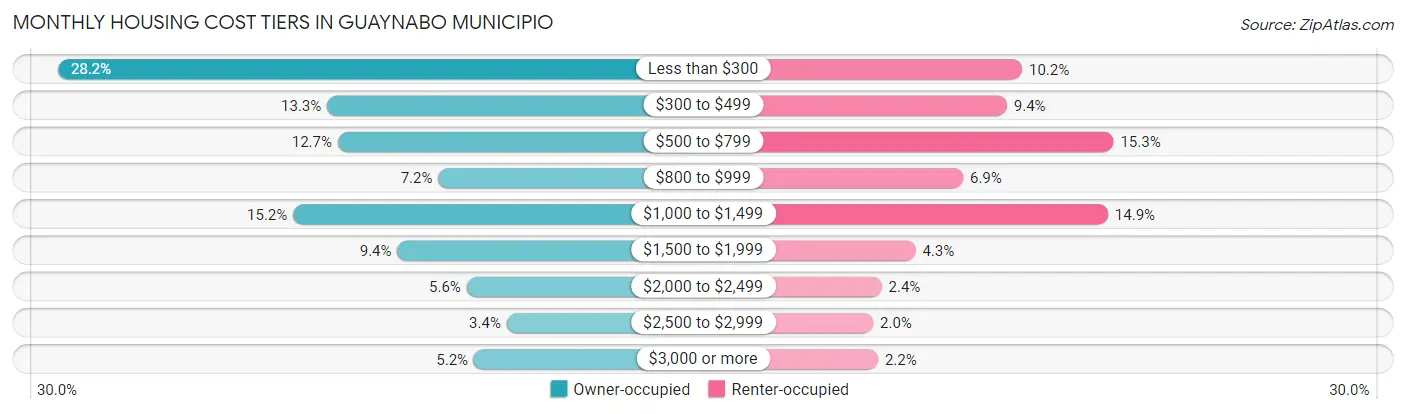
| Monthly Cost | Owner-occupied | Renter-occupied |
| Less than $300 | 6,706 (28.2%) | 984 (10.2%) |
| $300 to $499 | 3,166 (13.3%) | 903 (9.4%) |
| $500 to $799 | 3,025 (12.7%) | 1,471 (15.2%) |
| $800 to $999 | 1,702 (7.1%) | 670 (6.9%) |
| $1,000 to $1,499 | 3,613 (15.2%) | 1,441 (14.9%) |
| $1,500 to $1,999 | 2,240 (9.4%) | 416 (4.3%) |
| $2,000 to $2,499 | 1,328 (5.6%) | 235 (2.4%) |
| $2,500 to $2,999 | 803 (3.4%) | 190 (2.0%) |
| $3,000 or more | 1,233 (5.2%) | 216 (2.2%) |
| Total | 23,816 (100.0%) | 9,648 (100.0%) |
Physical Housing Characteristics in Guaynabo Municipio
Housing Structures in Guaynabo Municipio
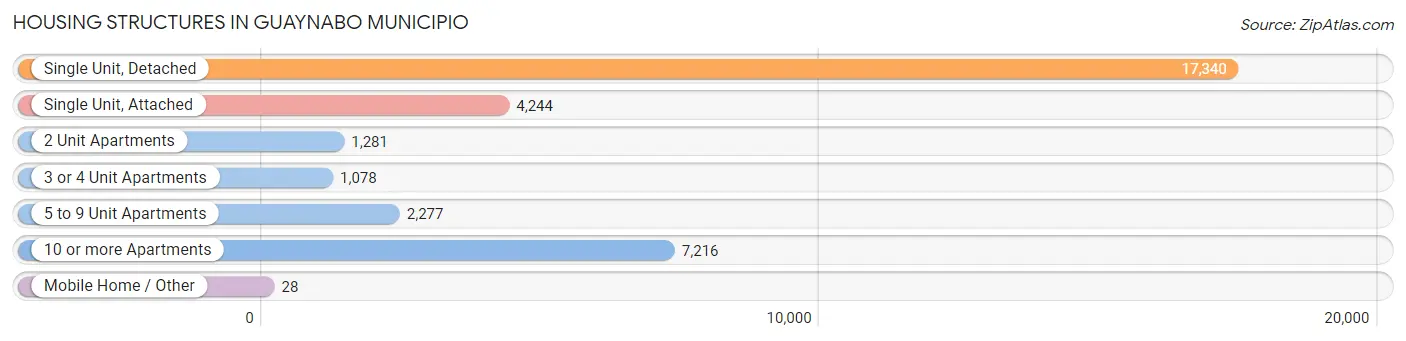
| Structure Type | # Housing Units | % Housing Units |
| Single Unit, Detached | 17,340 | 51.8% |
| Single Unit, Attached | 4,244 | 12.7% |
| 2 Unit Apartments | 1,281 | 3.8% |
| 3 or 4 Unit Apartments | 1,078 | 3.2% |
| 5 to 9 Unit Apartments | 2,277 | 6.8% |
| 10 or more Apartments | 7,216 | 21.6% |
| Mobile Home / Other | 28 | 0.1% |
| Total | 33,464 | 100.0% |
Housing Structures by Occupancy in Guaynabo Municipio
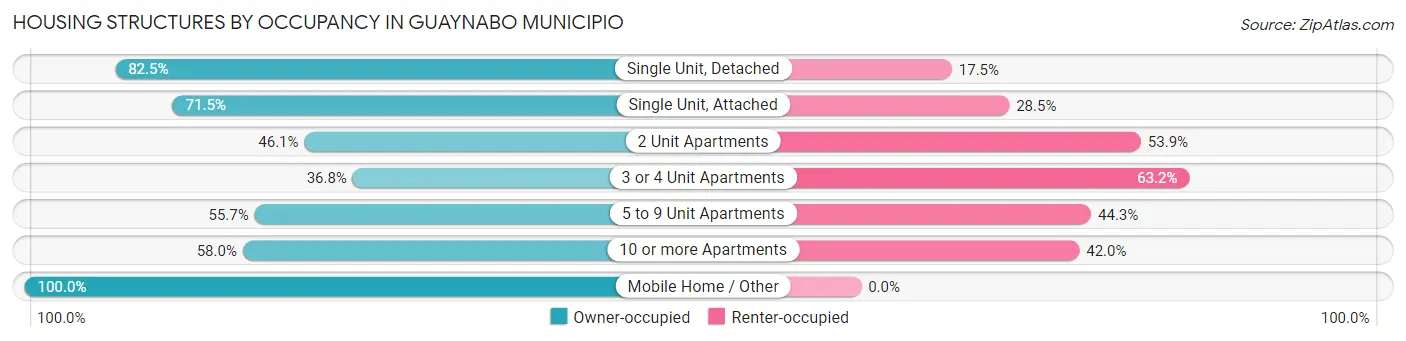
| Structure Type | Owner-occupied | Renter-occupied |
| Single Unit, Detached | 14,312 (82.5%) | 3,028 (17.5%) |
| Single Unit, Attached | 3,034 (71.5%) | 1,210 (28.5%) |
| 2 Unit Apartments | 591 (46.1%) | 690 (53.9%) |
| 3 or 4 Unit Apartments | 397 (36.8%) | 681 (63.2%) |
| 5 to 9 Unit Apartments | 1,269 (55.7%) | 1,008 (44.3%) |
| 10 or more Apartments | 4,185 (58.0%) | 3,031 (42.0%) |
| Mobile Home / Other | 28 (100.0%) | 0 (0.0%) |
| Total | 23,816 (71.2%) | 9,648 (28.8%) |
Housing Structures by Number of Rooms in Guaynabo Municipio
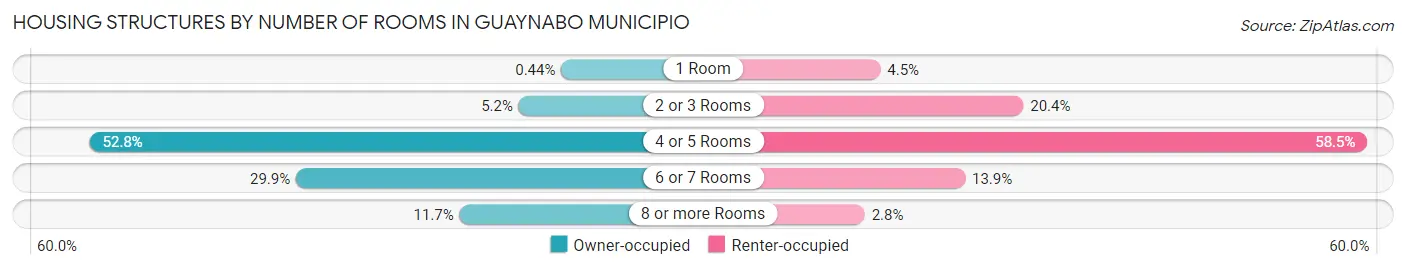
| Number of Rooms | Owner-occupied | Renter-occupied |
| 1 Room | 105 (0.4%) | 433 (4.5%) |
| 2 or 3 Rooms | 1,227 (5.1%) | 1,963 (20.3%) |
| 4 or 5 Rooms | 12,576 (52.8%) | 5,647 (58.5%) |
| 6 or 7 Rooms | 7,115 (29.9%) | 1,340 (13.9%) |
| 8 or more Rooms | 2,793 (11.7%) | 265 (2.8%) |
| Total | 23,816 (100.0%) | 9,648 (100.0%) |
Housing Structure by Heating Type in Guaynabo Municipio
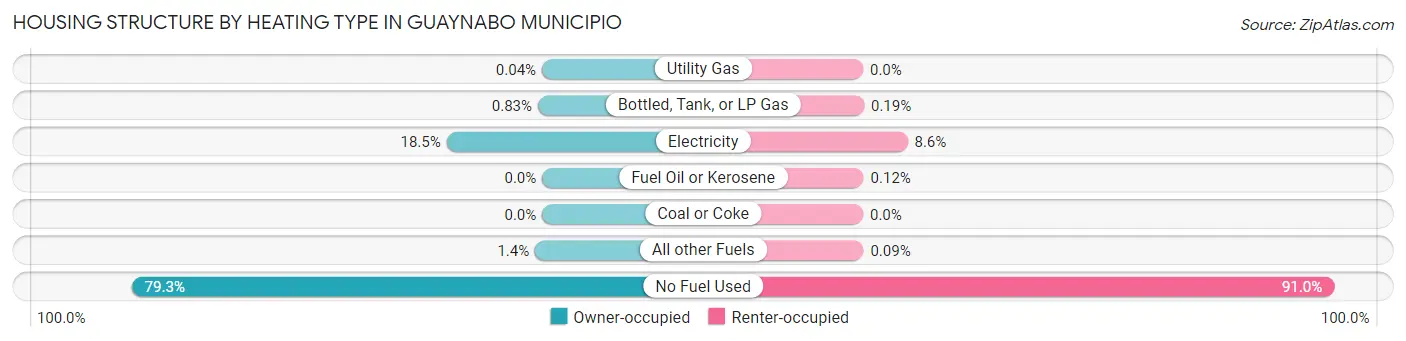
| Heating Type | Owner-occupied | Renter-occupied |
| Utility Gas | 10 (0.0%) | 0 (0.0%) |
| Bottled, Tank, or LP Gas | 197 (0.8%) | 18 (0.2%) |
| Electricity | 4,396 (18.5%) | 829 (8.6%) |
| Fuel Oil or Kerosene | 0 (0.0%) | 12 (0.1%) |
| Coal or Coke | 0 (0.0%) | 0 (0.0%) |
| All other Fuels | 325 (1.4%) | 9 (0.1%) |
| No Fuel Used | 18,888 (79.3%) | 8,780 (91.0%) |
| Total | 23,816 (100.0%) | 9,648 (100.0%) |
Household Vehicle Usage in Guaynabo Municipio
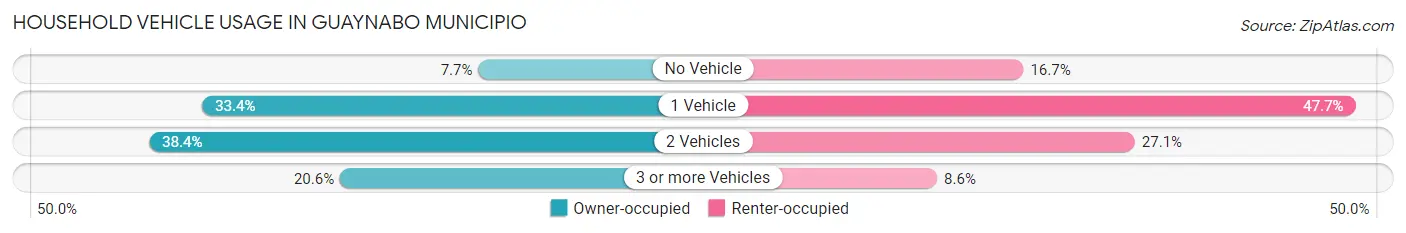
| Vehicles per Household | Owner-occupied | Renter-occupied |
| No Vehicle | 1,823 (7.6%) | 1,608 (16.7%) |
| 1 Vehicle | 7,959 (33.4%) | 4,597 (47.6%) |
| 2 Vehicles | 9,138 (38.4%) | 2,612 (27.1%) |
| 3 or more Vehicles | 4,896 (20.6%) | 831 (8.6%) |
| Total | 23,816 (100.0%) | 9,648 (100.0%) |
Real Estate & Mortgages in Guaynabo Municipio
Real Estate and Mortgage Overview in Guaynabo Municipio
| Characteristic | Without Mortgage | With Mortgage |
| Housing Units | 12,538 | 11,278 |
| Median Property Value | $174,600 | $222,100 |
| Median Household Income | $35,008 | $2,362 |
| Monthly Housing Costs | $280 | $1,233 |
| Real Estate Taxes | $1,011 | $4,992 |
Property Value by Mortgage Status in Guaynabo Municipio
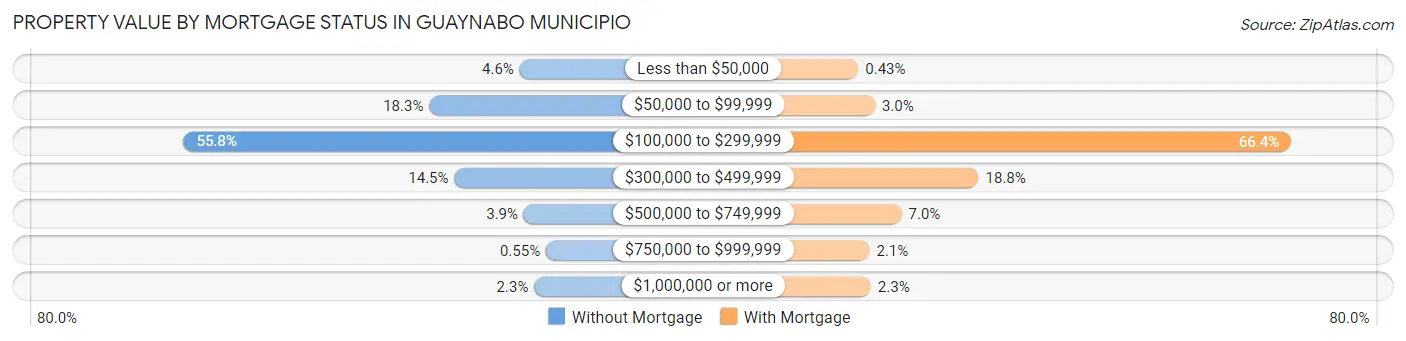
| Property Value | Without Mortgage | With Mortgage |
| Less than $50,000 | 572 (4.6%) | 48 (0.4%) |
| $50,000 to $99,999 | 2,300 (18.3%) | 334 (3.0%) |
| $100,000 to $299,999 | 6,993 (55.8%) | 7,485 (66.4%) |
| $300,000 to $499,999 | 1,819 (14.5%) | 2,115 (18.8%) |
| $500,000 to $749,999 | 491 (3.9%) | 792 (7.0%) |
| $750,000 to $999,999 | 69 (0.5%) | 240 (2.1%) |
| $1,000,000 or more | 294 (2.3%) | 264 (2.3%) |
| Total | 12,538 (100.0%) | 11,278 (100.0%) |
Household Income by Mortgage Status in Guaynabo Municipio
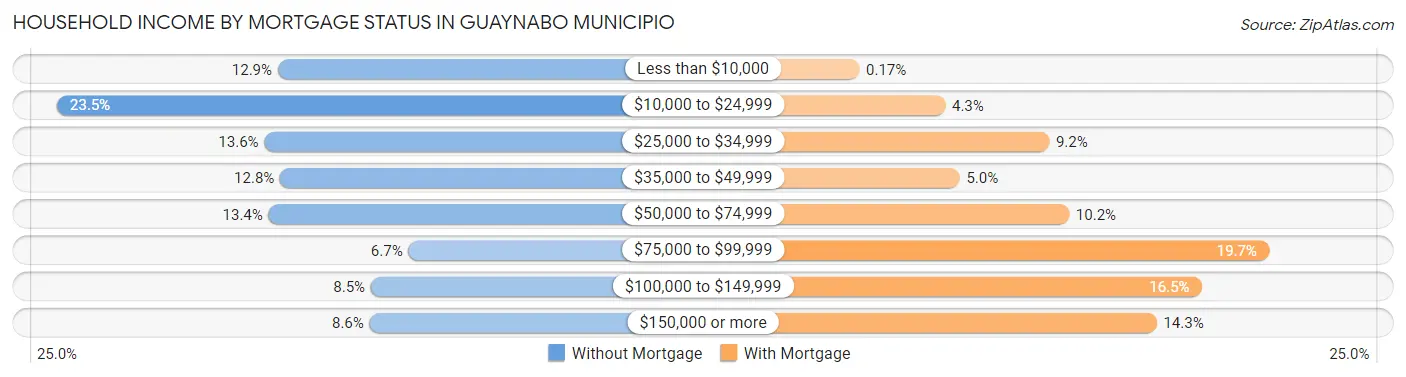
| Household Income | Without Mortgage | With Mortgage |
| Less than $10,000 | 1,623 (12.9%) | 19 (0.2%) |
| $10,000 to $24,999 | 2,942 (23.5%) | 480 (4.3%) |
| $25,000 to $34,999 | 1,703 (13.6%) | 1,039 (9.2%) |
| $35,000 to $49,999 | 1,609 (12.8%) | 558 (5.0%) |
| $50,000 to $74,999 | 1,678 (13.4%) | 1,146 (10.2%) |
| $75,000 to $99,999 | 842 (6.7%) | 2,219 (19.7%) |
| $100,000 to $149,999 | 1,067 (8.5%) | 1,858 (16.5%) |
| $150,000 or more | 1,074 (8.6%) | 1,616 (14.3%) |
| Total | 12,538 (100.0%) | 11,278 (100.0%) |
Property Value to Household Income Ratio in Guaynabo Municipio
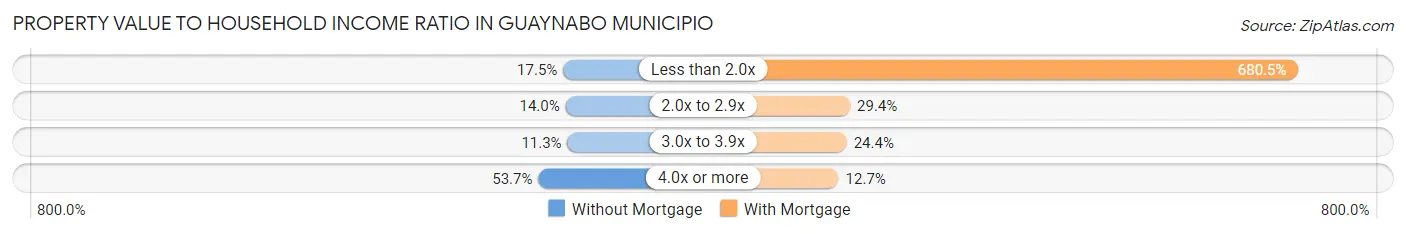
| Value-to-Income Ratio | Without Mortgage | With Mortgage |
| Less than 2.0x | 2,195 (17.5%) | 76,746 (680.5%) |
| 2.0x to 2.9x | 1,758 (14.0%) | 3,312 (29.4%) |
| 3.0x to 3.9x | 1,413 (11.3%) | 2,756 (24.4%) |
| 4.0x or more | 6,728 (53.7%) | 1,428 (12.7%) |
| Total | 12,538 (100.0%) | 11,278 (100.0%) |
Real Estate Taxes by Mortgage Status in Guaynabo Municipio
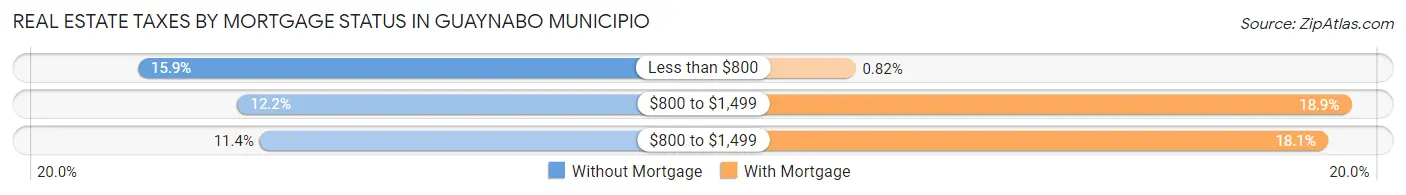
| Property Taxes | Without Mortgage | With Mortgage |
| Less than $800 | 1,988 (15.9%) | 92 (0.8%) |
| $800 to $1,499 | 1,532 (12.2%) | 2,135 (18.9%) |
| $800 to $1,499 | 1,430 (11.4%) | 2,038 (18.1%) |
| Total | 12,538 (100.0%) | 11,278 (100.0%) |
Health & Disability in Guaynabo Municipio
Health Insurance Coverage by Age in Guaynabo Municipio
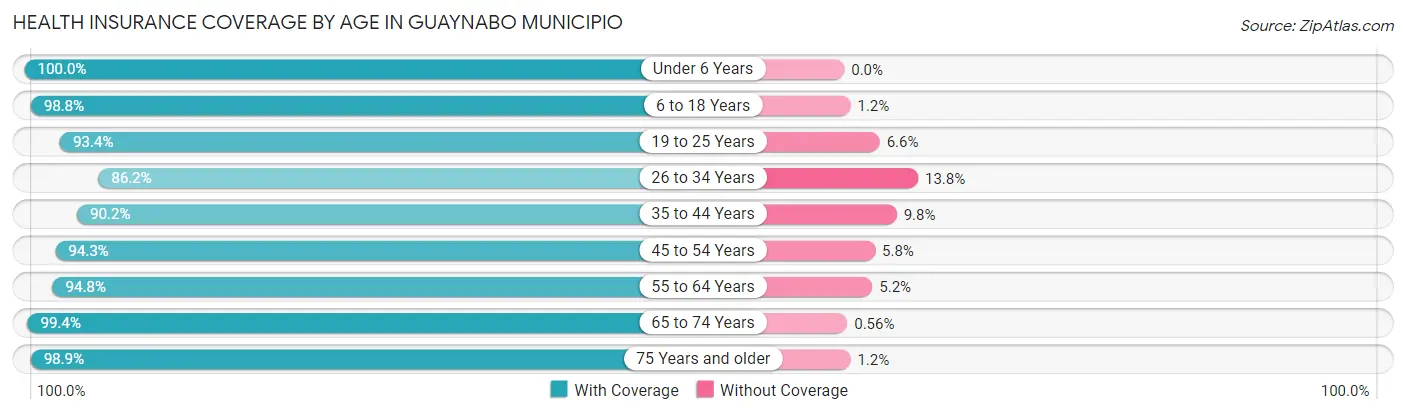
| Age Bracket | With Coverage | Without Coverage |
| Under 6 Years | 3,395 (100.0%) | 0 (0.0%) |
| 6 to 18 Years | 10,905 (98.8%) | 128 (1.2%) |
| 19 to 25 Years | 7,038 (93.4%) | 498 (6.6%) |
| 26 to 34 Years | 9,074 (86.2%) | 1,448 (13.8%) |
| 35 to 44 Years | 9,728 (90.2%) | 1,055 (9.8%) |
| 45 to 54 Years | 10,751 (94.3%) | 656 (5.8%) |
| 55 to 64 Years | 12,299 (94.8%) | 679 (5.2%) |
| 65 to 74 Years | 11,001 (99.4%) | 62 (0.6%) |
| 75 Years and older | 10,153 (98.9%) | 118 (1.1%) |
| Total | 84,344 (94.8%) | 4,644 (5.2%) |
Health Insurance Coverage by Citizenship Status in Guaynabo Municipio
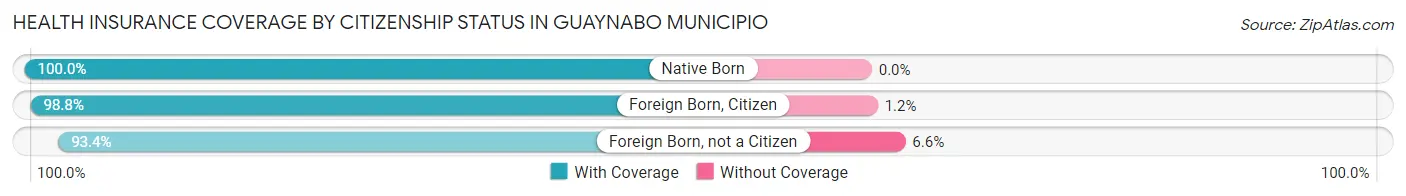
| Citizenship Status | With Coverage | Without Coverage |
| Native Born | 3,395 (100.0%) | 0 (0.0%) |
| Foreign Born, Citizen | 10,905 (98.8%) | 128 (1.2%) |
| Foreign Born, not a Citizen | 7,038 (93.4%) | 498 (6.6%) |
Health Insurance Coverage by Household Income in Guaynabo Municipio
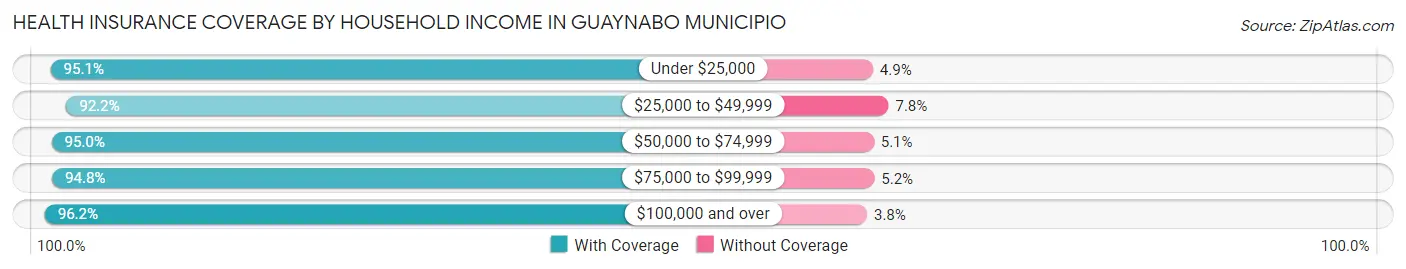
| Household Income | With Coverage | Without Coverage |
| Under $25,000 | 21,420 (95.1%) | 1,102 (4.9%) |
| $25,000 to $49,999 | 16,632 (92.2%) | 1,410 (7.8%) |
| $50,000 to $74,999 | 13,153 (95.0%) | 699 (5.1%) |
| $75,000 to $99,999 | 9,215 (94.8%) | 502 (5.2%) |
| $100,000 and over | 23,585 (96.2%) | 928 (3.8%) |
Public vs Private Health Insurance Coverage by Age in Guaynabo Municipio
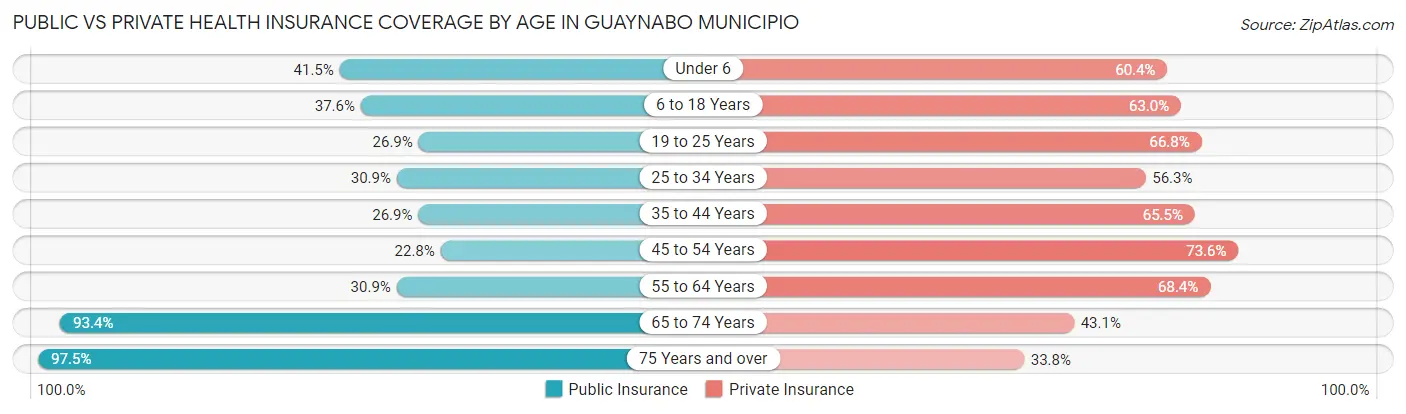
| Age Bracket | Public Insurance | Private Insurance |
| Under 6 | 1,410 (41.5%) | 2,052 (60.4%) |
| 6 to 18 Years | 4,148 (37.6%) | 6,947 (63.0%) |
| 19 to 25 Years | 2,024 (26.9%) | 5,031 (66.8%) |
| 25 to 34 Years | 3,252 (30.9%) | 5,927 (56.3%) |
| 35 to 44 Years | 2,904 (26.9%) | 7,064 (65.5%) |
| 45 to 54 Years | 2,599 (22.8%) | 8,394 (73.6%) |
| 55 to 64 Years | 4,016 (30.9%) | 8,872 (68.4%) |
| 65 to 74 Years | 10,333 (93.4%) | 4,763 (43.0%) |
| 75 Years and over | 10,014 (97.5%) | 3,470 (33.8%) |
| Total | 40,700 (45.7%) | 52,520 (59.0%) |
Disability Status by Sex by Age in Guaynabo Municipio
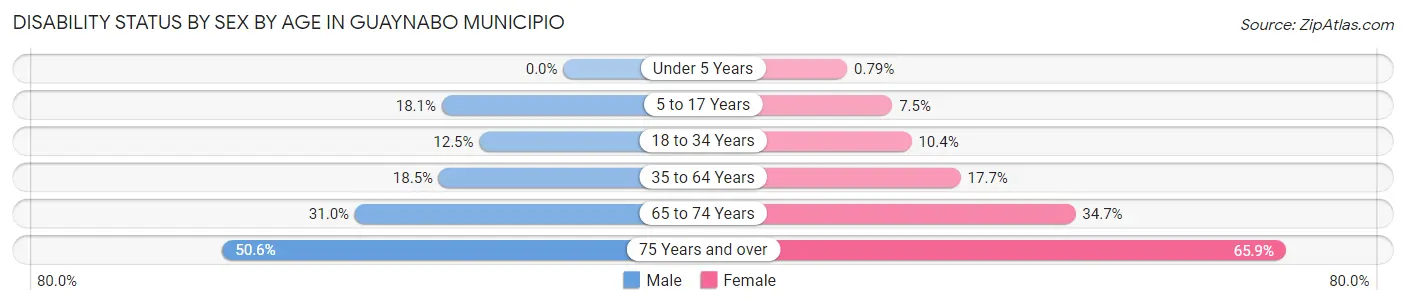
| Age Bracket | Male | Female |
| Under 5 Years | 0 (0.0%) | 11 (0.8%) |
| 5 to 17 Years | 961 (18.0%) | 384 (7.5%) |
| 18 to 34 Years | 1,252 (12.5%) | 947 (10.3%) |
| 35 to 64 Years | 2,978 (18.5%) | 3,362 (17.6%) |
| 65 to 74 Years | 1,486 (30.9%) | 2,172 (34.7%) |
| 75 Years and over | 2,005 (50.6%) | 4,160 (65.9%) |
Disability Class by Sex by Age in Guaynabo Municipio
Disability Class: Hearing Difficulty
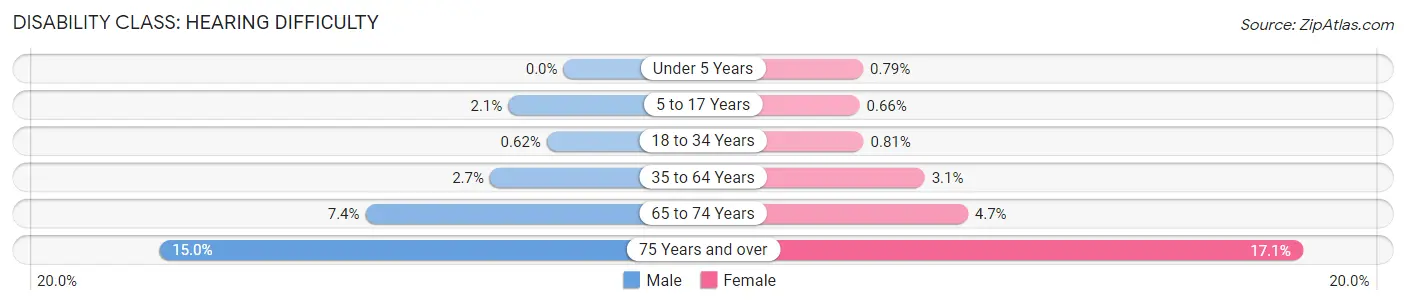
| Age Bracket | Male | Female |
| Under 5 Years | 0 (0.0%) | 11 (0.8%) |
| 5 to 17 Years | 109 (2.1%) | 34 (0.7%) |
| 18 to 34 Years | 62 (0.6%) | 74 (0.8%) |
| 35 to 64 Years | 440 (2.7%) | 586 (3.1%) |
| 65 to 74 Years | 353 (7.3%) | 293 (4.7%) |
| 75 Years and over | 594 (15.0%) | 1,079 (17.1%) |
Disability Class: Vision Difficulty
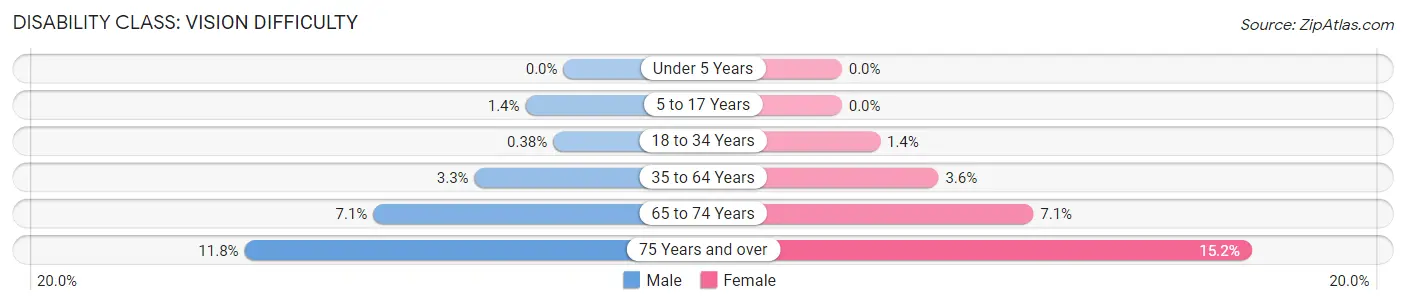
| Age Bracket | Male | Female |
| Under 5 Years | 0 (0.0%) | 0 (0.0%) |
| 5 to 17 Years | 75 (1.4%) | 0 (0.0%) |
| 18 to 34 Years | 38 (0.4%) | 130 (1.4%) |
| 35 to 64 Years | 532 (3.3%) | 684 (3.6%) |
| 65 to 74 Years | 339 (7.1%) | 445 (7.1%) |
| 75 Years and over | 469 (11.8%) | 960 (15.2%) |
Disability Class: Cognitive Difficulty
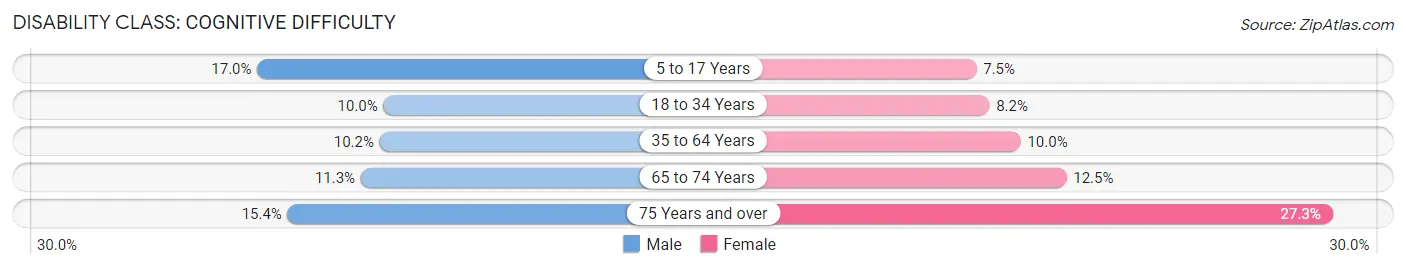
| Age Bracket | Male | Female |
| 5 to 17 Years | 907 (17.0%) | 384 (7.5%) |
| 18 to 34 Years | 1,005 (10.0%) | 751 (8.2%) |
| 35 to 64 Years | 1,647 (10.2%) | 1,895 (10.0%) |
| 65 to 74 Years | 541 (11.3%) | 783 (12.5%) |
| 75 Years and over | 608 (15.3%) | 1,725 (27.3%) |
Disability Class: Ambulatory Difficulty
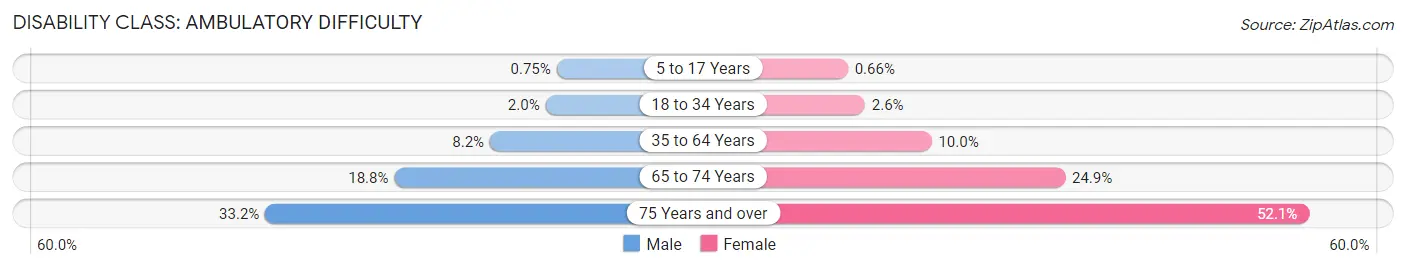
| Age Bracket | Male | Female |
| 5 to 17 Years | 40 (0.7%) | 34 (0.7%) |
| 18 to 34 Years | 200 (2.0%) | 235 (2.6%) |
| 35 to 64 Years | 1,318 (8.2%) | 1,903 (10.0%) |
| 65 to 74 Years | 904 (18.8%) | 1,557 (24.9%) |
| 75 Years and over | 1,315 (33.2%) | 3,285 (52.0%) |
Disability Class: Self-Care Difficulty
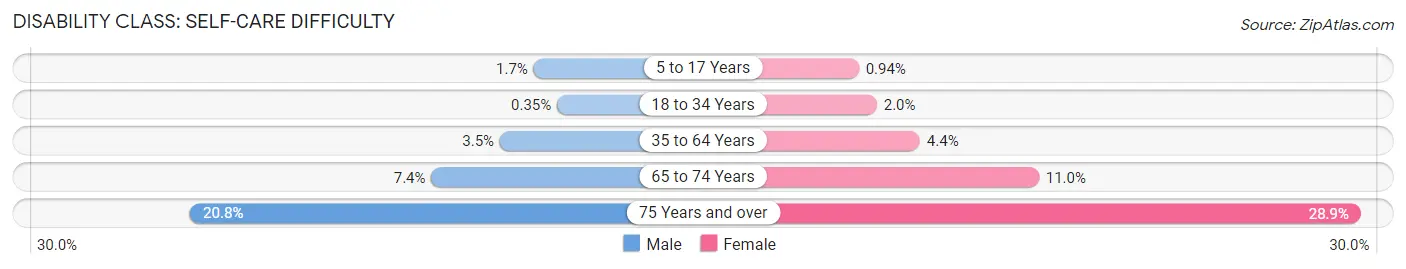
| Age Bracket | Male | Female |
| 5 to 17 Years | 88 (1.7%) | 48 (0.9%) |
| 18 to 34 Years | 35 (0.4%) | 178 (1.9%) |
| 35 to 64 Years | 569 (3.5%) | 828 (4.3%) |
| 65 to 74 Years | 353 (7.3%) | 687 (11.0%) |
| 75 Years and over | 823 (20.8%) | 1,824 (28.9%) |
Technology Access in Guaynabo Municipio
Computing Device Access in Guaynabo Municipio
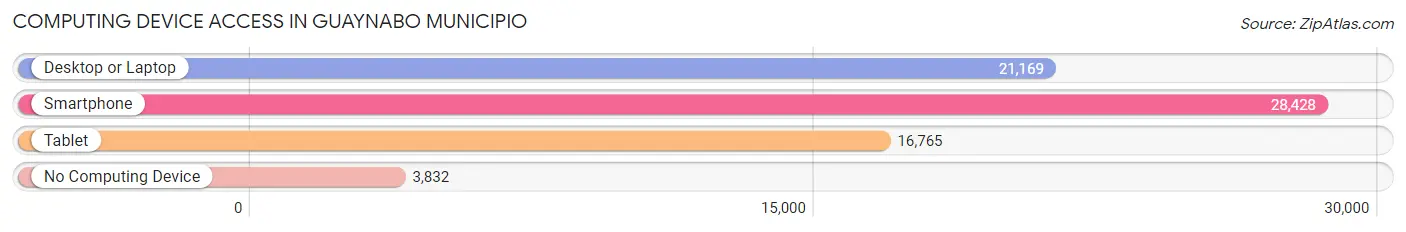
| Device Type | # Households | % Households |
| Desktop or Laptop | 21,169 | 63.3% |
| Smartphone | 28,428 | 85.0% |
| Tablet | 16,765 | 50.1% |
| No Computing Device | 3,832 | 11.5% |
| Total | 33,464 | 100.0% |
Internet Access in Guaynabo Municipio
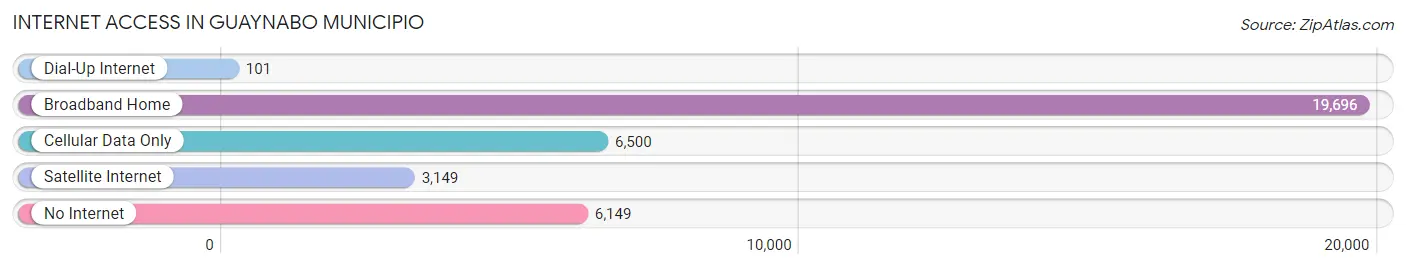
| Internet Type | # Households | % Households |
| Dial-Up Internet | 101 | 0.3% |
| Broadband Home | 19,696 | 58.9% |
| Cellular Data Only | 6,500 | 19.4% |
| Satellite Internet | 3,149 | 9.4% |
| No Internet | 6,149 | 18.4% |
| Total | 33,464 | 100.0% |
Guaynabo Municipio Summary
Guaynabo Municipio is a municipality located in the northern part of Puerto Rico. It is part of the San Juan-Caguas-Guaynabo Metropolitan Statistical Area. As of the 2010 census, the municipality had a population of 97,924, making it the third most populous municipality in Puerto Rico.
History
The area of Guaynabo was originally inhabited by the Taíno Indians. The first European settlement in the area was established in 1769 by the Spanish. The settlement was named San Antonio de la Guaynabo and was part of the San Juan metropolitan area. During the 19th century, the area was used for agricultural purposes and was known for its sugar cane plantations.
In the early 20th century, the area began to experience rapid population growth due to the influx of immigrants from the Dominican Republic and other Caribbean islands. This growth was further accelerated by the construction of the San Juan-Caguas-Guaynabo highway in the 1950s.
Geography
Guaynabo is located in the northern part of Puerto Rico, about 10 miles (16 km) south of San Juan. It is bordered by the municipalities of San Juan, Bayamón, Toa Baja, Cataño, and Trujillo Alto. The municipality covers an area of 24.7 square miles (64 km2) and is divided into seven barrios (neighborhoods): Guaynabo Pueblo, San Patricio, San Francisco, San Antonio, San Mateo, San José, and San Isidro.
The terrain of Guaynabo is mostly flat, with some hills in the northern part of the municipality. The highest point is Cerro de la Cruz, which has an elevation of 1,065 feet (325 m). The climate is tropical, with an average temperature of 79°F (26°C).
Economy
Guaynabo's economy is largely based on services and manufacturing. The municipality is home to several large companies, including pharmaceutical giant Pfizer, telecommunications company AT&T, and financial services company Banco Popular.
The municipality also has a thriving tourism industry, with several hotels, restaurants, and attractions. The most popular attractions include the Guaynabo City Museum, the San Patricio Plaza shopping center, and the Guaynabo River.
Demographics
As of the 2010 census, Guaynabo had a population of 97,924. The population is mostly of mixed European and African descent, with a small percentage of Native American and Asian ancestry. The median age is 38.7 years, and the median household income is $25,845.
The majority of the population (90.3%) speaks Spanish as their first language, while English is spoken by 8.2% of the population. The majority of the population (90.3%) is Roman Catholic, while 4.2% are Protestant and 5.5% are unaffiliated.
Guaynabo is a diverse municipality, with a large immigrant population. The largest immigrant groups are from the Dominican Republic (17.2%), the United States (14.2%), and Colombia (7.2%).
Common Questions
What is Per Capita Income in Guaynabo Municipio?
Per Capita income in Guaynabo Municipio is $28,637.
What is the Median Family Income in Guaynabo Municipio?
Median Family Income in Guaynabo Municipio is $55,704.
What is the Median Household income in Guaynabo Municipio?
Median Household Income in Guaynabo Municipio is $43,304.
What is Income or Wage Gap in Guaynabo Municipio?
Income or Wage Gap in Guaynabo Municipio is 9.0%.
Women in Guaynabo Municipio earn 91.0 cents for every dollar earned by a man.
What is Family Income Deficit in Guaynabo Municipio?
Family Income Deficit in Guaynabo Municipio is $10,368.
Families that are below poverty line in Guaynabo Municipio earn $10,368 less on average than the poverty threshold level.
What is Inequality or Gini Index in Guaynabo Municipio?
Inequality or Gini Index in Guaynabo Municipio is 0.55.
What is the Total Population of Guaynabo Municipio?
Total Population of Guaynabo Municipio is 89,554.
What is the Total Male Population of Guaynabo Municipio?
Total Male Population of Guaynabo Municipio is 42,015.
What is the Total Female Population of Guaynabo Municipio?
Total Female Population of Guaynabo Municipio is 47,539.
What is the Ratio of Males per 100 Females in Guaynabo Municipio?
There are 88.38 Males per 100 Females in Guaynabo Municipio.
What is the Ratio of Females per 100 Males in Guaynabo Municipio?
There are 113.15 Females per 100 Males in Guaynabo Municipio.
What is the Median Population Age in Guaynabo Municipio?
Median Population Age in Guaynabo Municipio is 46.3 Years.
What is the Average Family Size in Guaynabo Municipio
Average Family Size in Guaynabo Municipio is 3.4 People.
What is the Average Household Size in Guaynabo Municipio
Average Household Size in Guaynabo Municipio is 2.7 People.
How Large is the Labor Force in Guaynabo Municipio?
There are 40,772 People in the Labor Forcein in Guaynabo Municipio.
What is the Percentage of People in the Labor Force in Guaynabo Municipio?
52.1% of People are in the Labor Force in Guaynabo Municipio.
What is the Unemployment Rate in Guaynabo Municipio?
Unemployment Rate in Guaynabo Municipio is 8.2%.