Area Code 787 Map & Demographics
Area Code 787 Map
Area Code 787 Overview
$15,606
PER CAPITA INCOME
$29,821
AVG FAMILY INCOME
$24,068
AVG HOUSEHOLD INCOME
9.5%
WAGE / INCOME GAP [ % ]
90.5¢/ $1
WAGE / INCOME GAP [ $ ]
$11,134
FAMILY INCOME DEFICIT
55.03
INEQUALITY / GINI INDEX
3,022,142
TOTAL POPULATION
1,431,231
MALE POPULATION
1,590,911
FEMALE POPULATION
89.96
MALES / 100 FEMALES
111.16
FEMALES / 100 MALES
44.1
MEDIAN AGE
3.4
AVG FAMILY SIZE
2.7
AVG HOUSEHOLD SIZE
1,140,756
LABOR FORCE [ PEOPLE ]
44.3%
PERCENT IN LABOR FORCE
14.2%
UNEMPLOYMENT RATE
Nearby Area Codes
Income in Area Code 787
Income Overview in Area Code 787
Per Capita Income in Area Code 787 is $15,606, while median incomes of families and households are $29,821 and $24,068 respectively.
| Characteristic | Number | Measure |
| Per Capita Income | 3,022,142 | $15,606 |
| Median Family Income | 737,668 | $29,821 |
| Mean Family Income | 737,668 | $4,578,912 |
| Median Household Income | 1,123,325 | $24,068 |
| Mean Household Income | 1,123,325 | $3,897,401 |
| Income Deficit | 737,668 | $11,134 |
| Wage / Income Gap (%) | 3,022,142 | 9.50% |
| Wage / Income Gap ($) | 3,022,142 | 90.50¢ per $1 |
| Gini / Inequality Index | 3,022,142 | 55.03 |
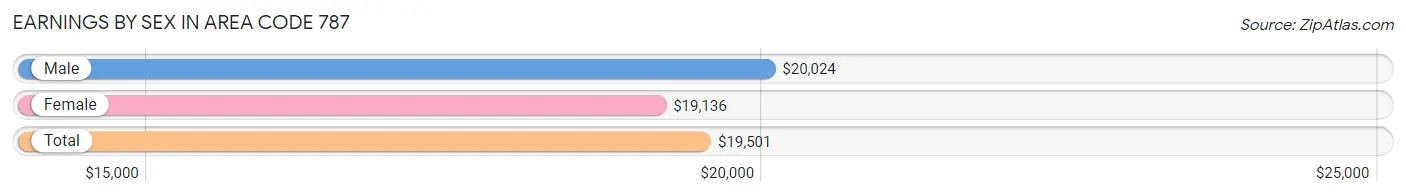
Earnings by Sex in Area Code 787
Average Earnings in Area Code 787 are $19,501, $20,024 for men and $19,136 for women, a difference of 4.4%.
| Sex | Number | Average Earnings |
| Male | 574,014 (52.5%) | $20,024 |
| Female | 519,994 (47.5%) | $19,136 |
| Total | 1,094,008 (100.0%) | $19,501 |
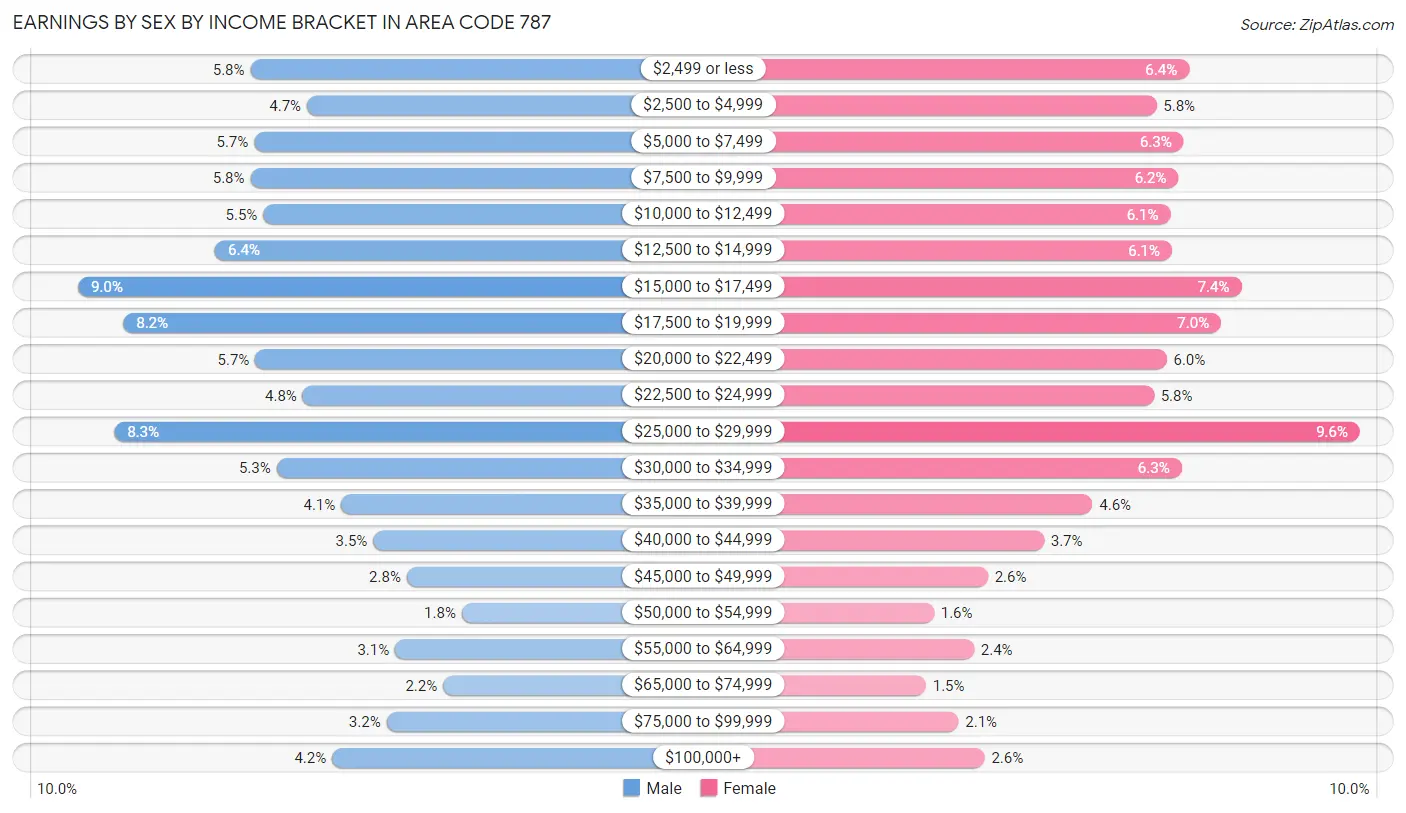
Earnings by Sex by Income Bracket in Area Code 787
The most common earnings brackets in Area Code 787 are $15,000 to $17,499 for men (51,683 | 9.0%) and $25,000 to $29,999 for women (49,967 | 9.6%).
| Income | Male | Female |
| $2,499 or less | 33,100 (5.8%) | 33,356 (6.4%) |
| $2,500 to $4,999 | 27,031 (4.7%) | 30,166 (5.8%) |
| $5,000 to $7,499 | 32,709 (5.7%) | 32,836 (6.3%) |
| $7,500 to $9,999 | 33,113 (5.8%) | 32,267 (6.2%) |
| $10,000 to $12,499 | 31,763 (5.5%) | 31,537 (6.1%) |
| $12,500 to $14,999 | 36,893 (6.4%) | 31,683 (6.1%) |
| $15,000 to $17,499 | 51,683 (9.0%) | 38,451 (7.4%) |
| $17,500 to $19,999 | 46,771 (8.2%) | 36,436 (7.0%) |
| $20,000 to $22,499 | 32,595 (5.7%) | 31,122 (6.0%) |
| $22,500 to $24,999 | 27,502 (4.8%) | 29,912 (5.8%) |
| $25,000 to $29,999 | 47,759 (8.3%) | 49,967 (9.6%) |
| $30,000 to $34,999 | 30,285 (5.3%) | 32,621 (6.3%) |
| $35,000 to $39,999 | 23,385 (4.1%) | 23,908 (4.6%) |
| $40,000 to $44,999 | 19,941 (3.5%) | 19,198 (3.7%) |
| $45,000 to $49,999 | 16,325 (2.8%) | 13,704 (2.6%) |
| $50,000 to $54,999 | 10,405 (1.8%) | 8,487 (1.6%) |
| $55,000 to $64,999 | 17,579 (3.1%) | 12,352 (2.4%) |
| $65,000 to $74,999 | 12,398 (2.2%) | 7,694 (1.5%) |
| $75,000 to $99,999 | 18,462 (3.2%) | 10,863 (2.1%) |
| $100,000+ | 24,315 (4.2%) | 13,434 (2.6%) |
| Total | 574,014 (100.0%) | 519,994 (100.0%) |
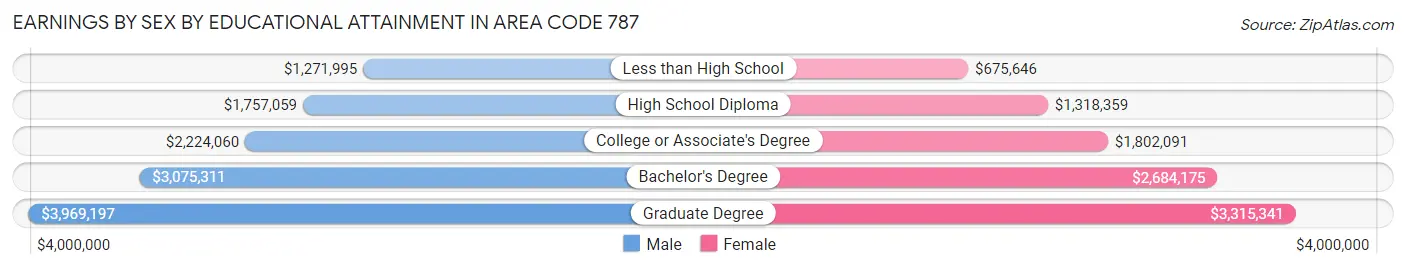
Earnings by Sex by Educational Attainment in Area Code 787
Average earnings in Area Code 787 are $2,276,127 for men and $2,184,028 for women, a difference of 4.1%. Men with an educational attainment of graduate degree enjoy the highest average annual earnings of $3,969,197, while those with less than high school education earn the least with $1,271,995. Women with an educational attainment of graduate degree earn the most with the average annual earnings of $3,315,341, while those with less than high school education have the smallest earnings of $675,646.
| Educational Attainment | Male Income | Female Income |
| Less than High School | $1,271,995 | $675,646 |
| High School Diploma | $1,757,059 | $1,318,359 |
| College or Associate's Degree | $2,224,060 | $1,802,091 |
| Bachelor's Degree | $3,075,311 | $2,684,175 |
| Graduate Degree | $3,969,197 | $3,315,341 |
| Total | $2,276,127 | $2,184,028 |
Family Income in Area Code 787
Family Income Brackets in Area Code 787
According to the Area Code 787 family income data, there are 14,616,154 families falling into the less than $10,000 income range, which is the most common income bracket and makes up 1,981.4% of all families. Conversely, the $150,000 to $199,999 income bracket is the least frequent group with only 1,457,632 families (197.6%) belonging to this category.
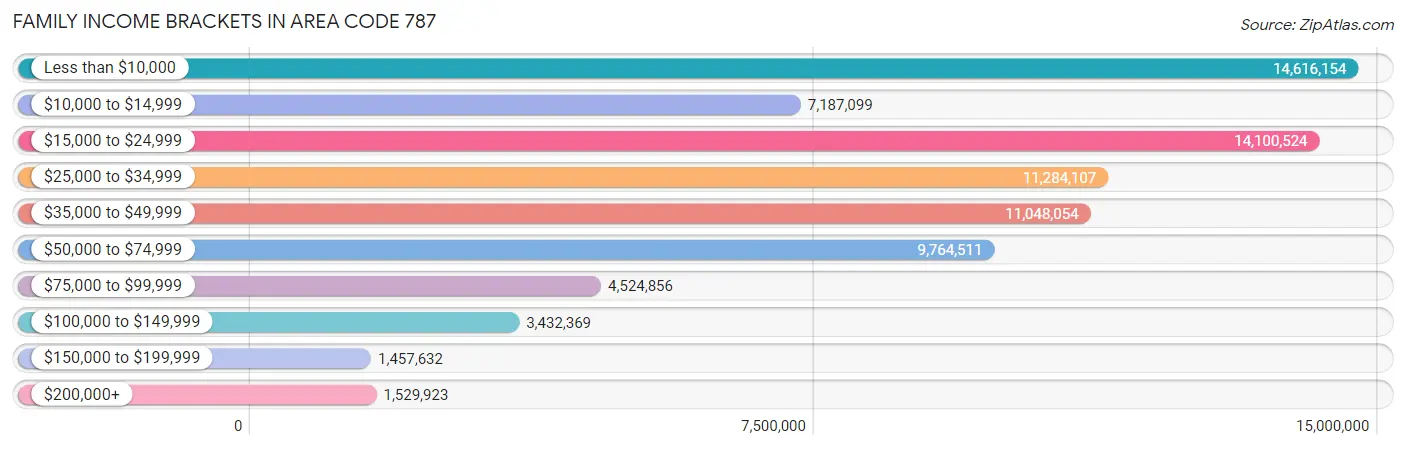
| Income Bracket | # Families | % Families |
| Less than $10,000 | 14,616,154 | 1,981.4% |
| $10,000 to $14,999 | 7,187,099 | 974.3% |
| $15,000 to $24,999 | 14,100,524 | 1,911.5% |
| $25,000 to $34,999 | 11,284,107 | 1,529.7% |
| $35,000 to $49,999 | 11,048,054 | 1,497.7% |
| $50,000 to $74,999 | 9,764,511 | 1,323.7% |
| $75,000 to $99,999 | 4,524,856 | 613.4% |
| $100,000 to $149,999 | 3,432,369 | 465.3% |
| $150,000 to $199,999 | 1,457,632 | 197.6% |
| $200,000+ | 1,529,923 | 207.4% |
Family Income by Famaliy Size in Area Code 787
7+ person families (3,733 | 0.5%) account for the highest median family income in Area Code 787 with $87,453 per family, while 2-person families (364,533 | 49.4%) have the highest median income of $13,004 per family member.
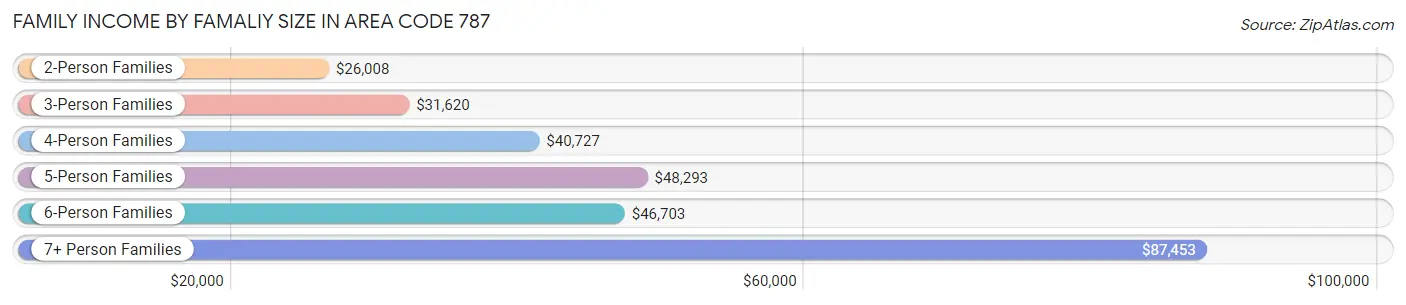
| Income Bracket | # Families | Median Income |
| 2-Person Families | 364,533 (49.4%) | $26,008 |
| 3-Person Families | 209,770 (28.4%) | $31,620 |
| 4-Person Families | 116,178 (15.8%) | $40,727 |
| 5-Person Families | 35,302 (4.8%) | $48,293 |
| 6-Person Families | 8,152 (1.1%) | $46,703 |
| 7+ Person Families | 3,733 (0.5%) | $87,453 |
| Total | 737,668 (100.0%) | $29,821 |
Family Income by Number of Earners in Area Code 787
The median family income in Area Code 787 is $29,821, with families comprising 3+ earners (35,296) having the highest median family income of $72,100, while families with no earners (264,207) have the lowest median family income of $17,169, accounting for 4.8% and 35.8% of families, respectively.
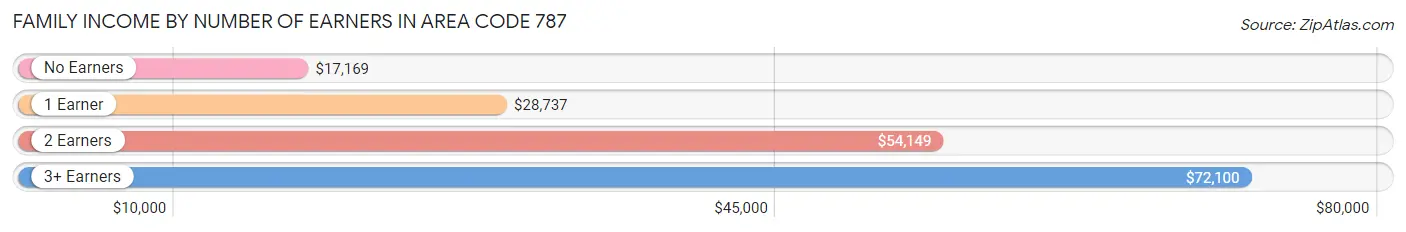
| Number of Earners | # Families | Median Income |
| No Earners | 264,207 (35.8%) | $17,169 |
| 1 Earner | 272,252 (36.9%) | $28,737 |
| 2 Earners | 165,913 (22.5%) | $54,149 |
| 3+ Earners | 35,296 (4.8%) | $72,100 |
| Total | 737,668 (100.0%) | $29,821 |
Household Income in Area Code 787
Household Income Brackets in Area Code 787
With 28,180,854 households falling in the category, the less than $10,000 income range is the most frequent in Area Code 787, accounting for 2,508.7% of all households. In contrast, only 1,701,837 households (151.5%) fall into the $200,000+ income bracket, making it the least populous group.
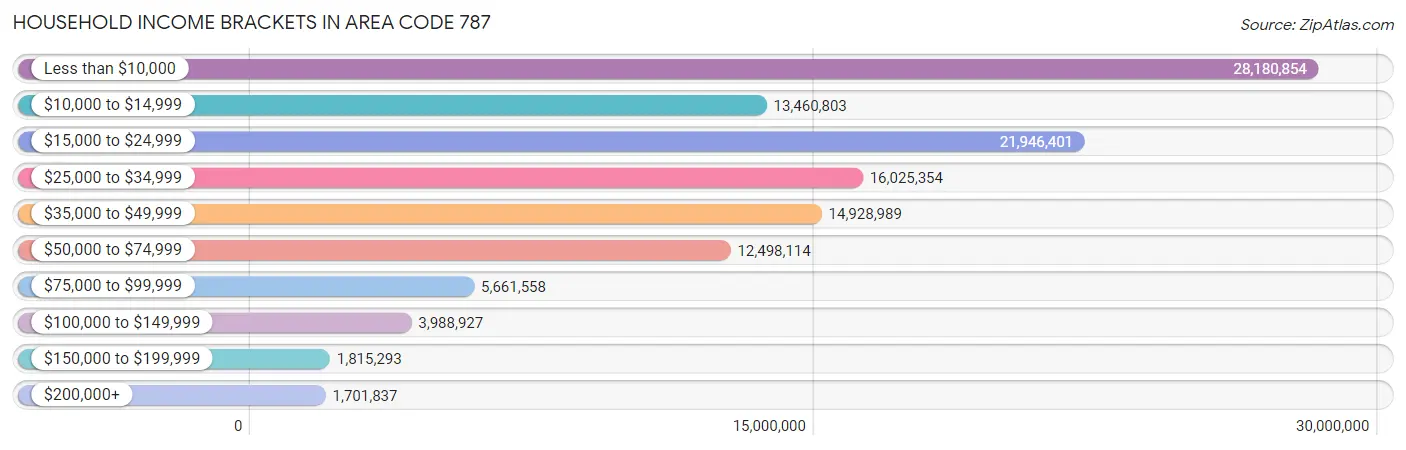
| Income Bracket | # Households | % Households |
| Less than $10,000 | 28,180,854 | 2,508.7% |
| $10,000 to $14,999 | 13,460,803 | 1,198.3% |
| $15,000 to $24,999 | 21,946,401 | 1,953.7% |
| $25,000 to $34,999 | 16,025,354 | 1,426.6% |
| $35,000 to $49,999 | 14,928,989 | 1,329.0% |
| $50,000 to $74,999 | 12,498,114 | 1,112.6% |
| $75,000 to $99,999 | 5,661,558 | 504.0% |
| $100,000 to $149,999 | 3,988,927 | 355.1% |
| $150,000 to $199,999 | 1,815,293 | 161.6% |
| $200,000+ | 1,701,837 | 151.5% |
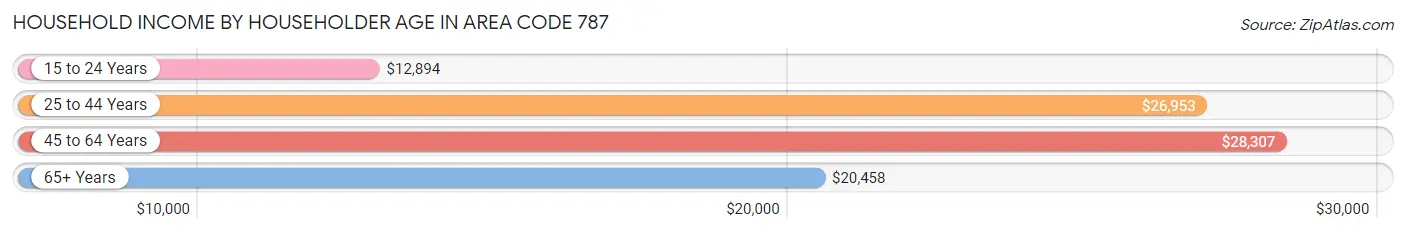
Household Income by Householder Age in Area Code 787
The median household income in Area Code 787 is $24,068, with the highest median household income of $28,307 found in the 45 to 64 years age bracket for the primary householder. A total of 421,034 households (37.5%) fall into this category. Meanwhile, the 15 to 24 years age bracket for the primary householder has the lowest median household income of $12,894, with 18,821 households (1.7%) in this group.
| Income Bracket | # Households | Median Income |
| 15 to 24 Years | 18,821 (1.7%) | $12,894 |
| 25 to 44 Years | 269,172 (24.0%) | $26,953 |
| 45 to 64 Years | 421,034 (37.5%) | $28,307 |
| 65+ Years | 414,298 (36.9%) | $20,458 |
| Total | 1,123,325 (100.0%) | $24,068 |
Poverty in Area Code 787
Income Below Poverty by Sex and Age in Area Code 787
With 39.8% poverty level for males and 43.7% for females among the residents of Area Code 787, under 5 year old males and under 5 year old females are the most vulnerable to poverty, with 32,844 males (62.0%) and 30,096 females (59.7%) in their respective age groups living below the poverty level.
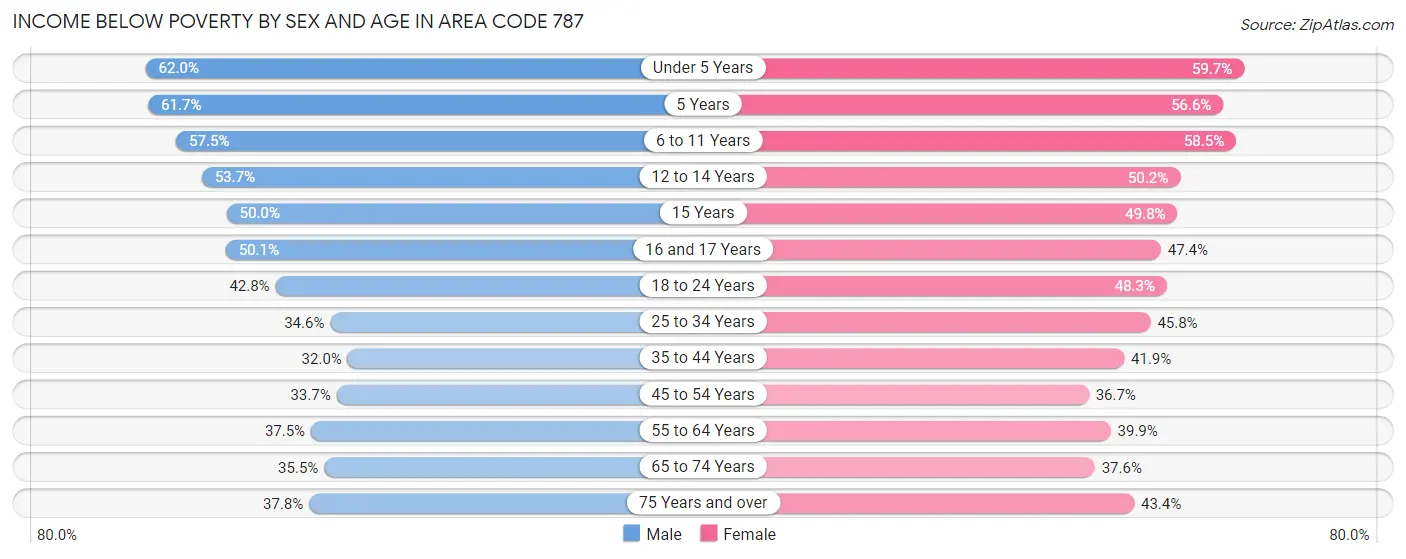
| Age Bracket | Male | Female |
| Under 5 Years | 32,844 (62.0%) | 30,096 (59.7%) |
| 5 Years | 7,753 (61.7%) | 7,065 (56.6%) |
| 6 to 11 Years | 52,401 (57.5%) | 50,947 (58.5%) |
| 12 to 14 Years | 28,189 (53.7%) | 26,332 (50.2%) |
| 15 Years | 8,896 (50.0%) | 8,402 (49.8%) |
| 16 and 17 Years | 19,233 (50.1%) | 16,871 (47.4%) |
| 18 to 24 Years | 60,800 (42.7%) | 66,243 (48.2%) |
| 25 to 34 Years | 65,084 (34.6%) | 89,987 (45.8%) |
| 35 to 44 Years | 54,717 (32.0%) | 80,463 (41.9%) |
| 45 to 54 Years | 61,230 (33.7%) | 75,571 (36.7%) |
| 55 to 64 Years | 69,815 (37.5%) | 88,395 (39.9%) |
| 65 to 74 Years | 55,700 (35.5%) | 72,665 (37.6%) |
| 75 Years and over | 48,769 (37.8%) | 78,170 (43.4%) |
| Total | 565,431 (39.8%) | 691,207 (43.7%) |
Income Above Poverty by Sex and Age in Area Code 787
According to the poverty statistics in Area Code 787, males aged 35 to 44 years and females aged 45 to 54 years are the age groups that are most secure financially, with 68.0% of males and 63.3% of females in these age groups living above the poverty line.

| Age Bracket | Male | Female |
| Under 5 Years | 20,108 (38.0%) | 20,298 (40.3%) |
| 5 Years | 4,820 (38.3%) | 5,411 (43.4%) |
| 6 to 11 Years | 38,751 (42.5%) | 36,097 (41.5%) |
| 12 to 14 Years | 24,316 (46.3%) | 26,091 (49.8%) |
| 15 Years | 8,896 (50.0%) | 8,461 (50.2%) |
| 16 and 17 Years | 19,136 (49.9%) | 18,747 (52.6%) |
| 18 to 24 Years | 81,430 (57.3%) | 71,043 (51.7%) |
| 25 to 34 Years | 122,930 (65.4%) | 106,375 (54.2%) |
| 35 to 44 Years | 116,116 (68.0%) | 111,499 (58.1%) |
| 45 to 54 Years | 120,520 (66.3%) | 130,547 (63.3%) |
| 55 to 64 Years | 116,463 (62.5%) | 133,031 (60.1%) |
| 65 to 74 Years | 101,110 (64.5%) | 120,787 (62.4%) |
| 75 Years and over | 80,422 (62.3%) | 101,958 (56.6%) |
| Total | 855,018 (60.2%) | 890,345 (56.3%) |
Income Below Poverty Among Married-Couple Families in Area Code 787
The poverty statistics for married-couple families in Area Code 787 show that 26.2% or 107,625 of the total 410,598 families live below the poverty line. Families with 5 or more children have the highest poverty rate of 78.9%, comprising of 330 families. On the other hand, families with no children have the lowest poverty rate of 25.1%, which includes 74,093 families.
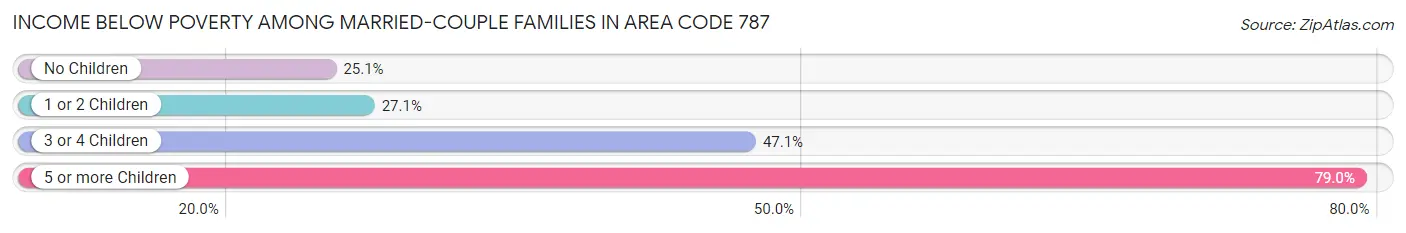
| Children | Above Poverty | Below Poverty |
| No Children | 220,667 (74.9%) | 74,093 (25.1%) |
| 1 or 2 Children | 77,232 (72.9%) | 28,772 (27.1%) |
| 3 or 4 Children | 4,986 (52.9%) | 4,430 (47.0%) |
| 5 or more Children | 88 (21.0%) | 330 (78.9%) |
| Total | 302,973 (73.8%) | 107,625 (26.2%) |
Income Below Poverty Among Single-Parent Households in Area Code 787
According to the poverty data in Area Code 787, 47.1% or 35,618 single-father households and 55.8% or 140,308 single-mother households are living below the poverty line. Among single-father households, those with 5 or more children have the highest poverty rate, with 106 households (100.0%) experiencing poverty. Likewise, among single-mother households, those with 5 or more children have the highest poverty rate, with 396 households (98.3%) falling below the poverty line.
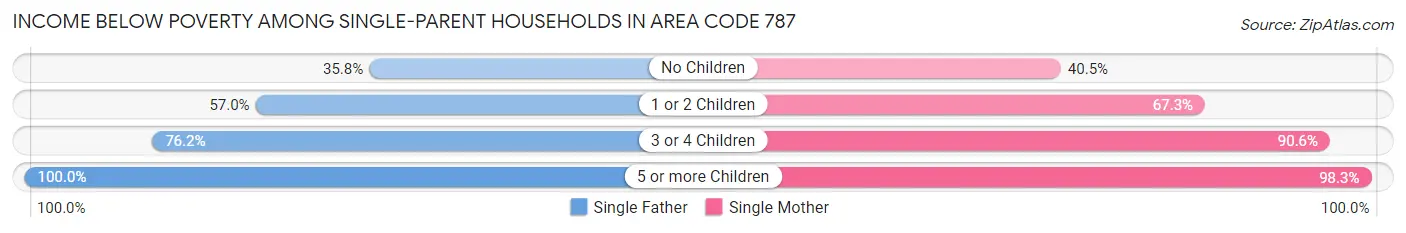
| Children | Single Father | Single Mother |
| No Children | 13,883 (35.8%) | 48,988 (40.5%) |
| 1 or 2 Children | 18,834 (57.0%) | 77,539 (67.3%) |
| 3 or 4 Children | 2,795 (76.2%) | 13,385 (90.5%) |
| 5 or more Children | 106 (100.0%) | 396 (98.3%) |
| Total | 35,618 (47.1%) | 140,308 (55.8%) |
Income Below Poverty Among Married-Couple vs Single-Parent Households in Area Code 787
The poverty data for Area Code 787 shows that 107,625 of the married-couple family households (26.2%) and 175,926 of the single-parent households (53.8%) are living below the poverty level. Within the married-couple family households, those with 5 or more children have the highest poverty rate, with 330 households (78.9%) falling below the poverty line. Among the single-parent households, those with 5 or more children have the highest poverty rate, with 502 household (98.6%) living below poverty.
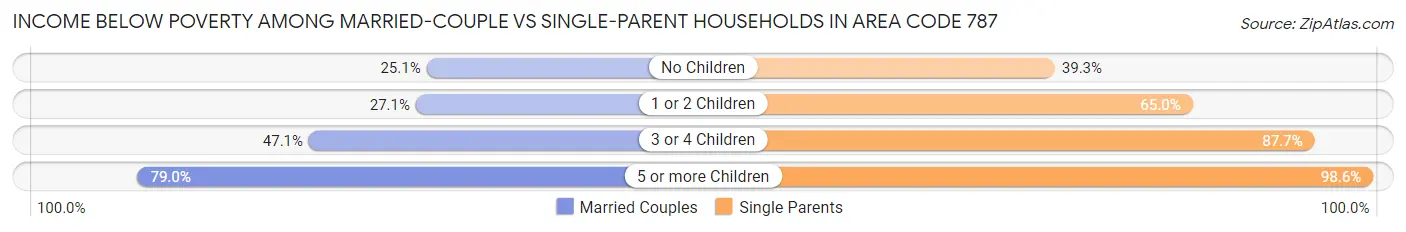
| Children | Married-Couple Families | Single-Parent Households |
| No Children | 74,093 (25.1%) | 62,871 (39.3%) |
| 1 or 2 Children | 28,772 (27.1%) | 96,373 (65.0%) |
| 3 or 4 Children | 4,430 (47.0%) | 16,180 (87.7%) |
| 5 or more Children | 330 (78.9%) | 502 (98.6%) |
| Total | 107,625 (26.2%) | 175,926 (53.8%) |
Race in Area Code 787
The most populous races in Area Code 787 are Hispanic or Latino (2,983,265 | 98.7%), White / Caucasian (1,315,271 | 43.5%), and Some other Race (723,416 | 23.9%).
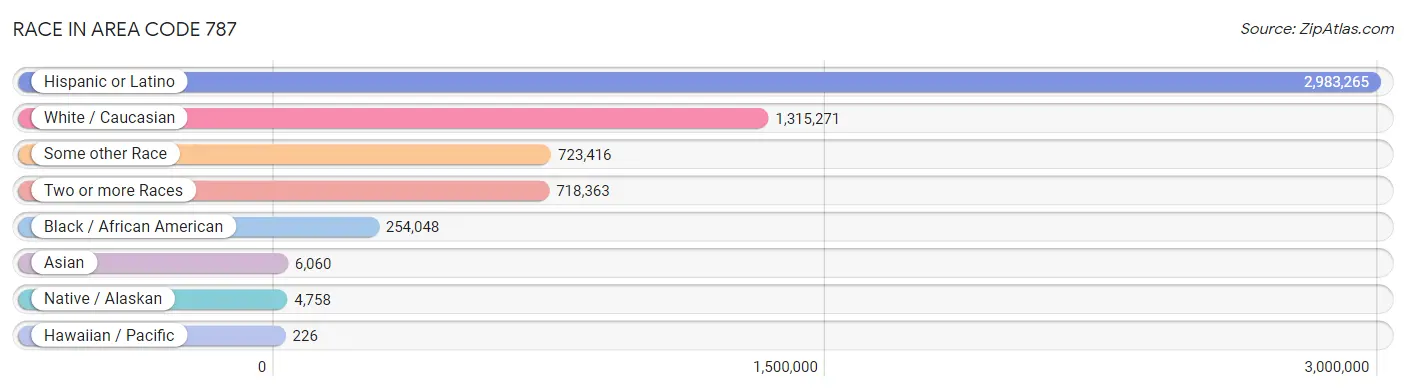
| Race | # Population | % Population |
| Asian | 6,060 | 0.2% |
| Black / African American | 254,048 | 8.4% |
| Hawaiian / Pacific | 226 | 0.0% |
| Hispanic or Latino | 2,983,265 | 98.7% |
| Native / Alaskan | 4,758 | 0.2% |
| White / Caucasian | 1,315,271 | 43.5% |
| Two or more Races | 718,363 | 23.8% |
| Some other Race | 723,416 | 23.9% |
| Total | 3,022,142 | 100.0% |
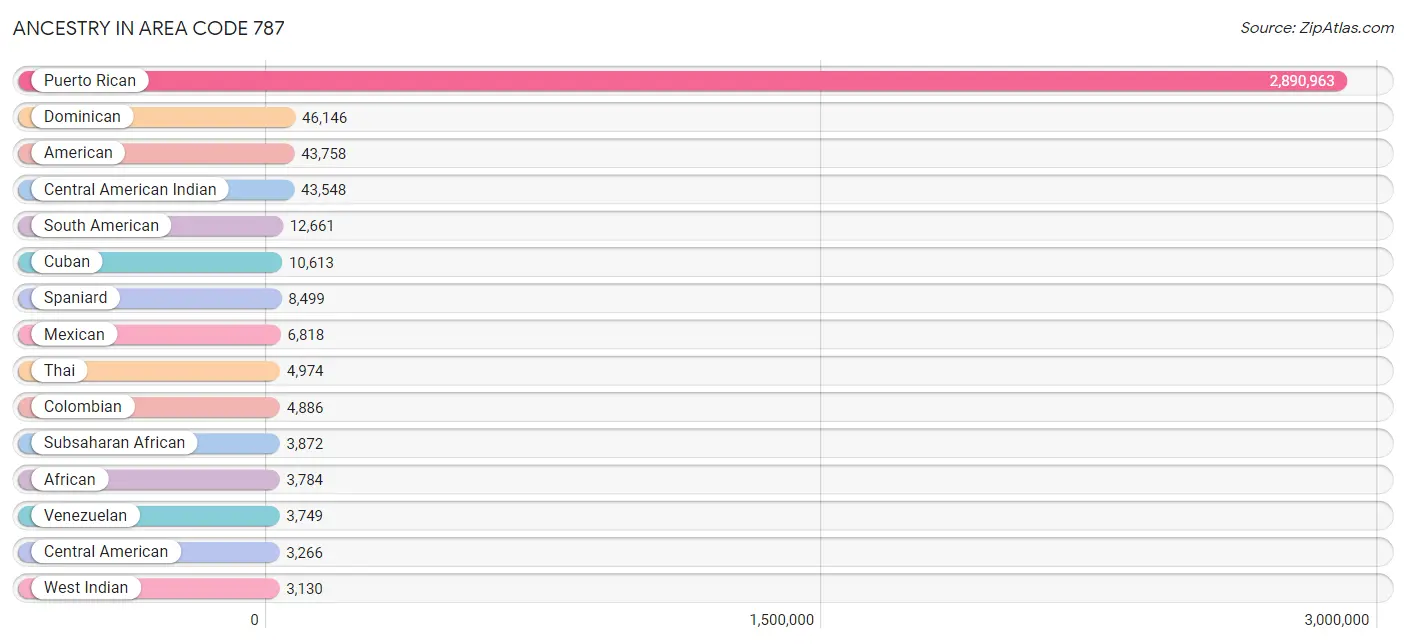
Ancestry in Area Code 787
The most populous ancestries reported in Area Code 787 are Puerto Rican (2,890,963 | 95.7%), Dominican (46,146 | 1.5%), American (43,758 | 1.5%), Central American Indian (43,548 | 1.4%), and South American (12,661 | 0.4%), together accounting for 100.5% of all Area Code 787 residents.
| Ancestry | # Population | % Population |
| African | 3,784 | 0.1% |
| American | 43,758 | 1.5% |
| Apache | 14 | 0.0% |
| Arab | 1,494 | 0.1% |
| Argentinean | 787 | 0.0% |
| Australian | 44 | 0.0% |
| Austrian | 55 | 0.0% |
| Barbadian | 36 | 0.0% |
| Basque | 68 | 0.0% |
| Belgian | 94 | 0.0% |
| Bhutanese | 80 | 0.0% |
| Bolivian | 10 | 0.0% |
| Brazilian | 279 | 0.0% |
| British | 426 | 0.0% |
| British West Indian | 492 | 0.0% |
| Bulgarian | 27 | 0.0% |
| Burmese | 279 | 0.0% |
| Canadian | 117 | 0.0% |
| Cape Verdean | 20 | 0.0% |
| Central American | 3,266 | 0.1% |
| Central American Indian | 43,548 | 1.4% |
| Cherokee | 27 | 0.0% |
| Chilean | 453 | 0.0% |
| Colombian | 4,886 | 0.2% |
| Costa Rican | 845 | 0.0% |
| Croatian | 9 | 0.0% |
| Cuban | 10,613 | 0.4% |
| Czech | 45 | 0.0% |
| Czechoslovakian | 26 | 0.0% |
| Danish | 29 | 0.0% |
| Dominican | 46,146 | 1.5% |
| Dutch | 174 | 0.0% |
| Dutch West Indian | 93 | 0.0% |
| Eastern European | 13 | 0.0% |
| Ecuadorian | 1,207 | 0.0% |
| Egyptian | 8 | 0.0% |
| English | 905 | 0.0% |
| European | 1,340 | 0.0% |
| Fijian | 10 | 0.0% |
| Finnish | 11 | 0.0% |
| French | 1,951 | 0.1% |
| French Canadian | 83 | 0.0% |
| German | 1,793 | 0.1% |
| Greek | 127 | 0.0% |
| Guamanian / Chamorro | 21 | 0.0% |
| Guatemalan | 265 | 0.0% |
| Guyanese | 21 | 0.0% |
| Haitian | 472 | 0.0% |
| Honduran | 655 | 0.0% |
| Hungarian | 48 | 0.0% |
| Indian (Asian) | 2,450 | 0.1% |
| Inupiat | 16 | 0.0% |
| Iranian | 89 | 0.0% |
| Iraqi | 19 | 0.0% |
| Irish | 1,046 | 0.0% |
| Israeli | 8 | 0.0% |
| Italian | 2,837 | 0.1% |
| Jamaican | 103 | 0.0% |
| Kenyan | 23 | 0.0% |
| Korean | 517 | 0.0% |
| Laotian | 49 | 0.0% |
| Lebanese | 206 | 0.0% |
| Liberian | 12 | 0.0% |
| Lithuanian | 14 | 0.0% |
| Mexican | 6,818 | 0.2% |
| Mexican American Indian | 237 | 0.0% |
| Native Hawaiian | 114 | 0.0% |
| Navajo | 12 | 0.0% |
| Nicaraguan | 269 | 0.0% |
| Nigerian | 18 | 0.0% |
| Northern European | 36 | 0.0% |
| Norwegian | 49 | 0.0% |
| Osage | 16 | 0.0% |
| Pakistani | 51 | 0.0% |
| Palestinian | 560 | 0.0% |
| Panamanian | 853 | 0.0% |
| Paraguayan | 78 | 0.0% |
| Peruvian | 1,314 | 0.0% |
| Polish | 446 | 0.0% |
| Portuguese | 462 | 0.0% |
| Pueblo | 15 | 0.0% |
| Puerto Rican | 2,890,963 | 95.7% |
| Romanian | 87 | 0.0% |
| Russian | 222 | 0.0% |
| Salvadoran | 379 | 0.0% |
| Samoan | 65 | 0.0% |
| Scotch-Irish | 51 | 0.0% |
| Scottish | 195 | 0.0% |
| Serbian | 9 | 0.0% |
| Slovene | 17 | 0.0% |
| South American | 12,661 | 0.4% |
| South American Indian | 449 | 0.0% |
| Spaniard | 8,499 | 0.3% |
| Spanish | 41 | 0.0% |
| Spanish American Indian | 531 | 0.0% |
| Sri Lankan | 109 | 0.0% |
| Subsaharan African | 3,872 | 0.1% |
| Swedish | 97 | 0.0% |
| Swiss | 58 | 0.0% |
| Syrian | 31 | 0.0% |
| Thai | 4,974 | 0.2% |
| Trinidadian and Tobagonian | 84 | 0.0% |
| U.S. Virgin Islander | 236 | 0.0% |
| Ukrainian | 74 | 0.0% |
| Uruguayan | 165 | 0.0% |
| Venezuelan | 3,749 | 0.1% |
| Welsh | 8 | 0.0% |
| West Indian | 3,130 | 0.1% | View All 108 Rows |
Immigrants in Area Code 787

| Immigration Origin | # Population | % Population | View All 0 Rows |
Sex and Age in Area Code 787
Sex and Age in Area Code 787
The most populous age groups in Area Code 787 are 20 to 24 Years (102,746 | 7.2%) for men and 60 to 64 Years (111,194 | 7.0%) for women.
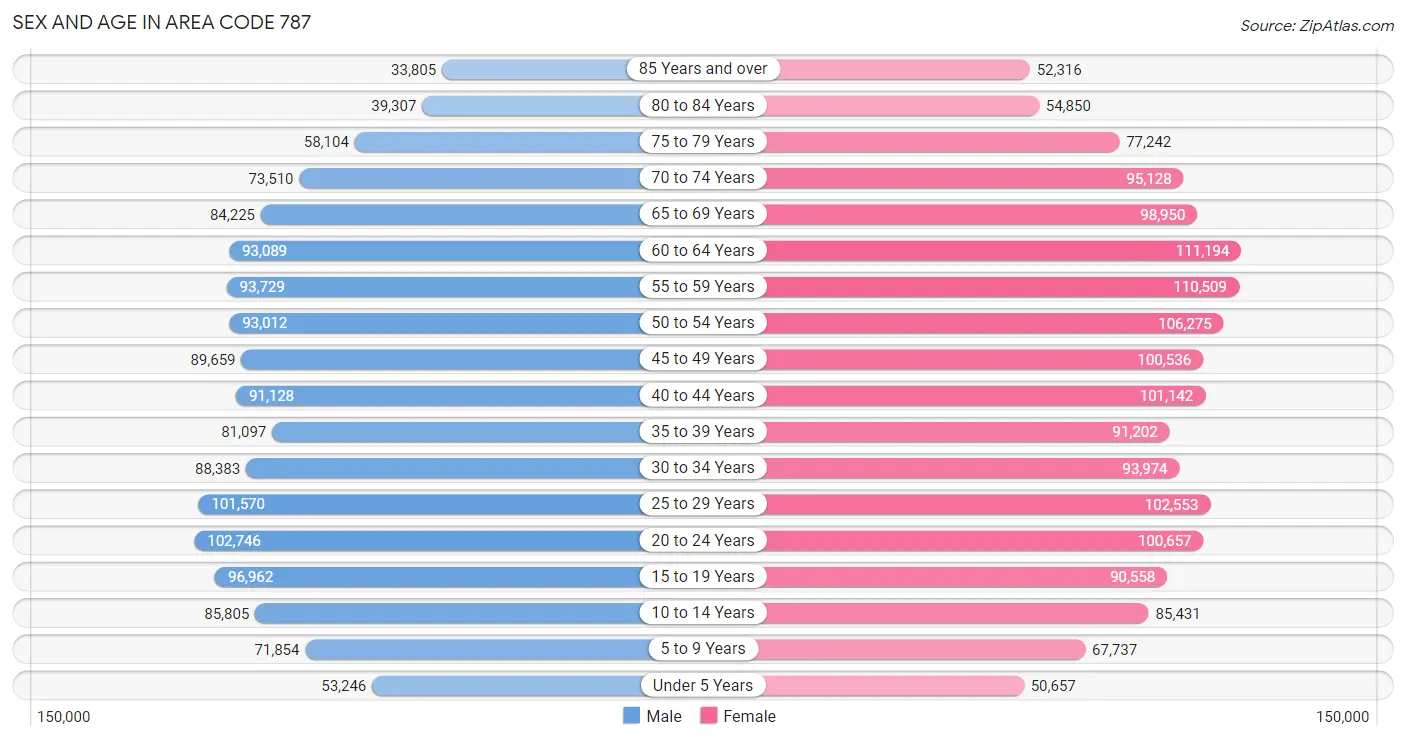
| Age Bracket | Male | Female |
| Under 5 Years | 53,246 (3.7%) | 50,657 (3.2%) |
| 5 to 9 Years | 71,854 (5.0%) | 67,737 (4.3%) |
| 10 to 14 Years | 85,805 (6.0%) | 85,431 (5.4%) |
| 15 to 19 Years | 96,962 (6.8%) | 90,558 (5.7%) |
| 20 to 24 Years | 102,746 (7.2%) | 100,657 (6.3%) |
| 25 to 29 Years | 101,570 (7.1%) | 102,553 (6.5%) |
| 30 to 34 Years | 88,383 (6.2%) | 93,974 (5.9%) |
| 35 to 39 Years | 81,097 (5.7%) | 91,202 (5.7%) |
| 40 to 44 Years | 91,128 (6.4%) | 101,142 (6.4%) |
| 45 to 49 Years | 89,659 (6.3%) | 100,536 (6.3%) |
| 50 to 54 Years | 93,012 (6.5%) | 106,275 (6.7%) |
| 55 to 59 Years | 93,729 (6.6%) | 110,509 (7.0%) |
| 60 to 64 Years | 93,089 (6.5%) | 111,194 (7.0%) |
| 65 to 69 Years | 84,225 (5.9%) | 98,950 (6.2%) |
| 70 to 74 Years | 73,510 (5.1%) | 95,128 (6.0%) |
| 75 to 79 Years | 58,104 (4.1%) | 77,242 (4.9%) |
| 80 to 84 Years | 39,307 (2.8%) | 54,850 (3.5%) |
| 85 Years and over | 33,805 (2.4%) | 52,316 (3.3%) |
| Total | 1,431,231 (100.0%) | 1,590,911 (100.0%) |
Families and Households in Area Code 787
Median Family Size in Area Code 787
The median family size in Area Code 787 is 3.36 persons per family, with single female/mother families (251,516 | 34.1%) accounting for the largest median family size of 3.49757 persons per family. On the other hand, married-couple families (410,598 | 55.7%) represent the smallest median family size with 3.28 persons per family.
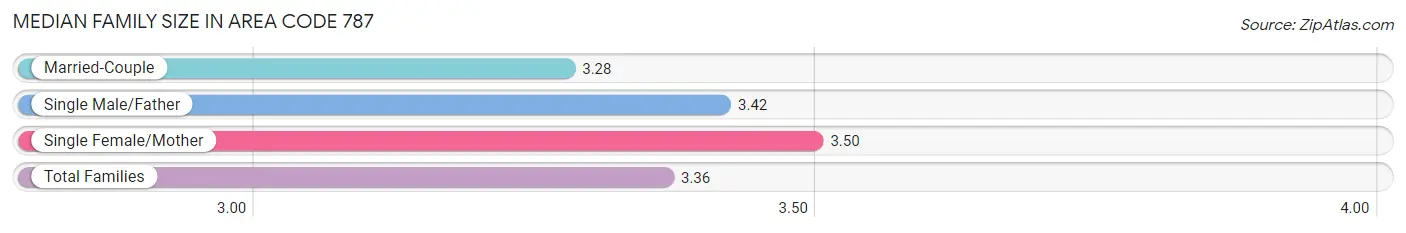
| Family Type | # Families | Family Size |
| Married-Couple | 410,598 (55.7%) | 3.28 |
| Single Male/Father | 75,554 (10.2%) | 3.42 |
| Single Female/Mother | 251,516 (34.1%) | 3.50 |
| Total Families | 737,668 (100.0%) | 3.36 |
Median Household Size in Area Code 787
The median household size in Area Code 787 is 2.68 persons per household, with single male/father households (75,554 | 6.7%) accounting for the largest median household size of 3.85783 persons per household. non-family households (385,657 | 34.3%) represent the smallest median household size with 1.17 persons per household.
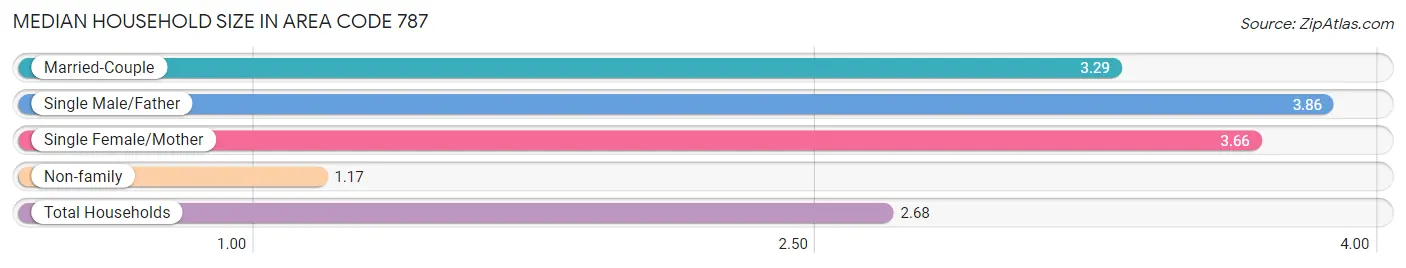
| Household Type | # Households | Household Size |
| Married-Couple | 410,598 (36.5%) | 3.29 |
| Single Male/Father | 75,554 (6.7%) | 3.86 |
| Single Female/Mother | 251,516 (22.4%) | 3.66 |
| Non-family | 385,657 (34.3%) | 1.17 |
| Total Households | 1,123,325 (100.0%) | 2.68 |
Household Size by Marriage Status in Area Code 787
Out of a total of 1,123,325 households in Area Code 787, 737,668 (65.7%) are family households, while 385,657 (34.3%) are nonfamily households. The most numerous type of family households are 2-person households, comprising 330,483, and the most common type of nonfamily households are 1-person households, comprising 330,965.
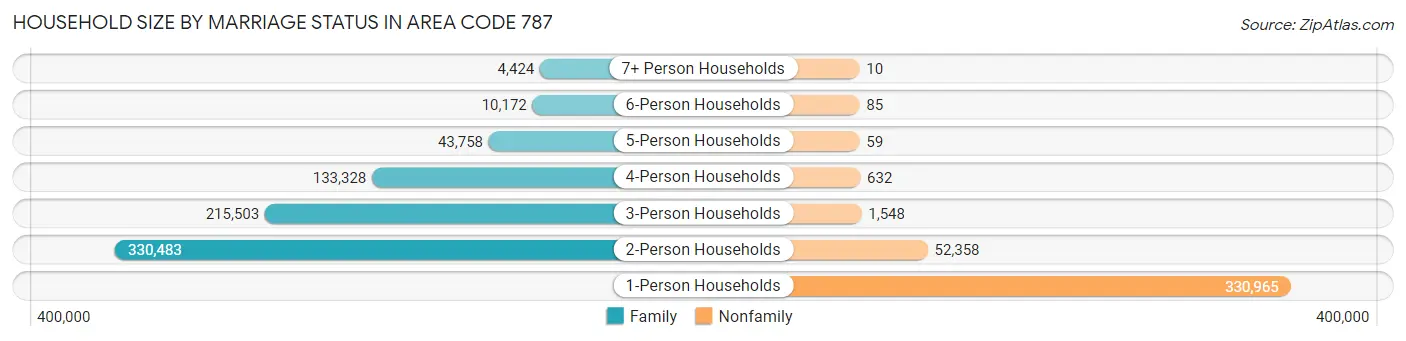
| Household Size | Family Households | Nonfamily Households |
| 1-Person Households | - | 330,965 (29.5%) |
| 2-Person Households | 330,483 (29.4%) | 52,358 (4.7%) |
| 3-Person Households | 215,503 (19.2%) | 1,548 (0.1%) |
| 4-Person Households | 133,328 (11.9%) | 632 (0.1%) |
| 5-Person Households | 43,758 (3.9%) | 59 (0.0%) |
| 6-Person Households | 10,172 (0.9%) | 85 (0.0%) |
| 7+ Person Households | 4,424 (0.4%) | 10 (0.0%) |
| Total | 737,668 (65.7%) | 385,657 (34.3%) |
Female Fertility in Area Code 787
Fertility by Age in Area Code 787
Average fertility rate in Area Code 787 is 27.9 births per 1,000 women. Women in the age bracket of 20 to 34 years have the highest fertility rate with 49.4 births per 1,000 women. Women in the age bracket of 20 to 34 years acount for 74.2% of all women with births.
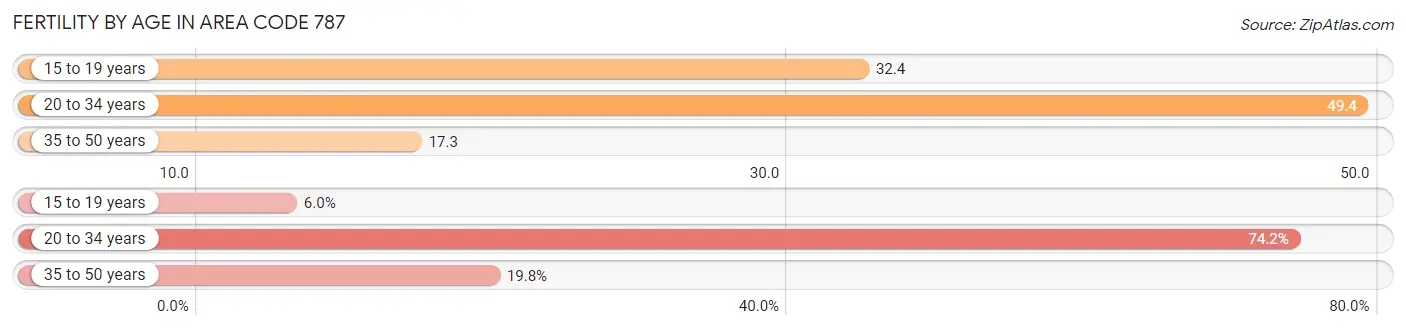
| Age Bracket | Women with Births | Births / 1,000 Women |
| 15 to 19 years | 1,165 (6.0%) | 32.4 |
| 20 to 34 years | 14,319 (74.2%) | 49.4 |
| 35 to 50 years | 3,826 (19.8%) | 17.2 |
| Total | 19,310 (100.0%) | 27.9 |
Fertility by Age by Marriage Status in Area Code 787
36.2% of women with births (19,310) in Area Code 787 are married. The highest percentage of unmarried women with births falls into 15 to 19 years age bracket with 96.8% of them unmarried at the time of birth, while the lowest percentage of unmarried women with births belong to 35 to 50 years age bracket with 62.9% of them unmarried.
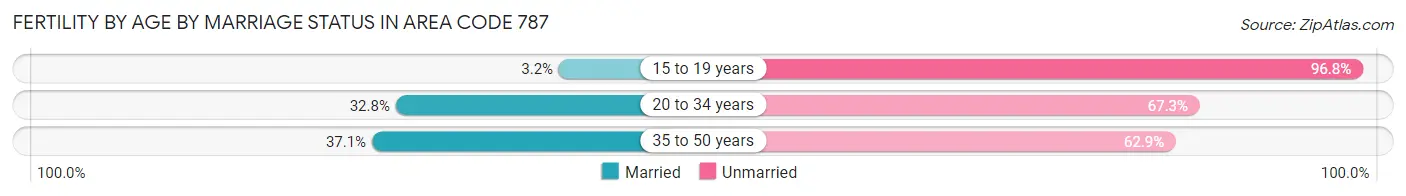
| Age Bracket | Married | Unmarried |
| 15 to 19 years | 37 (3.2%) | 1,128 (96.8%) |
| 20 to 34 years | 4,689 (32.8%) | 9,630 (67.2%) |
| 35 to 50 years | 1,418 (37.1%) | 2,408 (62.9%) |
| Total | 6,995 (36.2%) | 12,315 (63.8%) |
Fertility by Education in Area Code 787
Average fertility rate in Area Code 787 is 27.9 births per 1,000 women. Women with the education attainment of graduate degree have the highest fertility rate of 60.6 births per 1,000 women, while women with the education attainment of less than high school have the lowest fertility at 28.8 births per 1,000 women. Women with the education attainment of college or associate's degree represent 38.2% of all women with births.
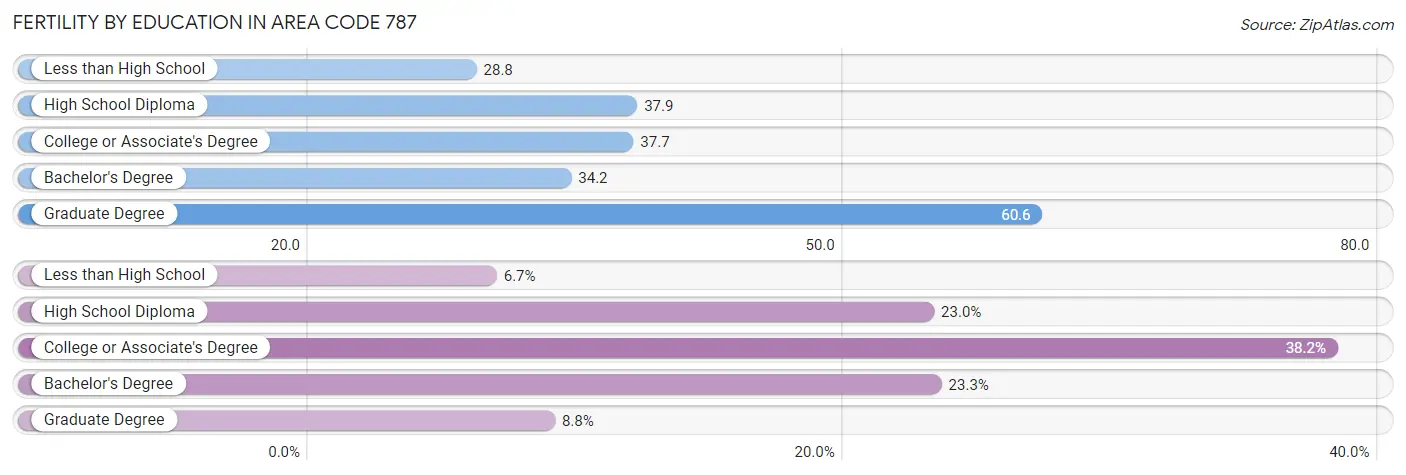
| Educational Attainment | Women with Births | Births / 1,000 Women |
| Less than High School | 1,284 (6.7%) | 28.8 |
| High School Diploma | 4,449 (23.0%) | 37.9 |
| College or Associate's Degree | 7,368 (38.2%) | 37.7 |
| Bachelor's Degree | 4,503 (23.3%) | 34.2 |
| Graduate Degree | 1,706 (8.8%) | 60.6 |
| Total | 19,310 (100.0%) | 27.9 |
Fertility by Education by Marriage Status in Area Code 787
63.8% of women with births in Area Code 787 are unmarried. Women with the educational attainment of bachelor's degree are most likely to be married with 38.3% of them married at childbirth, while women with the educational attainment of less than high school are least likely to be married with 91.5% of them unmarried at childbirth.
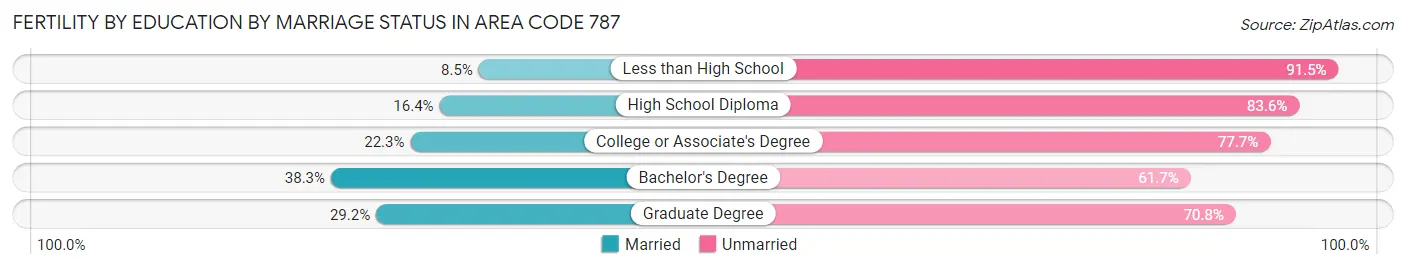
| Educational Attainment | Married | Unmarried |
| Less than High School | 109 (8.5%) | 1,175 (91.5%) |
| High School Diploma | 730 (16.4%) | 3,719 (83.6%) |
| College or Associate's Degree | 1,641 (22.3%) | 5,727 (77.7%) |
| Bachelor's Degree | 1,724 (38.3%) | 2,779 (61.7%) |
| Graduate Degree | 498 (29.2%) | 1,208 (70.8%) |
| Total | 6,995 (36.2%) | 12,315 (63.8%) |
Employment Characteristics in Area Code 787
Employment by Class of Employer in Area Code 787
Among the 973,839 employed individuals in Area Code 787, private company employees (611,350 | 62.8%), state government employees (112,023 | 11.5%), and self-employed (not incorporated) (104,932 | 10.8%) make up the most common classes of employment.
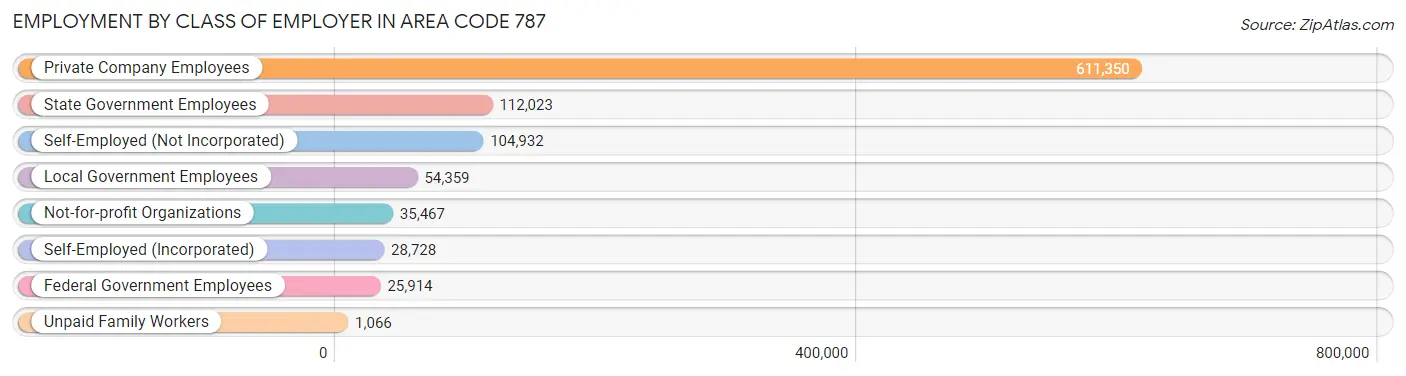
| Employer Class | # Employees | % Employees |
| Private Company Employees | 611,350 | 62.8% |
| Self-Employed (Incorporated) | 28,728 | 2.9% |
| Self-Employed (Not Incorporated) | 104,932 | 10.8% |
| Not-for-profit Organizations | 35,467 | 3.6% |
| Local Government Employees | 54,359 | 5.6% |
| State Government Employees | 112,023 | 11.5% |
| Federal Government Employees | 25,914 | 2.7% |
| Unpaid Family Workers | 1,066 | 0.1% |
| Total | 973,839 | 100.0% |
Employment Status by Age in Area Code 787
According to the labor force statistics for Area Code 787, out of the total population over 16 years of age (2,572,629), 44.3% or 1,140,704 individuals are in the labor force, with 14.2% or 161,752 of them unemployed. The age group with the highest labor force participation rate is 30 to 34 years, with 76.0% or 138,537 individuals in the labor force. Within the labor force, the 16 to 19 years age range has the highest percentage of unemployed individuals, with 3,962.9% or 909,723 of them being unemployed.
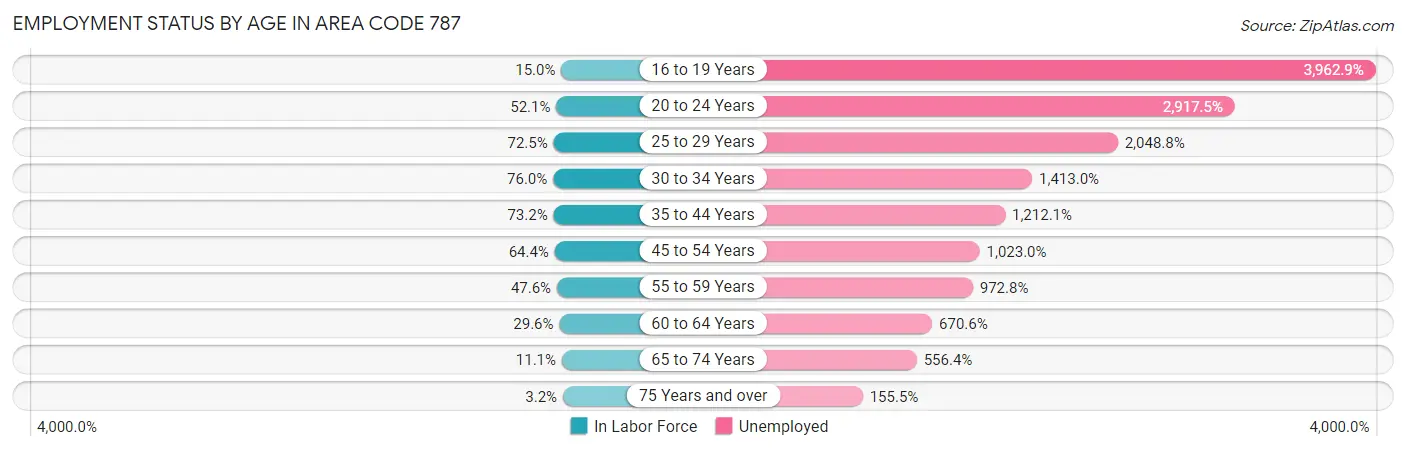
| Age Bracket | In Labor Force | Unemployed |
| 16 to 19 Years | 22,949 (15.0%) | 909,723 (3,962.9%) |
| 20 to 24 Years | 105,938 (52.1%) | 3,090,566 (2,917.5%) |
| 25 to 29 Years | 148,066 (72.5%) | 3,033,679 (2,048.8%) |
| 30 to 34 Years | 138,532 (76.0%) | 1,957,528 (1,413.0%) |
| 35 to 44 Years | 266,871 (73.2%) | 3,234,671 (1,212.1%) |
| 45 to 54 Years | 250,692 (64.4%) | 2,564,763 (1,023.0%) |
| 55 to 59 Years | 97,250 (47.6%) | 946,126 (972.8%) |
| 60 to 64 Years | 60,450 (29.6%) | 405,358 (670.6%) |
| 65 to 74 Years | 39,141 (11.1%) | 217,870 (556.4%) |
| 75 Years and over | 10,120 (3.2%) | 15,755 (155.5%) |
| Total | 1,140,756 (44.3%) | 161,775 (14.2%) |
Employment Status by Educational Attainment in Area Code 787
According to labor force statistics for Area Code 787, 62.0% of individuals (960,722) out of the total population between 25 and 64 years of age (1,549,052) are in the labor force, with 1,314.3% or 12,626,769 of them being unemployed. The group with the highest labor force participation rate are those with the educational attainment of bachelor's degree or higher, with 75.6% or 378,353 individuals in the labor force. Within the labor force, individuals with less than high school education have the highest percentage of unemployment, with 2,461.5% or 1,776,194 of them being unemployed.
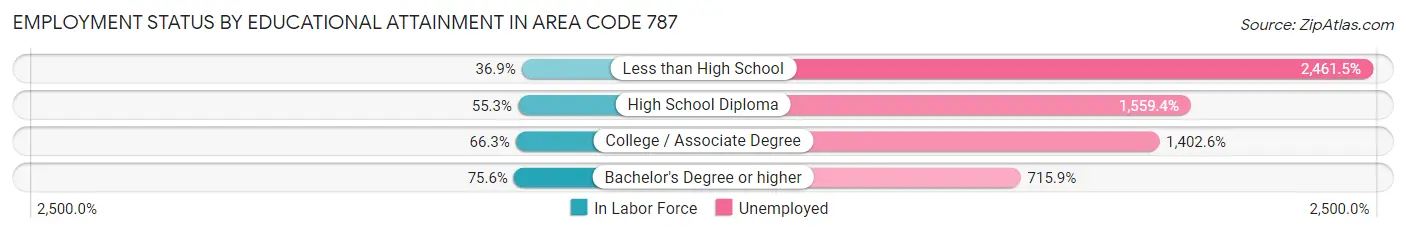
| Educational Attainment | In Labor Force | Unemployed |
| Less than High School | 72,154 (36.9%) | 4,813,537 (2,461.5%) |
| High School Diploma | 236,868 (55.3%) | 6,678,957 (1,559.4%) |
| College / Associate Degree | 281,722 (66.3%) | 5,958,175 (1,402.6%) |
| Bachelor's Degree or higher | 378,369 (75.6%) | 3,582,371 (715.9%) |
| Total | 960,789 (62.0%) | 20,359,190 (1,314.3%) |
Employment Occupations by Sex in Area Code 787
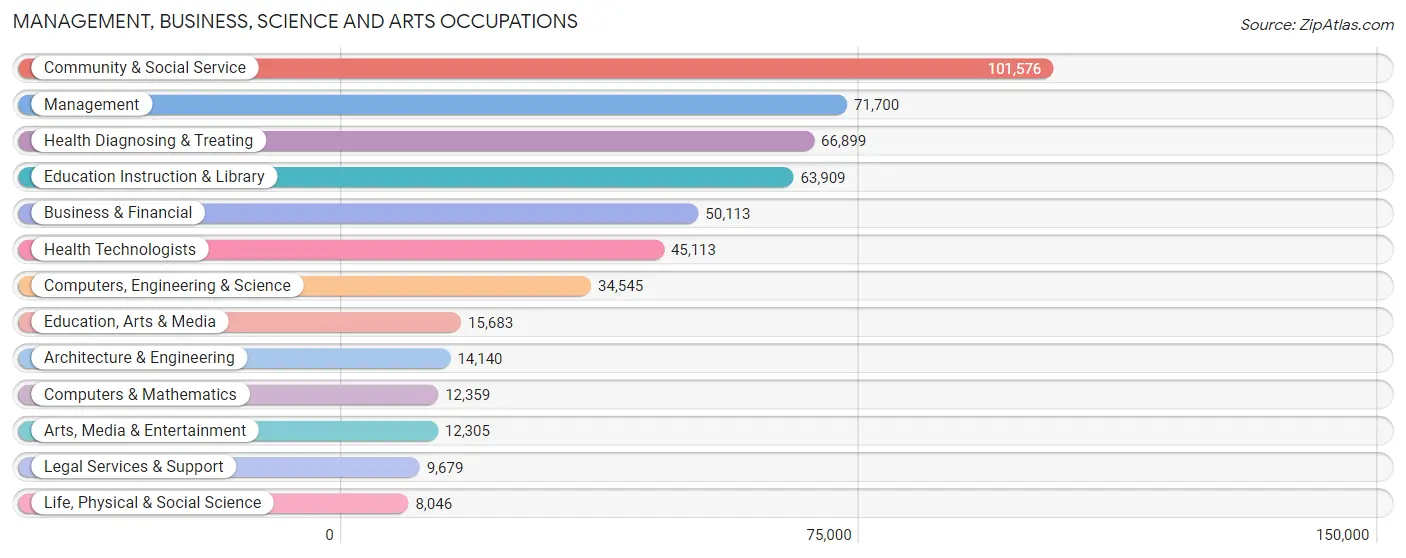
Management, Business, Science and Arts Occupations
The most common Management, Business, Science and Arts occupations in Area Code 787 are Community & Social Service (101,576 | 10.1%), Management (71,700 | 7.2%), Health Diagnosing & Treating (66,899 | 6.7%), Education Instruction & Library (63,909 | 6.4%), and Business & Financial (50,113 | 5.0%).
Management, Business, Science and Arts Occupations by Sex
Within the Management, Business, Science and Arts occupations in Area Code 787, the most male-oriented occupations are Architecture & Engineering (79.9%), Computers & Mathematics (72.9%), and Computers, Engineering & Science (67.4%), while the most female-oriented occupations are Education Instruction & Library (76.5%), Health Technologists (72.0%), and Health Diagnosing & Treating (70.9%).
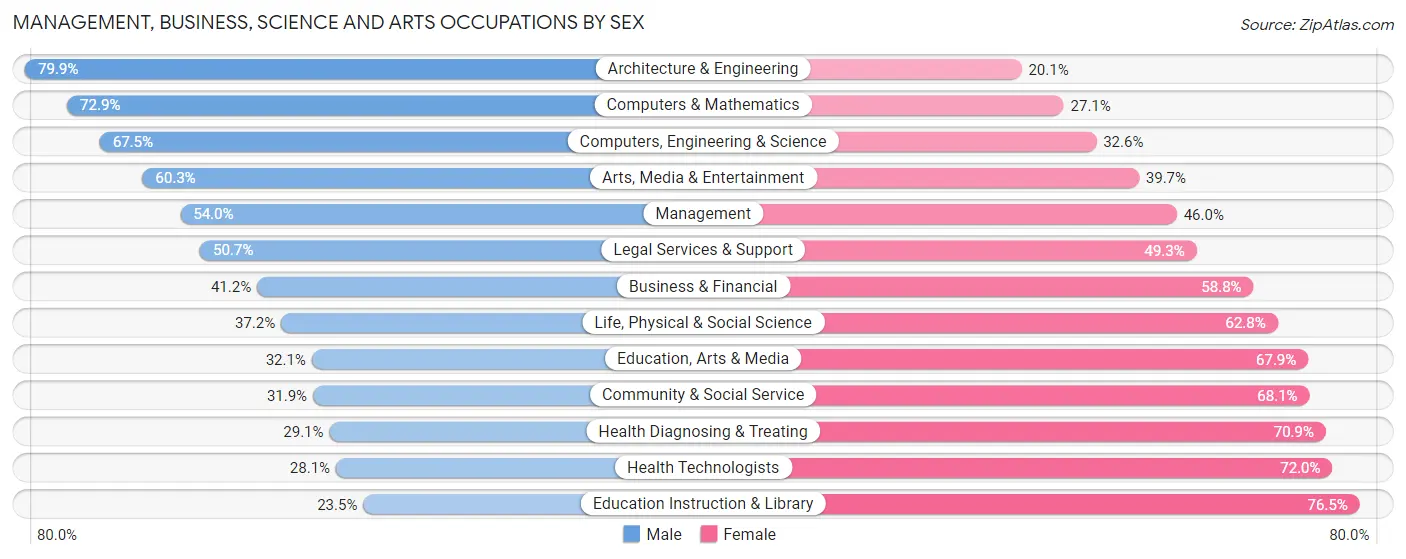
| Occupation | Male | Female |
| Management | 38,728 (54.0%) | 32,972 (46.0%) |
| Business & Financial | 20,659 (41.2%) | 29,454 (58.8%) |
| Computers, Engineering & Science | 23,302 (67.4%) | 11,243 (32.6%) |
| Computers & Mathematics | 9,008 (72.9%) | 3,351 (27.1%) |
| Architecture & Engineering | 11,301 (79.9%) | 2,839 (20.1%) |
| Life, Physical & Social Science | 2,993 (37.2%) | 5,053 (62.8%) |
| Community & Social Service | 32,380 (31.9%) | 69,196 (68.1%) |
| Education, Arts & Media | 5,033 (32.1%) | 10,650 (67.9%) |
| Legal Services & Support | 4,909 (50.7%) | 4,770 (49.3%) |
| Education Instruction & Library | 15,014 (23.5%) | 48,895 (76.5%) |
| Arts, Media & Entertainment | 7,424 (60.3%) | 4,881 (39.7%) |
| Health Diagnosing & Treating | 19,493 (29.1%) | 47,406 (70.9%) |
| Health Technologists | 12,652 (28.1%) | 32,461 (72.0%) |
| Total (Category) | 134,562 (41.4%) | 190,271 (58.6%) |
| Total (Overall) | 523,064 (52.2%) | 478,300 (47.8%) |
Services Occupations
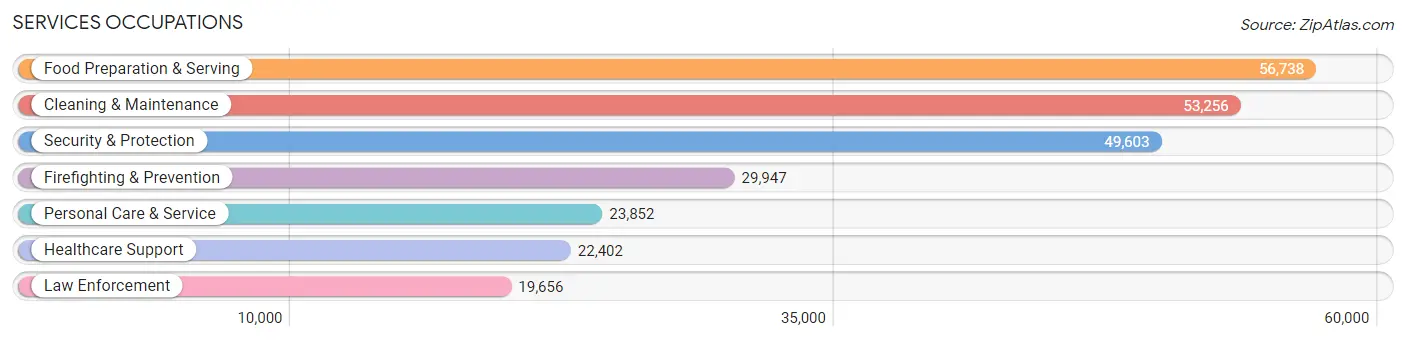
The most common Services occupations in Area Code 787 are Food Preparation & Serving (56,738 | 5.7%), Cleaning & Maintenance (53,256 | 5.3%), Security & Protection (49,603 | 5.0%), Firefighting & Prevention (29,947 | 3.0%), and Personal Care & Service (23,852 | 2.4%).
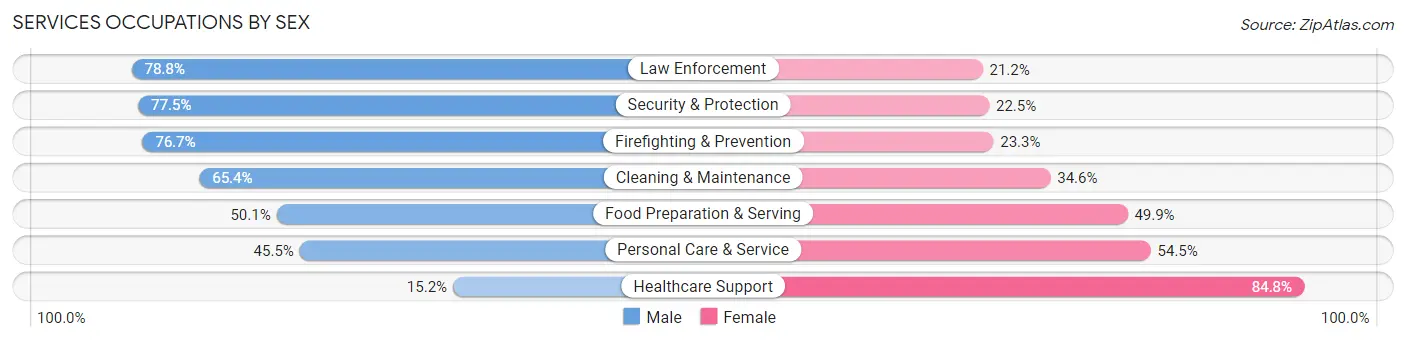
Services Occupations by Sex
Within the Services occupations in Area Code 787, the most male-oriented occupations are Law Enforcement (78.8%), Security & Protection (77.5%), and Firefighting & Prevention (76.7%), while the most female-oriented occupations are Healthcare Support (84.8%), Personal Care & Service (54.5%), and Food Preparation & Serving (49.9%).
| Occupation | Male | Female |
| Healthcare Support | 3,403 (15.2%) | 18,999 (84.8%) |
| Security & Protection | 38,458 (77.5%) | 11,145 (22.5%) |
| Firefighting & Prevention | 22,967 (76.7%) | 6,980 (23.3%) |
| Law Enforcement | 15,491 (78.8%) | 4,165 (21.2%) |
| Food Preparation & Serving | 28,435 (50.1%) | 28,303 (49.9%) |
| Cleaning & Maintenance | 34,831 (65.4%) | 18,425 (34.6%) |
| Personal Care & Service | 10,859 (45.5%) | 12,993 (54.5%) |
| Total (Category) | 115,986 (56.3%) | 89,865 (43.7%) |
| Total (Overall) | 523,064 (52.2%) | 478,300 (47.8%) |
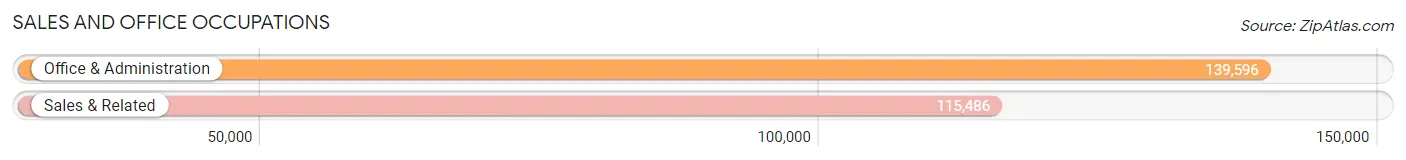
Sales and Office Occupations
The most common Sales and Office occupations in Area Code 787 are Office & Administration (139,596 | 13.9%), and Sales & Related (115,486 | 11.5%).
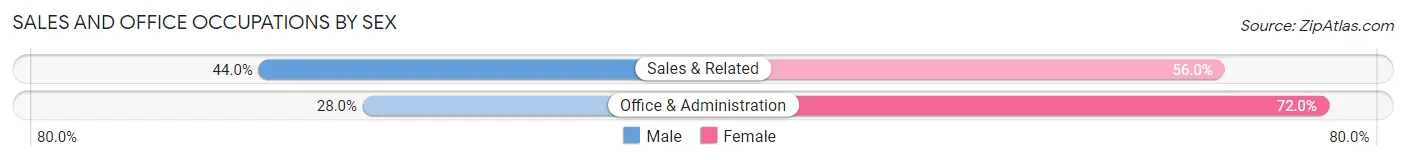
Sales and Office Occupations by Sex
| Occupation | Male | Female |
| Sales & Related | 50,802 (44.0%) | 64,684 (56.0%) |
| Office & Administration | 39,037 (28.0%) | 100,559 (72.0%) |
| Total (Category) | 89,839 (35.2%) | 165,243 (64.8%) |
| Total (Overall) | 523,064 (52.2%) | 478,300 (47.8%) |
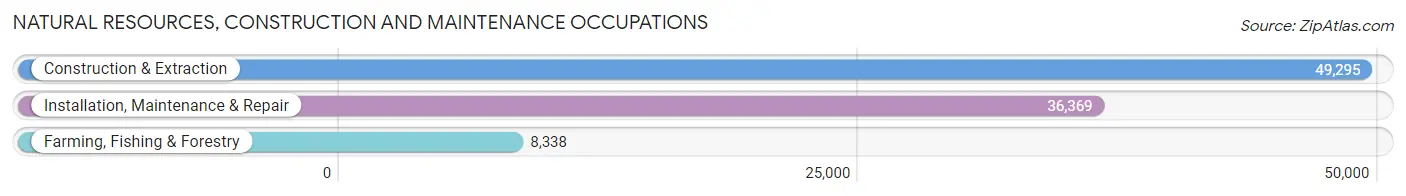
Natural Resources, Construction and Maintenance Occupations
The most common Natural Resources, Construction and Maintenance occupations in Area Code 787 are Construction & Extraction (49,295 | 4.9%), Installation, Maintenance & Repair (36,369 | 3.6%), and Farming, Fishing & Forestry (8,338 | 0.8%).
Natural Resources, Construction and Maintenance Occupations by Sex
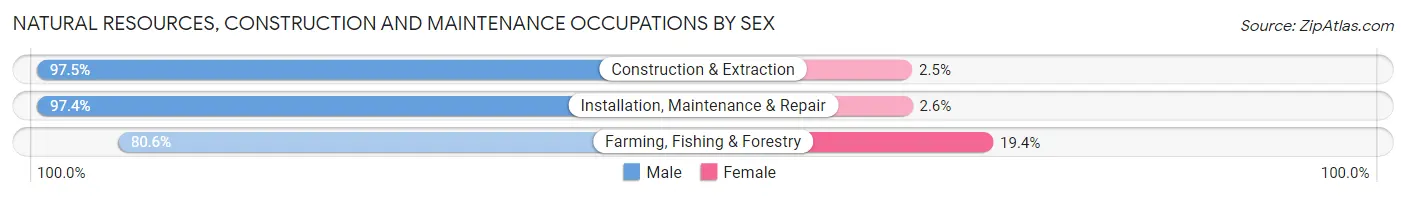
| Occupation | Male | Female |
| Farming, Fishing & Forestry | 6,721 (80.6%) | 1,617 (19.4%) |
| Construction & Extraction | 48,042 (97.5%) | 1,253 (2.5%) |
| Installation, Maintenance & Repair | 35,417 (97.4%) | 952 (2.6%) |
| Total (Category) | 90,180 (95.9%) | 3,822 (4.1%) |
| Total (Overall) | 523,064 (52.2%) | 478,300 (47.8%) |
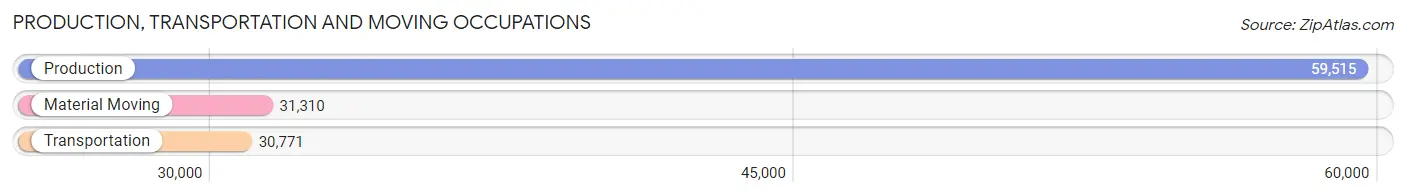
Production, Transportation and Moving Occupations
The most common Production, Transportation and Moving occupations in Area Code 787 are Production (59,515 | 5.9%), Material Moving (31,310 | 3.1%), and Transportation (30,771 | 3.1%).
Production, Transportation and Moving Occupations by Sex
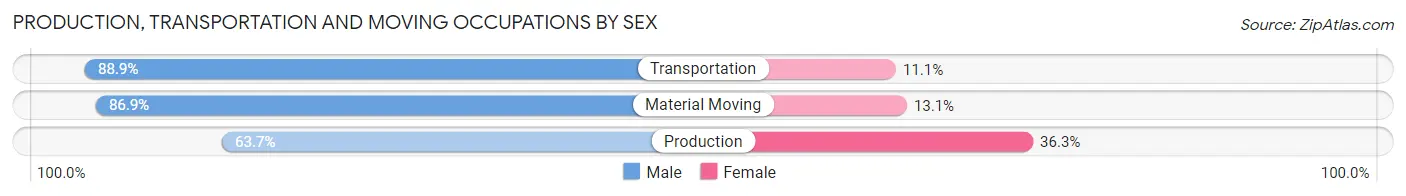
| Occupation | Male | Female |
| Production | 37,936 (63.7%) | 21,579 (36.3%) |
| Transportation | 27,354 (88.9%) | 3,417 (11.1%) |
| Material Moving | 27,207 (86.9%) | 4,103 (13.1%) |
| Total (Category) | 92,497 (76.1%) | 29,099 (23.9%) |
| Total (Overall) | 523,064 (52.2%) | 478,300 (47.8%) |
Employment Industries by Sex in Area Code 787
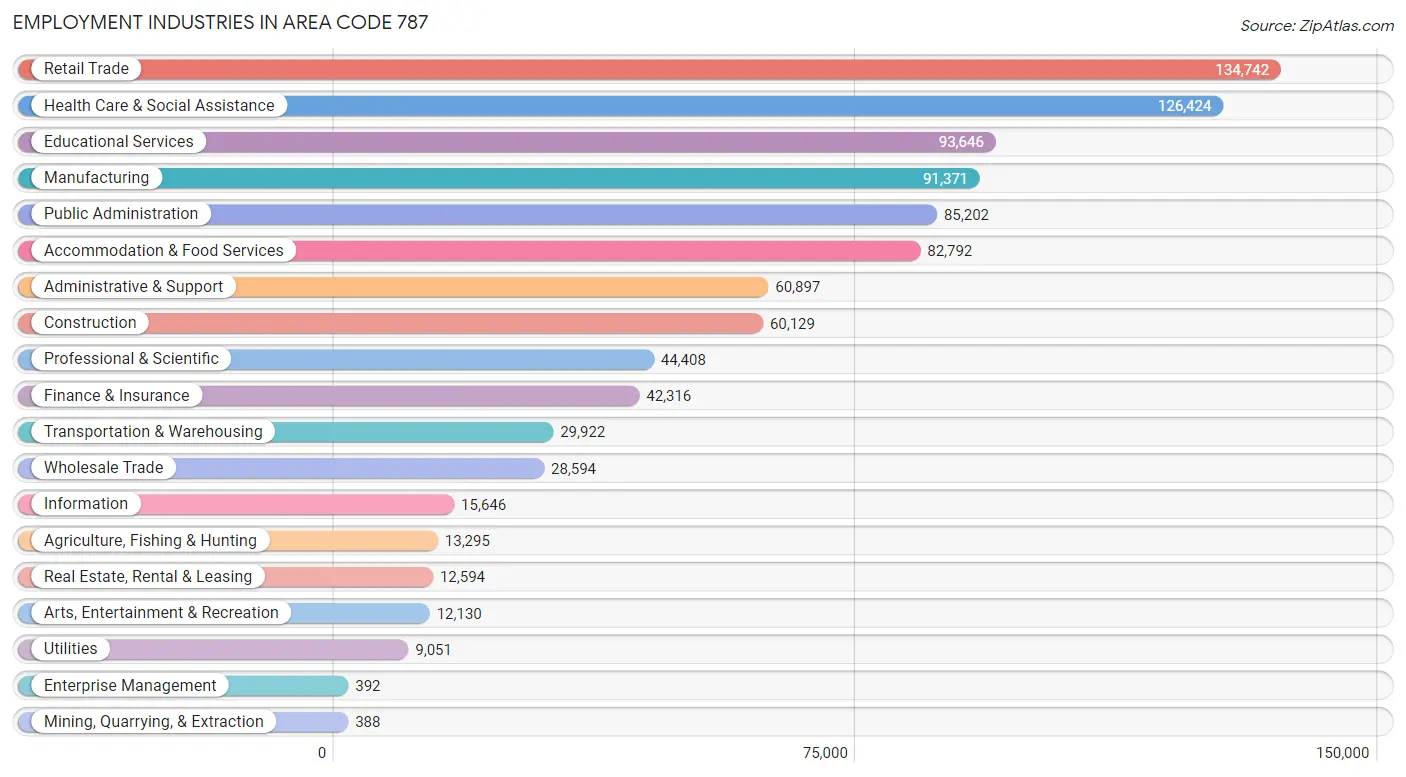
Employment Industries in Area Code 787
The major employment industries in Area Code 787 include Retail Trade (134,742 | 13.5%), Health Care & Social Assistance (126,424 | 12.6%), Educational Services (93,646 | 9.3%), Manufacturing (91,371 | 9.1%), and Public Administration (85,202 | 8.5%).
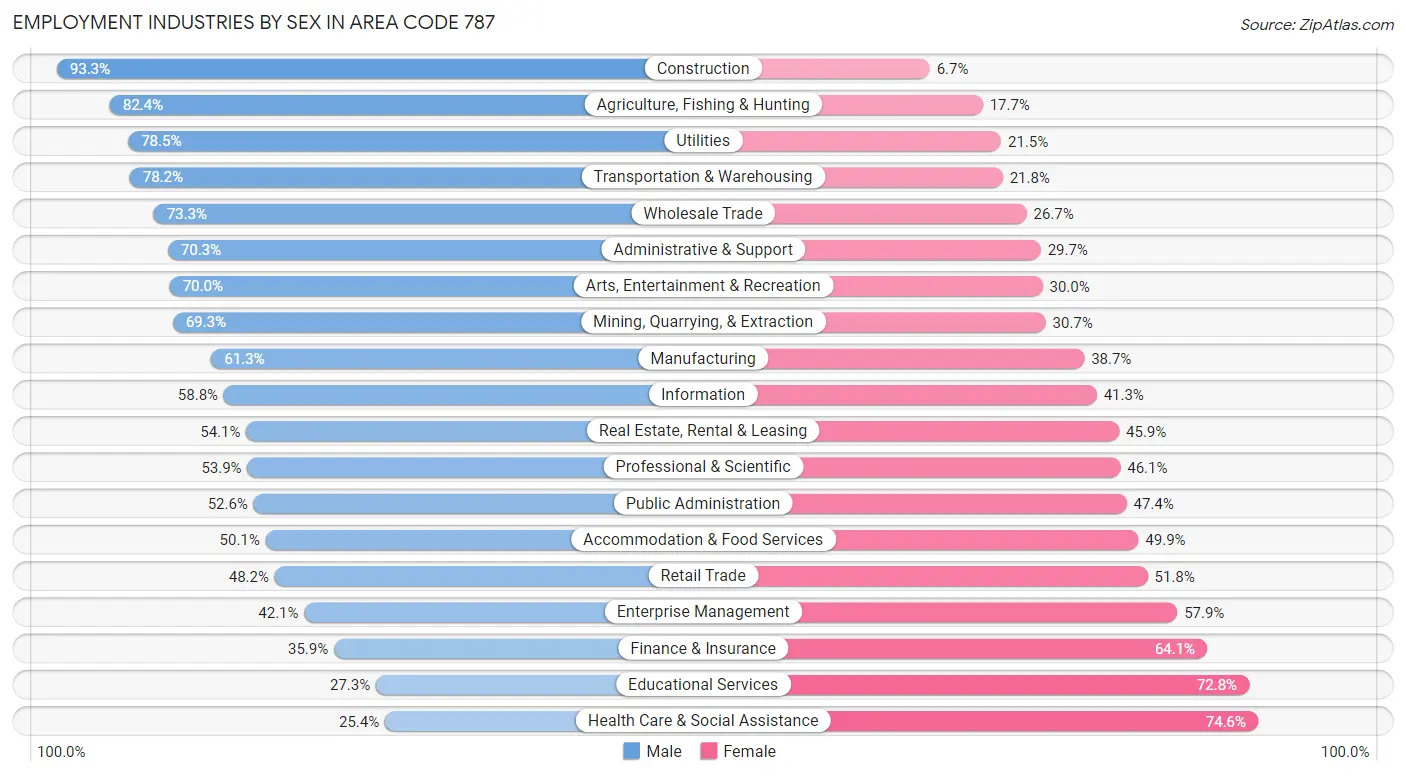
Employment Industries by Sex in Area Code 787
The Area Code 787 industries that see more men than women are Construction (93.3%), Agriculture, Fishing & Hunting (82.4%), and Utilities (78.5%), whereas the industries that tend to have a higher number of women are Health Care & Social Assistance (74.6%), Educational Services (72.8%), and Finance & Insurance (64.1%).
| Industry | Male | Female |
| Agriculture, Fishing & Hunting | 10,949 (82.4%) | 2,346 (17.6%) |
| Mining, Quarrying, & Extraction | 269 (69.3%) | 119 (30.7%) |
| Construction | 56,111 (93.3%) | 4,018 (6.7%) |
| Manufacturing | 56,049 (61.3%) | 35,322 (38.7%) |
| Wholesale Trade | 20,952 (73.3%) | 7,642 (26.7%) |
| Retail Trade | 64,958 (48.2%) | 69,784 (51.8%) |
| Transportation & Warehousing | 23,402 (78.2%) | 6,520 (21.8%) |
| Utilities | 7,109 (78.5%) | 1,942 (21.5%) |
| Information | 9,192 (58.8%) | 6,454 (41.2%) |
| Finance & Insurance | 15,209 (35.9%) | 27,107 (64.1%) |
| Real Estate, Rental & Leasing | 6,815 (54.1%) | 5,779 (45.9%) |
| Professional & Scientific | 23,924 (53.9%) | 20,484 (46.1%) |
| Enterprise Management | 165 (42.1%) | 227 (57.9%) |
| Administrative & Support | 42,833 (70.3%) | 18,064 (29.7%) |
| Educational Services | 25,517 (27.3%) | 68,129 (72.8%) |
| Health Care & Social Assistance | 32,117 (25.4%) | 94,307 (74.6%) |
| Arts, Entertainment & Recreation | 8,486 (70.0%) | 3,644 (30.0%) |
| Accommodation & Food Services | 41,496 (50.1%) | 41,296 (49.9%) |
| Public Administration | 44,798 (52.6%) | 40,404 (47.4%) |
| Total | 523,064 (52.2%) | 478,300 (47.8%) |
Education in Area Code 787
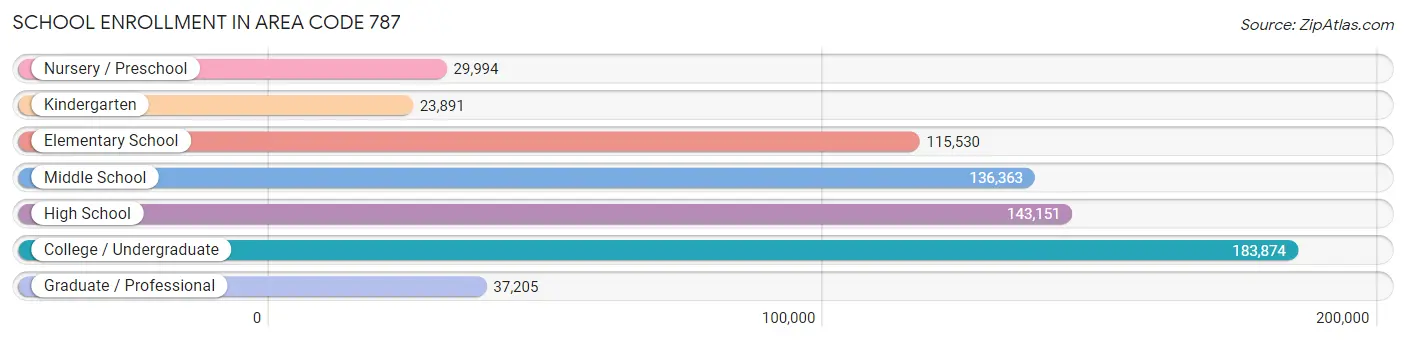
School Enrollment in Area Code 787
The most common levels of schooling among the 670,008 students in Area Code 787 are college / undergraduate (183,874 | 27.4%), high school (143,151 | 21.4%), and middle school (136,363 | 20.3%).
| School Level | # Students | % Students |
| Nursery / Preschool | 29,994 | 4.5% |
| Kindergarten | 23,891 | 3.6% |
| Elementary School | 115,530 | 17.2% |
| Middle School | 136,363 | 20.3% |
| High School | 143,151 | 21.4% |
| College / Undergraduate | 183,874 | 27.4% |
| Graduate / Professional | 37,205 | 5.6% |
| Total | 670,008 | 100.0% |
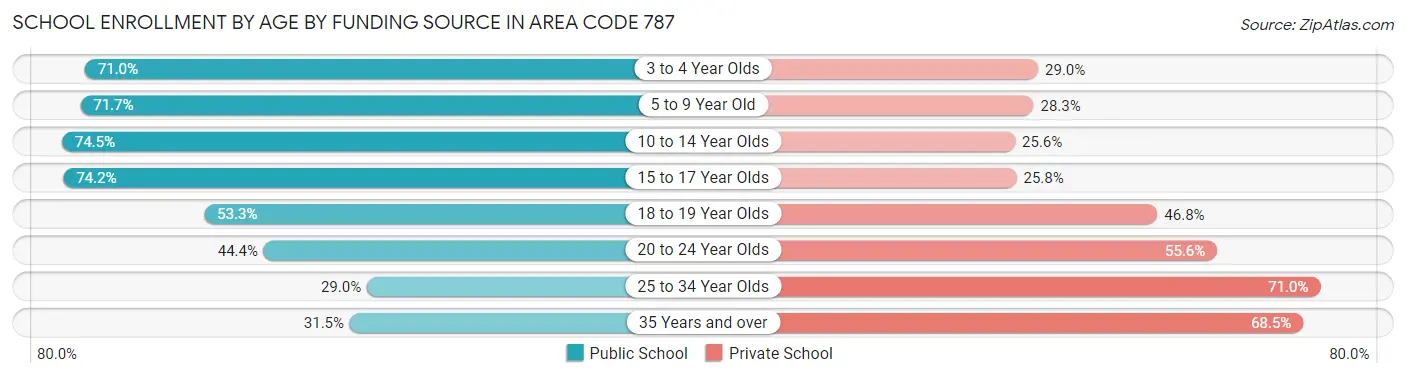
School Enrollment by Age by Funding Source in Area Code 787
Out of a total of 670,008 students who are enrolled in schools in Area Code 787, 252,240 (37.7%) attend a private institution, while the remaining 417,768 (62.4%) are enrolled in public schools. The age group of 25 to 34 year olds has the highest likelihood of being enrolled in private schools, with 32,302 (71.0% in the age bracket) enrolled. Conversely, the age group of 10 to 14 year olds has the lowest likelihood of being enrolled in a private school, with 125,559 (74.5% in the age bracket) attending a public institution.
| Age Bracket | Public School | Private School |
| 3 to 4 Year Olds | 19,143 (71.0%) | 7,808 (29.0%) |
| 5 to 9 Year Old | 97,016 (71.7%) | 38,288 (28.3%) |
| 10 to 14 Year Olds | 125,559 (74.5%) | 43,091 (25.6%) |
| 15 to 17 Year Olds | 77,567 (74.2%) | 26,909 (25.8%) |
| 18 to 19 Year Olds | 31,793 (53.2%) | 27,915 (46.8%) |
| 20 to 24 Year Olds | 43,999 (44.4%) | 55,197 (55.6%) |
| 25 to 34 Year Olds | 13,181 (29.0%) | 32,302 (71.0%) |
| 35 Years and over | 9,534 (31.5%) | 20,706 (68.5%) |
| Total | 417,768 (62.4%) | 252,240 (37.7%) |
Educational Attainment by Field of Study in Area Code 787
Business (184,762 | 28.7%), education (113,458 | 17.6%), science & technology (78,907 | 12.3%), arts & humanities (44,078 | 6.9%), and bio, nature & agricultural (37,998 | 5.9%) are the most common fields of study among 643,130 individuals in Area Code 787 who have obtained a bachelor's degree or higher.
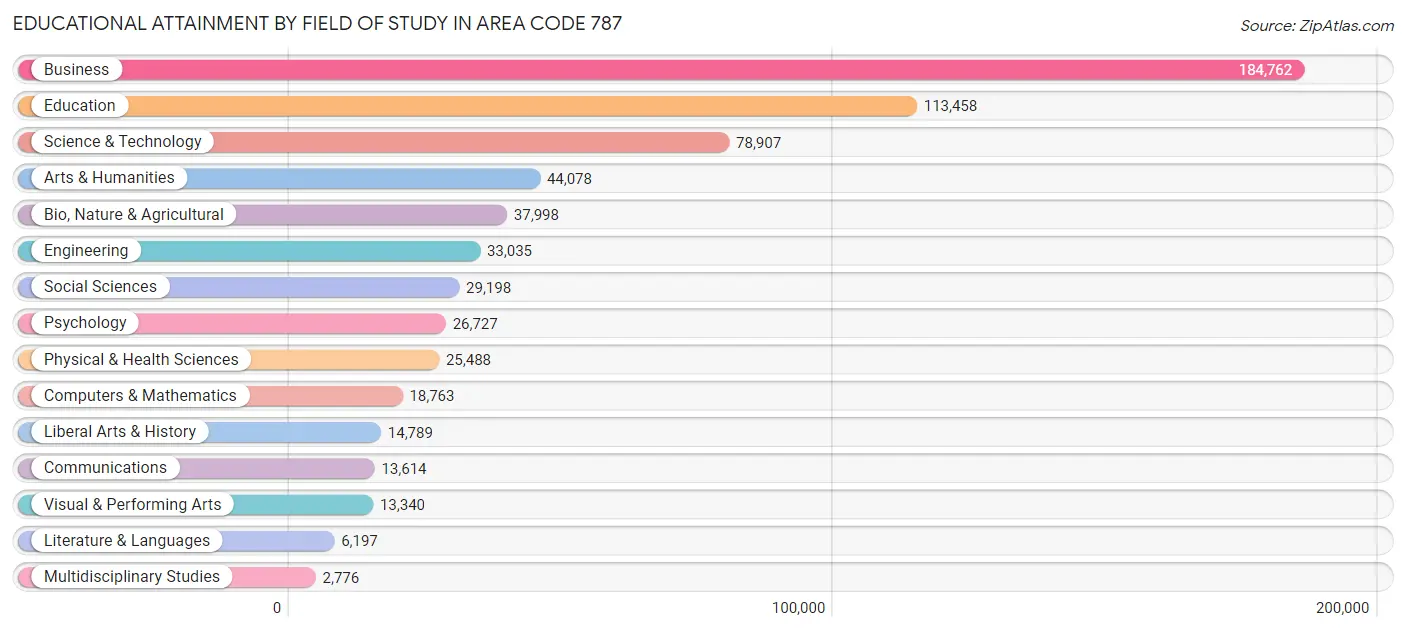
| Field of Study | # Graduates | % Graduates |
| Computers & Mathematics | 18,763 | 2.9% |
| Bio, Nature & Agricultural | 37,998 | 5.9% |
| Physical & Health Sciences | 25,488 | 4.0% |
| Psychology | 26,727 | 4.2% |
| Social Sciences | 29,198 | 4.5% |
| Engineering | 33,035 | 5.1% |
| Multidisciplinary Studies | 2,776 | 0.4% |
| Science & Technology | 78,907 | 12.3% |
| Business | 184,762 | 28.7% |
| Education | 113,458 | 17.6% |
| Literature & Languages | 6,197 | 1.0% |
| Liberal Arts & History | 14,789 | 2.3% |
| Visual & Performing Arts | 13,340 | 2.1% |
| Communications | 13,614 | 2.1% |
| Arts & Humanities | 44,078 | 6.9% |
| Total | 643,130 | 100.0% |
Transportation & Commute in Area Code 787
Vehicle Availability by Sex in Area Code 787
The most prevalent vehicle ownership categories in Area Code 787 are males with 2 vehicles (215,162, accounting for 42.2%) and females with 2 vehicles (182,047, making up 46.6%).
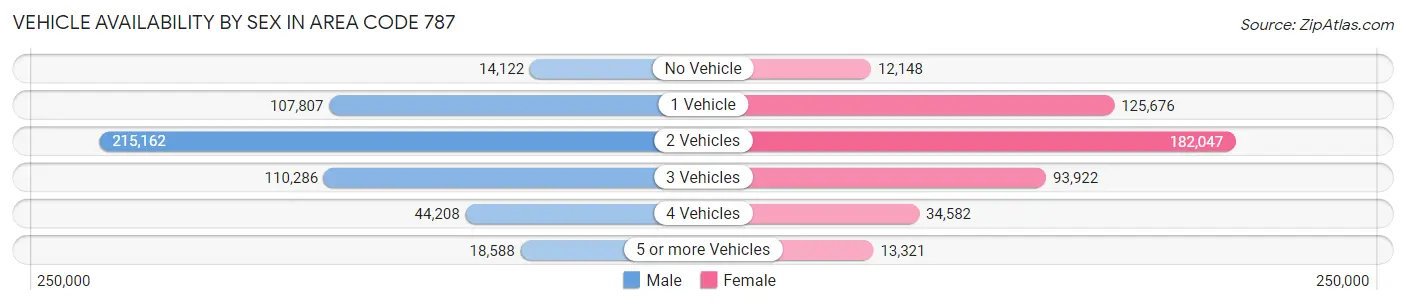
| Vehicles Available | Male | Female |
| No Vehicle | 14,122 (2.8%) | 12,148 (2.6%) |
| 1 Vehicle | 107,807 (21.1%) | 125,676 (27.2%) |
| 2 Vehicles | 215,162 (42.2%) | 182,047 (39.4%) |
| 3 Vehicles | 110,286 (21.6%) | 93,922 (20.3%) |
| 4 Vehicles | 44,208 (8.7%) | 34,582 (7.5%) |
| 5 or more Vehicles | 18,588 (3.6%) | 13,321 (2.9%) |
| Total | 510,173 (100.0%) | 461,696 (100.0%) |
Commute Time in Area Code 787
The most frequently occuring commute durations in Area Code 787 are 30 to 34 minutes (149,148 commuters, 16.1%), 15 to 19 minutes (141,784 commuters, 15.3%), and 20 to 24 minutes (137,914 commuters, 14.9%).
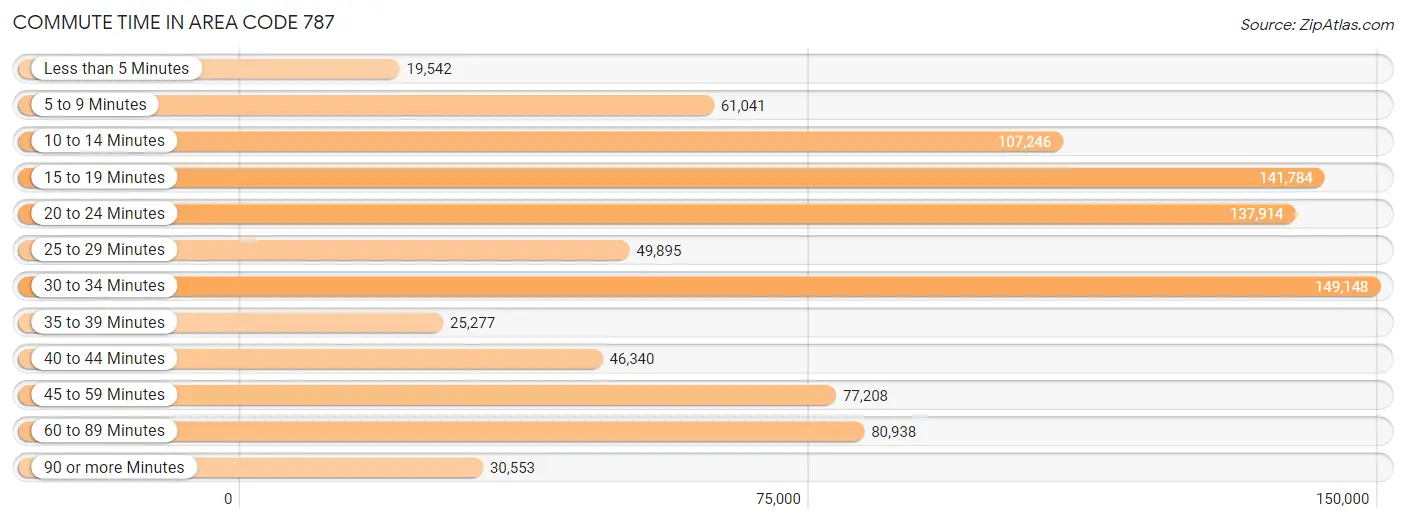
| Commute Time | # Commuters | % Commuters |
| Less than 5 Minutes | 19,542 | 2.1% |
| 5 to 9 Minutes | 61,041 | 6.6% |
| 10 to 14 Minutes | 107,246 | 11.6% |
| 15 to 19 Minutes | 141,784 | 15.3% |
| 20 to 24 Minutes | 137,914 | 14.9% |
| 25 to 29 Minutes | 49,895 | 5.4% |
| 30 to 34 Minutes | 149,148 | 16.1% |
| 35 to 39 Minutes | 25,277 | 2.7% |
| 40 to 44 Minutes | 46,340 | 5.0% |
| 45 to 59 Minutes | 77,208 | 8.3% |
| 60 to 89 Minutes | 80,938 | 8.7% |
| 90 or more Minutes | 30,553 | 3.3% |
Commute Time by Sex in Area Code 787
The most common commute times in Area Code 787 are 30 to 34 minutes (79,258 commuters, 16.2%) for males and 30 to 34 minutes (69,890 commuters, 15.9%) for females.
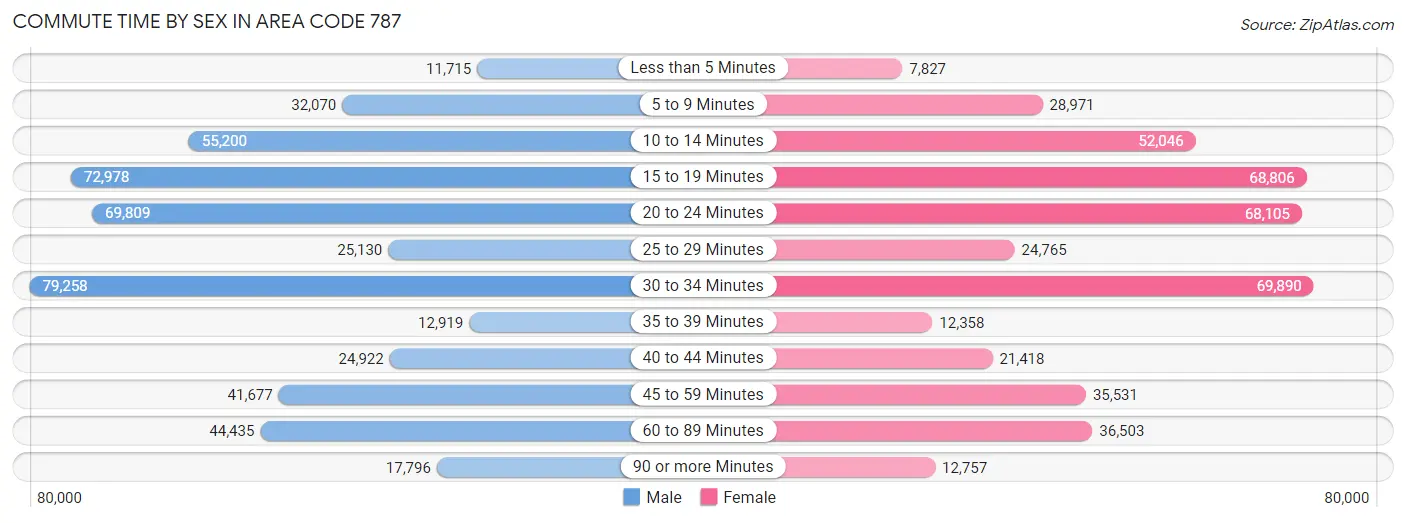
| Commute Time | Male | Female |
| Less than 5 Minutes | 11,715 (2.4%) | 7,827 (1.8%) |
| 5 to 9 Minutes | 32,070 (6.6%) | 28,971 (6.6%) |
| 10 to 14 Minutes | 55,200 (11.3%) | 52,046 (11.9%) |
| 15 to 19 Minutes | 72,978 (15.0%) | 68,806 (15.7%) |
| 20 to 24 Minutes | 69,809 (14.3%) | 68,105 (15.5%) |
| 25 to 29 Minutes | 25,130 (5.1%) | 24,765 (5.6%) |
| 30 to 34 Minutes | 79,258 (16.2%) | 69,890 (15.9%) |
| 35 to 39 Minutes | 12,919 (2.6%) | 12,358 (2.8%) |
| 40 to 44 Minutes | 24,922 (5.1%) | 21,418 (4.9%) |
| 45 to 59 Minutes | 41,677 (8.5%) | 35,531 (8.1%) |
| 60 to 89 Minutes | 44,435 (9.1%) | 36,503 (8.3%) |
| 90 or more Minutes | 17,796 (3.6%) | 12,757 (2.9%) |
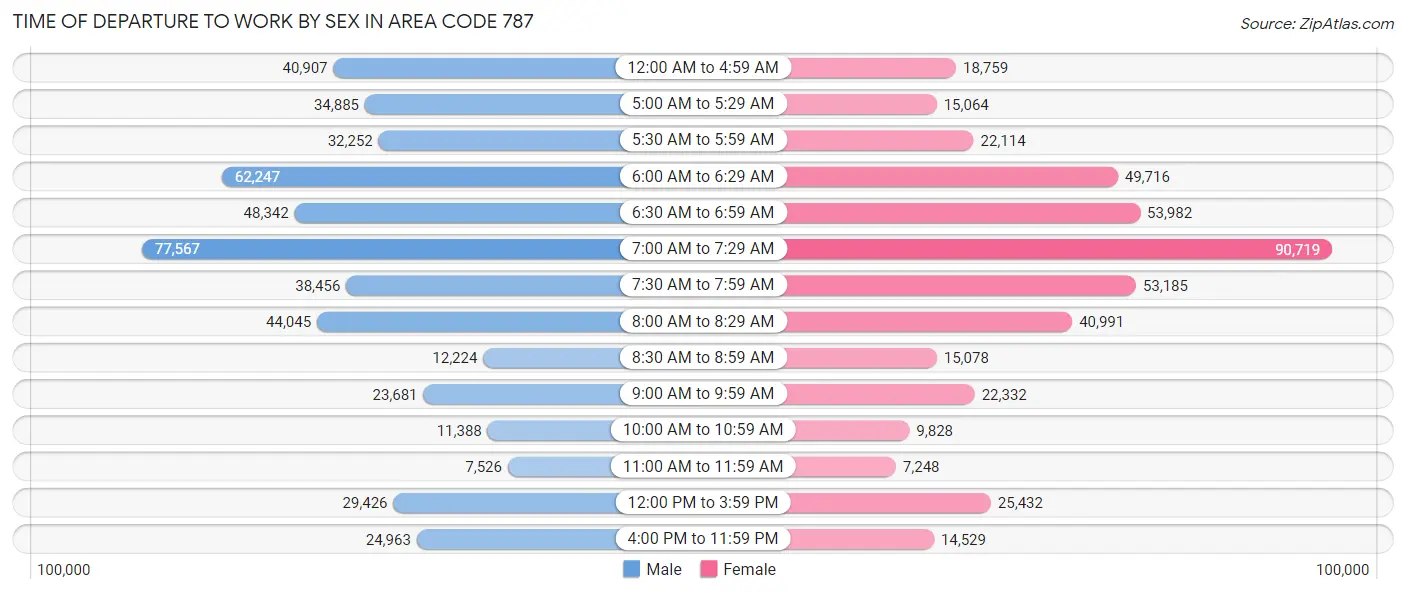
Time of Departure to Work by Sex in Area Code 787
The most frequent times of departure to work in Area Code 787 are 7:00 AM to 7:29 AM (77,567, 15.9%) for males and 7:00 AM to 7:29 AM (90,719, 20.7%) for females.
| Time of Departure | Male | Female |
| 12:00 AM to 4:59 AM | 40,907 (8.4%) | 18,759 (4.3%) |
| 5:00 AM to 5:29 AM | 34,885 (7.1%) | 15,064 (3.4%) |
| 5:30 AM to 5:59 AM | 32,252 (6.6%) | 22,114 (5.0%) |
| 6:00 AM to 6:29 AM | 62,247 (12.8%) | 49,716 (11.3%) |
| 6:30 AM to 6:59 AM | 48,342 (9.9%) | 53,982 (12.3%) |
| 7:00 AM to 7:29 AM | 77,567 (15.9%) | 90,719 (20.7%) |
| 7:30 AM to 7:59 AM | 38,456 (7.9%) | 53,185 (12.1%) |
| 8:00 AM to 8:29 AM | 44,045 (9.0%) | 40,991 (9.3%) |
| 8:30 AM to 8:59 AM | 12,224 (2.5%) | 15,078 (3.4%) |
| 9:00 AM to 9:59 AM | 23,681 (4.9%) | 22,332 (5.1%) |
| 10:00 AM to 10:59 AM | 11,388 (2.3%) | 9,828 (2.2%) |
| 11:00 AM to 11:59 AM | 7,526 (1.5%) | 7,248 (1.7%) |
| 12:00 PM to 3:59 PM | 29,426 (6.0%) | 25,432 (5.8%) |
| 4:00 PM to 11:59 PM | 24,963 (5.1%) | 14,529 (3.3%) |
| Total | 487,909 (100.0%) | 438,977 (100.0%) |
Housing Occupancy in Area Code 787
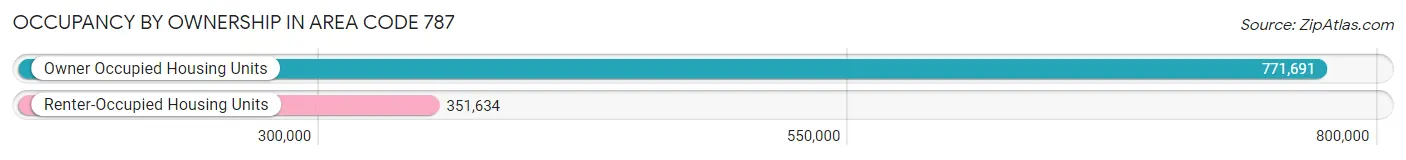
Occupancy by Ownership in Area Code 787
Of the total 1,123,325 dwellings in Area Code 787, owner-occupied units account for 771,691 (68.7%), while renter-occupied units make up 351,634 (31.3%).
| Occupancy | # Housing Units | % Housing Units |
| Owner Occupied Housing Units | 771,691 | 68.7% |
| Renter-Occupied Housing Units | 351,634 | 31.3% |
| Total Occupied Housing Units | 1,123,325 | 100.0% |
Occupancy by Household Size in Area Code 787
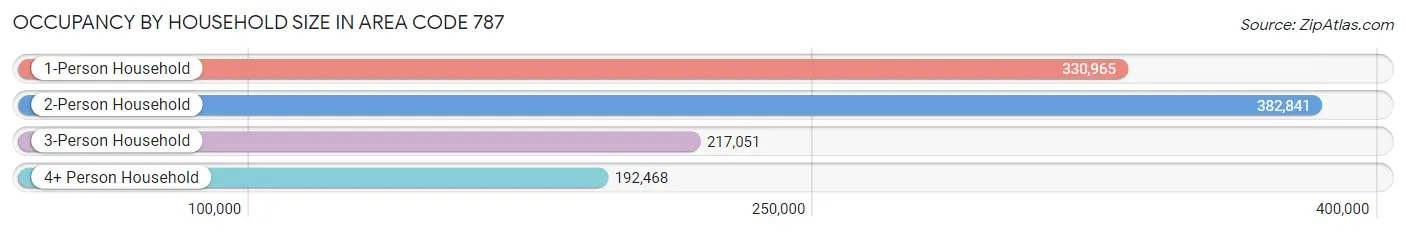
| Household Size | # Housing Units | % Housing Units |
| 1-Person Household | 330,965 | 29.5% |
| 2-Person Household | 382,841 | 34.1% |
| 3-Person Household | 217,051 | 19.3% |
| 4+ Person Household | 192,468 | 17.1% |
| Total Housing Units | 1,123,325 | 100.0% |
Occupancy by Ownership by Household Size in Area Code 787
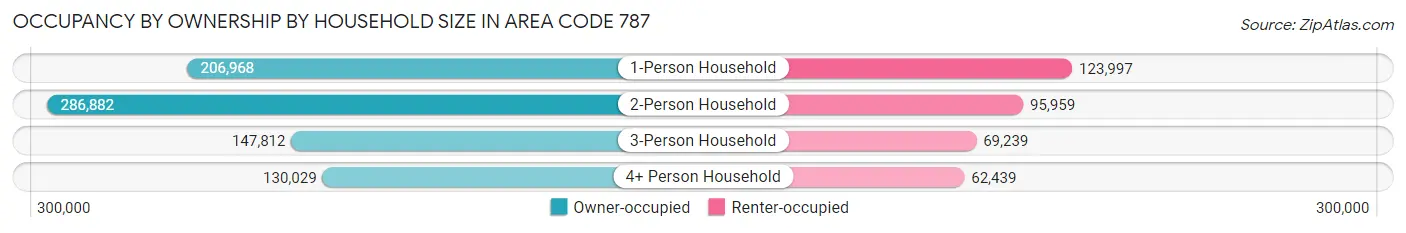
| Household Size | Owner-occupied | Renter-occupied |
| 1-Person Household | 206,968 (62.5%) | 123,997 (37.5%) |
| 2-Person Household | 286,882 (74.9%) | 95,959 (25.1%) |
| 3-Person Household | 147,812 (68.1%) | 69,239 (31.9%) |
| 4+ Person Household | 130,029 (67.6%) | 62,439 (32.4%) |
| Total Housing Units | 771,691 (68.7%) | 351,634 (31.3%) |
Occupancy by Educational Attainment in Area Code 787
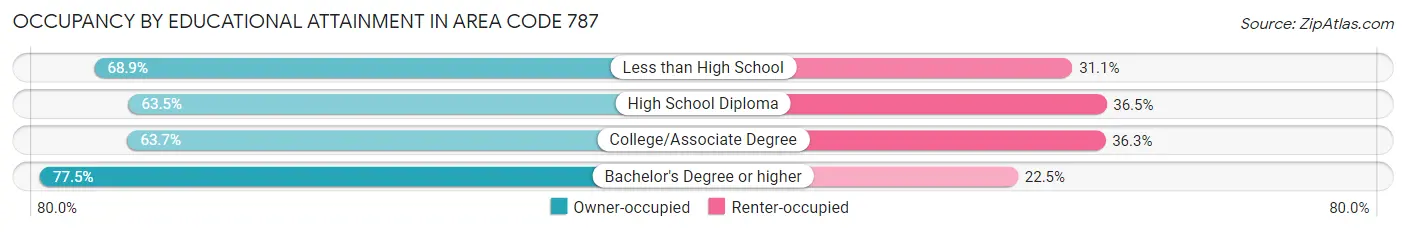
| Household Size | Owner-occupied | Renter-occupied |
| Less than High School | 163,818 (68.9%) | 73,971 (31.1%) |
| High School Diploma | 191,968 (63.5%) | 110,344 (36.5%) |
| College/Associate Degree | 166,678 (63.7%) | 95,095 (36.3%) |
| Bachelor's Degree or higher | 249,227 (77.5%) | 72,224 (22.5%) |
Occupancy by Age of Householder in Area Code 787
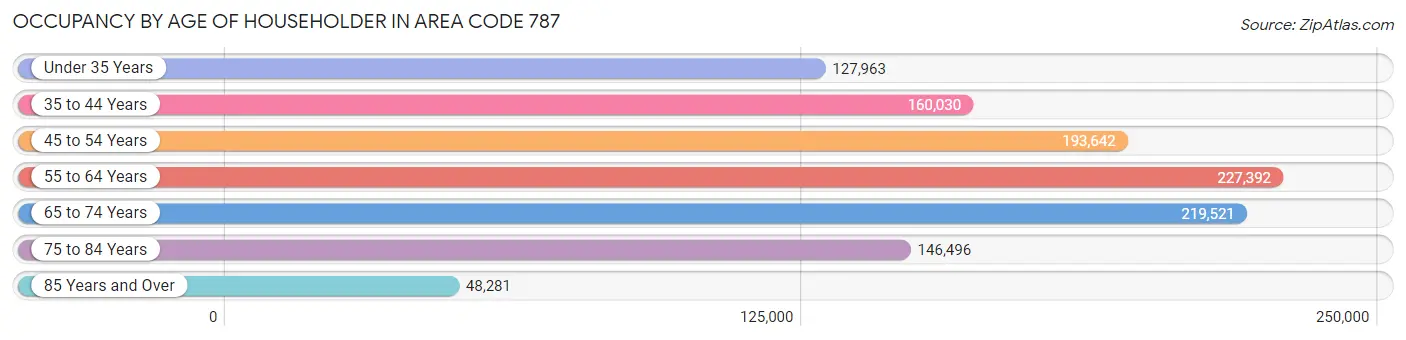
| Age Bracket | # Households | % Households |
| Under 35 Years | 127,963 | 11.4% |
| 35 to 44 Years | 160,030 | 14.2% |
| 45 to 54 Years | 193,642 | 17.2% |
| 55 to 64 Years | 227,392 | 20.2% |
| 65 to 74 Years | 219,521 | 19.5% |
| 75 to 84 Years | 146,496 | 13.0% |
| 85 Years and Over | 48,281 | 4.3% |
| Total | 1,123,325 | 100.0% |
Housing Finances in Area Code 787
Median Income by Occupancy in Area Code 787
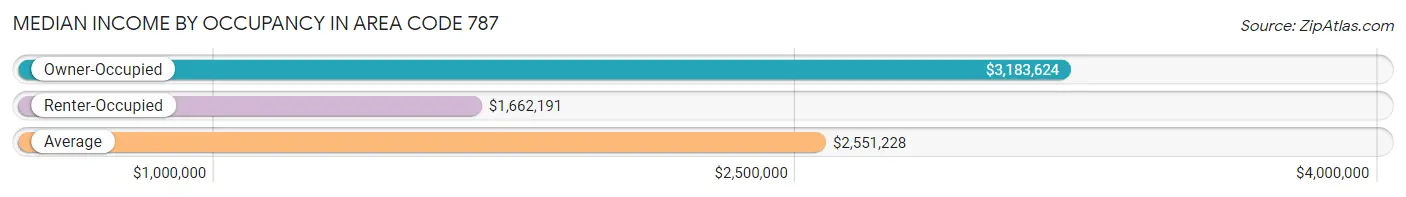
| Occupancy Type | # Households | Median Income |
| Owner-Occupied | 771,691 (68.7%) | $3,183,624 |
| Renter-Occupied | 351,634 (31.3%) | $1,662,191 |
| Average | 1,123,325 (100.0%) | $2,551,228 |
Occupancy by Householder Income Bracket in Area Code 787
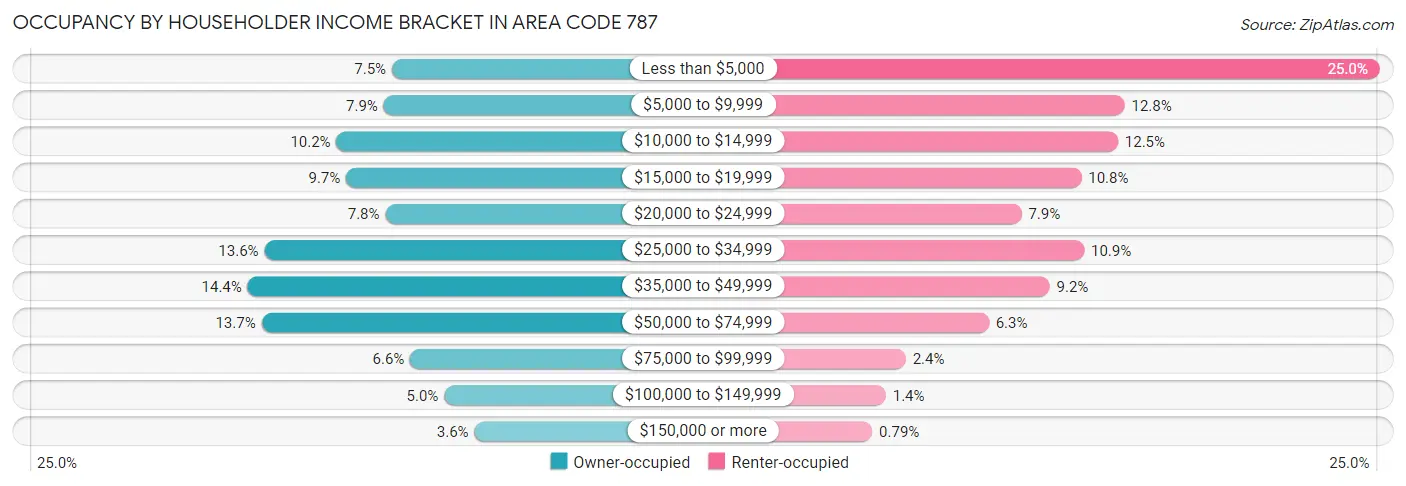
| Income Bracket | Owner-occupied | Renter-occupied |
| Less than $5,000 | 57,957 (7.5%) | 87,777 (25.0%) |
| $5,000 to $9,999 | 60,970 (7.9%) | 45,058 (12.8%) |
| $10,000 to $14,999 | 78,330 (10.2%) | 43,933 (12.5%) |
| $15,000 to $19,999 | 74,803 (9.7%) | 37,818 (10.7%) |
| $20,000 to $24,999 | 60,340 (7.8%) | 27,781 (7.9%) |
| $25,000 to $34,999 | 104,771 (13.6%) | 38,242 (10.9%) |
| $35,000 to $49,999 | 111,006 (14.4%) | 32,506 (9.2%) |
| $50,000 to $74,999 | 105,885 (13.7%) | 22,279 (6.3%) |
| $75,000 to $99,999 | 51,242 (6.6%) | 8,387 (2.4%) |
| $100,000 to $149,999 | 38,739 (5.0%) | 5,058 (1.4%) |
| $150,000 or more | 27,648 (3.6%) | 2,795 (0.8%) |
| Total | 771,691 (100.0%) | 351,634 (100.0%) |
Monthly Housing Cost Tiers in Area Code 787
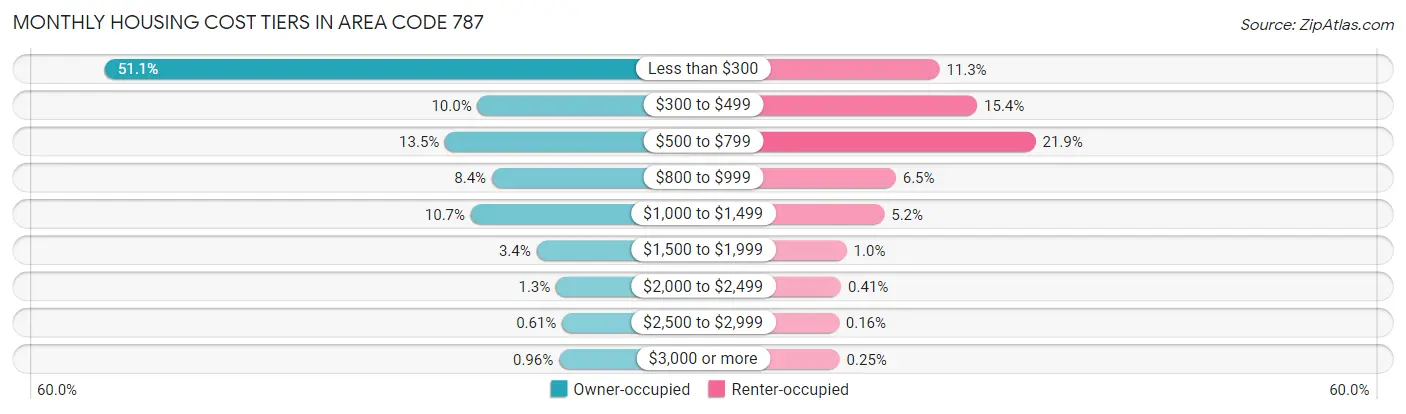
| Monthly Cost | Owner-occupied | Renter-occupied |
| Less than $300 | 394,588 (51.1%) | 39,642 (11.3%) |
| $300 to $499 | 76,925 (10.0%) | 54,251 (15.4%) |
| $500 to $799 | 104,513 (13.5%) | 76,956 (21.9%) |
| $800 to $999 | 64,592 (8.4%) | 22,689 (6.5%) |
| $1,000 to $1,499 | 82,606 (10.7%) | 18,202 (5.2%) |
| $1,500 to $1,999 | 26,516 (3.4%) | 3,584 (1.0%) |
| $2,000 to $2,499 | 9,877 (1.3%) | 1,431 (0.4%) |
| $2,500 to $2,999 | 4,685 (0.6%) | 576 (0.2%) |
| $3,000 or more | 7,389 (1.0%) | 862 (0.3%) |
| Total | 771,691 (100.0%) | 351,634 (100.0%) |
Physical Housing Characteristics in Area Code 787
Housing Structures in Area Code 787
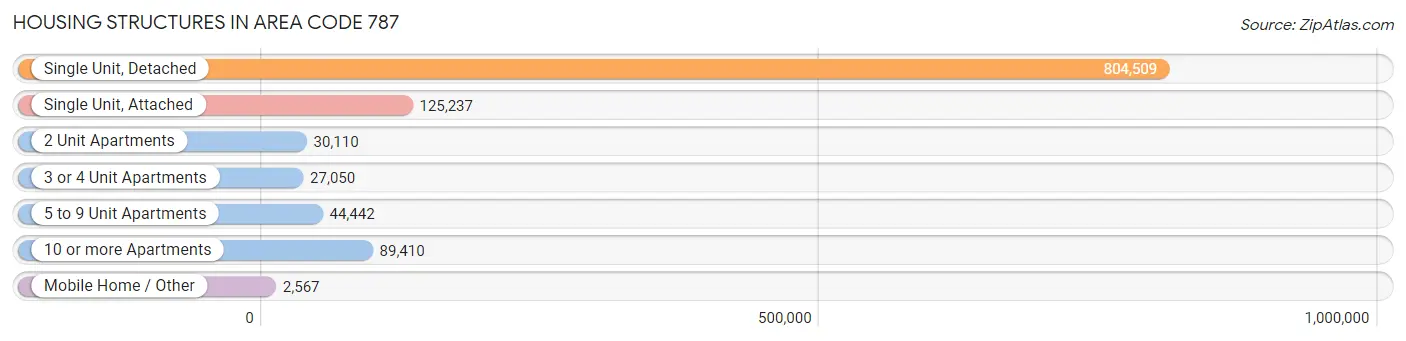
| Structure Type | # Housing Units | % Housing Units |
| Single Unit, Detached | 804,509 | 71.6% |
| Single Unit, Attached | 125,237 | 11.2% |
| 2 Unit Apartments | 30,110 | 2.7% |
| 3 or 4 Unit Apartments | 27,050 | 2.4% |
| 5 to 9 Unit Apartments | 44,442 | 4.0% |
| 10 or more Apartments | 89,410 | 8.0% |
| Mobile Home / Other | 2,567 | 0.2% |
| Total | 1,123,325 | 100.0% |
Housing Structures by Occupancy in Area Code 787
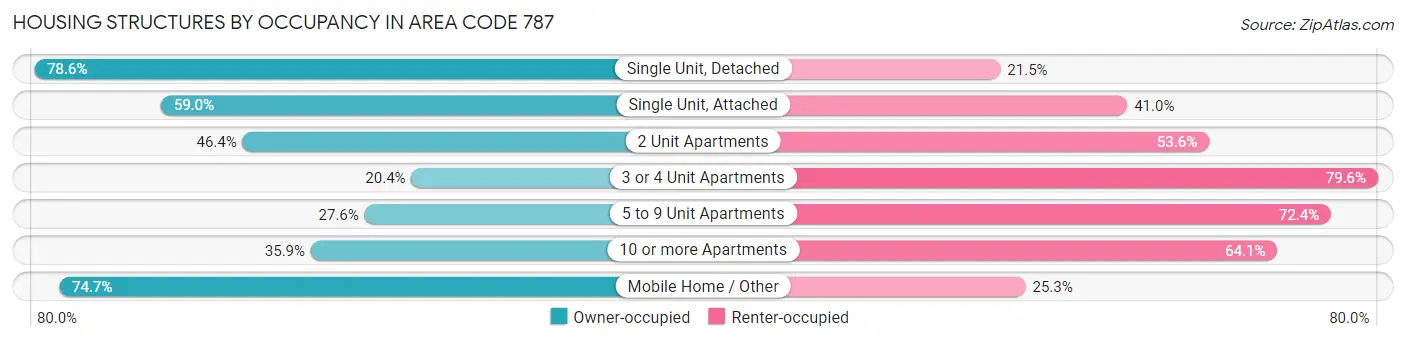
| Structure Type | Owner-occupied | Renter-occupied |
| Single Unit, Detached | 631,963 (78.5%) | 172,546 (21.4%) |
| Single Unit, Attached | 73,921 (59.0%) | 51,316 (41.0%) |
| 2 Unit Apartments | 13,979 (46.4%) | 16,131 (53.6%) |
| 3 or 4 Unit Apartments | 5,524 (20.4%) | 21,526 (79.6%) |
| 5 to 9 Unit Apartments | 12,279 (27.6%) | 32,163 (72.4%) |
| 10 or more Apartments | 32,108 (35.9%) | 57,302 (64.1%) |
| Mobile Home / Other | 1,917 (74.7%) | 650 (25.3%) |
| Total | 771,691 (68.7%) | 351,634 (31.3%) |
Housing Structures by Number of Rooms in Area Code 787
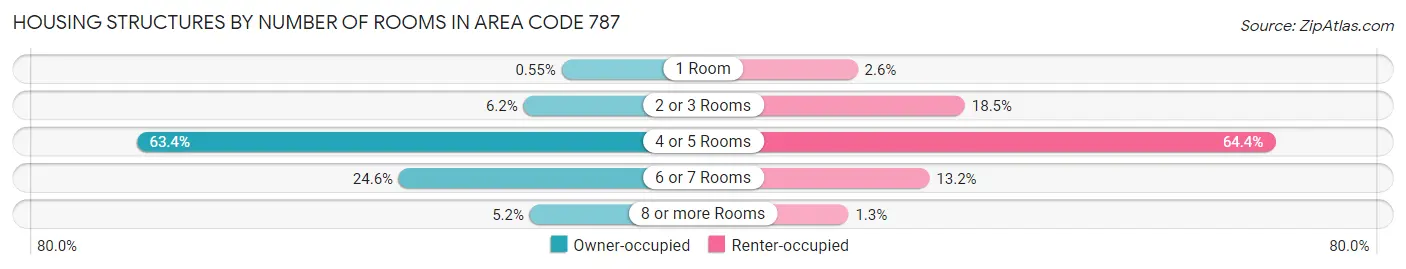
| Number of Rooms | Owner-occupied | Renter-occupied |
| 1 Room | 4,247 (0.5%) | 9,222 (2.6%) |
| 2 or 3 Rooms | 47,650 (6.2%) | 65,011 (18.5%) |
| 4 or 5 Rooms | 489,463 (63.4%) | 226,363 (64.4%) |
| 6 or 7 Rooms | 189,930 (24.6%) | 46,559 (13.2%) |
| 8 or more Rooms | 40,401 (5.2%) | 4,479 (1.3%) |
| Total | 771,691 (100.0%) | 351,634 (100.0%) |
Housing Structure by Heating Type in Area Code 787
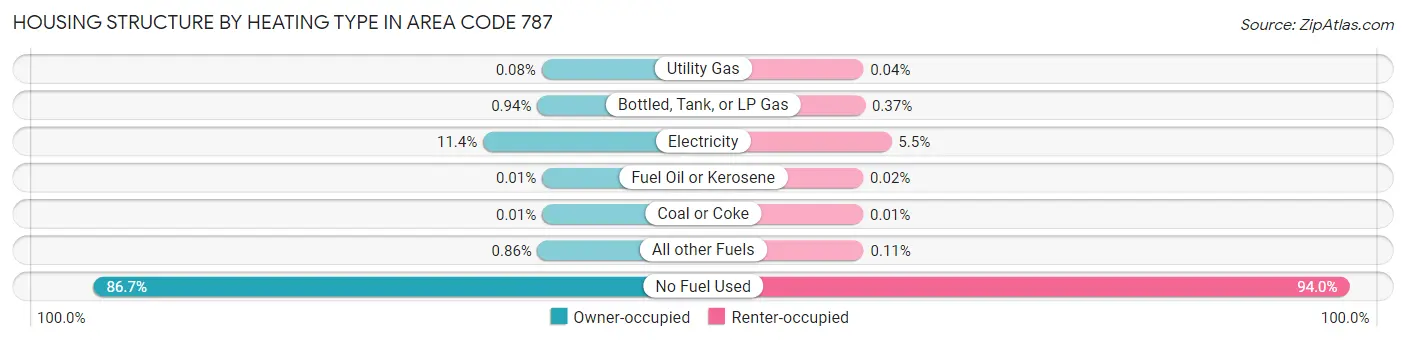
| Heating Type | Owner-occupied | Renter-occupied |
| Utility Gas | 605 (0.1%) | 152 (0.0%) |
| Bottled, Tank, or LP Gas | 7,232 (0.9%) | 1,304 (0.4%) |
| Electricity | 88,115 (11.4%) | 19,259 (5.5%) |
| Fuel Oil or Kerosene | 72 (0.0%) | 59 (0.0%) |
| Coal or Coke | 85 (0.0%) | 41 (0.0%) |
| All other Fuels | 6,644 (0.9%) | 382 (0.1%) |
| No Fuel Used | 668,938 (86.7%) | 330,437 (94.0%) |
| Total | 771,691 (100.0%) | 351,634 (100.0%) |
Household Vehicle Usage in Area Code 787
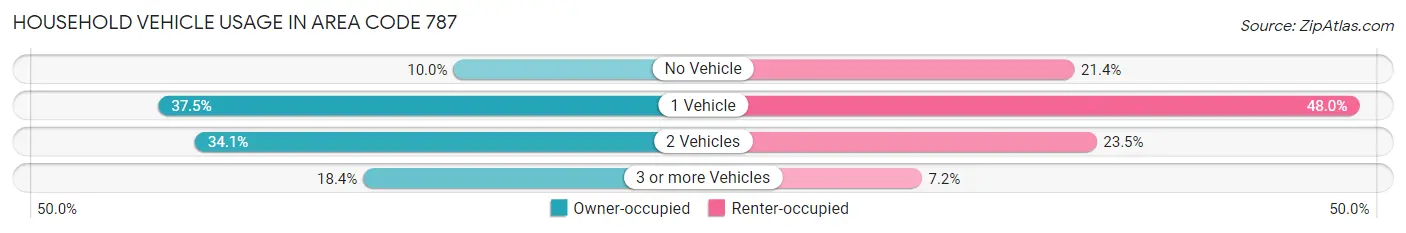
| Vehicles per Household | Owner-occupied | Renter-occupied |
| No Vehicle | 77,026 (10.0%) | 75,241 (21.4%) |
| 1 Vehicle | 289,544 (37.5%) | 168,751 (48.0%) |
| 2 Vehicles | 263,139 (34.1%) | 82,513 (23.5%) |
| 3 or more Vehicles | 141,982 (18.4%) | 25,129 (7.1%) |
| Total | 771,691 (100.0%) | 351,634 (100.0%) |
Real Estate & Mortgages in Area Code 787
Real Estate and Mortgage Overview in Area Code 787
| Characteristic | Without Mortgage | With Mortgage |
| Housing Units | 481,339 | 290,352 |
| Median Property Value | $12,550,400 | $15,461,700 |
| Median Household Income | $2,509,959 | $17,367 |
| Monthly Housing Costs | $20,038 | $7,099 |
| Real Estate Taxes | $51,238 | $234,865 |
Property Value by Mortgage Status in Area Code 787
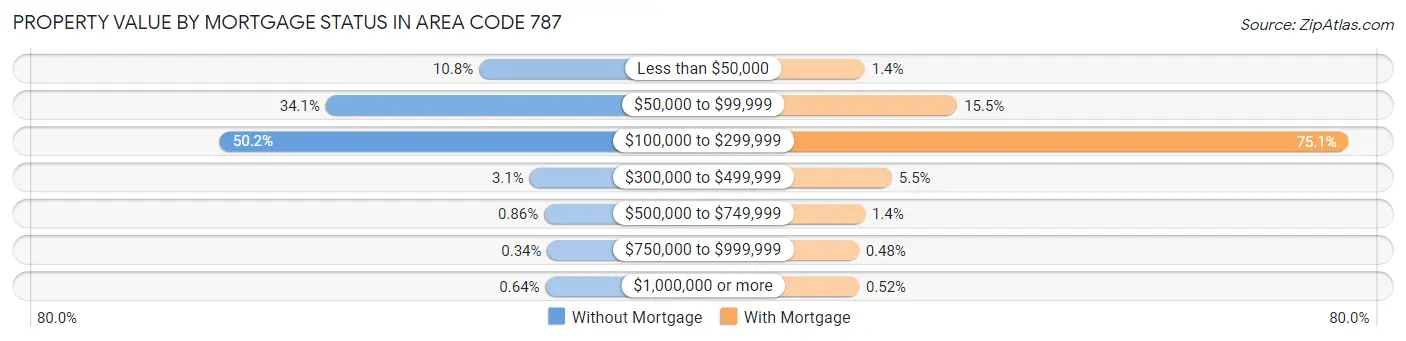
| Property Value | Without Mortgage | With Mortgage |
| Less than $50,000 | 51,771 (10.8%) | 4,084 (1.4%) |
| $50,000 to $99,999 | 164,182 (34.1%) | 44,966 (15.5%) |
| $100,000 to $299,999 | 241,821 (50.2%) | 218,168 (75.1%) |
| $300,000 to $499,999 | 14,713 (3.1%) | 16,043 (5.5%) |
| $500,000 to $749,999 | 4,139 (0.9%) | 4,185 (1.4%) |
| $750,000 to $999,999 | 1,614 (0.3%) | 1,382 (0.5%) |
| $1,000,000 or more | 3,099 (0.6%) | 1,524 (0.5%) |
| Total | 481,339 (100.0%) | 290,352 (100.0%) |
Household Income by Mortgage Status in Area Code 787
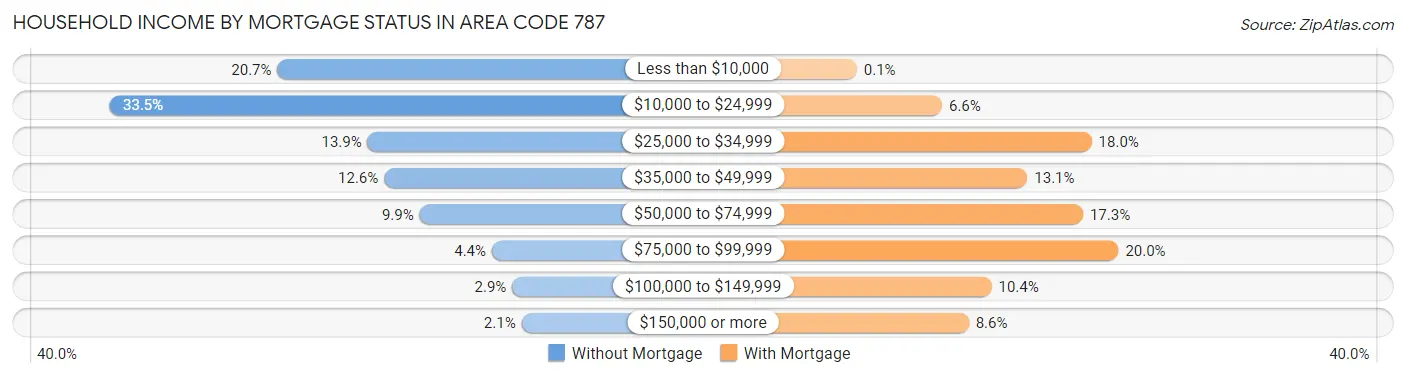
| Household Income | Without Mortgage | With Mortgage |
| Less than $10,000 | 99,806 (20.7%) | 283 (0.1%) |
| $10,000 to $24,999 | 161,226 (33.5%) | 19,121 (6.6%) |
| $25,000 to $34,999 | 66,751 (13.9%) | 52,247 (18.0%) |
| $35,000 to $49,999 | 60,679 (12.6%) | 38,020 (13.1%) |
| $50,000 to $74,999 | 47,714 (9.9%) | 50,327 (17.3%) |
| $75,000 to $99,999 | 21,170 (4.4%) | 58,171 (20.0%) |
| $100,000 to $149,999 | 13,712 (2.9%) | 30,072 (10.4%) |
| $150,000 or more | 10,281 (2.1%) | 25,027 (8.6%) |
| Total | 481,339 (100.0%) | 290,352 (100.0%) |
Property Value to Household Income Ratio in Area Code 787
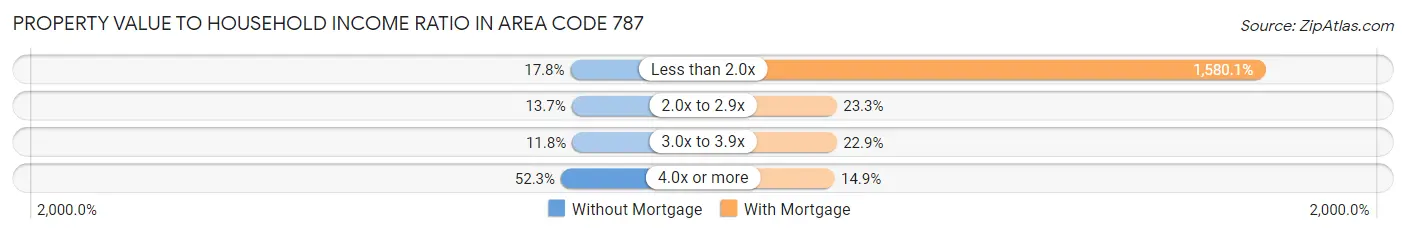
| Value-to-Income Ratio | Without Mortgage | With Mortgage |
| Less than 2.0x | 85,511 (17.8%) | 4,587,839 (1,580.1%) |
| 2.0x to 2.9x | 65,859 (13.7%) | 67,524 (23.3%) |
| 3.0x to 3.9x | 56,710 (11.8%) | 66,336 (22.9%) |
| 4.0x or more | 251,603 (52.3%) | 43,278 (14.9%) |
| Total | 481,339 (100.0%) | 290,352 (100.0%) |
Real Estate Taxes by Mortgage Status in Area Code 787
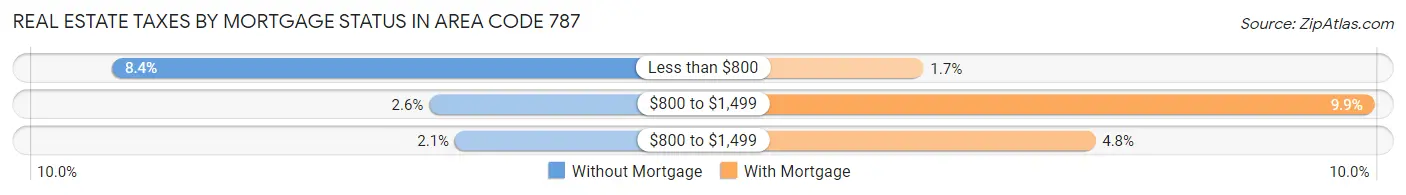
| Property Taxes | Without Mortgage | With Mortgage |
| Less than $800 | 40,446 (8.4%) | 4,783 (1.7%) |
| $800 to $1,499 | 12,553 (2.6%) | 28,715 (9.9%) |
| $800 to $1,499 | 10,306 (2.1%) | 13,909 (4.8%) |
| Total | 481,339 (100.0%) | 290,352 (100.0%) |
Health & Disability in Area Code 787
Health Insurance Coverage by Age in Area Code 787
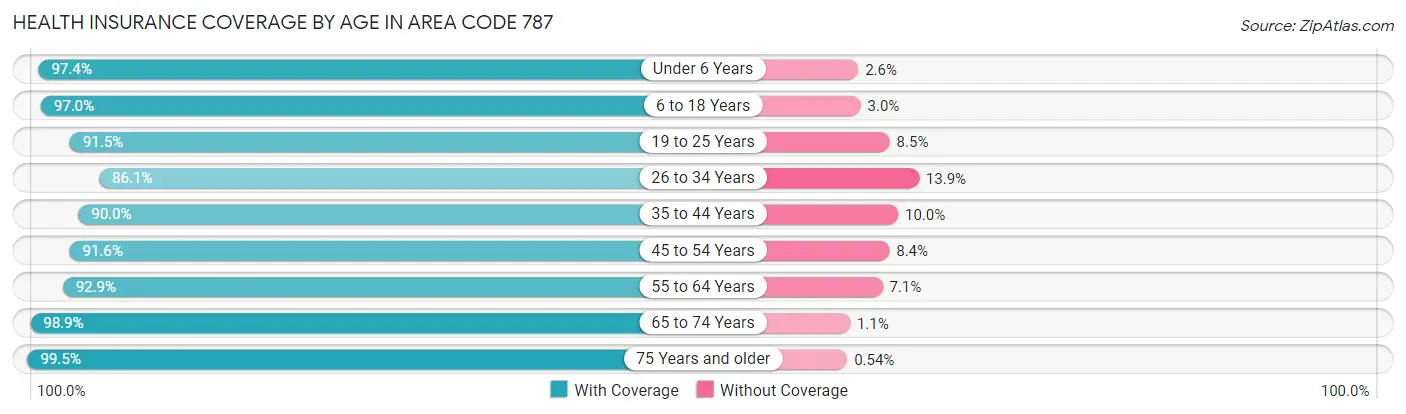
| Age Bracket | With Coverage | Without Coverage |
| Under 6 Years | 125,607 (97.4%) | 3,348 (2.6%) |
| 6 to 18 Years | 421,387 (97.0%) | 13,215 (3.0%) |
| 19 to 25 Years | 263,371 (91.5%) | 24,342 (8.5%) |
| 26 to 34 Years | 289,310 (86.1%) | 46,744 (13.9%) |
| 35 to 44 Years | 325,645 (90.0%) | 36,258 (10.0%) |
| 45 to 54 Years | 354,758 (91.6%) | 32,497 (8.4%) |
| 55 to 64 Years | 378,533 (92.9%) | 28,987 (7.1%) |
| 65 to 74 Years | 346,506 (98.9%) | 3,756 (1.1%) |
| 75 Years and older | 307,664 (99.5%) | 1,655 (0.5%) |
| Total | 2,812,781 (93.6%) | 190,802 (6.4%) |
Health Insurance Coverage by Citizenship Status in Area Code 787
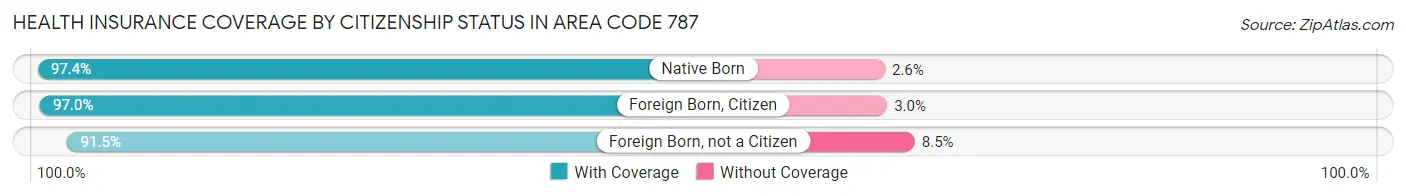
| Citizenship Status | With Coverage | Without Coverage |
| Native Born | 125,607 (97.4%) | 3,348 (2.6%) |
| Foreign Born, Citizen | 421,387 (97.0%) | 13,215 (3.0%) |
| Foreign Born, not a Citizen | 263,371 (91.5%) | 24,342 (8.5%) |
Health Insurance Coverage by Household Income in Area Code 787
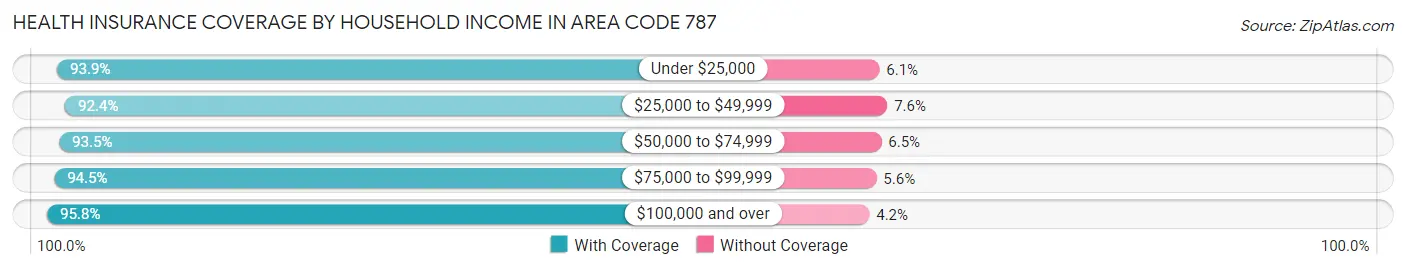
| Household Income | With Coverage | Without Coverage |
| Under $25,000 | 1,198,123 (93.9%) | 77,841 (6.1%) |
| $25,000 to $49,999 | 760,606 (92.4%) | 62,396 (7.6%) |
| $50,000 to $74,999 | 396,969 (93.5%) | 27,505 (6.5%) |
| $75,000 to $99,999 | 196,387 (94.5%) | 11,534 (5.6%) |
| $100,000 and over | 249,918 (95.8%) | 10,971 (4.2%) |
Public vs Private Health Insurance Coverage by Age in Area Code 787
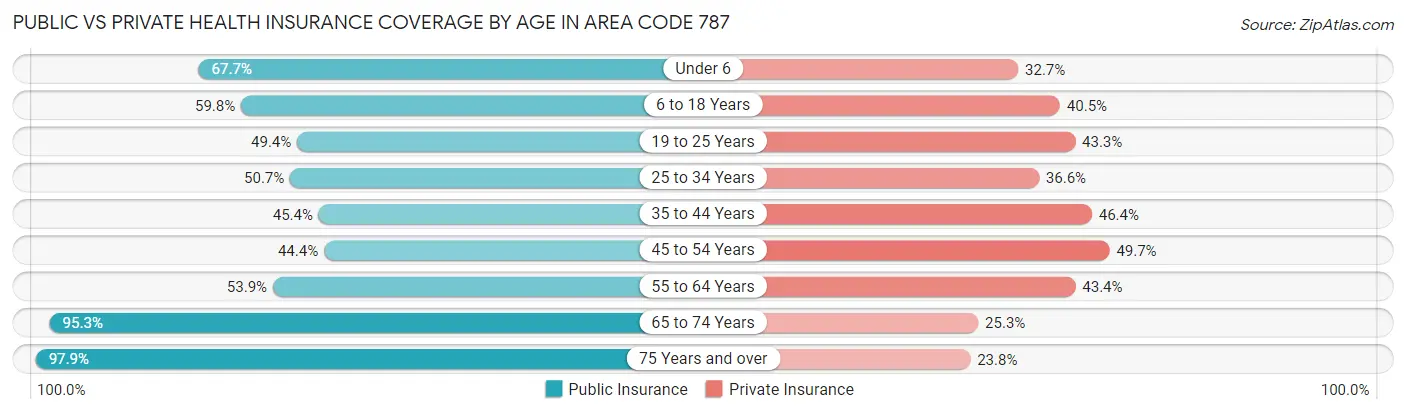
| Age Bracket | Public Insurance | Private Insurance |
| Under 6 | 87,294 (67.7%) | 42,210 (32.7%) |
| 6 to 18 Years | 259,986 (59.8%) | 175,916 (40.5%) |
| 19 to 25 Years | 142,184 (49.4%) | 124,595 (43.3%) |
| 25 to 34 Years | 170,457 (50.7%) | 122,977 (36.6%) |
| 35 to 44 Years | 164,260 (45.4%) | 167,943 (46.4%) |
| 45 to 54 Years | 172,047 (44.4%) | 192,377 (49.7%) |
| 55 to 64 Years | 219,706 (53.9%) | 176,673 (43.3%) |
| 65 to 74 Years | 333,957 (95.3%) | 88,661 (25.3%) |
| 75 Years and over | 302,916 (97.9%) | 73,752 (23.8%) |
| Total | 1,852,807 (61.7%) | 1,165,104 (38.8%) |
Disability Status by Sex by Age in Area Code 787
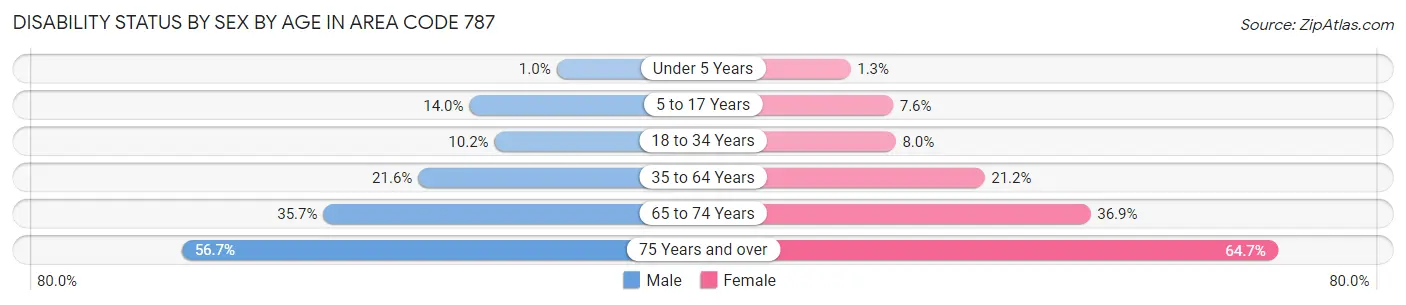
| Age Bracket | Male | Female |
| Under 5 Years | 544 (1.0%) | 638 (1.3%) |
| 5 to 17 Years | 29,826 (14.0%) | 15,564 (7.6%) |
| 18 to 34 Years | 33,756 (10.2%) | 26,672 (8.0%) |
| 35 to 64 Years | 115,909 (21.6%) | 130,980 (21.2%) |
| 65 to 74 Years | 55,907 (35.6%) | 71,377 (36.9%) |
| 75 Years and over | 73,212 (56.7%) | 116,559 (64.7%) |
Disability Class by Sex by Age in Area Code 787
Disability Class: Hearing Difficulty
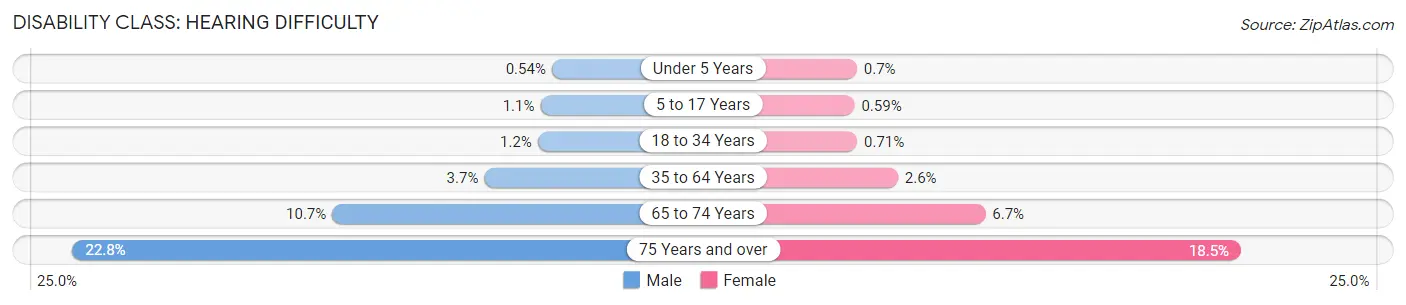
| Age Bracket | Male | Female |
| Under 5 Years | 285 (0.5%) | 357 (0.7%) |
| 5 to 17 Years | 2,287 (1.1%) | 1,221 (0.6%) |
| 18 to 34 Years | 3,925 (1.2%) | 2,377 (0.7%) |
| 35 to 64 Years | 19,718 (3.7%) | 16,107 (2.6%) |
| 65 to 74 Years | 16,823 (10.7%) | 12,892 (6.7%) |
| 75 Years and over | 29,429 (22.8%) | 33,352 (18.5%) |
Disability Class: Vision Difficulty
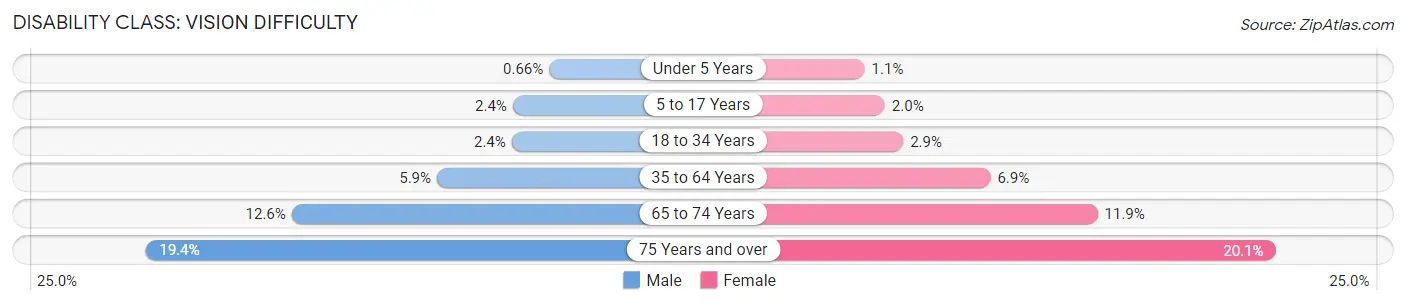
| Age Bracket | Male | Female |
| Under 5 Years | 353 (0.7%) | 535 (1.1%) |
| 5 to 17 Years | 5,017 (2.4%) | 4,111 (2.0%) |
| 18 to 34 Years | 7,901 (2.4%) | 9,528 (2.9%) |
| 35 to 64 Years | 31,531 (5.9%) | 42,703 (6.9%) |
| 65 to 74 Years | 19,779 (12.6%) | 22,967 (11.9%) |
| 75 Years and over | 24,997 (19.4%) | 36,250 (20.1%) |
Disability Class: Cognitive Difficulty
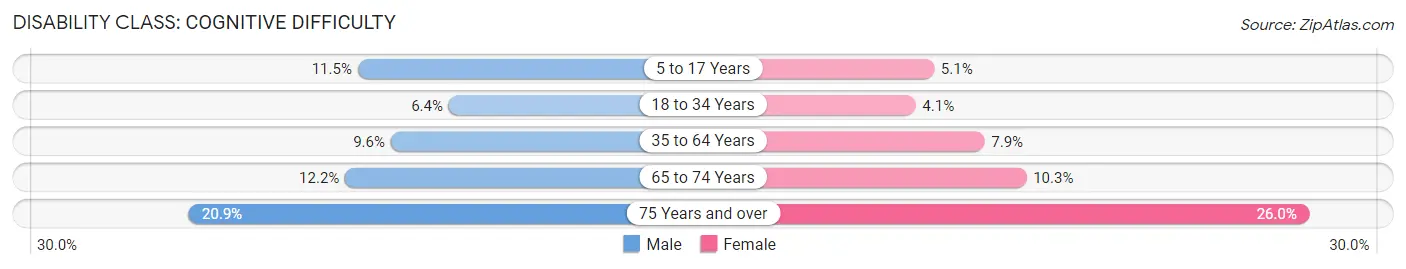
| Age Bracket | Male | Female |
| 5 to 17 Years | 24,440 (11.5%) | 10,555 (5.1%) |
| 18 to 34 Years | 21,042 (6.4%) | 13,713 (4.1%) |
| 35 to 64 Years | 51,632 (9.6%) | 49,159 (7.9%) |
| 65 to 74 Years | 19,060 (12.1%) | 19,864 (10.3%) |
| 75 Years and over | 26,936 (20.8%) | 46,838 (26.0%) |
Disability Class: Ambulatory Difficulty
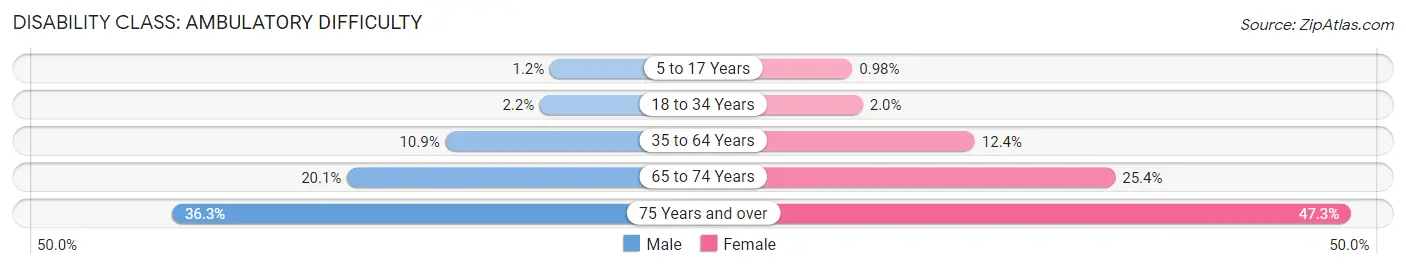
| Age Bracket | Male | Female |
| 5 to 17 Years | 2,635 (1.2%) | 2,005 (1.0%) |
| 18 to 34 Years | 7,109 (2.2%) | 6,534 (1.9%) |
| 35 to 64 Years | 58,819 (10.9%) | 76,460 (12.3%) |
| 65 to 74 Years | 31,462 (20.1%) | 49,106 (25.4%) |
| 75 Years and over | 46,925 (36.3%) | 85,123 (47.3%) |
Disability Class: Self-Care Difficulty
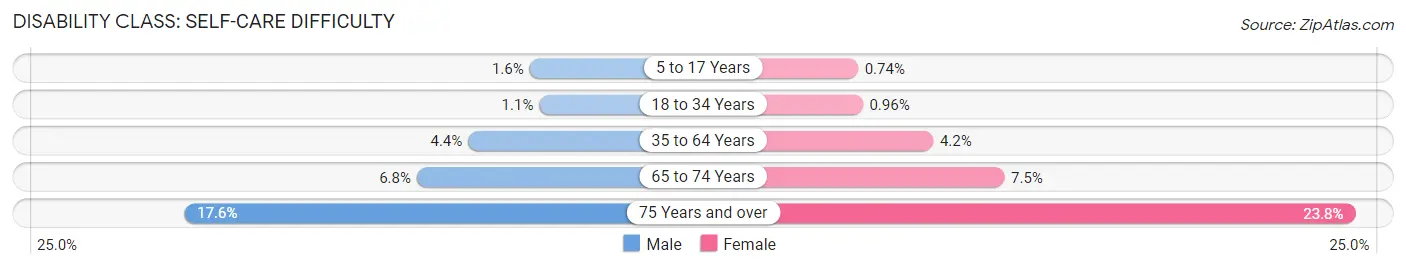
| Age Bracket | Male | Female |
| 5 to 17 Years | 3,351 (1.6%) | 1,522 (0.7%) |
| 18 to 34 Years | 3,683 (1.1%) | 3,220 (1.0%) |
| 35 to 64 Years | 23,734 (4.4%) | 26,173 (4.2%) |
| 65 to 74 Years | 10,661 (6.8%) | 14,573 (7.5%) |
| 75 Years and over | 22,734 (17.6%) | 42,923 (23.8%) |
Technology Access in Area Code 787
Computing Device Access in Area Code 787
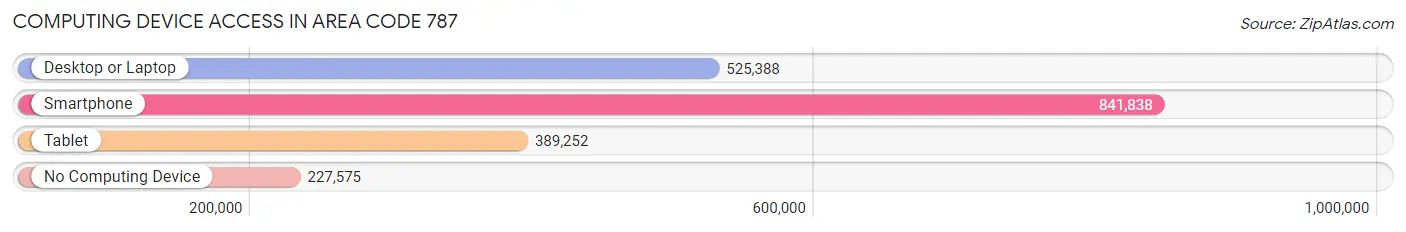
| Device Type | # Households | % Households |
| Desktop or Laptop | 525,388 | 46.8% |
| Smartphone | 841,838 | 74.9% |
| Tablet | 389,252 | 34.6% |
| No Computing Device | 227,575 | 20.3% |
| Total | 1,123,325 | 100.0% |
Internet Access in Area Code 787
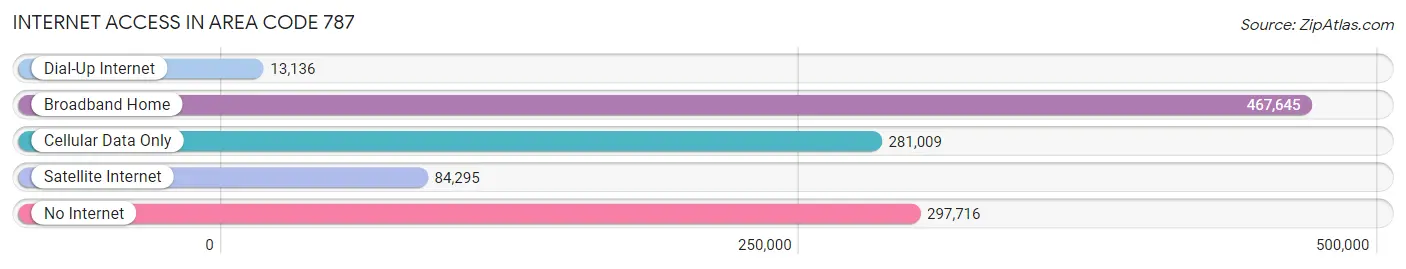
| Internet Type | # Households | % Households |
| Dial-Up Internet | 13,136 | 1.2% |
| Broadband Home | 467,645 | 41.6% |
| Cellular Data Only | 281,009 | 25.0% |
| Satellite Internet | 84,295 | 7.5% |
| No Internet | 297,716 | 26.5% |
| Total | 1,123,325 | 100.0% |
Area Code 787 Summary
Geography
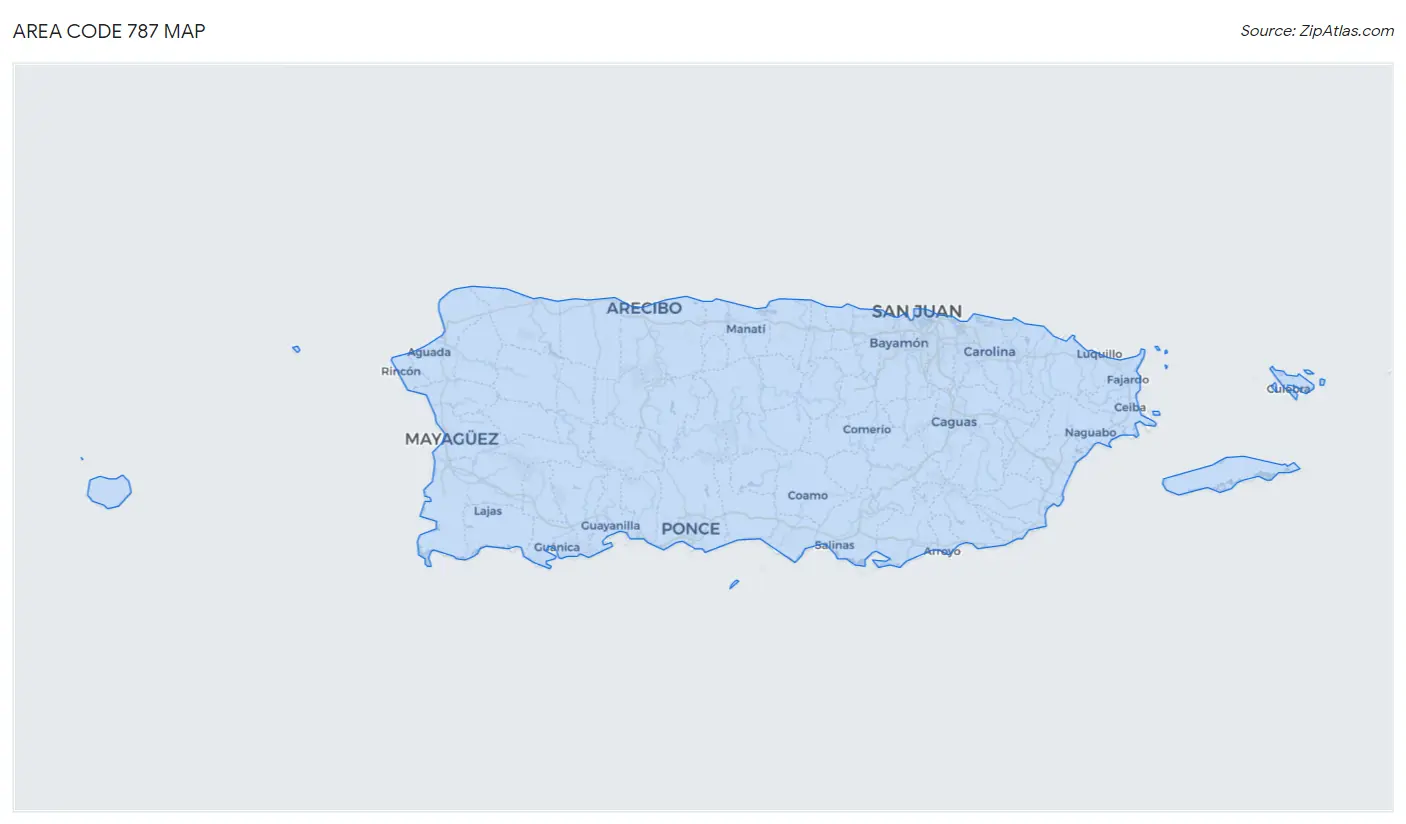
Area code 787 is located in Puerto Rico and is one of the two area codes that serve the island. It covers the eastern and northern parts of the island, including the cities of San Juan, Bayamón, Carolina, and Caguas.
Social
Area code 787 is a vibrant and diverse area, with a rich culture and history. It is home to many of Puerto Rico's most popular tourist attractions, including El Yunque National Forest, the San Juan National Historic Site, and the Arecibo Observatory.
Economics
Area code 787 is an important economic hub for Puerto Rico, with many businesses and industries located in the area. It is home to the Puerto Rico Convention Center, the largest convention center in the Caribbean, as well as the Puerto Rico Science and Technology Park.
Demographics
Area code 787 is home to a diverse population, with a mix of ethnicities and cultures. According to the 2010 census, the population of the area code was 1,845,945, with a median age of 37.5 years. The population is predominantly Hispanic, with a large percentage of African-American and other minority groups.
Common Questions
What is Per Capita Income in Area Code 787?
Per Capita income in Area Code 787 is $15,606.
What is the Median Family Income in Area Code 787?
Median Family Income in Area Code 787 is $29,821.
What is the Median Household income in Area Code 787?
Median Household Income in Area Code 787 is $24,068.
What is Income or Wage Gap in Area Code 787?
Income or Wage Gap in Area Code 787 is 9.5%.
Women in Area Code 787 earn 90.5 cents for every dollar earned by a man.
What is Family Income Deficit in Area Code 787?
Family Income Deficit in Area Code 787 is $11,134.
Families that are below poverty line in Area Code 787 earn $11,134 less on average than the poverty threshold level.
What is Inequality or Gini Index in Area Code 787?
Inequality or Gini Index in Area Code 787 is 55.03.
What is the Total Population of Area Code 787?
Total Population of Area Code 787 is 3,022,142.
What is the Total Male Population of Area Code 787?
Total Male Population of Area Code 787 is 1,431,231.
What is the Total Female Population of Area Code 787?
Total Female Population of Area Code 787 is 1,590,911.
What is the Ratio of Males per 100 Females in Area Code 787?
There are 89.96 Males per 100 Females in Area Code 787.
What is the Ratio of Females per 100 Males in Area Code 787?
There are 111.16 Females per 100 Males in Area Code 787.
What is the Median Population Age in Area Code 787?
Median Population Age in Area Code 787 is 44.1 Years.
What is the Average Family Size in Area Code 787
Average Family Size in Area Code 787 is 3.4 People.
What is the Average Household Size in Area Code 787
Average Household Size in Area Code 787 is 2.7 People.
How Large is the Labor Force in Area Code 787?
There are 1,140,756 People in the Labor Forcein in Area Code 787.
What is the Percentage of People in the Labor Force in Area Code 787?
44.3% of People are in the Labor Force in Area Code 787.
What is the Unemployment Rate in Area Code 787?
Unemployment Rate in Area Code 787 is 14.2%.