Cayey, PR Map & Demographics
Cayey Map
Cayey Overview
$11,752
PER CAPITA INCOME
$26,024
AVG FAMILY INCOME
$17,682
AVG HOUSEHOLD INCOME
17.1%
WAGE / INCOME GAP [ % ]
82.9¢/ $1
WAGE / INCOME GAP [ $ ]
$11,237
FAMILY INCOME DEFICIT
0.49
INEQUALITY / GINI INDEX
14,423
TOTAL POPULATION
6,548
MALE POPULATION
7,875
FEMALE POPULATION
83.15
MALES / 100 FEMALES
120.27
FEMALES / 100 MALES
44.4
MEDIAN AGE
3.2
AVG FAMILY SIZE
2.3
AVG HOUSEHOLD SIZE
4,461
LABOR FORCE [ PEOPLE ]
36.0%
PERCENT IN LABOR FORCE
7.3%
UNEMPLOYMENT RATE
Cayey Zip Codes
Income in Cayey
Income Overview in Cayey
Per Capita Income in Cayey is $11,752, while median incomes of families and households are $26,024 and $17,682 respectively.
| Characteristic | Number | Measure |
| Per Capita Income | 14,423 | $11,752 |
| Median Family Income | 3,272 | $26,024 |
| Mean Family Income | 3,272 | $30,953 |
| Median Household Income | 6,128 | $17,682 |
| Mean Household Income | 6,128 | $25,464 |
| Income Deficit | 3,272 | $11,237 |
| Wage / Income Gap (%) | 14,423 | 17.12% |
| Wage / Income Gap ($) | 14,423 | 82.88¢ per $1 |
| Gini / Inequality Index | 14,423 | 0.49 |
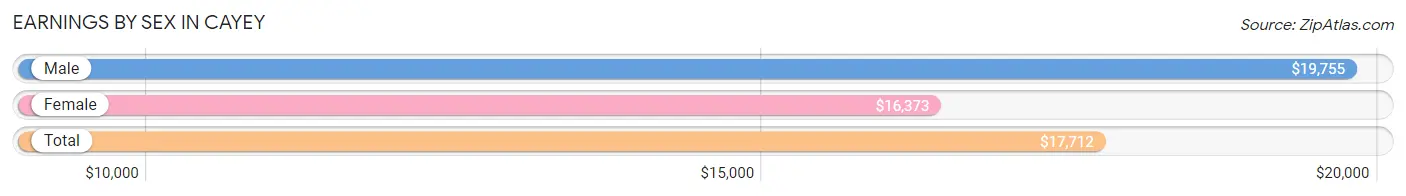
Earnings by Sex in Cayey
Average Earnings in Cayey are $17,712, $19,755 for men and $16,373 for women, a difference of 17.1%.
| Sex | Number | Average Earnings |
| Male | 2,189 (46.8%) | $19,755 |
| Female | 2,487 (53.2%) | $16,373 |
| Total | 4,676 (100.0%) | $17,712 |
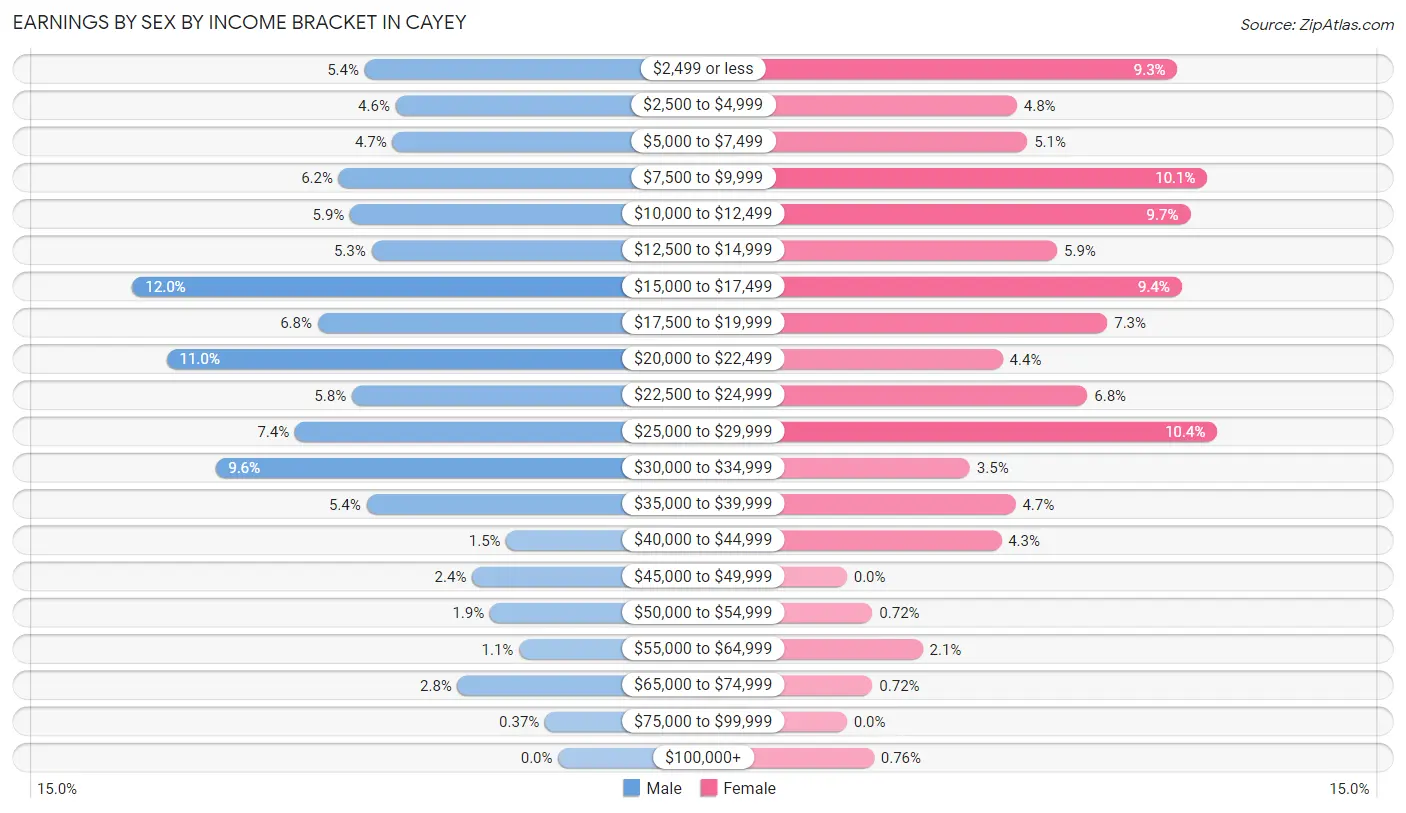
Earnings by Sex by Income Bracket in Cayey
The most common earnings brackets in Cayey are $15,000 to $17,499 for men (262 | 12.0%) and $25,000 to $29,999 for women (259 | 10.4%).
| Income | Male | Female |
| $2,499 or less | 119 (5.4%) | 231 (9.3%) |
| $2,500 to $4,999 | 100 (4.6%) | 119 (4.8%) |
| $5,000 to $7,499 | 102 (4.7%) | 126 (5.1%) |
| $7,500 to $9,999 | 135 (6.2%) | 252 (10.1%) |
| $10,000 to $12,499 | 128 (5.9%) | 240 (9.7%) |
| $12,500 to $14,999 | 115 (5.2%) | 147 (5.9%) |
| $15,000 to $17,499 | 262 (12.0%) | 234 (9.4%) |
| $17,500 to $19,999 | 148 (6.8%) | 182 (7.3%) |
| $20,000 to $22,499 | 241 (11.0%) | 109 (4.4%) |
| $22,500 to $24,999 | 127 (5.8%) | 168 (6.8%) |
| $25,000 to $29,999 | 162 (7.4%) | 259 (10.4%) |
| $30,000 to $34,999 | 211 (9.6%) | 86 (3.5%) |
| $35,000 to $39,999 | 118 (5.4%) | 118 (4.7%) |
| $40,000 to $44,999 | 32 (1.5%) | 108 (4.3%) |
| $45,000 to $49,999 | 53 (2.4%) | 0 (0.0%) |
| $50,000 to $54,999 | 42 (1.9%) | 18 (0.7%) |
| $55,000 to $64,999 | 24 (1.1%) | 53 (2.1%) |
| $65,000 to $74,999 | 62 (2.8%) | 18 (0.7%) |
| $75,000 to $99,999 | 8 (0.4%) | 0 (0.0%) |
| $100,000+ | 0 (0.0%) | 19 (0.8%) |
| Total | 2,189 (100.0%) | 2,487 (100.0%) |
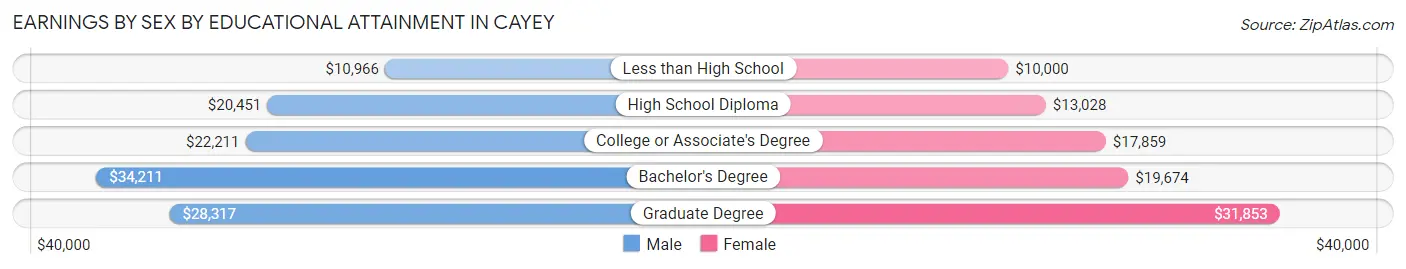
Earnings by Sex by Educational Attainment in Cayey
Average earnings in Cayey are $20,711 for men and $17,721 for women, a difference of 14.4%. Men with an educational attainment of bachelor's degree enjoy the highest average annual earnings of $34,211, while those with less than high school education earn the least with $10,966. Women with an educational attainment of graduate degree earn the most with the average annual earnings of $31,853, while those with less than high school education have the smallest earnings of $10,000.
| Educational Attainment | Male Income | Female Income |
| Less than High School | $10,966 | $10,000 |
| High School Diploma | $20,451 | $13,028 |
| College or Associate's Degree | $22,211 | $17,859 |
| Bachelor's Degree | $34,211 | $19,674 |
| Graduate Degree | $28,317 | $31,853 |
| Total | $20,711 | $17,721 |
Family Income in Cayey
Family Income Brackets in Cayey
According to the Cayey family income data, there are 733 families falling into the $25,000 to $34,999 income range, which is the most common income bracket and makes up 22.4% of all families.
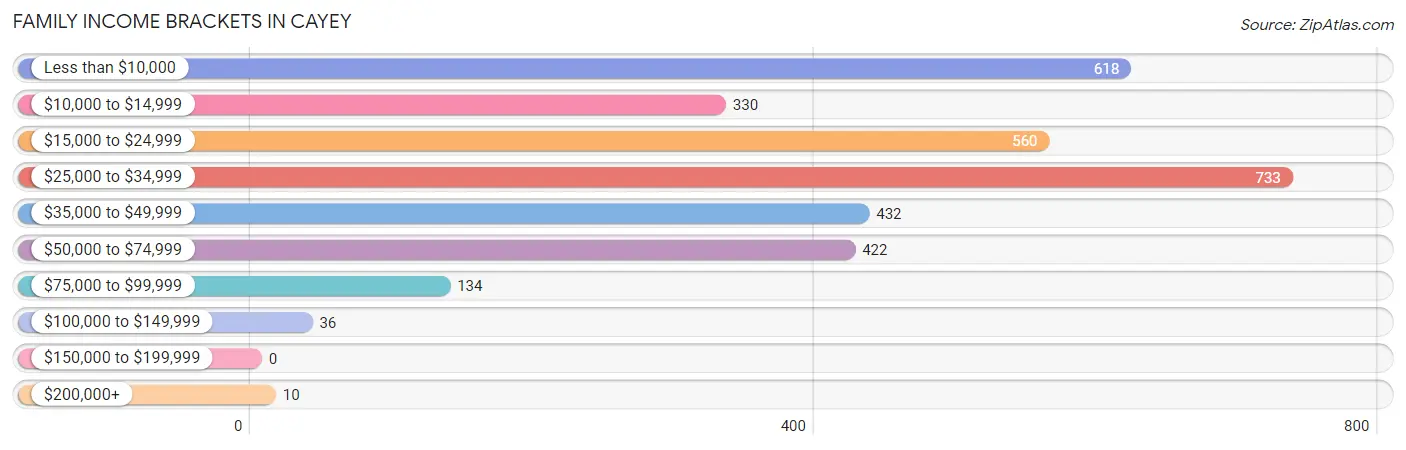
| Income Bracket | # Families | % Families |
| Less than $10,000 | 618 | 18.9% |
| $10,000 to $14,999 | 330 | 10.1% |
| $15,000 to $24,999 | 560 | 17.1% |
| $25,000 to $34,999 | 733 | 22.4% |
| $35,000 to $49,999 | 432 | 13.2% |
| $50,000 to $74,999 | 422 | 12.9% |
| $75,000 to $99,999 | 134 | 4.1% |
| $100,000 to $149,999 | 36 | 1.1% |
| $150,000 to $199,999 | 0 | 0.0% |
| $200,000+ | 10 | 0.3% |
Family Income by Famaliy Size in Cayey
5-person families (135 | 4.1%) account for the highest median family income in Cayey with $30,430 per family, while 2-person families (1,612 | 49.3%) have the highest median income of $12,992 per family member.
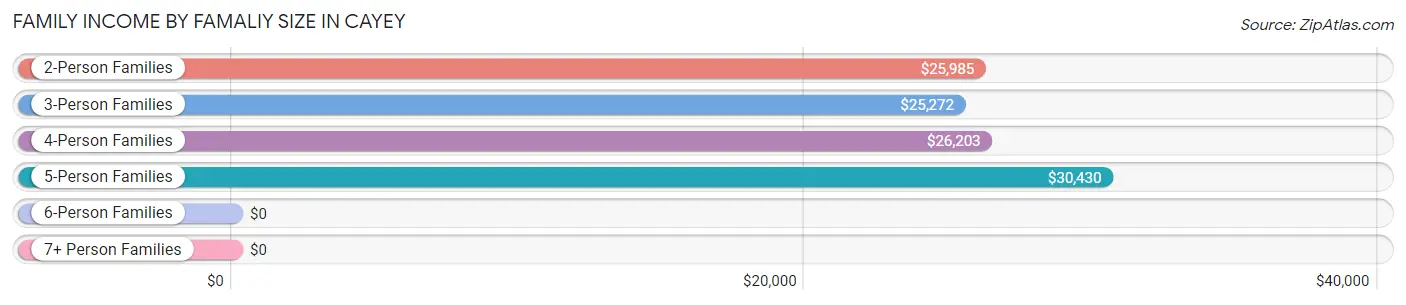
| Income Bracket | # Families | Median Income |
| 2-Person Families | 1,612 (49.3%) | $25,985 |
| 3-Person Families | 938 (28.7%) | $25,272 |
| 4-Person Families | 545 (16.7%) | $26,203 |
| 5-Person Families | 135 (4.1%) | $30,430 |
| 6-Person Families | 42 (1.3%) | $0 |
| 7+ Person Families | 0 (0.0%) | $0 |
| Total | 3,272 (100.0%) | $26,024 |
Family Income by Number of Earners in Cayey
The median family income in Cayey is $26,024, with families comprising 3+ earners (105) having the highest median family income of $61,250, while families with no earners (1,218) have the lowest median family income of $17,154, accounting for 3.2% and 37.2% of families, respectively.
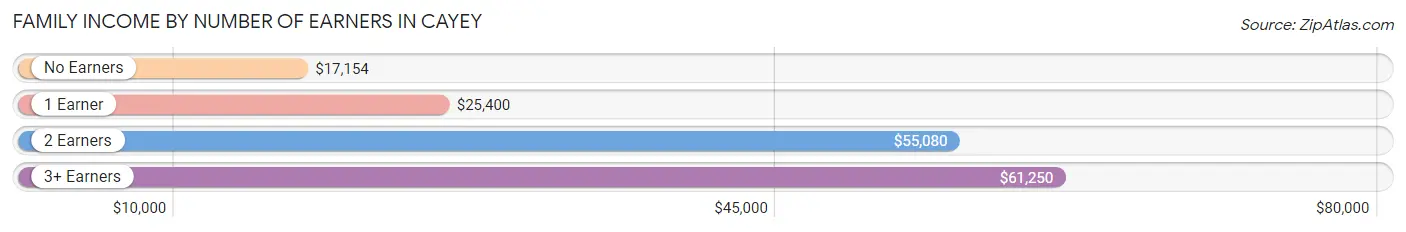
| Number of Earners | # Families | Median Income |
| No Earners | 1,218 (37.2%) | $17,154 |
| 1 Earner | 1,396 (42.7%) | $25,400 |
| 2 Earners | 553 (16.9%) | $55,080 |
| 3+ Earners | 105 (3.2%) | $61,250 |
| Total | 3,272 (100.0%) | $26,024 |
Household Income in Cayey
Household Income Brackets in Cayey
With 1,851 households falling in the category, the less than $10,000 income range is the most frequent in Cayey, accounting for 30.2% of all households. In contrast, only 6 households (0.1%) fall into the $200,000+ income bracket, making it the least populous group.
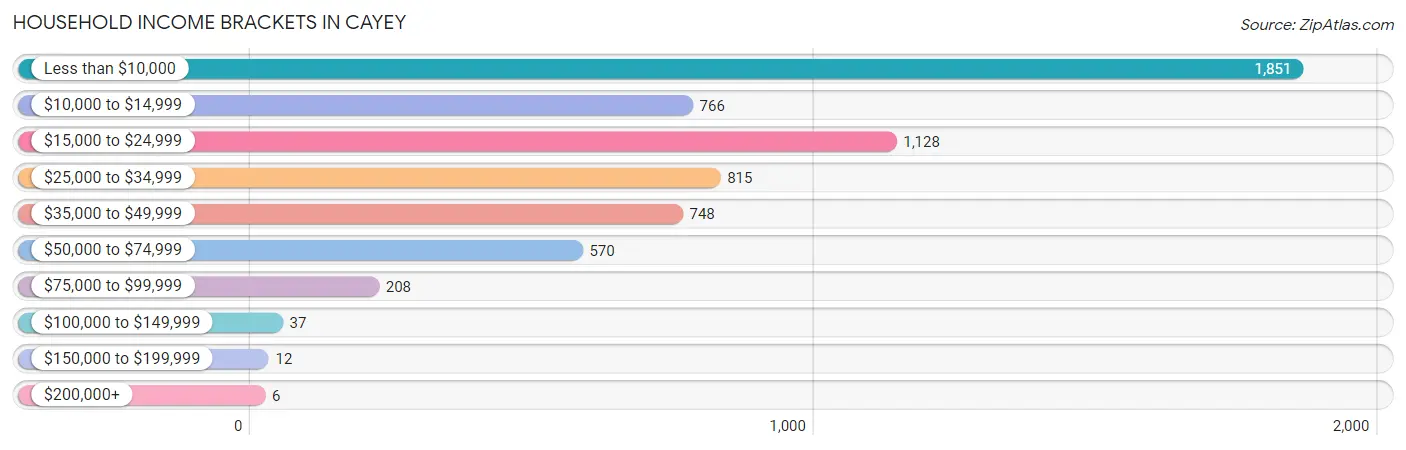
| Income Bracket | # Households | % Households |
| Less than $10,000 | 1,851 | 30.2% |
| $10,000 to $14,999 | 766 | 12.5% |
| $15,000 to $24,999 | 1,128 | 18.4% |
| $25,000 to $34,999 | 815 | 13.3% |
| $35,000 to $49,999 | 748 | 12.2% |
| $50,000 to $74,999 | 570 | 9.3% |
| $75,000 to $99,999 | 208 | 3.4% |
| $100,000 to $149,999 | 37 | 0.6% |
| $150,000 to $199,999 | 12 | 0.2% |
| $200,000+ | 6 | 0.1% |
Household Income by Householder Age in Cayey
The median household income in Cayey is $17,682, with the highest median household income of $22,055 found in the 25 to 44 years age bracket for the primary householder. A total of 1,595 households (26.0%) fall into this category. Meanwhile, the 15 to 24 years age bracket for the primary householder has the lowest median household income of $0, with 115 households (1.9%) in this group.
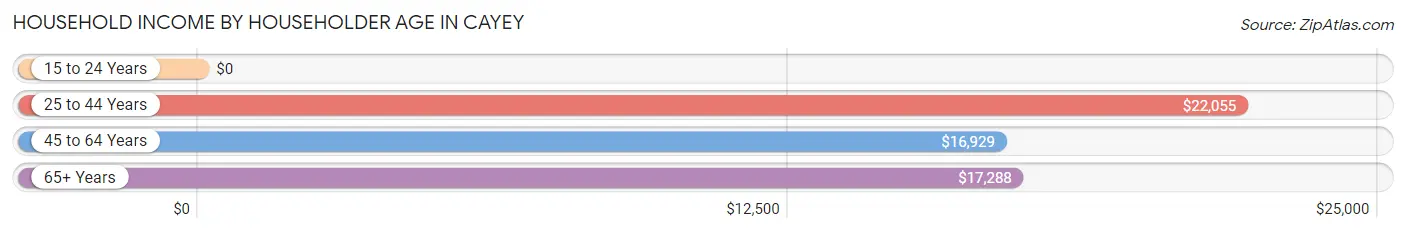
| Income Bracket | # Households | Median Income |
| 15 to 24 Years | 115 (1.9%) | $0 |
| 25 to 44 Years | 1,595 (26.0%) | $22,055 |
| 45 to 64 Years | 1,989 (32.5%) | $16,929 |
| 65+ Years | 2,429 (39.6%) | $17,288 |
| Total | 6,128 (100.0%) | $17,682 |
Poverty in Cayey
Income Below Poverty by Sex and Age in Cayey
With 49.0% poverty level for males and 53.4% for females among the residents of Cayey, 12 to 14 year old males and 15 year old females are the most vulnerable to poverty, with 150 males (77.3%) and 35 females (100.0%) in their respective age groups living below the poverty level.
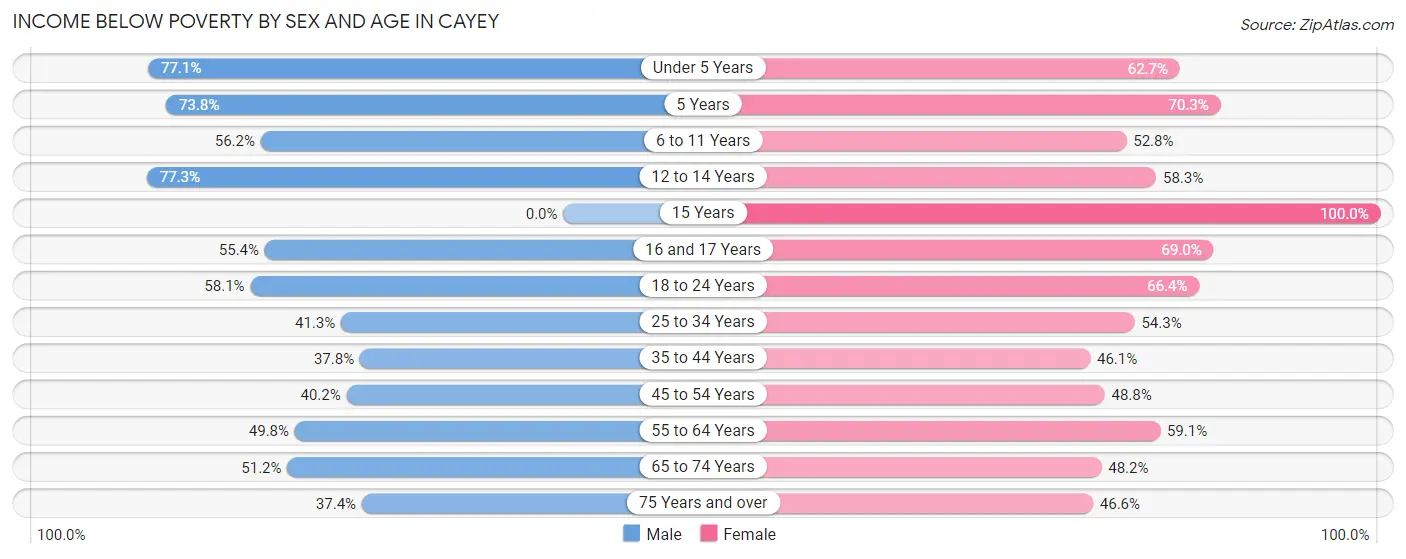
| Age Bracket | Male | Female |
| Under 5 Years | 222 (77.1%) | 207 (62.7%) |
| 5 Years | 59 (73.8%) | 45 (70.3%) |
| 6 to 11 Years | 301 (56.2%) | 151 (52.8%) |
| 12 to 14 Years | 150 (77.3%) | 119 (58.3%) |
| 15 Years | 0 (0.0%) | 35 (100.0%) |
| 16 and 17 Years | 118 (55.4%) | 147 (69.0%) |
| 18 to 24 Years | 377 (58.1%) | 438 (66.4%) |
| 25 to 34 Years | 297 (41.2%) | 539 (54.3%) |
| 35 to 44 Years | 285 (37.8%) | 482 (46.1%) |
| 45 to 54 Years | 299 (40.2%) | 494 (48.8%) |
| 55 to 64 Years | 477 (49.8%) | 580 (59.1%) |
| 65 to 74 Years | 375 (51.2%) | 459 (48.2%) |
| 75 Years and over | 249 (37.4%) | 507 (46.6%) |
| Total | 3,209 (49.0%) | 4,203 (53.4%) |
Income Above Poverty by Sex and Age in Cayey
According to the poverty statistics in Cayey, males aged 15 years and females aged 35 to 44 years are the age groups that are most secure financially, with 100.0% of males and 53.9% of females in these age groups living above the poverty line.
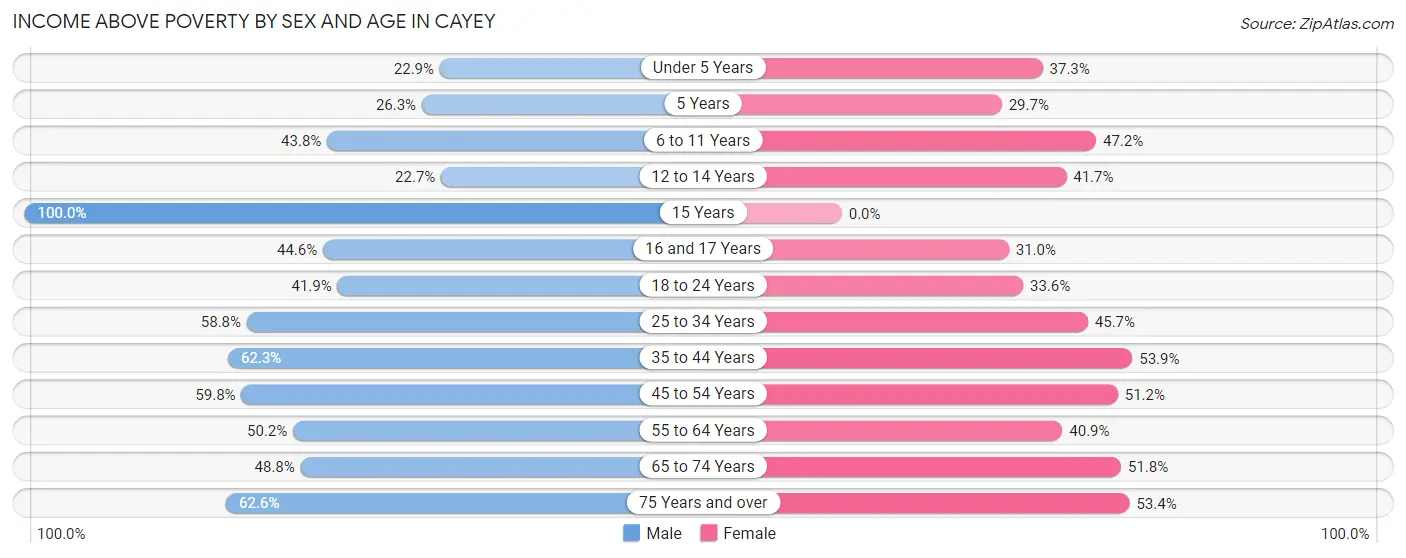
| Age Bracket | Male | Female |
| Under 5 Years | 66 (22.9%) | 123 (37.3%) |
| 5 Years | 21 (26.3%) | 19 (29.7%) |
| 6 to 11 Years | 235 (43.8%) | 135 (47.2%) |
| 12 to 14 Years | 44 (22.7%) | 85 (41.7%) |
| 15 Years | 15 (100.0%) | 0 (0.0%) |
| 16 and 17 Years | 95 (44.6%) | 66 (31.0%) |
| 18 to 24 Years | 272 (41.9%) | 222 (33.6%) |
| 25 to 34 Years | 423 (58.8%) | 453 (45.7%) |
| 35 to 44 Years | 470 (62.3%) | 564 (53.9%) |
| 45 to 54 Years | 444 (59.8%) | 519 (51.2%) |
| 55 to 64 Years | 480 (50.2%) | 402 (40.9%) |
| 65 to 74 Years | 357 (48.8%) | 494 (51.8%) |
| 75 Years and over | 417 (62.6%) | 581 (53.4%) |
| Total | 3,339 (51.0%) | 3,663 (46.6%) |
Income Below Poverty Among Married-Couple Families in Cayey
The poverty statistics for married-couple families in Cayey show that 24.7% or 301 of the total 1,216 families live below the poverty line. Families with 3 or 4 children have the highest poverty rate of 100.0%, comprising of 19 families. On the other hand, families with 1 or 2 children have the lowest poverty rate of 20.2%, which includes 66 families.
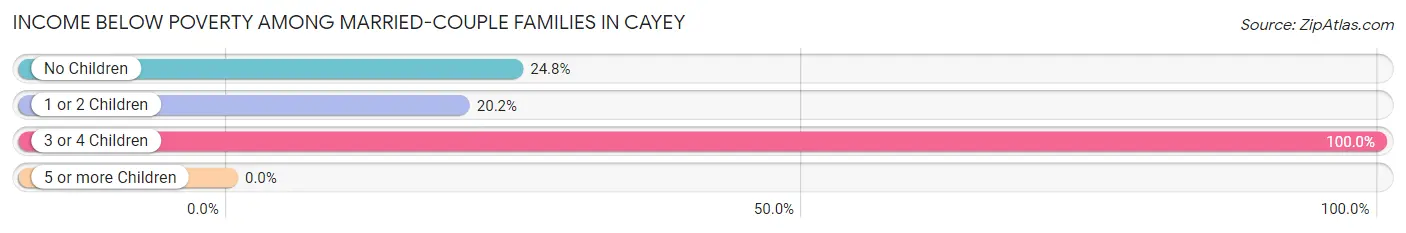
| Children | Above Poverty | Below Poverty |
| No Children | 654 (75.2%) | 216 (24.8%) |
| 1 or 2 Children | 261 (79.8%) | 66 (20.2%) |
| 3 or 4 Children | 0 (0.0%) | 19 (100.0%) |
| 5 or more Children | 0 (0.0%) | 0 (0.0%) |
| Total | 915 (75.2%) | 301 (24.7%) |
Income Below Poverty Among Single-Parent Households in Cayey
According to the poverty data in Cayey, 26.3% or 105 single-father households and 63.5% or 1,052 single-mother households are living below the poverty line. Among single-father households, those with 1 or 2 children have the highest poverty rate, with 75 households (34.9%) experiencing poverty. Likewise, among single-mother households, those with 3 or 4 children have the highest poverty rate, with 84 households (90.3%) falling below the poverty line.
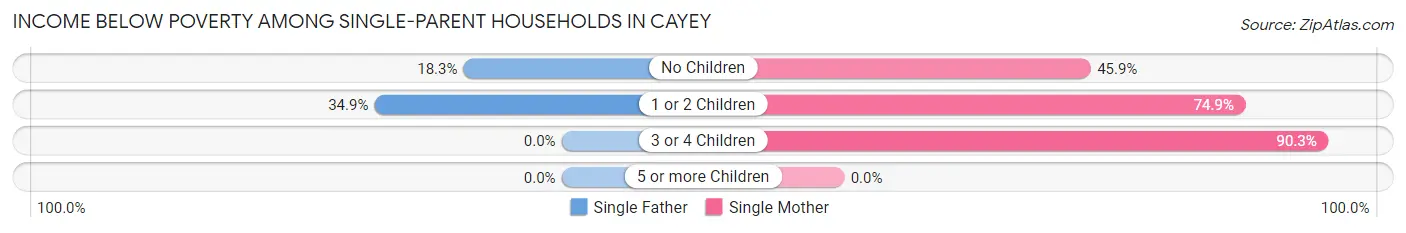
| Children | Single Father | Single Mother |
| No Children | 30 (18.3%) | 321 (45.9%) |
| 1 or 2 Children | 75 (34.9%) | 647 (74.9%) |
| 3 or 4 Children | 0 (0.0%) | 84 (90.3%) |
| 5 or more Children | 0 (0.0%) | 0 (0.0%) |
| Total | 105 (26.3%) | 1,052 (63.5%) |
Income Below Poverty Among Married-Couple vs Single-Parent Households in Cayey
The poverty data for Cayey shows that 301 of the married-couple family households (24.7%) and 1,157 of the single-parent households (56.3%) are living below the poverty level. Within the married-couple family households, those with 3 or 4 children have the highest poverty rate, with 19 households (100.0%) falling below the poverty line. Among the single-parent households, those with 3 or 4 children have the highest poverty rate, with 84 household (73.7%) living below poverty.
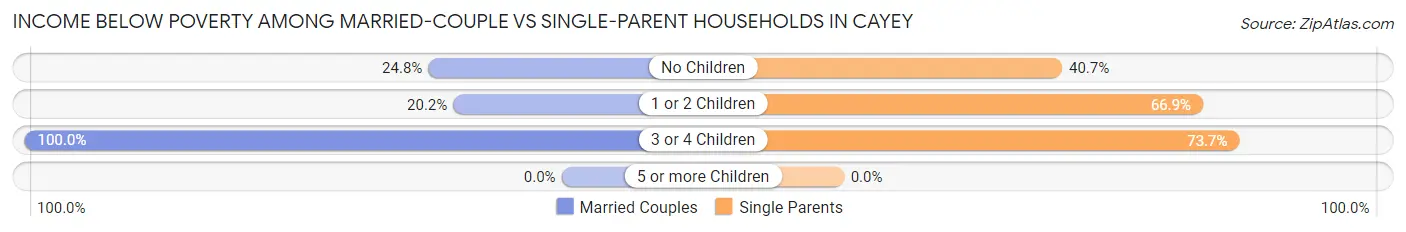
| Children | Married-Couple Families | Single-Parent Households |
| No Children | 216 (24.8%) | 351 (40.7%) |
| 1 or 2 Children | 66 (20.2%) | 722 (66.9%) |
| 3 or 4 Children | 19 (100.0%) | 84 (73.7%) |
| 5 or more Children | 0 (0.0%) | 0 (0.0%) |
| Total | 301 (24.7%) | 1,157 (56.3%) |
Race in Cayey
The most populous races in Cayey are Hispanic or Latino (14,413 | 99.9%), White / Caucasian (5,932 | 41.1%), and Two or more Races (4,375 | 30.3%).
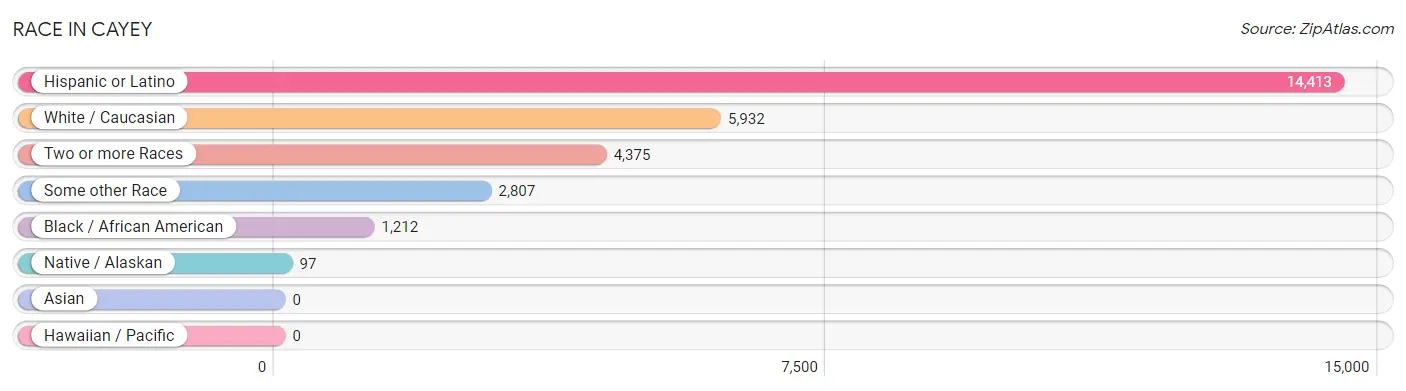
| Race | # Population | % Population |
| Asian | 0 | 0.0% |
| Black / African American | 1,212 | 8.4% |
| Hawaiian / Pacific | 0 | 0.0% |
| Hispanic or Latino | 14,413 | 99.9% |
| Native / Alaskan | 97 | 0.7% |
| White / Caucasian | 5,932 | 41.1% |
| Two or more Races | 4,375 | 30.3% |
| Some other Race | 2,807 | 19.5% |
| Total | 14,423 | 100.0% |
Ancestry in Cayey
The most populous ancestries reported in Cayey are Puerto Rican (14,279 | 99.0%), American (147 | 1.0%), Central American Indian (110 | 0.8%), Dominican (37 | 0.3%), and French (21 | 0.2%), together accounting for 101.2% of all Cayey residents.
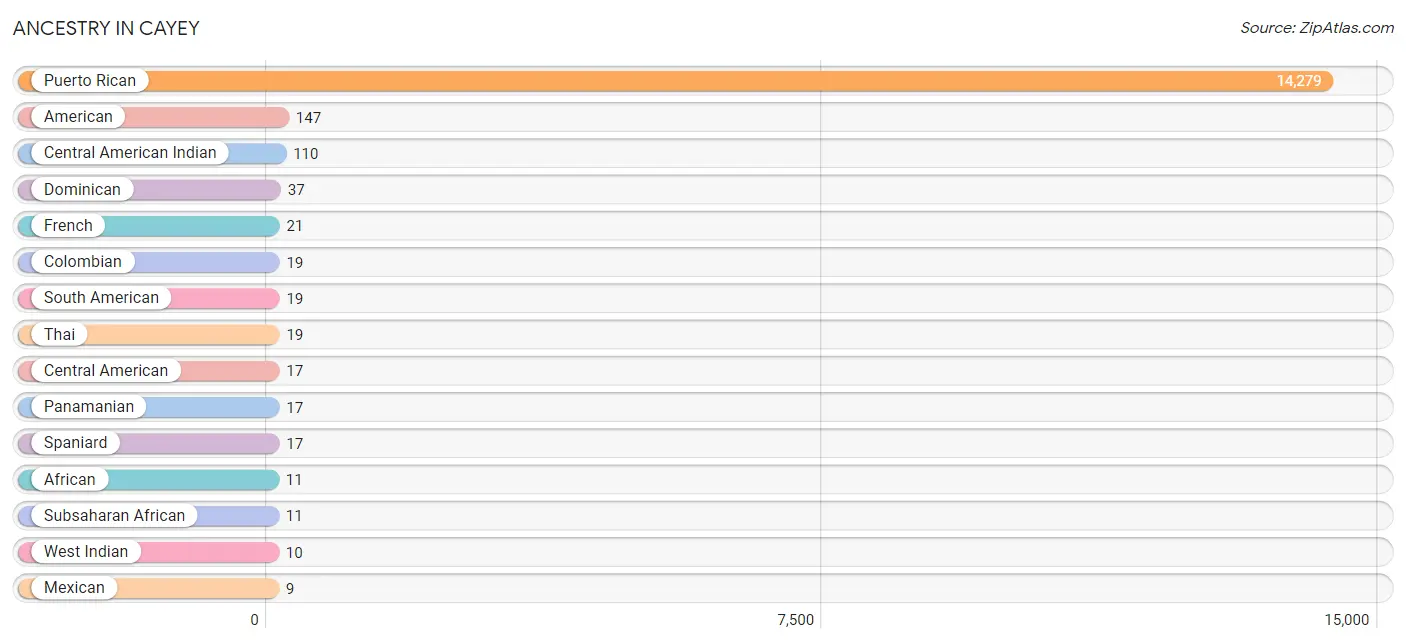
| Ancestry | # Population | % Population |
| African | 11 | 0.1% |
| American | 147 | 1.0% |
| Central American | 17 | 0.1% |
| Central American Indian | 110 | 0.8% |
| Colombian | 19 | 0.1% |
| Dominican | 37 | 0.3% |
| French | 21 | 0.2% |
| Jamaican | 1 | 0.0% |
| Mexican | 9 | 0.1% |
| Panamanian | 17 | 0.1% |
| Puerto Rican | 14,279 | 99.0% |
| South American | 19 | 0.1% |
| Spaniard | 17 | 0.1% |
| Subsaharan African | 11 | 0.1% |
| Thai | 19 | 0.1% |
| West Indian | 10 | 0.1% | View All 16 Rows |
Immigrants in Cayey

| Immigration Origin | # Population | % Population | View All 0 Rows |
Sex and Age in Cayey
Sex and Age in Cayey
The most populous age groups in Cayey are 55 to 59 Years (571 | 8.7%) for men and 45 to 49 Years (571 | 7.2%) for women.
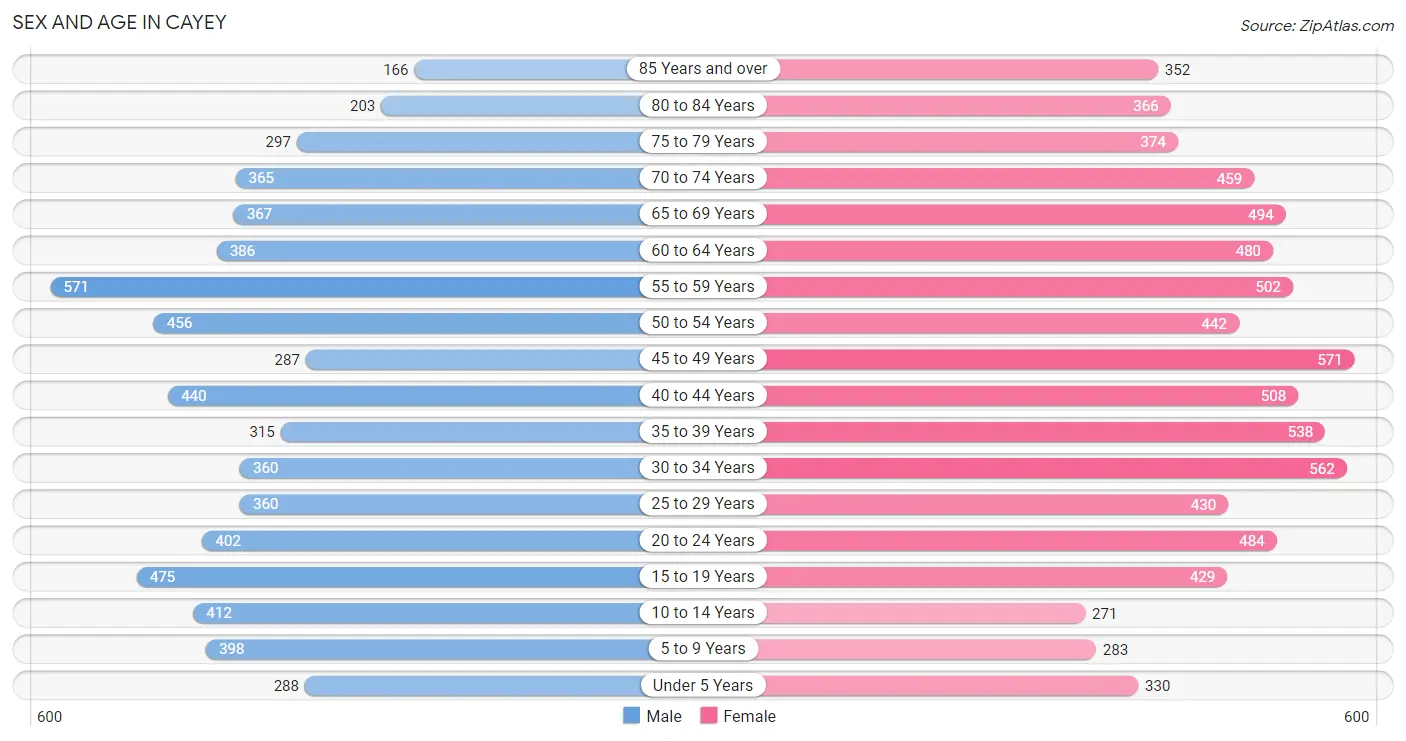
| Age Bracket | Male | Female |
| Under 5 Years | 288 (4.4%) | 330 (4.2%) |
| 5 to 9 Years | 398 (6.1%) | 283 (3.6%) |
| 10 to 14 Years | 412 (6.3%) | 271 (3.4%) |
| 15 to 19 Years | 475 (7.2%) | 429 (5.4%) |
| 20 to 24 Years | 402 (6.1%) | 484 (6.1%) |
| 25 to 29 Years | 360 (5.5%) | 430 (5.5%) |
| 30 to 34 Years | 360 (5.5%) | 562 (7.1%) |
| 35 to 39 Years | 315 (4.8%) | 538 (6.8%) |
| 40 to 44 Years | 440 (6.7%) | 508 (6.5%) |
| 45 to 49 Years | 287 (4.4%) | 571 (7.2%) |
| 50 to 54 Years | 456 (7.0%) | 442 (5.6%) |
| 55 to 59 Years | 571 (8.7%) | 502 (6.4%) |
| 60 to 64 Years | 386 (5.9%) | 480 (6.1%) |
| 65 to 69 Years | 367 (5.6%) | 494 (6.3%) |
| 70 to 74 Years | 365 (5.6%) | 459 (5.8%) |
| 75 to 79 Years | 297 (4.5%) | 374 (4.8%) |
| 80 to 84 Years | 203 (3.1%) | 366 (4.6%) |
| 85 Years and over | 166 (2.5%) | 352 (4.5%) |
| Total | 6,548 (100.0%) | 7,875 (100.0%) |
Families and Households in Cayey
Median Family Size in Cayey
The median family size in Cayey is 3.21 persons per family, with single male/father families (400 | 12.2%) accounting for the largest median family size of 3.4 persons per family. On the other hand, married-couple families (1,216 | 37.2%) represent the smallest median family size with 3.09 persons per family.
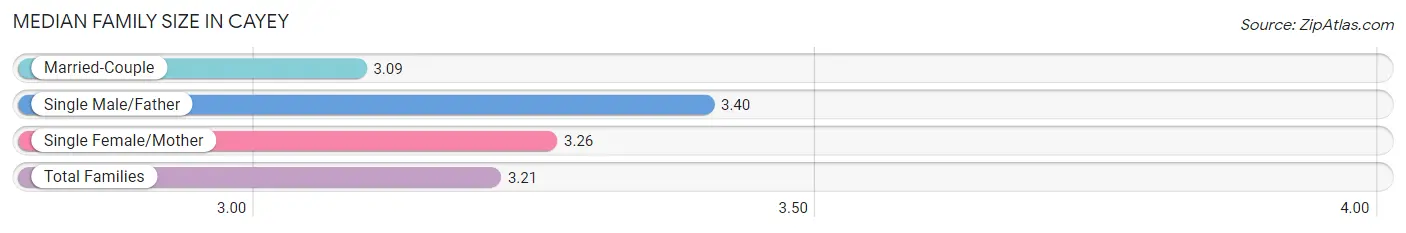
| Family Type | # Families | Family Size |
| Married-Couple | 1,216 (37.2%) | 3.09 |
| Single Male/Father | 400 (12.2%) | 3.40 |
| Single Female/Mother | 1,656 (50.6%) | 3.26 |
| Total Families | 3,272 (100.0%) | 3.21 |
Median Household Size in Cayey
The median household size in Cayey is 2.34 persons per household, with single male/father households (400 | 6.5%) accounting for the largest median household size of 3.87 persons per household. non-family households (2,856 | 46.6%) represent the smallest median household size with 1.16 persons per household.
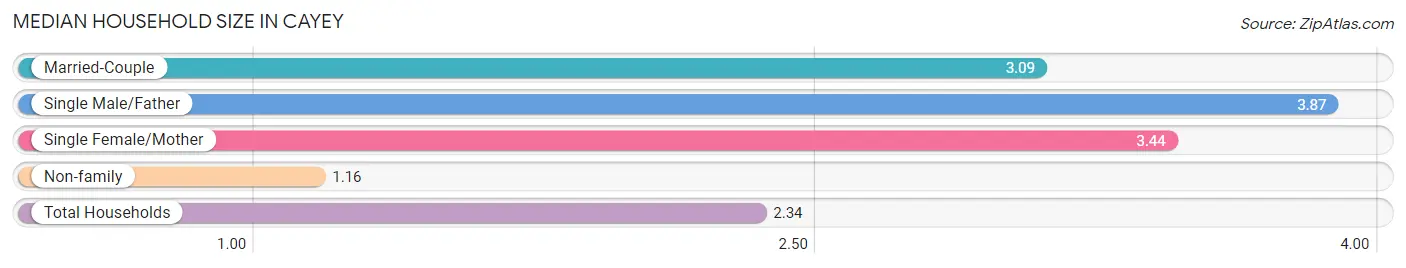
| Household Type | # Households | Household Size |
| Married-Couple | 1,216 (19.8%) | 3.09 |
| Single Male/Father | 400 (6.5%) | 3.87 |
| Single Female/Mother | 1,656 (27.0%) | 3.44 |
| Non-family | 2,856 (46.6%) | 1.16 |
| Total Households | 6,128 (100.0%) | 2.34 |
Household Size by Marriage Status in Cayey
Out of a total of 6,128 households in Cayey, 3,272 (53.4%) are family households, while 2,856 (46.6%) are nonfamily households. The most numerous type of family households are 2-person households, comprising 1,401, and the most common type of nonfamily households are 1-person households, comprising 2,453.
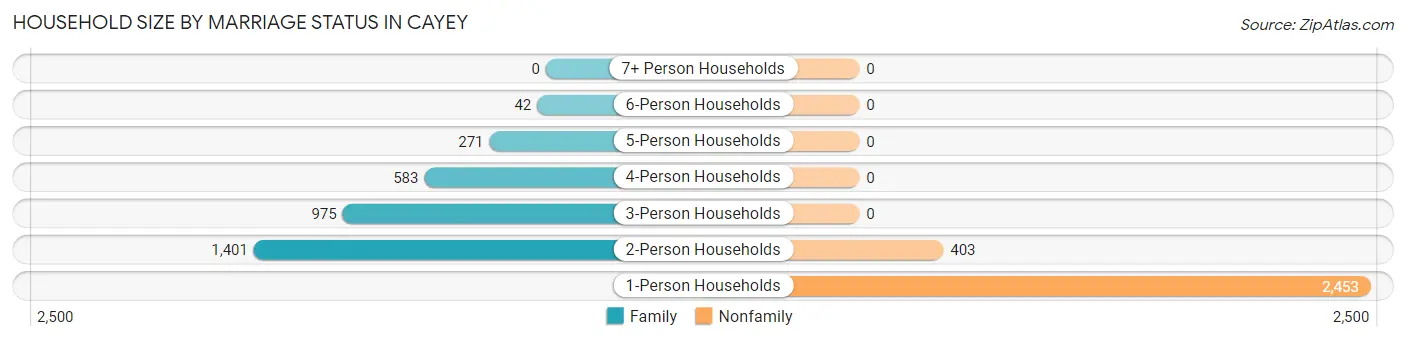
| Household Size | Family Households | Nonfamily Households |
| 1-Person Households | - | 2,453 (40.0%) |
| 2-Person Households | 1,401 (22.9%) | 403 (6.6%) |
| 3-Person Households | 975 (15.9%) | 0 (0.0%) |
| 4-Person Households | 583 (9.5%) | 0 (0.0%) |
| 5-Person Households | 271 (4.4%) | 0 (0.0%) |
| 6-Person Households | 42 (0.7%) | 0 (0.0%) |
| 7+ Person Households | 0 (0.0%) | 0 (0.0%) |
| Total | 3,272 (53.4%) | 2,856 (46.6%) |
Female Fertility in Cayey
Fertility by Age in Cayey
Average fertility rate in Cayey is 29.0 births per 1,000 women. Women in the age bracket of 20 to 34 years have the highest fertility rate with 64.0 births per 1,000 women. Women in the age bracket of 20 to 34 years acount for 88.7% of all women with births.
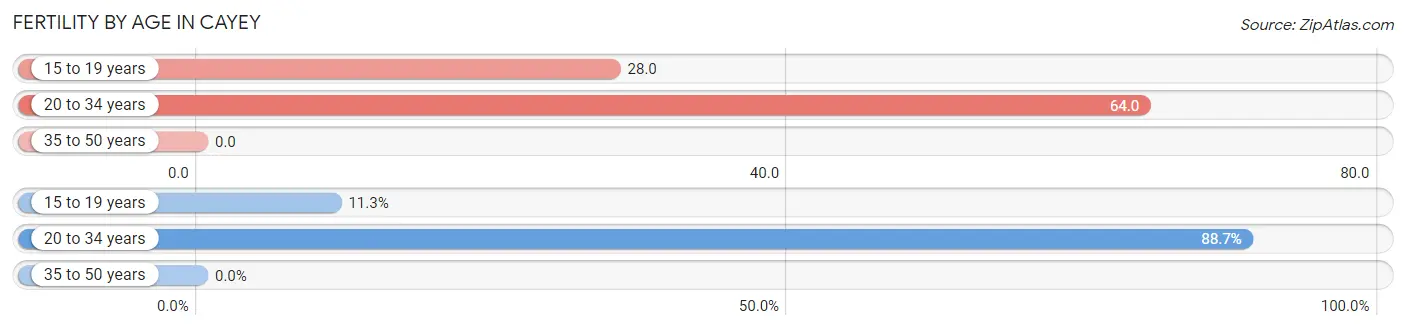
| Age Bracket | Women with Births | Births / 1,000 Women |
| 15 to 19 years | 12 (11.3%) | 28.0 |
| 20 to 34 years | 94 (88.7%) | 64.0 |
| 35 to 50 years | 0 (0.0%) | 0.0 |
| Total | 106 (100.0%) | 29.0 |
Fertility by Age by Marriage Status in Cayey
11.3% of women with births (106) in Cayey are married. The highest percentage of unmarried women with births falls into 15 to 19 years age bracket with 100.0% of them unmarried at the time of birth, while the lowest percentage of unmarried women with births belong to 20 to 34 years age bracket with 87.2% of them unmarried.
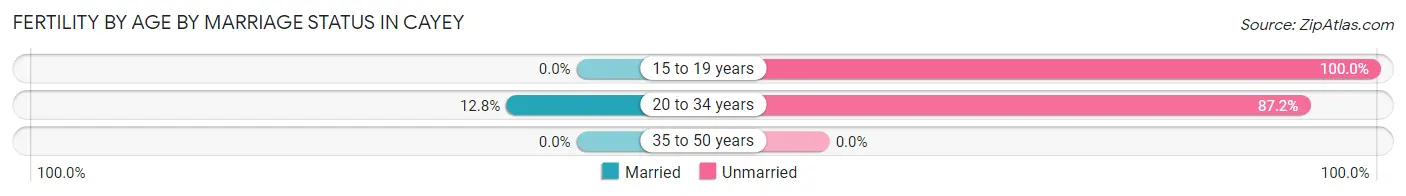
| Age Bracket | Married | Unmarried |
| 15 to 19 years | 0 (0.0%) | 12 (100.0%) |
| 20 to 34 years | 12 (12.8%) | 82 (87.2%) |
| 35 to 50 years | 0 (0.0%) | 0 (0.0%) |
| Total | 12 (11.3%) | 94 (88.7%) |
Fertility by Education in Cayey
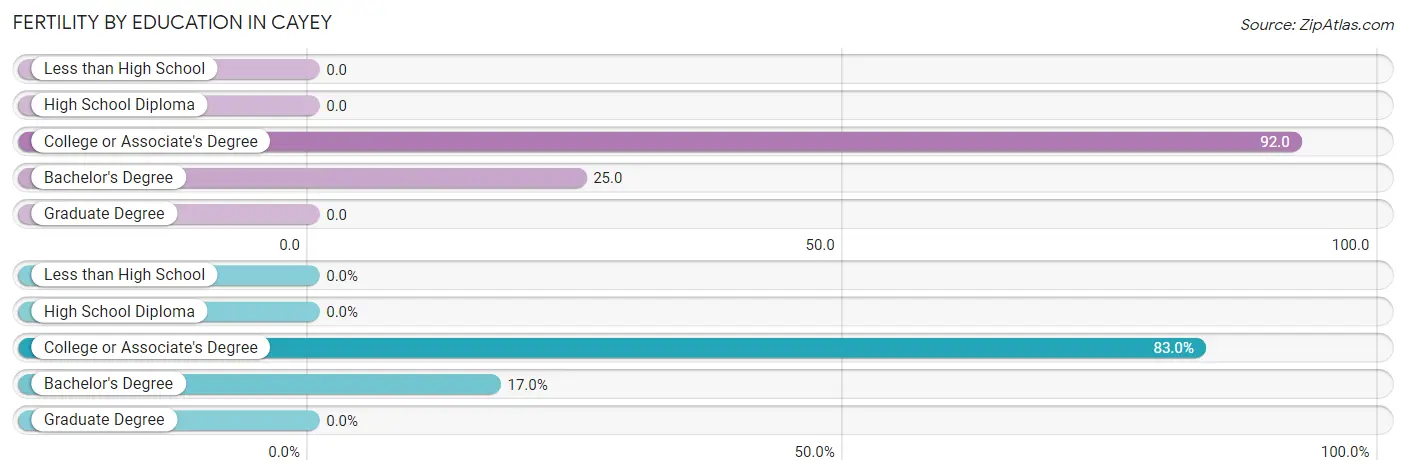
| Educational Attainment | Women with Births | Births / 1,000 Women |
| Less than High School | 0 (0.0%) | 0.0 |
| High School Diploma | 0 (0.0%) | 0.0 |
| College or Associate's Degree | 88 (83.0%) | 92.0 |
| Bachelor's Degree | 18 (17.0%) | 25.0 |
| Graduate Degree | 0 (0.0%) | 0.0 |
| Total | 106 (100.0%) | 29.0 |
Fertility by Education by Marriage Status in Cayey
88.7% of women with births in Cayey are unmarried. Women with the educational attainment of college or associate's degree are most likely to be married with 13.6% of them married at childbirth, while women with the educational attainment of bachelor's degree are least likely to be married with 100.0% of them unmarried at childbirth.
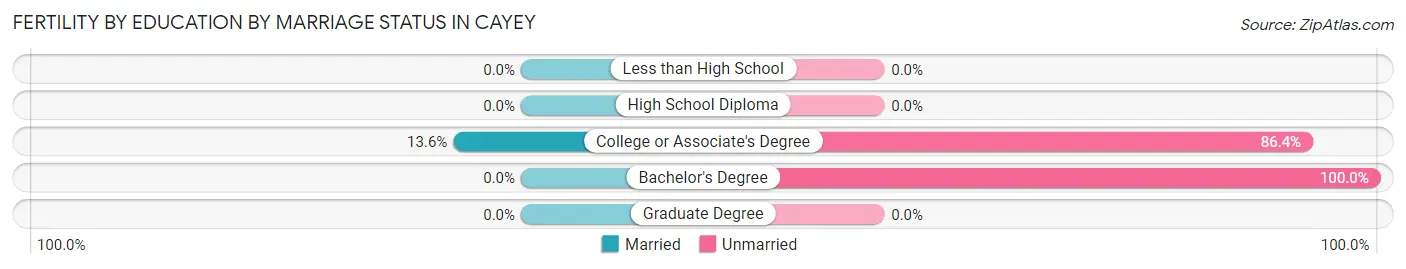
| Educational Attainment | Married | Unmarried |
| Less than High School | 0 (0.0%) | 0 (0.0%) |
| High School Diploma | 0 (0.0%) | 0 (0.0%) |
| College or Associate's Degree | 12 (13.6%) | 76 (86.4%) |
| Bachelor's Degree | 0 (0.0%) | 18 (100.0%) |
| Graduate Degree | 0 (0.0%) | 0 (0.0%) |
| Total | 12 (11.3%) | 94 (88.7%) |
Employment Characteristics in Cayey
Employment by Class of Employer in Cayey
Among the 4,105 employed individuals in Cayey, private company employees (2,372 | 57.8%), state government employees (553 | 13.5%), and self-employed (not incorporated) (470 | 11.5%) make up the most common classes of employment.
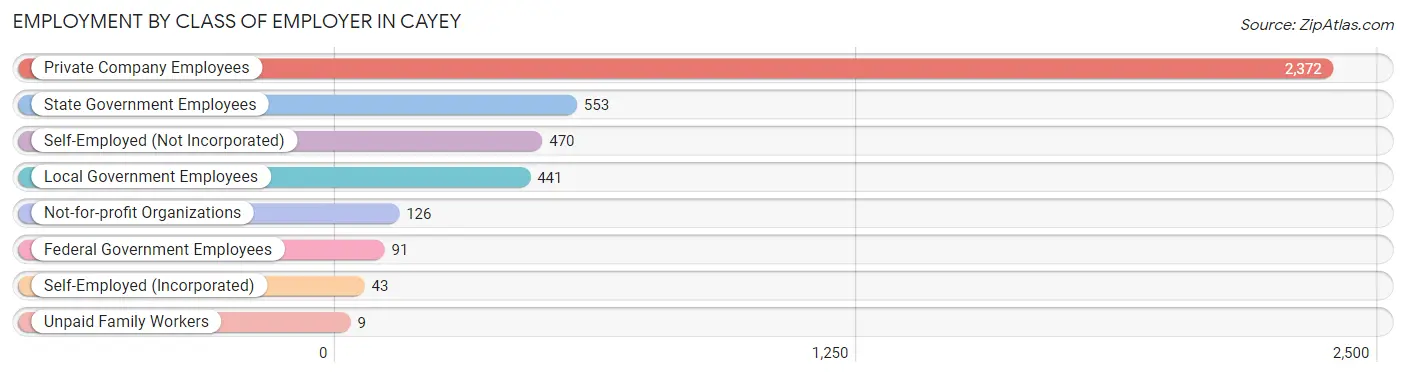
| Employer Class | # Employees | % Employees |
| Private Company Employees | 2,372 | 57.8% |
| Self-Employed (Incorporated) | 43 | 1.1% |
| Self-Employed (Not Incorporated) | 470 | 11.5% |
| Not-for-profit Organizations | 126 | 3.1% |
| Local Government Employees | 441 | 10.7% |
| State Government Employees | 553 | 13.5% |
| Federal Government Employees | 91 | 2.2% |
| Unpaid Family Workers | 9 | 0.2% |
| Total | 4,105 | 100.0% |
Employment Status by Age in Cayey
According to the labor force statistics for Cayey, out of the total population over 16 years of age (12,391), 36.0% or 4,461 individuals are in the labor force, with 7.3% or 326 of them unemployed. The age group with the highest labor force participation rate is 25 to 29 years, with 75.1% or 593 individuals in the labor force. Within the labor force, the 30 to 34 years age range has the highest percentage of unemployed individuals, with 13.4% or 91 of them being unemployed.
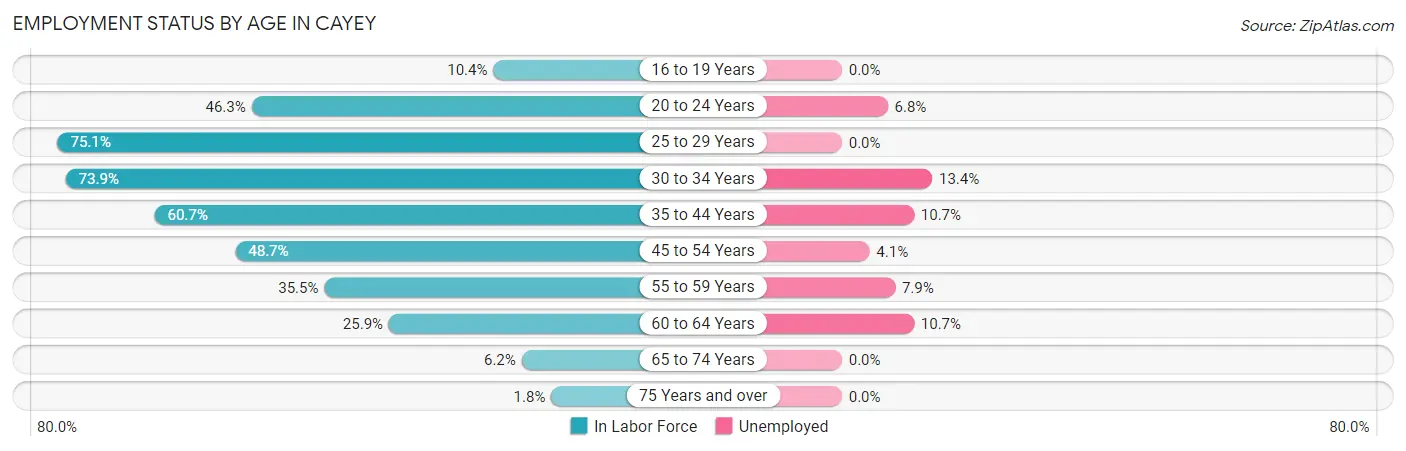
| Age Bracket | In Labor Force | Unemployed |
| 16 to 19 Years | 89 (10.4%) | 0 (0.0%) |
| 20 to 24 Years | 410 (46.3%) | 28 (6.8%) |
| 25 to 29 Years | 593 (75.1%) | 0 (0.0%) |
| 30 to 34 Years | 681 (73.9%) | 91 (13.4%) |
| 35 to 44 Years | 1,093 (60.7%) | 117 (10.7%) |
| 45 to 54 Years | 855 (48.7%) | 35 (4.1%) |
| 55 to 59 Years | 381 (35.5%) | 30 (7.9%) |
| 60 to 64 Years | 224 (25.9%) | 24 (10.7%) |
| 65 to 74 Years | 104 (6.2%) | 0 (0.0%) |
| 75 Years and over | 32 (1.8%) | 0 (0.0%) |
| Total | 4,461 (36.0%) | 326 (7.3%) |
Employment Status by Educational Attainment in Cayey
According to labor force statistics for Cayey, 53.1% of individuals (3,827) out of the total population between 25 and 64 years of age (7,208) are in the labor force, with 7.8% or 299 of them being unemployed. The group with the highest labor force participation rate are those with the educational attainment of bachelor's degree or higher, with 72.3% or 1,158 individuals in the labor force. Within the labor force, individuals with less than high school education have the highest percentage of unemployment, with 13.3% or 40 of them being unemployed.
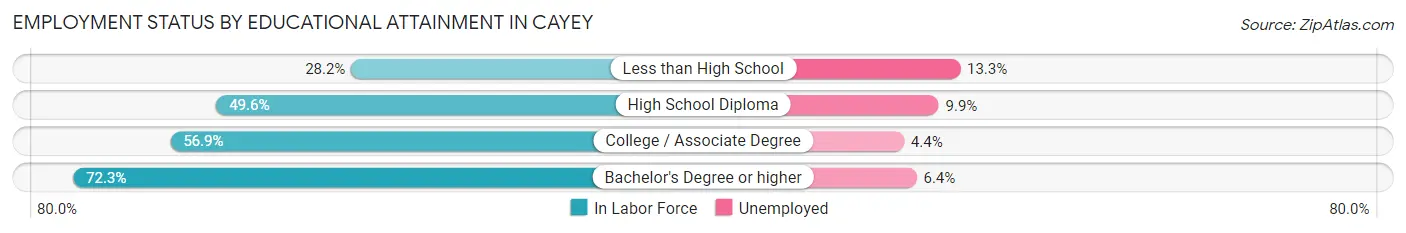
| Educational Attainment | In Labor Force | Unemployed |
| Less than High School | 300 (28.2%) | 142 (13.3%) |
| High School Diploma | 1,442 (49.6%) | 288 (9.9%) |
| College / Associate Degree | 930 (56.9%) | 72 (4.4%) |
| Bachelor's Degree or higher | 1,158 (72.3%) | 102 (6.4%) |
| Total | 3,827 (53.1%) | 562 (7.8%) |
Employment Occupations by Sex in Cayey
Management, Business, Science and Arts Occupations
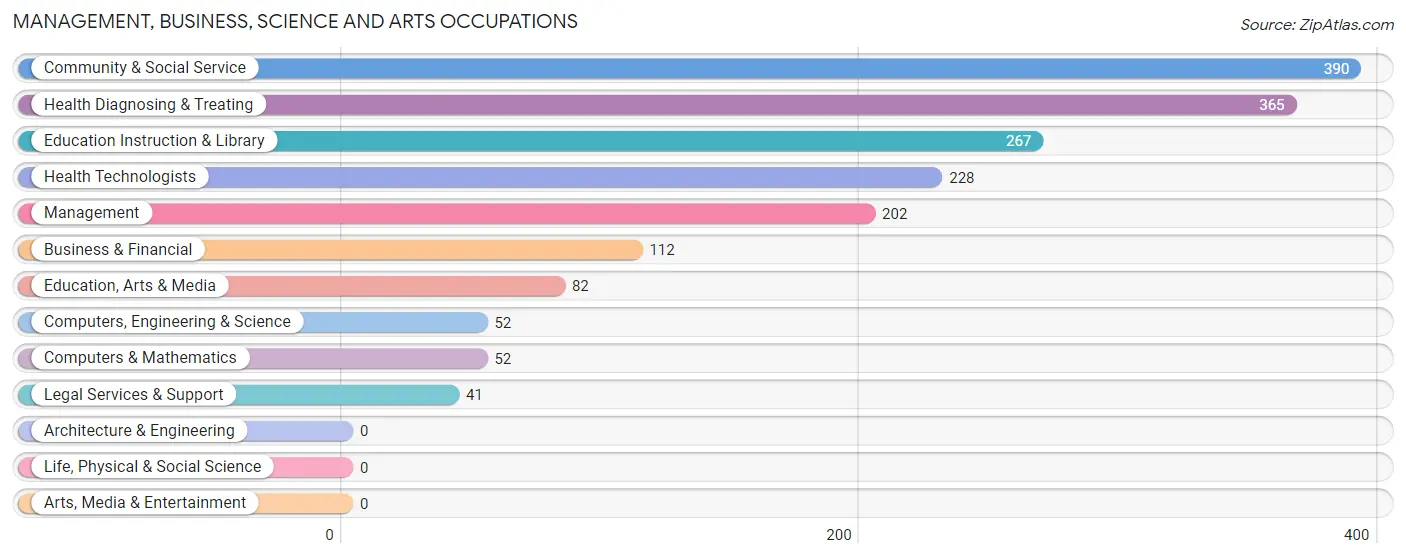
The most common Management, Business, Science and Arts occupations in Cayey are Community & Social Service (390 | 9.4%), Health Diagnosing & Treating (365 | 8.8%), Education Instruction & Library (267 | 6.5%), Health Technologists (228 | 5.5%), and Management (202 | 4.9%).
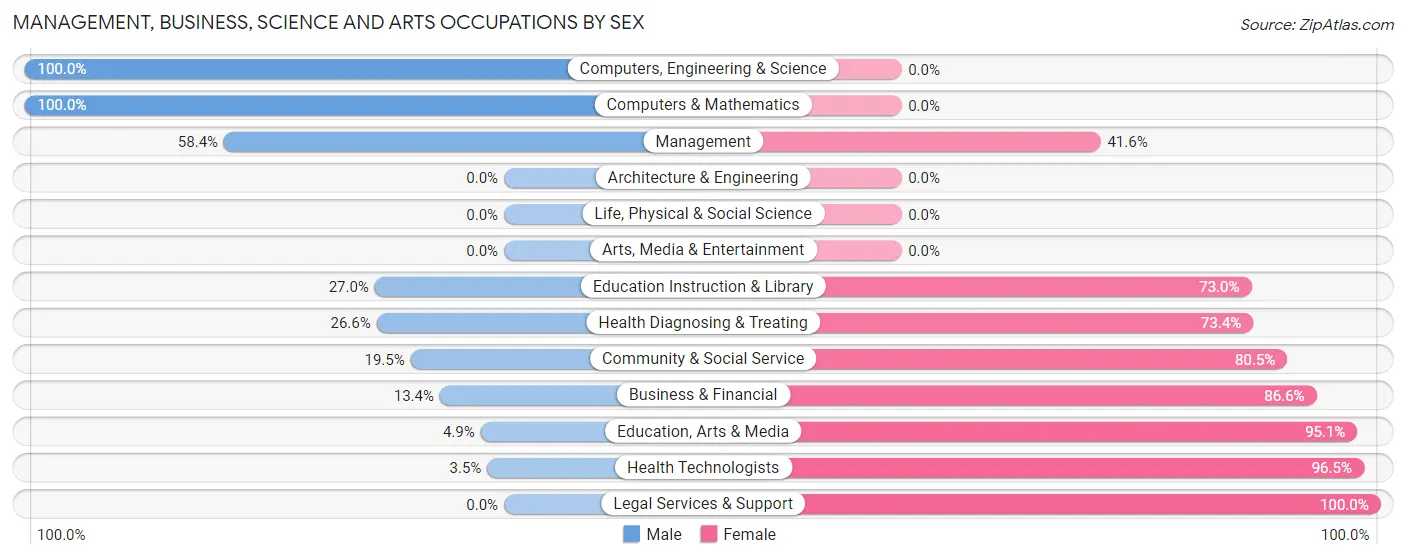
Management, Business, Science and Arts Occupations by Sex
Within the Management, Business, Science and Arts occupations in Cayey, the most male-oriented occupations are Computers, Engineering & Science (100.0%), Computers & Mathematics (100.0%), and Management (58.4%), while the most female-oriented occupations are Legal Services & Support (100.0%), Health Technologists (96.5%), and Education, Arts & Media (95.1%).
| Occupation | Male | Female |
| Management | 118 (58.4%) | 84 (41.6%) |
| Business & Financial | 15 (13.4%) | 97 (86.6%) |
| Computers, Engineering & Science | 52 (100.0%) | 0 (0.0%) |
| Computers & Mathematics | 52 (100.0%) | 0 (0.0%) |
| Architecture & Engineering | 0 (0.0%) | 0 (0.0%) |
| Life, Physical & Social Science | 0 (0.0%) | 0 (0.0%) |
| Community & Social Service | 76 (19.5%) | 314 (80.5%) |
| Education, Arts & Media | 4 (4.9%) | 78 (95.1%) |
| Legal Services & Support | 0 (0.0%) | 41 (100.0%) |
| Education Instruction & Library | 72 (27.0%) | 195 (73.0%) |
| Arts, Media & Entertainment | 0 (0.0%) | 0 (0.0%) |
| Health Diagnosing & Treating | 97 (26.6%) | 268 (73.4%) |
| Health Technologists | 8 (3.5%) | 220 (96.5%) |
| Total (Category) | 358 (31.9%) | 763 (68.1%) |
| Total (Overall) | 2,012 (48.6%) | 2,127 (51.4%) |
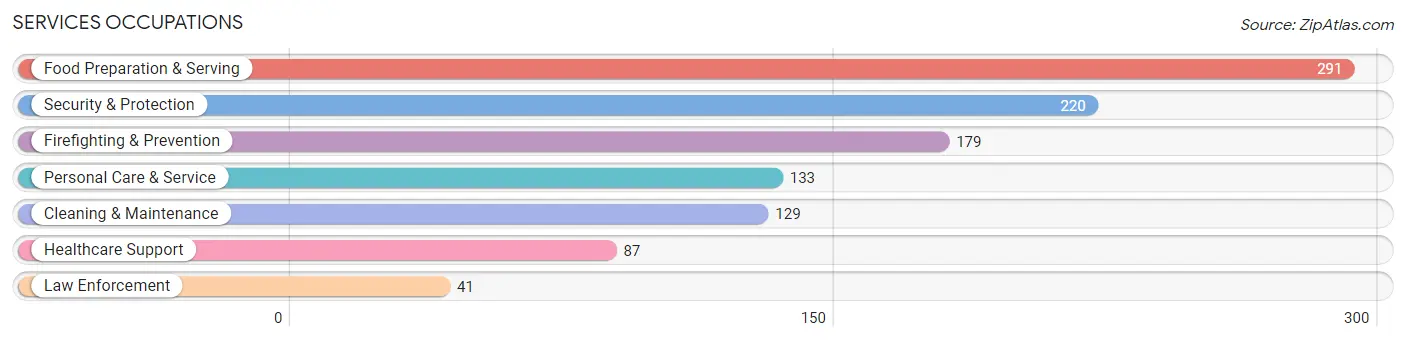
Services Occupations
The most common Services occupations in Cayey are Food Preparation & Serving (291 | 7.0%), Security & Protection (220 | 5.3%), Firefighting & Prevention (179 | 4.3%), Personal Care & Service (133 | 3.2%), and Cleaning & Maintenance (129 | 3.1%).
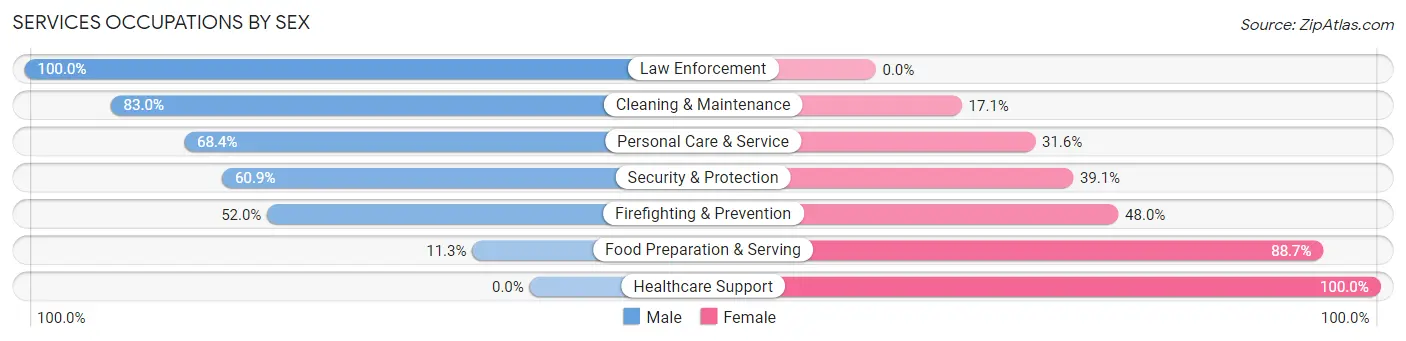
Services Occupations by Sex
Within the Services occupations in Cayey, the most male-oriented occupations are Law Enforcement (100.0%), Cleaning & Maintenance (83.0%), and Personal Care & Service (68.4%), while the most female-oriented occupations are Healthcare Support (100.0%), Food Preparation & Serving (88.7%), and Firefighting & Prevention (48.0%).
| Occupation | Male | Female |
| Healthcare Support | 0 (0.0%) | 87 (100.0%) |
| Security & Protection | 134 (60.9%) | 86 (39.1%) |
| Firefighting & Prevention | 93 (52.0%) | 86 (48.0%) |
| Law Enforcement | 41 (100.0%) | 0 (0.0%) |
| Food Preparation & Serving | 33 (11.3%) | 258 (88.7%) |
| Cleaning & Maintenance | 107 (83.0%) | 22 (17.1%) |
| Personal Care & Service | 91 (68.4%) | 42 (31.6%) |
| Total (Category) | 365 (42.4%) | 495 (57.6%) |
| Total (Overall) | 2,012 (48.6%) | 2,127 (51.4%) |
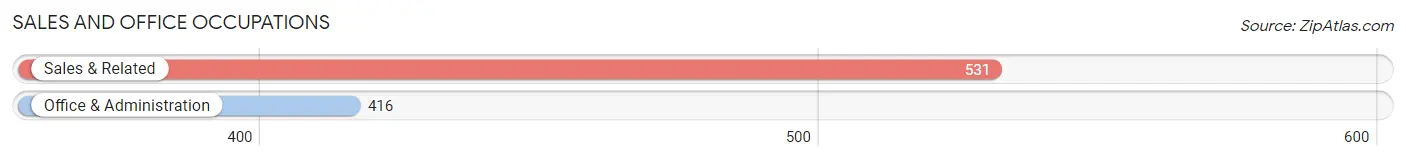
Sales and Office Occupations
The most common Sales and Office occupations in Cayey are Sales & Related (531 | 12.8%), and Office & Administration (416 | 10.1%).
Sales and Office Occupations by Sex
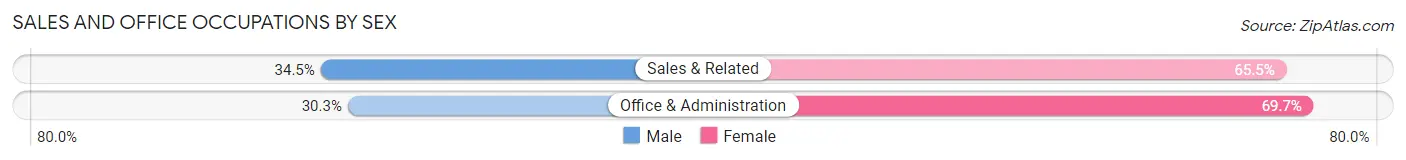
| Occupation | Male | Female |
| Sales & Related | 183 (34.5%) | 348 (65.5%) |
| Office & Administration | 126 (30.3%) | 290 (69.7%) |
| Total (Category) | 309 (32.6%) | 638 (67.4%) |
| Total (Overall) | 2,012 (48.6%) | 2,127 (51.4%) |
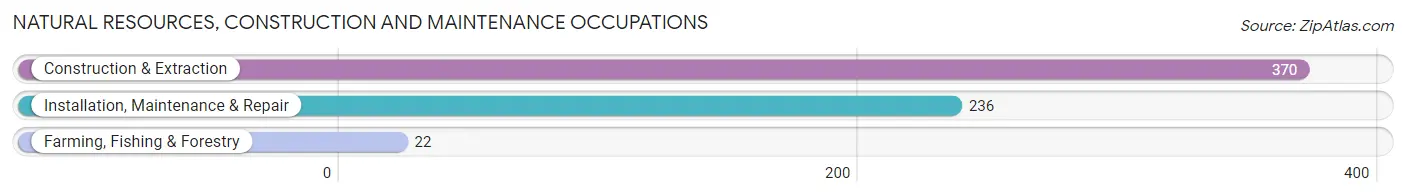
Natural Resources, Construction and Maintenance Occupations
The most common Natural Resources, Construction and Maintenance occupations in Cayey are Construction & Extraction (370 | 8.9%), Installation, Maintenance & Repair (236 | 5.7%), and Farming, Fishing & Forestry (22 | 0.5%).
Natural Resources, Construction and Maintenance Occupations by Sex
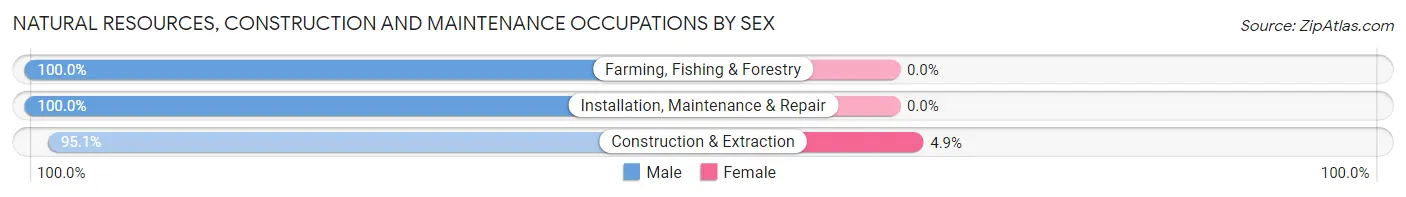
| Occupation | Male | Female |
| Farming, Fishing & Forestry | 22 (100.0%) | 0 (0.0%) |
| Construction & Extraction | 352 (95.1%) | 18 (4.9%) |
| Installation, Maintenance & Repair | 236 (100.0%) | 0 (0.0%) |
| Total (Category) | 610 (97.1%) | 18 (2.9%) |
| Total (Overall) | 2,012 (48.6%) | 2,127 (51.4%) |
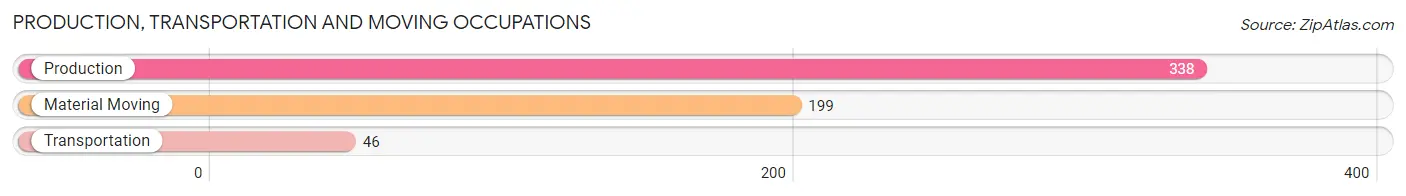
Production, Transportation and Moving Occupations
The most common Production, Transportation and Moving occupations in Cayey are Production (338 | 8.2%), Material Moving (199 | 4.8%), and Transportation (46 | 1.1%).
Production, Transportation and Moving Occupations by Sex
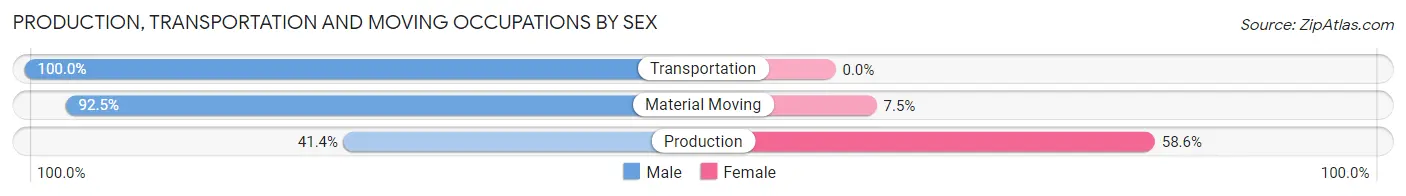
| Occupation | Male | Female |
| Production | 140 (41.4%) | 198 (58.6%) |
| Transportation | 46 (100.0%) | 0 (0.0%) |
| Material Moving | 184 (92.5%) | 15 (7.5%) |
| Total (Category) | 370 (63.5%) | 213 (36.5%) |
| Total (Overall) | 2,012 (48.6%) | 2,127 (51.4%) |
Employment Industries by Sex in Cayey
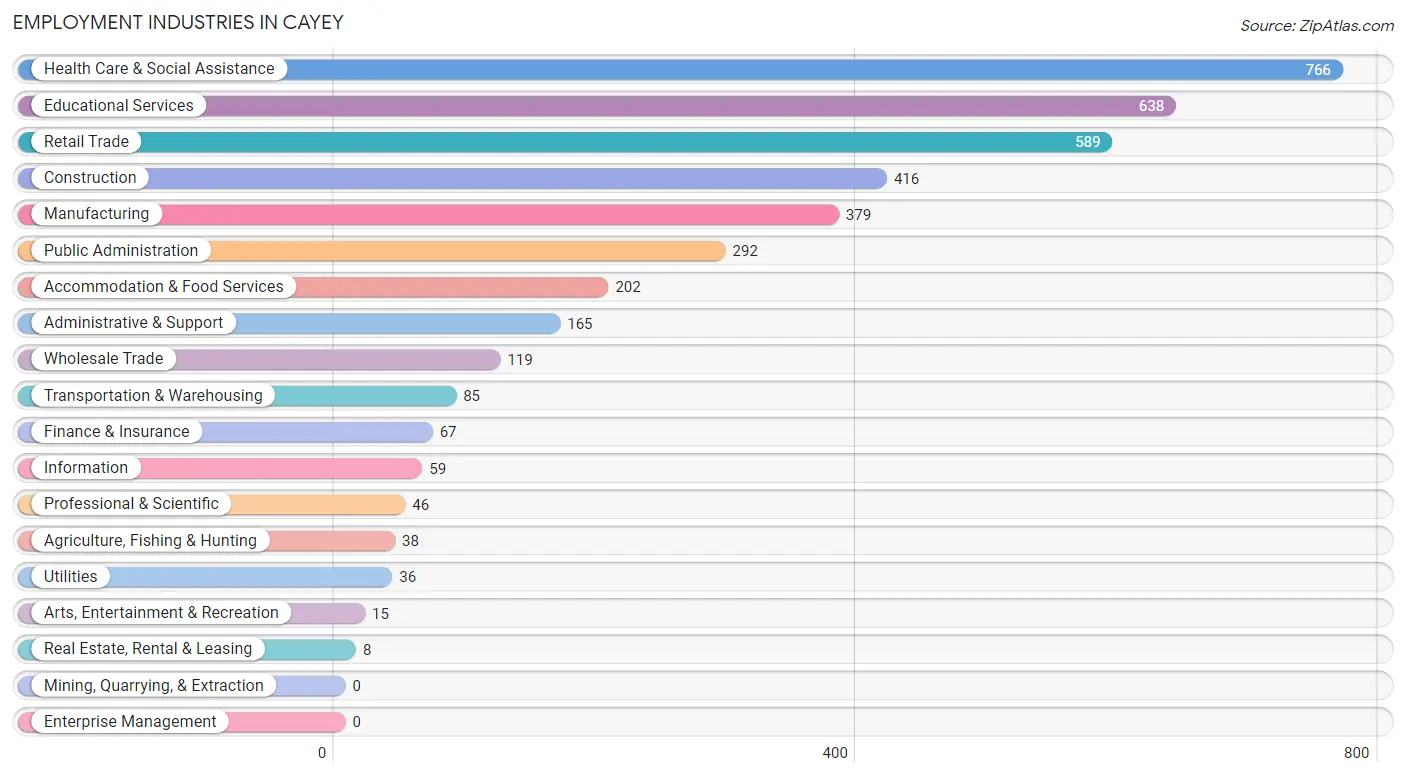
Employment Industries in Cayey
The major employment industries in Cayey include Health Care & Social Assistance (766 | 18.5%), Educational Services (638 | 15.4%), Retail Trade (589 | 14.2%), Construction (416 | 10.1%), and Manufacturing (379 | 9.2%).
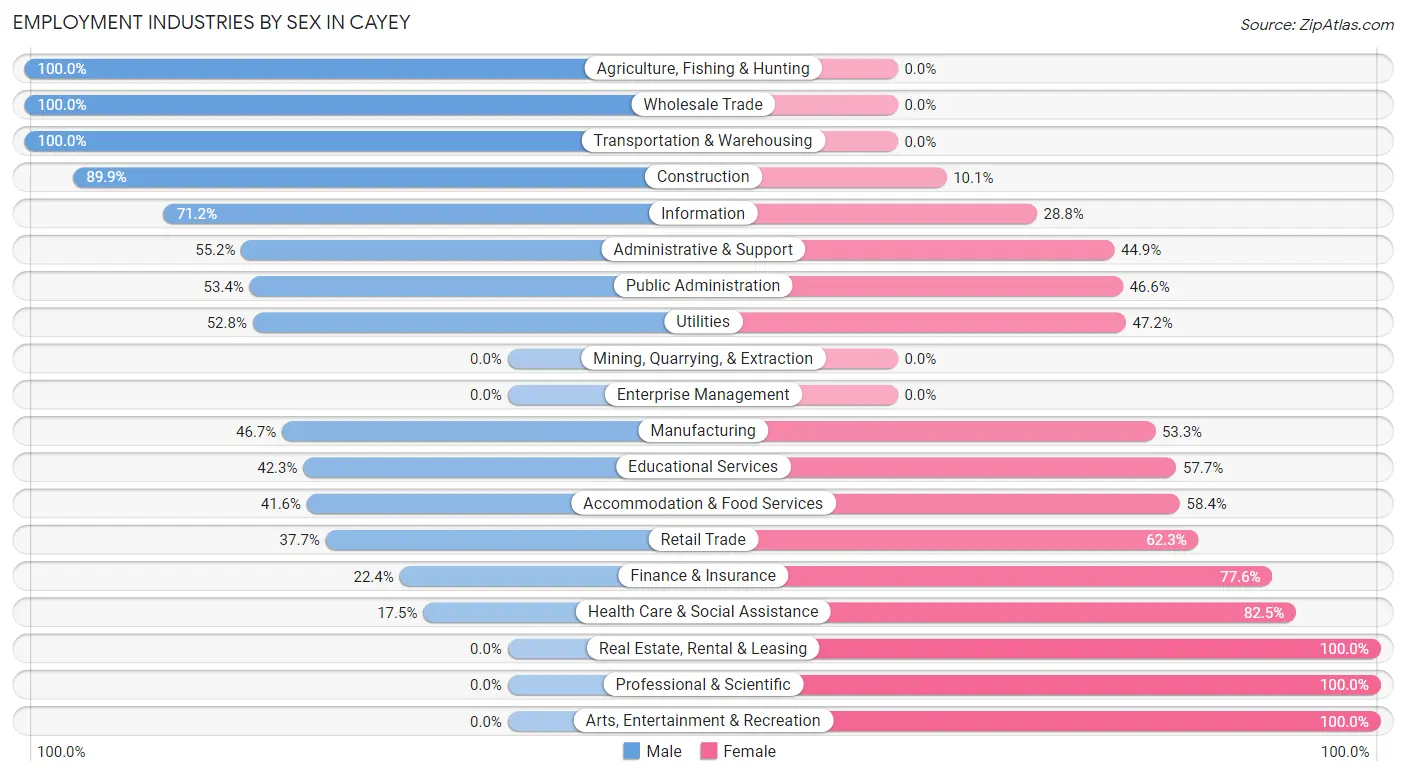
Employment Industries by Sex in Cayey
The Cayey industries that see more men than women are Agriculture, Fishing & Hunting (100.0%), Wholesale Trade (100.0%), and Transportation & Warehousing (100.0%), whereas the industries that tend to have a higher number of women are Real Estate, Rental & Leasing (100.0%), Professional & Scientific (100.0%), and Arts, Entertainment & Recreation (100.0%).
| Industry | Male | Female |
| Agriculture, Fishing & Hunting | 38 (100.0%) | 0 (0.0%) |
| Mining, Quarrying, & Extraction | 0 (0.0%) | 0 (0.0%) |
| Construction | 374 (89.9%) | 42 (10.1%) |
| Manufacturing | 177 (46.7%) | 202 (53.3%) |
| Wholesale Trade | 119 (100.0%) | 0 (0.0%) |
| Retail Trade | 222 (37.7%) | 367 (62.3%) |
| Transportation & Warehousing | 85 (100.0%) | 0 (0.0%) |
| Utilities | 19 (52.8%) | 17 (47.2%) |
| Information | 42 (71.2%) | 17 (28.8%) |
| Finance & Insurance | 15 (22.4%) | 52 (77.6%) |
| Real Estate, Rental & Leasing | 0 (0.0%) | 8 (100.0%) |
| Professional & Scientific | 0 (0.0%) | 46 (100.0%) |
| Enterprise Management | 0 (0.0%) | 0 (0.0%) |
| Administrative & Support | 91 (55.1%) | 74 (44.9%) |
| Educational Services | 270 (42.3%) | 368 (57.7%) |
| Health Care & Social Assistance | 134 (17.5%) | 632 (82.5%) |
| Arts, Entertainment & Recreation | 0 (0.0%) | 15 (100.0%) |
| Accommodation & Food Services | 84 (41.6%) | 118 (58.4%) |
| Public Administration | 156 (53.4%) | 136 (46.6%) |
| Total | 2,012 (48.6%) | 2,127 (51.4%) |
Education in Cayey
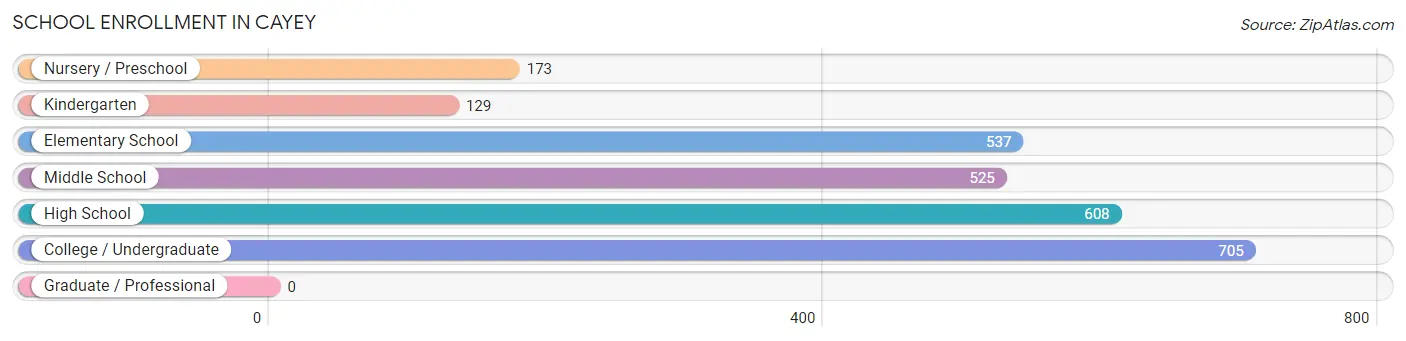
School Enrollment in Cayey
The most common levels of schooling among the 2,677 students in Cayey are college / undergraduate (705 | 26.3%), high school (608 | 22.7%), and elementary school (537 | 20.1%).
| School Level | # Students | % Students |
| Nursery / Preschool | 173 | 6.5% |
| Kindergarten | 129 | 4.8% |
| Elementary School | 537 | 20.1% |
| Middle School | 525 | 19.6% |
| High School | 608 | 22.7% |
| College / Undergraduate | 705 | 26.3% |
| Graduate / Professional | 0 | 0.0% |
| Total | 2,677 | 100.0% |
School Enrollment by Age by Funding Source in Cayey
Out of a total of 2,677 students who are enrolled in schools in Cayey, 675 (25.2%) attend a private institution, while the remaining 2,002 (74.8%) are enrolled in public schools. The age group of 35 years and over has the highest likelihood of being enrolled in private schools, with 68 (89.5% in the age bracket) enrolled. Conversely, the age group of 3 to 4 year olds has the lowest likelihood of being enrolled in a private school, with 153 (100.0% in the age bracket) attending a public institution.
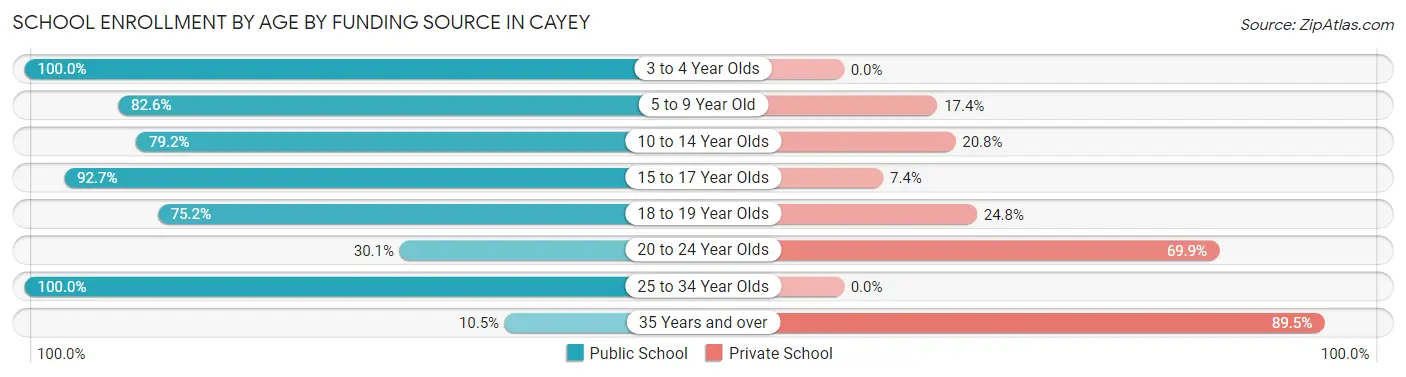
| Age Bracket | Public School | Private School |
| 3 to 4 Year Olds | 153 (100.0%) | 0 (0.0%) |
| 5 to 9 Year Old | 545 (82.6%) | 115 (17.4%) |
| 10 to 14 Year Olds | 541 (79.2%) | 142 (20.8%) |
| 15 to 17 Year Olds | 441 (92.6%) | 35 (7.3%) |
| 18 to 19 Year Olds | 188 (75.2%) | 62 (24.8%) |
| 20 to 24 Year Olds | 109 (30.1%) | 253 (69.9%) |
| 25 to 34 Year Olds | 17 (100.0%) | 0 (0.0%) |
| 35 Years and over | 8 (10.5%) | 68 (89.5%) |
| Total | 2,002 (74.8%) | 675 (25.2%) |
Educational Attainment by Field of Study in Cayey
Education (592 | 26.4%), business (448 | 20.0%), science & technology (334 | 14.9%), social sciences (148 | 6.6%), and psychology (136 | 6.1%) are the most common fields of study among 2,246 individuals in Cayey who have obtained a bachelor's degree or higher.
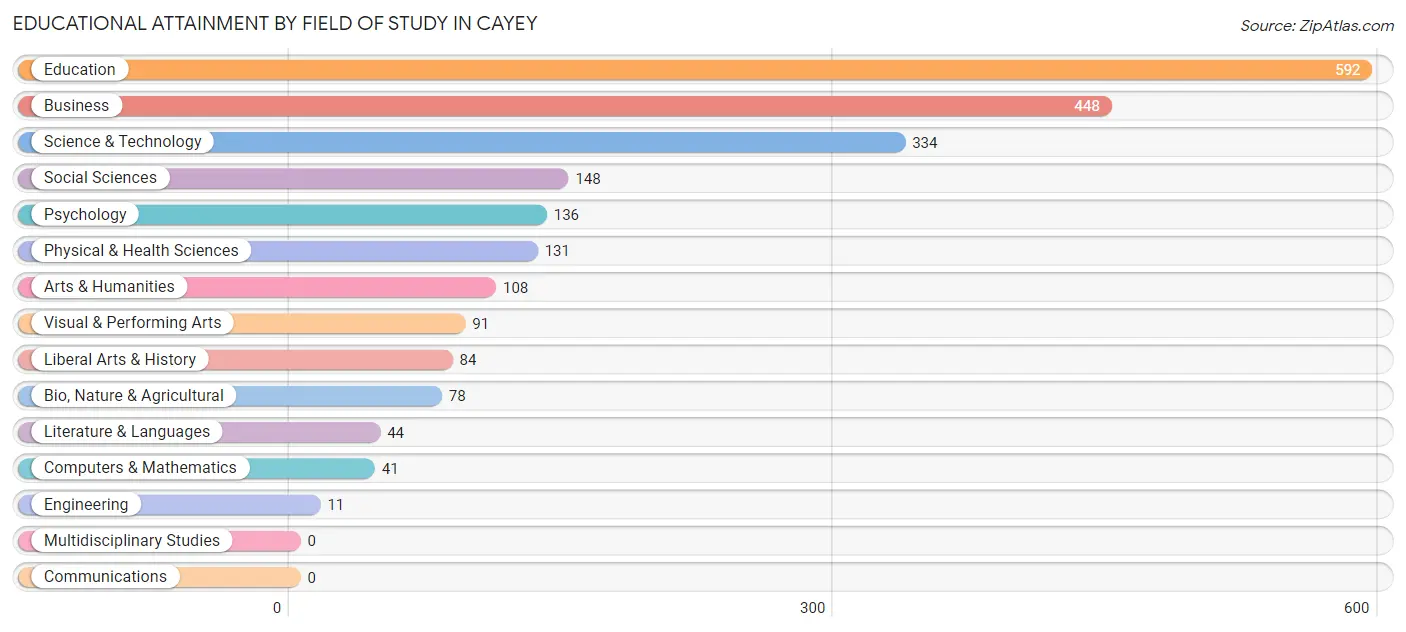
| Field of Study | # Graduates | % Graduates |
| Computers & Mathematics | 41 | 1.8% |
| Bio, Nature & Agricultural | 78 | 3.5% |
| Physical & Health Sciences | 131 | 5.8% |
| Psychology | 136 | 6.1% |
| Social Sciences | 148 | 6.6% |
| Engineering | 11 | 0.5% |
| Multidisciplinary Studies | 0 | 0.0% |
| Science & Technology | 334 | 14.9% |
| Business | 448 | 20.0% |
| Education | 592 | 26.4% |
| Literature & Languages | 44 | 2.0% |
| Liberal Arts & History | 84 | 3.7% |
| Visual & Performing Arts | 91 | 4.1% |
| Communications | 0 | 0.0% |
| Arts & Humanities | 108 | 4.8% |
| Total | 2,246 | 100.0% |
Transportation & Commute in Cayey
Vehicle Availability by Sex in Cayey
The most prevalent vehicle ownership categories in Cayey are males with 2 vehicles (995, accounting for 49.6%) and females with 2 vehicles (759, making up 47.6%).
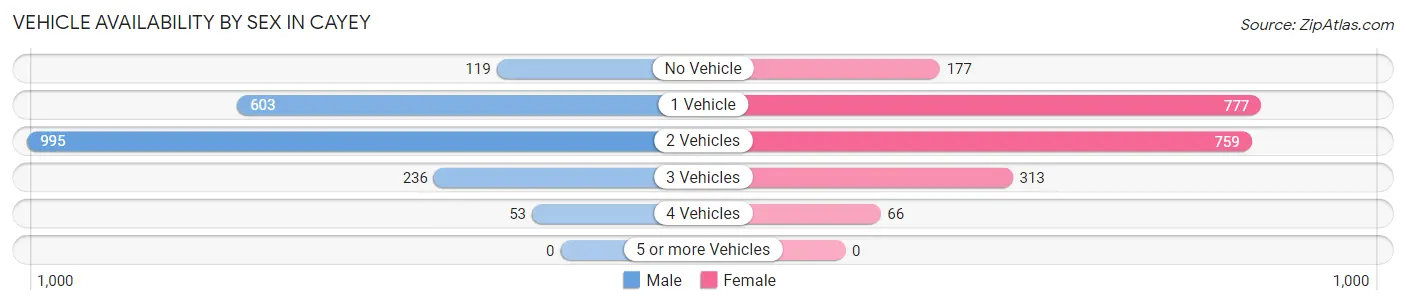
| Vehicles Available | Male | Female |
| No Vehicle | 119 (5.9%) | 177 (8.5%) |
| 1 Vehicle | 603 (30.1%) | 777 (37.1%) |
| 2 Vehicles | 995 (49.6%) | 759 (36.3%) |
| 3 Vehicles | 236 (11.8%) | 313 (15.0%) |
| 4 Vehicles | 53 (2.6%) | 66 (3.2%) |
| 5 or more Vehicles | 0 (0.0%) | 0 (0.0%) |
| Total | 2,006 (100.0%) | 2,092 (100.0%) |
Commute Time in Cayey
The most frequently occuring commute durations in Cayey are 10 to 14 minutes (973 commuters, 23.7%), 5 to 9 minutes (768 commuters, 18.8%), and 15 to 19 minutes (730 commuters, 17.8%).
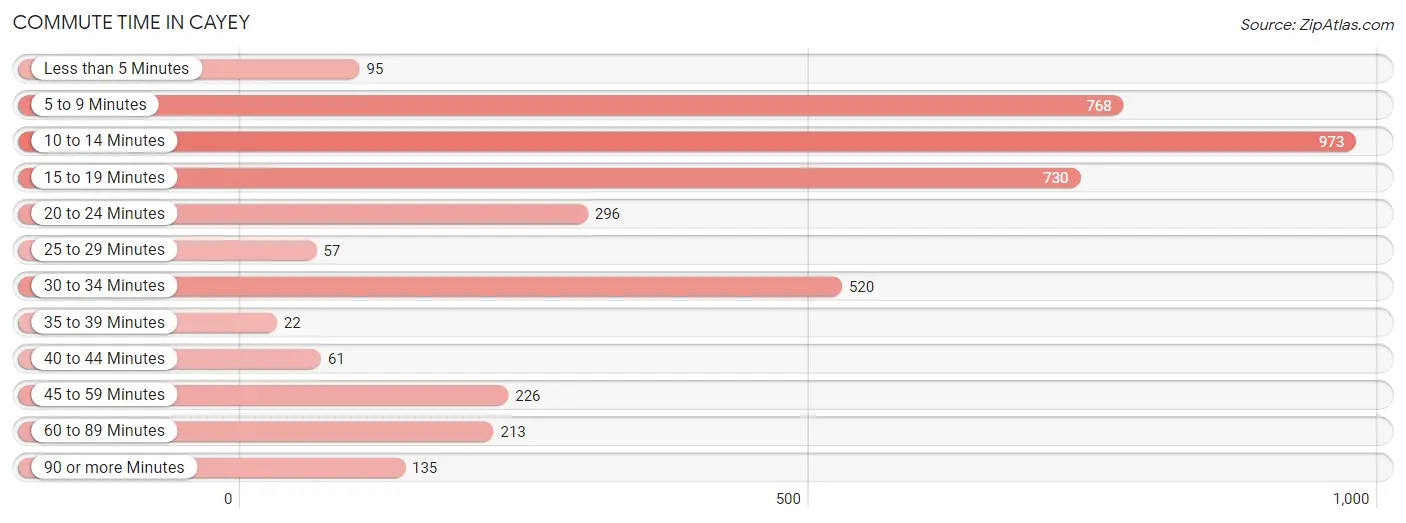
| Commute Time | # Commuters | % Commuters |
| Less than 5 Minutes | 95 | 2.3% |
| 5 to 9 Minutes | 768 | 18.8% |
| 10 to 14 Minutes | 973 | 23.7% |
| 15 to 19 Minutes | 730 | 17.8% |
| 20 to 24 Minutes | 296 | 7.2% |
| 25 to 29 Minutes | 57 | 1.4% |
| 30 to 34 Minutes | 520 | 12.7% |
| 35 to 39 Minutes | 22 | 0.5% |
| 40 to 44 Minutes | 61 | 1.5% |
| 45 to 59 Minutes | 226 | 5.5% |
| 60 to 89 Minutes | 213 | 5.2% |
| 90 or more Minutes | 135 | 3.3% |
Commute Time by Sex in Cayey
The most common commute times in Cayey are 10 to 14 minutes (446 commuters, 22.3%) for males and 10 to 14 minutes (527 commuters, 25.2%) for females.
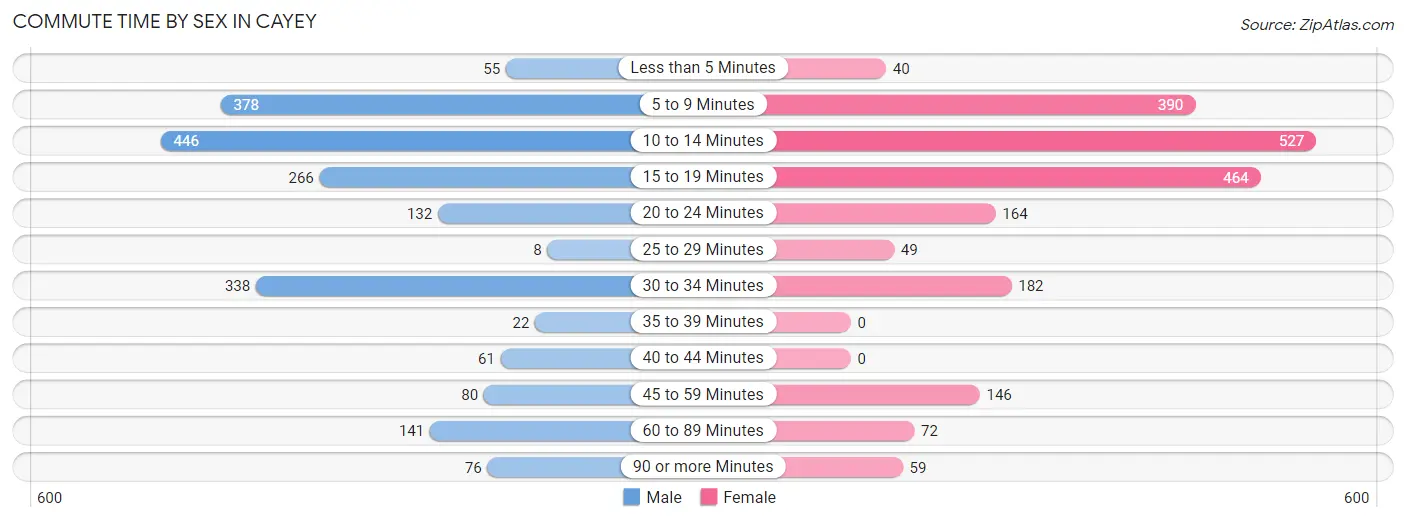
| Commute Time | Male | Female |
| Less than 5 Minutes | 55 (2.8%) | 40 (1.9%) |
| 5 to 9 Minutes | 378 (18.9%) | 390 (18.6%) |
| 10 to 14 Minutes | 446 (22.3%) | 527 (25.2%) |
| 15 to 19 Minutes | 266 (13.3%) | 464 (22.2%) |
| 20 to 24 Minutes | 132 (6.6%) | 164 (7.8%) |
| 25 to 29 Minutes | 8 (0.4%) | 49 (2.3%) |
| 30 to 34 Minutes | 338 (16.9%) | 182 (8.7%) |
| 35 to 39 Minutes | 22 (1.1%) | 0 (0.0%) |
| 40 to 44 Minutes | 61 (3.0%) | 0 (0.0%) |
| 45 to 59 Minutes | 80 (4.0%) | 146 (7.0%) |
| 60 to 89 Minutes | 141 (7.0%) | 72 (3.4%) |
| 90 or more Minutes | 76 (3.8%) | 59 (2.8%) |
Time of Departure to Work by Sex in Cayey
The most frequent times of departure to work in Cayey are 6:30 AM to 6:59 AM (275, 13.7%) for males and 7:00 AM to 7:29 AM (440, 21.0%) for females.
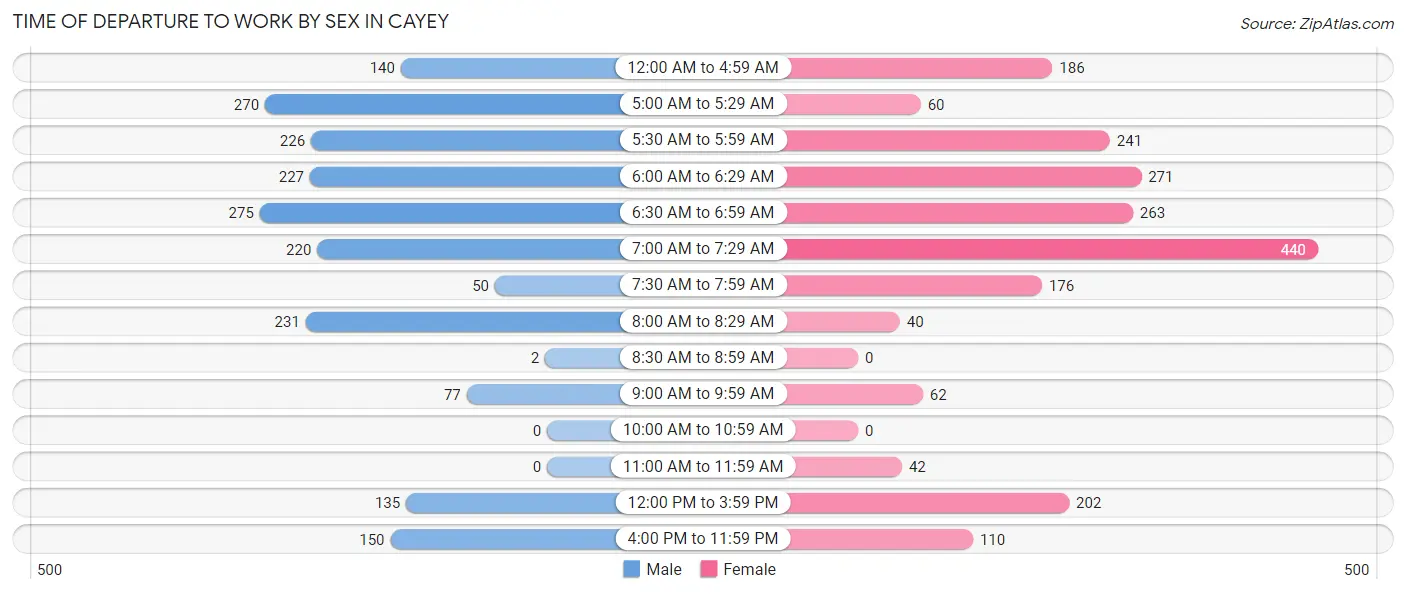
| Time of Departure | Male | Female |
| 12:00 AM to 4:59 AM | 140 (7.0%) | 186 (8.9%) |
| 5:00 AM to 5:29 AM | 270 (13.5%) | 60 (2.9%) |
| 5:30 AM to 5:59 AM | 226 (11.3%) | 241 (11.5%) |
| 6:00 AM to 6:29 AM | 227 (11.3%) | 271 (13.0%) |
| 6:30 AM to 6:59 AM | 275 (13.7%) | 263 (12.6%) |
| 7:00 AM to 7:29 AM | 220 (11.0%) | 440 (21.0%) |
| 7:30 AM to 7:59 AM | 50 (2.5%) | 176 (8.4%) |
| 8:00 AM to 8:29 AM | 231 (11.5%) | 40 (1.9%) |
| 8:30 AM to 8:59 AM | 2 (0.1%) | 0 (0.0%) |
| 9:00 AM to 9:59 AM | 77 (3.8%) | 62 (3.0%) |
| 10:00 AM to 10:59 AM | 0 (0.0%) | 0 (0.0%) |
| 11:00 AM to 11:59 AM | 0 (0.0%) | 42 (2.0%) |
| 12:00 PM to 3:59 PM | 135 (6.7%) | 202 (9.7%) |
| 4:00 PM to 11:59 PM | 150 (7.5%) | 110 (5.3%) |
| Total | 2,003 (100.0%) | 2,093 (100.0%) |
Housing Occupancy in Cayey
Occupancy by Ownership in Cayey
Of the total 6,128 dwellings in Cayey, owner-occupied units account for 3,017 (49.2%), while renter-occupied units make up 3,111 (50.8%).
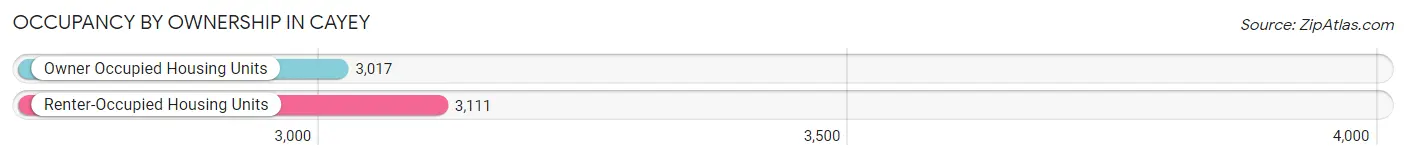
| Occupancy | # Housing Units | % Housing Units |
| Owner Occupied Housing Units | 3,017 | 49.2% |
| Renter-Occupied Housing Units | 3,111 | 50.8% |
| Total Occupied Housing Units | 6,128 | 100.0% |
Occupancy by Household Size in Cayey
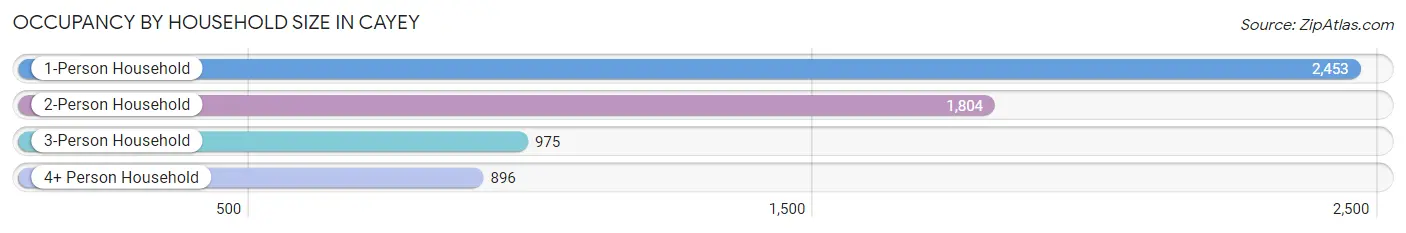
| Household Size | # Housing Units | % Housing Units |
| 1-Person Household | 2,453 | 40.0% |
| 2-Person Household | 1,804 | 29.4% |
| 3-Person Household | 975 | 15.9% |
| 4+ Person Household | 896 | 14.6% |
| Total Housing Units | 6,128 | 100.0% |
Occupancy by Ownership by Household Size in Cayey
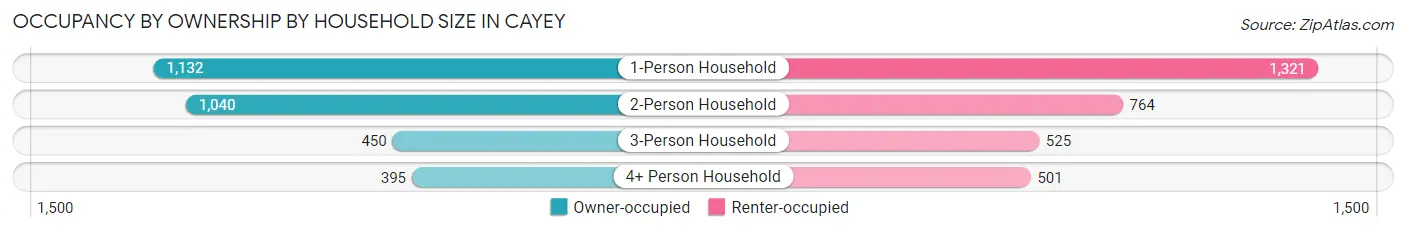
| Household Size | Owner-occupied | Renter-occupied |
| 1-Person Household | 1,132 (46.2%) | 1,321 (53.8%) |
| 2-Person Household | 1,040 (57.7%) | 764 (42.3%) |
| 3-Person Household | 450 (46.2%) | 525 (53.8%) |
| 4+ Person Household | 395 (44.1%) | 501 (55.9%) |
| Total Housing Units | 3,017 (49.2%) | 3,111 (50.8%) |
Occupancy by Educational Attainment in Cayey
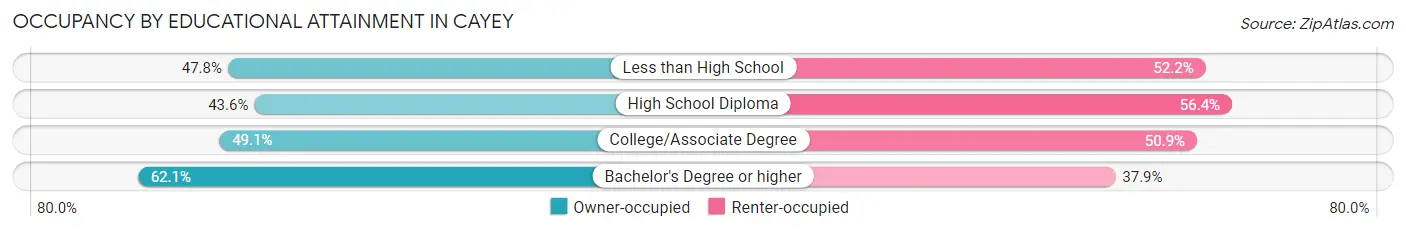
| Household Size | Owner-occupied | Renter-occupied |
| Less than High School | 846 (47.8%) | 925 (52.2%) |
| High School Diploma | 907 (43.6%) | 1,174 (56.4%) |
| College/Associate Degree | 564 (49.1%) | 584 (50.9%) |
| Bachelor's Degree or higher | 700 (62.1%) | 428 (37.9%) |
Occupancy by Age of Householder in Cayey
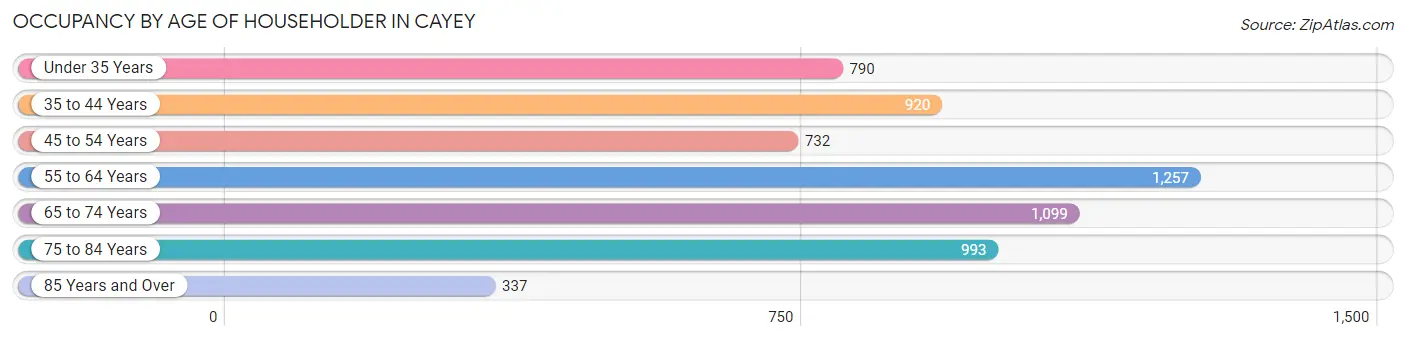
| Age Bracket | # Households | % Households |
| Under 35 Years | 790 | 12.9% |
| 35 to 44 Years | 920 | 15.0% |
| 45 to 54 Years | 732 | 11.9% |
| 55 to 64 Years | 1,257 | 20.5% |
| 65 to 74 Years | 1,099 | 17.9% |
| 75 to 84 Years | 993 | 16.2% |
| 85 Years and Over | 337 | 5.5% |
| Total | 6,128 | 100.0% |
Housing Finances in Cayey
Median Income by Occupancy in Cayey
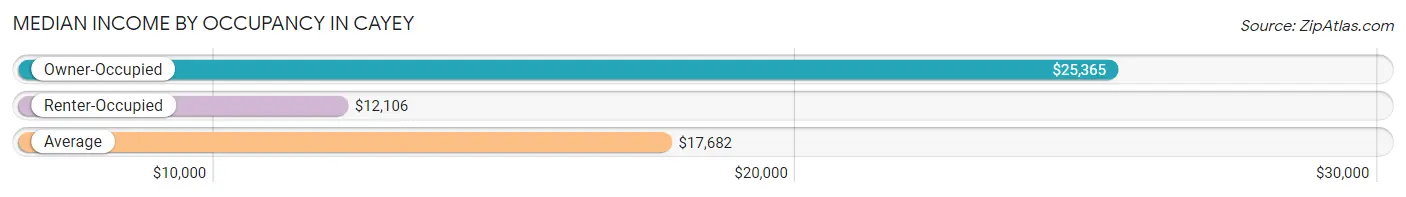
| Occupancy Type | # Households | Median Income |
| Owner-Occupied | 3,017 (49.2%) | $25,365 |
| Renter-Occupied | 3,111 (50.8%) | $12,106 |
| Average | 6,128 (100.0%) | $17,682 |
Occupancy by Householder Income Bracket in Cayey
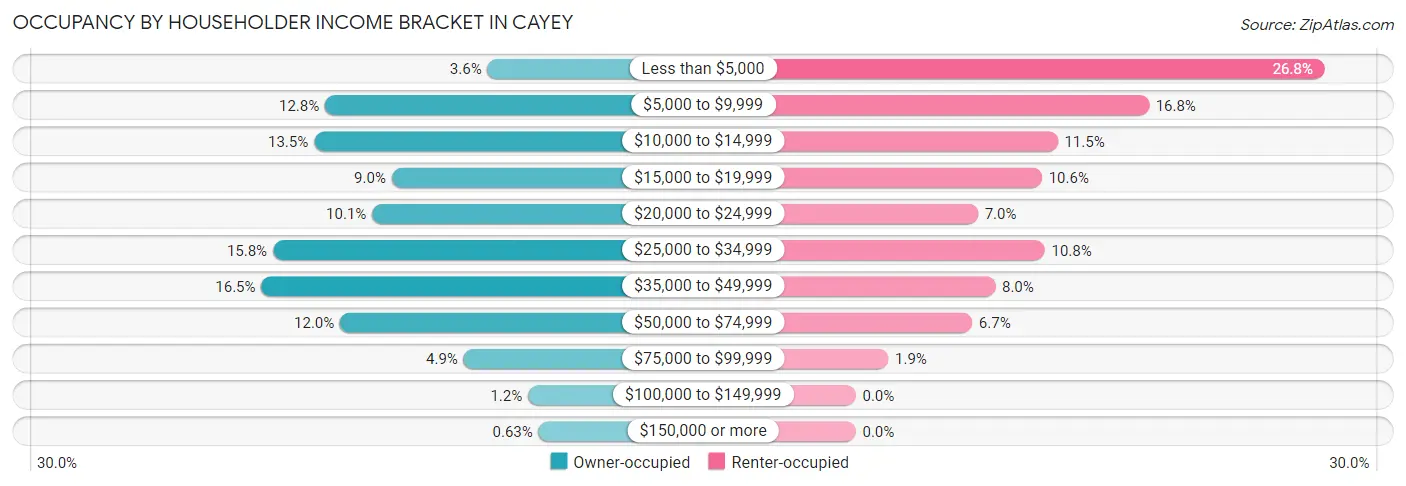
| Income Bracket | Owner-occupied | Renter-occupied |
| Less than $5,000 | 107 (3.5%) | 834 (26.8%) |
| $5,000 to $9,999 | 387 (12.8%) | 521 (16.8%) |
| $10,000 to $14,999 | 406 (13.5%) | 359 (11.5%) |
| $15,000 to $19,999 | 272 (9.0%) | 331 (10.6%) |
| $20,000 to $24,999 | 306 (10.1%) | 217 (7.0%) |
| $25,000 to $34,999 | 477 (15.8%) | 336 (10.8%) |
| $35,000 to $49,999 | 497 (16.5%) | 248 (8.0%) |
| $50,000 to $74,999 | 361 (12.0%) | 207 (6.7%) |
| $75,000 to $99,999 | 148 (4.9%) | 58 (1.9%) |
| $100,000 to $149,999 | 37 (1.2%) | 0 (0.0%) |
| $150,000 or more | 19 (0.6%) | 0 (0.0%) |
| Total | 3,017 (100.0%) | 3,111 (100.0%) |
Monthly Housing Cost Tiers in Cayey
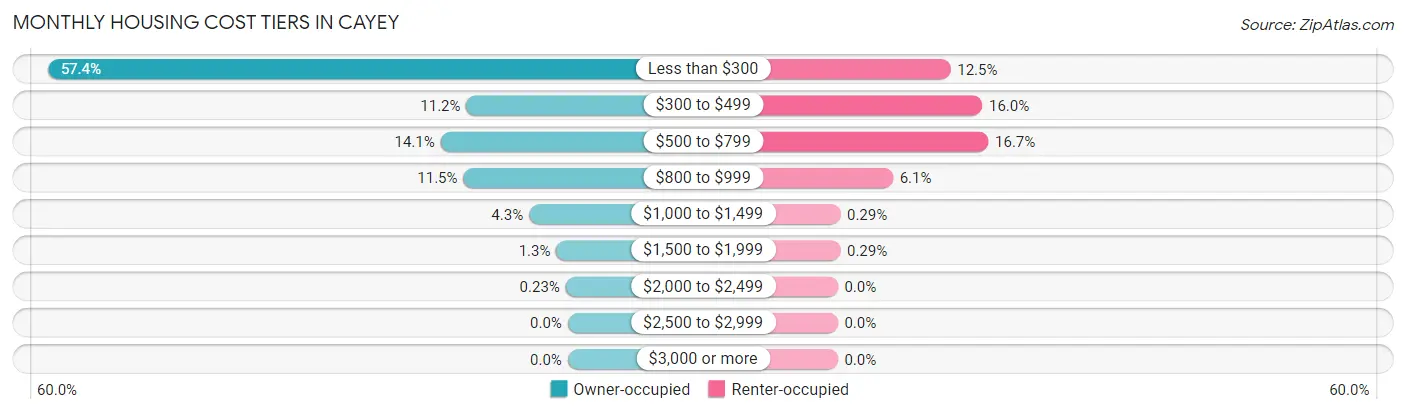
| Monthly Cost | Owner-occupied | Renter-occupied |
| Less than $300 | 1,733 (57.4%) | 388 (12.5%) |
| $300 to $499 | 338 (11.2%) | 497 (16.0%) |
| $500 to $799 | 424 (14.1%) | 518 (16.7%) |
| $800 to $999 | 348 (11.5%) | 190 (6.1%) |
| $1,000 to $1,499 | 129 (4.3%) | 9 (0.3%) |
| $1,500 to $1,999 | 38 (1.3%) | 9 (0.3%) |
| $2,000 to $2,499 | 7 (0.2%) | 0 (0.0%) |
| $2,500 to $2,999 | 0 (0.0%) | 0 (0.0%) |
| $3,000 or more | 0 (0.0%) | 0 (0.0%) |
| Total | 3,017 (100.0%) | 3,111 (100.0%) |
Physical Housing Characteristics in Cayey
Housing Structures in Cayey
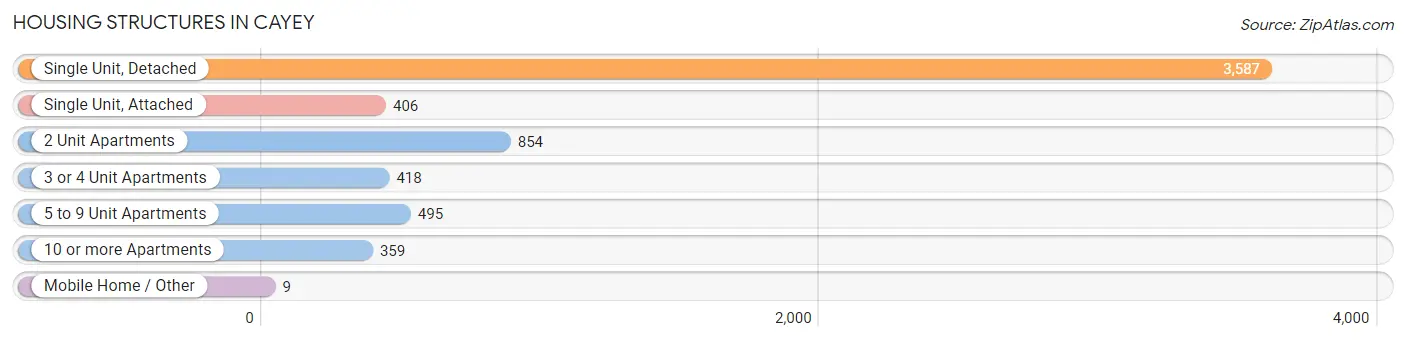
| Structure Type | # Housing Units | % Housing Units |
| Single Unit, Detached | 3,587 | 58.5% |
| Single Unit, Attached | 406 | 6.6% |
| 2 Unit Apartments | 854 | 13.9% |
| 3 or 4 Unit Apartments | 418 | 6.8% |
| 5 to 9 Unit Apartments | 495 | 8.1% |
| 10 or more Apartments | 359 | 5.9% |
| Mobile Home / Other | 9 | 0.2% |
| Total | 6,128 | 100.0% |
Housing Structures by Occupancy in Cayey
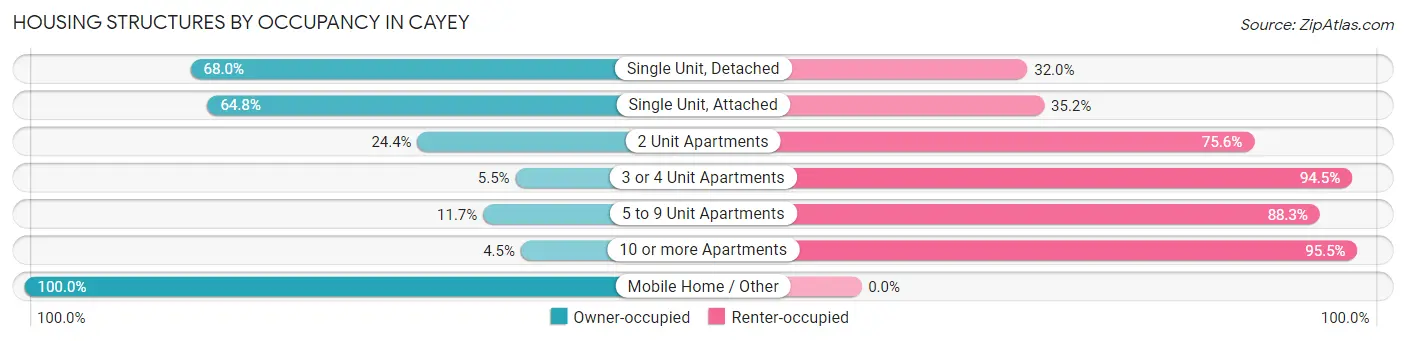
| Structure Type | Owner-occupied | Renter-occupied |
| Single Unit, Detached | 2,440 (68.0%) | 1,147 (32.0%) |
| Single Unit, Attached | 263 (64.8%) | 143 (35.2%) |
| 2 Unit Apartments | 208 (24.4%) | 646 (75.6%) |
| 3 or 4 Unit Apartments | 23 (5.5%) | 395 (94.5%) |
| 5 to 9 Unit Apartments | 58 (11.7%) | 437 (88.3%) |
| 10 or more Apartments | 16 (4.5%) | 343 (95.5%) |
| Mobile Home / Other | 9 (100.0%) | 0 (0.0%) |
| Total | 3,017 (49.2%) | 3,111 (50.8%) |
Housing Structures by Number of Rooms in Cayey
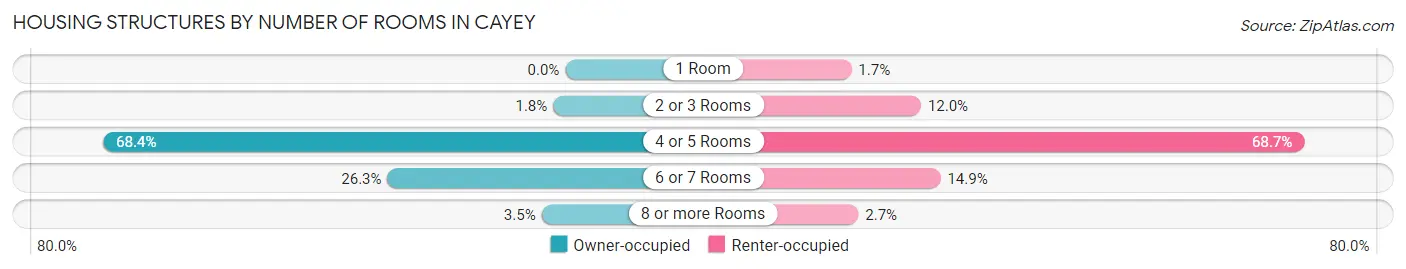
| Number of Rooms | Owner-occupied | Renter-occupied |
| 1 Room | 0 (0.0%) | 53 (1.7%) |
| 2 or 3 Rooms | 54 (1.8%) | 373 (12.0%) |
| 4 or 5 Rooms | 2,063 (68.4%) | 2,137 (68.7%) |
| 6 or 7 Rooms | 794 (26.3%) | 463 (14.9%) |
| 8 or more Rooms | 106 (3.5%) | 85 (2.7%) |
| Total | 3,017 (100.0%) | 3,111 (100.0%) |
Housing Structure by Heating Type in Cayey
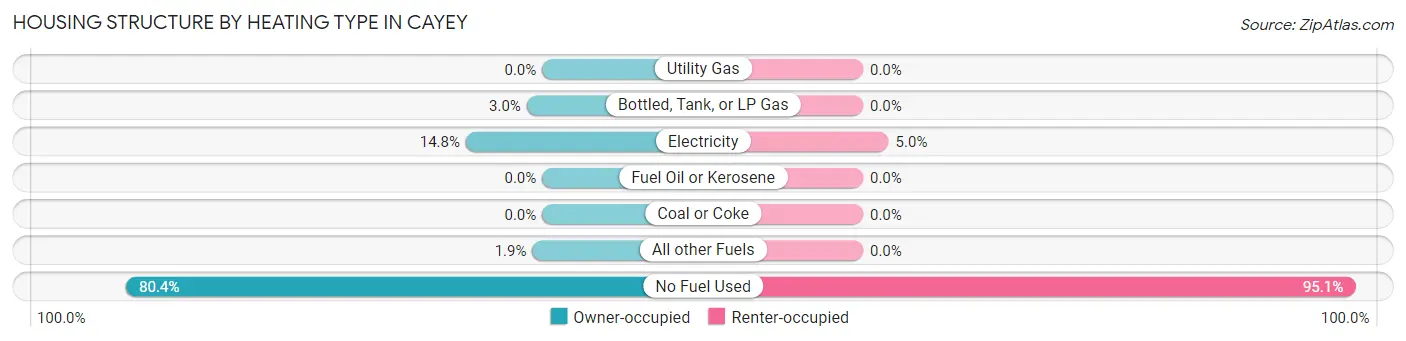
| Heating Type | Owner-occupied | Renter-occupied |
| Utility Gas | 0 (0.0%) | 0 (0.0%) |
| Bottled, Tank, or LP Gas | 90 (3.0%) | 0 (0.0%) |
| Electricity | 445 (14.7%) | 154 (5.0%) |
| Fuel Oil or Kerosene | 0 (0.0%) | 0 (0.0%) |
| Coal or Coke | 0 (0.0%) | 0 (0.0%) |
| All other Fuels | 57 (1.9%) | 0 (0.0%) |
| No Fuel Used | 2,425 (80.4%) | 2,957 (95.1%) |
| Total | 3,017 (100.0%) | 3,111 (100.0%) |
Household Vehicle Usage in Cayey
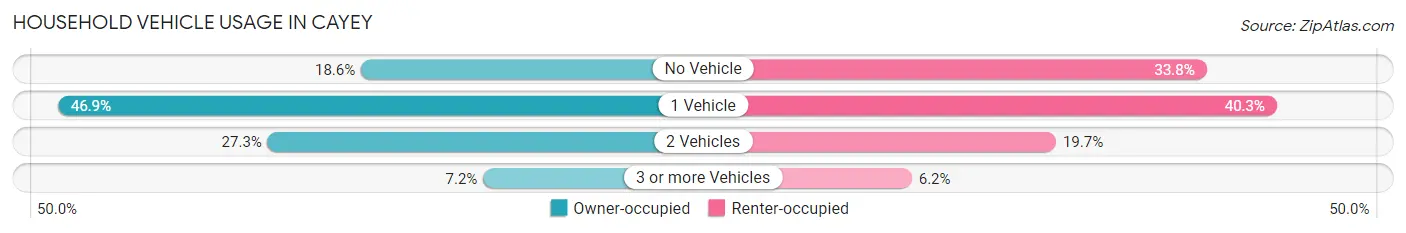
| Vehicles per Household | Owner-occupied | Renter-occupied |
| No Vehicle | 561 (18.6%) | 1,050 (33.8%) |
| 1 Vehicle | 1,415 (46.9%) | 1,254 (40.3%) |
| 2 Vehicles | 824 (27.3%) | 613 (19.7%) |
| 3 or more Vehicles | 217 (7.2%) | 194 (6.2%) |
| Total | 3,017 (100.0%) | 3,111 (100.0%) |
Real Estate & Mortgages in Cayey
Real Estate and Mortgage Overview in Cayey
| Characteristic | Without Mortgage | With Mortgage |
| Housing Units | 1,964 | 1,053 |
| Median Property Value | $115,300 | $129,300 |
| Median Household Income | $21,343 | $9 |
| Monthly Housing Costs | $139 | $0 |
| Real Estate Taxes | $576 | $1,033 |
Property Value by Mortgage Status in Cayey
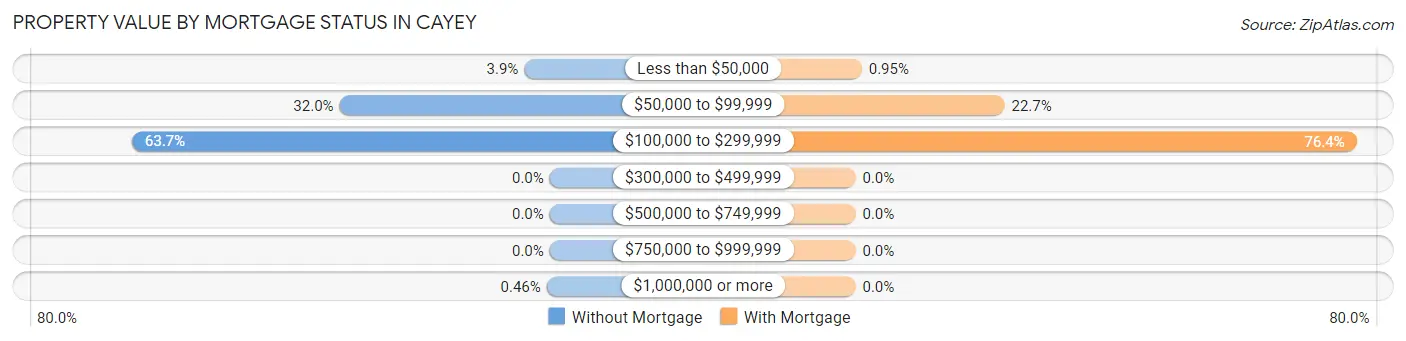
| Property Value | Without Mortgage | With Mortgage |
| Less than $50,000 | 76 (3.9%) | 10 (0.9%) |
| $50,000 to $99,999 | 629 (32.0%) | 239 (22.7%) |
| $100,000 to $299,999 | 1,250 (63.6%) | 804 (76.3%) |
| $300,000 to $499,999 | 0 (0.0%) | 0 (0.0%) |
| $500,000 to $749,999 | 0 (0.0%) | 0 (0.0%) |
| $750,000 to $999,999 | 0 (0.0%) | 0 (0.0%) |
| $1,000,000 or more | 9 (0.5%) | 0 (0.0%) |
| Total | 1,964 (100.0%) | 1,053 (100.0%) |
Household Income by Mortgage Status in Cayey
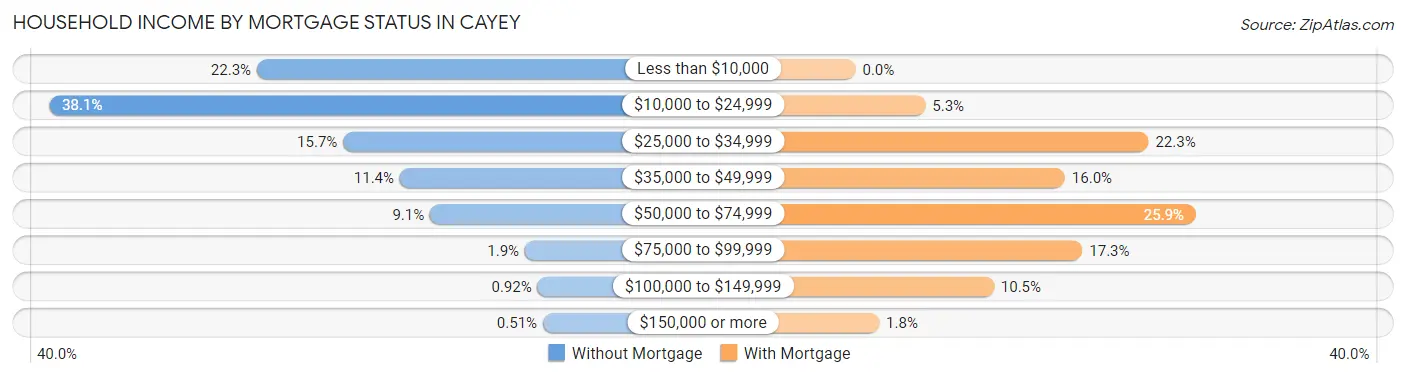
| Household Income | Without Mortgage | With Mortgage |
| Less than $10,000 | 438 (22.3%) | 0 (0.0%) |
| $10,000 to $24,999 | 749 (38.1%) | 56 (5.3%) |
| $25,000 to $34,999 | 309 (15.7%) | 235 (22.3%) |
| $35,000 to $49,999 | 224 (11.4%) | 168 (16.0%) |
| $50,000 to $74,999 | 179 (9.1%) | 273 (25.9%) |
| $75,000 to $99,999 | 37 (1.9%) | 182 (17.3%) |
| $100,000 to $149,999 | 18 (0.9%) | 111 (10.5%) |
| $150,000 or more | 10 (0.5%) | 19 (1.8%) |
| Total | 1,964 (100.0%) | 1,053 (100.0%) |
Property Value to Household Income Ratio in Cayey
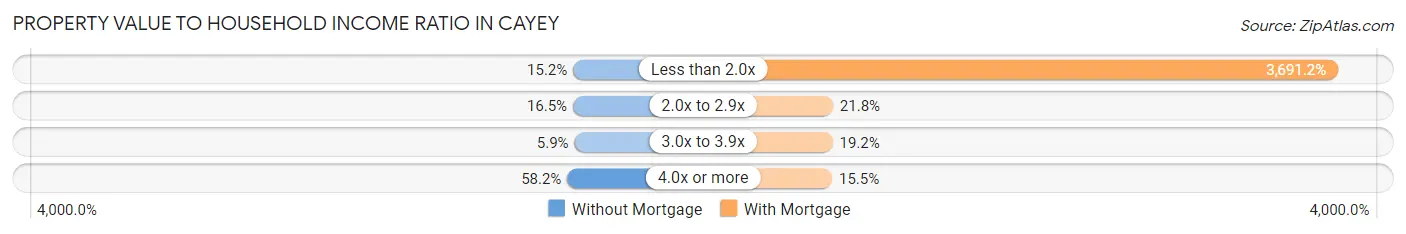
| Value-to-Income Ratio | Without Mortgage | With Mortgage |
| Less than 2.0x | 299 (15.2%) | 38,868 (3,691.2%) |
| 2.0x to 2.9x | 324 (16.5%) | 230 (21.8%) |
| 3.0x to 3.9x | 116 (5.9%) | 202 (19.2%) |
| 4.0x or more | 1,143 (58.2%) | 163 (15.5%) |
| Total | 1,964 (100.0%) | 1,053 (100.0%) |
Real Estate Taxes by Mortgage Status in Cayey
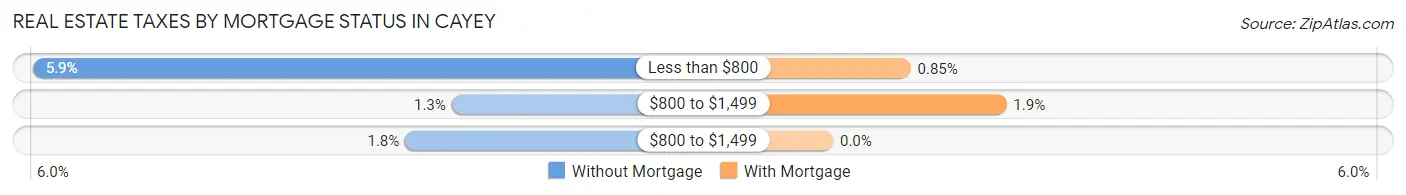
| Property Taxes | Without Mortgage | With Mortgage |
| Less than $800 | 116 (5.9%) | 9 (0.9%) |
| $800 to $1,499 | 26 (1.3%) | 20 (1.9%) |
| $800 to $1,499 | 36 (1.8%) | 0 (0.0%) |
| Total | 1,964 (100.0%) | 1,053 (100.0%) |
Health & Disability in Cayey
Health Insurance Coverage by Age in Cayey
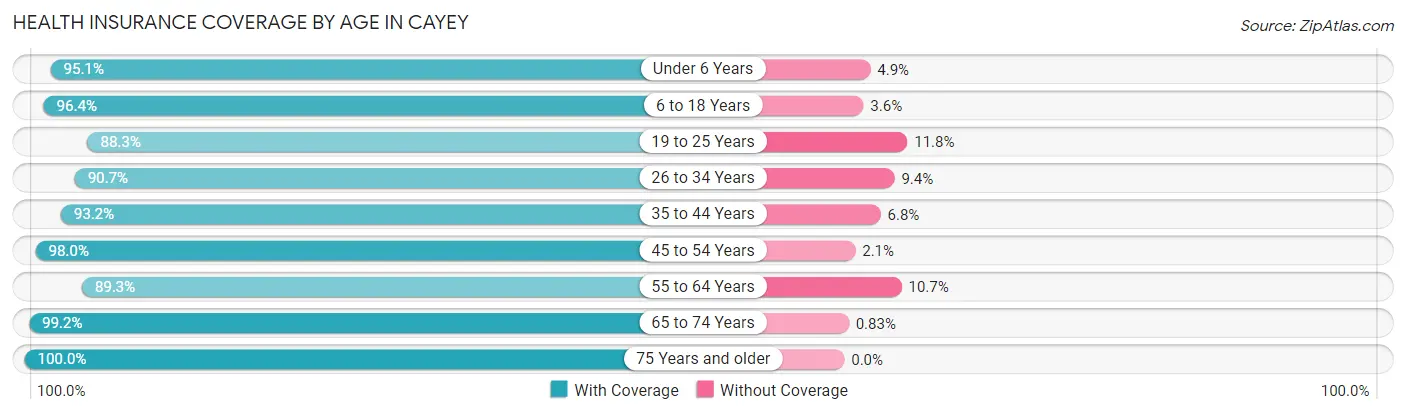
| Age Bracket | With Coverage | Without Coverage |
| Under 6 Years | 725 (95.1%) | 37 (4.9%) |
| 6 to 18 Years | 1,815 (96.4%) | 67 (3.6%) |
| 19 to 25 Years | 1,232 (88.2%) | 164 (11.7%) |
| 26 to 34 Years | 1,309 (90.6%) | 135 (9.3%) |
| 35 to 44 Years | 1,679 (93.2%) | 122 (6.8%) |
| 45 to 54 Years | 1,720 (98.0%) | 36 (2.1%) |
| 55 to 64 Years | 1,732 (89.3%) | 207 (10.7%) |
| 65 to 74 Years | 1,671 (99.2%) | 14 (0.8%) |
| 75 Years and older | 1,754 (100.0%) | 0 (0.0%) |
| Total | 13,637 (94.6%) | 782 (5.4%) |
Health Insurance Coverage by Citizenship Status in Cayey
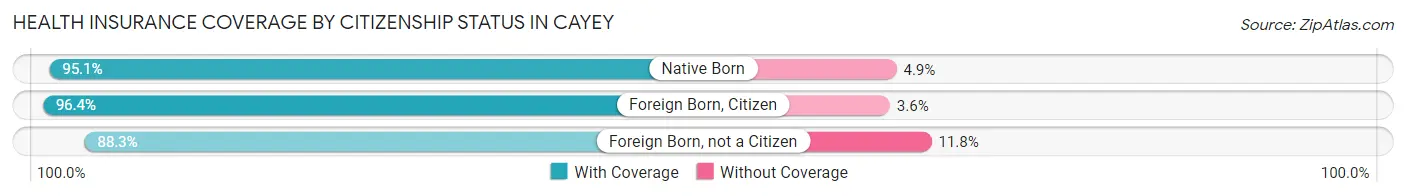
| Citizenship Status | With Coverage | Without Coverage |
| Native Born | 725 (95.1%) | 37 (4.9%) |
| Foreign Born, Citizen | 1,815 (96.4%) | 67 (3.6%) |
| Foreign Born, not a Citizen | 1,232 (88.2%) | 164 (11.7%) |
Health Insurance Coverage by Household Income in Cayey
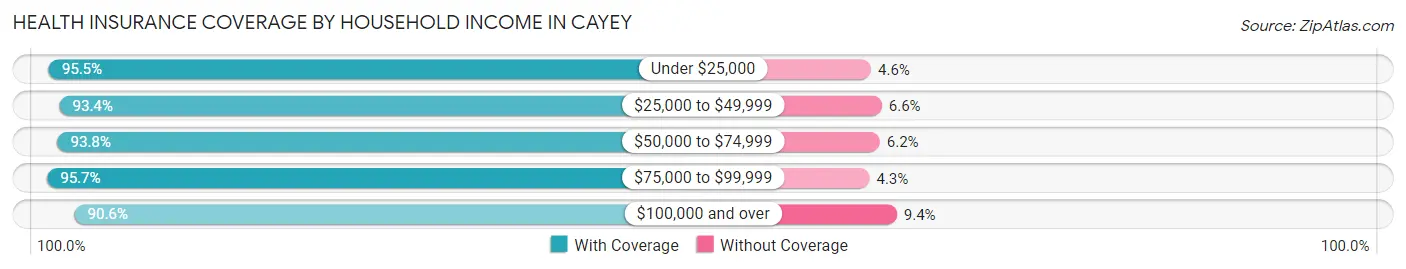
| Household Income | With Coverage | Without Coverage |
| Under $25,000 | 6,751 (95.5%) | 322 (4.5%) |
| $25,000 to $49,999 | 4,409 (93.4%) | 310 (6.6%) |
| $50,000 to $74,999 | 1,561 (93.8%) | 103 (6.2%) |
| $75,000 to $99,999 | 652 (95.7%) | 29 (4.3%) |
| $100,000 and over | 174 (90.6%) | 18 (9.4%) |
Public vs Private Health Insurance Coverage by Age in Cayey
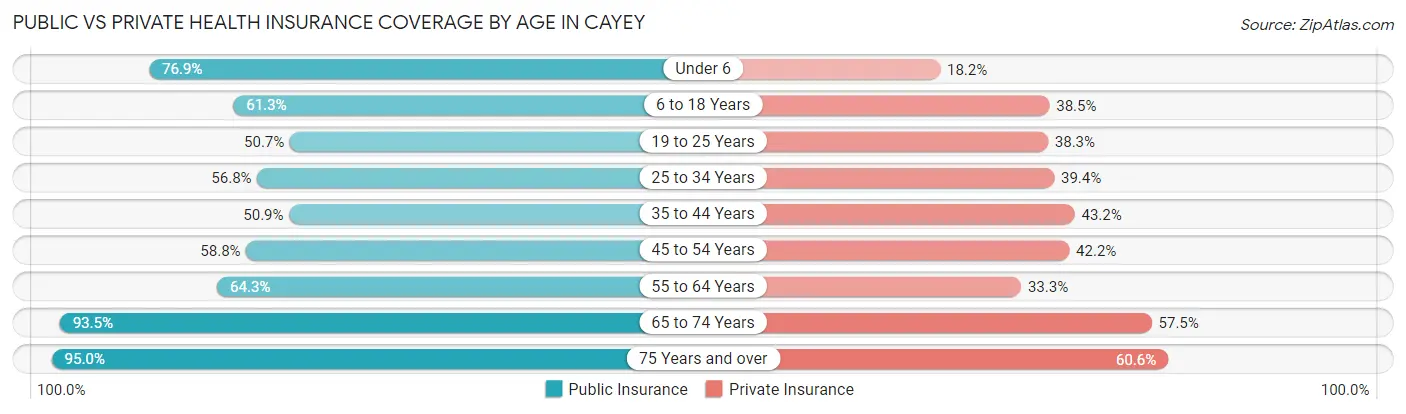
| Age Bracket | Public Insurance | Private Insurance |
| Under 6 | 586 (76.9%) | 139 (18.2%) |
| 6 to 18 Years | 1,153 (61.3%) | 725 (38.5%) |
| 19 to 25 Years | 708 (50.7%) | 534 (38.3%) |
| 25 to 34 Years | 820 (56.8%) | 569 (39.4%) |
| 35 to 44 Years | 916 (50.9%) | 778 (43.2%) |
| 45 to 54 Years | 1,033 (58.8%) | 741 (42.2%) |
| 55 to 64 Years | 1,246 (64.3%) | 645 (33.3%) |
| 65 to 74 Years | 1,575 (93.5%) | 969 (57.5%) |
| 75 Years and over | 1,666 (95.0%) | 1,062 (60.6%) |
| Total | 9,703 (67.3%) | 6,162 (42.7%) |
Disability Status by Sex by Age in Cayey
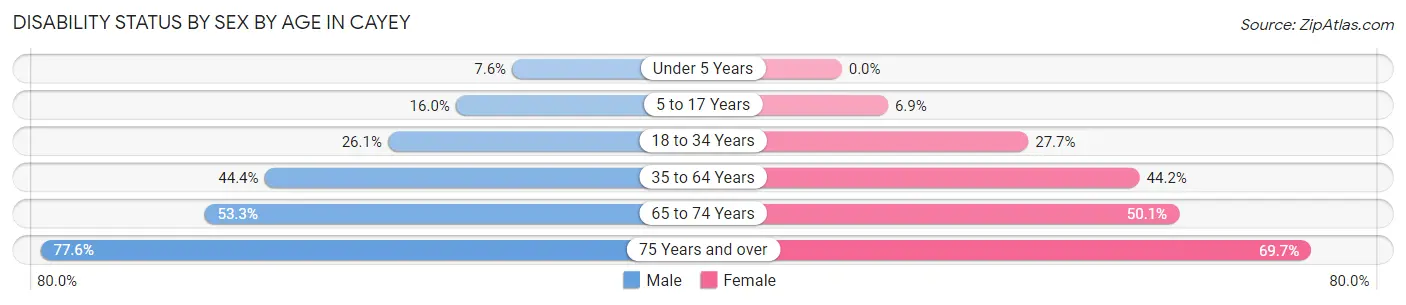
| Age Bracket | Male | Female |
| Under 5 Years | 22 (7.6%) | 0 (0.0%) |
| 5 to 17 Years | 166 (16.0%) | 55 (6.9%) |
| 18 to 34 Years | 357 (26.1%) | 459 (27.7%) |
| 35 to 64 Years | 1,090 (44.4%) | 1,345 (44.2%) |
| 65 to 74 Years | 390 (53.3%) | 477 (50.0%) |
| 75 Years and over | 517 (77.6%) | 758 (69.7%) |
Disability Class by Sex by Age in Cayey
Disability Class: Hearing Difficulty
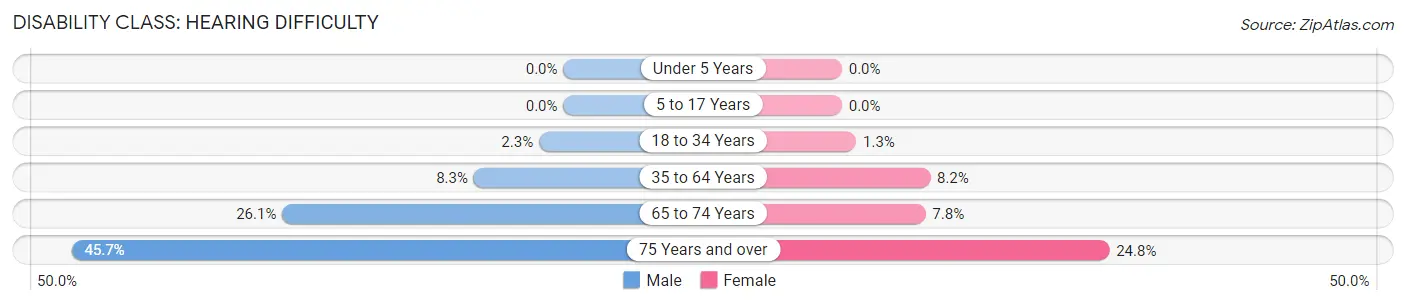
| Age Bracket | Male | Female |
| Under 5 Years | 0 (0.0%) | 0 (0.0%) |
| 5 to 17 Years | 0 (0.0%) | 0 (0.0%) |
| 18 to 34 Years | 31 (2.3%) | 22 (1.3%) |
| 35 to 64 Years | 204 (8.3%) | 249 (8.2%) |
| 65 to 74 Years | 191 (26.1%) | 74 (7.8%) |
| 75 Years and over | 304 (45.7%) | 270 (24.8%) |
Disability Class: Vision Difficulty
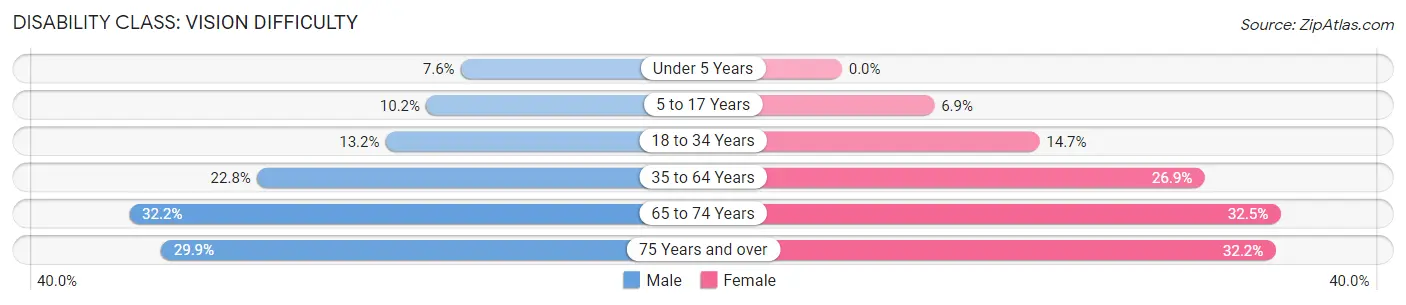
| Age Bracket | Male | Female |
| Under 5 Years | 22 (7.6%) | 0 (0.0%) |
| 5 to 17 Years | 106 (10.2%) | 55 (6.9%) |
| 18 to 34 Years | 181 (13.2%) | 243 (14.7%) |
| 35 to 64 Years | 559 (22.8%) | 818 (26.9%) |
| 65 to 74 Years | 236 (32.2%) | 310 (32.5%) |
| 75 Years and over | 199 (29.9%) | 350 (32.2%) |
Disability Class: Cognitive Difficulty
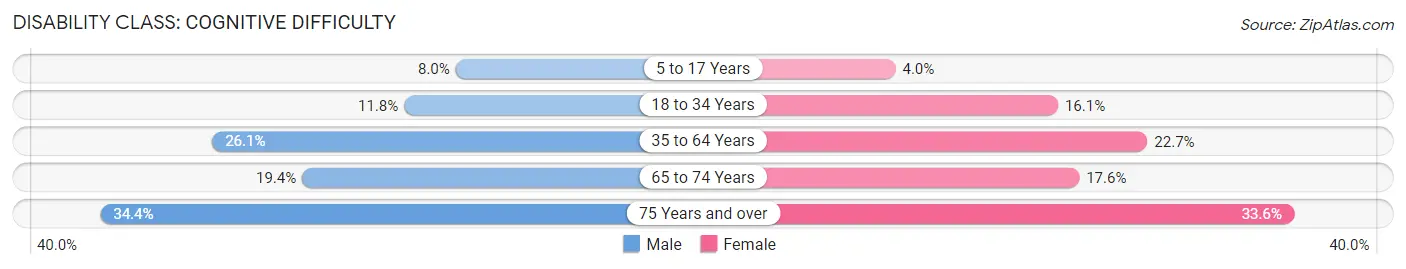
| Age Bracket | Male | Female |
| 5 to 17 Years | 83 (8.0%) | 32 (4.0%) |
| 18 to 34 Years | 162 (11.8%) | 266 (16.1%) |
| 35 to 64 Years | 640 (26.1%) | 690 (22.7%) |
| 65 to 74 Years | 142 (19.4%) | 168 (17.6%) |
| 75 Years and over | 229 (34.4%) | 365 (33.6%) |
Disability Class: Ambulatory Difficulty
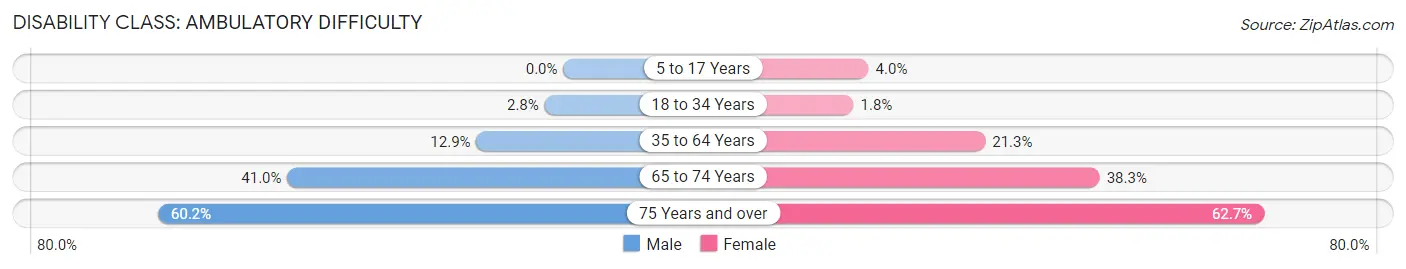
| Age Bracket | Male | Female |
| 5 to 17 Years | 0 (0.0%) | 32 (4.0%) |
| 18 to 34 Years | 38 (2.8%) | 29 (1.8%) |
| 35 to 64 Years | 317 (12.9%) | 648 (21.3%) |
| 65 to 74 Years | 300 (41.0%) | 365 (38.3%) |
| 75 Years and over | 401 (60.2%) | 682 (62.7%) |
Disability Class: Self-Care Difficulty
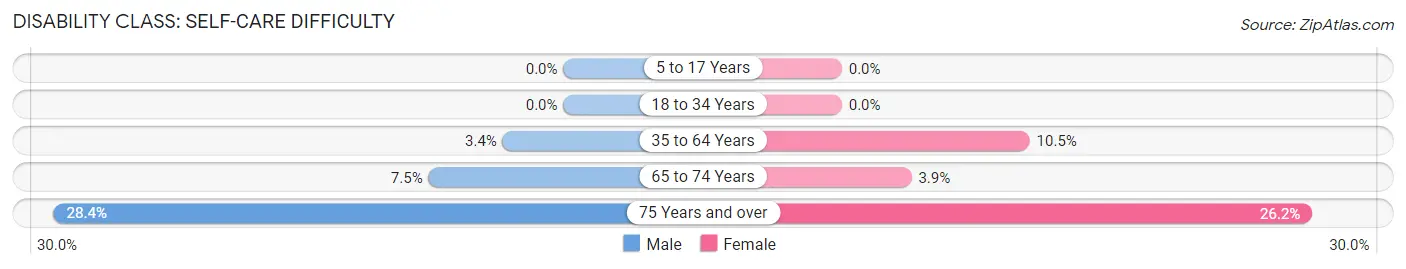
| Age Bracket | Male | Female |
| 5 to 17 Years | 0 (0.0%) | 0 (0.0%) |
| 18 to 34 Years | 0 (0.0%) | 0 (0.0%) |
| 35 to 64 Years | 83 (3.4%) | 318 (10.5%) |
| 65 to 74 Years | 55 (7.5%) | 37 (3.9%) |
| 75 Years and over | 189 (28.4%) | 285 (26.2%) |
Technology Access in Cayey
Computing Device Access in Cayey
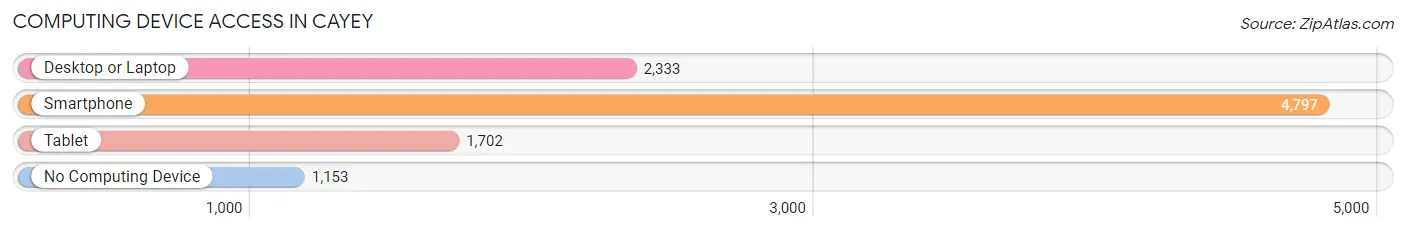
| Device Type | # Households | % Households |
| Desktop or Laptop | 2,333 | 38.1% |
| Smartphone | 4,797 | 78.3% |
| Tablet | 1,702 | 27.8% |
| No Computing Device | 1,153 | 18.8% |
| Total | 6,128 | 100.0% |
Internet Access in Cayey
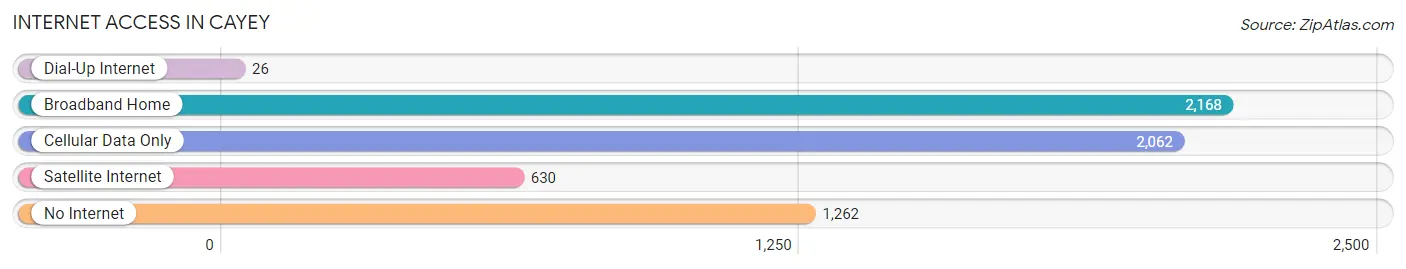
| Internet Type | # Households | % Households |
| Dial-Up Internet | 26 | 0.4% |
| Broadband Home | 2,168 | 35.4% |
| Cellular Data Only | 2,062 | 33.7% |
| Satellite Internet | 630 | 10.3% |
| No Internet | 1,262 | 20.6% |
| Total | 6,128 | 100.0% |
Cayey Summary
Cayey is a municipality located in the central mountain range of Puerto Rico. It is the capital of the Cayey district and is part of the San Juan-Caguas-Guaynabo Metropolitan Statistical Area. The town is located about 30 miles southeast of San Juan, the capital of Puerto Rico.
History
Cayey was founded in 1773 by Juan Mata Vázquez, who named it after the Taino Indian word for “place of waters”. The town was officially recognized in 1802 and has since grown to become one of the most important towns in Puerto Rico.
Cayey has a long and rich history. During the Spanish-American War, the town was the site of a major battle between the Spanish and American forces. The town was also the site of the first railroad in Puerto Rico, which was built in 1841.
In the early 20th century, Cayey was an important center of the sugar industry in Puerto Rico. The town was also the site of the first hydroelectric plant in the country, which was built in 1912.
Geography
Cayey is located in the central mountain range of Puerto Rico, about 30 miles southeast of San Juan. The town is situated at an elevation of 1,000 feet above sea level and is surrounded by lush green hills and mountains. The town is located in a valley, which is fed by several rivers and streams.
The climate in Cayey is tropical, with temperatures ranging from the mid-70s to the mid-80s year-round. The town receives an average of 60 inches of rain per year.
Economy
Cayey’s economy is largely based on agriculture and manufacturing. The town is home to several large factories, including a Coca-Cola bottling plant and a Nestle plant. The town is also home to several small businesses, including restaurants, shops, and hotels.
The town is also home to several universities, including the University of Puerto Rico at Cayey and the Interamerican University of Puerto Rico.
Demographics
As of the 2010 census, Cayey had a population of 45,543. The town has a population density of 1,072 people per square mile. The median age in Cayey is 33.7 years, and the median household income is $17,845.
The majority of the population is of Hispanic or Latino origin, with the largest ethnic group being Puerto Ricans. Other ethnic groups include Dominicans, Cubans, and Colombians. The town is also home to a large number of immigrants from other countries, including the Dominican Republic, Colombia, and the United States.
The town is predominantly Catholic, with the majority of the population being Roman Catholic. Other religious groups include Protestants, Jehovah’s Witnesses, and Mormons.
Conclusion
Cayey is a municipality located in the central mountain range of Puerto Rico. It is the capital of the Cayey district and is part of the San Juan-Caguas-Guaynabo Metropolitan Statistical Area. The town has a long and rich history, and is home to several large factories and universities. The town has a population of 45,543, with the majority of the population being of Hispanic or Latino origin. The town is predominantly Catholic, with the majority of the population being Roman Catholic. The town’s economy is largely based on agriculture and manufacturing.
Common Questions
What is Per Capita Income in Cayey?
Per Capita income in Cayey is $11,752.
What is the Median Family Income in Cayey?
Median Family Income in Cayey is $26,024.
What is the Median Household income in Cayey?
Median Household Income in Cayey is $17,682.
What is Income or Wage Gap in Cayey?
Income or Wage Gap in Cayey is 17.1%.
Women in Cayey earn 82.9 cents for every dollar earned by a man.
What is Family Income Deficit in Cayey?
Family Income Deficit in Cayey is $11,237.
Families that are below poverty line in Cayey earn $11,237 less on average than the poverty threshold level.
What is Inequality or Gini Index in Cayey?
Inequality or Gini Index in Cayey is 0.49.
What is the Total Population of Cayey?
Total Population of Cayey is 14,423.
What is the Total Male Population of Cayey?
Total Male Population of Cayey is 6,548.
What is the Total Female Population of Cayey?
Total Female Population of Cayey is 7,875.
What is the Ratio of Males per 100 Females in Cayey?
There are 83.15 Males per 100 Females in Cayey.
What is the Ratio of Females per 100 Males in Cayey?
There are 120.27 Females per 100 Males in Cayey.
What is the Median Population Age in Cayey?
Median Population Age in Cayey is 44.4 Years.
What is the Average Family Size in Cayey
Average Family Size in Cayey is 3.2 People.
What is the Average Household Size in Cayey
Average Household Size in Cayey is 2.3 People.
How Large is the Labor Force in Cayey?
There are 4,461 People in the Labor Forcein in Cayey.
What is the Percentage of People in the Labor Force in Cayey?
36.0% of People are in the Labor Force in Cayey.
What is the Unemployment Rate in Cayey?
Unemployment Rate in Cayey is 7.3%.