Pajaros, PR Map & Demographics
Pajaros Overview
$16,112
PER CAPITA INCOME
$36,580
AVG FAMILY INCOME
$34,190
AVG HOUSEHOLD INCOME
2.5%
WAGE / INCOME GAP [ % ]
97.5¢/ $1
WAGE / INCOME GAP [ $ ]
$8,815
FAMILY INCOME DEFICIT
0.45
INEQUALITY / GINI INDEX
10,043
TOTAL POPULATION
4,086
MALE POPULATION
5,957
FEMALE POPULATION
68.59
MALES / 100 FEMALES
145.79
FEMALES / 100 MALES
40.7
MEDIAN AGE
3.6
AVG FAMILY SIZE
3.1
AVG HOUSEHOLD SIZE
4,850
LABOR FORCE [ PEOPLE ]
56.8%
PERCENT IN LABOR FORCE
7.0%
UNEMPLOYMENT RATE
Income in Pajaros
Income Overview in Pajaros
Per Capita Income in Pajaros is $16,112, while median incomes of families and households are $36,580 and $34,190 respectively.
| Characteristic | Number | Measure |
| Per Capita Income | 10,043 | $16,112 |
| Median Family Income | 2,488 | $36,580 |
| Mean Family Income | 2,488 | $46,641 |
| Median Household Income | 3,216 | $34,190 |
| Mean Household Income | 3,216 | $46,187 |
| Income Deficit | 2,488 | $8,815 |
| Wage / Income Gap (%) | 10,043 | 2.52% |
| Wage / Income Gap ($) | 10,043 | 97.48¢ per $1 |
| Gini / Inequality Index | 10,043 | 0.45 |
Earnings by Sex in Pajaros
Average Earnings in Pajaros are $22,943, $23,329 for men and $22,740 for women, a difference of 2.5%.
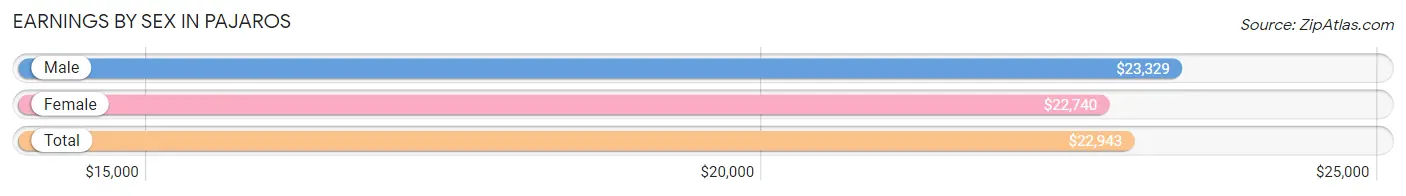
| Sex | Number | Average Earnings |
| Male | 2,040 (43.5%) | $23,329 |
| Female | 2,645 (56.5%) | $22,740 |
| Total | 4,685 (100.0%) | $22,943 |
Earnings by Sex by Income Bracket in Pajaros
The most common earnings brackets in Pajaros are $15,000 to $17,499 for men (231 | 11.3%) and $22,500 to $24,999 for women (349 | 13.2%).
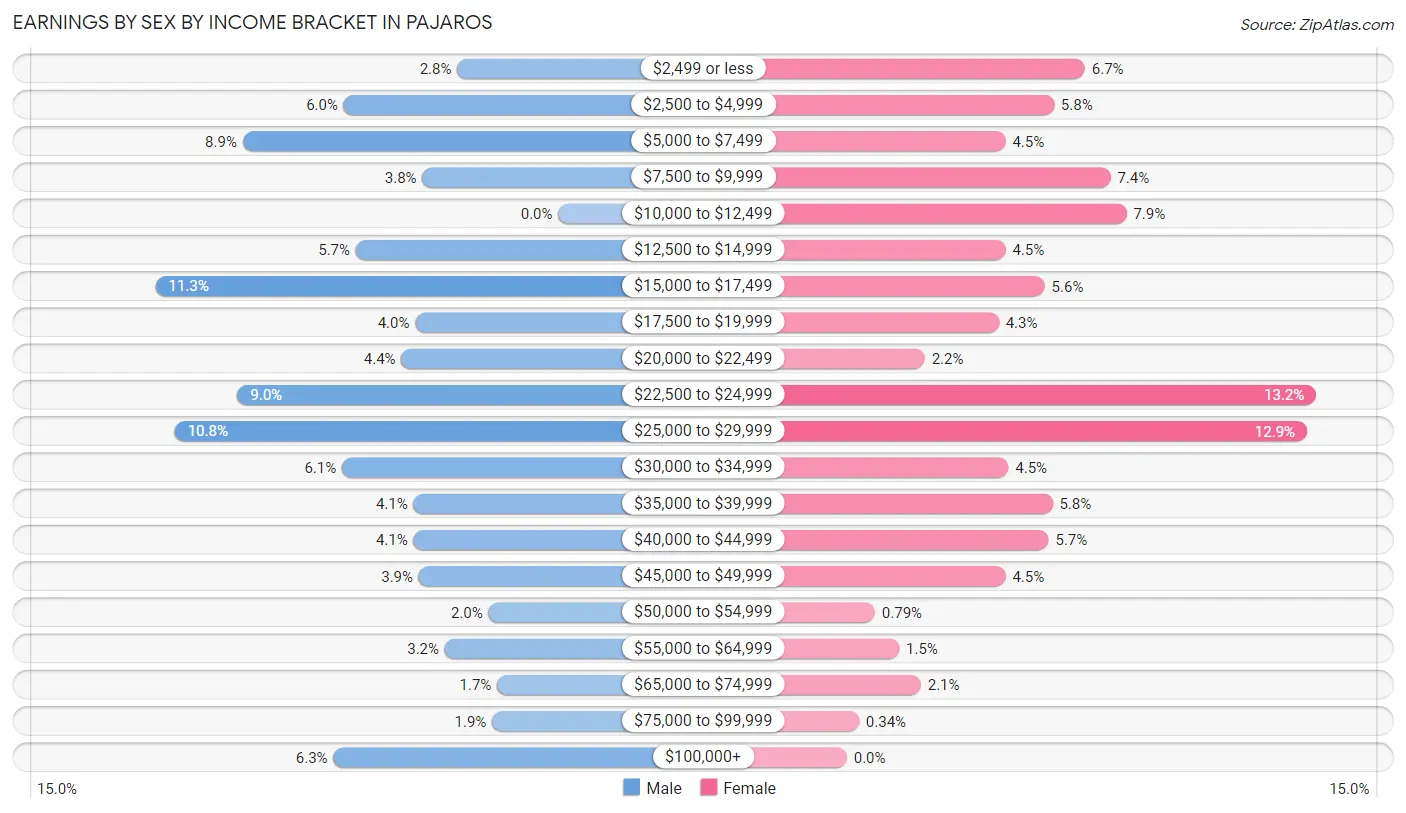
| Income | Male | Female |
| $2,499 or less | 58 (2.8%) | 177 (6.7%) |
| $2,500 to $4,999 | 123 (6.0%) | 154 (5.8%) |
| $5,000 to $7,499 | 181 (8.9%) | 118 (4.5%) |
| $7,500 to $9,999 | 78 (3.8%) | 196 (7.4%) |
| $10,000 to $12,499 | 0 (0.0%) | 208 (7.9%) |
| $12,500 to $14,999 | 116 (5.7%) | 118 (4.5%) |
| $15,000 to $17,499 | 231 (11.3%) | 147 (5.6%) |
| $17,500 to $19,999 | 82 (4.0%) | 113 (4.3%) |
| $20,000 to $22,499 | 90 (4.4%) | 58 (2.2%) |
| $22,500 to $24,999 | 184 (9.0%) | 349 (13.2%) |
| $25,000 to $29,999 | 220 (10.8%) | 342 (12.9%) |
| $30,000 to $34,999 | 124 (6.1%) | 120 (4.5%) |
| $35,000 to $39,999 | 83 (4.1%) | 153 (5.8%) |
| $40,000 to $44,999 | 83 (4.1%) | 150 (5.7%) |
| $45,000 to $49,999 | 80 (3.9%) | 118 (4.5%) |
| $50,000 to $54,999 | 40 (2.0%) | 21 (0.8%) |
| $55,000 to $64,999 | 65 (3.2%) | 39 (1.5%) |
| $65,000 to $74,999 | 35 (1.7%) | 55 (2.1%) |
| $75,000 to $99,999 | 38 (1.9%) | 9 (0.3%) |
| $100,000+ | 129 (6.3%) | 0 (0.0%) |
| Total | 2,040 (100.0%) | 2,645 (100.0%) |
Earnings by Sex by Educational Attainment in Pajaros
Average earnings in Pajaros are $24,293 for men and $23,512 for women, a difference of 3.2%. Men with an educational attainment of bachelor's degree enjoy the highest average annual earnings of $35,625, while those with less than high school education earn the least with $6,910. Women with an educational attainment of graduate degree earn the most with the average annual earnings of $29,734, while those with high school diploma education have the smallest earnings of $11,939.
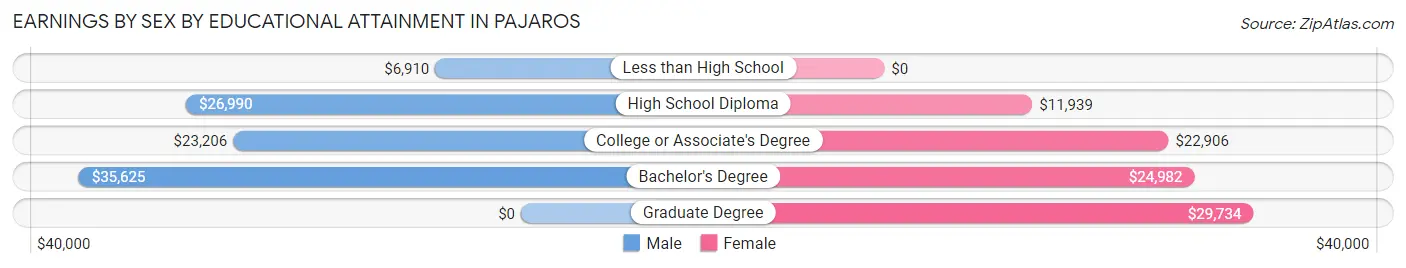
| Educational Attainment | Male Income | Female Income |
| Less than High School | $6,910 | $0 |
| High School Diploma | $26,990 | $11,939 |
| College or Associate's Degree | $23,206 | $22,906 |
| Bachelor's Degree | $35,625 | $24,982 |
| Graduate Degree | - | - |
| Total | $24,293 | $23,512 |
Family Income in Pajaros
Family Income Brackets in Pajaros
According to the Pajaros family income data, there are 448 families falling into the $25,000 to $34,999 income range, which is the most common income bracket and makes up 18.0% of all families.
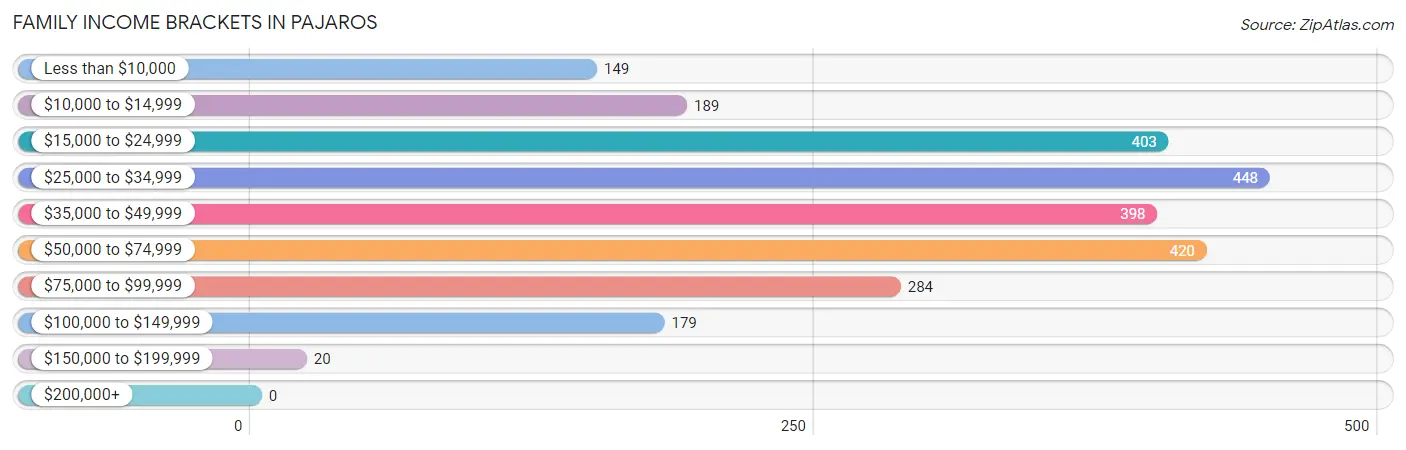
| Income Bracket | # Families | % Families |
| Less than $10,000 | 149 | 6.0% |
| $10,000 to $14,999 | 189 | 7.6% |
| $15,000 to $24,999 | 403 | 16.2% |
| $25,000 to $34,999 | 448 | 18.0% |
| $35,000 to $49,999 | 398 | 16.0% |
| $50,000 to $74,999 | 420 | 16.9% |
| $75,000 to $99,999 | 284 | 11.4% |
| $100,000 to $149,999 | 179 | 7.2% |
| $150,000 to $199,999 | 20 | 0.8% |
| $200,000+ | 0 | 0.0% |
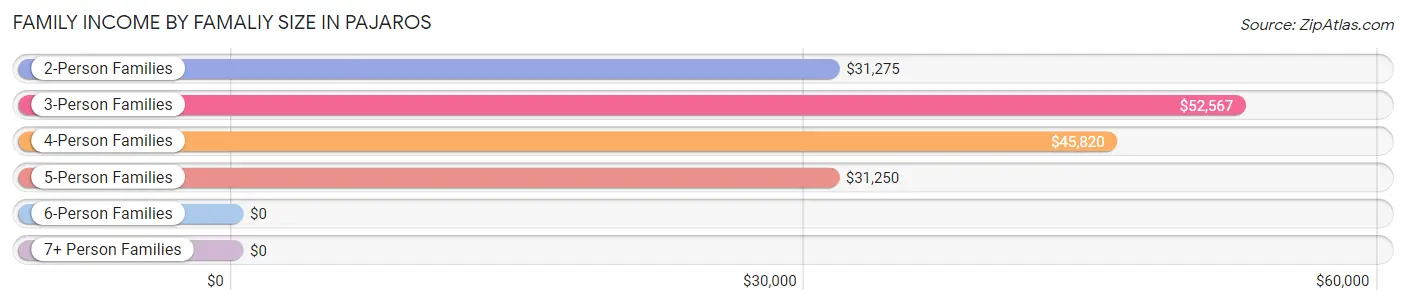
Family Income by Famaliy Size in Pajaros
3-person families (793 | 31.9%) account for the highest median family income in Pajaros with $52,567 per family, while 3-person families (793 | 31.9%) have the highest median income of $17,522 per family member.
| Income Bracket | # Families | Median Income |
| 2-Person Families | 1,064 (42.8%) | $31,275 |
| 3-Person Families | 793 (31.9%) | $52,567 |
| 4-Person Families | 311 (12.5%) | $45,820 |
| 5-Person Families | 220 (8.8%) | $31,250 |
| 6-Person Families | 48 (1.9%) | $0 |
| 7+ Person Families | 52 (2.1%) | $0 |
| Total | 2,488 (100.0%) | $36,580 |
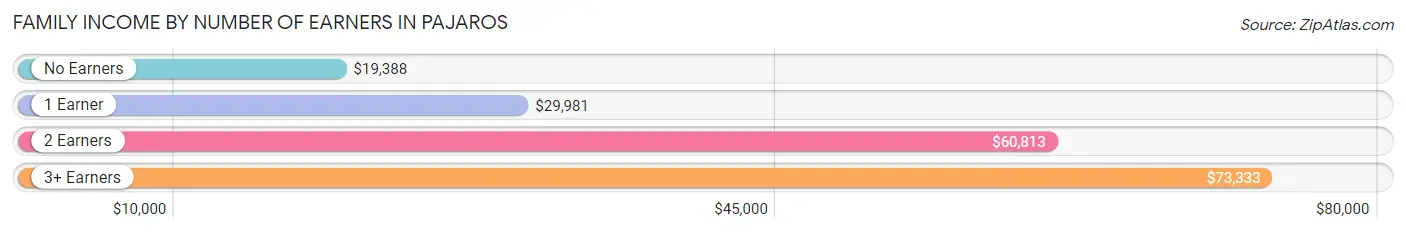
Family Income by Number of Earners in Pajaros
The median family income in Pajaros is $36,580, with families comprising 3+ earners (322) having the highest median family income of $73,333, while families with no earners (532) have the lowest median family income of $19,388, accounting for 12.9% and 21.4% of families, respectively.
| Number of Earners | # Families | Median Income |
| No Earners | 532 (21.4%) | $19,388 |
| 1 Earner | 991 (39.8%) | $29,981 |
| 2 Earners | 643 (25.8%) | $60,813 |
| 3+ Earners | 322 (12.9%) | $73,333 |
| Total | 2,488 (100.0%) | $36,580 |
Household Income in Pajaros
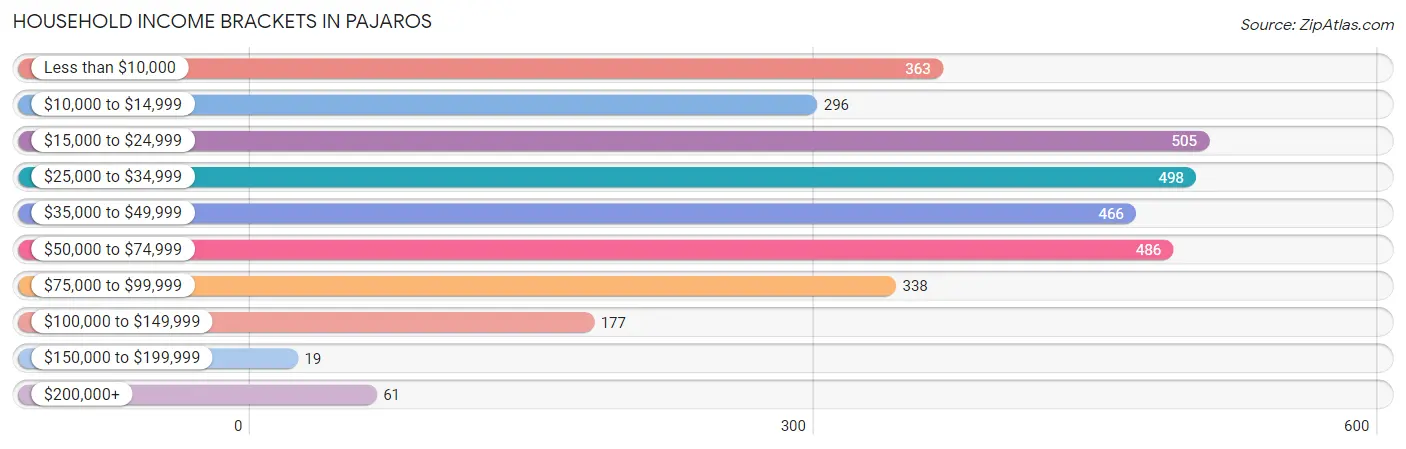
Household Income Brackets in Pajaros
With 505 households falling in the category, the $15,000 to $24,999 income range is the most frequent in Pajaros, accounting for 15.7% of all households. In contrast, only 19 households (0.6%) fall into the $150,000 to $199,999 income bracket, making it the least populous group.
| Income Bracket | # Households | % Households |
| Less than $10,000 | 363 | 11.3% |
| $10,000 to $14,999 | 296 | 9.2% |
| $15,000 to $24,999 | 505 | 15.7% |
| $25,000 to $34,999 | 498 | 15.5% |
| $35,000 to $49,999 | 466 | 14.5% |
| $50,000 to $74,999 | 486 | 15.1% |
| $75,000 to $99,999 | 338 | 10.5% |
| $100,000 to $149,999 | 177 | 5.5% |
| $150,000 to $199,999 | 19 | 0.6% |
| $200,000+ | 61 | 1.9% |
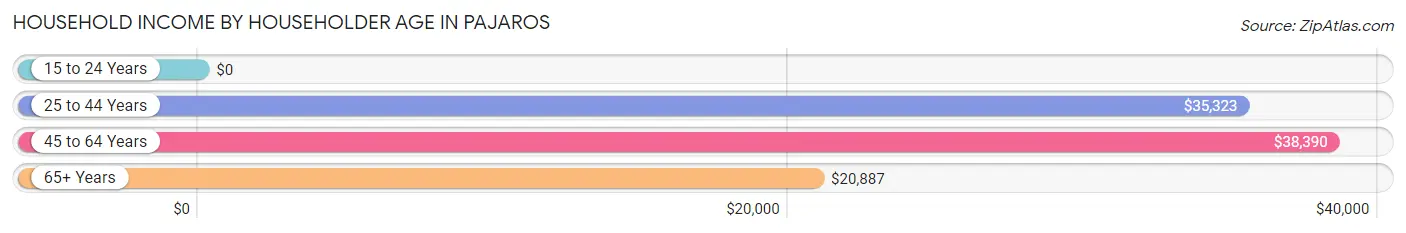
Household Income by Householder Age in Pajaros
The median household income in Pajaros is $34,190, with the highest median household income of $38,390 found in the 45 to 64 years age bracket for the primary householder. A total of 1,518 households (47.2%) fall into this category.
| Income Bracket | # Households | Median Income |
| 15 to 24 Years | 0 (0.0%) | $0 |
| 25 to 44 Years | 1,038 (32.3%) | $35,323 |
| 45 to 64 Years | 1,518 (47.2%) | $38,390 |
| 65+ Years | 660 (20.5%) | $20,887 |
| Total | 3,216 (100.0%) | $34,190 |
Poverty in Pajaros
Income Below Poverty by Sex and Age in Pajaros
With 32.0% poverty level for males and 35.2% for females among the residents of Pajaros, 6 to 11 year old males and 75 year old and over females are the most vulnerable to poverty, with 177 males (71.4%) and 128 females (52.7%) in their respective age groups living below the poverty level.
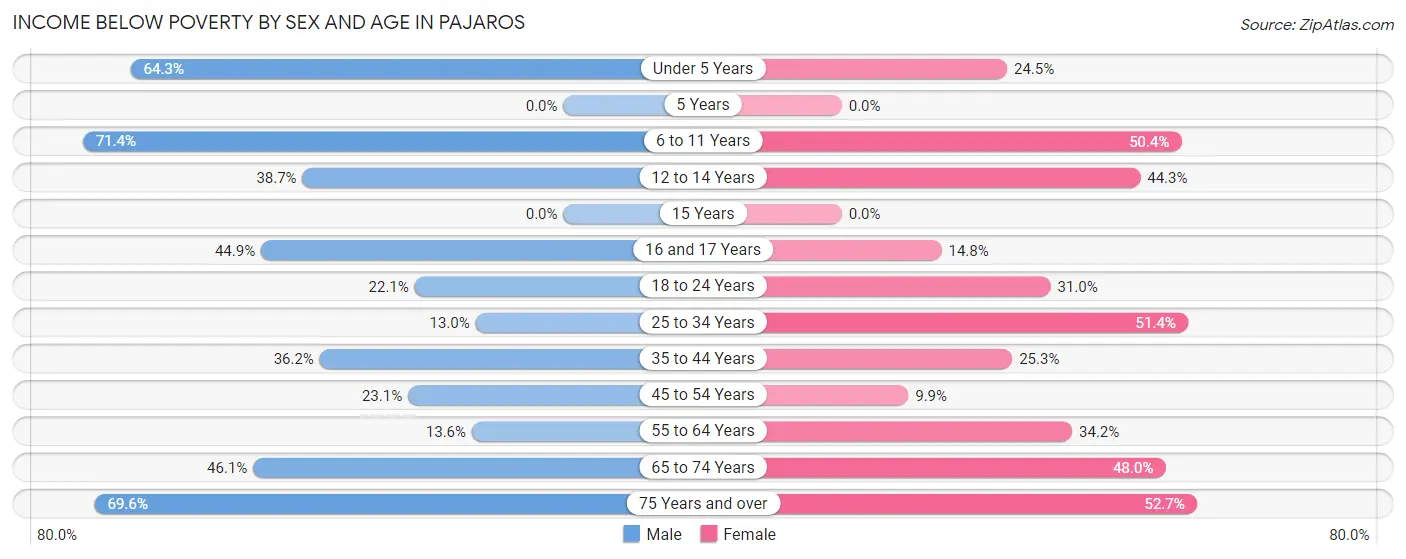
| Age Bracket | Male | Female |
| Under 5 Years | 133 (64.2%) | 40 (24.5%) |
| 5 Years | 0 (0.0%) | 0 (0.0%) |
| 6 to 11 Years | 177 (71.4%) | 249 (50.4%) |
| 12 to 14 Years | 43 (38.7%) | 86 (44.3%) |
| 15 Years | 0 (0.0%) | 0 (0.0%) |
| 16 and 17 Years | 66 (44.9%) | 16 (14.8%) |
| 18 to 24 Years | 99 (22.1%) | 186 (31.0%) |
| 25 to 34 Years | 63 (13.0%) | 532 (51.3%) |
| 35 to 44 Years | 233 (36.2%) | 244 (25.3%) |
| 45 to 54 Years | 155 (23.1%) | 74 (9.9%) |
| 55 to 64 Years | 81 (13.6%) | 288 (34.2%) |
| 65 to 74 Years | 146 (46.1%) | 255 (48.0%) |
| 75 Years and over | 110 (69.6%) | 128 (52.7%) |
| Total | 1,306 (32.0%) | 2,098 (35.2%) |
Income Above Poverty by Sex and Age in Pajaros
According to the poverty statistics in Pajaros, males aged 15 years and females aged 15 years are the age groups that are most secure financially, with 100.0% of males and 100.0% of females in these age groups living above the poverty line.
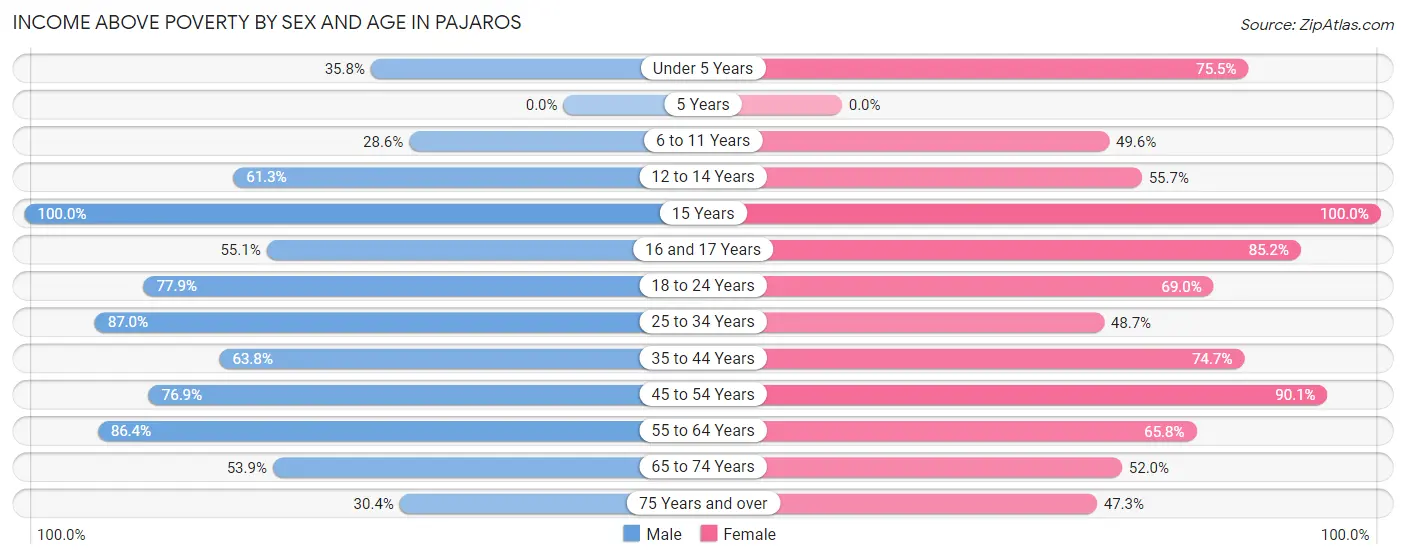
| Age Bracket | Male | Female |
| Under 5 Years | 74 (35.7%) | 123 (75.5%) |
| 5 Years | 0 (0.0%) | 0 (0.0%) |
| 6 to 11 Years | 71 (28.6%) | 245 (49.6%) |
| 12 to 14 Years | 68 (61.3%) | 108 (55.7%) |
| 15 Years | 55 (100.0%) | 32 (100.0%) |
| 16 and 17 Years | 81 (55.1%) | 92 (85.2%) |
| 18 to 24 Years | 349 (77.9%) | 414 (69.0%) |
| 25 to 34 Years | 420 (87.0%) | 504 (48.6%) |
| 35 to 44 Years | 411 (63.8%) | 720 (74.7%) |
| 45 to 54 Years | 517 (76.9%) | 676 (90.1%) |
| 55 to 64 Years | 515 (86.4%) | 554 (65.8%) |
| 65 to 74 Years | 171 (53.9%) | 276 (52.0%) |
| 75 Years and over | 48 (30.4%) | 115 (47.3%) |
| Total | 2,780 (68.0%) | 3,859 (64.8%) |
Income Below Poverty Among Married-Couple Families in Pajaros
The poverty statistics for married-couple families in Pajaros show that 19.4% or 295 of the total 1,518 families live below the poverty line. Families with 3 or 4 children have the highest poverty rate of 61.5%, comprising of 64 families. On the other hand, families with no children have the lowest poverty rate of 13.2%, which includes 134 families.
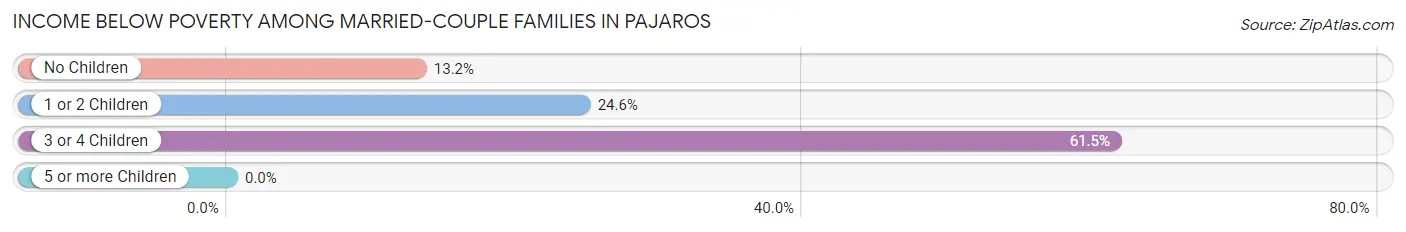
| Children | Above Poverty | Below Poverty |
| No Children | 885 (86.9%) | 134 (13.2%) |
| 1 or 2 Children | 298 (75.4%) | 97 (24.6%) |
| 3 or 4 Children | 40 (38.5%) | 64 (61.5%) |
| 5 or more Children | 0 (0.0%) | 0 (0.0%) |
| Total | 1,223 (80.6%) | 295 (19.4%) |
Income Below Poverty Among Single-Parent Households in Pajaros
According to the poverty data in Pajaros, 55.9% or 100 single-father households and 39.2% or 310 single-mother households are living below the poverty line. Among single-father households, those with no children have the highest poverty rate, with 30 households (68.2%) experiencing poverty. Likewise, among single-mother households, those with 3 or 4 children have the highest poverty rate, with 15 households (62.5%) falling below the poverty line.
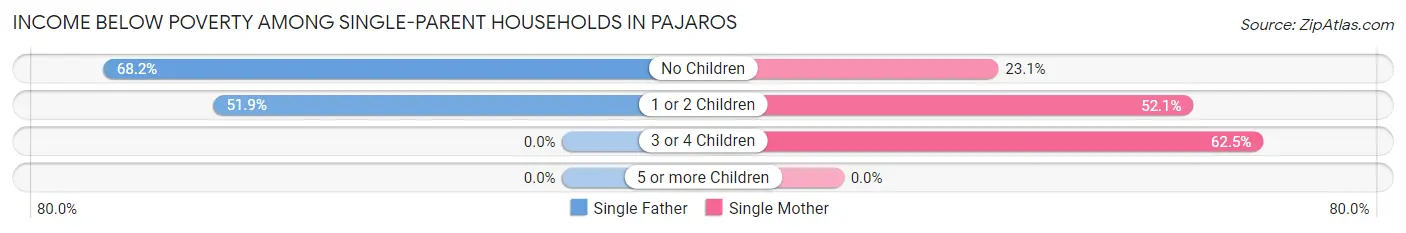
| Children | Single Father | Single Mother |
| No Children | 30 (68.2%) | 83 (23.1%) |
| 1 or 2 Children | 70 (51.8%) | 212 (52.1%) |
| 3 or 4 Children | 0 (0.0%) | 15 (62.5%) |
| 5 or more Children | 0 (0.0%) | 0 (0.0%) |
| Total | 100 (55.9%) | 310 (39.2%) |
Income Below Poverty Among Married-Couple vs Single-Parent Households in Pajaros
The poverty data for Pajaros shows that 295 of the married-couple family households (19.4%) and 410 of the single-parent households (42.3%) are living below the poverty level. Within the married-couple family households, those with 3 or 4 children have the highest poverty rate, with 64 households (61.5%) falling below the poverty line. Among the single-parent households, those with 3 or 4 children have the highest poverty rate, with 15 household (62.5%) living below poverty.
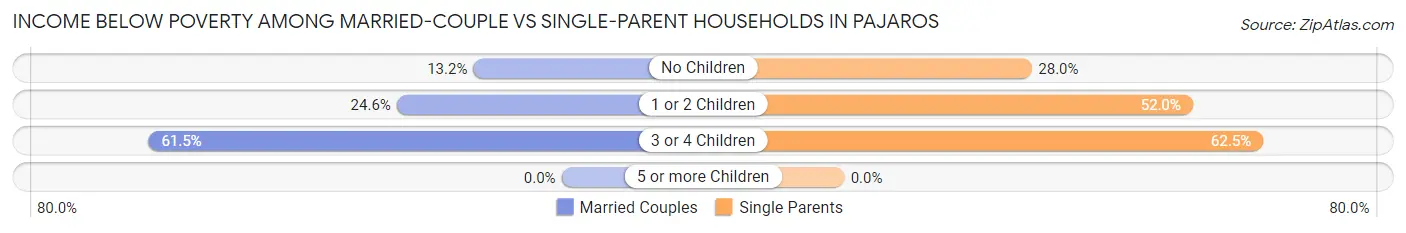
| Children | Married-Couple Families | Single-Parent Households |
| No Children | 134 (13.2%) | 113 (28.0%) |
| 1 or 2 Children | 97 (24.6%) | 282 (52.0%) |
| 3 or 4 Children | 64 (61.5%) | 15 (62.5%) |
| 5 or more Children | 0 (0.0%) | 0 (0.0%) |
| Total | 295 (19.4%) | 410 (42.3%) |
Race in Pajaros
The most populous races in Pajaros are Hispanic or Latino (9,986 | 99.4%), White / Caucasian (5,138 | 51.2%), and Some other Race (2,389 | 23.8%).
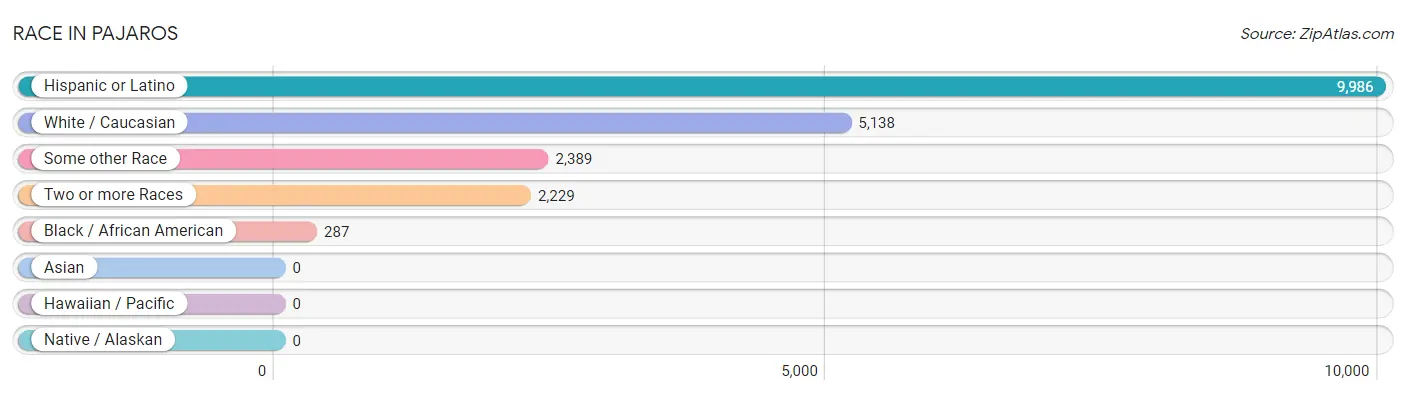
| Race | # Population | % Population |
| Asian | 0 | 0.0% |
| Black / African American | 287 | 2.9% |
| Hawaiian / Pacific | 0 | 0.0% |
| Hispanic or Latino | 9,986 | 99.4% |
| Native / Alaskan | 0 | 0.0% |
| White / Caucasian | 5,138 | 51.2% |
| Two or more Races | 2,229 | 22.2% |
| Some other Race | 2,389 | 23.8% |
| Total | 10,043 | 100.0% |
Ancestry in Pajaros
The most populous ancestries reported in Pajaros are Puerto Rican (9,932 | 98.9%), American (129 | 1.3%), U.S. Virgin Islander (33 | 0.3%), Central American Indian (18 | 0.2%), and Cuban (15 | 0.2%), together accounting for 100.8% of all Pajaros residents.
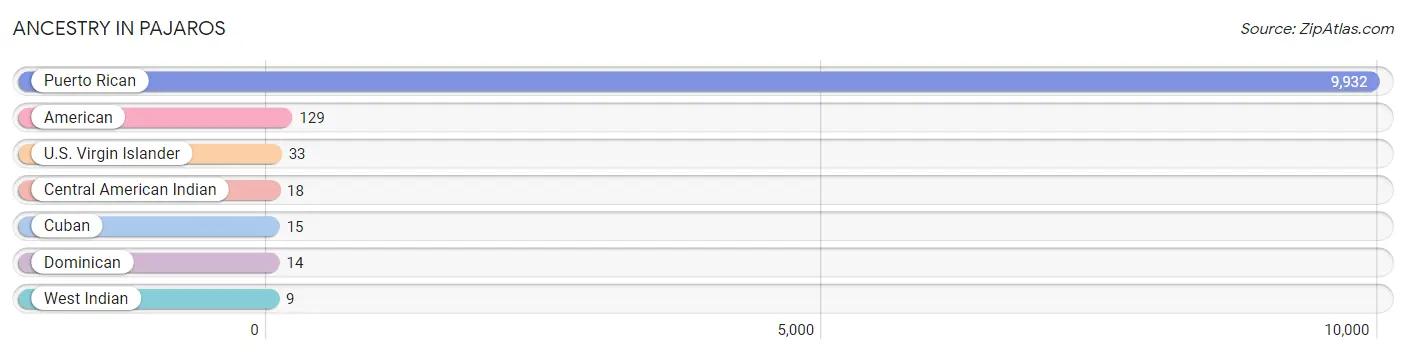
| Ancestry | # Population | % Population |
| American | 129 | 1.3% |
| Central American Indian | 18 | 0.2% |
| Cuban | 15 | 0.2% |
| Dominican | 14 | 0.1% |
| Puerto Rican | 9,932 | 98.9% |
| U.S. Virgin Islander | 33 | 0.3% |
| West Indian | 9 | 0.1% | View All 7 Rows |
Immigrants in Pajaros

| Immigration Origin | # Population | % Population | View All 0 Rows |
Sex and Age in Pajaros
Sex and Age in Pajaros
The most populous age groups in Pajaros are 45 to 49 Years (462 | 11.3%) for men and 25 to 29 Years (551 | 9.2%) for women.
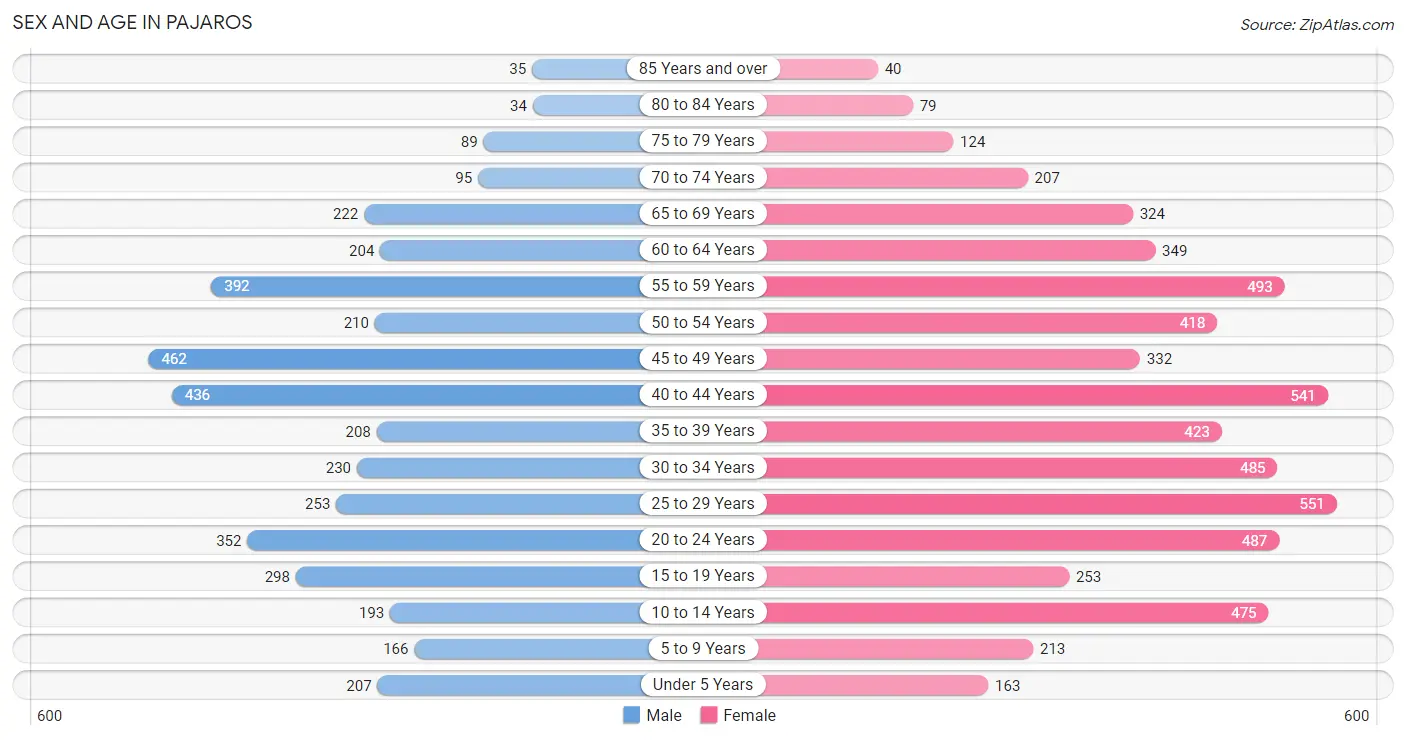
| Age Bracket | Male | Female |
| Under 5 Years | 207 (5.1%) | 163 (2.7%) |
| 5 to 9 Years | 166 (4.1%) | 213 (3.6%) |
| 10 to 14 Years | 193 (4.7%) | 475 (8.0%) |
| 15 to 19 Years | 298 (7.3%) | 253 (4.3%) |
| 20 to 24 Years | 352 (8.6%) | 487 (8.2%) |
| 25 to 29 Years | 253 (6.2%) | 551 (9.2%) |
| 30 to 34 Years | 230 (5.6%) | 485 (8.1%) |
| 35 to 39 Years | 208 (5.1%) | 423 (7.1%) |
| 40 to 44 Years | 436 (10.7%) | 541 (9.1%) |
| 45 to 49 Years | 462 (11.3%) | 332 (5.6%) |
| 50 to 54 Years | 210 (5.1%) | 418 (7.0%) |
| 55 to 59 Years | 392 (9.6%) | 493 (8.3%) |
| 60 to 64 Years | 204 (5.0%) | 349 (5.9%) |
| 65 to 69 Years | 222 (5.4%) | 324 (5.4%) |
| 70 to 74 Years | 95 (2.3%) | 207 (3.5%) |
| 75 to 79 Years | 89 (2.2%) | 124 (2.1%) |
| 80 to 84 Years | 34 (0.8%) | 79 (1.3%) |
| 85 Years and over | 35 (0.9%) | 40 (0.7%) |
| Total | 4,086 (100.0%) | 5,957 (100.0%) |
Families and Households in Pajaros
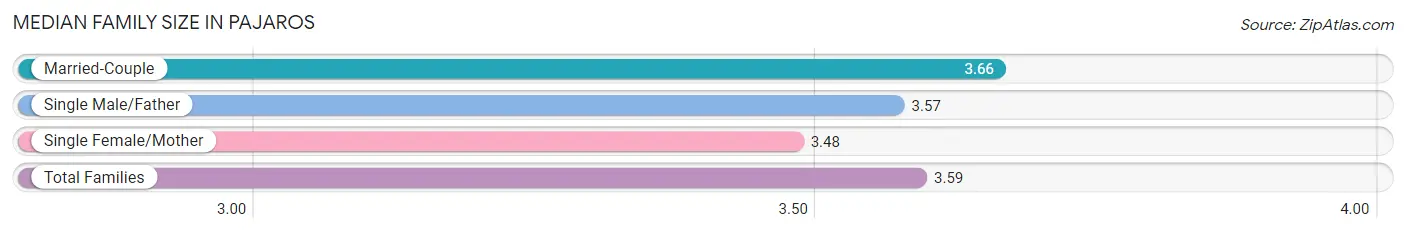
Median Family Size in Pajaros
The median family size in Pajaros is 3.59 persons per family, with married-couple families (1,518 | 61.0%) accounting for the largest median family size of 3.66 persons per family. On the other hand, single female/mother families (791 | 31.8%) represent the smallest median family size with 3.48 persons per family.
| Family Type | # Families | Family Size |
| Married-Couple | 1,518 (61.0%) | 3.66 |
| Single Male/Father | 179 (7.2%) | 3.57 |
| Single Female/Mother | 791 (31.8%) | 3.48 |
| Total Families | 2,488 (100.0%) | 3.59 |
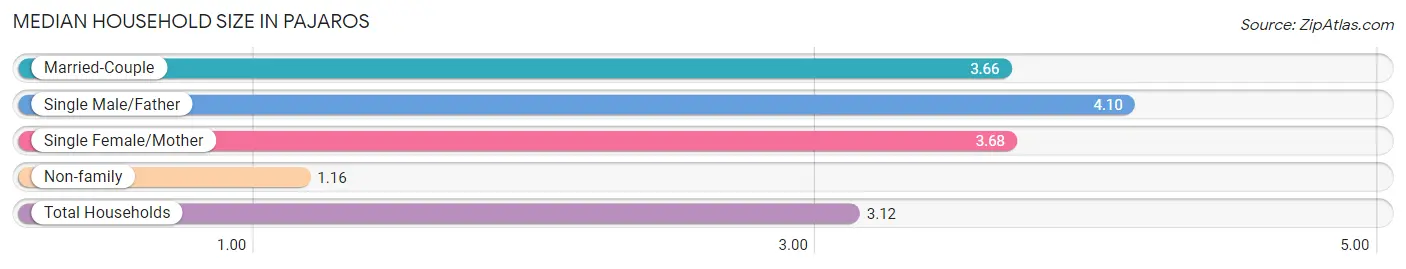
Median Household Size in Pajaros
The median household size in Pajaros is 3.12 persons per household, with single male/father households (179 | 5.6%) accounting for the largest median household size of 4.1 persons per household. non-family households (728 | 22.6%) represent the smallest median household size with 1.16 persons per household.
| Household Type | # Households | Household Size |
| Married-Couple | 1,518 (47.2%) | 3.66 |
| Single Male/Father | 179 (5.6%) | 4.10 |
| Single Female/Mother | 791 (24.6%) | 3.68 |
| Non-family | 728 (22.6%) | 1.16 |
| Total Households | 3,216 (100.0%) | 3.12 |
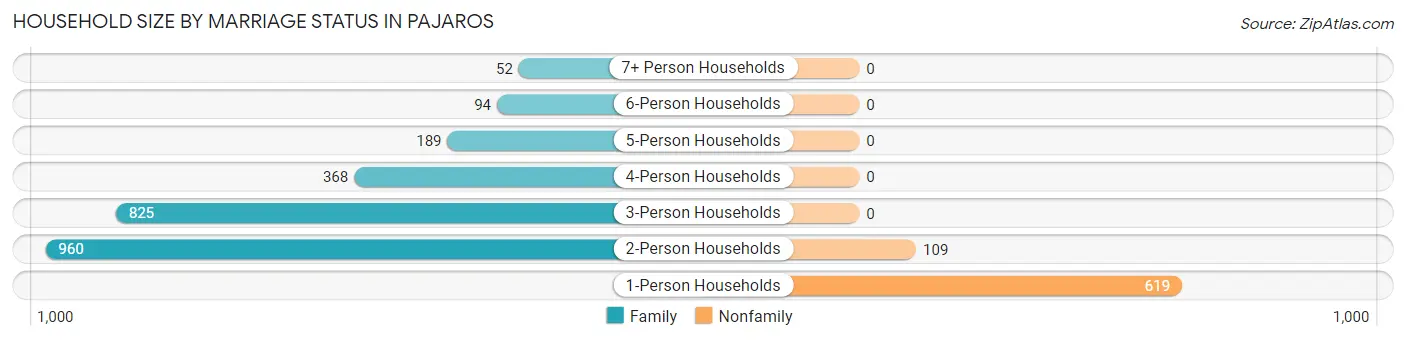
Household Size by Marriage Status in Pajaros
Out of a total of 3,216 households in Pajaros, 2,488 (77.4%) are family households, while 728 (22.6%) are nonfamily households. The most numerous type of family households are 2-person households, comprising 960, and the most common type of nonfamily households are 1-person households, comprising 619.
| Household Size | Family Households | Nonfamily Households |
| 1-Person Households | - | 619 (19.3%) |
| 2-Person Households | 960 (29.8%) | 109 (3.4%) |
| 3-Person Households | 825 (25.7%) | 0 (0.0%) |
| 4-Person Households | 368 (11.4%) | 0 (0.0%) |
| 5-Person Households | 189 (5.9%) | 0 (0.0%) |
| 6-Person Households | 94 (2.9%) | 0 (0.0%) |
| 7+ Person Households | 52 (1.6%) | 0 (0.0%) |
| Total | 2,488 (77.4%) | 728 (22.6%) |
Female Fertility in Pajaros
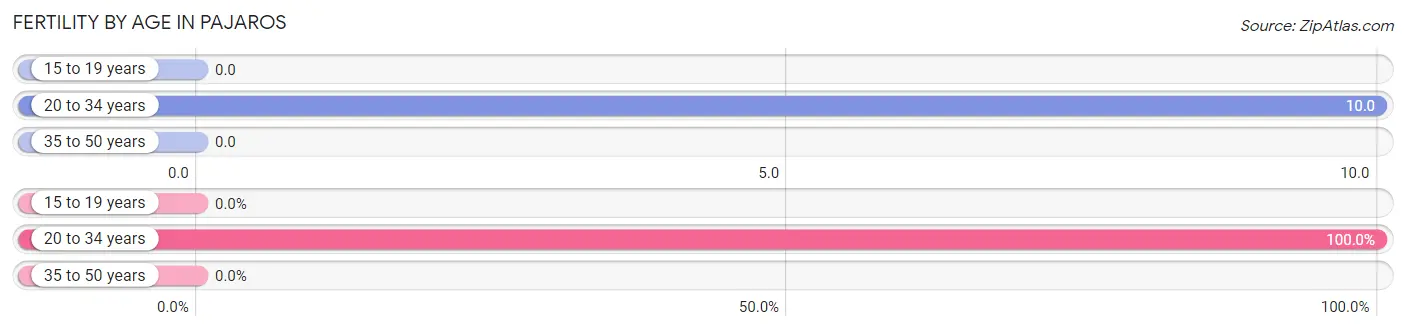
Fertility by Age in Pajaros
Average fertility rate in Pajaros is 5.0 births per 1,000 women. Women in the age bracket of 20 to 34 years have the highest fertility rate with 10.0 births per 1,000 women. Women in the age bracket of 20 to 34 years acount for 100.0% of all women with births.
| Age Bracket | Women with Births | Births / 1,000 Women |
| 15 to 19 years | 0 (0.0%) | 0.0 |
| 20 to 34 years | 15 (100.0%) | 10.0 |
| 35 to 50 years | 0 (0.0%) | 0.0 |
| Total | 15 (100.0%) | 5.0 |
Fertility by Age by Marriage Status in Pajaros
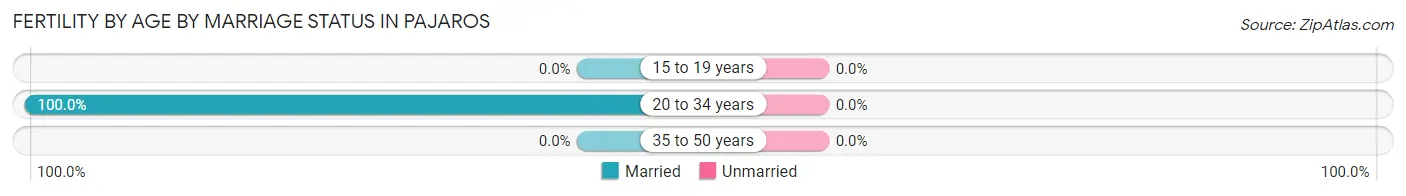
| Age Bracket | Married | Unmarried |
| 15 to 19 years | 0 (0.0%) | 0 (0.0%) |
| 20 to 34 years | 15 (100.0%) | 0 (0.0%) |
| 35 to 50 years | 0 (0.0%) | 0 (0.0%) |
| Total | 15 (100.0%) | 0 (0.0%) |
Fertility by Education in Pajaros
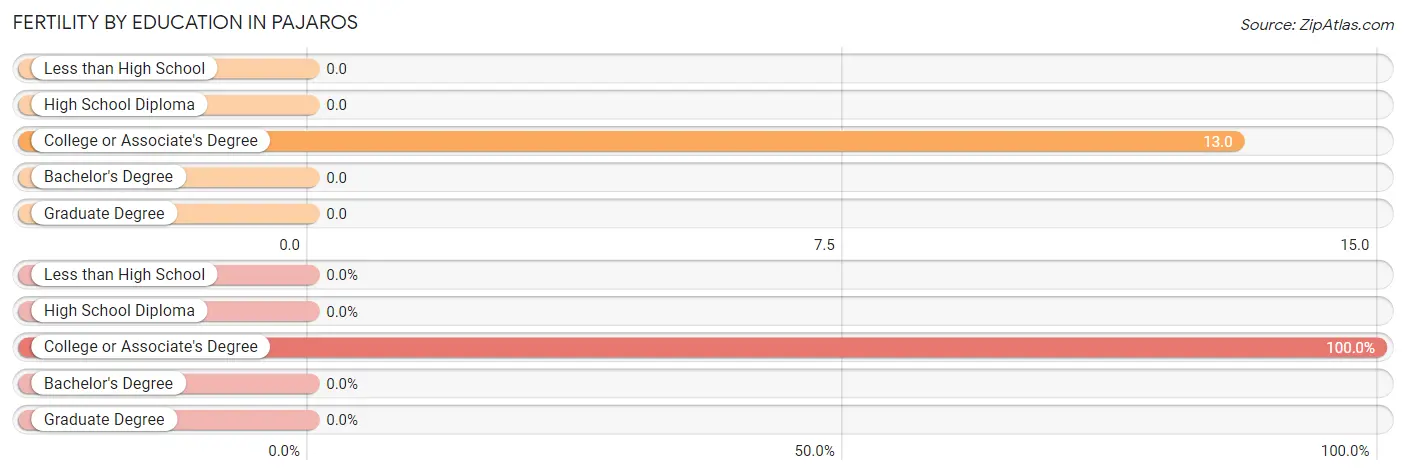
| Educational Attainment | Women with Births | Births / 1,000 Women |
| Less than High School | 0 (0.0%) | 0.0 |
| High School Diploma | 0 (0.0%) | 0.0 |
| College or Associate's Degree | 15 (100.0%) | 13.0 |
| Bachelor's Degree | 0 (0.0%) | 0.0 |
| Graduate Degree | 0 (0.0%) | 0.0 |
| Total | 15 (100.0%) | 5.0 |
Fertility by Education by Marriage Status in Pajaros
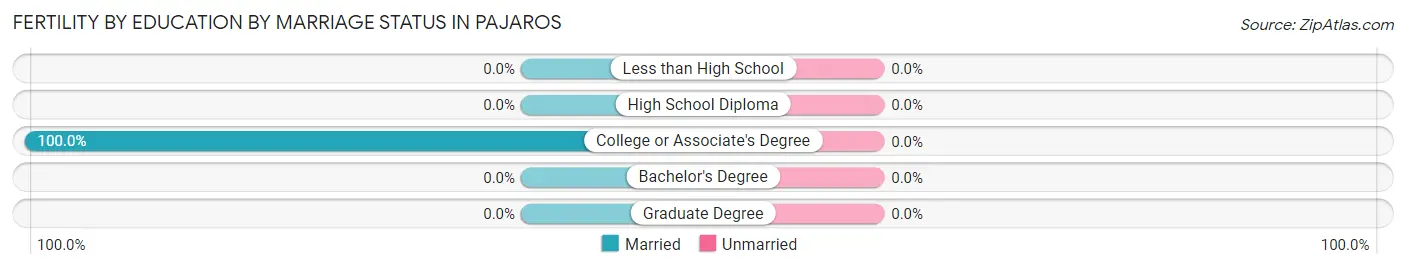
| Educational Attainment | Married | Unmarried |
| Less than High School | 0 (0.0%) | 0 (0.0%) |
| High School Diploma | 0 (0.0%) | 0 (0.0%) |
| College or Associate's Degree | 15 (100.0%) | 0 (0.0%) |
| Bachelor's Degree | 0 (0.0%) | 0 (0.0%) |
| Graduate Degree | 0 (0.0%) | 0 (0.0%) |
| Total | 15 (100.0%) | 0 (0.0%) |
Employment Characteristics in Pajaros
Employment by Class of Employer in Pajaros
Among the 4,421 employed individuals in Pajaros, private company employees (3,146 | 71.2%), not-for-profit organizations (284 | 6.4%), and local government employees (277 | 6.3%) make up the most common classes of employment.
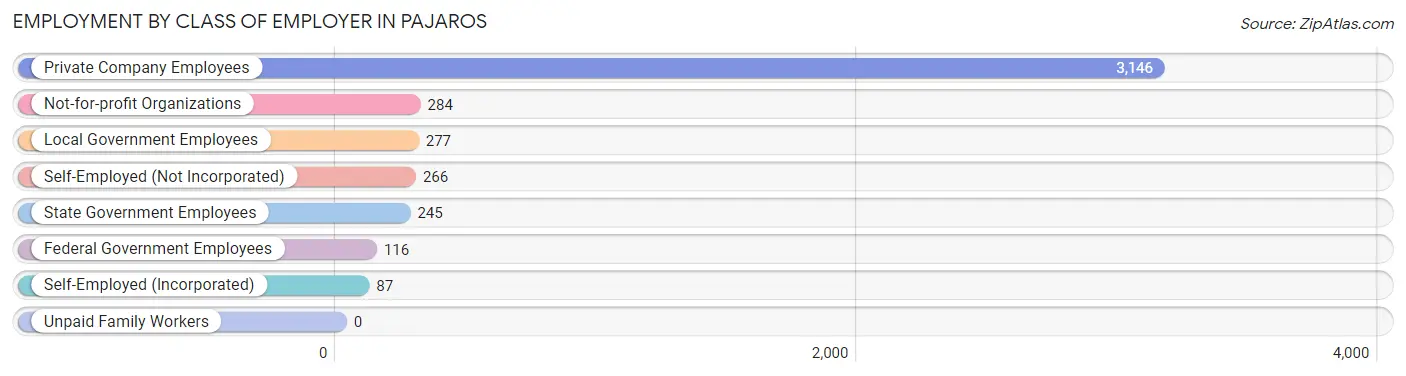
| Employer Class | # Employees | % Employees |
| Private Company Employees | 3,146 | 71.2% |
| Self-Employed (Incorporated) | 87 | 2.0% |
| Self-Employed (Not Incorporated) | 266 | 6.0% |
| Not-for-profit Organizations | 284 | 6.4% |
| Local Government Employees | 277 | 6.3% |
| State Government Employees | 245 | 5.5% |
| Federal Government Employees | 116 | 2.6% |
| Unpaid Family Workers | 0 | 0.0% |
| Total | 4,421 | 100.0% |
Employment Status by Age in Pajaros
According to the labor force statistics for Pajaros, out of the total population over 16 years of age (8,539), 56.8% or 4,850 individuals are in the labor force, with 7.0% or 340 of them unemployed. The age group with the highest labor force participation rate is 30 to 34 years, with 88.3% or 631 individuals in the labor force. Within the labor force, the 20 to 24 years age range has the highest percentage of unemployed individuals, with 27.2% or 138 of them being unemployed.
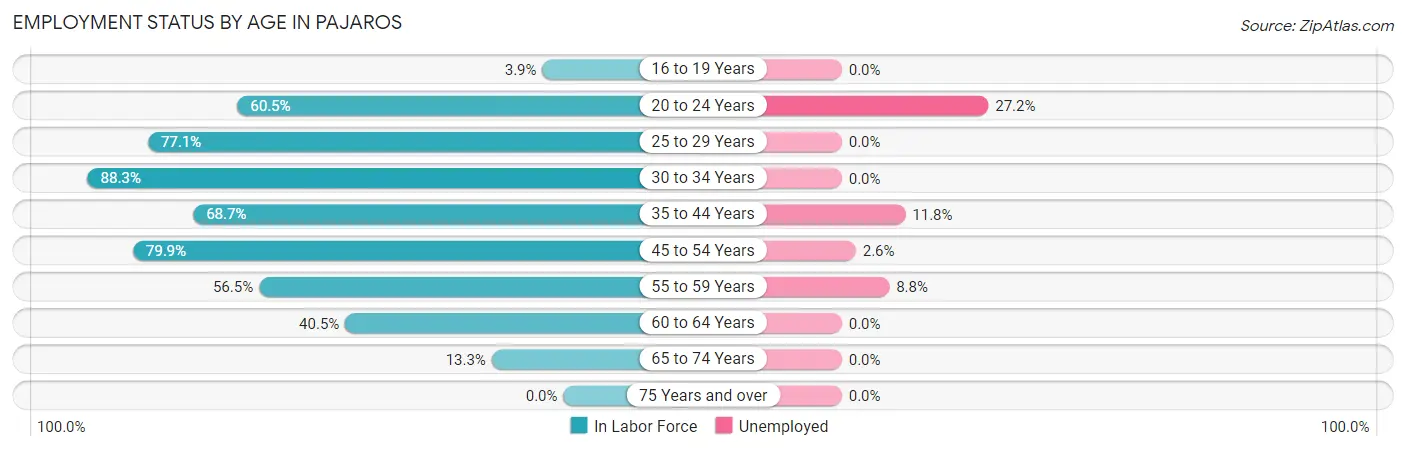
| Age Bracket | In Labor Force | Unemployed |
| 16 to 19 Years | 18 (3.9%) | 0 (0.0%) |
| 20 to 24 Years | 508 (60.5%) | 138 (27.2%) |
| 25 to 29 Years | 620 (77.1%) | 0 (0.0%) |
| 30 to 34 Years | 631 (88.3%) | 0 (0.0%) |
| 35 to 44 Years | 1,105 (68.7%) | 130 (11.8%) |
| 45 to 54 Years | 1,136 (79.9%) | 30 (2.6%) |
| 55 to 59 Years | 500 (56.5%) | 44 (8.8%) |
| 60 to 64 Years | 224 (40.5%) | 0 (0.0%) |
| 65 to 74 Years | 113 (13.3%) | 0 (0.0%) |
| 75 Years and over | 0 (0.0%) | 0 (0.0%) |
| Total | 4,850 (56.8%) | 340 (7.0%) |
Employment Status by Educational Attainment in Pajaros
According to labor force statistics for Pajaros, 70.4% of individuals (4,215) out of the total population between 25 and 64 years of age (5,987) are in the labor force, with 4.8% or 202 of them being unemployed. The group with the highest labor force participation rate are those with the educational attainment of bachelor's degree or higher, with 87.2% or 1,490 individuals in the labor force. Within the labor force, individuals with less than high school education have the highest percentage of unemployment, with 58.4% or 128 of them being unemployed.
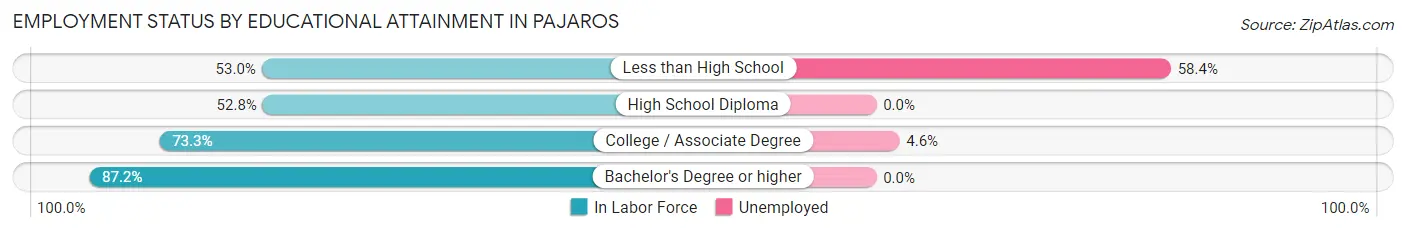
| Educational Attainment | In Labor Force | Unemployed |
| Less than High School | 219 (53.0%) | 241 (58.4%) |
| High School Diploma | 844 (52.8%) | 0 (0.0%) |
| College / Associate Degree | 1,661 (73.3%) | 104 (4.6%) |
| Bachelor's Degree or higher | 1,490 (87.2%) | 0 (0.0%) |
| Total | 4,215 (70.4%) | 287 (4.8%) |
Employment Occupations by Sex in Pajaros
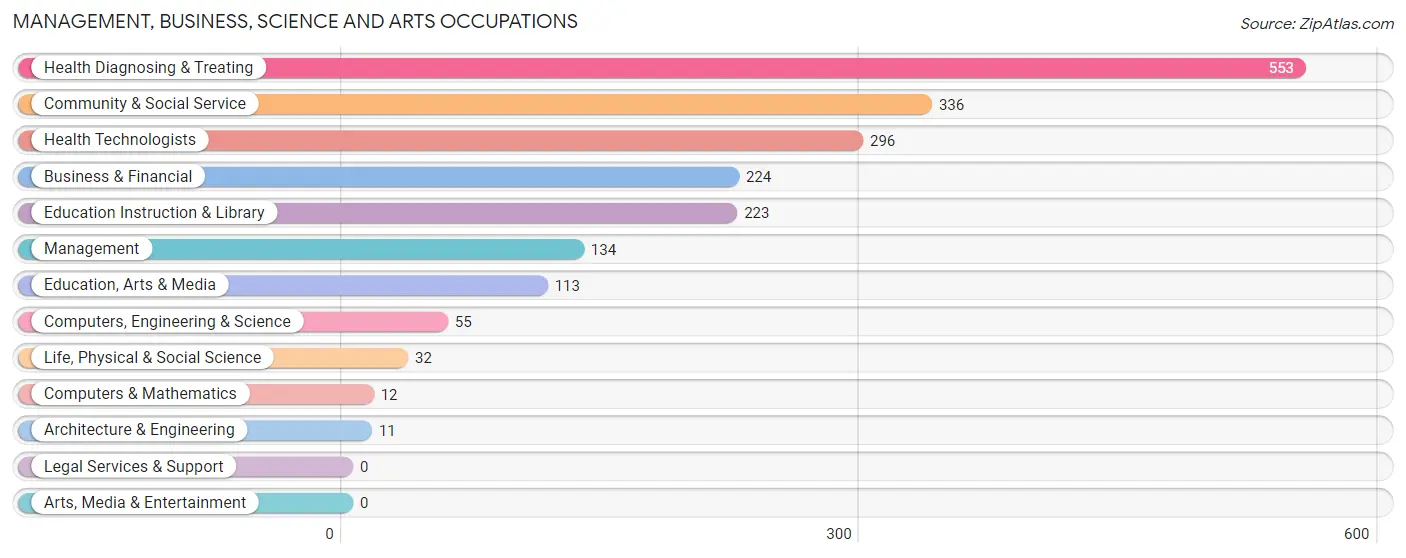
Management, Business, Science and Arts Occupations
The most common Management, Business, Science and Arts occupations in Pajaros are Health Diagnosing & Treating (553 | 12.3%), Community & Social Service (336 | 7.4%), Health Technologists (296 | 6.6%), Business & Financial (224 | 5.0%), and Education Instruction & Library (223 | 4.9%).
Management, Business, Science and Arts Occupations by Sex
Within the Management, Business, Science and Arts occupations in Pajaros, the most male-oriented occupations are Computers & Mathematics (100.0%), Architecture & Engineering (100.0%), and Business & Financial (66.1%), while the most female-oriented occupations are Education, Arts & Media (100.0%), Health Technologists (95.3%), and Health Diagnosing & Treating (89.1%).
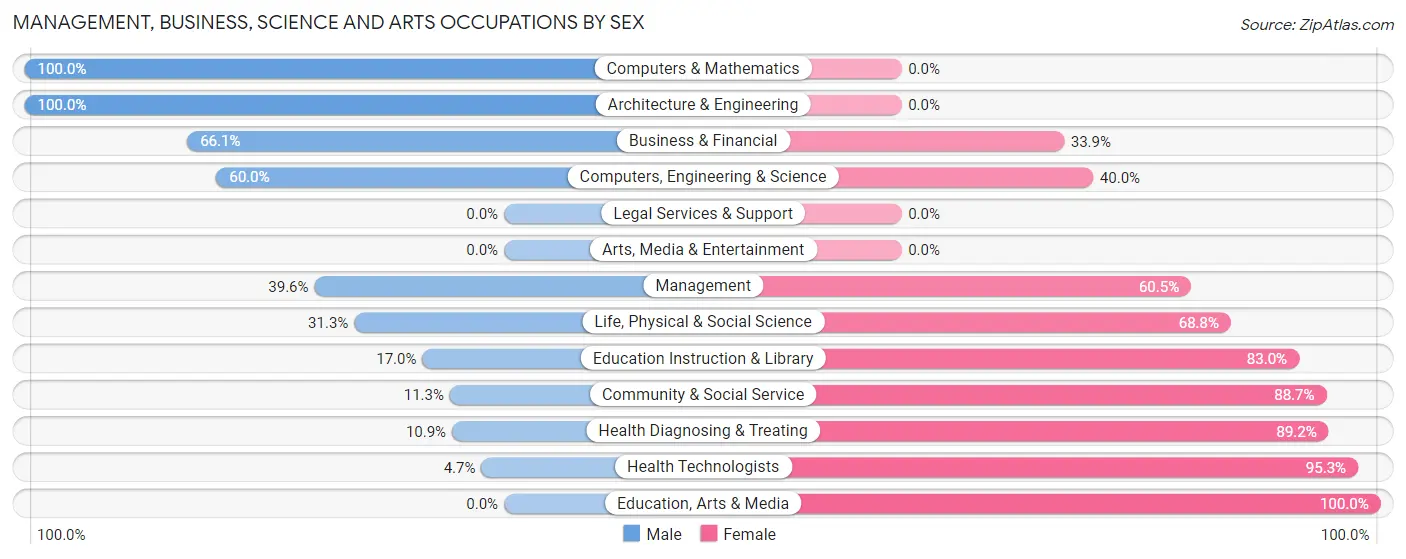
| Occupation | Male | Female |
| Management | 53 (39.6%) | 81 (60.5%) |
| Business & Financial | 148 (66.1%) | 76 (33.9%) |
| Computers, Engineering & Science | 33 (60.0%) | 22 (40.0%) |
| Computers & Mathematics | 12 (100.0%) | 0 (0.0%) |
| Architecture & Engineering | 11 (100.0%) | 0 (0.0%) |
| Life, Physical & Social Science | 10 (31.2%) | 22 (68.8%) |
| Community & Social Service | 38 (11.3%) | 298 (88.7%) |
| Education, Arts & Media | 0 (0.0%) | 113 (100.0%) |
| Legal Services & Support | 0 (0.0%) | 0 (0.0%) |
| Education Instruction & Library | 38 (17.0%) | 185 (83.0%) |
| Arts, Media & Entertainment | 0 (0.0%) | 0 (0.0%) |
| Health Diagnosing & Treating | 60 (10.8%) | 493 (89.1%) |
| Health Technologists | 14 (4.7%) | 282 (95.3%) |
| Total (Category) | 332 (25.5%) | 970 (74.5%) |
| Total (Overall) | 1,982 (43.9%) | 2,530 (56.1%) |
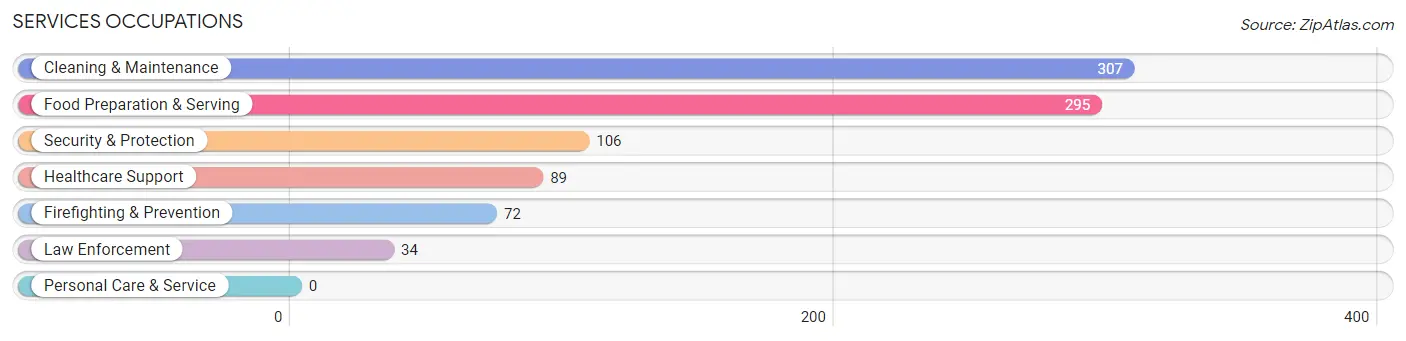
Services Occupations
The most common Services occupations in Pajaros are Cleaning & Maintenance (307 | 6.8%), Food Preparation & Serving (295 | 6.5%), Security & Protection (106 | 2.4%), Healthcare Support (89 | 2.0%), and Firefighting & Prevention (72 | 1.6%).
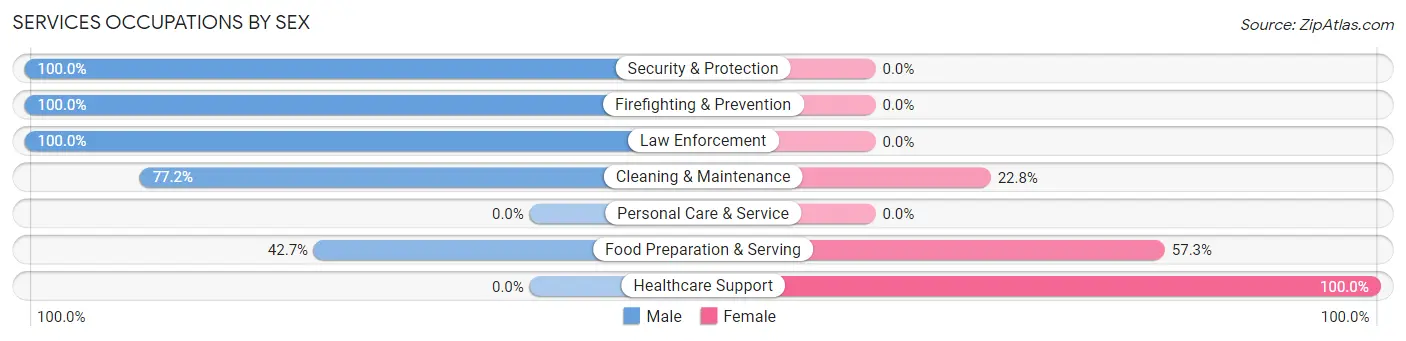
Services Occupations by Sex
Within the Services occupations in Pajaros, the most male-oriented occupations are Security & Protection (100.0%), Firefighting & Prevention (100.0%), and Law Enforcement (100.0%), while the most female-oriented occupations are Healthcare Support (100.0%), Food Preparation & Serving (57.3%), and Cleaning & Maintenance (22.8%).
| Occupation | Male | Female |
| Healthcare Support | 0 (0.0%) | 89 (100.0%) |
| Security & Protection | 106 (100.0%) | 0 (0.0%) |
| Firefighting & Prevention | 72 (100.0%) | 0 (0.0%) |
| Law Enforcement | 34 (100.0%) | 0 (0.0%) |
| Food Preparation & Serving | 126 (42.7%) | 169 (57.3%) |
| Cleaning & Maintenance | 237 (77.2%) | 70 (22.8%) |
| Personal Care & Service | 0 (0.0%) | 0 (0.0%) |
| Total (Category) | 469 (58.9%) | 328 (41.1%) |
| Total (Overall) | 1,982 (43.9%) | 2,530 (56.1%) |
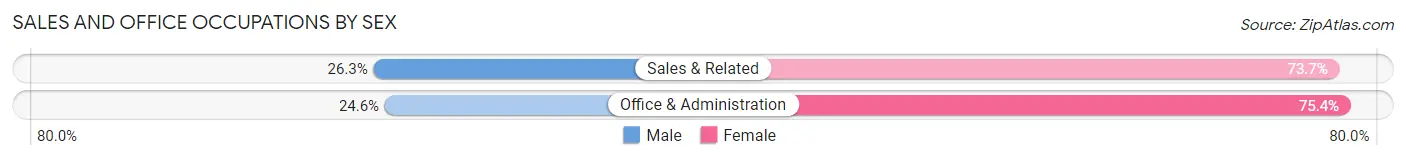
Sales and Office Occupations
The most common Sales and Office occupations in Pajaros are Office & Administration (802 | 17.8%), and Sales & Related (631 | 14.0%).

Sales and Office Occupations by Sex
| Occupation | Male | Female |
| Sales & Related | 166 (26.3%) | 465 (73.7%) |
| Office & Administration | 197 (24.6%) | 605 (75.4%) |
| Total (Category) | 363 (25.3%) | 1,070 (74.7%) |
| Total (Overall) | 1,982 (43.9%) | 2,530 (56.1%) |
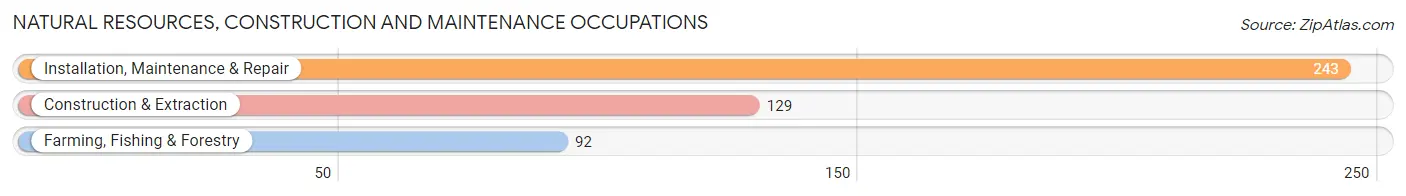
Natural Resources, Construction and Maintenance Occupations
The most common Natural Resources, Construction and Maintenance occupations in Pajaros are Installation, Maintenance & Repair (243 | 5.4%), Construction & Extraction (129 | 2.9%), and Farming, Fishing & Forestry (92 | 2.0%).
Natural Resources, Construction and Maintenance Occupations by Sex
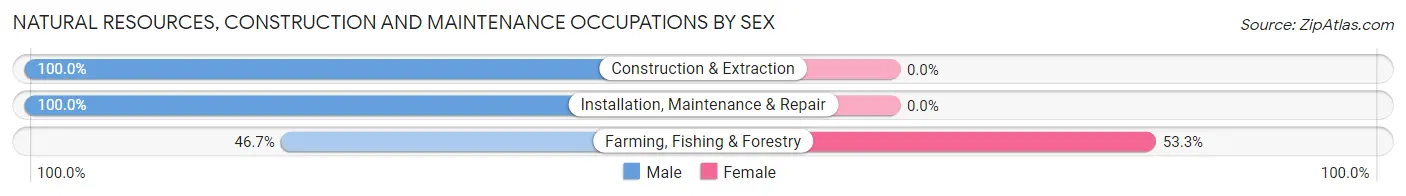
| Occupation | Male | Female |
| Farming, Fishing & Forestry | 43 (46.7%) | 49 (53.3%) |
| Construction & Extraction | 129 (100.0%) | 0 (0.0%) |
| Installation, Maintenance & Repair | 243 (100.0%) | 0 (0.0%) |
| Total (Category) | 415 (89.4%) | 49 (10.6%) |
| Total (Overall) | 1,982 (43.9%) | 2,530 (56.1%) |
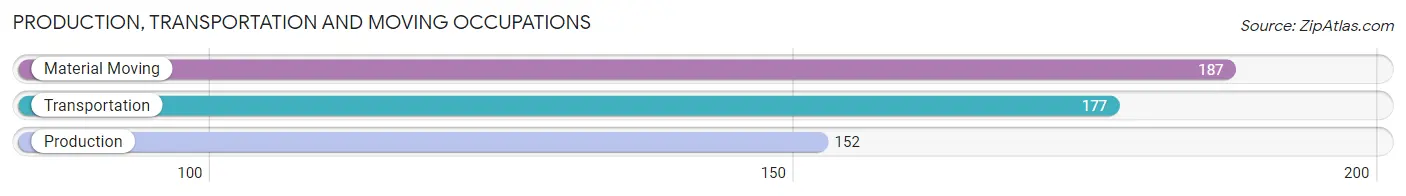
Production, Transportation and Moving Occupations
The most common Production, Transportation and Moving occupations in Pajaros are Material Moving (187 | 4.1%), Transportation (177 | 3.9%), and Production (152 | 3.4%).
Production, Transportation and Moving Occupations by Sex
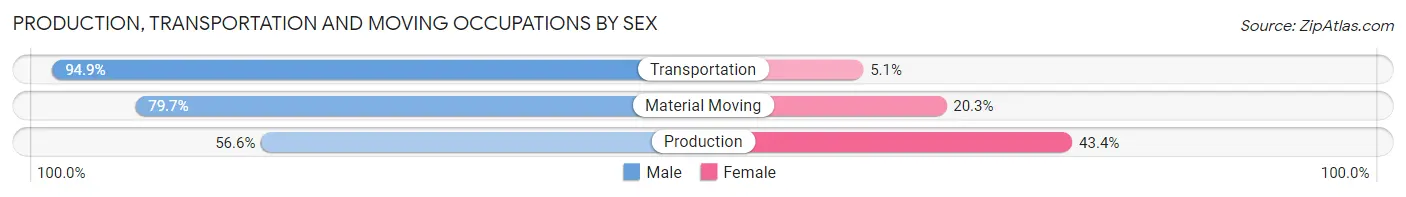
| Occupation | Male | Female |
| Production | 86 (56.6%) | 66 (43.4%) |
| Transportation | 168 (94.9%) | 9 (5.1%) |
| Material Moving | 149 (79.7%) | 38 (20.3%) |
| Total (Category) | 403 (78.1%) | 113 (21.9%) |
| Total (Overall) | 1,982 (43.9%) | 2,530 (56.1%) |
Employment Industries by Sex in Pajaros
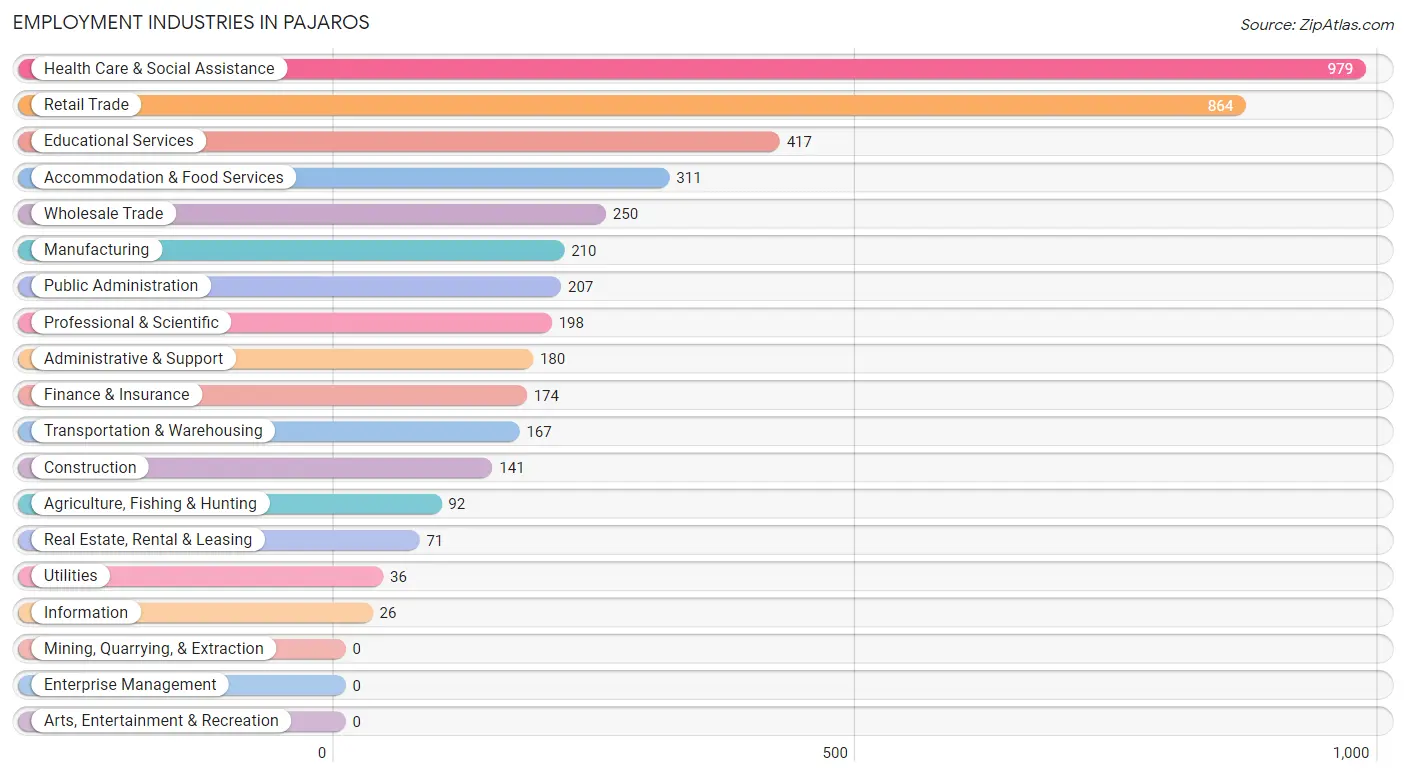
Employment Industries in Pajaros
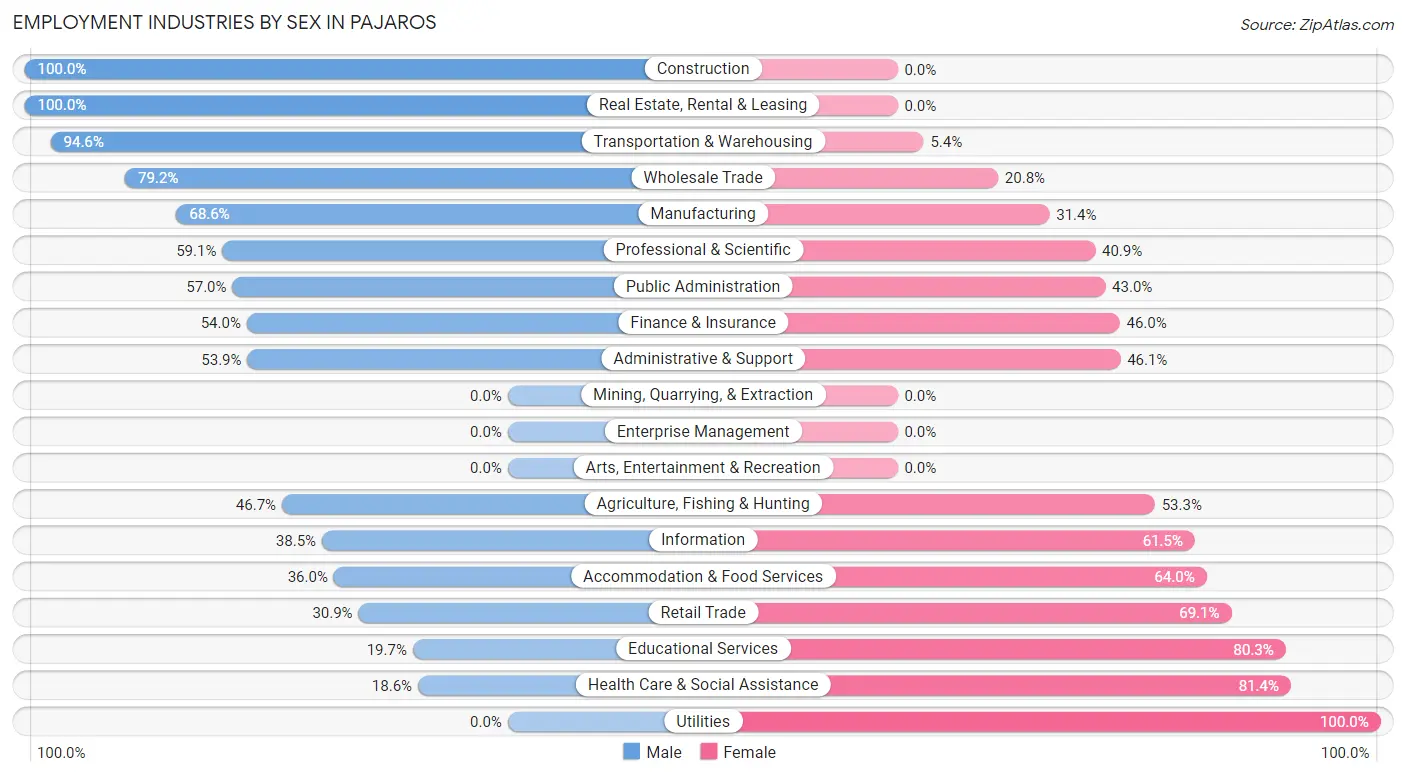
The major employment industries in Pajaros include Health Care & Social Assistance (979 | 21.7%), Retail Trade (864 | 19.2%), Educational Services (417 | 9.2%), Accommodation & Food Services (311 | 6.9%), and Wholesale Trade (250 | 5.5%).
Employment Industries by Sex in Pajaros
The Pajaros industries that see more men than women are Construction (100.0%), Real Estate, Rental & Leasing (100.0%), and Transportation & Warehousing (94.6%), whereas the industries that tend to have a higher number of women are Utilities (100.0%), Health Care & Social Assistance (81.4%), and Educational Services (80.3%).
| Industry | Male | Female |
| Agriculture, Fishing & Hunting | 43 (46.7%) | 49 (53.3%) |
| Mining, Quarrying, & Extraction | 0 (0.0%) | 0 (0.0%) |
| Construction | 141 (100.0%) | 0 (0.0%) |
| Manufacturing | 144 (68.6%) | 66 (31.4%) |
| Wholesale Trade | 198 (79.2%) | 52 (20.8%) |
| Retail Trade | 267 (30.9%) | 597 (69.1%) |
| Transportation & Warehousing | 158 (94.6%) | 9 (5.4%) |
| Utilities | 0 (0.0%) | 36 (100.0%) |
| Information | 10 (38.5%) | 16 (61.5%) |
| Finance & Insurance | 94 (54.0%) | 80 (46.0%) |
| Real Estate, Rental & Leasing | 71 (100.0%) | 0 (0.0%) |
| Professional & Scientific | 117 (59.1%) | 81 (40.9%) |
| Enterprise Management | 0 (0.0%) | 0 (0.0%) |
| Administrative & Support | 97 (53.9%) | 83 (46.1%) |
| Educational Services | 82 (19.7%) | 335 (80.3%) |
| Health Care & Social Assistance | 182 (18.6%) | 797 (81.4%) |
| Arts, Entertainment & Recreation | 0 (0.0%) | 0 (0.0%) |
| Accommodation & Food Services | 112 (36.0%) | 199 (64.0%) |
| Public Administration | 118 (57.0%) | 89 (43.0%) |
| Total | 1,982 (43.9%) | 2,530 (56.1%) |
Education in Pajaros
School Enrollment in Pajaros
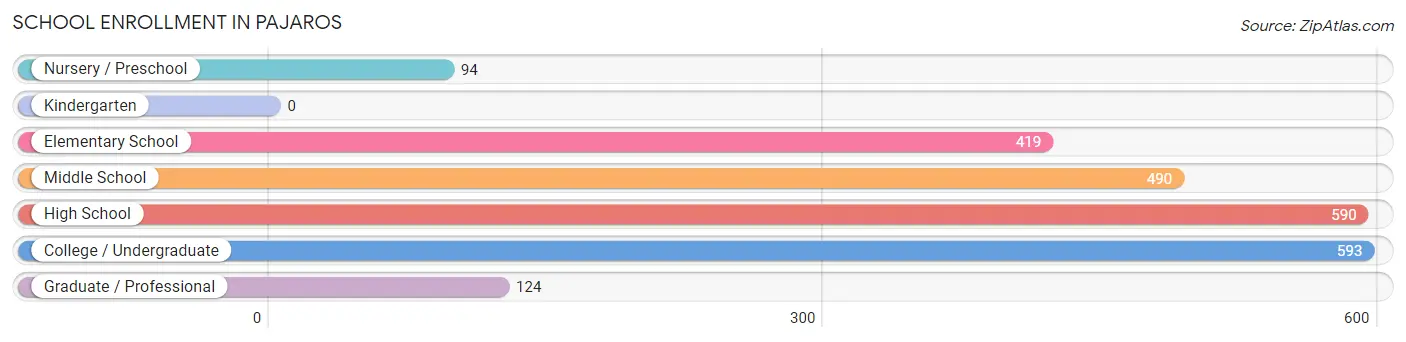
The most common levels of schooling among the 2,310 students in Pajaros are college / undergraduate (593 | 25.7%), high school (590 | 25.5%), and middle school (490 | 21.2%).
| School Level | # Students | % Students |
| Nursery / Preschool | 94 | 4.1% |
| Kindergarten | 0 | 0.0% |
| Elementary School | 419 | 18.1% |
| Middle School | 490 | 21.2% |
| High School | 590 | 25.5% |
| College / Undergraduate | 593 | 25.7% |
| Graduate / Professional | 124 | 5.4% |
| Total | 2,310 | 100.0% |
School Enrollment by Age by Funding Source in Pajaros
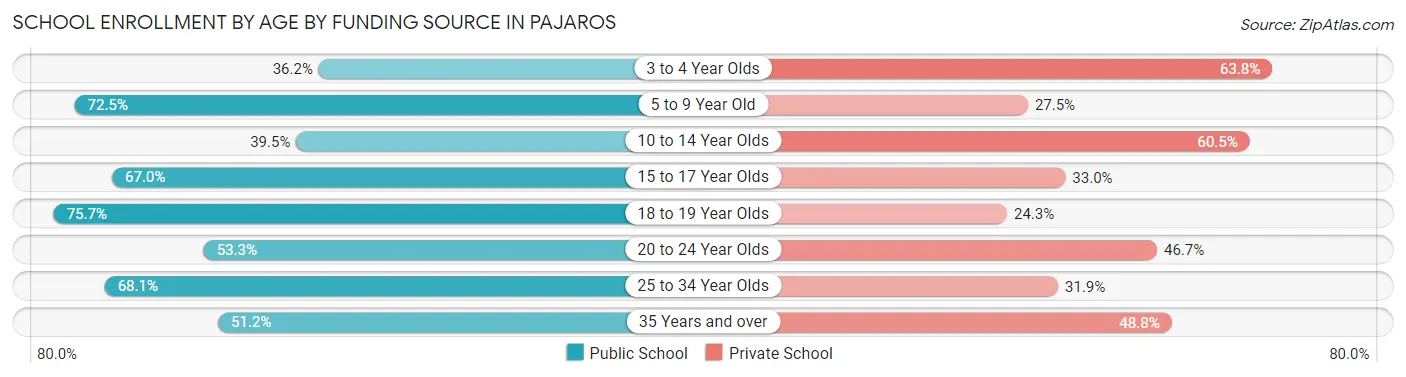
Out of a total of 2,310 students who are enrolled in schools in Pajaros, 1,033 (44.7%) attend a private institution, while the remaining 1,277 (55.3%) are enrolled in public schools. The age group of 3 to 4 year olds has the highest likelihood of being enrolled in private schools, with 60 (63.8% in the age bracket) enrolled. Conversely, the age group of 18 to 19 year olds has the lowest likelihood of being enrolled in a private school, with 115 (75.7% in the age bracket) attending a public institution.
| Age Bracket | Public School | Private School |
| 3 to 4 Year Olds | 34 (36.2%) | 60 (63.8%) |
| 5 to 9 Year Old | 243 (72.5%) | 92 (27.5%) |
| 10 to 14 Year Olds | 264 (39.5%) | 404 (60.5%) |
| 15 to 17 Year Olds | 229 (67.0%) | 113 (33.0%) |
| 18 to 19 Year Olds | 115 (75.7%) | 37 (24.3%) |
| 20 to 24 Year Olds | 299 (53.3%) | 262 (46.7%) |
| 25 to 34 Year Olds | 49 (68.1%) | 23 (31.9%) |
| 35 Years and over | 44 (51.2%) | 42 (48.8%) |
| Total | 1,277 (55.3%) | 1,033 (44.7%) |
Educational Attainment by Field of Study in Pajaros
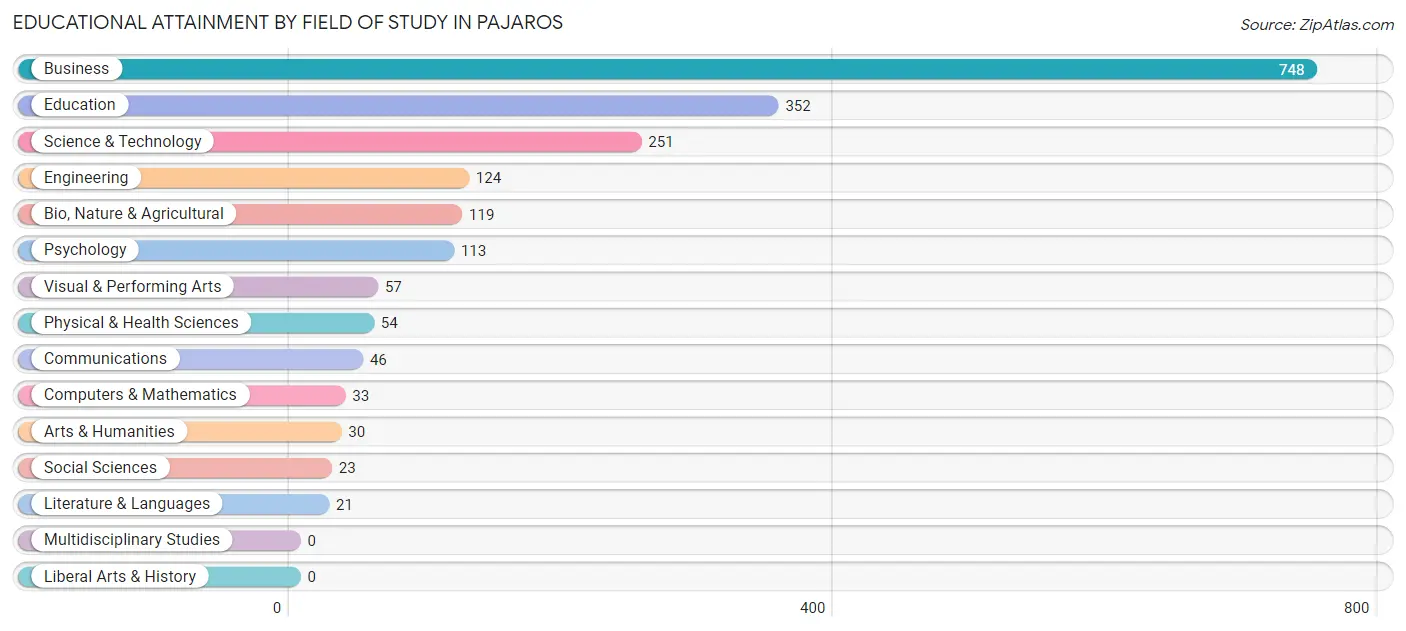
Business (748 | 38.0%), education (352 | 17.9%), science & technology (251 | 12.7%), engineering (124 | 6.3%), and bio, nature & agricultural (119 | 6.0%) are the most common fields of study among 1,971 individuals in Pajaros who have obtained a bachelor's degree or higher.
| Field of Study | # Graduates | % Graduates |
| Computers & Mathematics | 33 | 1.7% |
| Bio, Nature & Agricultural | 119 | 6.0% |
| Physical & Health Sciences | 54 | 2.7% |
| Psychology | 113 | 5.7% |
| Social Sciences | 23 | 1.2% |
| Engineering | 124 | 6.3% |
| Multidisciplinary Studies | 0 | 0.0% |
| Science & Technology | 251 | 12.7% |
| Business | 748 | 38.0% |
| Education | 352 | 17.9% |
| Literature & Languages | 21 | 1.1% |
| Liberal Arts & History | 0 | 0.0% |
| Visual & Performing Arts | 57 | 2.9% |
| Communications | 46 | 2.3% |
| Arts & Humanities | 30 | 1.5% |
| Total | 1,971 | 100.0% |
Transportation & Commute in Pajaros
Vehicle Availability by Sex in Pajaros
The most prevalent vehicle ownership categories in Pajaros are males with 2 vehicles (800, accounting for 40.6%) and females with 2 vehicles (1,170, making up 32.7%).
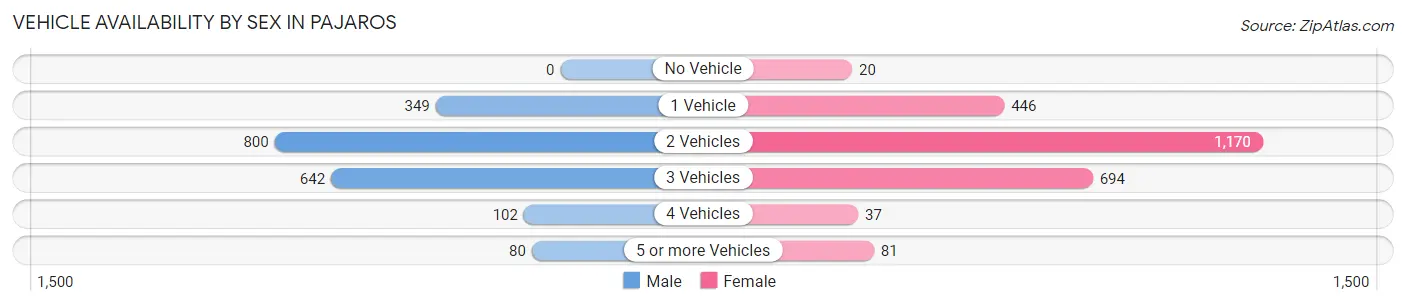
| Vehicles Available | Male | Female |
| No Vehicle | 0 (0.0%) | 20 (0.8%) |
| 1 Vehicle | 349 (17.7%) | 446 (18.2%) |
| 2 Vehicles | 800 (40.6%) | 1,170 (47.8%) |
| 3 Vehicles | 642 (32.5%) | 694 (28.3%) |
| 4 Vehicles | 102 (5.2%) | 37 (1.5%) |
| 5 or more Vehicles | 80 (4.1%) | 81 (3.3%) |
| Total | 1,973 (100.0%) | 2,448 (100.0%) |
Commute Time in Pajaros
The most frequently occuring commute durations in Pajaros are 60 to 89 minutes (801 commuters, 18.3%), 45 to 59 minutes (780 commuters, 17.8%), and 40 to 44 minutes (623 commuters, 14.2%).
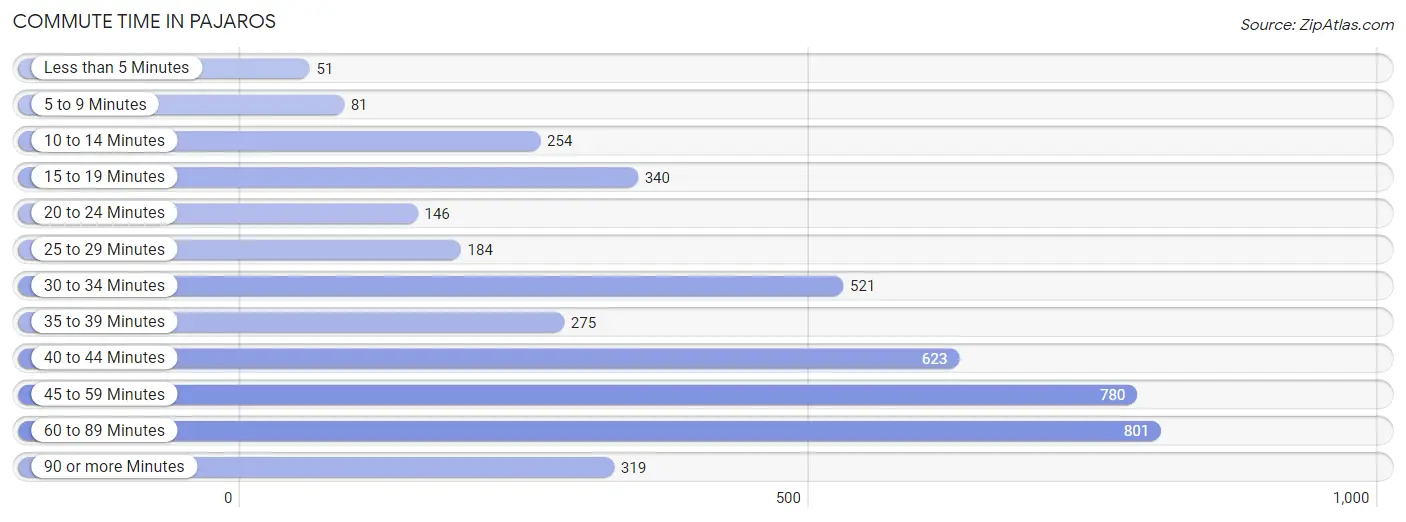
| Commute Time | # Commuters | % Commuters |
| Less than 5 Minutes | 51 | 1.2% |
| 5 to 9 Minutes | 81 | 1.8% |
| 10 to 14 Minutes | 254 | 5.8% |
| 15 to 19 Minutes | 340 | 7.8% |
| 20 to 24 Minutes | 146 | 3.3% |
| 25 to 29 Minutes | 184 | 4.2% |
| 30 to 34 Minutes | 521 | 11.9% |
| 35 to 39 Minutes | 275 | 6.3% |
| 40 to 44 Minutes | 623 | 14.2% |
| 45 to 59 Minutes | 780 | 17.8% |
| 60 to 89 Minutes | 801 | 18.3% |
| 90 or more Minutes | 319 | 7.3% |
Commute Time by Sex in Pajaros
The most common commute times in Pajaros are 45 to 59 minutes (496 commuters, 25.1%) for males and 40 to 44 minutes (422 commuters, 17.6%) for females.
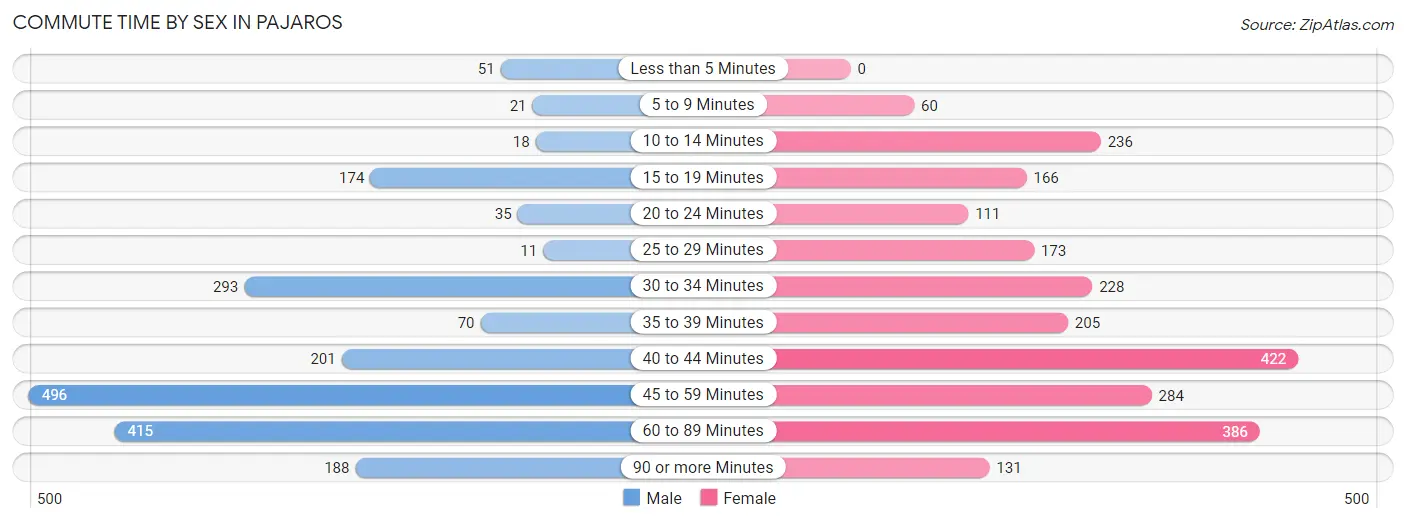
| Commute Time | Male | Female |
| Less than 5 Minutes | 51 (2.6%) | 0 (0.0%) |
| 5 to 9 Minutes | 21 (1.1%) | 60 (2.5%) |
| 10 to 14 Minutes | 18 (0.9%) | 236 (9.8%) |
| 15 to 19 Minutes | 174 (8.8%) | 166 (6.9%) |
| 20 to 24 Minutes | 35 (1.8%) | 111 (4.6%) |
| 25 to 29 Minutes | 11 (0.6%) | 173 (7.2%) |
| 30 to 34 Minutes | 293 (14.8%) | 228 (9.5%) |
| 35 to 39 Minutes | 70 (3.5%) | 205 (8.5%) |
| 40 to 44 Minutes | 201 (10.2%) | 422 (17.6%) |
| 45 to 59 Minutes | 496 (25.1%) | 284 (11.8%) |
| 60 to 89 Minutes | 415 (21.0%) | 386 (16.1%) |
| 90 or more Minutes | 188 (9.5%) | 131 (5.4%) |
Time of Departure to Work by Sex in Pajaros
The most frequent times of departure to work in Pajaros are 5:30 AM to 5:59 AM (336, 17.0%) for males and 6:30 AM to 6:59 AM (495, 20.6%) for females.
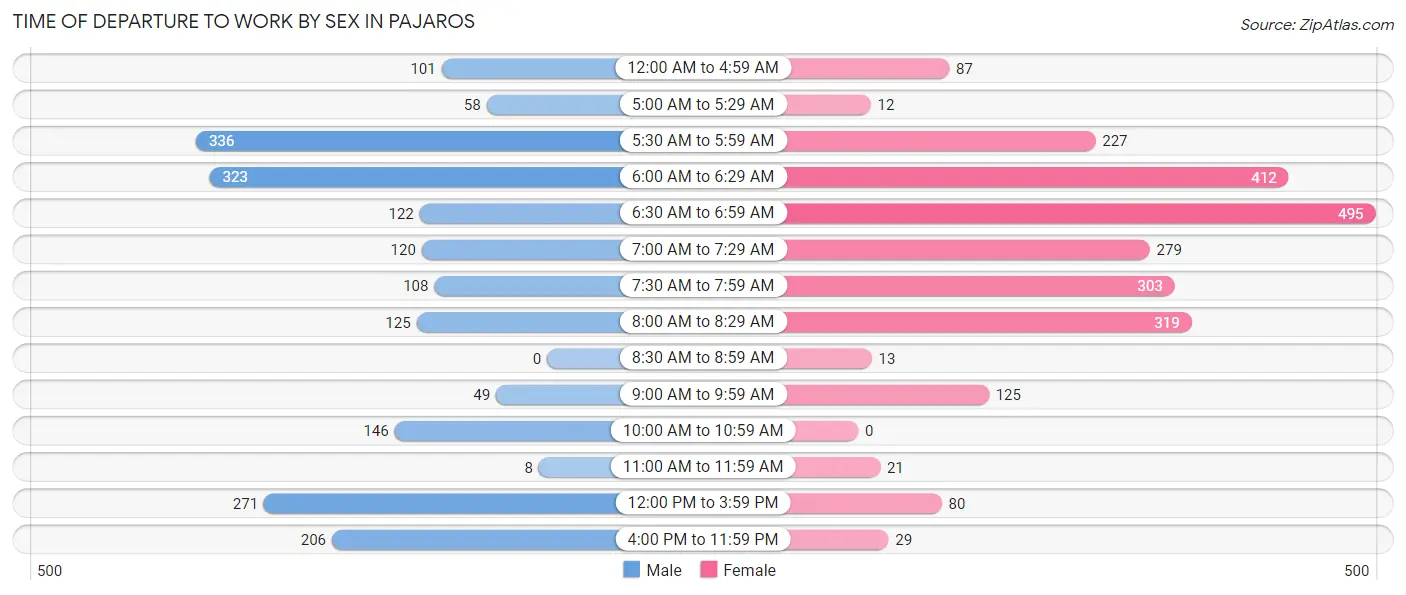
| Time of Departure | Male | Female |
| 12:00 AM to 4:59 AM | 101 (5.1%) | 87 (3.6%) |
| 5:00 AM to 5:29 AM | 58 (2.9%) | 12 (0.5%) |
| 5:30 AM to 5:59 AM | 336 (17.0%) | 227 (9.5%) |
| 6:00 AM to 6:29 AM | 323 (16.4%) | 412 (17.2%) |
| 6:30 AM to 6:59 AM | 122 (6.2%) | 495 (20.6%) |
| 7:00 AM to 7:29 AM | 120 (6.1%) | 279 (11.6%) |
| 7:30 AM to 7:59 AM | 108 (5.5%) | 303 (12.6%) |
| 8:00 AM to 8:29 AM | 125 (6.3%) | 319 (13.3%) |
| 8:30 AM to 8:59 AM | 0 (0.0%) | 13 (0.5%) |
| 9:00 AM to 9:59 AM | 49 (2.5%) | 125 (5.2%) |
| 10:00 AM to 10:59 AM | 146 (7.4%) | 0 (0.0%) |
| 11:00 AM to 11:59 AM | 8 (0.4%) | 21 (0.9%) |
| 12:00 PM to 3:59 PM | 271 (13.7%) | 80 (3.3%) |
| 4:00 PM to 11:59 PM | 206 (10.4%) | 29 (1.2%) |
| Total | 1,973 (100.0%) | 2,402 (100.0%) |
Housing Occupancy in Pajaros
Occupancy by Ownership in Pajaros
Of the total 3,216 dwellings in Pajaros, owner-occupied units account for 2,658 (82.7%), while renter-occupied units make up 558 (17.3%).
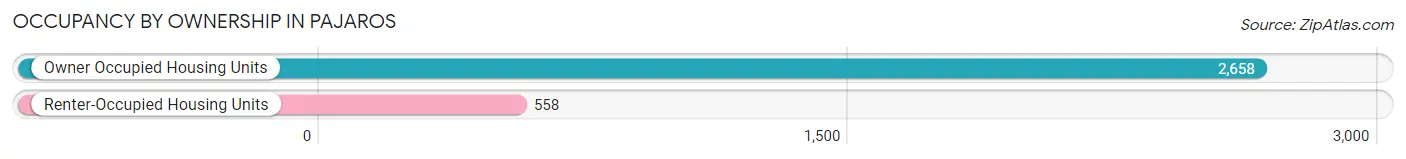
| Occupancy | # Housing Units | % Housing Units |
| Owner Occupied Housing Units | 2,658 | 82.7% |
| Renter-Occupied Housing Units | 558 | 17.3% |
| Total Occupied Housing Units | 3,216 | 100.0% |
Occupancy by Household Size in Pajaros
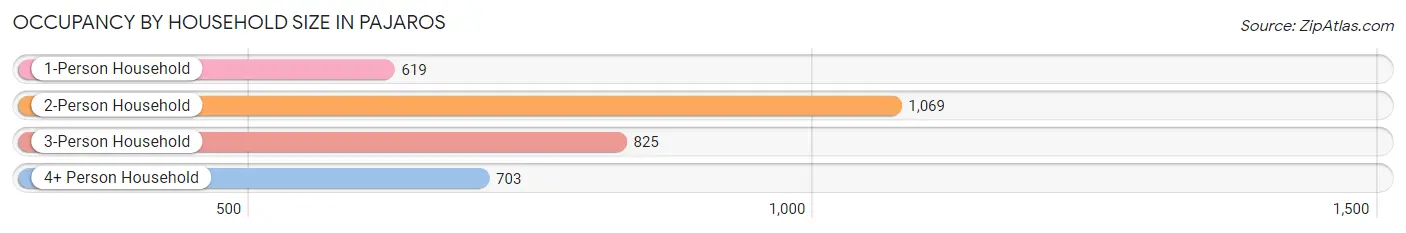
| Household Size | # Housing Units | % Housing Units |
| 1-Person Household | 619 | 19.3% |
| 2-Person Household | 1,069 | 33.2% |
| 3-Person Household | 825 | 25.7% |
| 4+ Person Household | 703 | 21.9% |
| Total Housing Units | 3,216 | 100.0% |
Occupancy by Ownership by Household Size in Pajaros
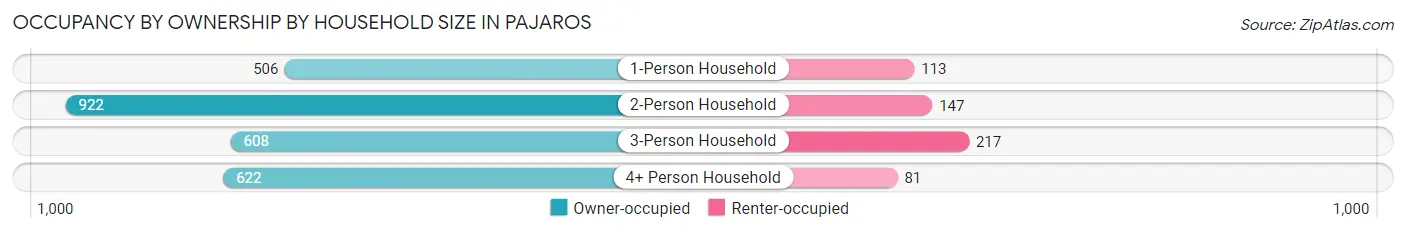
| Household Size | Owner-occupied | Renter-occupied |
| 1-Person Household | 506 (81.7%) | 113 (18.3%) |
| 2-Person Household | 922 (86.3%) | 147 (13.8%) |
| 3-Person Household | 608 (73.7%) | 217 (26.3%) |
| 4+ Person Household | 622 (88.5%) | 81 (11.5%) |
| Total Housing Units | 2,658 (82.7%) | 558 (17.3%) |
Occupancy by Educational Attainment in Pajaros
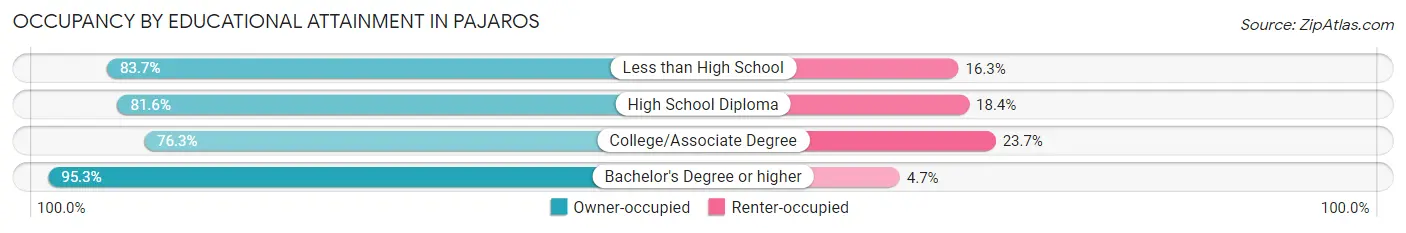
| Household Size | Owner-occupied | Renter-occupied |
| Less than High School | 256 (83.7%) | 50 (16.3%) |
| High School Diploma | 686 (81.6%) | 155 (18.4%) |
| College/Associate Degree | 1,027 (76.3%) | 319 (23.7%) |
| Bachelor's Degree or higher | 689 (95.3%) | 34 (4.7%) |
Occupancy by Age of Householder in Pajaros
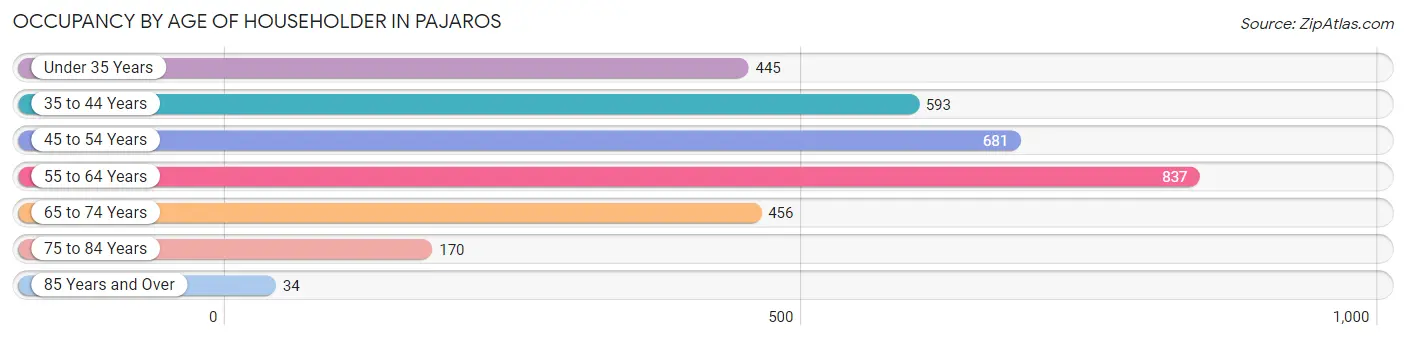
| Age Bracket | # Households | % Households |
| Under 35 Years | 445 | 13.8% |
| 35 to 44 Years | 593 | 18.4% |
| 45 to 54 Years | 681 | 21.2% |
| 55 to 64 Years | 837 | 26.0% |
| 65 to 74 Years | 456 | 14.2% |
| 75 to 84 Years | 170 | 5.3% |
| 85 Years and Over | 34 | 1.1% |
| Total | 3,216 | 100.0% |
Housing Finances in Pajaros
Median Income by Occupancy in Pajaros
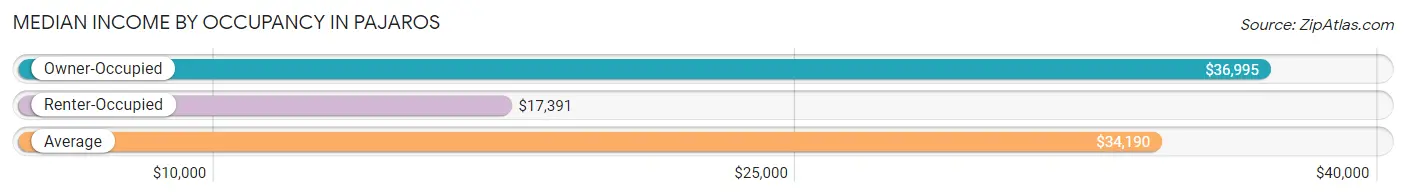
| Occupancy Type | # Households | Median Income |
| Owner-Occupied | 2,658 (82.7%) | $36,995 |
| Renter-Occupied | 558 (17.3%) | $17,391 |
| Average | 3,216 (100.0%) | $34,190 |
Occupancy by Householder Income Bracket in Pajaros
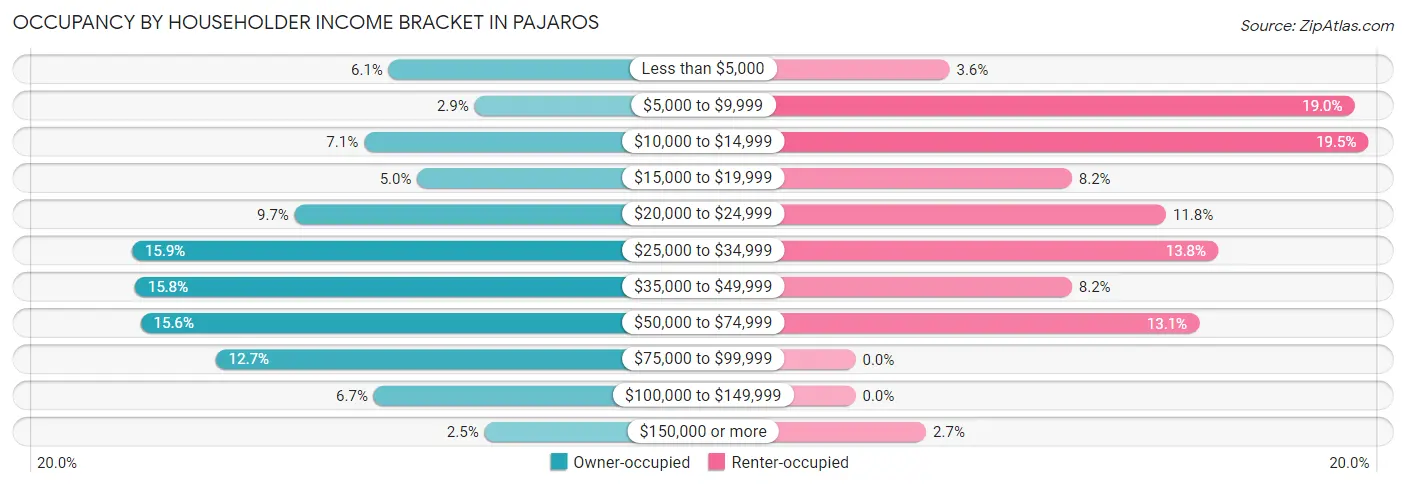
| Income Bracket | Owner-occupied | Renter-occupied |
| Less than $5,000 | 163 (6.1%) | 20 (3.6%) |
| $5,000 to $9,999 | 76 (2.9%) | 106 (19.0%) |
| $10,000 to $14,999 | 188 (7.1%) | 109 (19.5%) |
| $15,000 to $19,999 | 134 (5.0%) | 46 (8.2%) |
| $20,000 to $24,999 | 258 (9.7%) | 66 (11.8%) |
| $25,000 to $34,999 | 423 (15.9%) | 77 (13.8%) |
| $35,000 to $49,999 | 420 (15.8%) | 46 (8.2%) |
| $50,000 to $74,999 | 414 (15.6%) | 73 (13.1%) |
| $75,000 to $99,999 | 338 (12.7%) | 0 (0.0%) |
| $100,000 to $149,999 | 178 (6.7%) | 0 (0.0%) |
| $150,000 or more | 66 (2.5%) | 15 (2.7%) |
| Total | 2,658 (100.0%) | 558 (100.0%) |
Monthly Housing Cost Tiers in Pajaros
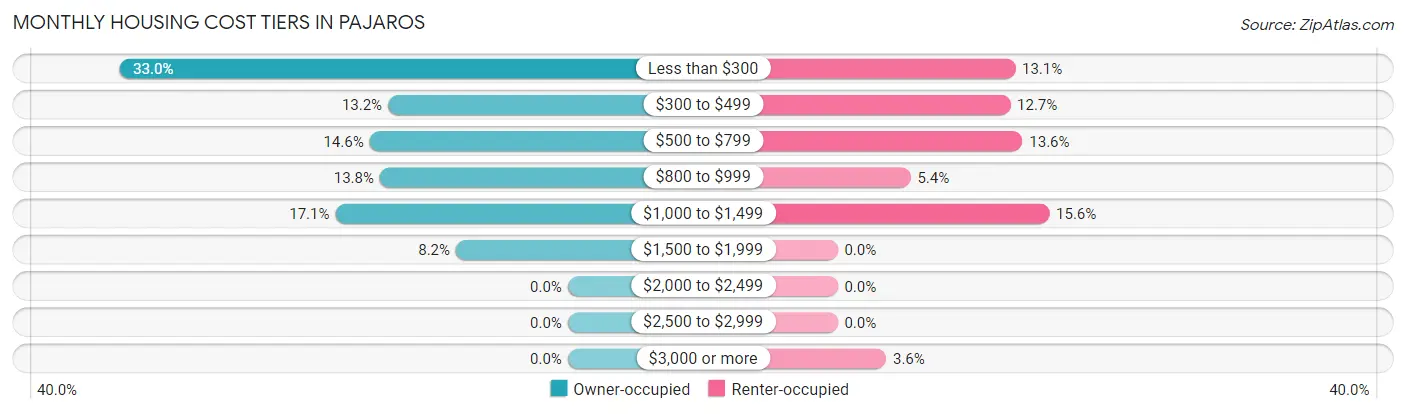
| Monthly Cost | Owner-occupied | Renter-occupied |
| Less than $300 | 876 (33.0%) | 73 (13.1%) |
| $300 to $499 | 352 (13.2%) | 71 (12.7%) |
| $500 to $799 | 388 (14.6%) | 76 (13.6%) |
| $800 to $999 | 368 (13.8%) | 30 (5.4%) |
| $1,000 to $1,499 | 455 (17.1%) | 87 (15.6%) |
| $1,500 to $1,999 | 219 (8.2%) | 0 (0.0%) |
| $2,000 to $2,499 | 0 (0.0%) | 0 (0.0%) |
| $2,500 to $2,999 | 0 (0.0%) | 0 (0.0%) |
| $3,000 or more | 0 (0.0%) | 20 (3.6%) |
| Total | 2,658 (100.0%) | 558 (100.0%) |
Physical Housing Characteristics in Pajaros
Housing Structures in Pajaros
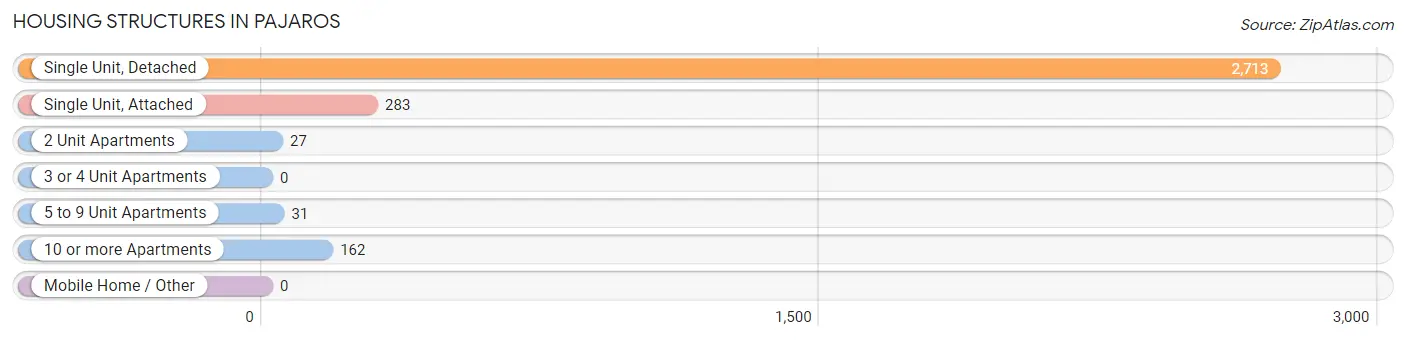
| Structure Type | # Housing Units | % Housing Units |
| Single Unit, Detached | 2,713 | 84.4% |
| Single Unit, Attached | 283 | 8.8% |
| 2 Unit Apartments | 27 | 0.8% |
| 3 or 4 Unit Apartments | 0 | 0.0% |
| 5 to 9 Unit Apartments | 31 | 1.0% |
| 10 or more Apartments | 162 | 5.0% |
| Mobile Home / Other | 0 | 0.0% |
| Total | 3,216 | 100.0% |
Housing Structures by Occupancy in Pajaros
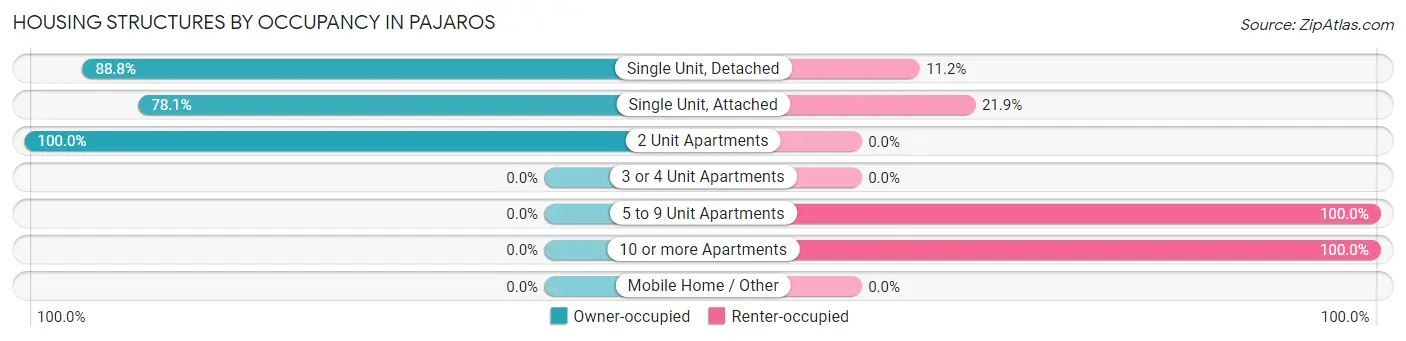
| Structure Type | Owner-occupied | Renter-occupied |
| Single Unit, Detached | 2,410 (88.8%) | 303 (11.2%) |
| Single Unit, Attached | 221 (78.1%) | 62 (21.9%) |
| 2 Unit Apartments | 27 (100.0%) | 0 (0.0%) |
| 3 or 4 Unit Apartments | 0 (0.0%) | 0 (0.0%) |
| 5 to 9 Unit Apartments | 0 (0.0%) | 31 (100.0%) |
| 10 or more Apartments | 0 (0.0%) | 162 (100.0%) |
| Mobile Home / Other | 0 (0.0%) | 0 (0.0%) |
| Total | 2,658 (82.7%) | 558 (17.3%) |
Housing Structures by Number of Rooms in Pajaros
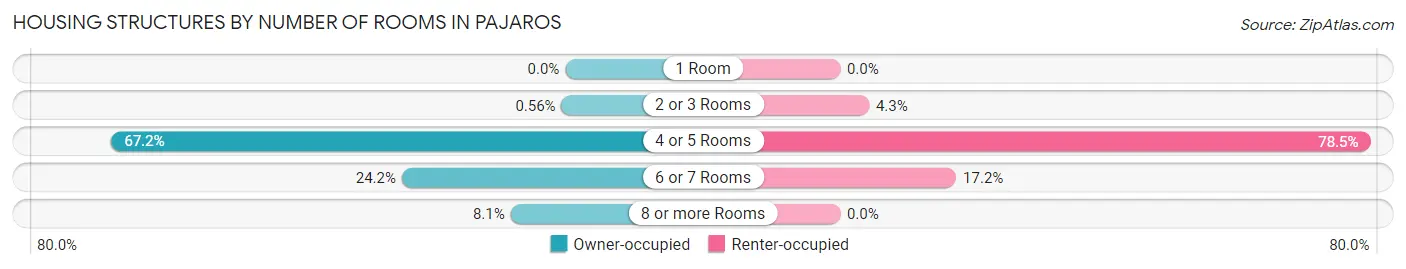
| Number of Rooms | Owner-occupied | Renter-occupied |
| 1 Room | 0 (0.0%) | 0 (0.0%) |
| 2 or 3 Rooms | 15 (0.6%) | 24 (4.3%) |
| 4 or 5 Rooms | 1,785 (67.2%) | 438 (78.5%) |
| 6 or 7 Rooms | 643 (24.2%) | 96 (17.2%) |
| 8 or more Rooms | 215 (8.1%) | 0 (0.0%) |
| Total | 2,658 (100.0%) | 558 (100.0%) |
Housing Structure by Heating Type in Pajaros
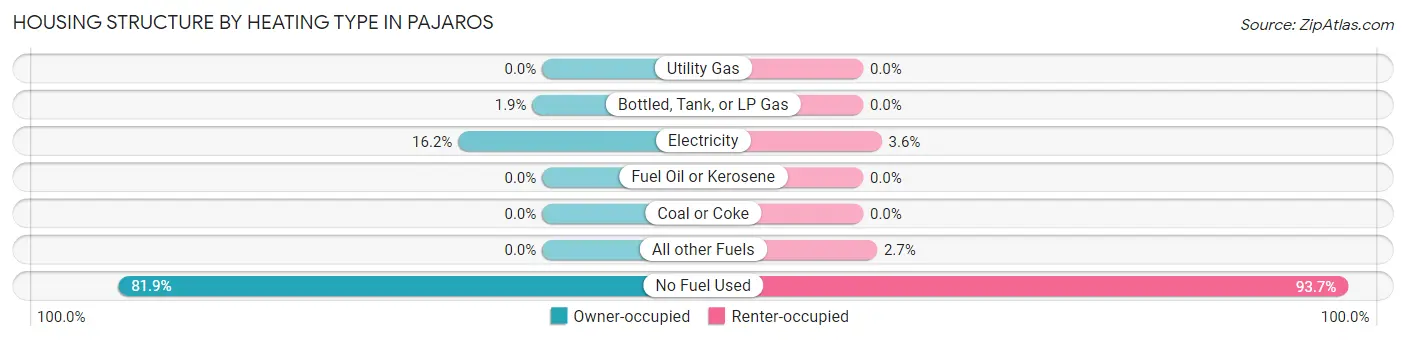
| Heating Type | Owner-occupied | Renter-occupied |
| Utility Gas | 0 (0.0%) | 0 (0.0%) |
| Bottled, Tank, or LP Gas | 50 (1.9%) | 0 (0.0%) |
| Electricity | 431 (16.2%) | 20 (3.6%) |
| Fuel Oil or Kerosene | 0 (0.0%) | 0 (0.0%) |
| Coal or Coke | 0 (0.0%) | 0 (0.0%) |
| All other Fuels | 0 (0.0%) | 15 (2.7%) |
| No Fuel Used | 2,177 (81.9%) | 523 (93.7%) |
| Total | 2,658 (100.0%) | 558 (100.0%) |
Household Vehicle Usage in Pajaros
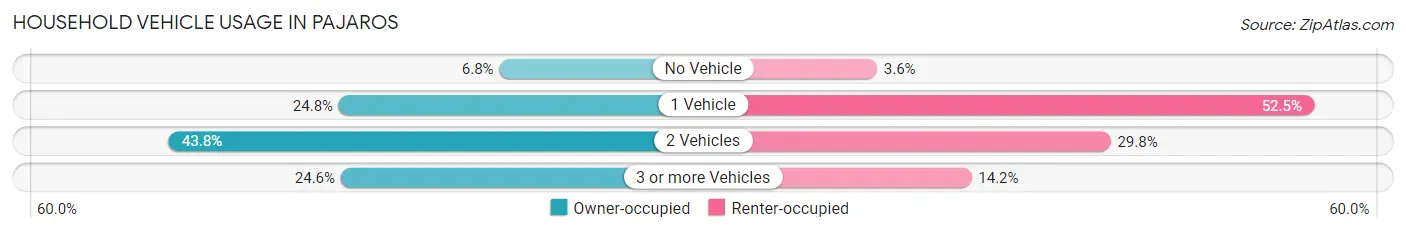
| Vehicles per Household | Owner-occupied | Renter-occupied |
| No Vehicle | 181 (6.8%) | 20 (3.6%) |
| 1 Vehicle | 659 (24.8%) | 293 (52.5%) |
| 2 Vehicles | 1,165 (43.8%) | 166 (29.7%) |
| 3 or more Vehicles | 653 (24.6%) | 79 (14.2%) |
| Total | 2,658 (100.0%) | 558 (100.0%) |
Real Estate & Mortgages in Pajaros
Real Estate and Mortgage Overview in Pajaros
| Characteristic | Without Mortgage | With Mortgage |
| Housing Units | 1,285 | 1,373 |
| Median Property Value | $120,500 | $136,900 |
| Median Household Income | $28,398 | $66 |
| Monthly Housing Costs | $242 | $0 |
| Real Estate Taxes | - | - |
Property Value by Mortgage Status in Pajaros
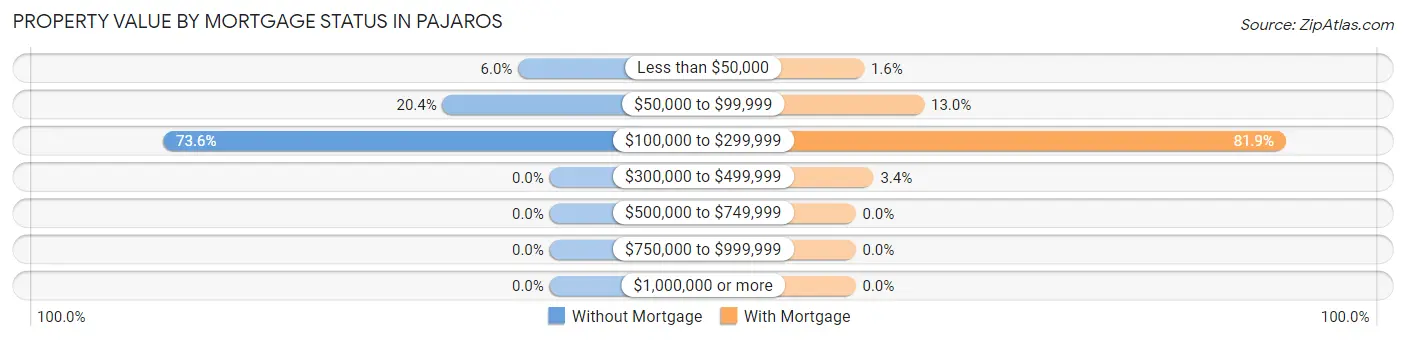
| Property Value | Without Mortgage | With Mortgage |
| Less than $50,000 | 77 (6.0%) | 22 (1.6%) |
| $50,000 to $99,999 | 262 (20.4%) | 179 (13.0%) |
| $100,000 to $299,999 | 946 (73.6%) | 1,125 (81.9%) |
| $300,000 to $499,999 | 0 (0.0%) | 47 (3.4%) |
| $500,000 to $749,999 | 0 (0.0%) | 0 (0.0%) |
| $750,000 to $999,999 | 0 (0.0%) | 0 (0.0%) |
| $1,000,000 or more | 0 (0.0%) | 0 (0.0%) |
| Total | 1,285 (100.0%) | 1,373 (100.0%) |
Household Income by Mortgage Status in Pajaros
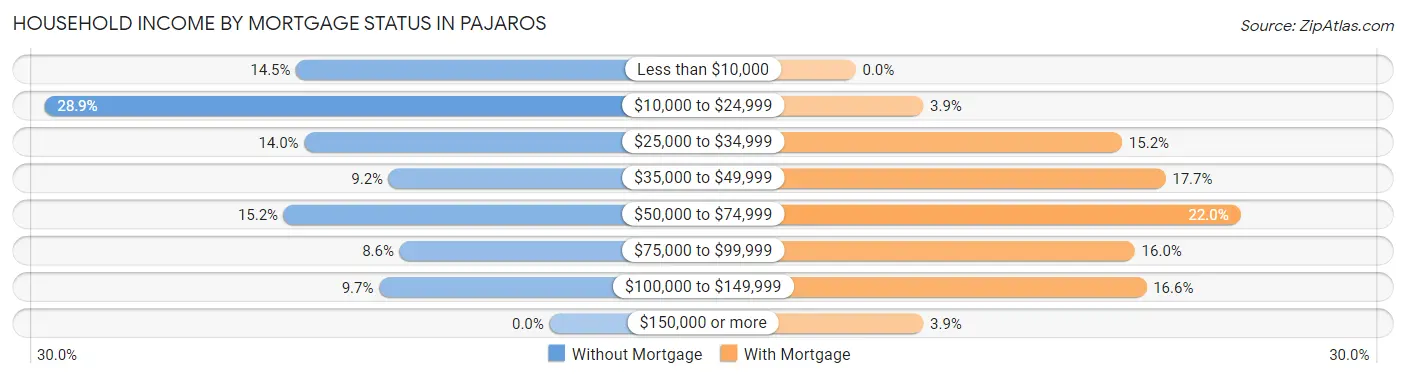
| Household Income | Without Mortgage | With Mortgage |
| Less than $10,000 | 186 (14.5%) | 0 (0.0%) |
| $10,000 to $24,999 | 371 (28.9%) | 53 (3.9%) |
| $25,000 to $34,999 | 180 (14.0%) | 209 (15.2%) |
| $35,000 to $49,999 | 118 (9.2%) | 243 (17.7%) |
| $50,000 to $74,999 | 195 (15.2%) | 302 (22.0%) |
| $75,000 to $99,999 | 110 (8.6%) | 219 (16.0%) |
| $100,000 to $149,999 | 125 (9.7%) | 228 (16.6%) |
| $150,000 or more | 0 (0.0%) | 53 (3.9%) |
| Total | 1,285 (100.0%) | 1,373 (100.0%) |
Property Value to Household Income Ratio in Pajaros
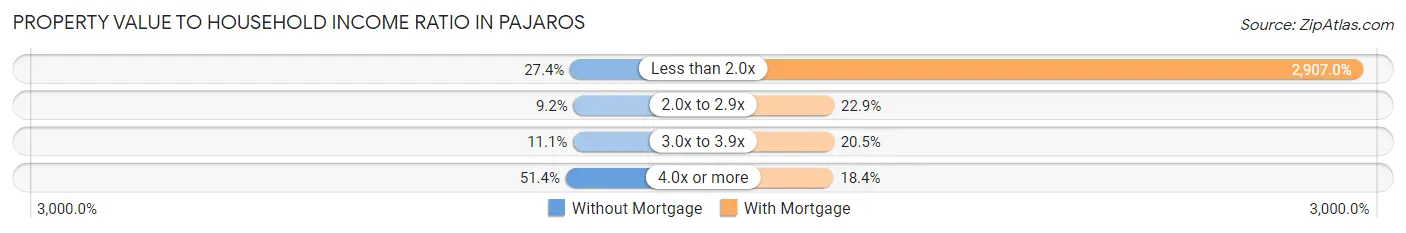
| Value-to-Income Ratio | Without Mortgage | With Mortgage |
| Less than 2.0x | 352 (27.4%) | 39,913 (2,907.0%) |
| 2.0x to 2.9x | 118 (9.2%) | 315 (22.9%) |
| 3.0x to 3.9x | 142 (11.1%) | 282 (20.5%) |
| 4.0x or more | 661 (51.4%) | 253 (18.4%) |
| Total | 1,285 (100.0%) | 1,373 (100.0%) |
Real Estate Taxes by Mortgage Status in Pajaros
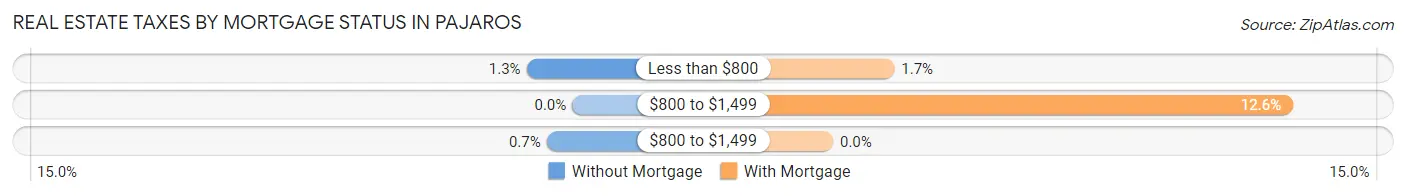
| Property Taxes | Without Mortgage | With Mortgage |
| Less than $800 | 16 (1.3%) | 23 (1.7%) |
| $800 to $1,499 | 0 (0.0%) | 173 (12.6%) |
| $800 to $1,499 | 9 (0.7%) | 0 (0.0%) |
| Total | 1,285 (100.0%) | 1,373 (100.0%) |
Health & Disability in Pajaros
Health Insurance Coverage by Age in Pajaros
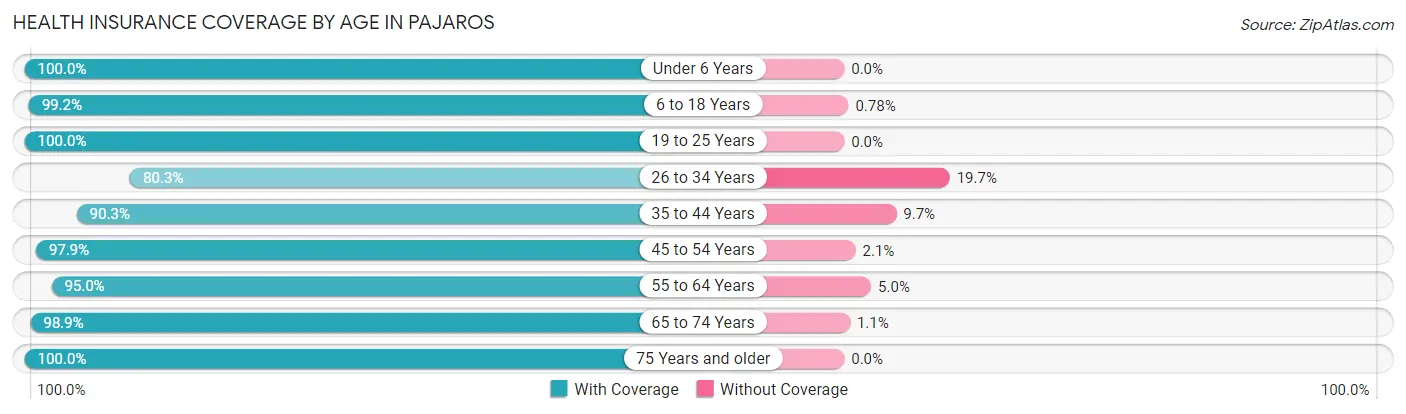
| Age Bracket | With Coverage | Without Coverage |
| Under 6 Years | 370 (100.0%) | 0 (0.0%) |
| 6 to 18 Years | 1,535 (99.2%) | 12 (0.8%) |
| 19 to 25 Years | 1,036 (100.0%) | 0 (0.0%) |
| 26 to 34 Years | 1,103 (80.3%) | 270 (19.7%) |
| 35 to 44 Years | 1,452 (90.3%) | 156 (9.7%) |
| 45 to 54 Years | 1,392 (97.9%) | 30 (2.1%) |
| 55 to 64 Years | 1,366 (95.0%) | 72 (5.0%) |
| 65 to 74 Years | 839 (98.9%) | 9 (1.1%) |
| 75 Years and older | 401 (100.0%) | 0 (0.0%) |
| Total | 9,494 (94.5%) | 549 (5.5%) |
Health Insurance Coverage by Citizenship Status in Pajaros
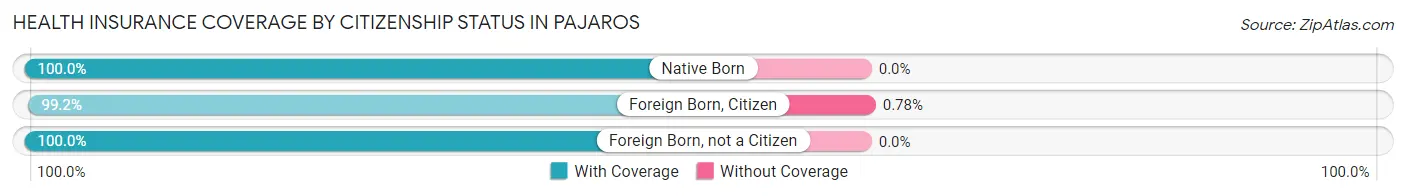
| Citizenship Status | With Coverage | Without Coverage |
| Native Born | 370 (100.0%) | 0 (0.0%) |
| Foreign Born, Citizen | 1,535 (99.2%) | 12 (0.8%) |
| Foreign Born, not a Citizen | 1,036 (100.0%) | 0 (0.0%) |
Health Insurance Coverage by Household Income in Pajaros
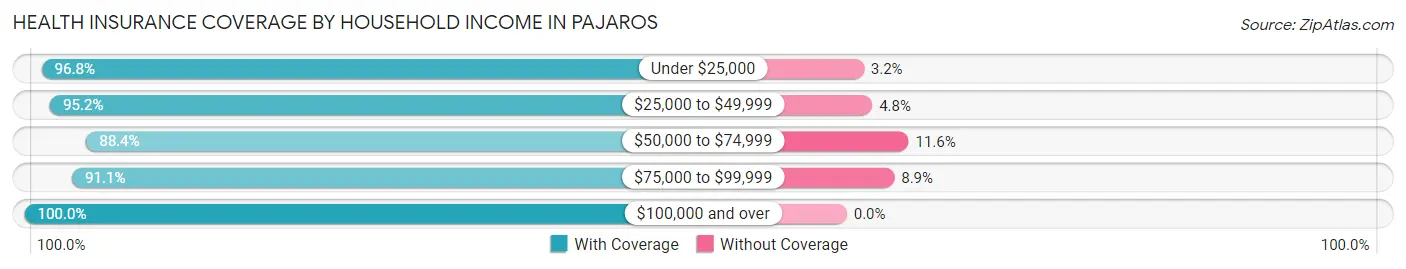
| Household Income | With Coverage | Without Coverage |
| Under $25,000 | 2,662 (96.8%) | 88 (3.2%) |
| $25,000 to $49,999 | 2,901 (95.2%) | 145 (4.8%) |
| $50,000 to $74,999 | 1,452 (88.4%) | 190 (11.6%) |
| $75,000 to $99,999 | 1,289 (91.1%) | 126 (8.9%) |
| $100,000 and over | 1,187 (100.0%) | 0 (0.0%) |
Public vs Private Health Insurance Coverage by Age in Pajaros
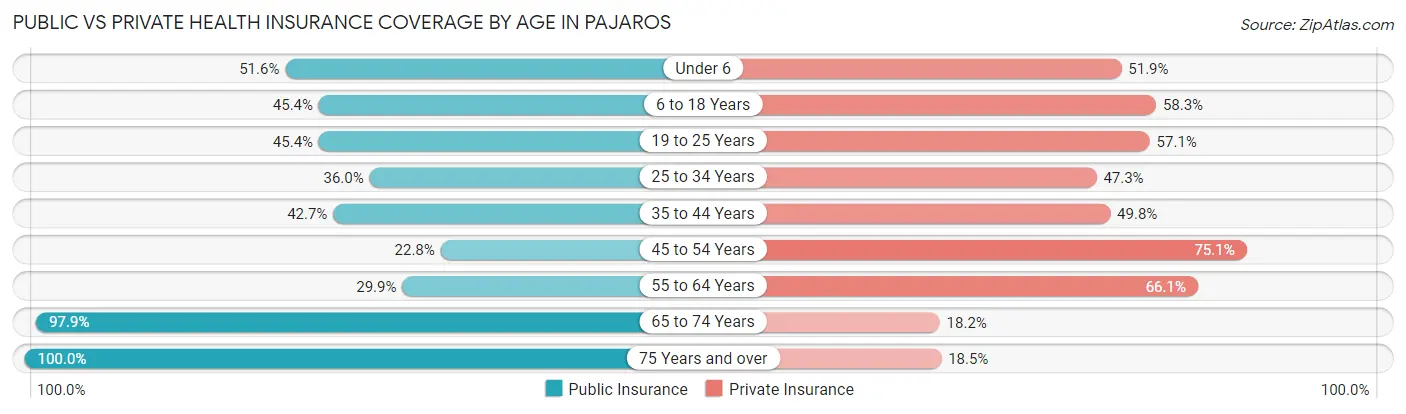
| Age Bracket | Public Insurance | Private Insurance |
| Under 6 | 191 (51.6%) | 192 (51.9%) |
| 6 to 18 Years | 702 (45.4%) | 902 (58.3%) |
| 19 to 25 Years | 470 (45.4%) | 592 (57.1%) |
| 25 to 34 Years | 494 (36.0%) | 649 (47.3%) |
| 35 to 44 Years | 687 (42.7%) | 801 (49.8%) |
| 45 to 54 Years | 324 (22.8%) | 1,068 (75.1%) |
| 55 to 64 Years | 430 (29.9%) | 950 (66.1%) |
| 65 to 74 Years | 830 (97.9%) | 154 (18.2%) |
| 75 Years and over | 401 (100.0%) | 74 (18.4%) |
| Total | 4,529 (45.1%) | 5,382 (53.6%) |
Disability Status by Sex by Age in Pajaros
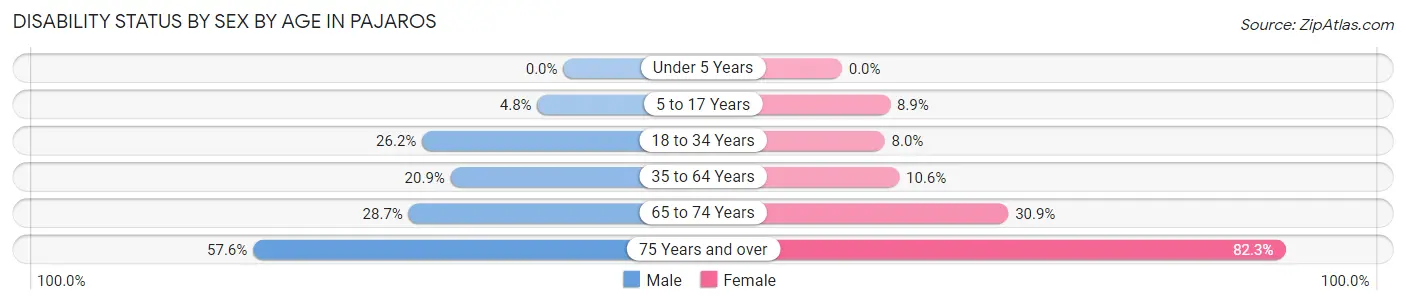
| Age Bracket | Male | Female |
| Under 5 Years | 0 (0.0%) | 0 (0.0%) |
| 5 to 17 Years | 27 (4.8%) | 74 (8.9%) |
| 18 to 34 Years | 244 (26.2%) | 130 (8.0%) |
| 35 to 64 Years | 400 (20.9%) | 272 (10.6%) |
| 65 to 74 Years | 91 (28.7%) | 164 (30.9%) |
| 75 Years and over | 91 (57.6%) | 200 (82.3%) |
Disability Class by Sex by Age in Pajaros
Disability Class: Hearing Difficulty
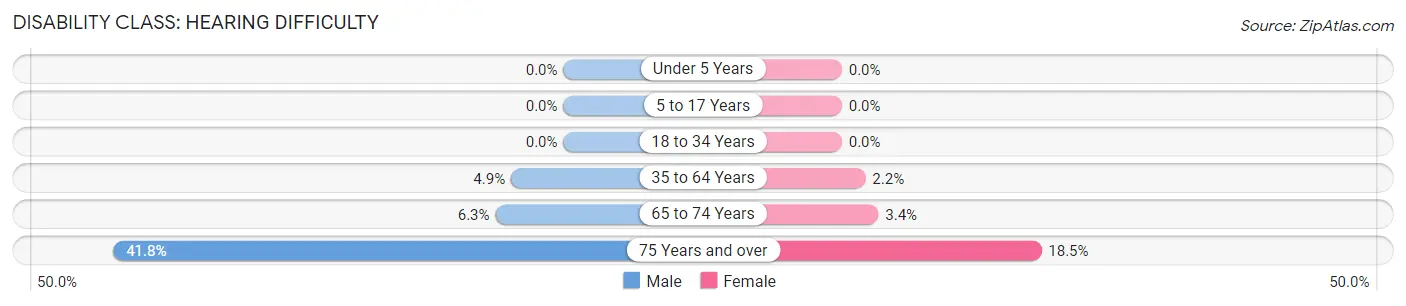
| Age Bracket | Male | Female |
| Under 5 Years | 0 (0.0%) | 0 (0.0%) |
| 5 to 17 Years | 0 (0.0%) | 0 (0.0%) |
| 18 to 34 Years | 0 (0.0%) | 0 (0.0%) |
| 35 to 64 Years | 93 (4.9%) | 56 (2.2%) |
| 65 to 74 Years | 20 (6.3%) | 18 (3.4%) |
| 75 Years and over | 66 (41.8%) | 45 (18.5%) |
Disability Class: Vision Difficulty
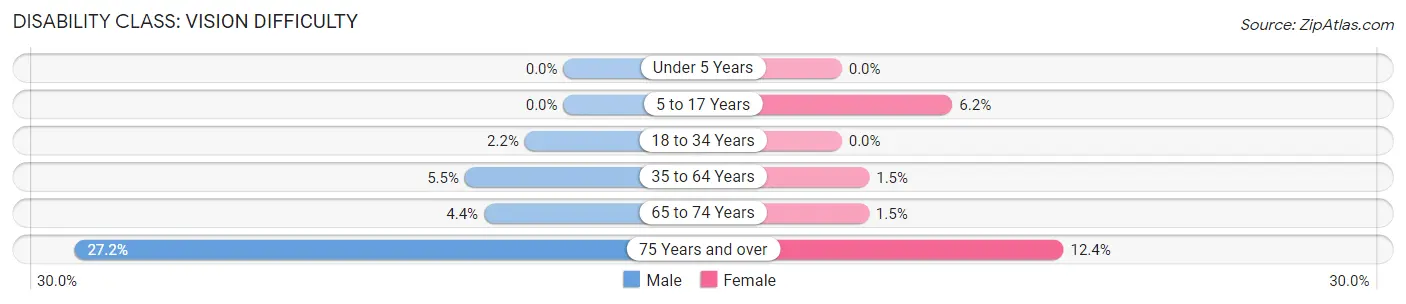
| Age Bracket | Male | Female |
| Under 5 Years | 0 (0.0%) | 0 (0.0%) |
| 5 to 17 Years | 0 (0.0%) | 51 (6.2%) |
| 18 to 34 Years | 20 (2.1%) | 0 (0.0%) |
| 35 to 64 Years | 105 (5.5%) | 39 (1.5%) |
| 65 to 74 Years | 14 (4.4%) | 8 (1.5%) |
| 75 Years and over | 43 (27.2%) | 30 (12.3%) |
Disability Class: Cognitive Difficulty
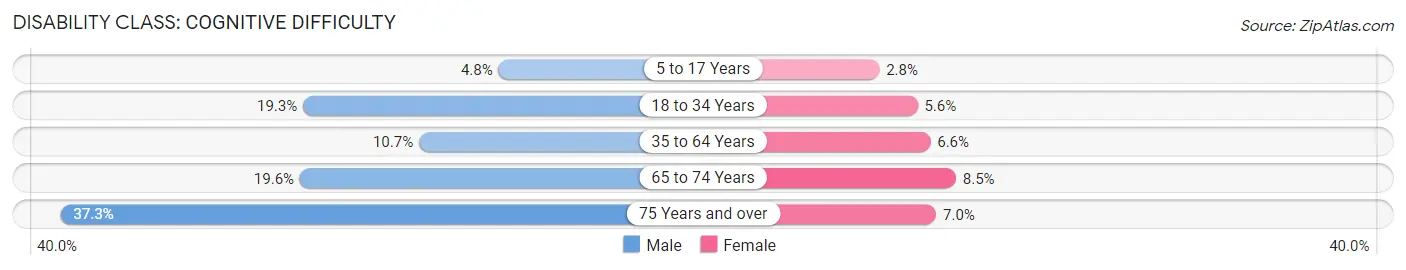
| Age Bracket | Male | Female |
| 5 to 17 Years | 27 (4.8%) | 23 (2.8%) |
| 18 to 34 Years | 180 (19.3%) | 92 (5.6%) |
| 35 to 64 Years | 205 (10.7%) | 168 (6.6%) |
| 65 to 74 Years | 62 (19.6%) | 45 (8.5%) |
| 75 Years and over | 59 (37.3%) | 17 (7.0%) |
Disability Class: Ambulatory Difficulty
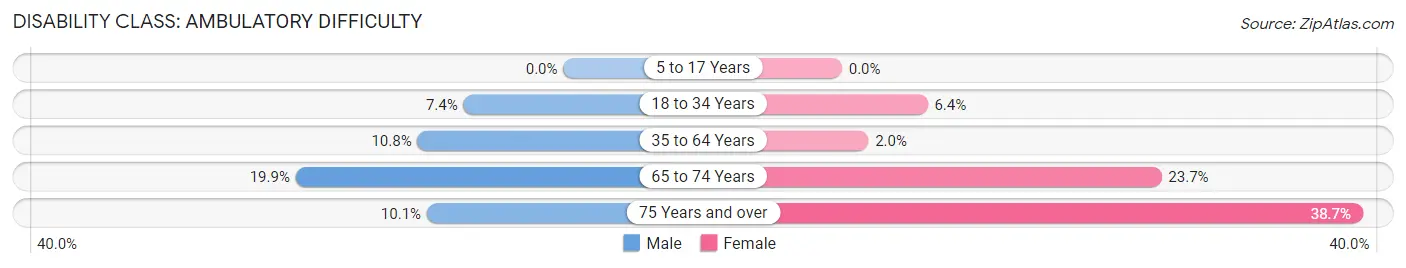
| Age Bracket | Male | Female |
| 5 to 17 Years | 0 (0.0%) | 0 (0.0%) |
| 18 to 34 Years | 69 (7.4%) | 104 (6.4%) |
| 35 to 64 Years | 207 (10.8%) | 50 (2.0%) |
| 65 to 74 Years | 63 (19.9%) | 126 (23.7%) |
| 75 Years and over | 16 (10.1%) | 94 (38.7%) |
Disability Class: Self-Care Difficulty
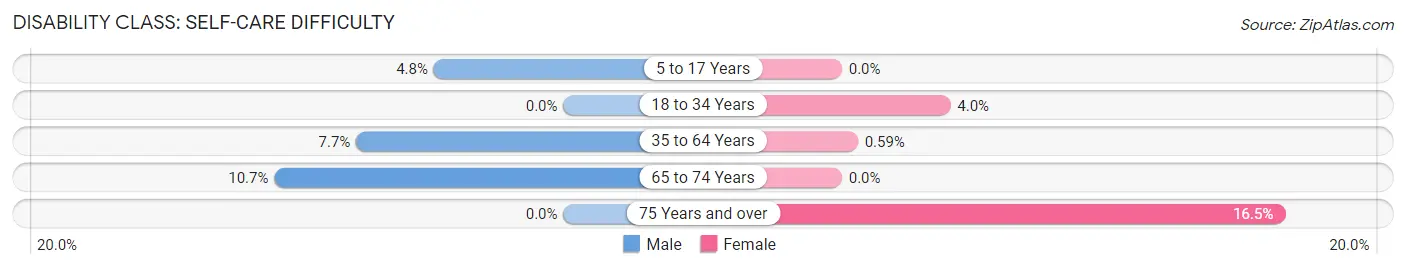
| Age Bracket | Male | Female |
| 5 to 17 Years | 27 (4.8%) | 0 (0.0%) |
| 18 to 34 Years | 0 (0.0%) | 66 (4.0%) |
| 35 to 64 Years | 147 (7.7%) | 15 (0.6%) |
| 65 to 74 Years | 34 (10.7%) | 0 (0.0%) |
| 75 Years and over | 0 (0.0%) | 40 (16.5%) |
Technology Access in Pajaros
Computing Device Access in Pajaros
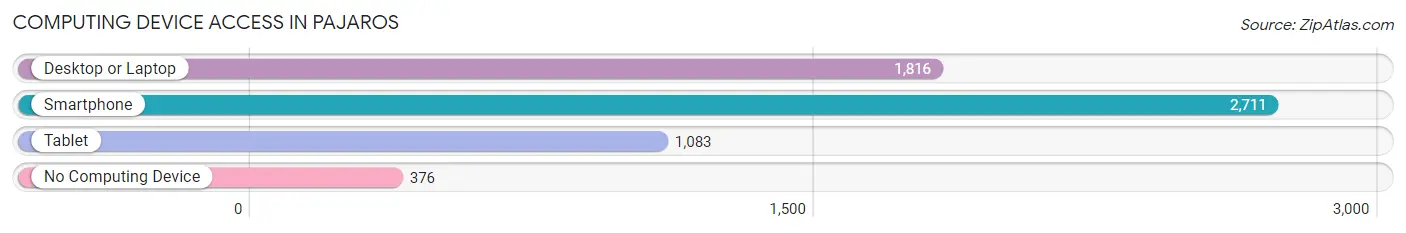
| Device Type | # Households | % Households |
| Desktop or Laptop | 1,816 | 56.5% |
| Smartphone | 2,711 | 84.3% |
| Tablet | 1,083 | 33.7% |
| No Computing Device | 376 | 11.7% |
| Total | 3,216 | 100.0% |
Internet Access in Pajaros
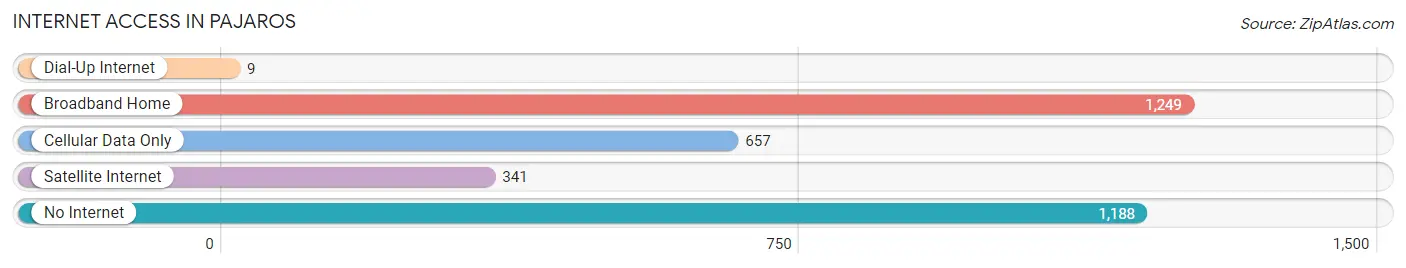
| Internet Type | # Households | % Households |
| Dial-Up Internet | 9 | 0.3% |
| Broadband Home | 1,249 | 38.8% |
| Cellular Data Only | 657 | 20.4% |
| Satellite Internet | 341 | 10.6% |
| No Internet | 1,188 | 36.9% |
| Total | 3,216 | 100.0% |
Pajaros Summary
Pajaros, Puerto Rico is a small municipality located in the northern region of the island of Puerto Rico. It is part of the San Juan-Caguas-Guaynabo Metropolitan Statistical Area. The municipality is bordered by the municipalities of San Juan, Toa Baja, Bayamón, and Cataño. As of the 2010 census, the population of Pajaros was 8,845.
History
The area of Pajaros was originally inhabited by the Taíno Indians. The name Pajaros is derived from the Taíno word for “birds”. The area was later colonized by the Spanish in the 16th century. During the 19th century, the area was part of the municipality of Bayamón. In 1838, Pajaros was officially established as a municipality.
Geography
Pajaros is located in the northern region of Puerto Rico, in the San Juan-Caguas-Guaynabo Metropolitan Statistical Area. It is bordered by the municipalities of San Juan, Toa Baja, Bayamón, and Cataño. The municipality covers an area of 4.2 square miles and has a population density of 2,093 people per square mile.
Economy
The economy of Pajaros is largely based on agriculture and manufacturing. The main agricultural products grown in the area include sugarcane, bananas, coffee, and tobacco. The main industries in the area are food processing, pharmaceuticals, and electronics.
Demographics
As of the 2010 census, the population of Pajaros was 8,845. The population is largely of Hispanic descent, with a small percentage of African-American and White residents. The median household income in the municipality is $17,845, and the median age is 37. The unemployment rate in the municipality is 11.3%.
Conclusion
Pajaros, Puerto Rico is a small municipality located in the northern region of the island of Puerto Rico. It is part of the San Juan-Caguas-Guaynabo Metropolitan Statistical Area. The municipality was originally inhabited by the Taíno Indians and was later colonized by the Spanish in the 16th century. The economy of Pajaros is largely based on agriculture and manufacturing, and the population is largely of Hispanic descent. The median household income in the municipality is $17,845, and the median age is 37.
Common Questions
What is Per Capita Income in Pajaros?
Per Capita income in Pajaros is $16,112.
What is the Median Family Income in Pajaros?
Median Family Income in Pajaros is $36,580.
What is the Median Household income in Pajaros?
Median Household Income in Pajaros is $34,190.
What is Income or Wage Gap in Pajaros?
Income or Wage Gap in Pajaros is 2.5%.
Women in Pajaros earn 97.5 cents for every dollar earned by a man.
What is Family Income Deficit in Pajaros?
Family Income Deficit in Pajaros is $8,815.
Families that are below poverty line in Pajaros earn $8,815 less on average than the poverty threshold level.
What is Inequality or Gini Index in Pajaros?
Inequality or Gini Index in Pajaros is 0.45.
What is the Total Population of Pajaros?
Total Population of Pajaros is 10,043.
What is the Total Male Population of Pajaros?
Total Male Population of Pajaros is 4,086.
What is the Total Female Population of Pajaros?
Total Female Population of Pajaros is 5,957.
What is the Ratio of Males per 100 Females in Pajaros?
There are 68.59 Males per 100 Females in Pajaros.
What is the Ratio of Females per 100 Males in Pajaros?
There are 145.79 Females per 100 Males in Pajaros.
What is the Median Population Age in Pajaros?
Median Population Age in Pajaros is 40.7 Years.
What is the Average Family Size in Pajaros
Average Family Size in Pajaros is 3.6 People.
What is the Average Household Size in Pajaros
Average Household Size in Pajaros is 3.1 People.
How Large is the Labor Force in Pajaros?
There are 4,850 People in the Labor Forcein in Pajaros.
What is the Percentage of People in the Labor Force in Pajaros?
56.8% of People are in the Labor Force in Pajaros.
What is the Unemployment Rate in Pajaros?
Unemployment Rate in Pajaros is 7.0%.