Hormigueros, PR Map & Demographics
Hormigueros Map
Hormigueros Overview
$13,838
PER CAPITA INCOME
$26,482
AVG FAMILY INCOME
$21,950
AVG HOUSEHOLD INCOME
8.9%
WAGE / INCOME GAP [ % ]
91.1¢/ $1
WAGE / INCOME GAP [ $ ]
$8,838
FAMILY INCOME DEFICIT
0.46
INEQUALITY / GINI INDEX
11,224
TOTAL POPULATION
5,185
MALE POPULATION
6,039
FEMALE POPULATION
85.86
MALES / 100 FEMALES
116.47
FEMALES / 100 MALES
51.8
MEDIAN AGE
3.1
AVG FAMILY SIZE
2.4
AVG HOUSEHOLD SIZE
4,212
LABOR FORCE [ PEOPLE ]
41.9%
PERCENT IN LABOR FORCE
16.0%
UNEMPLOYMENT RATE
Hormigueros Zip Codes
Hormigueros Area Codes
Income in Hormigueros
Income Overview in Hormigueros
Per Capita Income in Hormigueros is $13,838, while median incomes of families and households are $26,482 and $21,950 respectively.
| Characteristic | Number | Measure |
| Per Capita Income | 11,224 | $13,838 |
| Median Family Income | 2,933 | $26,482 |
| Mean Family Income | 2,933 | $35,526 |
| Median Household Income | 4,573 | $21,950 |
| Mean Household Income | 4,573 | $31,931 |
| Income Deficit | 2,933 | $8,838 |
| Wage / Income Gap (%) | 11,224 | 8.85% |
| Wage / Income Gap ($) | 11,224 | 91.15¢ per $1 |
| Gini / Inequality Index | 11,224 | 0.46 |
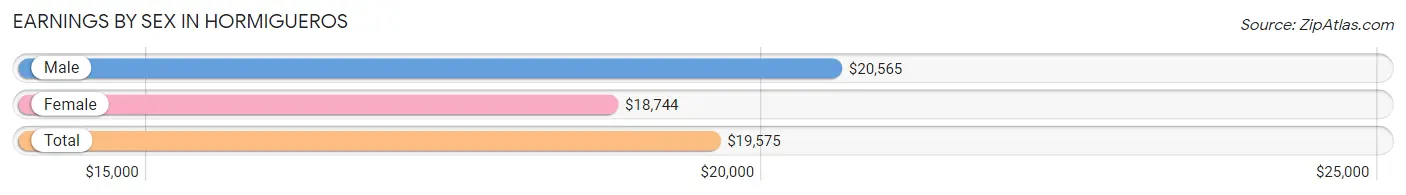
Earnings by Sex in Hormigueros
Average Earnings in Hormigueros are $19,575, $20,565 for men and $18,744 for women, a difference of 8.8%.
| Sex | Number | Average Earnings |
| Male | 1,835 (48.5%) | $20,565 |
| Female | 1,948 (51.5%) | $18,744 |
| Total | 3,783 (100.0%) | $19,575 |
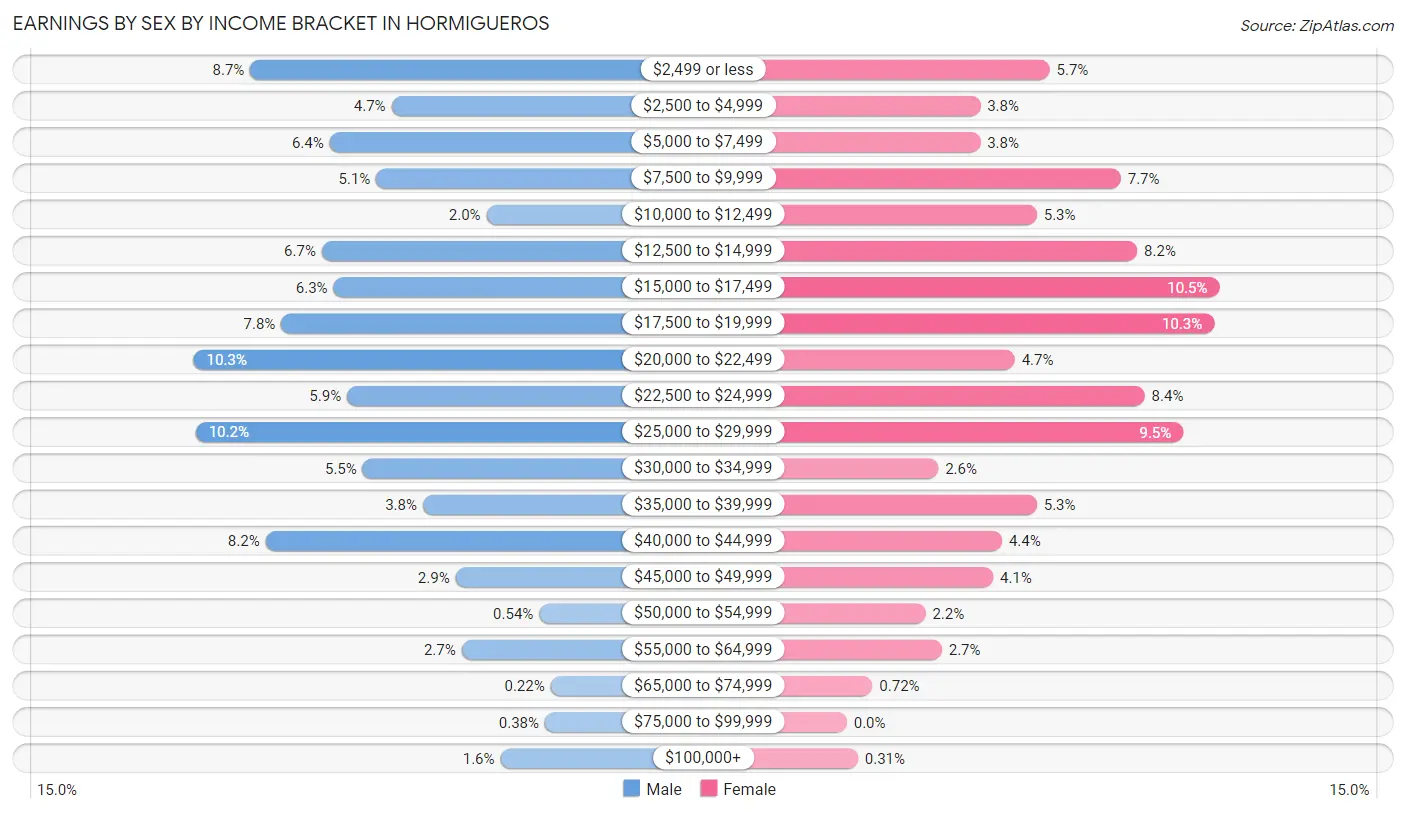
Earnings by Sex by Income Bracket in Hormigueros
The most common earnings brackets in Hormigueros are $20,000 to $22,499 for men (188 | 10.2%) and $15,000 to $17,499 for women (204 | 10.5%).
| Income | Male | Female |
| $2,499 or less | 159 (8.7%) | 111 (5.7%) |
| $2,500 to $4,999 | 86 (4.7%) | 73 (3.7%) |
| $5,000 to $7,499 | 118 (6.4%) | 73 (3.7%) |
| $7,500 to $9,999 | 94 (5.1%) | 150 (7.7%) |
| $10,000 to $12,499 | 37 (2.0%) | 104 (5.3%) |
| $12,500 to $14,999 | 122 (6.7%) | 159 (8.2%) |
| $15,000 to $17,499 | 116 (6.3%) | 204 (10.5%) |
| $17,500 to $19,999 | 143 (7.8%) | 201 (10.3%) |
| $20,000 to $22,499 | 188 (10.2%) | 92 (4.7%) |
| $22,500 to $24,999 | 109 (5.9%) | 163 (8.4%) |
| $25,000 to $29,999 | 187 (10.2%) | 184 (9.5%) |
| $30,000 to $34,999 | 101 (5.5%) | 50 (2.6%) |
| $35,000 to $39,999 | 70 (3.8%) | 104 (5.3%) |
| $40,000 to $44,999 | 151 (8.2%) | 85 (4.4%) |
| $45,000 to $49,999 | 53 (2.9%) | 80 (4.1%) |
| $50,000 to $54,999 | 10 (0.5%) | 43 (2.2%) |
| $55,000 to $64,999 | 50 (2.7%) | 52 (2.7%) |
| $65,000 to $74,999 | 4 (0.2%) | 14 (0.7%) |
| $75,000 to $99,999 | 7 (0.4%) | 0 (0.0%) |
| $100,000+ | 30 (1.6%) | 6 (0.3%) |
| Total | 1,835 (100.0%) | 1,948 (100.0%) |
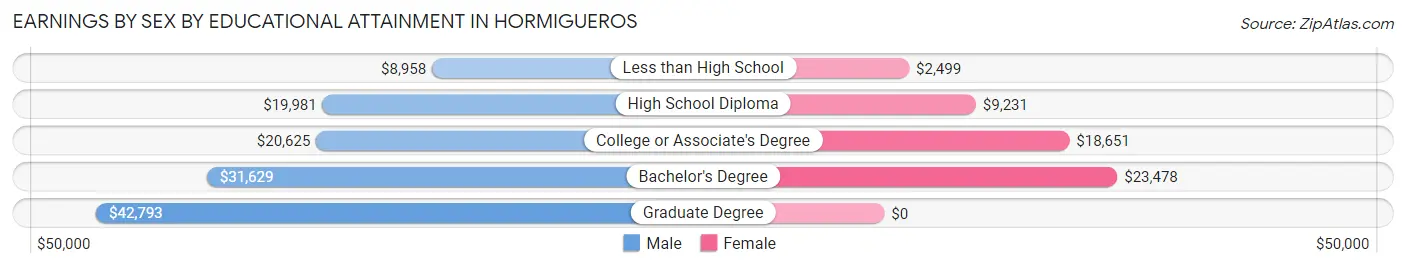
Earnings by Sex by Educational Attainment in Hormigueros
Average earnings in Hormigueros are $20,738 for men and $19,695 for women, a difference of 5.0%. Men with an educational attainment of graduate degree enjoy the highest average annual earnings of $42,793, while those with less than high school education earn the least with $8,958. Women with an educational attainment of bachelor's degree earn the most with the average annual earnings of $23,478, while those with less than high school education have the smallest earnings of $2,499.
| Educational Attainment | Male Income | Female Income |
| Less than High School | $8,958 | $2,499 |
| High School Diploma | $19,981 | $9,231 |
| College or Associate's Degree | $20,625 | $18,651 |
| Bachelor's Degree | $31,629 | $23,478 |
| Graduate Degree | $42,793 | $0 |
| Total | $20,738 | $19,695 |
Family Income in Hormigueros
Family Income Brackets in Hormigueros
According to the Hormigueros family income data, there are 707 families falling into the $15,000 to $24,999 income range, which is the most common income bracket and makes up 24.1% of all families.
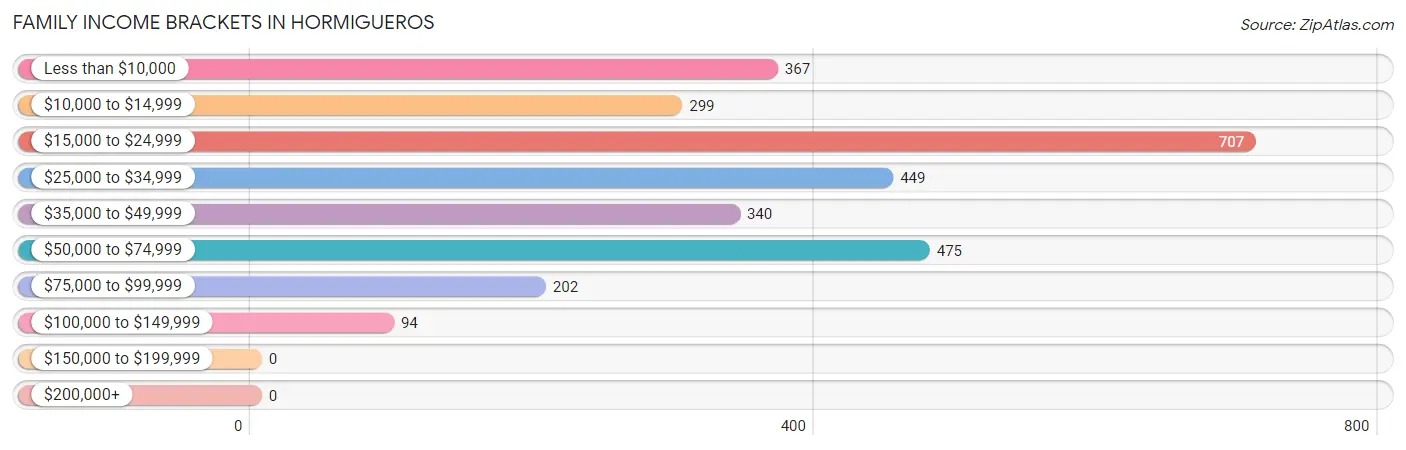
| Income Bracket | # Families | % Families |
| Less than $10,000 | 367 | 12.5% |
| $10,000 to $14,999 | 299 | 10.2% |
| $15,000 to $24,999 | 707 | 24.1% |
| $25,000 to $34,999 | 449 | 15.3% |
| $35,000 to $49,999 | 340 | 11.6% |
| $50,000 to $74,999 | 475 | 16.2% |
| $75,000 to $99,999 | 202 | 6.9% |
| $100,000 to $149,999 | 94 | 3.2% |
| $150,000 to $199,999 | 0 | 0.0% |
| $200,000+ | 0 | 0.0% |
Family Income by Famaliy Size in Hormigueros
4-person families (388 | 13.2%) account for the highest median family income in Hormigueros with $42,619 per family, while 2-person families (1,420 | 48.4%) have the highest median income of $12,744 per family member.
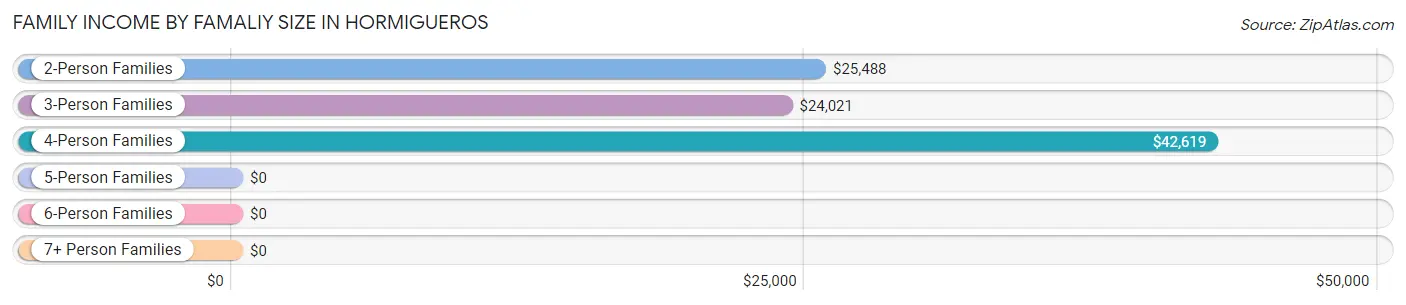
| Income Bracket | # Families | Median Income |
| 2-Person Families | 1,420 (48.4%) | $25,488 |
| 3-Person Families | 1,009 (34.4%) | $24,021 |
| 4-Person Families | 388 (13.2%) | $42,619 |
| 5-Person Families | 92 (3.1%) | $0 |
| 6-Person Families | 20 (0.7%) | $0 |
| 7+ Person Families | 4 (0.1%) | $0 |
| Total | 2,933 (100.0%) | $26,482 |
Family Income by Number of Earners in Hormigueros
The median family income in Hormigueros is $26,482, with families comprising 3+ earners (180) having the highest median family income of $72,500, while families with no earners (1,202) have the lowest median family income of $19,782, accounting for 6.1% and 41.0% of families, respectively.
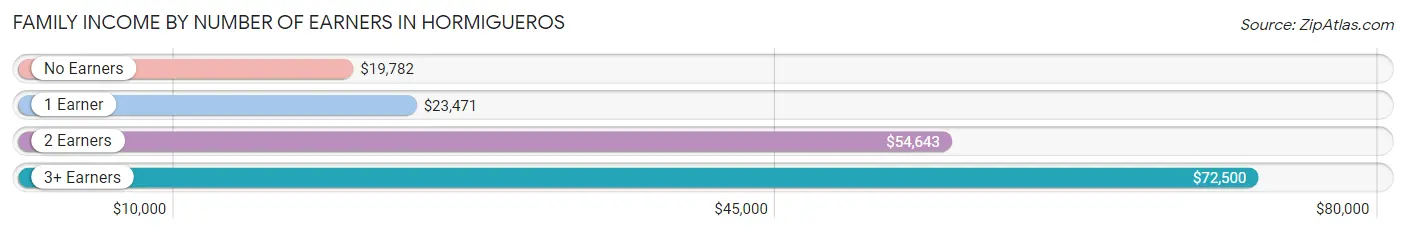
| Number of Earners | # Families | Median Income |
| No Earners | 1,202 (41.0%) | $19,782 |
| 1 Earner | 989 (33.7%) | $23,471 |
| 2 Earners | 562 (19.2%) | $54,643 |
| 3+ Earners | 180 (6.1%) | $72,500 |
| Total | 2,933 (100.0%) | $26,482 |
Household Income in Hormigueros
Household Income Brackets in Hormigueros
With 1,070 households falling in the category, the $15,000 to $24,999 income range is the most frequent in Hormigueros, accounting for 23.4% of all households. In contrast, only 14 households (0.3%) fall into the $150,000 to $199,999 income bracket, making it the least populous group.
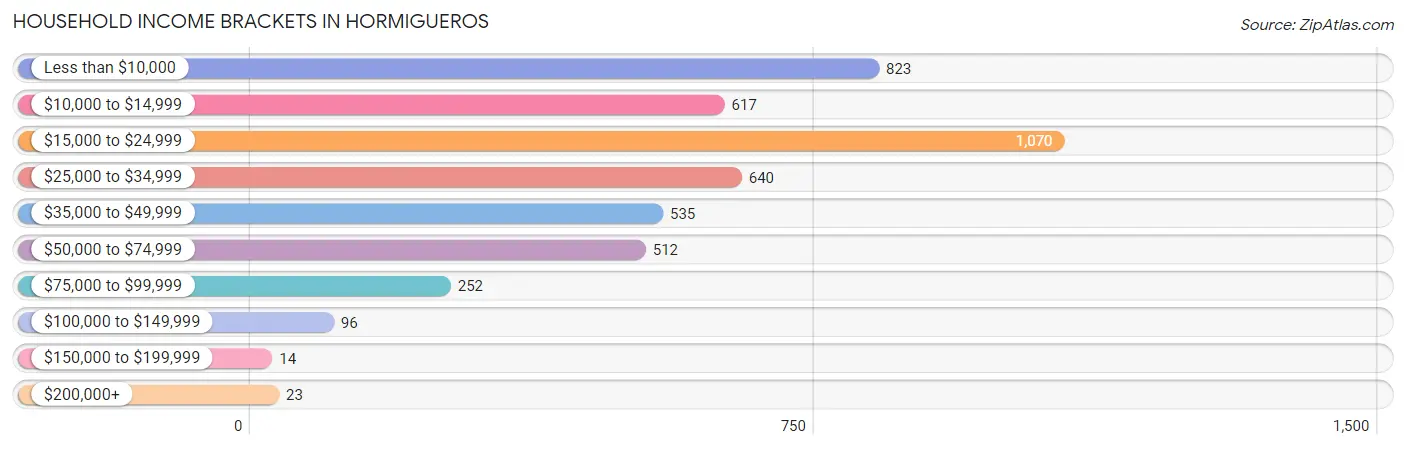
| Income Bracket | # Households | % Households |
| Less than $10,000 | 823 | 18.0% |
| $10,000 to $14,999 | 617 | 13.5% |
| $15,000 to $24,999 | 1,070 | 23.4% |
| $25,000 to $34,999 | 640 | 14.0% |
| $35,000 to $49,999 | 535 | 11.7% |
| $50,000 to $74,999 | 512 | 11.2% |
| $75,000 to $99,999 | 252 | 5.5% |
| $100,000 to $149,999 | 96 | 2.1% |
| $150,000 to $199,999 | 14 | 0.3% |
| $200,000+ | 23 | 0.5% |
Household Income by Householder Age in Hormigueros
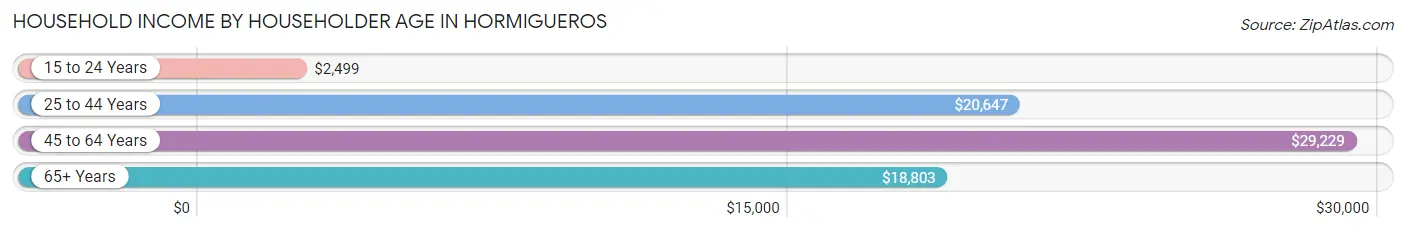
The median household income in Hormigueros is $21,950, with the highest median household income of $29,229 found in the 45 to 64 years age bracket for the primary householder. A total of 1,716 households (37.5%) fall into this category. Meanwhile, the 15 to 24 years age bracket for the primary householder has the lowest median household income of $2,499, with 62 households (1.4%) in this group.
| Income Bracket | # Households | Median Income |
| 15 to 24 Years | 62 (1.4%) | $2,499 |
| 25 to 44 Years | 677 (14.8%) | $20,647 |
| 45 to 64 Years | 1,716 (37.5%) | $29,229 |
| 65+ Years | 2,118 (46.3%) | $18,803 |
| Total | 4,573 (100.0%) | $21,950 |
Poverty in Hormigueros
Income Below Poverty by Sex and Age in Hormigueros
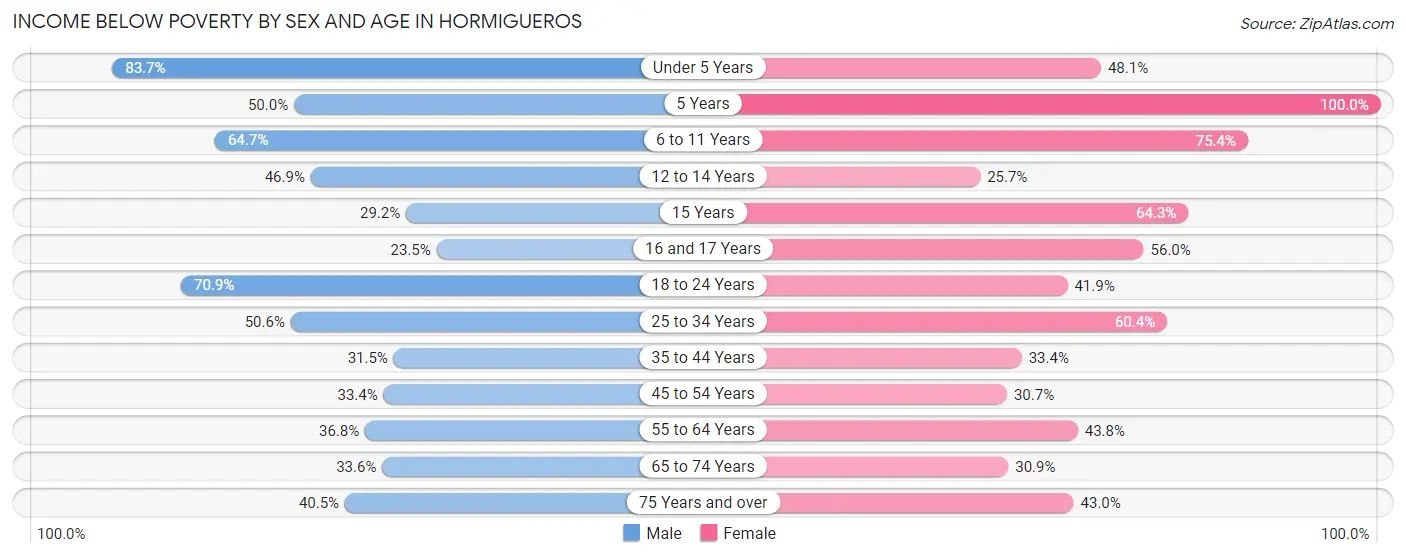
With 42.6% poverty level for males and 41.9% for females among the residents of Hormigueros, under 5 year old males and 5 year old females are the most vulnerable to poverty, with 108 males (83.7%) and 28 females (100.0%) in their respective age groups living below the poverty level.
| Age Bracket | Male | Female |
| Under 5 Years | 108 (83.7%) | 51 (48.1%) |
| 5 Years | 15 (50.0%) | 28 (100.0%) |
| 6 to 11 Years | 139 (64.6%) | 162 (75.3%) |
| 12 to 14 Years | 83 (46.9%) | 37 (25.7%) |
| 15 Years | 33 (29.2%) | 9 (64.3%) |
| 16 and 17 Years | 32 (23.5%) | 93 (56.0%) |
| 18 to 24 Years | 332 (70.9%) | 204 (41.9%) |
| 25 to 34 Years | 255 (50.6%) | 370 (60.4%) |
| 35 to 44 Years | 159 (31.5%) | 173 (33.4%) |
| 45 to 54 Years | 248 (33.4%) | 260 (30.7%) |
| 55 to 64 Years | 265 (36.8%) | 357 (43.8%) |
| 65 to 74 Years | 235 (33.6%) | 281 (30.9%) |
| 75 Years and over | 287 (40.5%) | 491 (43.0%) |
| Total | 2,191 (42.6%) | 2,516 (41.9%) |
Income Above Poverty by Sex and Age in Hormigueros
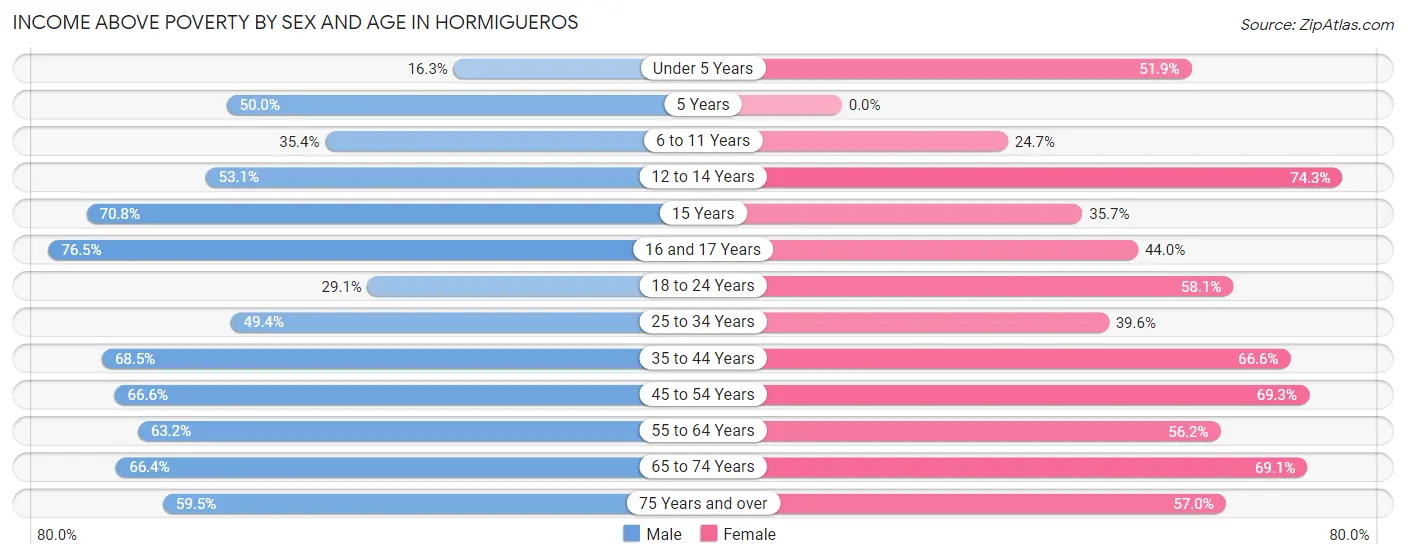
According to the poverty statistics in Hormigueros, males aged 16 and 17 years and females aged 12 to 14 years are the age groups that are most secure financially, with 76.5% of males and 74.3% of females in these age groups living above the poverty line.
| Age Bracket | Male | Female |
| Under 5 Years | 21 (16.3%) | 55 (51.9%) |
| 5 Years | 15 (50.0%) | 0 (0.0%) |
| 6 to 11 Years | 76 (35.3%) | 53 (24.6%) |
| 12 to 14 Years | 94 (53.1%) | 107 (74.3%) |
| 15 Years | 80 (70.8%) | 5 (35.7%) |
| 16 and 17 Years | 104 (76.5%) | 73 (44.0%) |
| 18 to 24 Years | 136 (29.1%) | 283 (58.1%) |
| 25 to 34 Years | 249 (49.4%) | 243 (39.6%) |
| 35 to 44 Years | 346 (68.5%) | 345 (66.6%) |
| 45 to 54 Years | 495 (66.6%) | 588 (69.3%) |
| 55 to 64 Years | 455 (63.2%) | 458 (56.2%) |
| 65 to 74 Years | 464 (66.4%) | 628 (69.1%) |
| 75 Years and over | 421 (59.5%) | 650 (57.0%) |
| Total | 2,956 (57.4%) | 3,488 (58.1%) |
Income Below Poverty Among Married-Couple Families in Hormigueros
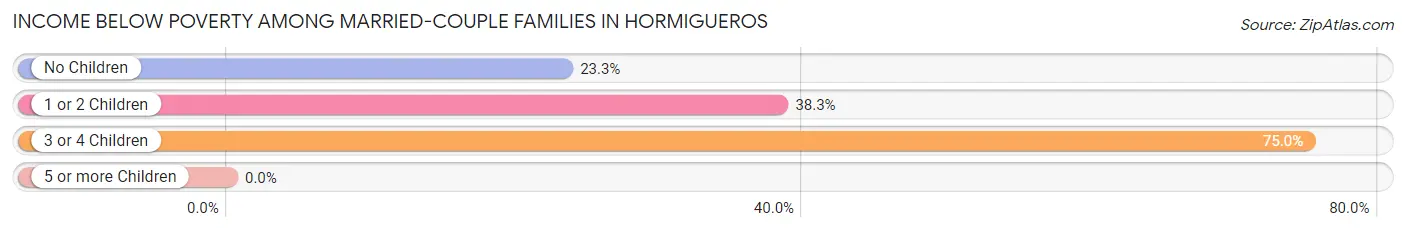
The poverty statistics for married-couple families in Hormigueros show that 28.6% or 483 of the total 1,687 families live below the poverty line. Families with 3 or 4 children have the highest poverty rate of 75.0%, comprising of 12 families. On the other hand, families with no children have the lowest poverty rate of 23.3%, which includes 264 families.
| Children | Above Poverty | Below Poverty |
| No Children | 867 (76.7%) | 264 (23.3%) |
| 1 or 2 Children | 333 (61.7%) | 207 (38.3%) |
| 3 or 4 Children | 4 (25.0%) | 12 (75.0%) |
| 5 or more Children | 0 (0.0%) | 0 (0.0%) |
| Total | 1,204 (71.4%) | 483 (28.6%) |
Income Below Poverty Among Single-Parent Households in Hormigueros
According to the poverty data in Hormigueros, 36.0% or 116 single-father households and 60.9% or 563 single-mother households are living below the poverty line. Among single-father households, those with no children have the highest poverty rate, with 104 households (39.7%) experiencing poverty. Likewise, among single-mother households, those with 1 or 2 children have the highest poverty rate, with 339 households (73.7%) falling below the poverty line.
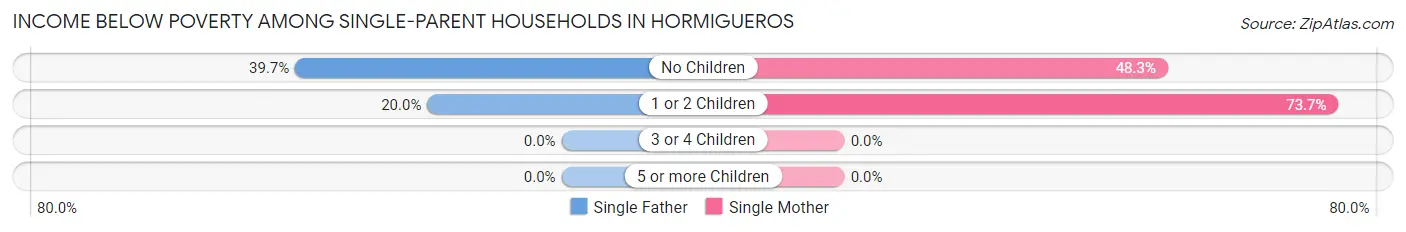
| Children | Single Father | Single Mother |
| No Children | 104 (39.7%) | 224 (48.3%) |
| 1 or 2 Children | 12 (20.0%) | 339 (73.7%) |
| 3 or 4 Children | 0 (0.0%) | 0 (0.0%) |
| 5 or more Children | 0 (0.0%) | 0 (0.0%) |
| Total | 116 (36.0%) | 563 (60.9%) |
Income Below Poverty Among Married-Couple vs Single-Parent Households in Hormigueros
The poverty data for Hormigueros shows that 483 of the married-couple family households (28.6%) and 679 of the single-parent households (54.5%) are living below the poverty level. Within the married-couple family households, those with 3 or 4 children have the highest poverty rate, with 12 households (75.0%) falling below the poverty line. Among the single-parent households, those with 1 or 2 children have the highest poverty rate, with 351 household (67.5%) living below poverty.
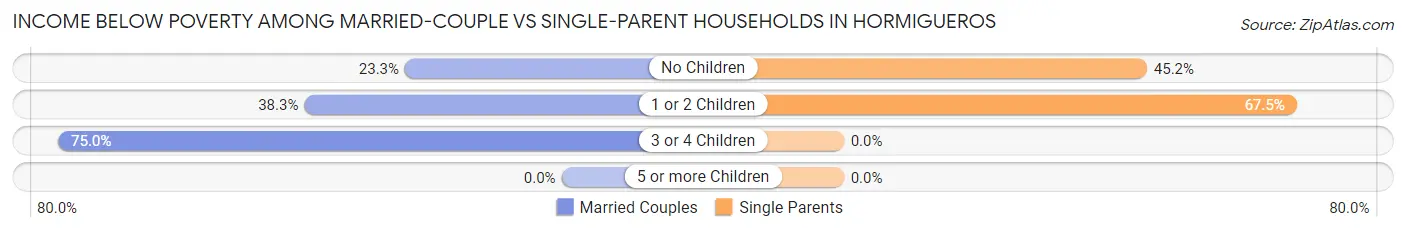
| Children | Married-Couple Families | Single-Parent Households |
| No Children | 264 (23.3%) | 328 (45.2%) |
| 1 or 2 Children | 207 (38.3%) | 351 (67.5%) |
| 3 or 4 Children | 12 (75.0%) | 0 (0.0%) |
| 5 or more Children | 0 (0.0%) | 0 (0.0%) |
| Total | 483 (28.6%) | 679 (54.5%) |
Race in Hormigueros
The most populous races in Hormigueros are Hispanic or Latino (11,097 | 98.9%), Some other Race (8,020 | 71.5%), and White / Caucasian (2,349 | 20.9%).
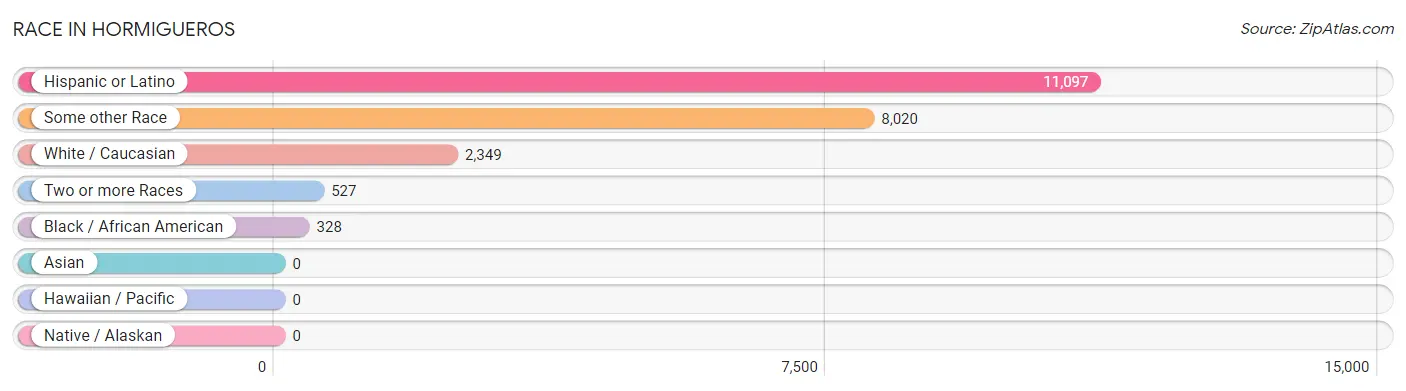
| Race | # Population | % Population |
| Asian | 0 | 0.0% |
| Black / African American | 328 | 2.9% |
| Hawaiian / Pacific | 0 | 0.0% |
| Hispanic or Latino | 11,097 | 98.9% |
| Native / Alaskan | 0 | 0.0% |
| White / Caucasian | 2,349 | 20.9% |
| Two or more Races | 527 | 4.7% |
| Some other Race | 8,020 | 71.5% |
| Total | 11,224 | 100.0% |
Ancestry in Hormigueros
The most populous ancestries reported in Hormigueros are Puerto Rican (10,856 | 96.7%), American (213 | 1.9%), Dominican (213 | 1.9%), Portuguese (19 | 0.2%), and Cuban (15 | 0.1%), together accounting for 100.8% of all Hormigueros residents.
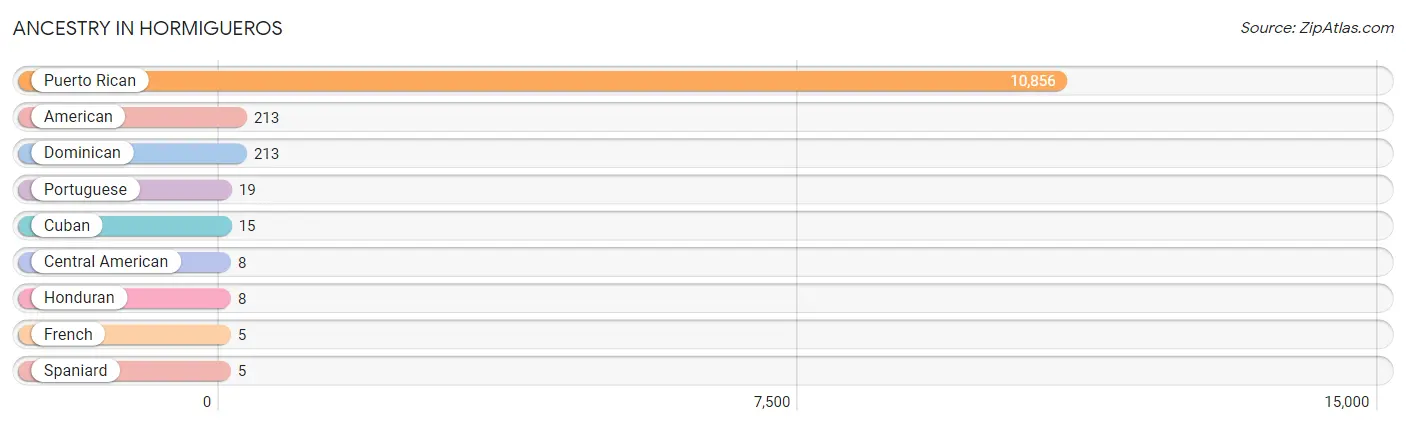
| Ancestry | # Population | % Population |
| American | 213 | 1.9% |
| Central American | 8 | 0.1% |
| Cuban | 15 | 0.1% |
| Dominican | 213 | 1.9% |
| French | 5 | 0.0% |
| Honduran | 8 | 0.1% |
| Portuguese | 19 | 0.2% |
| Puerto Rican | 10,856 | 96.7% |
| Spaniard | 5 | 0.0% | View All 9 Rows |
Immigrants in Hormigueros

| Immigration Origin | # Population | % Population | View All 0 Rows |
Sex and Age in Hormigueros
Sex and Age in Hormigueros
The most populous age groups in Hormigueros are 45 to 49 Years (405 | 7.8%) for men and 75 to 79 Years (573 | 9.5%) for women.
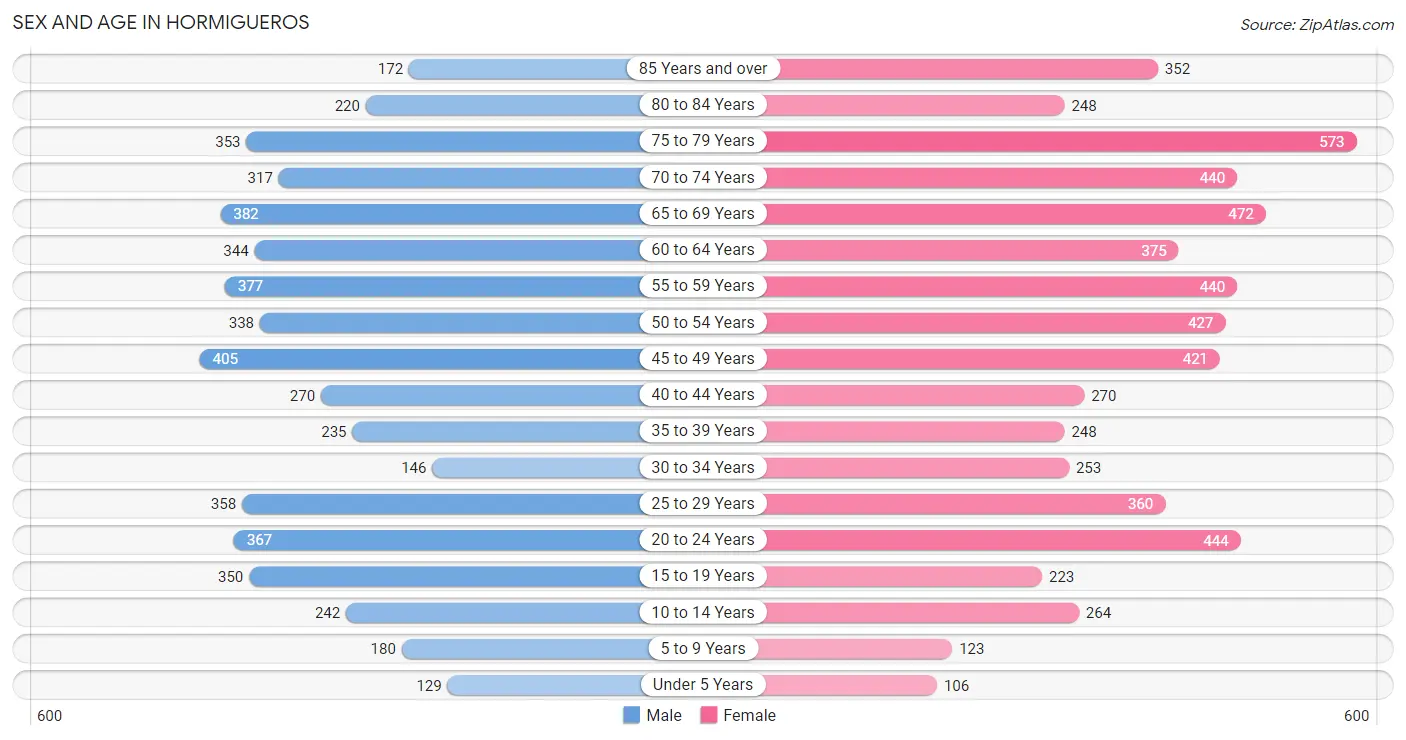
| Age Bracket | Male | Female |
| Under 5 Years | 129 (2.5%) | 106 (1.8%) |
| 5 to 9 Years | 180 (3.5%) | 123 (2.0%) |
| 10 to 14 Years | 242 (4.7%) | 264 (4.4%) |
| 15 to 19 Years | 350 (6.8%) | 223 (3.7%) |
| 20 to 24 Years | 367 (7.1%) | 444 (7.3%) |
| 25 to 29 Years | 358 (6.9%) | 360 (6.0%) |
| 30 to 34 Years | 146 (2.8%) | 253 (4.2%) |
| 35 to 39 Years | 235 (4.5%) | 248 (4.1%) |
| 40 to 44 Years | 270 (5.2%) | 270 (4.5%) |
| 45 to 49 Years | 405 (7.8%) | 421 (7.0%) |
| 50 to 54 Years | 338 (6.5%) | 427 (7.1%) |
| 55 to 59 Years | 377 (7.3%) | 440 (7.3%) |
| 60 to 64 Years | 344 (6.6%) | 375 (6.2%) |
| 65 to 69 Years | 382 (7.4%) | 472 (7.8%) |
| 70 to 74 Years | 317 (6.1%) | 440 (7.3%) |
| 75 to 79 Years | 353 (6.8%) | 573 (9.5%) |
| 80 to 84 Years | 220 (4.2%) | 248 (4.1%) |
| 85 Years and over | 172 (3.3%) | 352 (5.8%) |
| Total | 5,185 (100.0%) | 6,039 (100.0%) |
Families and Households in Hormigueros
Median Family Size in Hormigueros
The median family size in Hormigueros is 3.11 persons per family, with married-couple families (1,687 | 57.5%) accounting for the largest median family size of 3.24 persons per family. On the other hand, single male/father families (322 | 11.0%) represent the smallest median family size with 2.88 persons per family.
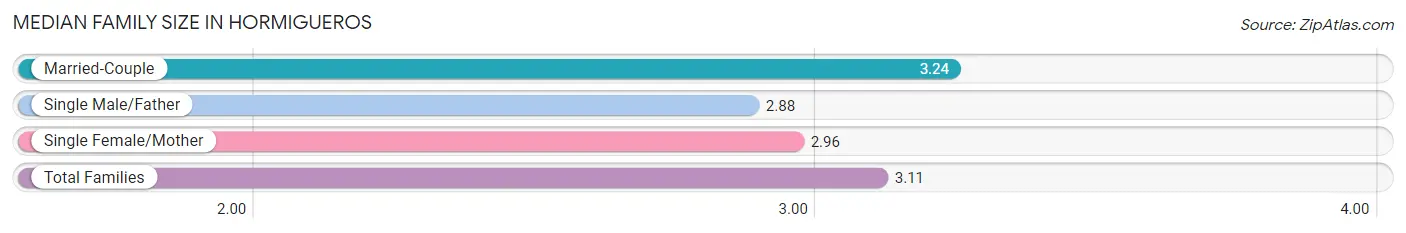
| Family Type | # Families | Family Size |
| Married-Couple | 1,687 (57.5%) | 3.24 |
| Single Male/Father | 322 (11.0%) | 2.88 |
| Single Female/Mother | 924 (31.5%) | 2.96 |
| Total Families | 2,933 (100.0%) | 3.11 |
Median Household Size in Hormigueros
The median household size in Hormigueros is 2.42 persons per household, with married-couple households (1,687 | 36.9%) accounting for the largest median household size of 3.24 persons per household. non-family households (1,640 | 35.9%) represent the smallest median household size with 1.11 persons per household.
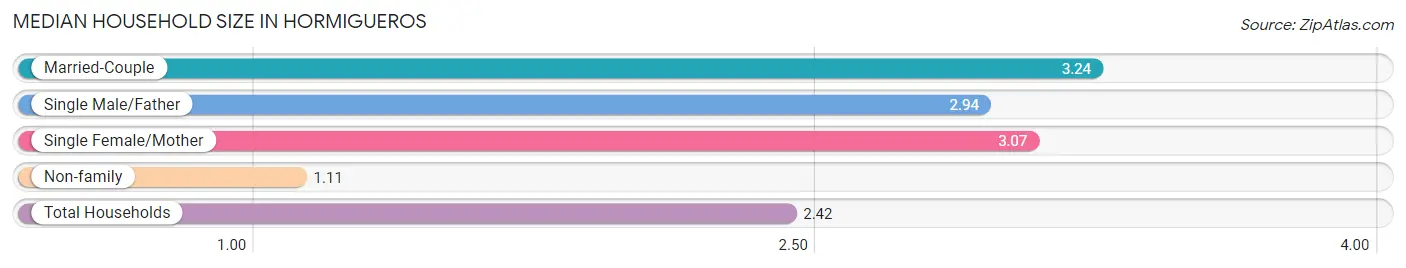
| Household Type | # Households | Household Size |
| Married-Couple | 1,687 (36.9%) | 3.24 |
| Single Male/Father | 322 (7.0%) | 2.94 |
| Single Female/Mother | 924 (20.2%) | 3.07 |
| Non-family | 1,640 (35.9%) | 1.11 |
| Total Households | 4,573 (100.0%) | 2.42 |
Household Size by Marriage Status in Hormigueros
Out of a total of 4,573 households in Hormigueros, 2,933 (64.1%) are family households, while 1,640 (35.9%) are nonfamily households. The most numerous type of family households are 2-person households, comprising 1,338, and the most common type of nonfamily households are 1-person households, comprising 1,442.
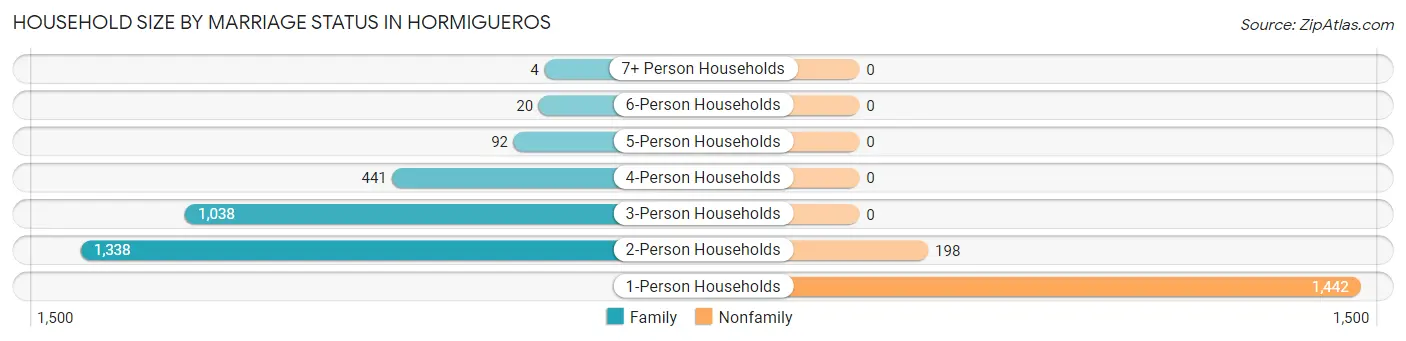
| Household Size | Family Households | Nonfamily Households |
| 1-Person Households | - | 1,442 (31.5%) |
| 2-Person Households | 1,338 (29.3%) | 198 (4.3%) |
| 3-Person Households | 1,038 (22.7%) | 0 (0.0%) |
| 4-Person Households | 441 (9.6%) | 0 (0.0%) |
| 5-Person Households | 92 (2.0%) | 0 (0.0%) |
| 6-Person Households | 20 (0.4%) | 0 (0.0%) |
| 7+ Person Households | 4 (0.1%) | 0 (0.0%) |
| Total | 2,933 (64.1%) | 1,640 (35.9%) |
Female Fertility in Hormigueros
Fertility by Age in Hormigueros
Average fertility rate in Hormigueros is 39.0 births per 1,000 women. Women in the age bracket of 20 to 34 years have the highest fertility rate with 81.0 births per 1,000 women. Women in the age bracket of 20 to 34 years acount for 93.5% of all women with births.
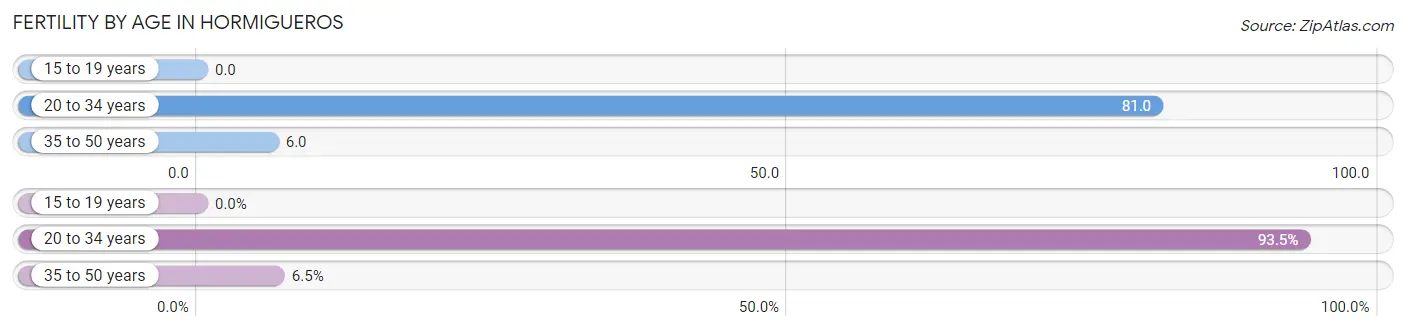
| Age Bracket | Women with Births | Births / 1,000 Women |
| 15 to 19 years | 0 (0.0%) | 0.0 |
| 20 to 34 years | 86 (93.5%) | 81.0 |
| 35 to 50 years | 6 (6.5%) | 6.0 |
| Total | 92 (100.0%) | 39.0 |
Fertility by Age by Marriage Status in Hormigueros
52.2% of women with births (92) in Hormigueros are married. The highest percentage of unmarried women with births falls into 35 to 50 years age bracket with 100.0% of them unmarried at the time of birth, while the lowest percentage of unmarried women with births belong to 20 to 34 years age bracket with 44.2% of them unmarried.
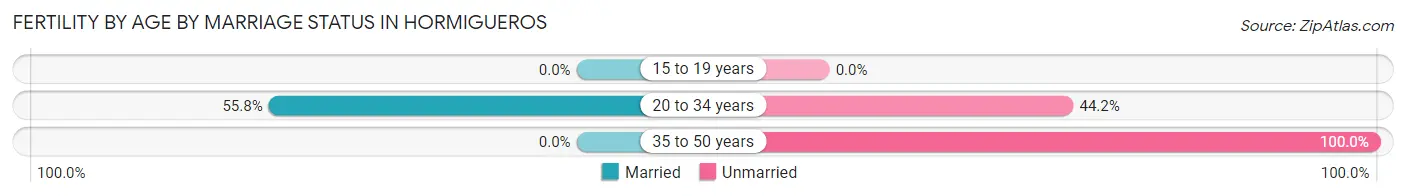
| Age Bracket | Married | Unmarried |
| 15 to 19 years | 0 (0.0%) | 0 (0.0%) |
| 20 to 34 years | 48 (55.8%) | 38 (44.2%) |
| 35 to 50 years | 0 (0.0%) | 6 (100.0%) |
| Total | 48 (52.2%) | 44 (47.8%) |
Fertility by Education in Hormigueros
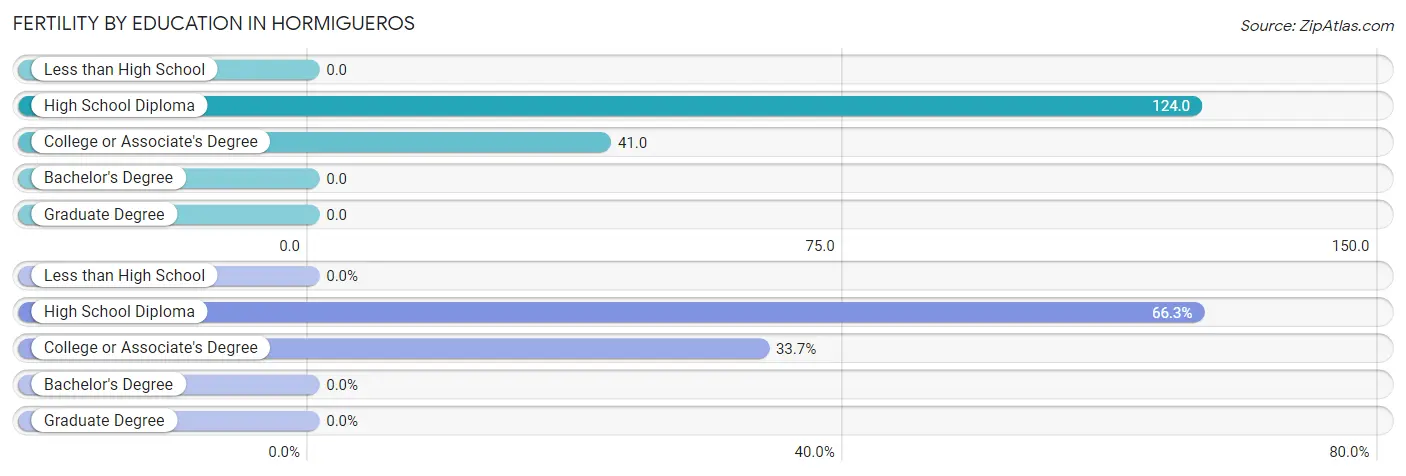
| Educational Attainment | Women with Births | Births / 1,000 Women |
| Less than High School | 0 (0.0%) | 0.0 |
| High School Diploma | 61 (66.3%) | 124.0 |
| College or Associate's Degree | 31 (33.7%) | 41.0 |
| Bachelor's Degree | 0 (0.0%) | 0.0 |
| Graduate Degree | 0 (0.0%) | 0.0 |
| Total | 92 (100.0%) | 39.0 |
Fertility by Education by Marriage Status in Hormigueros
47.8% of women with births in Hormigueros are unmarried. Women with the educational attainment of high school diploma are most likely to be married with 78.7% of them married at childbirth, while women with the educational attainment of college or associate's degree are least likely to be married with 100.0% of them unmarried at childbirth.
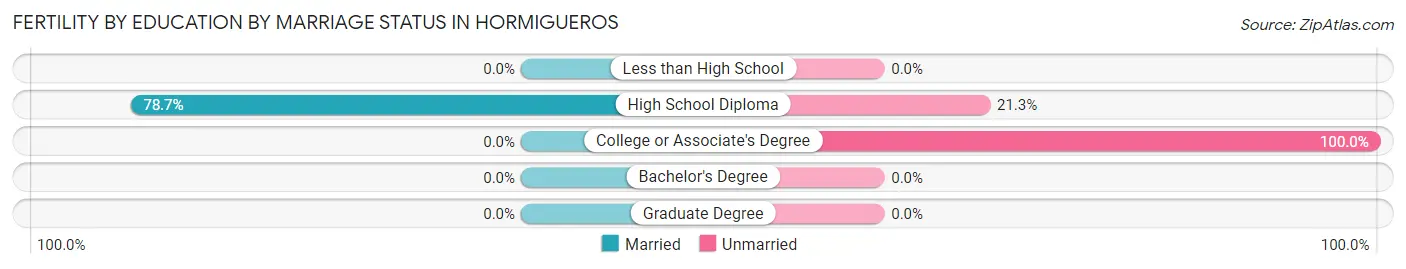
| Educational Attainment | Married | Unmarried |
| Less than High School | 0 (0.0%) | 0 (0.0%) |
| High School Diploma | 48 (78.7%) | 13 (21.3%) |
| College or Associate's Degree | 0 (0.0%) | 31 (100.0%) |
| Bachelor's Degree | 0 (0.0%) | 0 (0.0%) |
| Graduate Degree | 0 (0.0%) | 0 (0.0%) |
| Total | 48 (52.2%) | 44 (47.8%) |
Employment Characteristics in Hormigueros
Employment by Class of Employer in Hormigueros
Among the 3,458 employed individuals in Hormigueros, private company employees (2,193 | 63.4%), state government employees (713 | 20.6%), and local government employees (191 | 5.5%) make up the most common classes of employment.
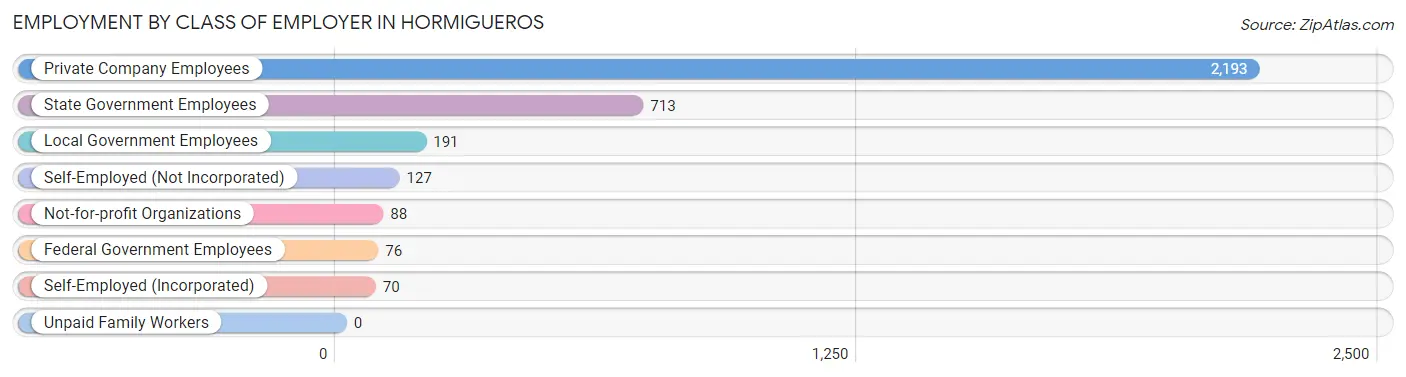
| Employer Class | # Employees | % Employees |
| Private Company Employees | 2,193 | 63.4% |
| Self-Employed (Incorporated) | 70 | 2.0% |
| Self-Employed (Not Incorporated) | 127 | 3.7% |
| Not-for-profit Organizations | 88 | 2.5% |
| Local Government Employees | 191 | 5.5% |
| State Government Employees | 713 | 20.6% |
| Federal Government Employees | 76 | 2.2% |
| Unpaid Family Workers | 0 | 0.0% |
| Total | 3,458 | 100.0% |
Employment Status by Age in Hormigueros
According to the labor force statistics for Hormigueros, out of the total population over 16 years of age (10,053), 41.9% or 4,212 individuals are in the labor force, with 16.0% or 674 of them unemployed. The age group with the highest labor force participation rate is 30 to 34 years, with 96.5% or 385 individuals in the labor force. Within the labor force, the 16 to 19 years age range has the highest percentage of unemployed individuals, with 53.3% or 48 of them being unemployed.
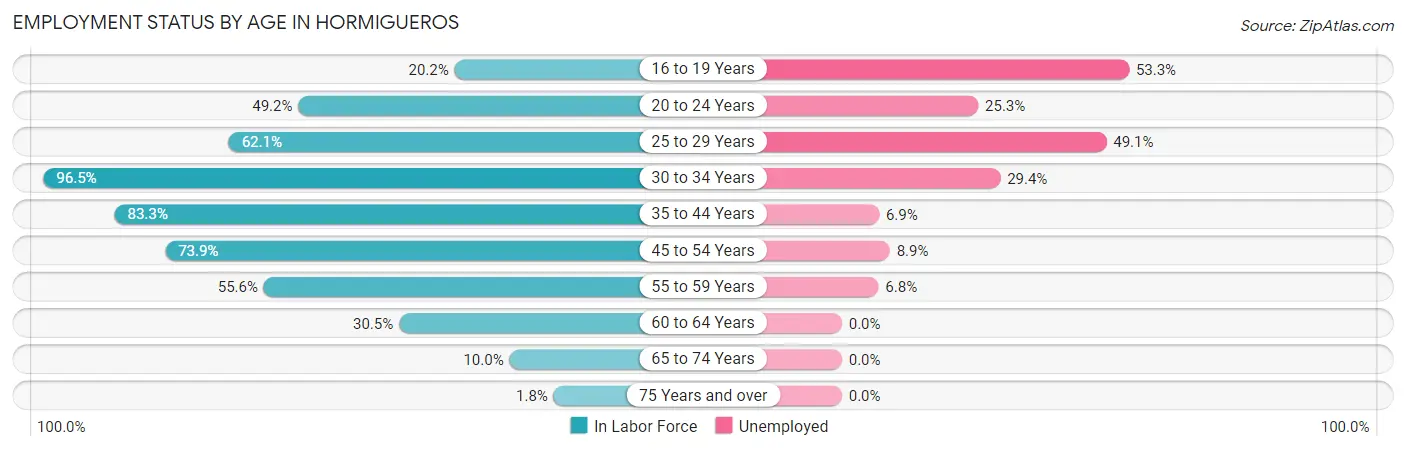
| Age Bracket | In Labor Force | Unemployed |
| 16 to 19 Years | 90 (20.2%) | 48 (53.3%) |
| 20 to 24 Years | 399 (49.2%) | 101 (25.3%) |
| 25 to 29 Years | 446 (62.1%) | 219 (49.1%) |
| 30 to 34 Years | 385 (96.5%) | 113 (29.4%) |
| 35 to 44 Years | 852 (83.3%) | 59 (6.9%) |
| 45 to 54 Years | 1,176 (73.9%) | 105 (8.9%) |
| 55 to 59 Years | 454 (55.6%) | 31 (6.8%) |
| 60 to 64 Years | 219 (30.5%) | 0 (0.0%) |
| 65 to 74 Years | 161 (10.0%) | 0 (0.0%) |
| 75 Years and over | 35 (1.8%) | 0 (0.0%) |
| Total | 4,212 (41.9%) | 674 (16.0%) |
Employment Status by Educational Attainment in Hormigueros
According to labor force statistics for Hormigueros, 67.1% of individuals (3,534) out of the total population between 25 and 64 years of age (5,267) are in the labor force, with 14.9% or 527 of them being unemployed. The group with the highest labor force participation rate are those with the educational attainment of bachelor's degree or higher, with 75.9% or 1,359 individuals in the labor force. Within the labor force, individuals with less than high school education have the highest percentage of unemployment, with 37.2% or 71 of them being unemployed.
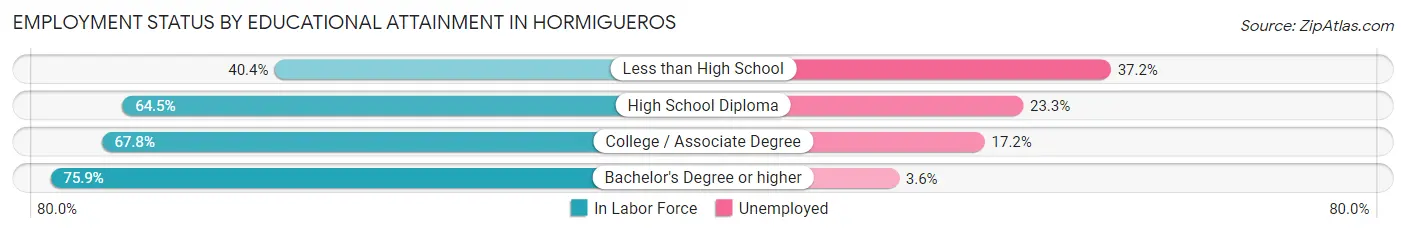
| Educational Attainment | In Labor Force | Unemployed |
| Less than High School | 191 (40.4%) | 176 (37.2%) |
| High School Diploma | 1,084 (64.5%) | 391 (23.3%) |
| College / Associate Degree | 897 (67.8%) | 228 (17.2%) |
| Bachelor's Degree or higher | 1,359 (75.9%) | 64 (3.6%) |
| Total | 3,534 (67.1%) | 785 (14.9%) |
Employment Occupations by Sex in Hormigueros
Management, Business, Science and Arts Occupations
The most common Management, Business, Science and Arts occupations in Hormigueros are Community & Social Service (424 | 12.0%), Health Diagnosing & Treating (355 | 10.1%), Education Instruction & Library (300 | 8.5%), Health Technologists (258 | 7.3%), and Management (236 | 6.7%).
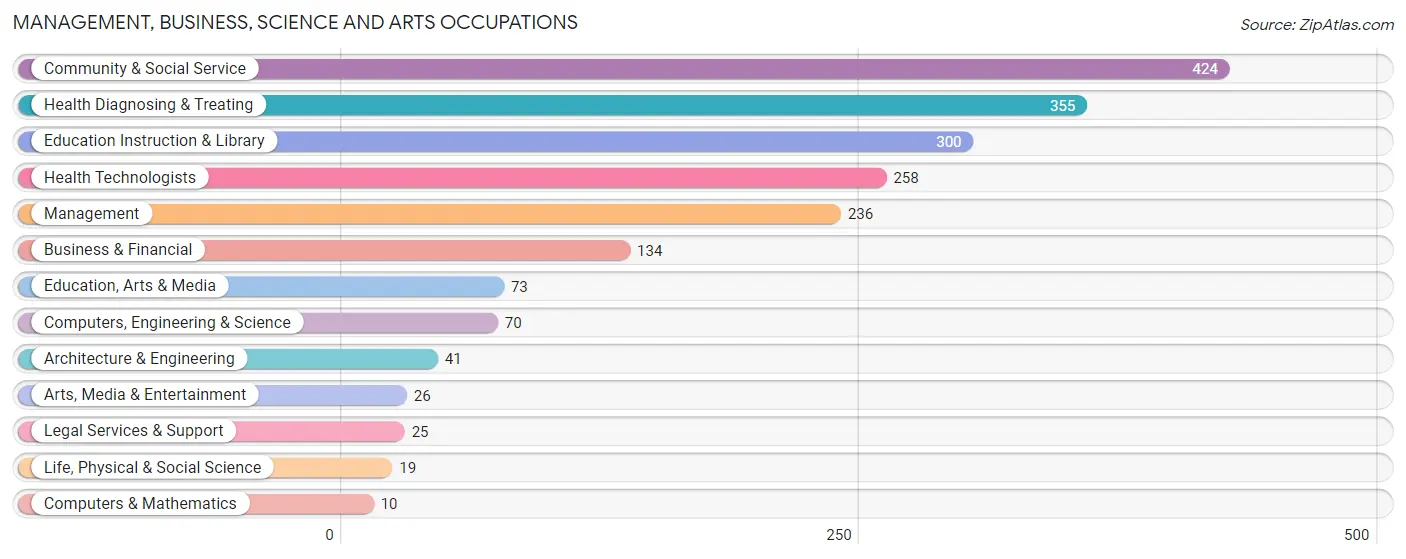
Management, Business, Science and Arts Occupations by Sex
Within the Management, Business, Science and Arts occupations in Hormigueros, the most male-oriented occupations are Computers, Engineering & Science (100.0%), Computers & Mathematics (100.0%), and Architecture & Engineering (100.0%), while the most female-oriented occupations are Arts, Media & Entertainment (100.0%), Education Instruction & Library (89.3%), and Community & Social Service (82.6%).
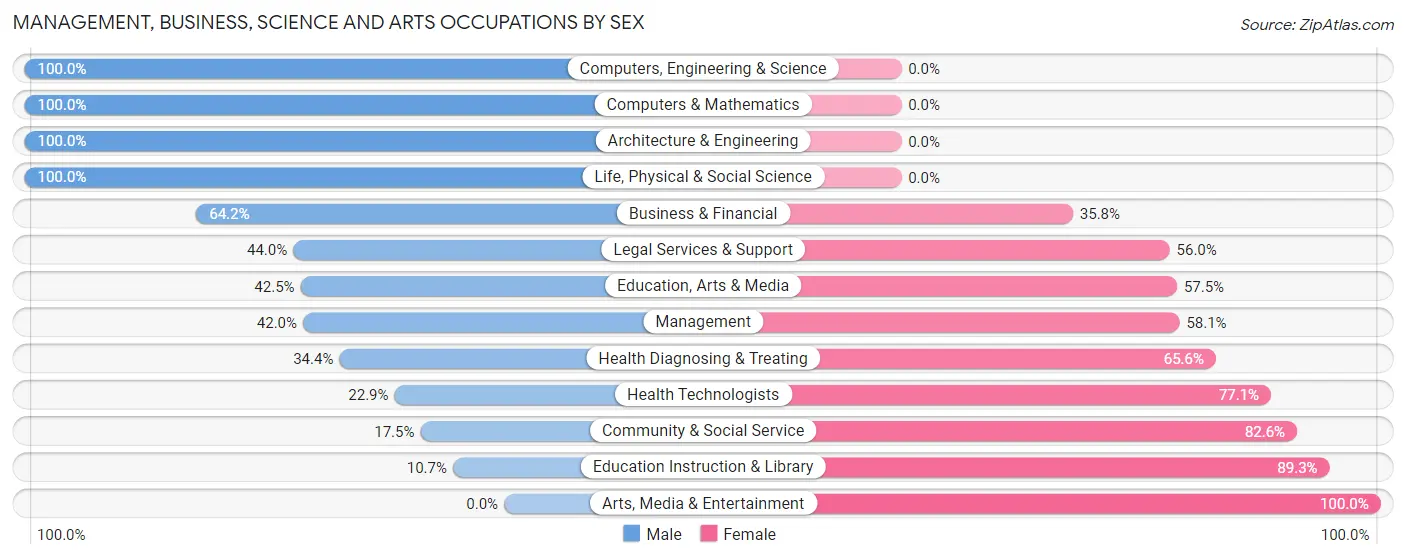
| Occupation | Male | Female |
| Management | 99 (41.9%) | 137 (58.1%) |
| Business & Financial | 86 (64.2%) | 48 (35.8%) |
| Computers, Engineering & Science | 70 (100.0%) | 0 (0.0%) |
| Computers & Mathematics | 10 (100.0%) | 0 (0.0%) |
| Architecture & Engineering | 41 (100.0%) | 0 (0.0%) |
| Life, Physical & Social Science | 19 (100.0%) | 0 (0.0%) |
| Community & Social Service | 74 (17.4%) | 350 (82.6%) |
| Education, Arts & Media | 31 (42.5%) | 42 (57.5%) |
| Legal Services & Support | 11 (44.0%) | 14 (56.0%) |
| Education Instruction & Library | 32 (10.7%) | 268 (89.3%) |
| Arts, Media & Entertainment | 0 (0.0%) | 26 (100.0%) |
| Health Diagnosing & Treating | 122 (34.4%) | 233 (65.6%) |
| Health Technologists | 59 (22.9%) | 199 (77.1%) |
| Total (Category) | 451 (37.0%) | 768 (63.0%) |
| Total (Overall) | 1,624 (46.0%) | 1,910 (54.0%) |
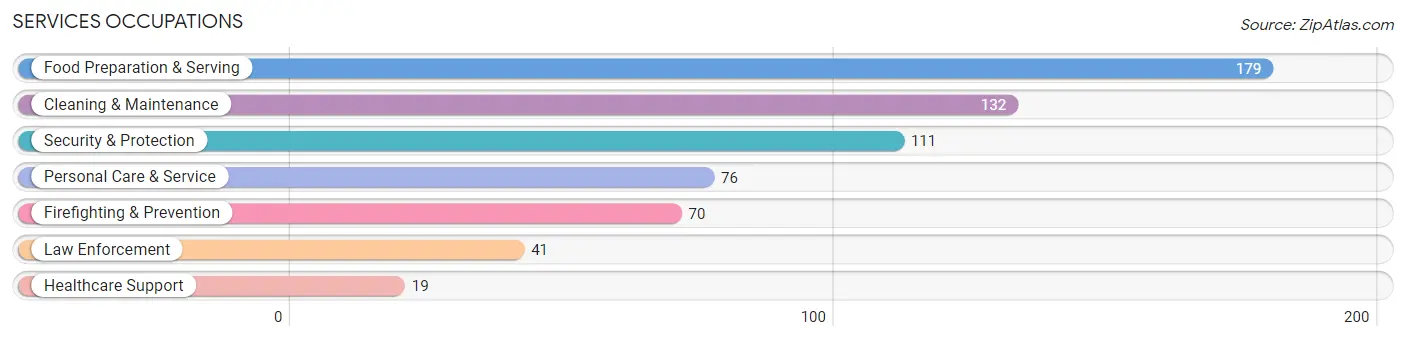
Services Occupations
The most common Services occupations in Hormigueros are Food Preparation & Serving (179 | 5.1%), Cleaning & Maintenance (132 | 3.7%), Security & Protection (111 | 3.1%), Personal Care & Service (76 | 2.1%), and Firefighting & Prevention (70 | 2.0%).
Services Occupations by Sex
Within the Services occupations in Hormigueros, the most male-oriented occupations are Law Enforcement (100.0%), Personal Care & Service (100.0%), and Security & Protection (93.7%), while the most female-oriented occupations are Cleaning & Maintenance (76.5%), Food Preparation & Serving (64.8%), and Healthcare Support (57.9%).
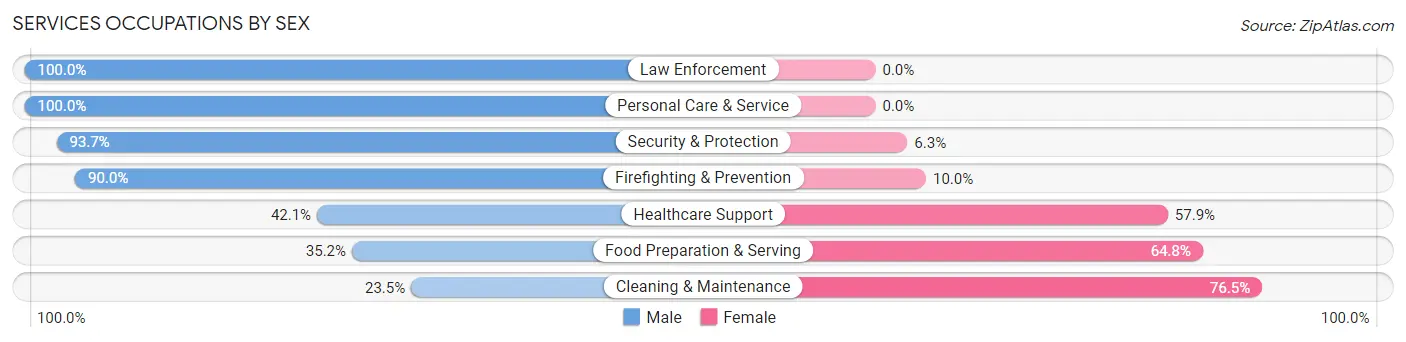
| Occupation | Male | Female |
| Healthcare Support | 8 (42.1%) | 11 (57.9%) |
| Security & Protection | 104 (93.7%) | 7 (6.3%) |
| Firefighting & Prevention | 63 (90.0%) | 7 (10.0%) |
| Law Enforcement | 41 (100.0%) | 0 (0.0%) |
| Food Preparation & Serving | 63 (35.2%) | 116 (64.8%) |
| Cleaning & Maintenance | 31 (23.5%) | 101 (76.5%) |
| Personal Care & Service | 76 (100.0%) | 0 (0.0%) |
| Total (Category) | 282 (54.5%) | 235 (45.5%) |
| Total (Overall) | 1,624 (46.0%) | 1,910 (54.0%) |
Sales and Office Occupations
The most common Sales and Office occupations in Hormigueros are Office & Administration (724 | 20.5%), and Sales & Related (486 | 13.8%).
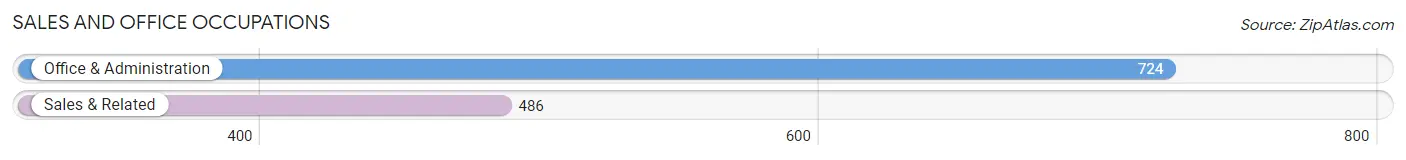
Sales and Office Occupations by Sex
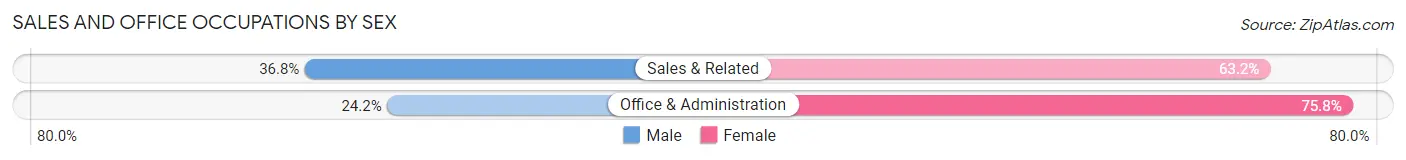
| Occupation | Male | Female |
| Sales & Related | 179 (36.8%) | 307 (63.2%) |
| Office & Administration | 175 (24.2%) | 549 (75.8%) |
| Total (Category) | 354 (29.3%) | 856 (70.7%) |
| Total (Overall) | 1,624 (46.0%) | 1,910 (54.0%) |
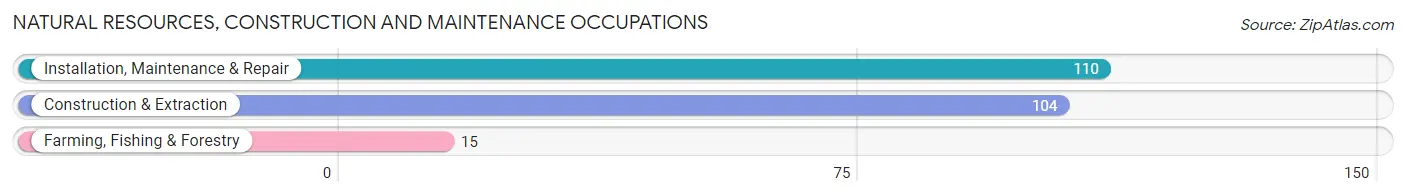
Natural Resources, Construction and Maintenance Occupations
The most common Natural Resources, Construction and Maintenance occupations in Hormigueros are Installation, Maintenance & Repair (110 | 3.1%), Construction & Extraction (104 | 2.9%), and Farming, Fishing & Forestry (15 | 0.4%).
Natural Resources, Construction and Maintenance Occupations by Sex
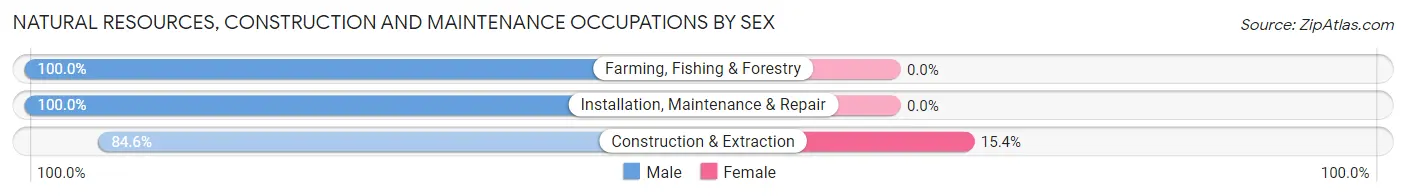
| Occupation | Male | Female |
| Farming, Fishing & Forestry | 15 (100.0%) | 0 (0.0%) |
| Construction & Extraction | 88 (84.6%) | 16 (15.4%) |
| Installation, Maintenance & Repair | 110 (100.0%) | 0 (0.0%) |
| Total (Category) | 213 (93.0%) | 16 (7.0%) |
| Total (Overall) | 1,624 (46.0%) | 1,910 (54.0%) |
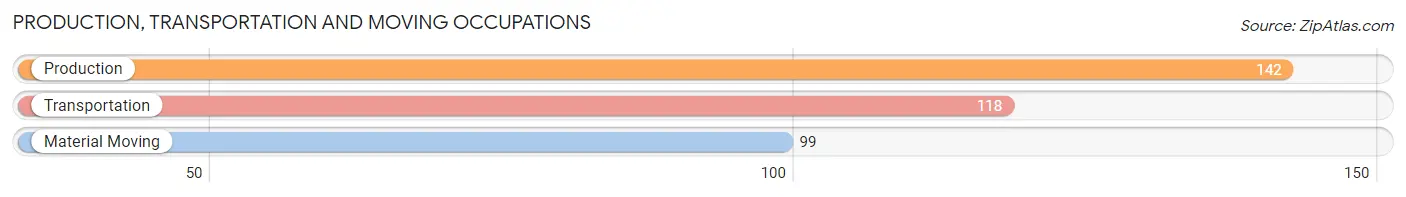
Production, Transportation and Moving Occupations
The most common Production, Transportation and Moving occupations in Hormigueros are Production (142 | 4.0%), Transportation (118 | 3.3%), and Material Moving (99 | 2.8%).
Production, Transportation and Moving Occupations by Sex
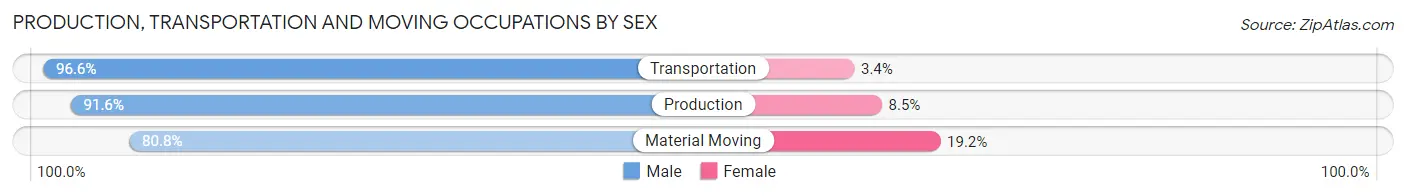
| Occupation | Male | Female |
| Production | 130 (91.5%) | 12 (8.5%) |
| Transportation | 114 (96.6%) | 4 (3.4%) |
| Material Moving | 80 (80.8%) | 19 (19.2%) |
| Total (Category) | 324 (90.2%) | 35 (9.8%) |
| Total (Overall) | 1,624 (46.0%) | 1,910 (54.0%) |
Employment Industries by Sex in Hormigueros
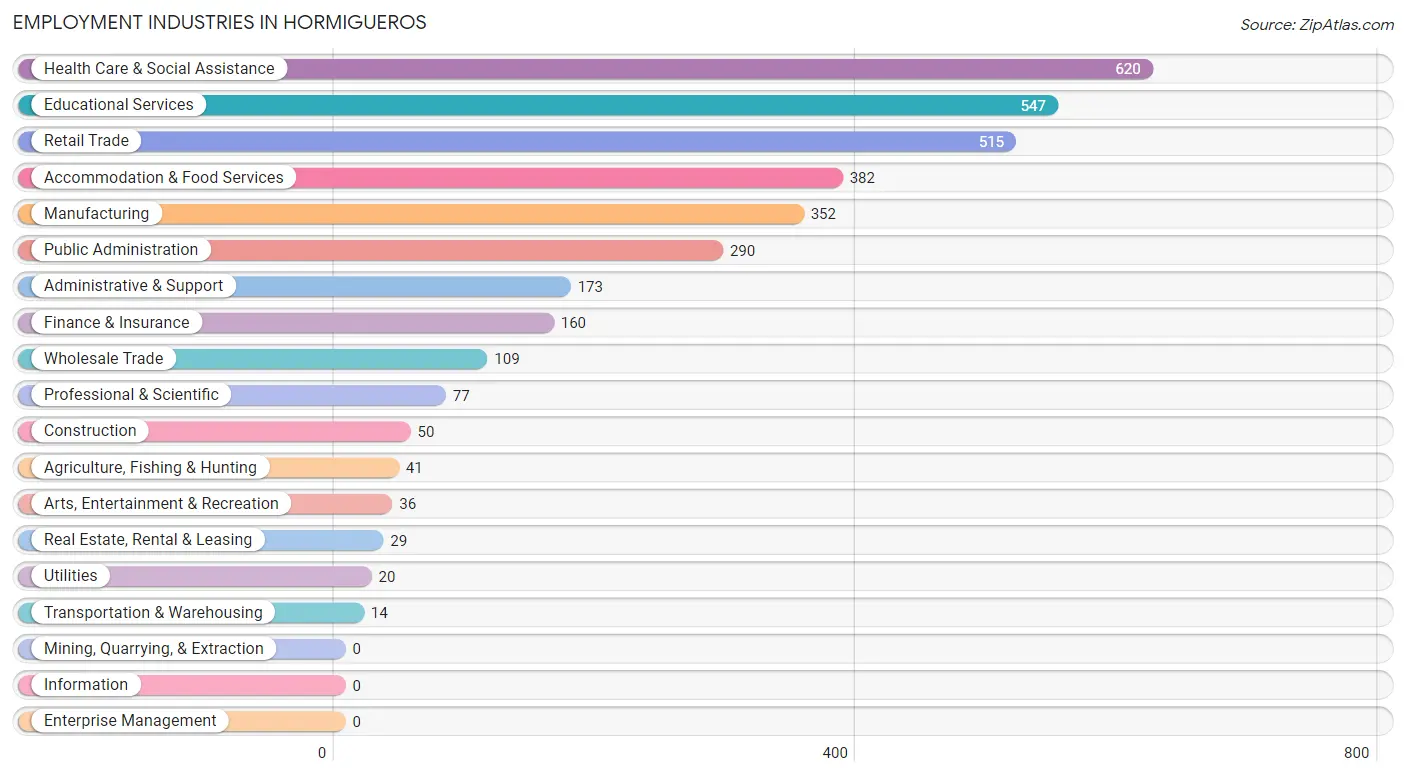
Employment Industries in Hormigueros
The major employment industries in Hormigueros include Health Care & Social Assistance (620 | 17.5%), Educational Services (547 | 15.5%), Retail Trade (515 | 14.6%), Accommodation & Food Services (382 | 10.8%), and Manufacturing (352 | 10.0%).
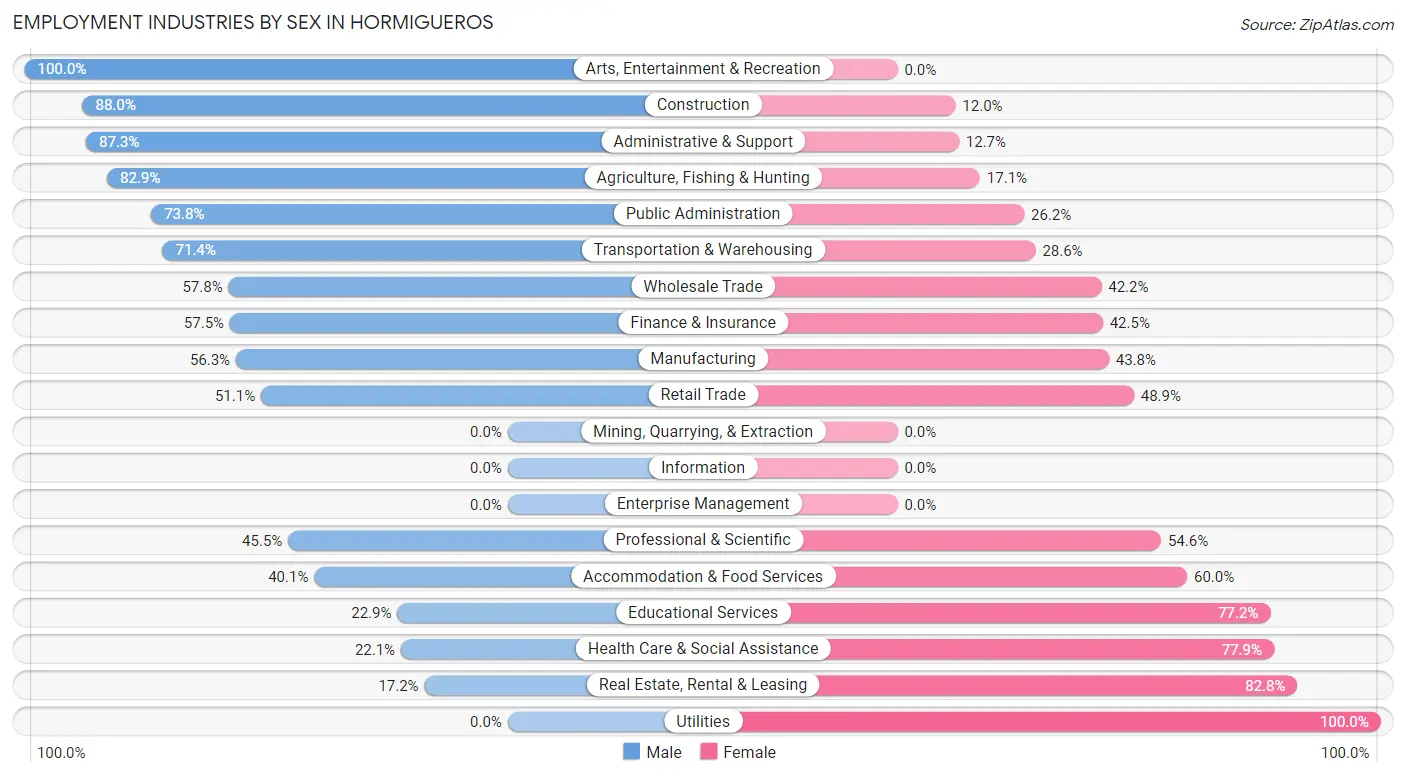
Employment Industries by Sex in Hormigueros
The Hormigueros industries that see more men than women are Arts, Entertainment & Recreation (100.0%), Construction (88.0%), and Administrative & Support (87.3%), whereas the industries that tend to have a higher number of women are Utilities (100.0%), Real Estate, Rental & Leasing (82.8%), and Health Care & Social Assistance (77.9%).
| Industry | Male | Female |
| Agriculture, Fishing & Hunting | 34 (82.9%) | 7 (17.1%) |
| Mining, Quarrying, & Extraction | 0 (0.0%) | 0 (0.0%) |
| Construction | 44 (88.0%) | 6 (12.0%) |
| Manufacturing | 198 (56.2%) | 154 (43.8%) |
| Wholesale Trade | 63 (57.8%) | 46 (42.2%) |
| Retail Trade | 263 (51.1%) | 252 (48.9%) |
| Transportation & Warehousing | 10 (71.4%) | 4 (28.6%) |
| Utilities | 0 (0.0%) | 20 (100.0%) |
| Information | 0 (0.0%) | 0 (0.0%) |
| Finance & Insurance | 92 (57.5%) | 68 (42.5%) |
| Real Estate, Rental & Leasing | 5 (17.2%) | 24 (82.8%) |
| Professional & Scientific | 35 (45.5%) | 42 (54.5%) |
| Enterprise Management | 0 (0.0%) | 0 (0.0%) |
| Administrative & Support | 151 (87.3%) | 22 (12.7%) |
| Educational Services | 125 (22.9%) | 422 (77.1%) |
| Health Care & Social Assistance | 137 (22.1%) | 483 (77.9%) |
| Arts, Entertainment & Recreation | 36 (100.0%) | 0 (0.0%) |
| Accommodation & Food Services | 153 (40.1%) | 229 (60.0%) |
| Public Administration | 214 (73.8%) | 76 (26.2%) |
| Total | 1,624 (46.0%) | 1,910 (54.0%) |
Education in Hormigueros
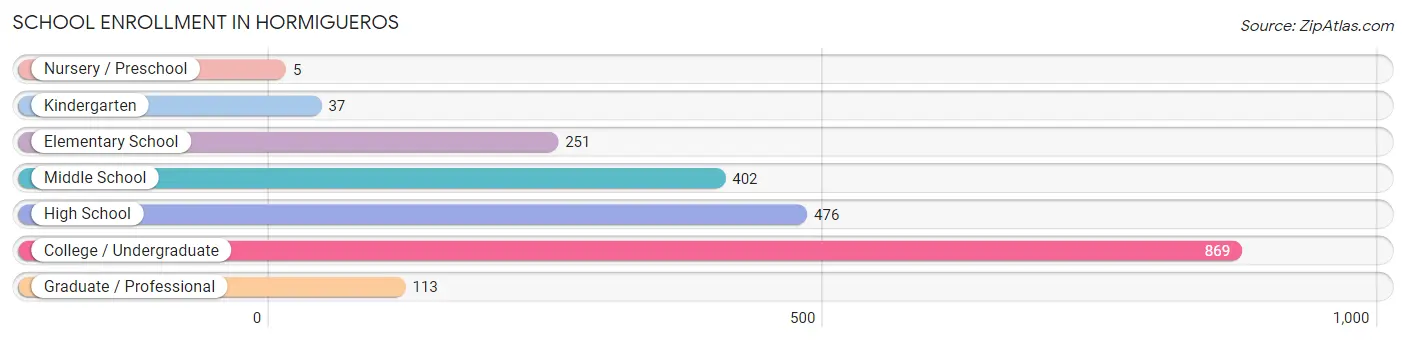
School Enrollment in Hormigueros
The most common levels of schooling among the 2,153 students in Hormigueros are college / undergraduate (869 | 40.4%), high school (476 | 22.1%), and middle school (402 | 18.7%).
| School Level | # Students | % Students |
| Nursery / Preschool | 5 | 0.2% |
| Kindergarten | 37 | 1.7% |
| Elementary School | 251 | 11.7% |
| Middle School | 402 | 18.7% |
| High School | 476 | 22.1% |
| College / Undergraduate | 869 | 40.4% |
| Graduate / Professional | 113 | 5.2% |
| Total | 2,153 | 100.0% |
School Enrollment by Age by Funding Source in Hormigueros
Out of a total of 2,153 students who are enrolled in schools in Hormigueros, 1,051 (48.8%) attend a private institution, while the remaining 1,102 (51.2%) are enrolled in public schools. The age group of 3 to 4 year olds has the highest likelihood of being enrolled in private schools, with 5 (100.0% in the age bracket) enrolled. Conversely, the age group of 10 to 14 year olds has the lowest likelihood of being enrolled in a private school, with 411 (81.2% in the age bracket) attending a public institution.
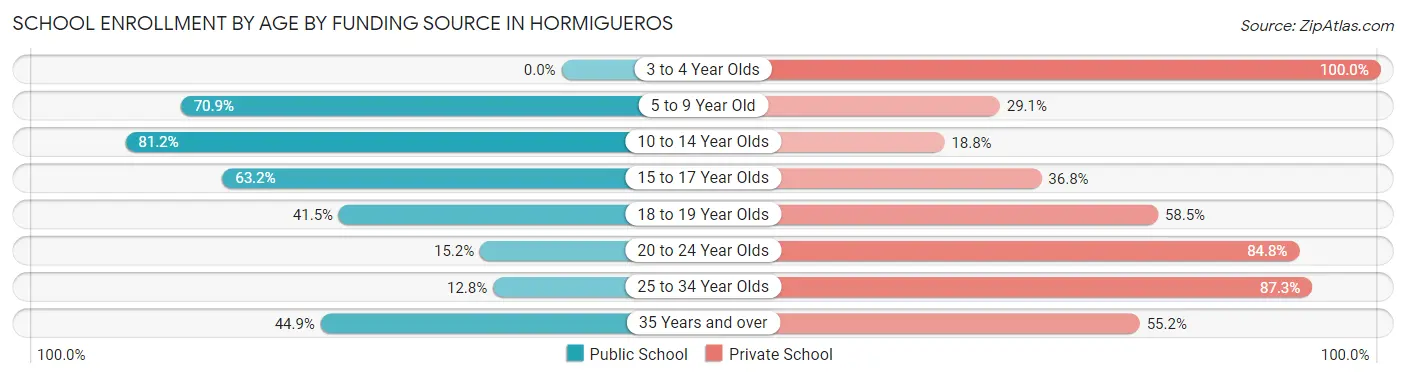
| Age Bracket | Public School | Private School |
| 3 to 4 Year Olds | 0 (0.0%) | 5 (100.0%) |
| 5 to 9 Year Old | 200 (70.9%) | 82 (29.1%) |
| 10 to 14 Year Olds | 411 (81.2%) | 95 (18.8%) |
| 15 to 17 Year Olds | 271 (63.2%) | 158 (36.8%) |
| 18 to 19 Year Olds | 51 (41.5%) | 72 (58.5%) |
| 20 to 24 Year Olds | 82 (15.2%) | 459 (84.8%) |
| 25 to 34 Year Olds | 13 (12.8%) | 89 (87.3%) |
| 35 Years and over | 74 (44.9%) | 91 (55.1%) |
| Total | 1,102 (51.2%) | 1,051 (48.8%) |
Educational Attainment by Field of Study in Hormigueros
Business (684 | 29.5%), education (515 | 22.2%), science & technology (272 | 11.7%), social sciences (250 | 10.8%), and arts & humanities (236 | 10.2%) are the most common fields of study among 2,316 individuals in Hormigueros who have obtained a bachelor's degree or higher.
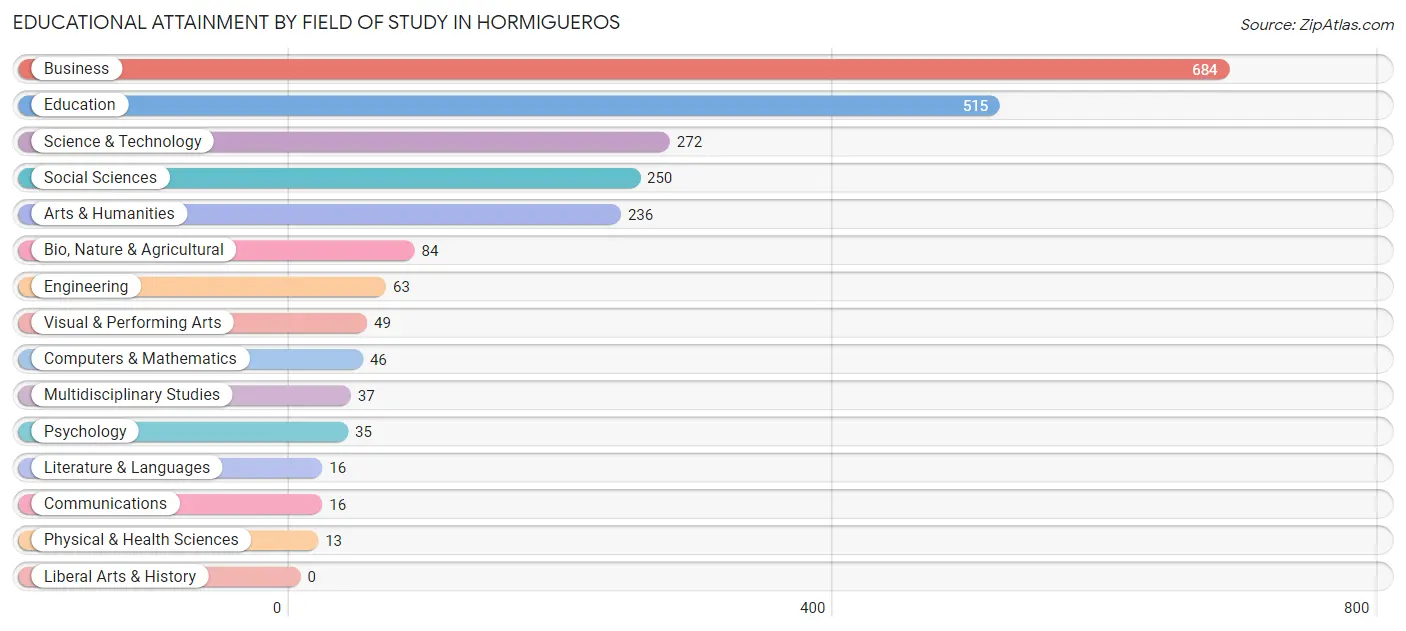
| Field of Study | # Graduates | % Graduates |
| Computers & Mathematics | 46 | 2.0% |
| Bio, Nature & Agricultural | 84 | 3.6% |
| Physical & Health Sciences | 13 | 0.6% |
| Psychology | 35 | 1.5% |
| Social Sciences | 250 | 10.8% |
| Engineering | 63 | 2.7% |
| Multidisciplinary Studies | 37 | 1.6% |
| Science & Technology | 272 | 11.7% |
| Business | 684 | 29.5% |
| Education | 515 | 22.2% |
| Literature & Languages | 16 | 0.7% |
| Liberal Arts & History | 0 | 0.0% |
| Visual & Performing Arts | 49 | 2.1% |
| Communications | 16 | 0.7% |
| Arts & Humanities | 236 | 10.2% |
| Total | 2,316 | 100.0% |
Transportation & Commute in Hormigueros
Vehicle Availability by Sex in Hormigueros
The most prevalent vehicle ownership categories in Hormigueros are males with 2 vehicles (624, accounting for 39.3%) and females with 2 vehicles (801, making up 33.4%).
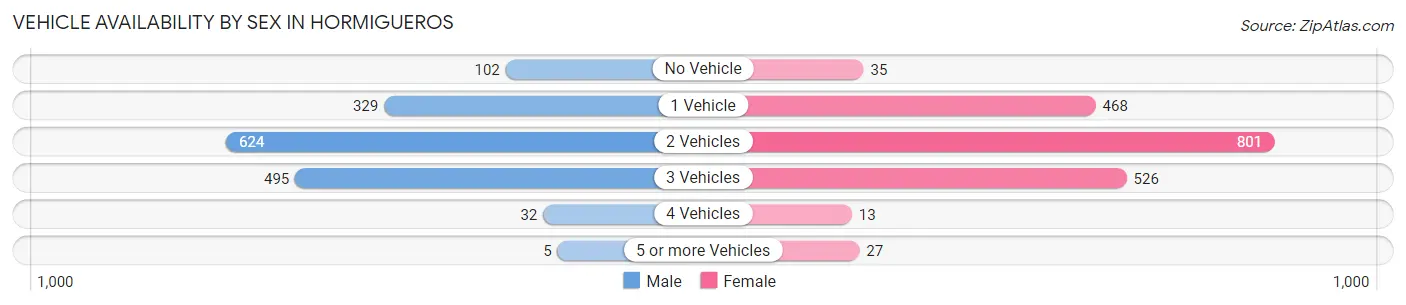
| Vehicles Available | Male | Female |
| No Vehicle | 102 (6.4%) | 35 (1.9%) |
| 1 Vehicle | 329 (20.7%) | 468 (25.0%) |
| 2 Vehicles | 624 (39.3%) | 801 (42.8%) |
| 3 Vehicles | 495 (31.2%) | 526 (28.1%) |
| 4 Vehicles | 32 (2.0%) | 13 (0.7%) |
| 5 or more Vehicles | 5 (0.3%) | 27 (1.4%) |
| Total | 1,587 (100.0%) | 1,870 (100.0%) |
Commute Time in Hormigueros
The most frequently occuring commute durations in Hormigueros are 20 to 24 minutes (719 commuters, 21.3%), 10 to 14 minutes (660 commuters, 19.6%), and 15 to 19 minutes (586 commuters, 17.4%).
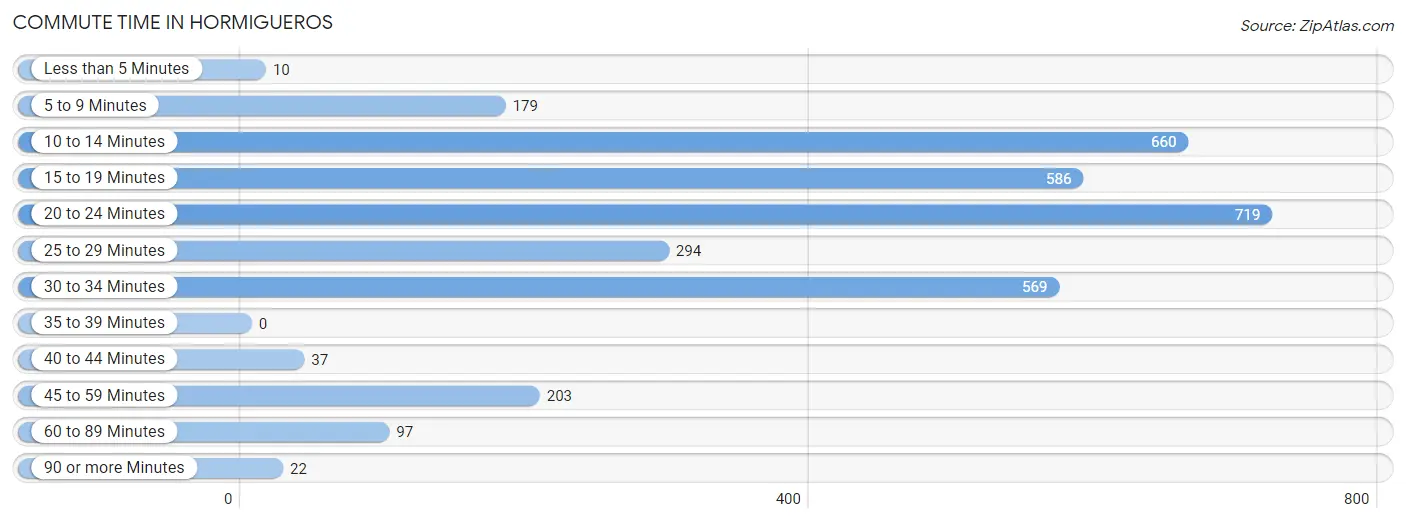
| Commute Time | # Commuters | % Commuters |
| Less than 5 Minutes | 10 | 0.3% |
| 5 to 9 Minutes | 179 | 5.3% |
| 10 to 14 Minutes | 660 | 19.6% |
| 15 to 19 Minutes | 586 | 17.4% |
| 20 to 24 Minutes | 719 | 21.3% |
| 25 to 29 Minutes | 294 | 8.7% |
| 30 to 34 Minutes | 569 | 16.9% |
| 35 to 39 Minutes | 0 | 0.0% |
| 40 to 44 Minutes | 37 | 1.1% |
| 45 to 59 Minutes | 203 | 6.0% |
| 60 to 89 Minutes | 97 | 2.9% |
| 90 or more Minutes | 22 | 0.6% |
Commute Time by Sex in Hormigueros
The most common commute times in Hormigueros are 10 to 14 minutes (375 commuters, 24.1%) for males and 20 to 24 minutes (496 commuters, 27.2%) for females.
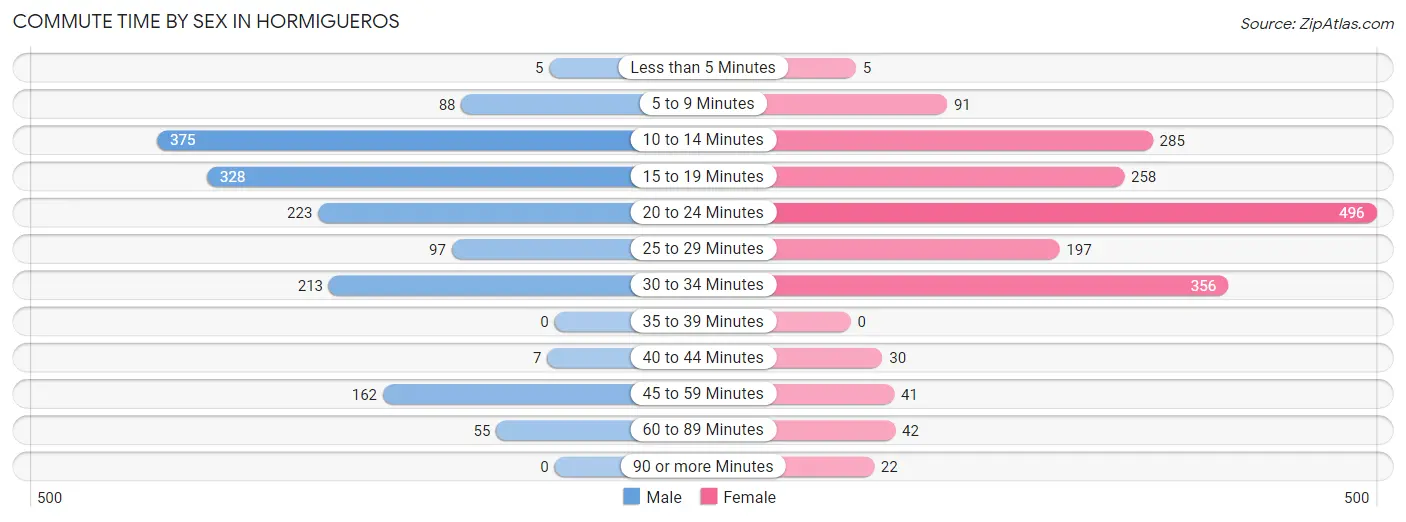
| Commute Time | Male | Female |
| Less than 5 Minutes | 5 (0.3%) | 5 (0.3%) |
| 5 to 9 Minutes | 88 (5.7%) | 91 (5.0%) |
| 10 to 14 Minutes | 375 (24.1%) | 285 (15.6%) |
| 15 to 19 Minutes | 328 (21.1%) | 258 (14.1%) |
| 20 to 24 Minutes | 223 (14.4%) | 496 (27.2%) |
| 25 to 29 Minutes | 97 (6.2%) | 197 (10.8%) |
| 30 to 34 Minutes | 213 (13.7%) | 356 (19.5%) |
| 35 to 39 Minutes | 0 (0.0%) | 0 (0.0%) |
| 40 to 44 Minutes | 7 (0.4%) | 30 (1.7%) |
| 45 to 59 Minutes | 162 (10.4%) | 41 (2.2%) |
| 60 to 89 Minutes | 55 (3.5%) | 42 (2.3%) |
| 90 or more Minutes | 0 (0.0%) | 22 (1.2%) |
Time of Departure to Work by Sex in Hormigueros
The most frequent times of departure to work in Hormigueros are 7:00 AM to 7:29 AM (346, 22.3%) for males and 7:30 AM to 7:59 AM (405, 22.2%) for females.
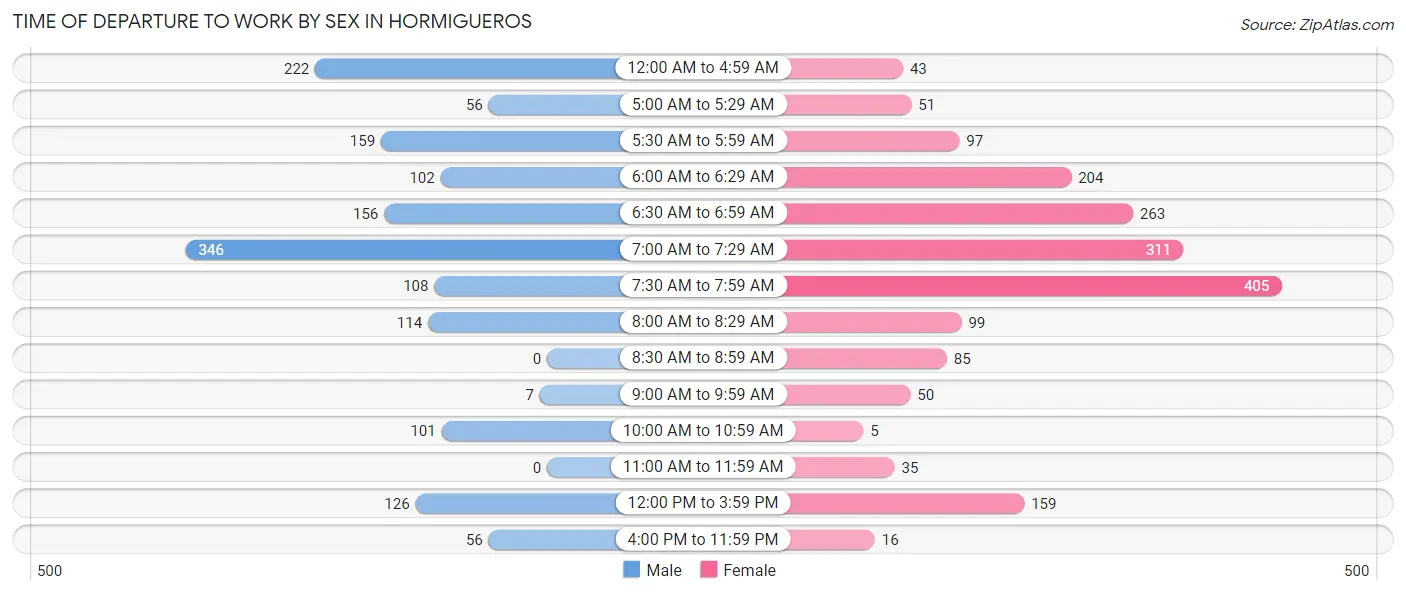
| Time of Departure | Male | Female |
| 12:00 AM to 4:59 AM | 222 (14.3%) | 43 (2.4%) |
| 5:00 AM to 5:29 AM | 56 (3.6%) | 51 (2.8%) |
| 5:30 AM to 5:59 AM | 159 (10.2%) | 97 (5.3%) |
| 6:00 AM to 6:29 AM | 102 (6.6%) | 204 (11.2%) |
| 6:30 AM to 6:59 AM | 156 (10.1%) | 263 (14.4%) |
| 7:00 AM to 7:29 AM | 346 (22.3%) | 311 (17.1%) |
| 7:30 AM to 7:59 AM | 108 (7.0%) | 405 (22.2%) |
| 8:00 AM to 8:29 AM | 114 (7.3%) | 99 (5.4%) |
| 8:30 AM to 8:59 AM | 0 (0.0%) | 85 (4.7%) |
| 9:00 AM to 9:59 AM | 7 (0.4%) | 50 (2.7%) |
| 10:00 AM to 10:59 AM | 101 (6.5%) | 5 (0.3%) |
| 11:00 AM to 11:59 AM | 0 (0.0%) | 35 (1.9%) |
| 12:00 PM to 3:59 PM | 126 (8.1%) | 159 (8.7%) |
| 4:00 PM to 11:59 PM | 56 (3.6%) | 16 (0.9%) |
| Total | 1,553 (100.0%) | 1,823 (100.0%) |
Housing Occupancy in Hormigueros
Occupancy by Ownership in Hormigueros
Of the total 4,573 dwellings in Hormigueros, owner-occupied units account for 3,185 (69.7%), while renter-occupied units make up 1,388 (30.3%).
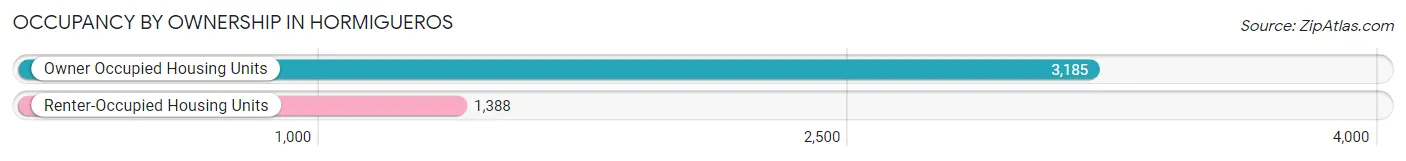
| Occupancy | # Housing Units | % Housing Units |
| Owner Occupied Housing Units | 3,185 | 69.7% |
| Renter-Occupied Housing Units | 1,388 | 30.3% |
| Total Occupied Housing Units | 4,573 | 100.0% |
Occupancy by Household Size in Hormigueros
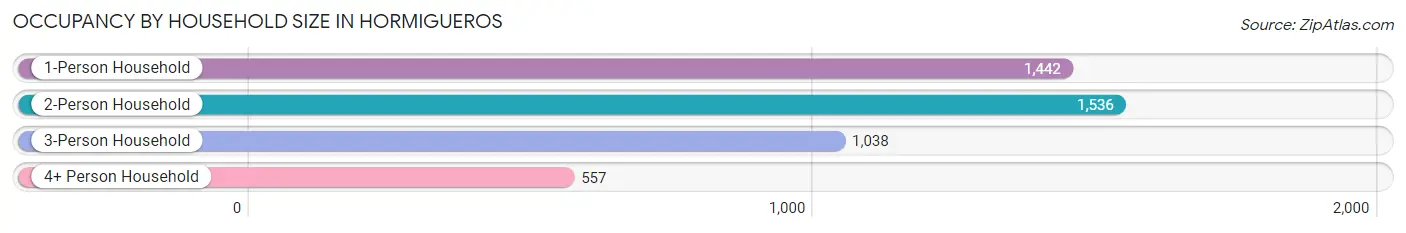
| Household Size | # Housing Units | % Housing Units |
| 1-Person Household | 1,442 | 31.5% |
| 2-Person Household | 1,536 | 33.6% |
| 3-Person Household | 1,038 | 22.7% |
| 4+ Person Household | 557 | 12.2% |
| Total Housing Units | 4,573 | 100.0% |
Occupancy by Ownership by Household Size in Hormigueros
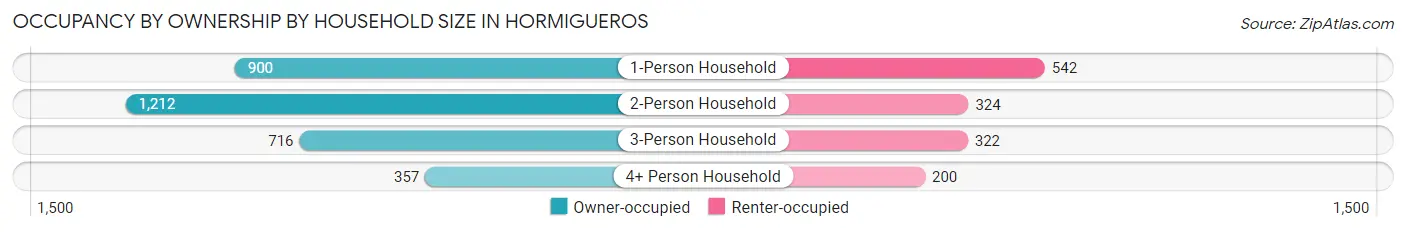
| Household Size | Owner-occupied | Renter-occupied |
| 1-Person Household | 900 (62.4%) | 542 (37.6%) |
| 2-Person Household | 1,212 (78.9%) | 324 (21.1%) |
| 3-Person Household | 716 (69.0%) | 322 (31.0%) |
| 4+ Person Household | 357 (64.1%) | 200 (35.9%) |
| Total Housing Units | 3,185 (69.7%) | 1,388 (30.3%) |
Occupancy by Educational Attainment in Hormigueros
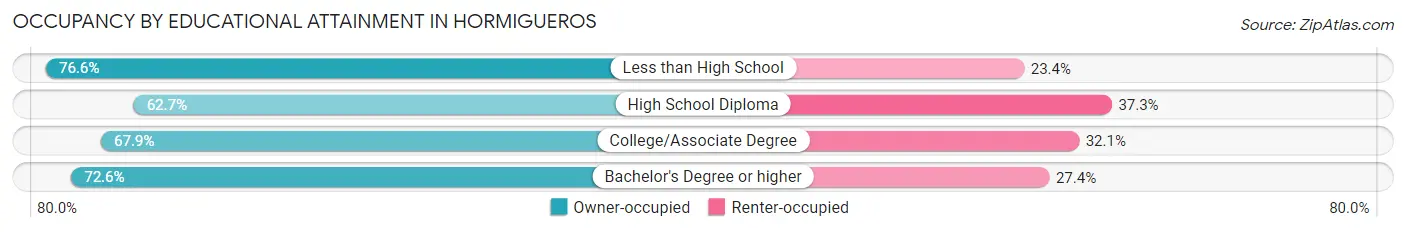
| Household Size | Owner-occupied | Renter-occupied |
| Less than High School | 772 (76.6%) | 236 (23.4%) |
| High School Diploma | 801 (62.7%) | 477 (37.3%) |
| College/Associate Degree | 693 (67.9%) | 328 (32.1%) |
| Bachelor's Degree or higher | 919 (72.6%) | 347 (27.4%) |
Occupancy by Age of Householder in Hormigueros
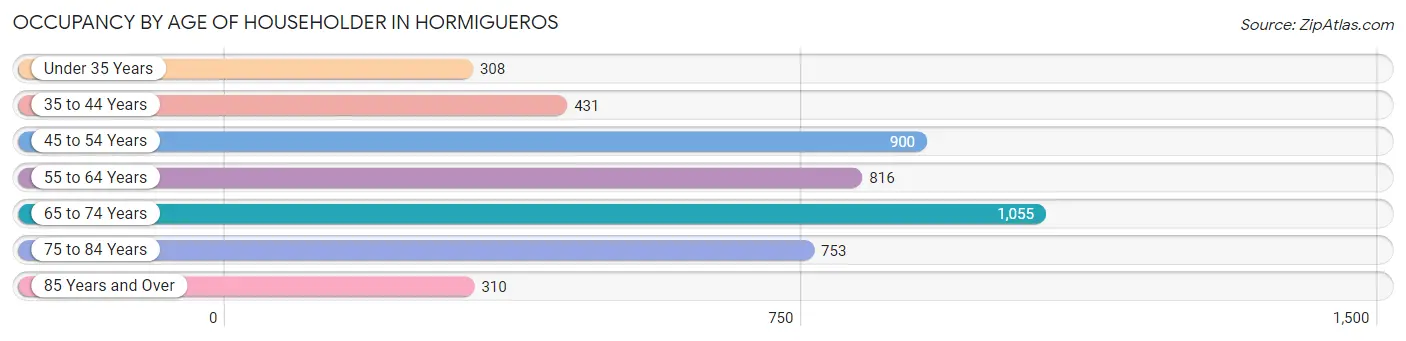
| Age Bracket | # Households | % Households |
| Under 35 Years | 308 | 6.7% |
| 35 to 44 Years | 431 | 9.4% |
| 45 to 54 Years | 900 | 19.7% |
| 55 to 64 Years | 816 | 17.8% |
| 65 to 74 Years | 1,055 | 23.1% |
| 75 to 84 Years | 753 | 16.5% |
| 85 Years and Over | 310 | 6.8% |
| Total | 4,573 | 100.0% |
Housing Finances in Hormigueros
Median Income by Occupancy in Hormigueros
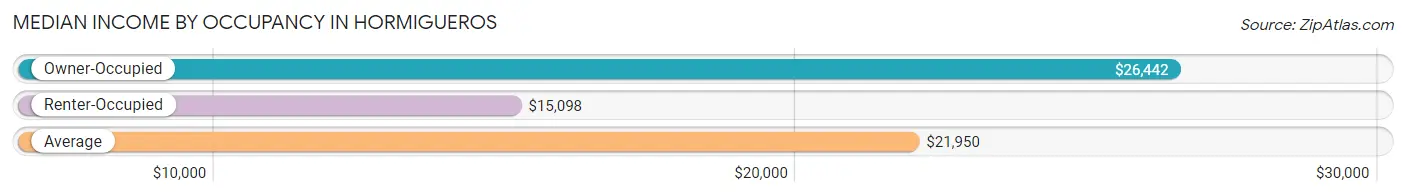
| Occupancy Type | # Households | Median Income |
| Owner-Occupied | 3,185 (69.7%) | $26,442 |
| Renter-Occupied | 1,388 (30.3%) | $15,098 |
| Average | 4,573 (100.0%) | $21,950 |
Occupancy by Householder Income Bracket in Hormigueros
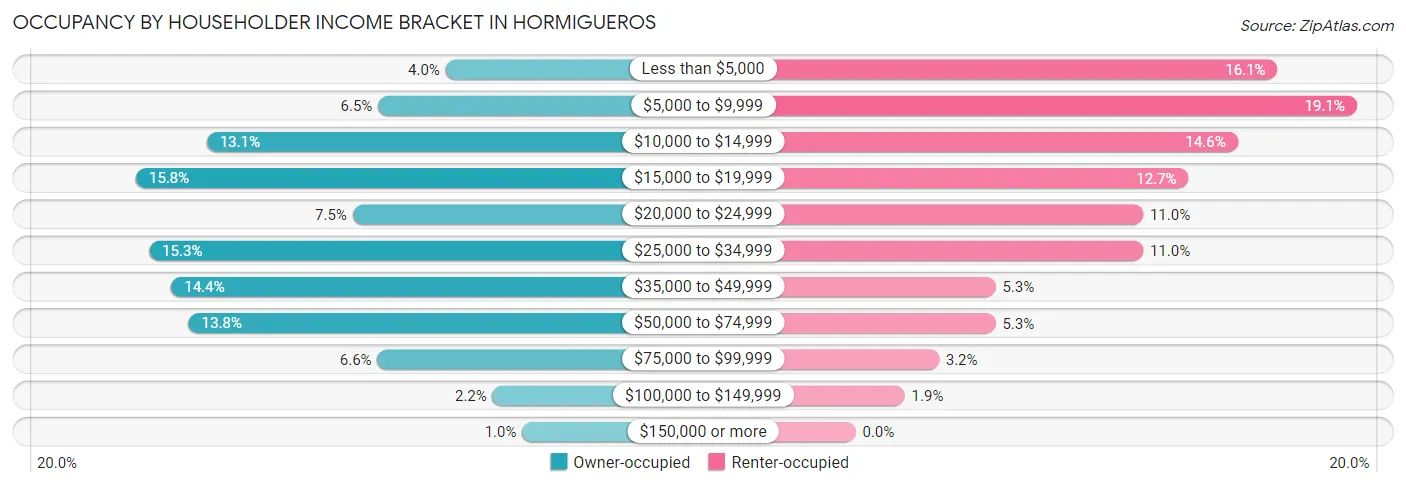
| Income Bracket | Owner-occupied | Renter-occupied |
| Less than $5,000 | 126 (4.0%) | 223 (16.1%) |
| $5,000 to $9,999 | 208 (6.5%) | 265 (19.1%) |
| $10,000 to $14,999 | 416 (13.1%) | 202 (14.5%) |
| $15,000 to $19,999 | 502 (15.8%) | 176 (12.7%) |
| $20,000 to $24,999 | 239 (7.5%) | 152 (11.0%) |
| $25,000 to $34,999 | 486 (15.3%) | 152 (11.0%) |
| $35,000 to $49,999 | 459 (14.4%) | 74 (5.3%) |
| $50,000 to $74,999 | 438 (13.8%) | 74 (5.3%) |
| $75,000 to $99,999 | 209 (6.6%) | 44 (3.2%) |
| $100,000 to $149,999 | 69 (2.2%) | 26 (1.9%) |
| $150,000 or more | 33 (1.0%) | 0 (0.0%) |
| Total | 3,185 (100.0%) | 1,388 (100.0%) |
Monthly Housing Cost Tiers in Hormigueros
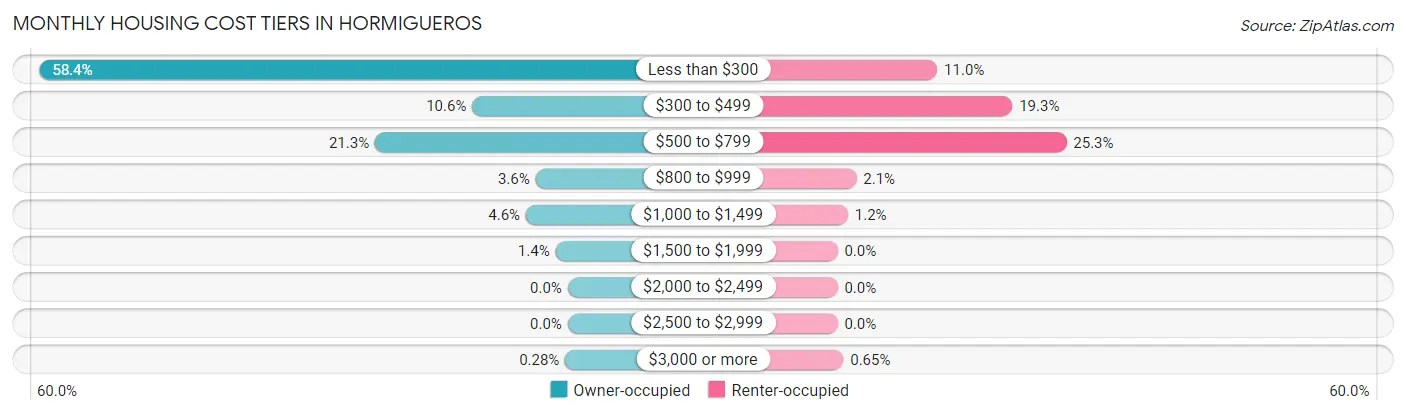
| Monthly Cost | Owner-occupied | Renter-occupied |
| Less than $300 | 1,859 (58.4%) | 153 (11.0%) |
| $300 to $499 | 336 (10.5%) | 268 (19.3%) |
| $500 to $799 | 678 (21.3%) | 351 (25.3%) |
| $800 to $999 | 113 (3.5%) | 29 (2.1%) |
| $1,000 to $1,499 | 147 (4.6%) | 16 (1.1%) |
| $1,500 to $1,999 | 43 (1.3%) | 0 (0.0%) |
| $2,000 to $2,499 | 0 (0.0%) | 0 (0.0%) |
| $2,500 to $2,999 | 0 (0.0%) | 0 (0.0%) |
| $3,000 or more | 9 (0.3%) | 9 (0.6%) |
| Total | 3,185 (100.0%) | 1,388 (100.0%) |
Physical Housing Characteristics in Hormigueros
Housing Structures in Hormigueros
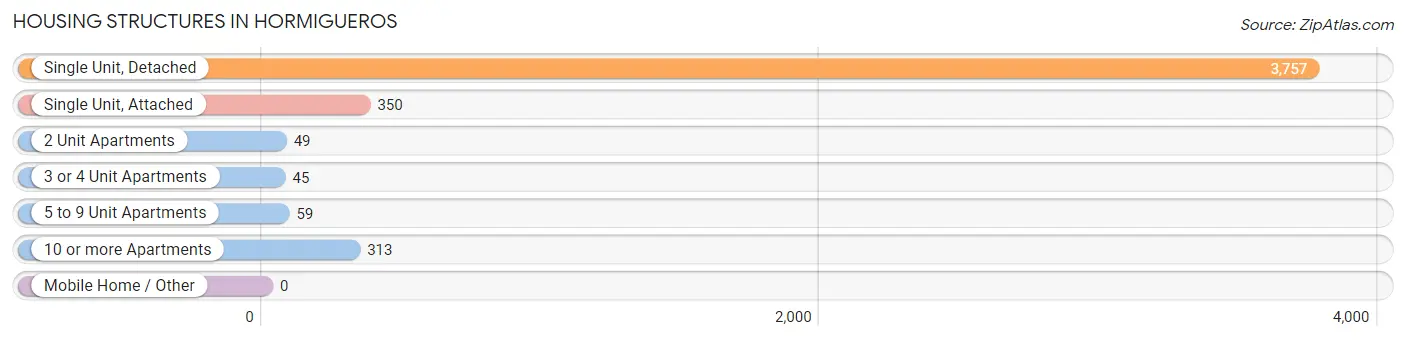
| Structure Type | # Housing Units | % Housing Units |
| Single Unit, Detached | 3,757 | 82.2% |
| Single Unit, Attached | 350 | 7.6% |
| 2 Unit Apartments | 49 | 1.1% |
| 3 or 4 Unit Apartments | 45 | 1.0% |
| 5 to 9 Unit Apartments | 59 | 1.3% |
| 10 or more Apartments | 313 | 6.8% |
| Mobile Home / Other | 0 | 0.0% |
| Total | 4,573 | 100.0% |
Housing Structures by Occupancy in Hormigueros
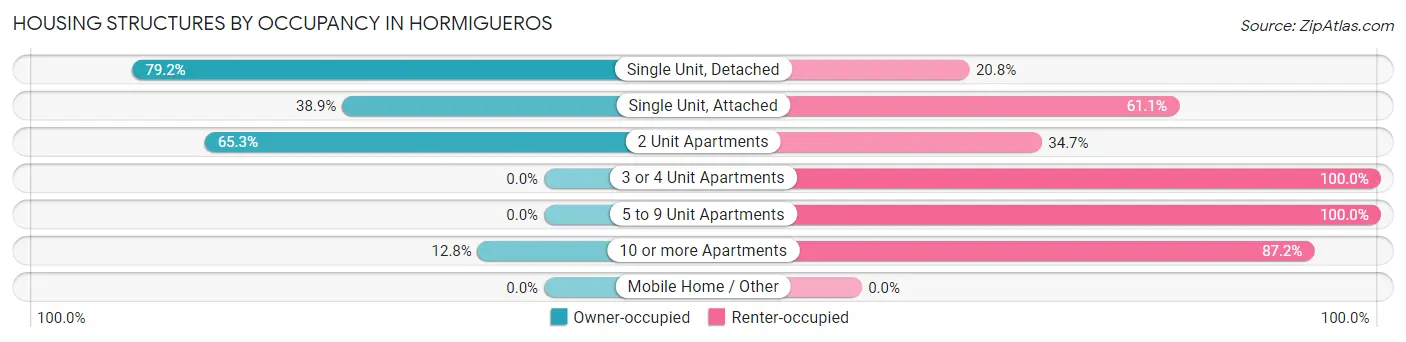
| Structure Type | Owner-occupied | Renter-occupied |
| Single Unit, Detached | 2,977 (79.2%) | 780 (20.8%) |
| Single Unit, Attached | 136 (38.9%) | 214 (61.1%) |
| 2 Unit Apartments | 32 (65.3%) | 17 (34.7%) |
| 3 or 4 Unit Apartments | 0 (0.0%) | 45 (100.0%) |
| 5 to 9 Unit Apartments | 0 (0.0%) | 59 (100.0%) |
| 10 or more Apartments | 40 (12.8%) | 273 (87.2%) |
| Mobile Home / Other | 0 (0.0%) | 0 (0.0%) |
| Total | 3,185 (69.7%) | 1,388 (30.3%) |
Housing Structures by Number of Rooms in Hormigueros
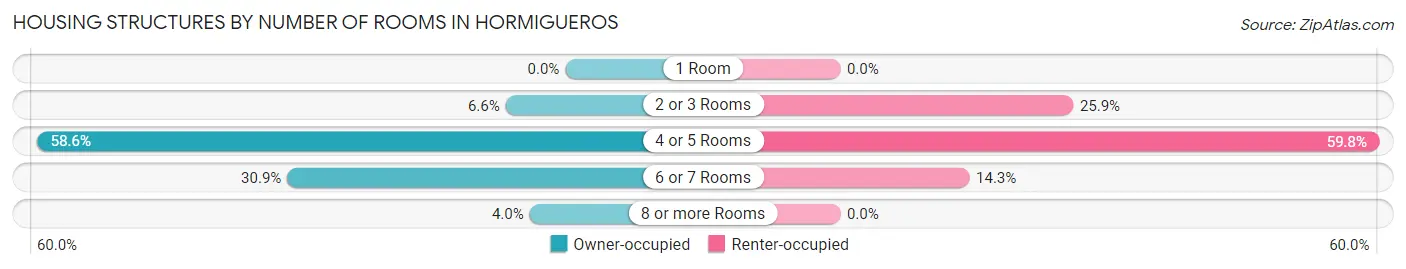
| Number of Rooms | Owner-occupied | Renter-occupied |
| 1 Room | 0 (0.0%) | 0 (0.0%) |
| 2 or 3 Rooms | 211 (6.6%) | 359 (25.9%) |
| 4 or 5 Rooms | 1,865 (58.6%) | 830 (59.8%) |
| 6 or 7 Rooms | 983 (30.9%) | 199 (14.3%) |
| 8 or more Rooms | 126 (4.0%) | 0 (0.0%) |
| Total | 3,185 (100.0%) | 1,388 (100.0%) |
Housing Structure by Heating Type in Hormigueros
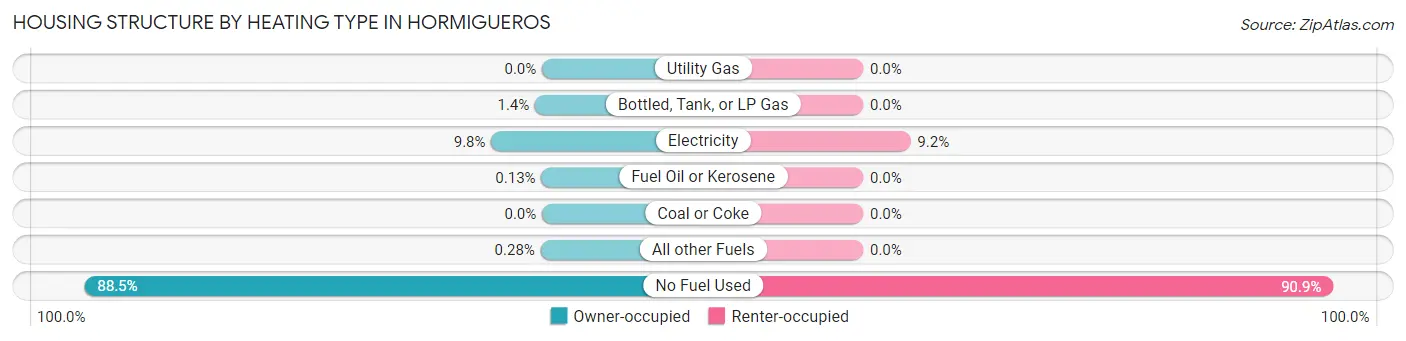
| Heating Type | Owner-occupied | Renter-occupied |
| Utility Gas | 0 (0.0%) | 0 (0.0%) |
| Bottled, Tank, or LP Gas | 43 (1.3%) | 0 (0.0%) |
| Electricity | 312 (9.8%) | 127 (9.1%) |
| Fuel Oil or Kerosene | 4 (0.1%) | 0 (0.0%) |
| Coal or Coke | 0 (0.0%) | 0 (0.0%) |
| All other Fuels | 9 (0.3%) | 0 (0.0%) |
| No Fuel Used | 2,817 (88.4%) | 1,261 (90.8%) |
| Total | 3,185 (100.0%) | 1,388 (100.0%) |
Household Vehicle Usage in Hormigueros
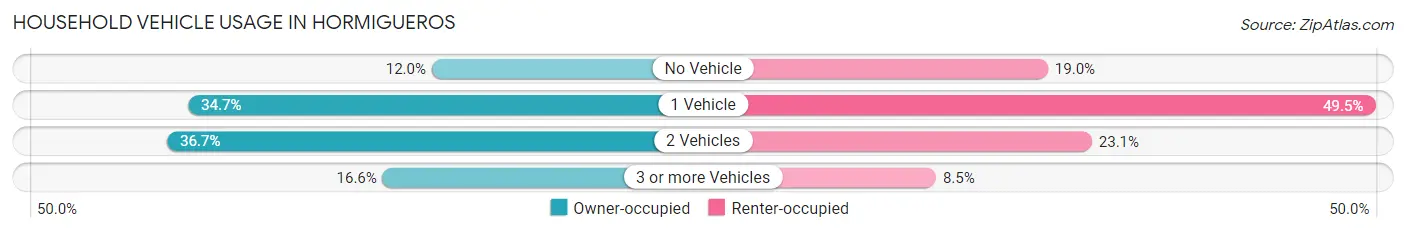
| Vehicles per Household | Owner-occupied | Renter-occupied |
| No Vehicle | 382 (12.0%) | 263 (19.0%) |
| 1 Vehicle | 1,106 (34.7%) | 687 (49.5%) |
| 2 Vehicles | 1,169 (36.7%) | 320 (23.1%) |
| 3 or more Vehicles | 528 (16.6%) | 118 (8.5%) |
| Total | 3,185 (100.0%) | 1,388 (100.0%) |
Real Estate & Mortgages in Hormigueros
Real Estate and Mortgage Overview in Hormigueros
| Characteristic | Without Mortgage | With Mortgage |
| Housing Units | 2,097 | 1,088 |
| Median Property Value | $102,100 | $117,300 |
| Median Household Income | $21,271 | $16 |
| Monthly Housing Costs | $177 | $4 |
| Real Estate Taxes | - | - |
Property Value by Mortgage Status in Hormigueros
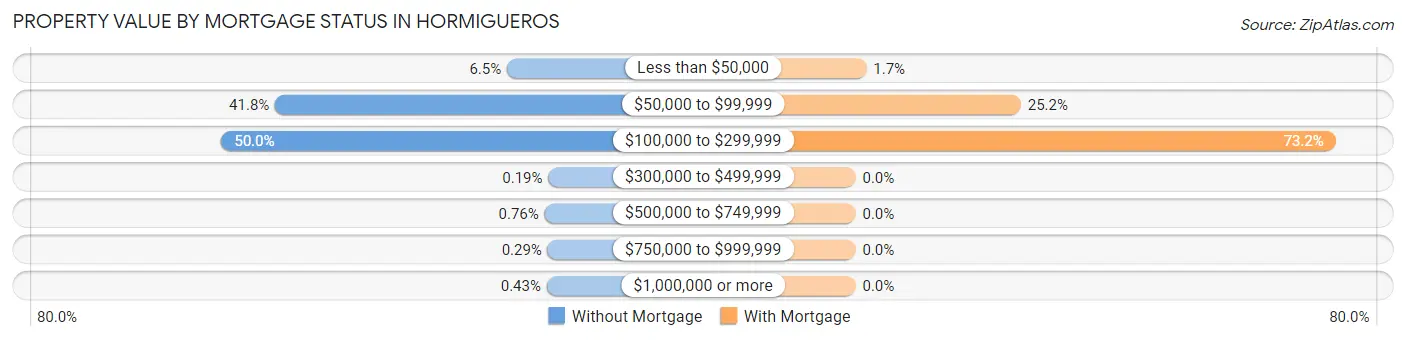
| Property Value | Without Mortgage | With Mortgage |
| Less than $50,000 | 136 (6.5%) | 18 (1.7%) |
| $50,000 to $99,999 | 877 (41.8%) | 274 (25.2%) |
| $100,000 to $299,999 | 1,049 (50.0%) | 796 (73.2%) |
| $300,000 to $499,999 | 4 (0.2%) | 0 (0.0%) |
| $500,000 to $749,999 | 16 (0.8%) | 0 (0.0%) |
| $750,000 to $999,999 | 6 (0.3%) | 0 (0.0%) |
| $1,000,000 or more | 9 (0.4%) | 0 (0.0%) |
| Total | 2,097 (100.0%) | 1,088 (100.0%) |
Household Income by Mortgage Status in Hormigueros
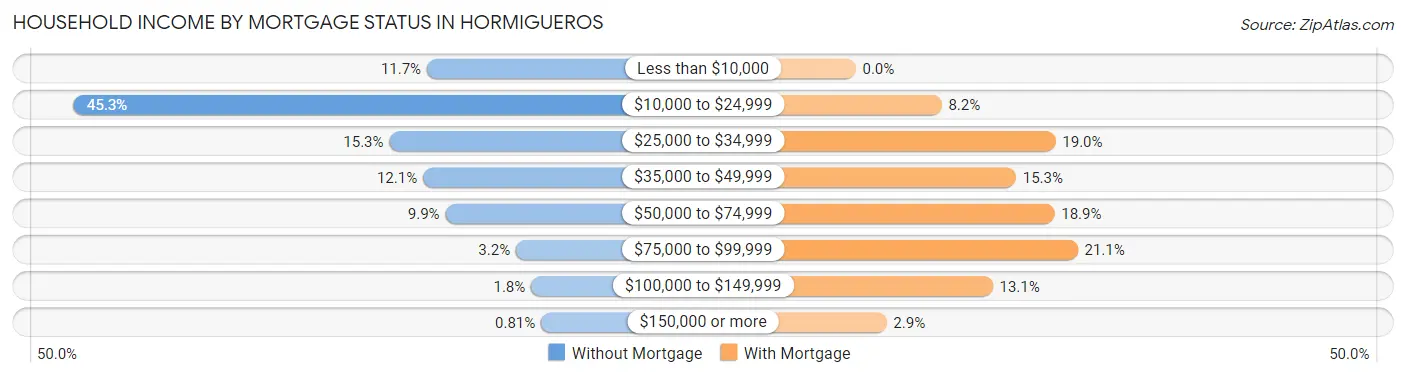
| Household Income | Without Mortgage | With Mortgage |
| Less than $10,000 | 245 (11.7%) | 0 (0.0%) |
| $10,000 to $24,999 | 950 (45.3%) | 89 (8.2%) |
| $25,000 to $34,999 | 320 (15.3%) | 207 (19.0%) |
| $35,000 to $49,999 | 253 (12.1%) | 166 (15.3%) |
| $50,000 to $74,999 | 208 (9.9%) | 206 (18.9%) |
| $75,000 to $99,999 | 67 (3.2%) | 230 (21.1%) |
| $100,000 to $149,999 | 37 (1.8%) | 142 (13.1%) |
| $150,000 or more | 17 (0.8%) | 32 (2.9%) |
| Total | 2,097 (100.0%) | 1,088 (100.0%) |
Property Value to Household Income Ratio in Hormigueros
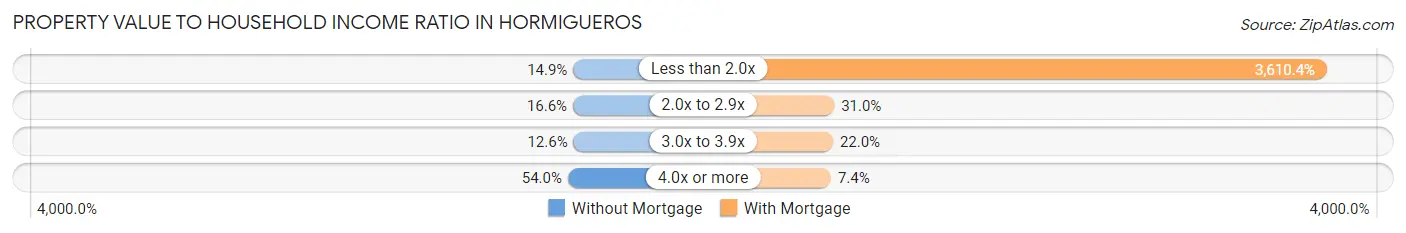
| Value-to-Income Ratio | Without Mortgage | With Mortgage |
| Less than 2.0x | 312 (14.9%) | 39,281 (3,610.4%) |
| 2.0x to 2.9x | 347 (16.6%) | 337 (31.0%) |
| 3.0x to 3.9x | 265 (12.6%) | 239 (22.0%) |
| 4.0x or more | 1,133 (54.0%) | 81 (7.4%) |
| Total | 2,097 (100.0%) | 1,088 (100.0%) |
Real Estate Taxes by Mortgage Status in Hormigueros
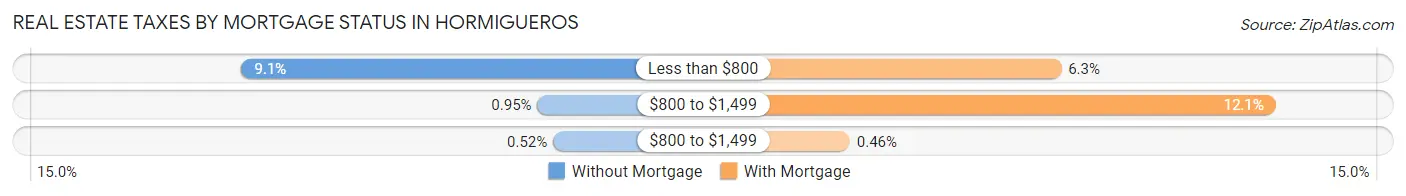
| Property Taxes | Without Mortgage | With Mortgage |
| Less than $800 | 190 (9.1%) | 68 (6.2%) |
| $800 to $1,499 | 20 (0.9%) | 132 (12.1%) |
| $800 to $1,499 | 11 (0.5%) | 5 (0.5%) |
| Total | 2,097 (100.0%) | 1,088 (100.0%) |
Health & Disability in Hormigueros
Health Insurance Coverage by Age in Hormigueros
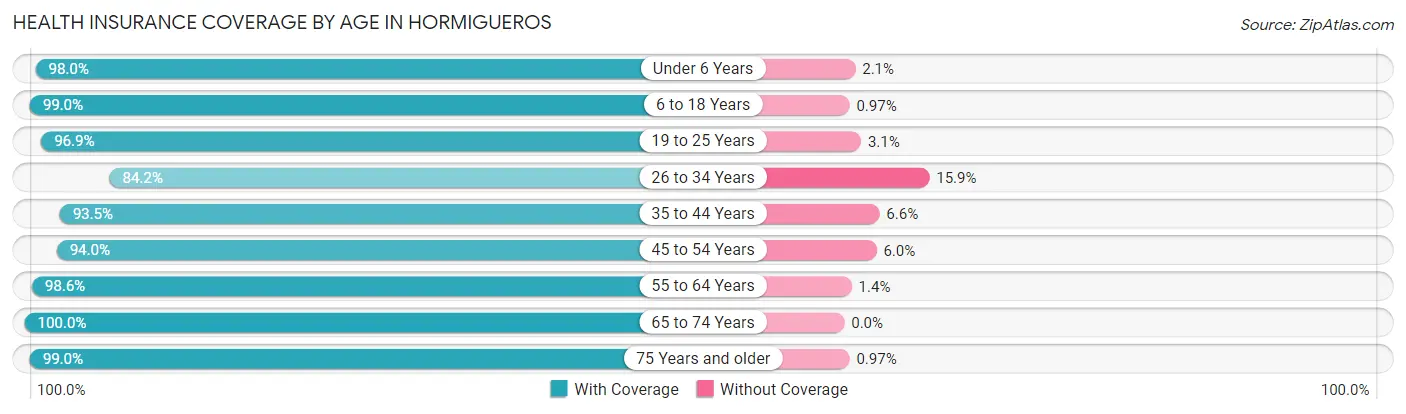
| Age Bracket | With Coverage | Without Coverage |
| Under 6 Years | 287 (98.0%) | 6 (2.1%) |
| 6 to 18 Years | 1,225 (99.0%) | 12 (1.0%) |
| 19 to 25 Years | 1,060 (96.9%) | 34 (3.1%) |
| 26 to 34 Years | 775 (84.2%) | 146 (15.9%) |
| 35 to 44 Years | 956 (93.4%) | 67 (6.6%) |
| 45 to 54 Years | 1,489 (94.0%) | 95 (6.0%) |
| 55 to 64 Years | 1,514 (98.6%) | 21 (1.4%) |
| 65 to 74 Years | 1,608 (100.0%) | 0 (0.0%) |
| 75 Years and older | 1,831 (99.0%) | 18 (1.0%) |
| Total | 10,745 (96.4%) | 399 (3.6%) |
Health Insurance Coverage by Citizenship Status in Hormigueros
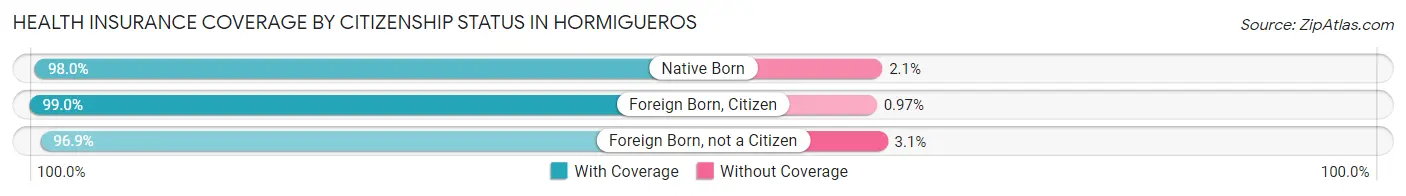
| Citizenship Status | With Coverage | Without Coverage |
| Native Born | 287 (98.0%) | 6 (2.1%) |
| Foreign Born, Citizen | 1,225 (99.0%) | 12 (1.0%) |
| Foreign Born, not a Citizen | 1,060 (96.9%) | 34 (3.1%) |
Health Insurance Coverage by Household Income in Hormigueros
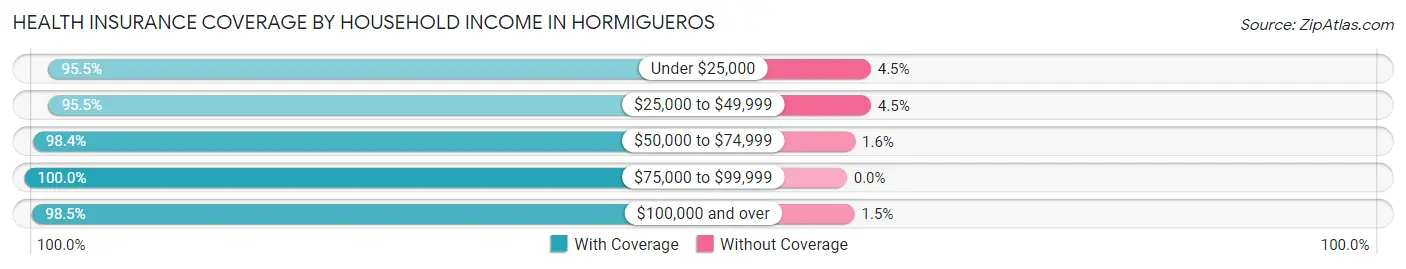
| Household Income | With Coverage | Without Coverage |
| Under $25,000 | 4,992 (95.5%) | 235 (4.5%) |
| $25,000 to $49,999 | 2,849 (95.5%) | 135 (4.5%) |
| $50,000 to $74,999 | 1,456 (98.4%) | 23 (1.6%) |
| $75,000 to $99,999 | 964 (100.0%) | 0 (0.0%) |
| $100,000 and over | 406 (98.5%) | 6 (1.5%) |
Public vs Private Health Insurance Coverage by Age in Hormigueros
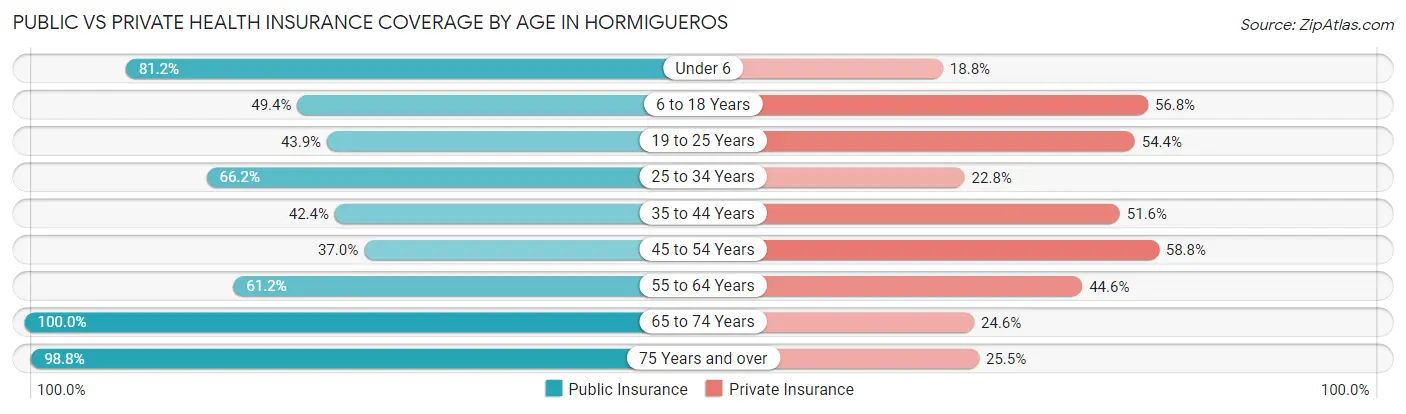
| Age Bracket | Public Insurance | Private Insurance |
| Under 6 | 238 (81.2%) | 55 (18.8%) |
| 6 to 18 Years | 611 (49.4%) | 703 (56.8%) |
| 19 to 25 Years | 480 (43.9%) | 595 (54.4%) |
| 25 to 34 Years | 610 (66.2%) | 210 (22.8%) |
| 35 to 44 Years | 434 (42.4%) | 528 (51.6%) |
| 45 to 54 Years | 586 (37.0%) | 932 (58.8%) |
| 55 to 64 Years | 940 (61.2%) | 685 (44.6%) |
| 65 to 74 Years | 1,608 (100.0%) | 395 (24.6%) |
| 75 Years and over | 1,826 (98.8%) | 471 (25.5%) |
| Total | 7,333 (65.8%) | 4,574 (41.0%) |
Disability Status by Sex by Age in Hormigueros
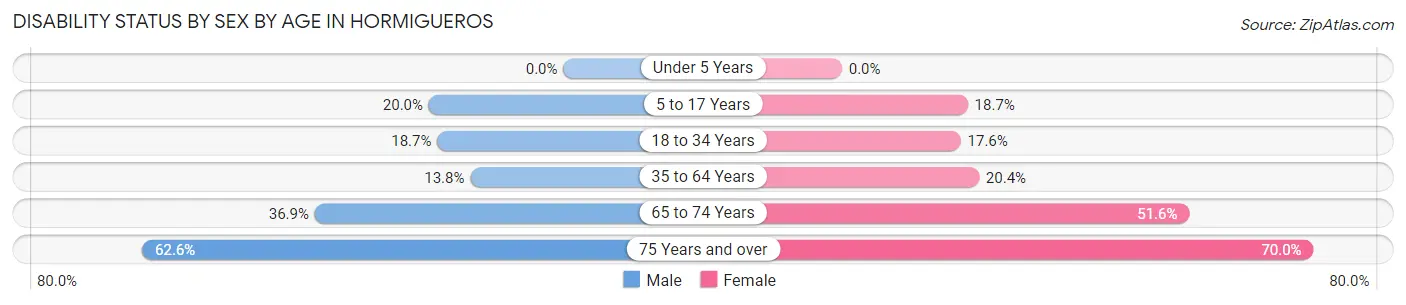
| Age Bracket | Male | Female |
| Under 5 Years | 0 (0.0%) | 0 (0.0%) |
| 5 to 17 Years | 134 (20.0%) | 106 (18.7%) |
| 18 to 34 Years | 182 (18.7%) | 194 (17.6%) |
| 35 to 64 Years | 271 (13.8%) | 444 (20.4%) |
| 65 to 74 Years | 258 (36.9%) | 469 (51.6%) |
| 75 Years and over | 443 (62.6%) | 799 (70.0%) |
Disability Class by Sex by Age in Hormigueros
Disability Class: Hearing Difficulty
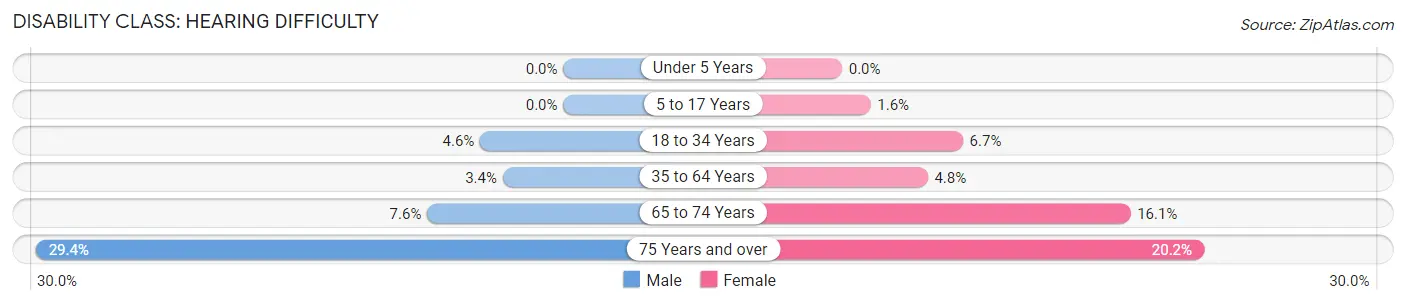
| Age Bracket | Male | Female |
| Under 5 Years | 0 (0.0%) | 0 (0.0%) |
| 5 to 17 Years | 0 (0.0%) | 9 (1.6%) |
| 18 to 34 Years | 45 (4.6%) | 74 (6.7%) |
| 35 to 64 Years | 66 (3.4%) | 104 (4.8%) |
| 65 to 74 Years | 53 (7.6%) | 146 (16.1%) |
| 75 Years and over | 208 (29.4%) | 230 (20.2%) |
Disability Class: Vision Difficulty
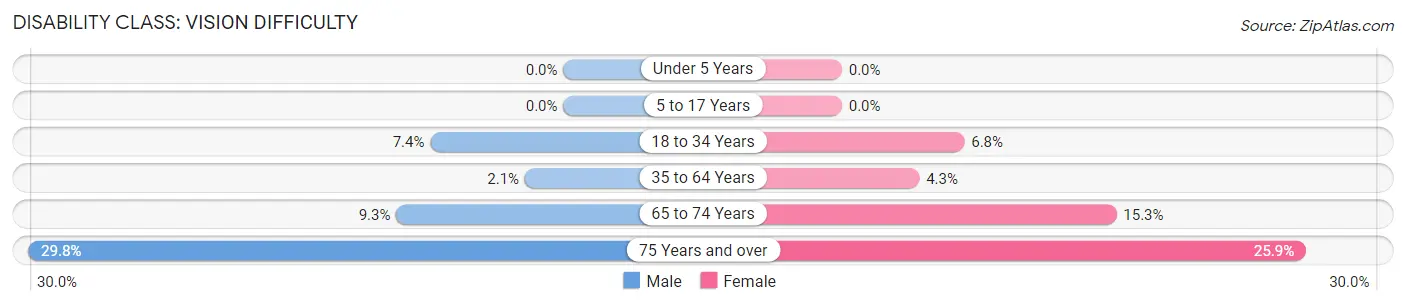
| Age Bracket | Male | Female |
| Under 5 Years | 0 (0.0%) | 0 (0.0%) |
| 5 to 17 Years | 0 (0.0%) | 0 (0.0%) |
| 18 to 34 Years | 72 (7.4%) | 75 (6.8%) |
| 35 to 64 Years | 42 (2.1%) | 94 (4.3%) |
| 65 to 74 Years | 65 (9.3%) | 139 (15.3%) |
| 75 Years and over | 211 (29.8%) | 295 (25.9%) |
Disability Class: Cognitive Difficulty
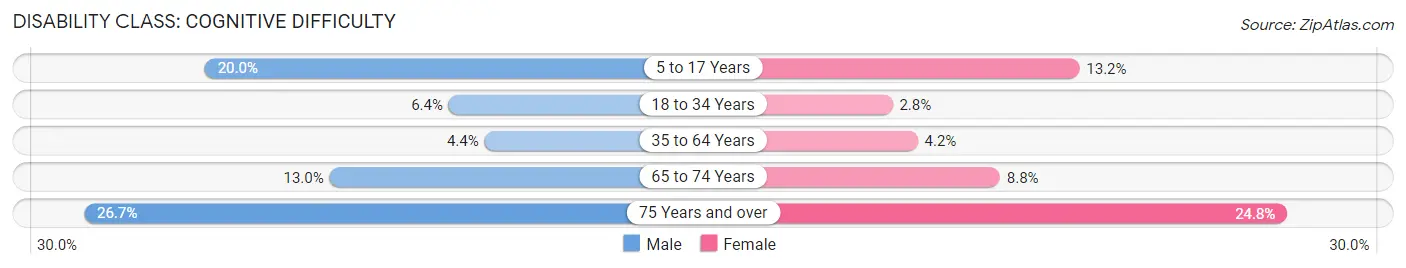
| Age Bracket | Male | Female |
| 5 to 17 Years | 134 (20.0%) | 75 (13.2%) |
| 18 to 34 Years | 62 (6.4%) | 31 (2.8%) |
| 35 to 64 Years | 86 (4.4%) | 92 (4.2%) |
| 65 to 74 Years | 91 (13.0%) | 80 (8.8%) |
| 75 Years and over | 189 (26.7%) | 283 (24.8%) |
Disability Class: Ambulatory Difficulty
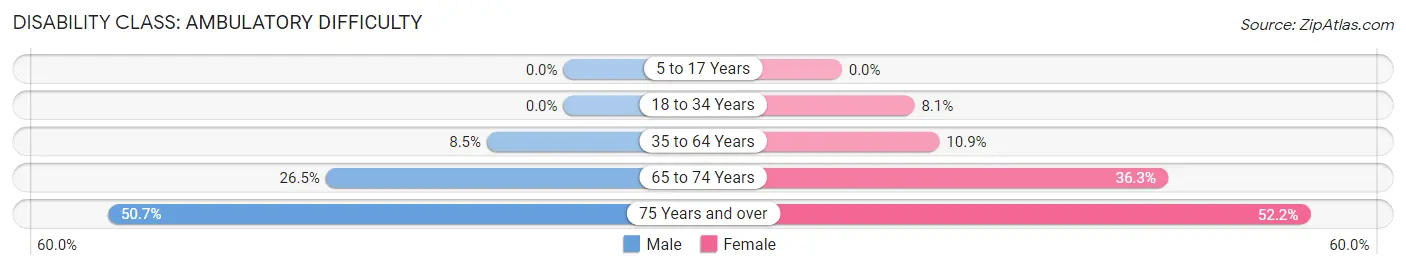
| Age Bracket | Male | Female |
| 5 to 17 Years | 0 (0.0%) | 0 (0.0%) |
| 18 to 34 Years | 0 (0.0%) | 89 (8.1%) |
| 35 to 64 Years | 167 (8.5%) | 237 (10.9%) |
| 65 to 74 Years | 185 (26.5%) | 330 (36.3%) |
| 75 Years and over | 359 (50.7%) | 595 (52.1%) |
Disability Class: Self-Care Difficulty
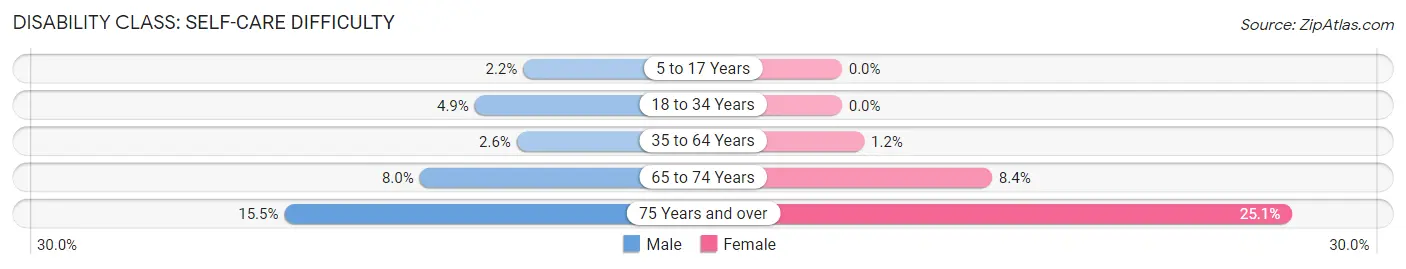
| Age Bracket | Male | Female |
| 5 to 17 Years | 15 (2.2%) | 0 (0.0%) |
| 18 to 34 Years | 48 (4.9%) | 0 (0.0%) |
| 35 to 64 Years | 51 (2.6%) | 27 (1.2%) |
| 65 to 74 Years | 56 (8.0%) | 76 (8.4%) |
| 75 Years and over | 110 (15.5%) | 286 (25.1%) |
Technology Access in Hormigueros
Computing Device Access in Hormigueros
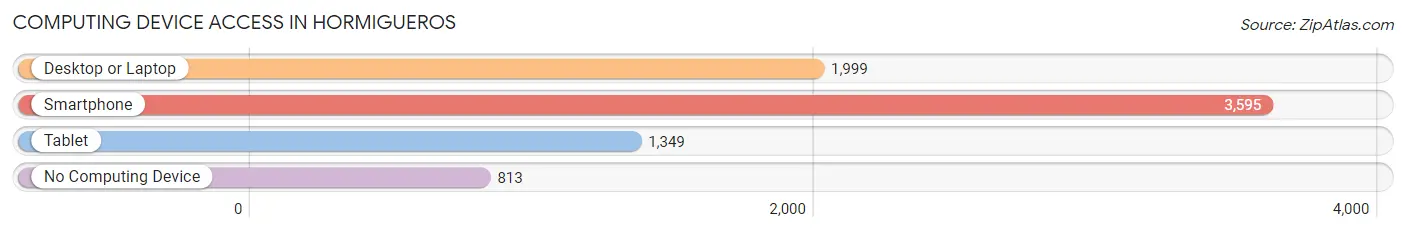
| Device Type | # Households | % Households |
| Desktop or Laptop | 1,999 | 43.7% |
| Smartphone | 3,595 | 78.6% |
| Tablet | 1,349 | 29.5% |
| No Computing Device | 813 | 17.8% |
| Total | 4,573 | 100.0% |
Internet Access in Hormigueros
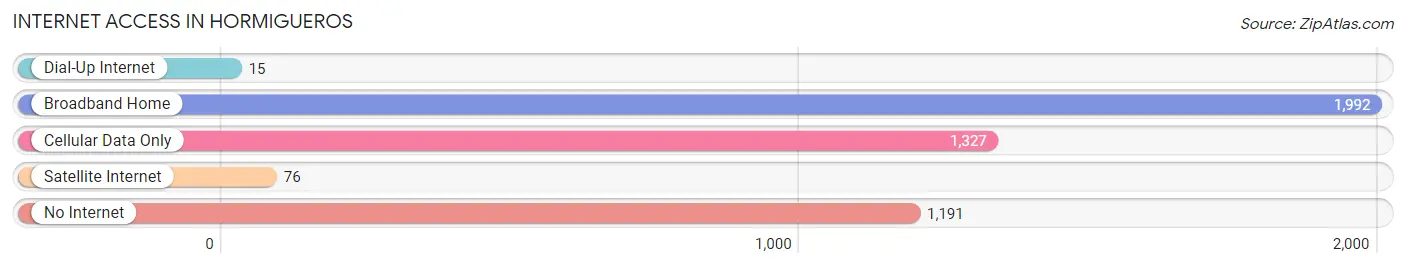
| Internet Type | # Households | % Households |
| Dial-Up Internet | 15 | 0.3% |
| Broadband Home | 1,992 | 43.6% |
| Cellular Data Only | 1,327 | 29.0% |
| Satellite Internet | 76 | 1.7% |
| No Internet | 1,191 | 26.0% |
| Total | 4,573 | 100.0% |
Hormigueros Summary
Hormigueros is a municipality located in the western region of Puerto Rico. It is part of the Mayagüez-San Germán-Cabo Rojo Metropolitan Statistical Area. The town is located in the southwestern part of the island, about 10 miles (16 km) from the city of Mayagüez. As of the 2010 census, the population of Hormigueros was 8,845.
Geography
Hormigueros is located in the western region of Puerto Rico, in the southwestern part of the island. It is bordered by the municipalities of Mayagüez, San Germán, and Cabo Rojo. The town is situated in a valley surrounded by hills and mountains. The highest point in the municipality is Cerro de la Cruz, which rises to an elevation of 1,068 feet (325 m).
The municipality is home to several rivers, including the Hormigueros, Guayo, and Culebrinas rivers. The town is also home to several small lakes, including Laguna de Hormigueros and Laguna de Guayo.
Climate
Hormigueros has a tropical climate, with hot and humid summers and mild winters. The average temperature is around 80°F (27°C). The average annual precipitation is around 50 inches (127 cm).
History
Hormigueros was founded in 1737 by Don Juan de Hormigueros, a Spanish colonist. The town was originally part of the municipality of San Germán, but it was granted its own municipality in 1831.
The town was an important agricultural center during the 19th century, and it was known for its production of sugar cane, coffee, and tobacco. In the early 20th century, the town experienced a period of economic decline, but it began to recover in the 1950s.
Economy
Hormigueros is primarily an agricultural town, with sugar cane, coffee, and tobacco being the main crops. The town is also home to several small businesses, including restaurants, shops, and services.
Demographics
As of the 2010 census, the population of Hormigueros was 8,845. The population is mostly of Puerto Rican descent, with a small minority of African and European descent. The town has a population density of 1,072 people per square mile (414/km2).
The median household income in Hormigueros is $17,845, and the median family income is $20,945. The unemployment rate is around 10.5%.
Education
Hormigueros is served by the Puerto Rico Department of Education. The town has several public schools, including Escuela Superior Hormigueros, Escuela Superior de Hormigueros II, and Escuela Superior de Hormigueros III. The town also has several private schools, including Colegio San Antonio de Padua and Colegio San José.
Common Questions
What is Per Capita Income in Hormigueros?
Per Capita income in Hormigueros is $13,838.
What is the Median Family Income in Hormigueros?
Median Family Income in Hormigueros is $26,482.
What is the Median Household income in Hormigueros?
Median Household Income in Hormigueros is $21,950.
What is Income or Wage Gap in Hormigueros?
Income or Wage Gap in Hormigueros is 8.9%.
Women in Hormigueros earn 91.1 cents for every dollar earned by a man.
What is Family Income Deficit in Hormigueros?
Family Income Deficit in Hormigueros is $8,838.
Families that are below poverty line in Hormigueros earn $8,838 less on average than the poverty threshold level.
What is Inequality or Gini Index in Hormigueros?
Inequality or Gini Index in Hormigueros is 0.46.
What is the Total Population of Hormigueros?
Total Population of Hormigueros is 11,224.
What is the Total Male Population of Hormigueros?
Total Male Population of Hormigueros is 5,185.
What is the Total Female Population of Hormigueros?
Total Female Population of Hormigueros is 6,039.
What is the Ratio of Males per 100 Females in Hormigueros?
There are 85.86 Males per 100 Females in Hormigueros.
What is the Ratio of Females per 100 Males in Hormigueros?
There are 116.47 Females per 100 Males in Hormigueros.
What is the Median Population Age in Hormigueros?
Median Population Age in Hormigueros is 51.8 Years.
What is the Average Family Size in Hormigueros
Average Family Size in Hormigueros is 3.1 People.
What is the Average Household Size in Hormigueros
Average Household Size in Hormigueros is 2.4 People.
How Large is the Labor Force in Hormigueros?
There are 4,212 People in the Labor Forcein in Hormigueros.
What is the Percentage of People in the Labor Force in Hormigueros?
41.9% of People are in the Labor Force in Hormigueros.
What is the Unemployment Rate in Hormigueros?
Unemployment Rate in Hormigueros is 16.0%.