Fajardo, PR Map & Demographics
Fajardo Map
Fajardo Overview
$14,854
PER CAPITA INCOME
$27,071
AVG FAMILY INCOME
$23,811
AVG HOUSEHOLD INCOME
3.4%
WAGE / INCOME GAP [ % ]
96.6¢/ $1
WAGE / INCOME GAP [ $ ]
$10,723
FAMILY INCOME DEFICIT
0.51
INEQUALITY / GINI INDEX
25,573
TOTAL POPULATION
11,683
MALE POPULATION
13,890
FEMALE POPULATION
84.11
MALES / 100 FEMALES
118.89
FEMALES / 100 MALES
43.5
MEDIAN AGE
3.1
AVG FAMILY SIZE
2.5
AVG HOUSEHOLD SIZE
10,989
LABOR FORCE [ PEOPLE ]
51.6%
PERCENT IN LABOR FORCE
24.0%
UNEMPLOYMENT RATE
Fajardo Zip Codes
Income in Fajardo
Income Overview in Fajardo
Per Capita Income in Fajardo is $14,854, while median incomes of families and households are $27,071 and $23,811 respectively.
| Characteristic | Number | Measure |
| Per Capita Income | 25,573 | $14,854 |
| Median Family Income | 6,653 | $27,071 |
| Mean Family Income | 6,653 | $36,514 |
| Median Household Income | 10,039 | $23,811 |
| Mean Household Income | 10,039 | $33,260 |
| Income Deficit | 6,653 | $10,723 |
| Wage / Income Gap (%) | 25,573 | 3.38% |
| Wage / Income Gap ($) | 25,573 | 96.62¢ per $1 |
| Gini / Inequality Index | 25,573 | 0.51 |
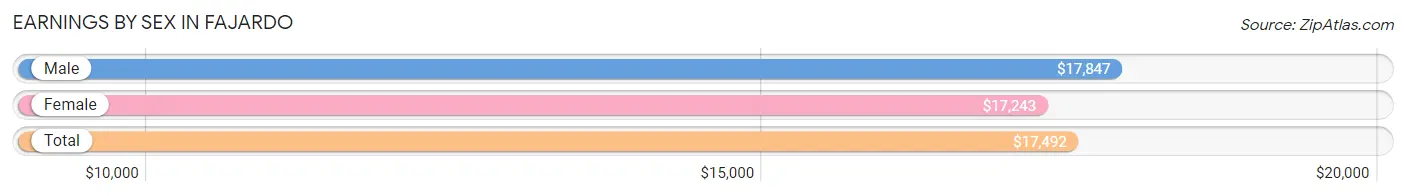
Earnings by Sex in Fajardo
Average Earnings in Fajardo are $17,492, $17,847 for men and $17,243 for women, a difference of 3.4%.
| Sex | Number | Average Earnings |
| Male | 4,578 (49.3%) | $17,847 |
| Female | 4,708 (50.7%) | $17,243 |
| Total | 9,286 (100.0%) | $17,492 |
Earnings by Sex by Income Bracket in Fajardo
The most common earnings brackets in Fajardo are $15,000 to $17,499 for men (577 | 12.6%) and $15,000 to $17,499 for women (633 | 13.5%).
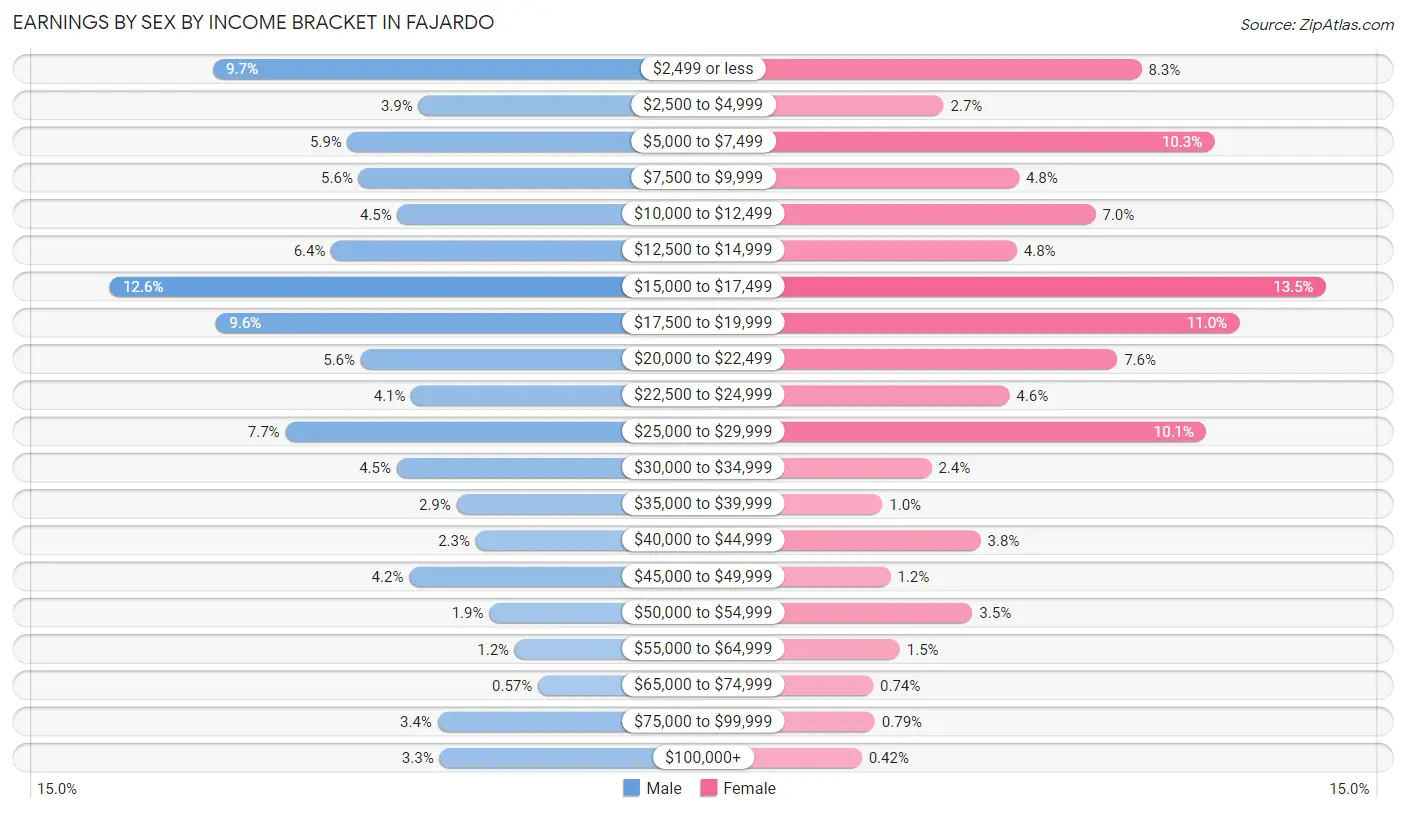
| Income | Male | Female |
| $2,499 or less | 444 (9.7%) | 390 (8.3%) |
| $2,500 to $4,999 | 180 (3.9%) | 128 (2.7%) |
| $5,000 to $7,499 | 271 (5.9%) | 486 (10.3%) |
| $7,500 to $9,999 | 257 (5.6%) | 228 (4.8%) |
| $10,000 to $12,499 | 207 (4.5%) | 329 (7.0%) |
| $12,500 to $14,999 | 292 (6.4%) | 225 (4.8%) |
| $15,000 to $17,499 | 577 (12.6%) | 633 (13.5%) |
| $17,500 to $19,999 | 440 (9.6%) | 519 (11.0%) |
| $20,000 to $22,499 | 254 (5.6%) | 358 (7.6%) |
| $22,500 to $24,999 | 189 (4.1%) | 215 (4.6%) |
| $25,000 to $29,999 | 351 (7.7%) | 475 (10.1%) |
| $30,000 to $34,999 | 208 (4.5%) | 112 (2.4%) |
| $35,000 to $39,999 | 131 (2.9%) | 47 (1.0%) |
| $40,000 to $44,999 | 106 (2.3%) | 177 (3.8%) |
| $45,000 to $49,999 | 192 (4.2%) | 58 (1.2%) |
| $50,000 to $54,999 | 89 (1.9%) | 166 (3.5%) |
| $55,000 to $64,999 | 56 (1.2%) | 70 (1.5%) |
| $65,000 to $74,999 | 26 (0.6%) | 35 (0.7%) |
| $75,000 to $99,999 | 155 (3.4%) | 37 (0.8%) |
| $100,000+ | 153 (3.3%) | 20 (0.4%) |
| Total | 4,578 (100.0%) | 4,708 (100.0%) |
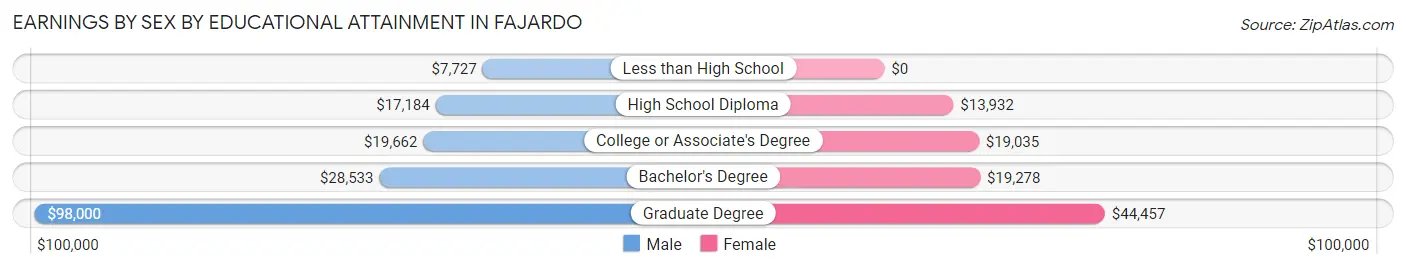
Earnings by Sex by Educational Attainment in Fajardo
Average earnings in Fajardo are $18,762 for men and $18,491 for women, a difference of 1.4%. Men with an educational attainment of graduate degree enjoy the highest average annual earnings of $98,000, while those with less than high school education earn the least with $7,727. Women with an educational attainment of graduate degree earn the most with the average annual earnings of $44,457, while those with high school diploma education have the smallest earnings of $13,932.
| Educational Attainment | Male Income | Female Income |
| Less than High School | $7,727 | $0 |
| High School Diploma | $17,184 | $13,932 |
| College or Associate's Degree | $19,662 | $19,035 |
| Bachelor's Degree | $28,533 | $19,278 |
| Graduate Degree | $98,000 | $44,457 |
| Total | $18,762 | $18,491 |
Family Income in Fajardo
Family Income Brackets in Fajardo
According to the Fajardo family income data, there are 1,457 families falling into the $15,000 to $24,999 income range, which is the most common income bracket and makes up 21.9% of all families. Conversely, the $150,000 to $199,999 income bracket is the least frequent group with only 27 families (0.4%) belonging to this category.
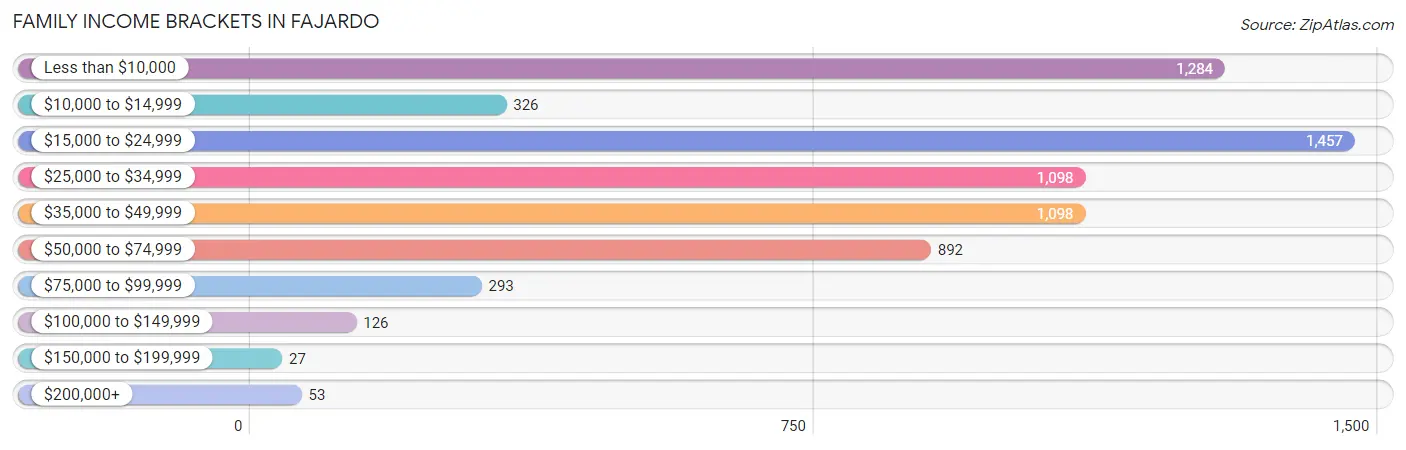
| Income Bracket | # Families | % Families |
| Less than $10,000 | 1,284 | 19.3% |
| $10,000 to $14,999 | 326 | 4.9% |
| $15,000 to $24,999 | 1,457 | 21.9% |
| $25,000 to $34,999 | 1,098 | 16.5% |
| $35,000 to $49,999 | 1,098 | 16.5% |
| $50,000 to $74,999 | 892 | 13.4% |
| $75,000 to $99,999 | 293 | 4.4% |
| $100,000 to $149,999 | 126 | 1.9% |
| $150,000 to $199,999 | 27 | 0.4% |
| $200,000+ | 53 | 0.8% |
Family Income by Famaliy Size in Fajardo
4-person families (821 | 12.3%) account for the highest median family income in Fajardo with $39,725 per family, while 2-person families (3,531 | 53.1%) have the highest median income of $12,414 per family member.
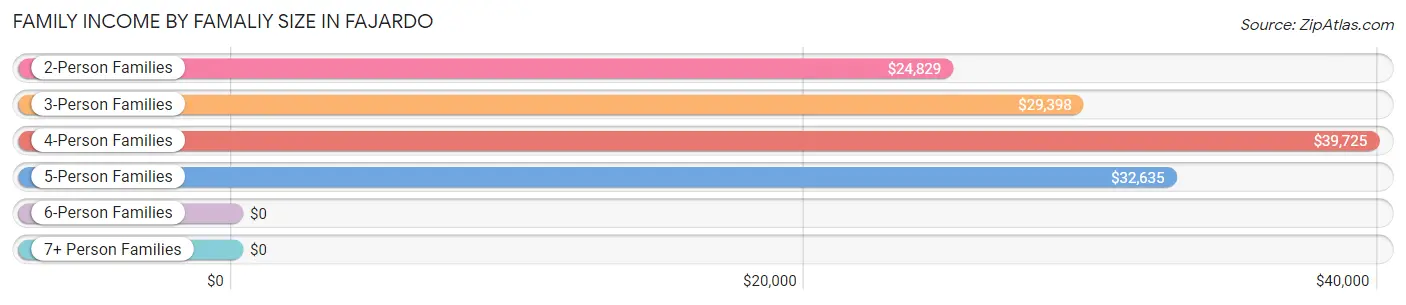
| Income Bracket | # Families | Median Income |
| 2-Person Families | 3,531 (53.1%) | $24,829 |
| 3-Person Families | 2,009 (30.2%) | $29,398 |
| 4-Person Families | 821 (12.3%) | $39,725 |
| 5-Person Families | 218 (3.3%) | $32,635 |
| 6-Person Families | 35 (0.5%) | $0 |
| 7+ Person Families | 39 (0.6%) | $0 |
| Total | 6,653 (100.0%) | $27,071 |
Family Income by Number of Earners in Fajardo
The median family income in Fajardo is $27,071, with families comprising 3+ earners (317) having the highest median family income of $54,960, while families with no earners (2,185) have the lowest median family income of $16,368, accounting for 4.8% and 32.8% of families, respectively.
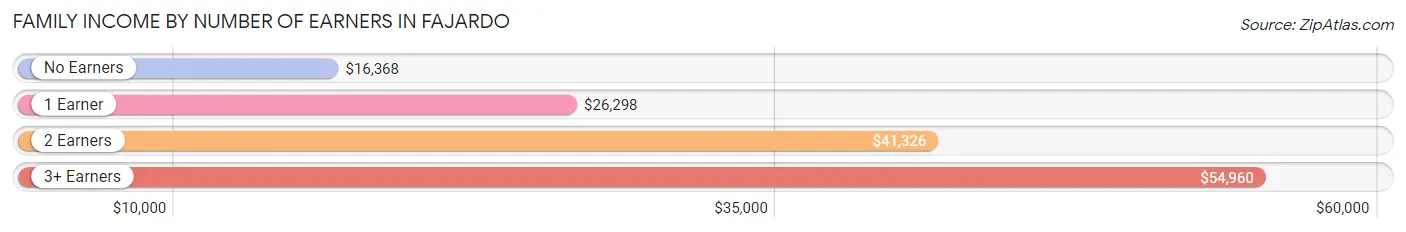
| Number of Earners | # Families | Median Income |
| No Earners | 2,185 (32.8%) | $16,368 |
| 1 Earner | 2,898 (43.6%) | $26,298 |
| 2 Earners | 1,253 (18.8%) | $41,326 |
| 3+ Earners | 317 (4.8%) | $54,960 |
| Total | 6,653 (100.0%) | $27,071 |
Household Income in Fajardo
Household Income Brackets in Fajardo
With 2,219 households falling in the category, the less than $10,000 income range is the most frequent in Fajardo, accounting for 22.1% of all households. In contrast, only 10 households (0.1%) fall into the $150,000 to $199,999 income bracket, making it the least populous group.
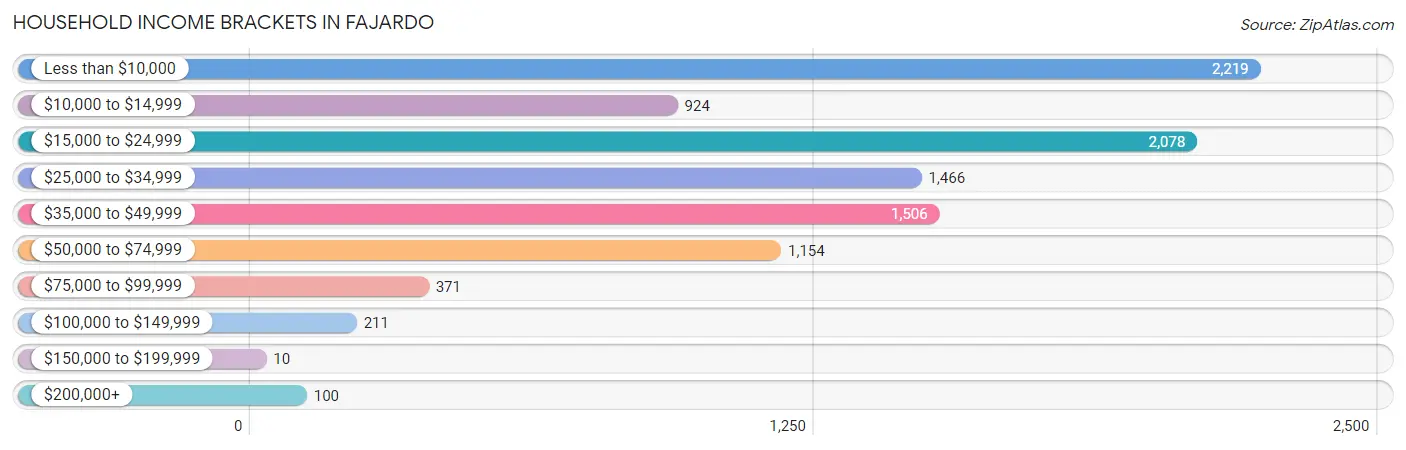
| Income Bracket | # Households | % Households |
| Less than $10,000 | 2,219 | 22.1% |
| $10,000 to $14,999 | 924 | 9.2% |
| $15,000 to $24,999 | 2,078 | 20.7% |
| $25,000 to $34,999 | 1,466 | 14.6% |
| $35,000 to $49,999 | 1,506 | 15.0% |
| $50,000 to $74,999 | 1,154 | 11.5% |
| $75,000 to $99,999 | 371 | 3.7% |
| $100,000 to $149,999 | 211 | 2.1% |
| $150,000 to $199,999 | 10 | 0.1% |
| $200,000+ | 100 | 1.0% |
Household Income by Householder Age in Fajardo
The median household income in Fajardo is $23,811, with the highest median household income of $27,066 found in the 45 to 64 years age bracket for the primary householder. A total of 3,664 households (36.5%) fall into this category. Meanwhile, the 15 to 24 years age bracket for the primary householder has the lowest median household income of $2,499, with 105 households (1.1%) in this group.
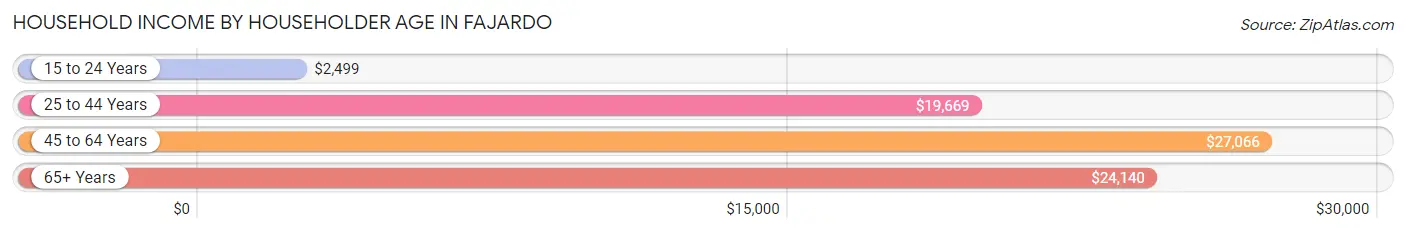
| Income Bracket | # Households | Median Income |
| 15 to 24 Years | 105 (1.1%) | $2,499 |
| 25 to 44 Years | 2,410 (24.0%) | $19,669 |
| 45 to 64 Years | 3,664 (36.5%) | $27,066 |
| 65+ Years | 3,860 (38.5%) | $24,140 |
| Total | 10,039 (100.0%) | $23,811 |
Poverty in Fajardo
Income Below Poverty by Sex and Age in Fajardo
With 41.4% poverty level for males and 45.5% for females among the residents of Fajardo, 6 to 11 year old males and 6 to 11 year old females are the most vulnerable to poverty, with 573 males (73.2%) and 641 females (86.5%) in their respective age groups living below the poverty level.
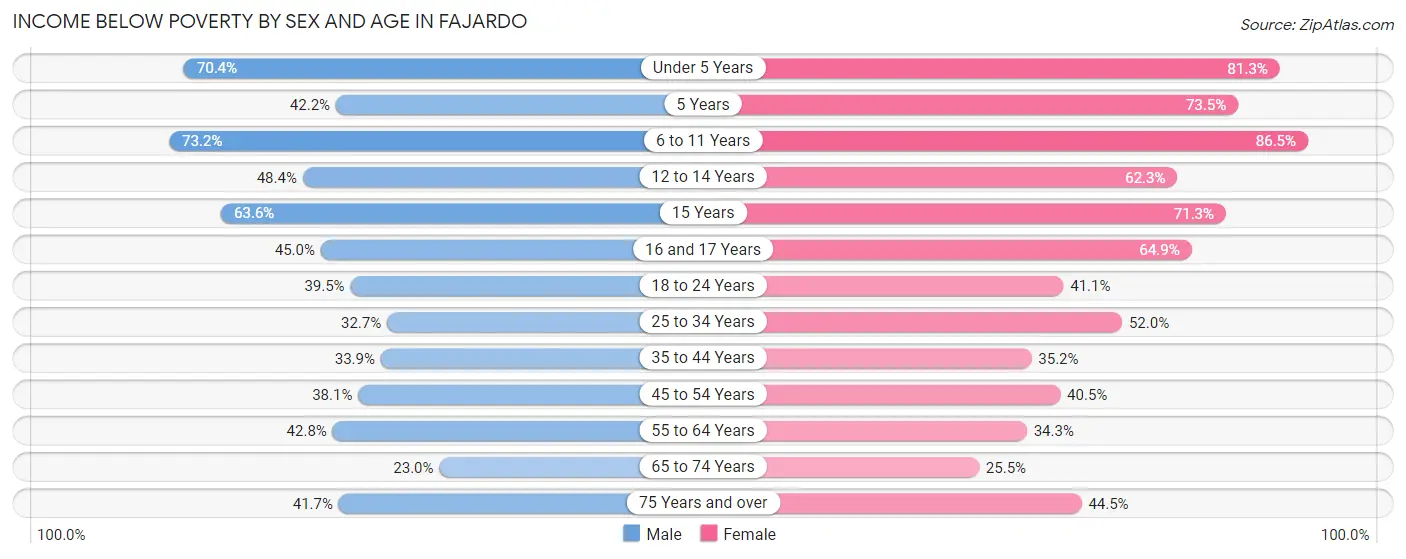
| Age Bracket | Male | Female |
| Under 5 Years | 405 (70.4%) | 447 (81.3%) |
| 5 Years | 38 (42.2%) | 75 (73.5%) |
| 6 to 11 Years | 573 (73.2%) | 641 (86.5%) |
| 12 to 14 Years | 252 (48.4%) | 302 (62.3%) |
| 15 Years | 136 (63.5%) | 139 (71.3%) |
| 16 and 17 Years | 149 (45.0%) | 148 (64.9%) |
| 18 to 24 Years | 396 (39.5%) | 468 (41.1%) |
| 25 to 34 Years | 557 (32.7%) | 981 (52.0%) |
| 35 to 44 Years | 363 (33.9%) | 547 (35.2%) |
| 45 to 54 Years | 576 (38.1%) | 738 (40.5%) |
| 55 to 64 Years | 561 (42.8%) | 585 (34.3%) |
| 65 to 74 Years | 300 (23.0%) | 398 (25.5%) |
| 75 Years and over | 491 (41.7%) | 842 (44.5%) |
| Total | 4,797 (41.4%) | 6,311 (45.5%) |
Income Above Poverty by Sex and Age in Fajardo
According to the poverty statistics in Fajardo, males aged 65 to 74 years and females aged 65 to 74 years are the age groups that are most secure financially, with 77.0% of males and 74.6% of females in these age groups living above the poverty line.
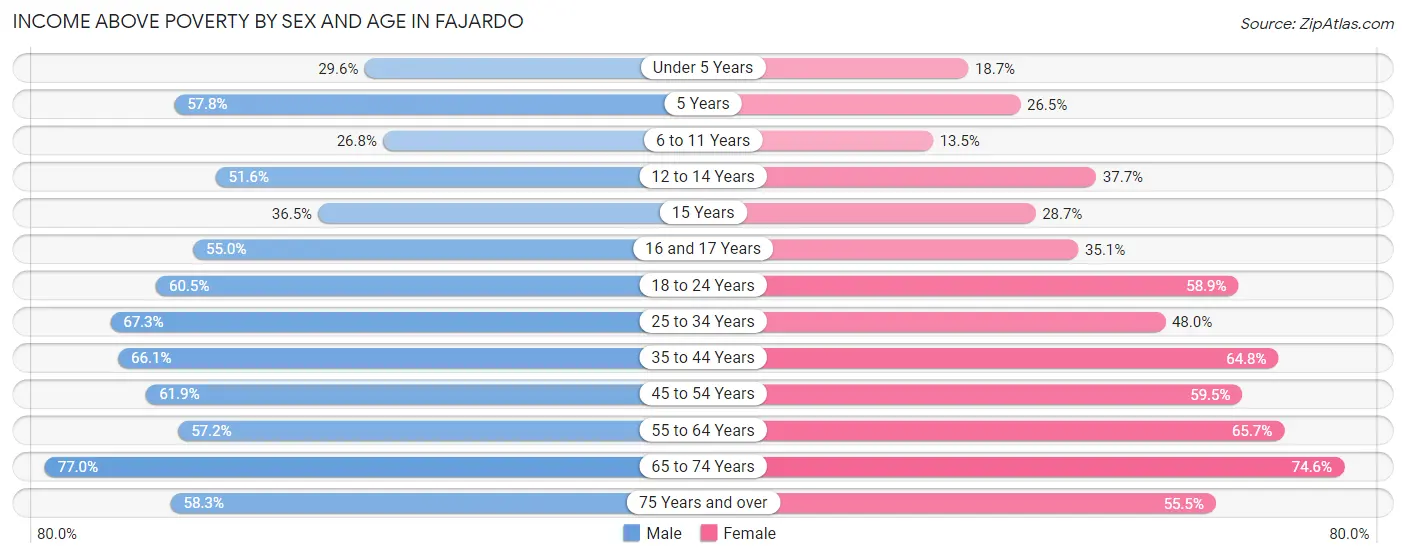
| Age Bracket | Male | Female |
| Under 5 Years | 170 (29.6%) | 103 (18.7%) |
| 5 Years | 52 (57.8%) | 27 (26.5%) |
| 6 to 11 Years | 210 (26.8%) | 100 (13.5%) |
| 12 to 14 Years | 269 (51.6%) | 183 (37.7%) |
| 15 Years | 78 (36.4%) | 56 (28.7%) |
| 16 and 17 Years | 182 (55.0%) | 80 (35.1%) |
| 18 to 24 Years | 606 (60.5%) | 670 (58.9%) |
| 25 to 34 Years | 1,145 (67.3%) | 905 (48.0%) |
| 35 to 44 Years | 708 (66.1%) | 1,008 (64.8%) |
| 45 to 54 Years | 937 (61.9%) | 1,083 (59.5%) |
| 55 to 64 Years | 749 (57.2%) | 1,119 (65.7%) |
| 65 to 74 Years | 1,004 (77.0%) | 1,166 (74.6%) |
| 75 Years and over | 687 (58.3%) | 1,051 (55.5%) |
| Total | 6,797 (58.6%) | 7,551 (54.5%) |
Income Below Poverty Among Married-Couple Families in Fajardo
The poverty statistics for married-couple families in Fajardo show that 31.0% or 971 of the total 3,132 families live below the poverty line. Families with 3 or 4 children have the highest poverty rate of 100.0%, comprising of 28 families. On the other hand, families with no children have the lowest poverty rate of 29.5%, which includes 740 families.
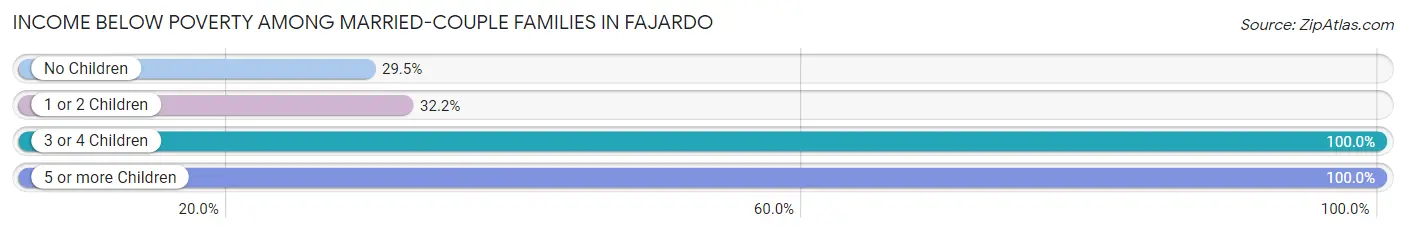
| Children | Above Poverty | Below Poverty |
| No Children | 1,765 (70.5%) | 740 (29.5%) |
| 1 or 2 Children | 396 (67.8%) | 188 (32.2%) |
| 3 or 4 Children | 0 (0.0%) | 28 (100.0%) |
| 5 or more Children | 0 (0.0%) | 15 (100.0%) |
| Total | 2,161 (69.0%) | 971 (31.0%) |
Income Below Poverty Among Single-Parent Households in Fajardo
According to the poverty data in Fajardo, 50.8% or 398 single-father households and 53.3% or 1,459 single-mother households are living below the poverty line. Among single-father households, those with 3 or 4 children have the highest poverty rate, with 28 households (100.0%) experiencing poverty. Likewise, among single-mother households, those with 3 or 4 children have the highest poverty rate, with 156 households (100.0%) falling below the poverty line.
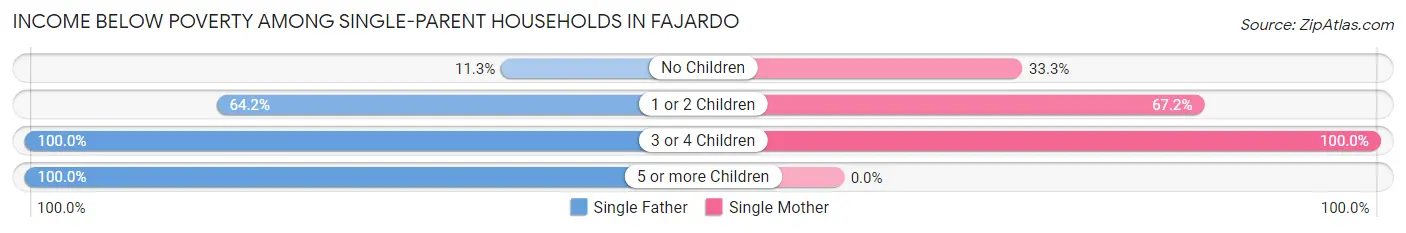
| Children | Single Father | Single Mother |
| No Children | 26 (11.3%) | 422 (33.3%) |
| 1 or 2 Children | 325 (64.2%) | 881 (67.1%) |
| 3 or 4 Children | 28 (100.0%) | 156 (100.0%) |
| 5 or more Children | 19 (100.0%) | 0 (0.0%) |
| Total | 398 (50.8%) | 1,459 (53.3%) |
Income Below Poverty Among Married-Couple vs Single-Parent Households in Fajardo
The poverty data for Fajardo shows that 971 of the married-couple family households (31.0%) and 1,857 of the single-parent households (52.7%) are living below the poverty level. Within the married-couple family households, those with 3 or 4 children have the highest poverty rate, with 28 households (100.0%) falling below the poverty line. Among the single-parent households, those with 3 or 4 children have the highest poverty rate, with 184 household (100.0%) living below poverty.
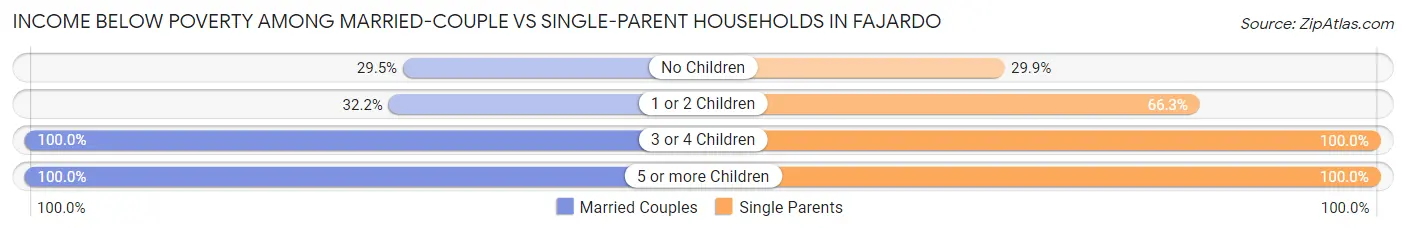
| Children | Married-Couple Families | Single-Parent Households |
| No Children | 740 (29.5%) | 448 (29.9%) |
| 1 or 2 Children | 188 (32.2%) | 1,206 (66.3%) |
| 3 or 4 Children | 28 (100.0%) | 184 (100.0%) |
| 5 or more Children | 15 (100.0%) | 19 (100.0%) |
| Total | 971 (31.0%) | 1,857 (52.7%) |
Race in Fajardo
The most populous races in Fajardo are Hispanic or Latino (25,518 | 99.8%), Some other Race (8,065 | 31.5%), and White / Caucasian (7,971 | 31.2%).
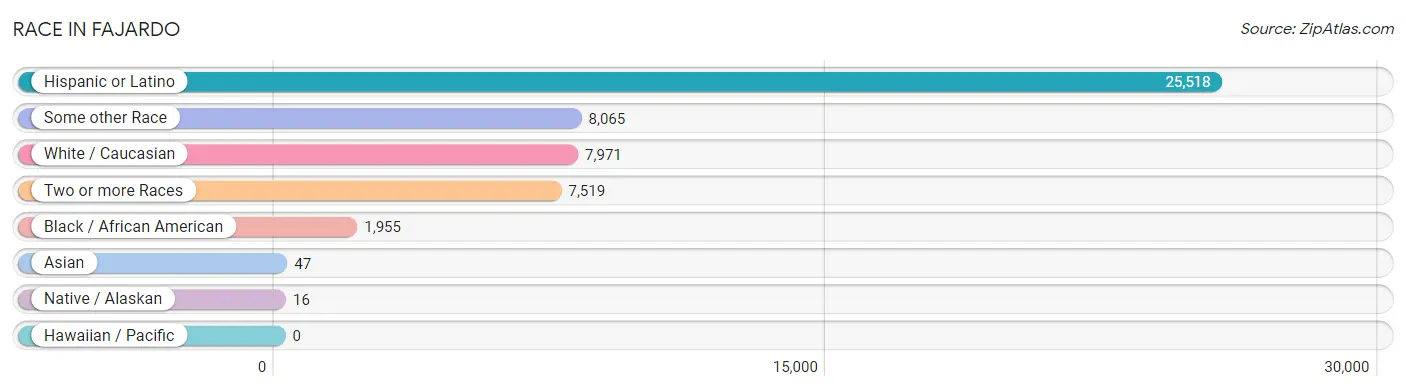
| Race | # Population | % Population |
| Asian | 47 | 0.2% |
| Black / African American | 1,955 | 7.6% |
| Hawaiian / Pacific | 0 | 0.0% |
| Hispanic or Latino | 25,518 | 99.8% |
| Native / Alaskan | 16 | 0.1% |
| White / Caucasian | 7,971 | 31.2% |
| Two or more Races | 7,519 | 29.4% |
| Some other Race | 8,065 | 31.5% |
| Total | 25,573 | 100.0% |
Ancestry in Fajardo
The most populous ancestries reported in Fajardo are Puerto Rican (24,794 | 97.0%), Dominican (342 | 1.3%), American (285 | 1.1%), South American (174 | 0.7%), and Spaniard (102 | 0.4%), together accounting for 100.5% of all Fajardo residents.
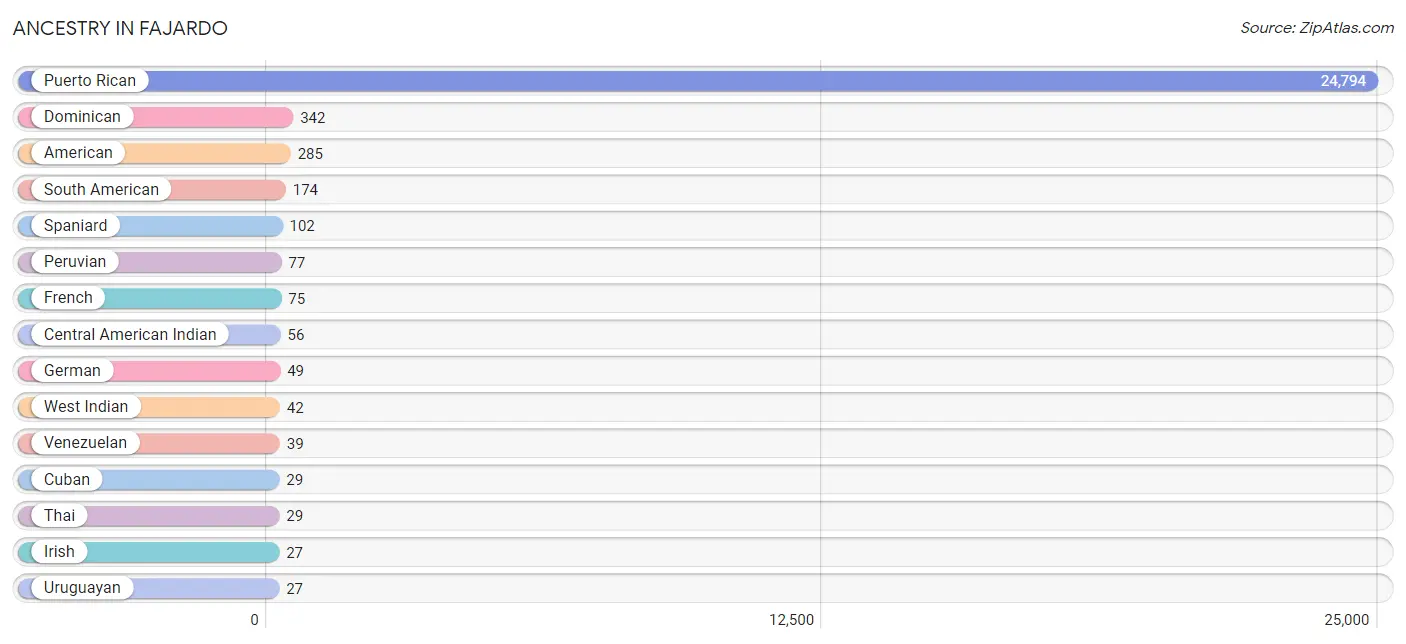
| Ancestry | # Population | % Population |
| African | 9 | 0.0% |
| American | 285 | 1.1% |
| Bolivian | 10 | 0.0% |
| Central American | 22 | 0.1% |
| Central American Indian | 56 | 0.2% |
| Cherokee | 15 | 0.1% |
| Cuban | 29 | 0.1% |
| Dominican | 342 | 1.3% |
| Ecuadorian | 21 | 0.1% |
| French | 75 | 0.3% |
| German | 49 | 0.2% |
| Greek | 10 | 0.0% |
| Indian (Asian) | 18 | 0.1% |
| Irish | 27 | 0.1% |
| Italian | 25 | 0.1% |
| Korean | 18 | 0.1% |
| Mexican | 15 | 0.1% |
| Mexican American Indian | 5 | 0.0% |
| Peruvian | 77 | 0.3% |
| Puerto Rican | 24,794 | 97.0% |
| Romanian | 13 | 0.1% |
| Salvadoran | 22 | 0.1% |
| South American | 174 | 0.7% |
| Spaniard | 102 | 0.4% |
| Spanish American Indian | 15 | 0.1% |
| Subsaharan African | 9 | 0.0% |
| Thai | 29 | 0.1% |
| Uruguayan | 27 | 0.1% |
| Venezuelan | 39 | 0.2% |
| West Indian | 42 | 0.2% | View All 30 Rows |
Immigrants in Fajardo

| Immigration Origin | # Population | % Population | View All 0 Rows |
Sex and Age in Fajardo
Sex and Age in Fajardo
The most populous age groups in Fajardo are 25 to 29 Years (958 | 8.2%) for men and 25 to 29 Years (1,037 | 7.5%) for women.
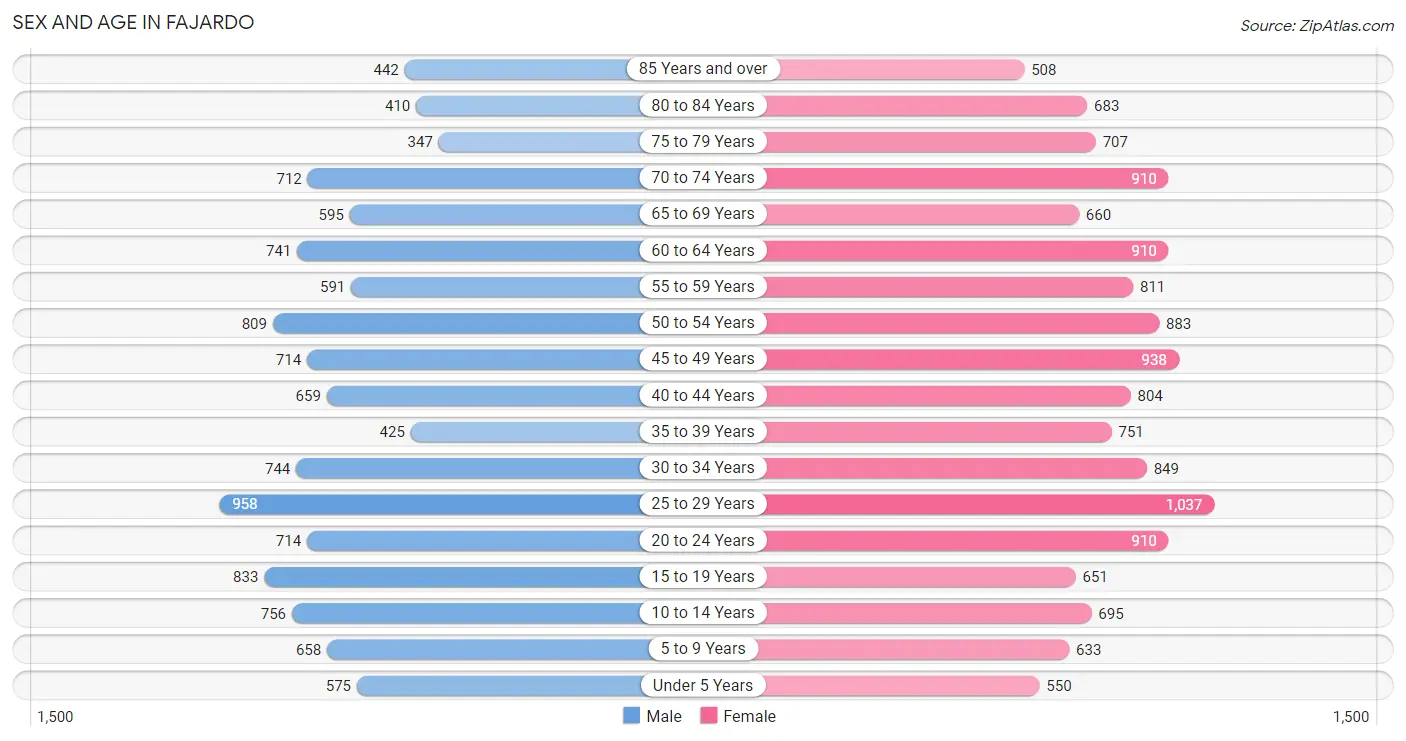
| Age Bracket | Male | Female |
| Under 5 Years | 575 (4.9%) | 550 (4.0%) |
| 5 to 9 Years | 658 (5.6%) | 633 (4.6%) |
| 10 to 14 Years | 756 (6.5%) | 695 (5.0%) |
| 15 to 19 Years | 833 (7.1%) | 651 (4.7%) |
| 20 to 24 Years | 714 (6.1%) | 910 (6.6%) |
| 25 to 29 Years | 958 (8.2%) | 1,037 (7.5%) |
| 30 to 34 Years | 744 (6.4%) | 849 (6.1%) |
| 35 to 39 Years | 425 (3.6%) | 751 (5.4%) |
| 40 to 44 Years | 659 (5.6%) | 804 (5.8%) |
| 45 to 49 Years | 714 (6.1%) | 938 (6.8%) |
| 50 to 54 Years | 809 (6.9%) | 883 (6.4%) |
| 55 to 59 Years | 591 (5.1%) | 811 (5.8%) |
| 60 to 64 Years | 741 (6.3%) | 910 (6.6%) |
| 65 to 69 Years | 595 (5.1%) | 660 (4.8%) |
| 70 to 74 Years | 712 (6.1%) | 910 (6.6%) |
| 75 to 79 Years | 347 (3.0%) | 707 (5.1%) |
| 80 to 84 Years | 410 (3.5%) | 683 (4.9%) |
| 85 Years and over | 442 (3.8%) | 508 (3.7%) |
| Total | 11,683 (100.0%) | 13,890 (100.0%) |
Families and Households in Fajardo
Median Family Size in Fajardo
The median family size in Fajardo is 3.13 persons per family, with single female/mother families (2,737 | 41.1%) accounting for the largest median family size of 3.21 persons per family. On the other hand, married-couple families (3,132 | 47.1%) represent the smallest median family size with 3.04 persons per family.
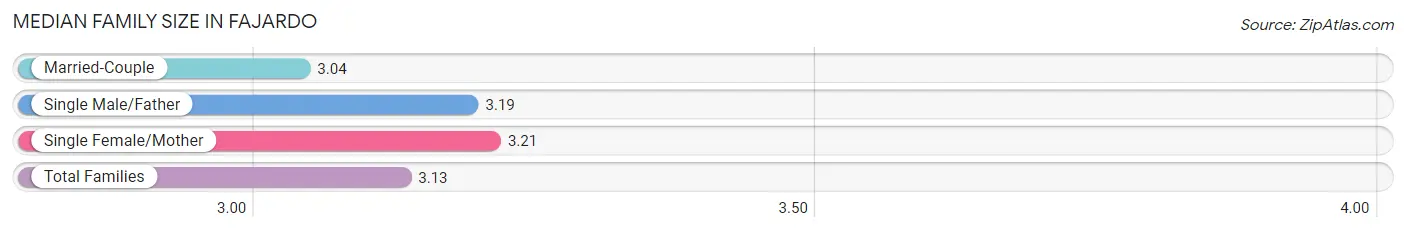
| Family Type | # Families | Family Size |
| Married-Couple | 3,132 (47.1%) | 3.04 |
| Single Male/Father | 784 (11.8%) | 3.19 |
| Single Female/Mother | 2,737 (41.1%) | 3.21 |
| Total Families | 6,653 (100.0%) | 3.13 |
Median Household Size in Fajardo
The median household size in Fajardo is 2.53 persons per household, with single male/father households (784 | 7.8%) accounting for the largest median household size of 3.69 persons per household. non-family households (3,386 | 33.7%) represent the smallest median household size with 1.09 persons per household.
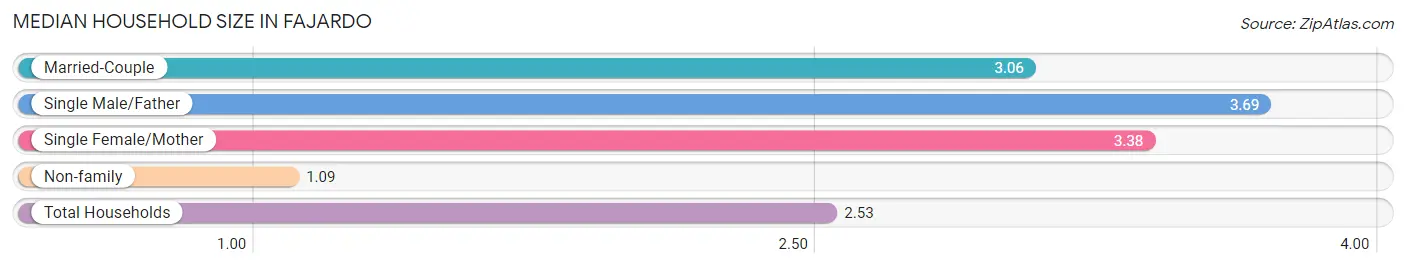
| Household Type | # Households | Household Size |
| Married-Couple | 3,132 (31.2%) | 3.06 |
| Single Male/Father | 784 (7.8%) | 3.69 |
| Single Female/Mother | 2,737 (27.3%) | 3.38 |
| Non-family | 3,386 (33.7%) | 1.09 |
| Total Households | 10,039 (100.0%) | 2.53 |
Household Size by Marriage Status in Fajardo
Out of a total of 10,039 households in Fajardo, 6,653 (66.3%) are family households, while 3,386 (33.7%) are nonfamily households. The most numerous type of family households are 2-person households, comprising 3,137, and the most common type of nonfamily households are 1-person households, comprising 3,090.
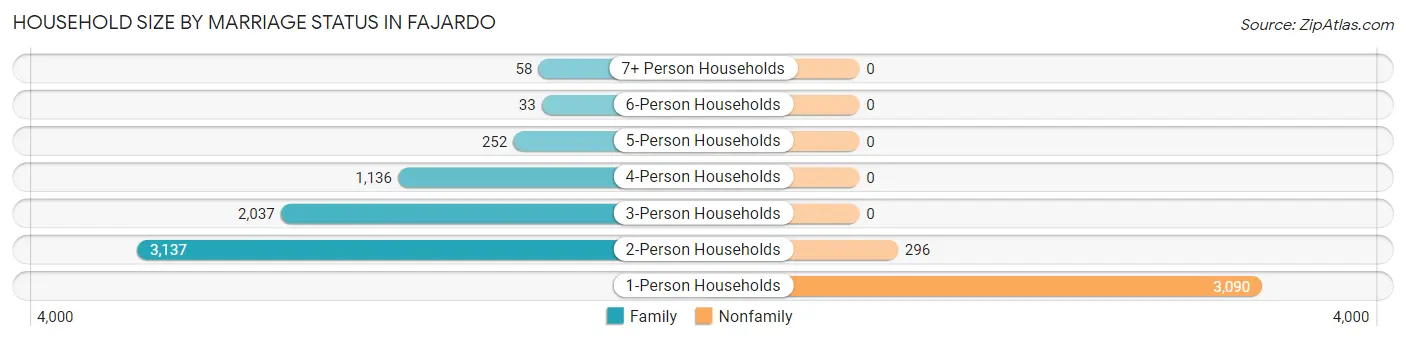
| Household Size | Family Households | Nonfamily Households |
| 1-Person Households | - | 3,090 (30.8%) |
| 2-Person Households | 3,137 (31.2%) | 296 (2.9%) |
| 3-Person Households | 2,037 (20.3%) | 0 (0.0%) |
| 4-Person Households | 1,136 (11.3%) | 0 (0.0%) |
| 5-Person Households | 252 (2.5%) | 0 (0.0%) |
| 6-Person Households | 33 (0.3%) | 0 (0.0%) |
| 7+ Person Households | 58 (0.6%) | 0 (0.0%) |
| Total | 6,653 (66.3%) | 3,386 (33.7%) |
Female Fertility in Fajardo
Fertility by Age in Fajardo
Average fertility rate in Fajardo is 32.0 births per 1,000 women. Women in the age bracket of 20 to 34 years have the highest fertility rate with 63.0 births per 1,000 women. Women in the age bracket of 20 to 34 years acount for 90.2% of all women with births.
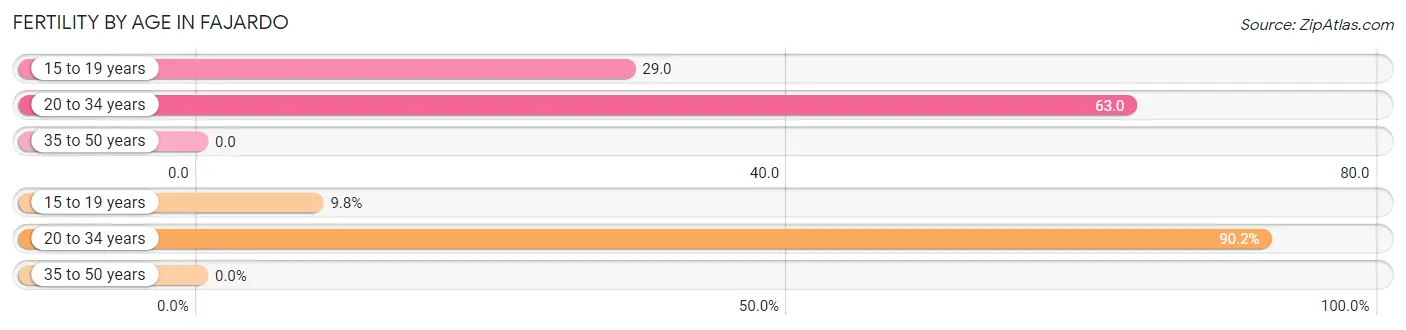
| Age Bracket | Women with Births | Births / 1,000 Women |
| 15 to 19 years | 19 (9.8%) | 29.0 |
| 20 to 34 years | 175 (90.2%) | 63.0 |
| 35 to 50 years | 0 (0.0%) | 0.0 |
| Total | 194 (100.0%) | 32.0 |
Fertility by Age by Marriage Status in Fajardo
12.4% of women with births (194) in Fajardo are married. The highest percentage of unmarried women with births falls into 20 to 34 years age bracket with 97.1% of them unmarried at the time of birth, while the lowest percentage of unmarried women with births belong to 15 to 19 years age bracket with 0.0% of them unmarried.
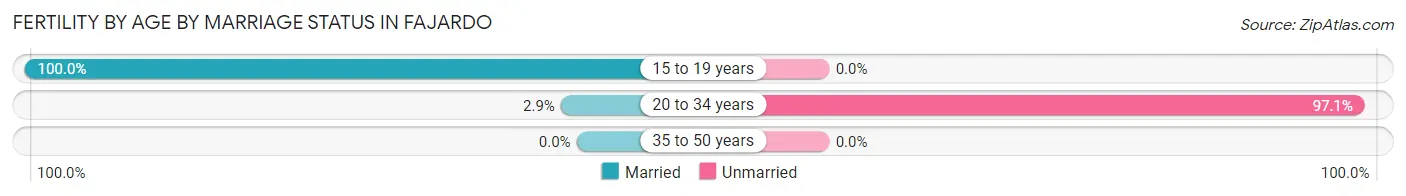
| Age Bracket | Married | Unmarried |
| 15 to 19 years | 19 (100.0%) | 0 (0.0%) |
| 20 to 34 years | 5 (2.9%) | 170 (97.1%) |
| 35 to 50 years | 0 (0.0%) | 0 (0.0%) |
| Total | 24 (12.4%) | 170 (87.6%) |
Fertility by Education in Fajardo
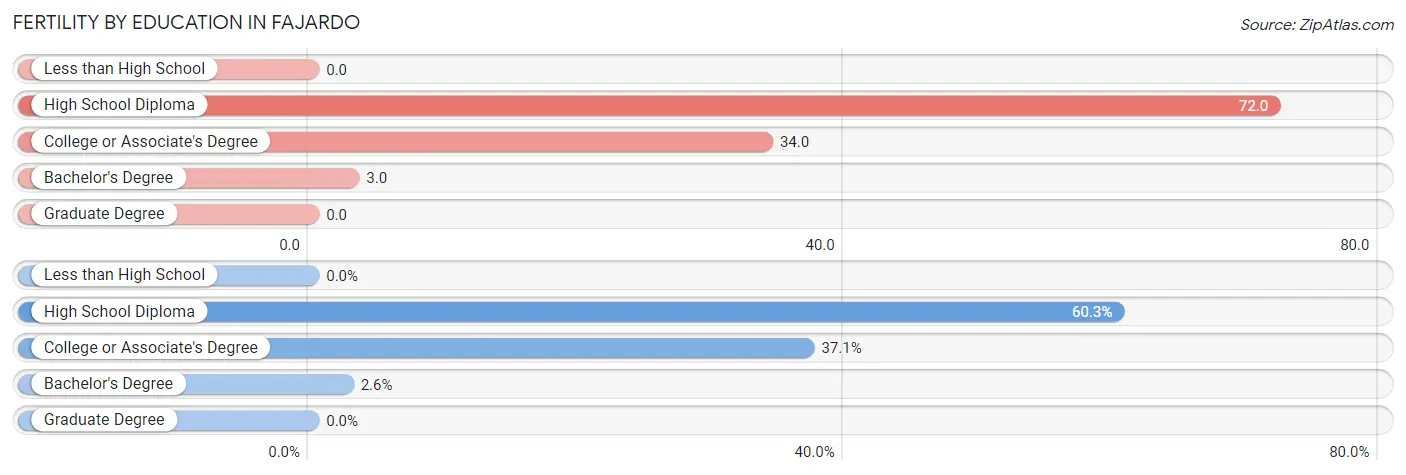
| Educational Attainment | Women with Births | Births / 1,000 Women |
| Less than High School | 0 (0.0%) | 0.0 |
| High School Diploma | 117 (60.3%) | 72.0 |
| College or Associate's Degree | 72 (37.1%) | 34.0 |
| Bachelor's Degree | 5 (2.6%) | 3.0 |
| Graduate Degree | 0 (0.0%) | 0.0 |
| Total | 194 (100.0%) | 32.0 |
Fertility by Education by Marriage Status in Fajardo
87.6% of women with births in Fajardo are unmarried. Women with the educational attainment of bachelor's degree are most likely to be married with 100.0% of them married at childbirth, while women with the educational attainment of college or associate's degree are least likely to be married with 100.0% of them unmarried at childbirth.
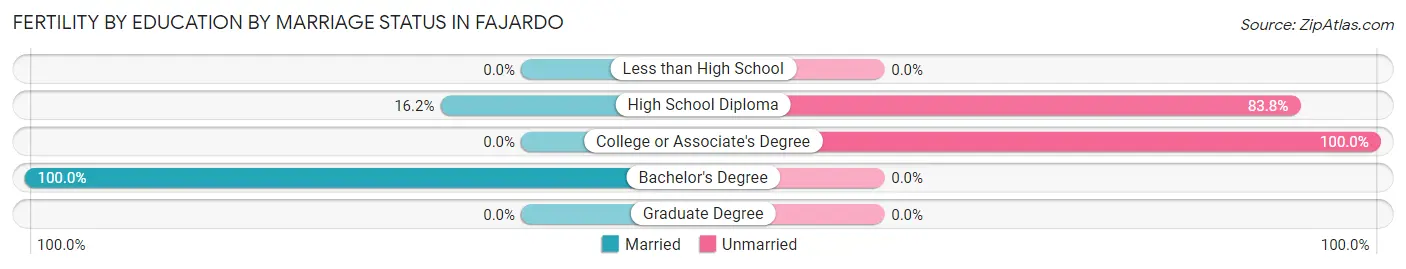
| Educational Attainment | Married | Unmarried |
| Less than High School | 0 (0.0%) | 0 (0.0%) |
| High School Diploma | 19 (16.2%) | 98 (83.8%) |
| College or Associate's Degree | 0 (0.0%) | 72 (100.0%) |
| Bachelor's Degree | 5 (100.0%) | 0 (0.0%) |
| Graduate Degree | 0 (0.0%) | 0 (0.0%) |
| Total | 24 (12.4%) | 170 (87.6%) |
Employment Characteristics in Fajardo
Employment by Class of Employer in Fajardo
Among the 7,820 employed individuals in Fajardo, private company employees (4,747 | 60.7%), self-employed (not incorporated) (1,038 | 13.3%), and state government employees (788 | 10.1%) make up the most common classes of employment.
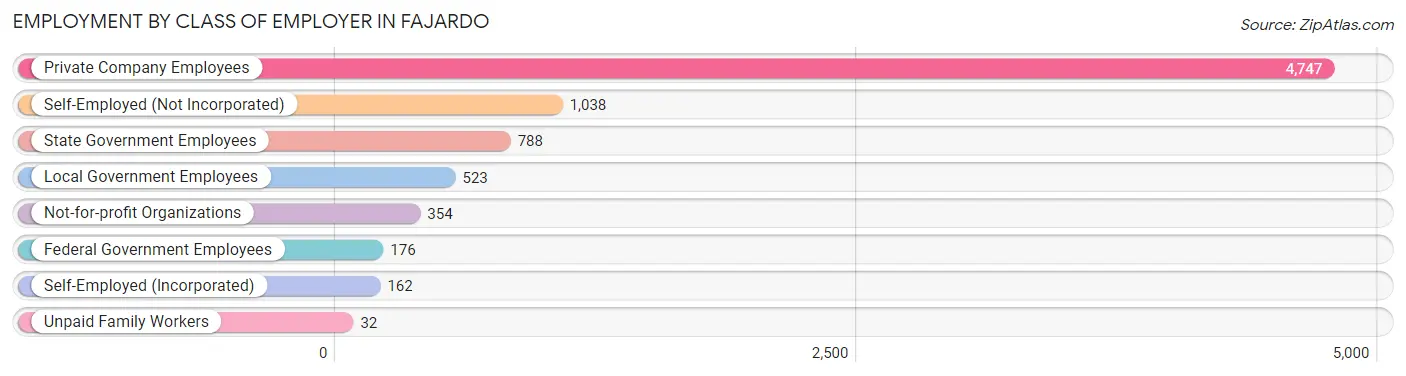
| Employer Class | # Employees | % Employees |
| Private Company Employees | 4,747 | 60.7% |
| Self-Employed (Incorporated) | 162 | 2.1% |
| Self-Employed (Not Incorporated) | 1,038 | 13.3% |
| Not-for-profit Organizations | 354 | 4.5% |
| Local Government Employees | 523 | 6.7% |
| State Government Employees | 788 | 10.1% |
| Federal Government Employees | 176 | 2.2% |
| Unpaid Family Workers | 32 | 0.4% |
| Total | 7,820 | 100.0% |
Employment Status by Age in Fajardo
According to the labor force statistics for Fajardo, out of the total population over 16 years of age (21,297), 51.6% or 10,989 individuals are in the labor force, with 24.0% or 2,637 of them unemployed. The age group with the highest labor force participation rate is 25 to 29 years, with 89.5% or 1,786 individuals in the labor force. Within the labor force, the 16 to 19 years age range has the highest percentage of unemployed individuals, with 40.0% or 104 of them being unemployed.
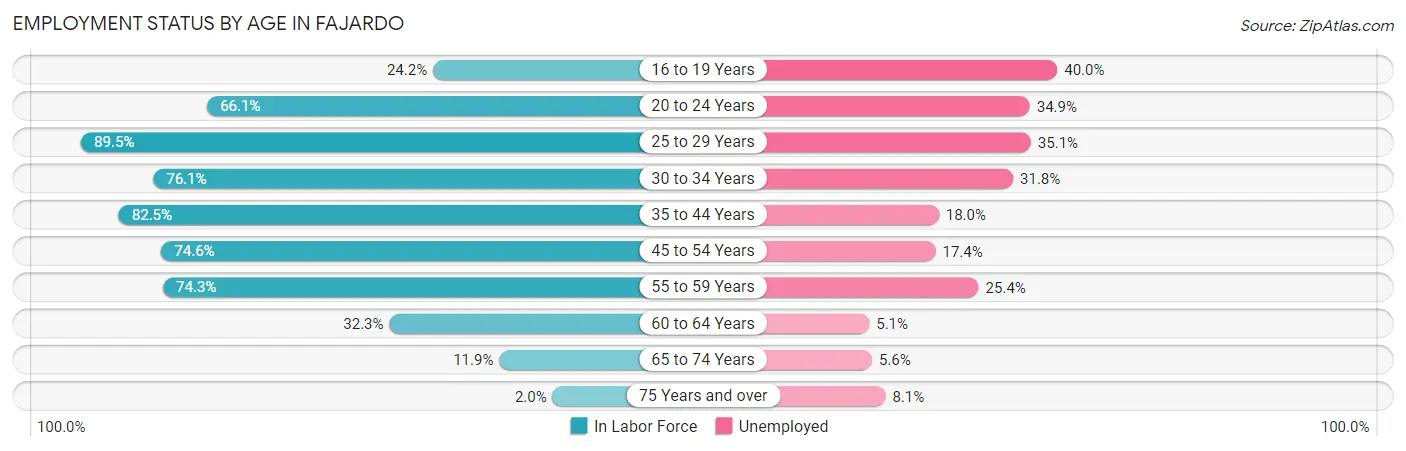
| Age Bracket | In Labor Force | Unemployed |
| 16 to 19 Years | 260 (24.2%) | 104 (40.0%) |
| 20 to 24 Years | 1,073 (66.1%) | 374 (34.9%) |
| 25 to 29 Years | 1,786 (89.5%) | 627 (35.1%) |
| 30 to 34 Years | 1,212 (76.1%) | 385 (31.8%) |
| 35 to 44 Years | 2,177 (82.5%) | 392 (18.0%) |
| 45 to 54 Years | 2,495 (74.6%) | 434 (17.4%) |
| 55 to 59 Years | 1,042 (74.3%) | 265 (25.4%) |
| 60 to 64 Years | 533 (32.3%) | 27 (5.1%) |
| 65 to 74 Years | 342 (11.9%) | 19 (5.6%) |
| 75 Years and over | 62 (2.0%) | 5 (8.1%) |
| Total | 10,989 (51.6%) | 2,637 (24.0%) |
Employment Status by Educational Attainment in Fajardo
According to labor force statistics for Fajardo, 73.2% of individuals (9,241) out of the total population between 25 and 64 years of age (12,624) are in the labor force, with 23.1% or 2,135 of them being unemployed. The group with the highest labor force participation rate are those with the educational attainment of college / associate degree, with 78.6% or 2,504 individuals in the labor force. Within the labor force, individuals with less than high school education have the highest percentage of unemployment, with 39.5% or 210 of them being unemployed.
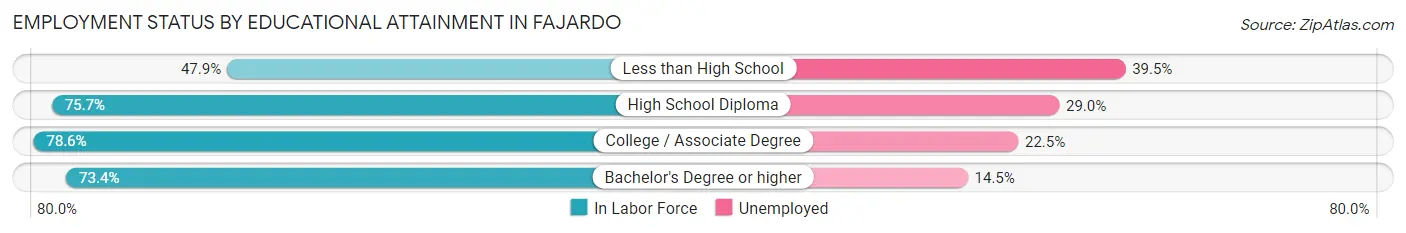
| Educational Attainment | In Labor Force | Unemployed |
| Less than High School | 531 (47.9%) | 438 (39.5%) |
| High School Diploma | 3,163 (75.7%) | 1,212 (29.0%) |
| College / Associate Degree | 2,504 (78.6%) | 717 (22.5%) |
| Bachelor's Degree or higher | 3,048 (73.4%) | 602 (14.5%) |
| Total | 9,241 (73.2%) | 2,916 (23.1%) |
Employment Occupations by Sex in Fajardo
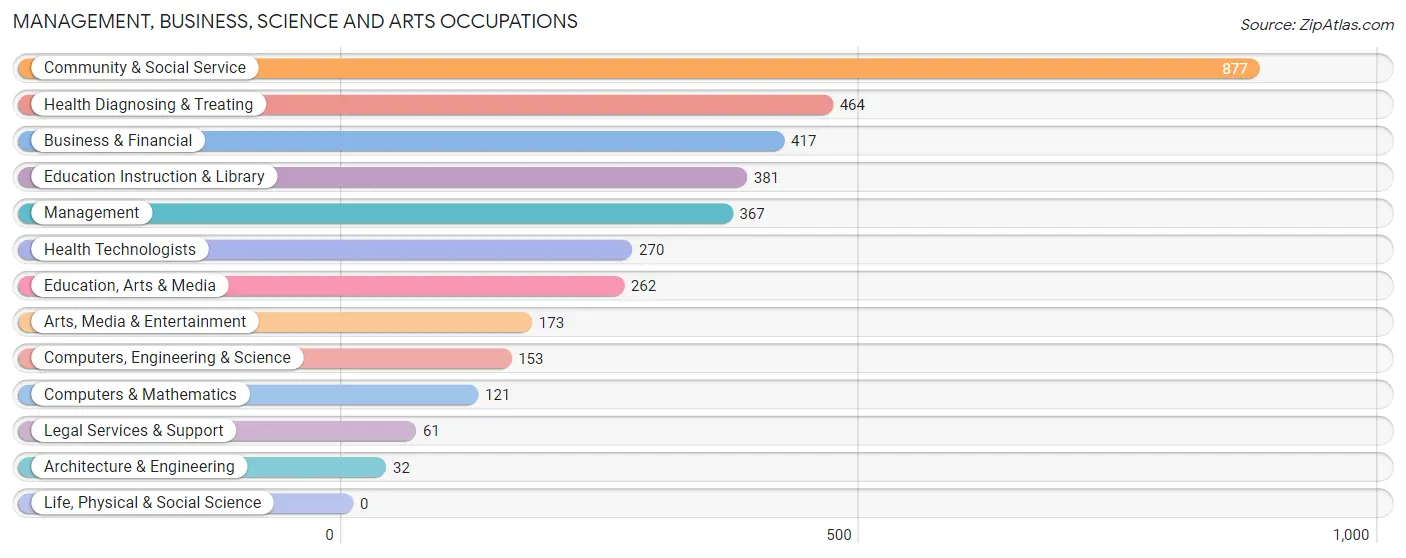
Management, Business, Science and Arts Occupations
The most common Management, Business, Science and Arts occupations in Fajardo are Community & Social Service (877 | 10.5%), Health Diagnosing & Treating (464 | 5.6%), Business & Financial (417 | 5.0%), Education Instruction & Library (381 | 4.6%), and Management (367 | 4.4%).
Management, Business, Science and Arts Occupations by Sex
Within the Management, Business, Science and Arts occupations in Fajardo, the most male-oriented occupations are Architecture & Engineering (100.0%), Arts, Media & Entertainment (79.2%), and Management (59.1%), while the most female-oriented occupations are Education Instruction & Library (90.0%), Education, Arts & Media (72.9%), and Health Diagnosing & Treating (71.6%).
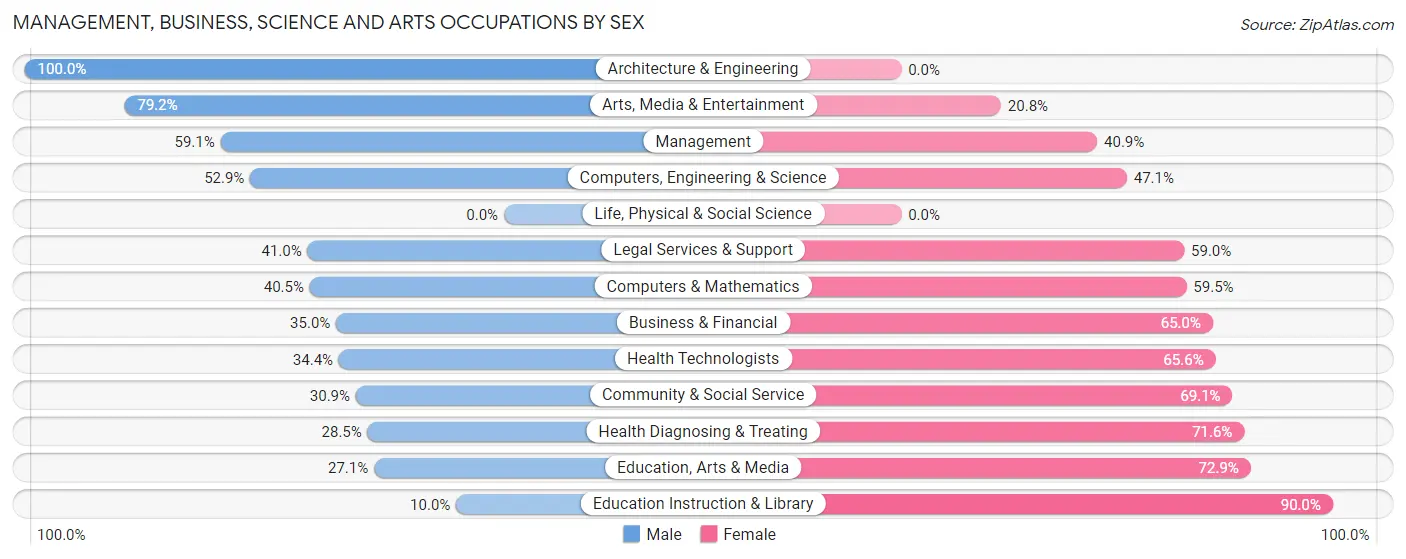
| Occupation | Male | Female |
| Management | 217 (59.1%) | 150 (40.9%) |
| Business & Financial | 146 (35.0%) | 271 (65.0%) |
| Computers, Engineering & Science | 81 (52.9%) | 72 (47.1%) |
| Computers & Mathematics | 49 (40.5%) | 72 (59.5%) |
| Architecture & Engineering | 32 (100.0%) | 0 (0.0%) |
| Life, Physical & Social Science | 0 (0.0%) | 0 (0.0%) |
| Community & Social Service | 271 (30.9%) | 606 (69.1%) |
| Education, Arts & Media | 71 (27.1%) | 191 (72.9%) |
| Legal Services & Support | 25 (41.0%) | 36 (59.0%) |
| Education Instruction & Library | 38 (10.0%) | 343 (90.0%) |
| Arts, Media & Entertainment | 137 (79.2%) | 36 (20.8%) |
| Health Diagnosing & Treating | 132 (28.4%) | 332 (71.6%) |
| Health Technologists | 93 (34.4%) | 177 (65.6%) |
| Total (Category) | 847 (37.2%) | 1,431 (62.8%) |
| Total (Overall) | 4,135 (49.6%) | 4,202 (50.4%) |
Services Occupations
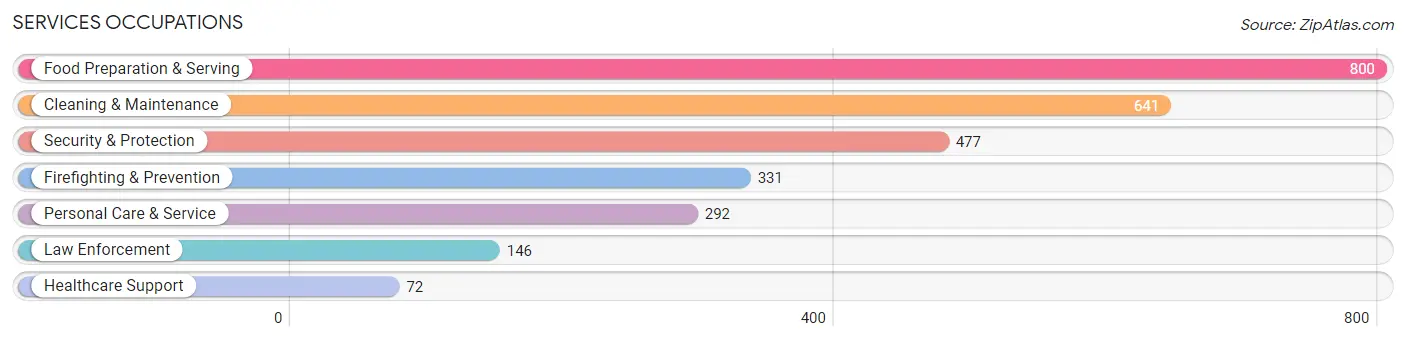
The most common Services occupations in Fajardo are Food Preparation & Serving (800 | 9.6%), Cleaning & Maintenance (641 | 7.7%), Security & Protection (477 | 5.7%), Firefighting & Prevention (331 | 4.0%), and Personal Care & Service (292 | 3.5%).
Services Occupations by Sex
Within the Services occupations in Fajardo, the most male-oriented occupations are Firefighting & Prevention (81.0%), Cleaning & Maintenance (78.2%), and Security & Protection (75.3%), while the most female-oriented occupations are Healthcare Support (100.0%), Food Preparation & Serving (59.1%), and Personal Care & Service (56.5%).
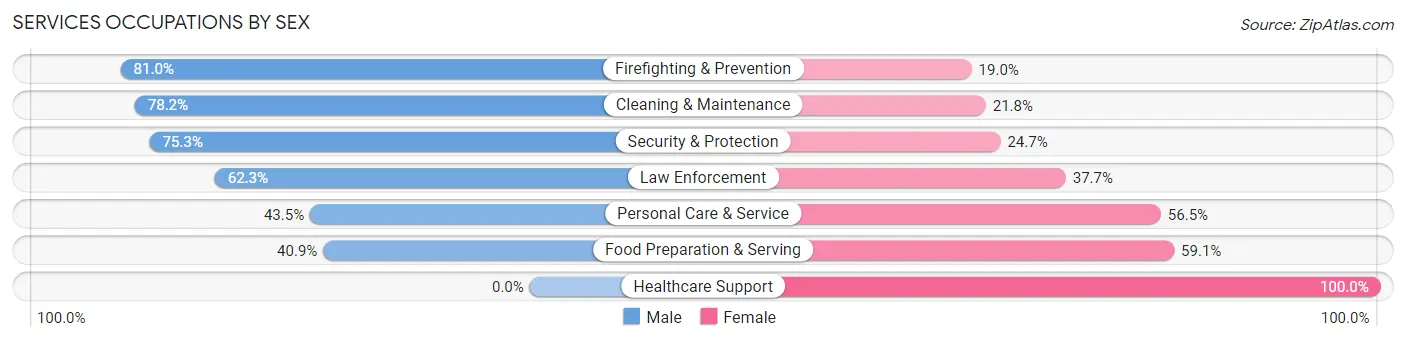
| Occupation | Male | Female |
| Healthcare Support | 0 (0.0%) | 72 (100.0%) |
| Security & Protection | 359 (75.3%) | 118 (24.7%) |
| Firefighting & Prevention | 268 (81.0%) | 63 (19.0%) |
| Law Enforcement | 91 (62.3%) | 55 (37.7%) |
| Food Preparation & Serving | 327 (40.9%) | 473 (59.1%) |
| Cleaning & Maintenance | 501 (78.2%) | 140 (21.8%) |
| Personal Care & Service | 127 (43.5%) | 165 (56.5%) |
| Total (Category) | 1,314 (57.6%) | 968 (42.4%) |
| Total (Overall) | 4,135 (49.6%) | 4,202 (50.4%) |
Sales and Office Occupations
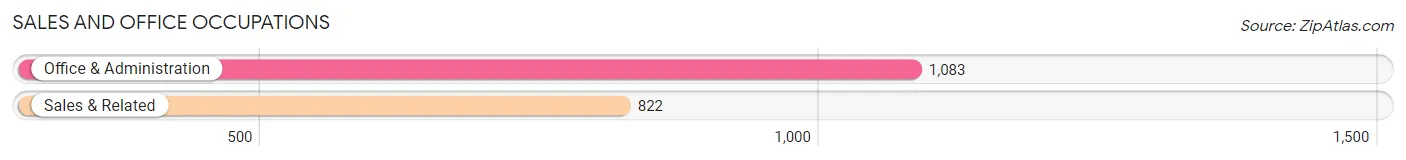
The most common Sales and Office occupations in Fajardo are Office & Administration (1,083 | 13.0%), and Sales & Related (822 | 9.9%).
Sales and Office Occupations by Sex
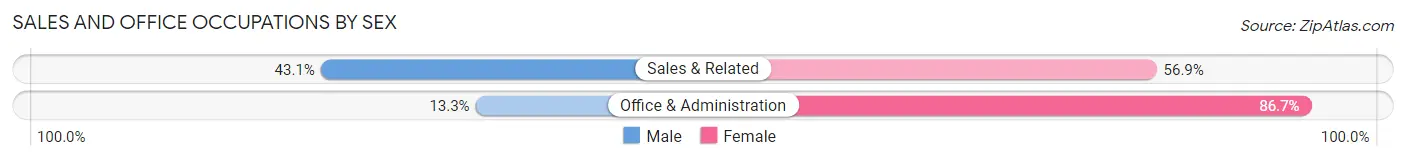
| Occupation | Male | Female |
| Sales & Related | 354 (43.1%) | 468 (56.9%) |
| Office & Administration | 144 (13.3%) | 939 (86.7%) |
| Total (Category) | 498 (26.1%) | 1,407 (73.9%) |
| Total (Overall) | 4,135 (49.6%) | 4,202 (50.4%) |
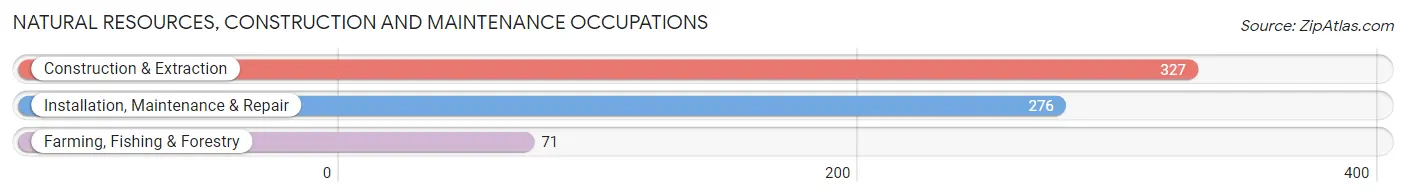
Natural Resources, Construction and Maintenance Occupations
The most common Natural Resources, Construction and Maintenance occupations in Fajardo are Construction & Extraction (327 | 3.9%), Installation, Maintenance & Repair (276 | 3.3%), and Farming, Fishing & Forestry (71 | 0.9%).
Natural Resources, Construction and Maintenance Occupations by Sex
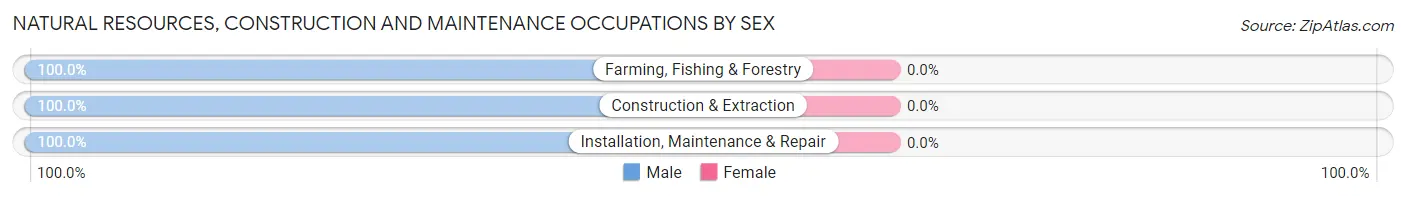
| Occupation | Male | Female |
| Farming, Fishing & Forestry | 71 (100.0%) | 0 (0.0%) |
| Construction & Extraction | 327 (100.0%) | 0 (0.0%) |
| Installation, Maintenance & Repair | 276 (100.0%) | 0 (0.0%) |
| Total (Category) | 674 (100.0%) | 0 (0.0%) |
| Total (Overall) | 4,135 (49.6%) | 4,202 (50.4%) |
Production, Transportation and Moving Occupations
The most common Production, Transportation and Moving occupations in Fajardo are Production (445 | 5.3%), Material Moving (395 | 4.7%), and Transportation (358 | 4.3%).
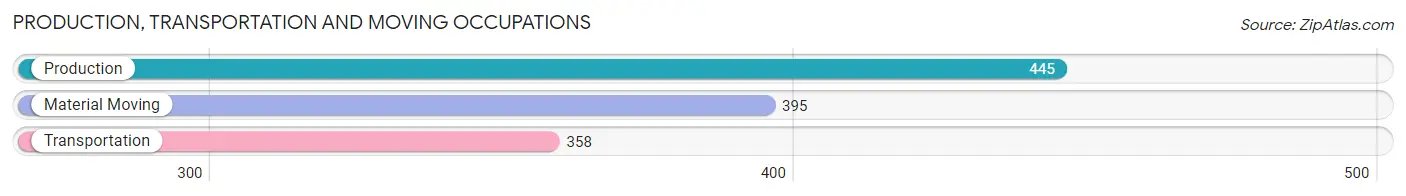
Production, Transportation and Moving Occupations by Sex
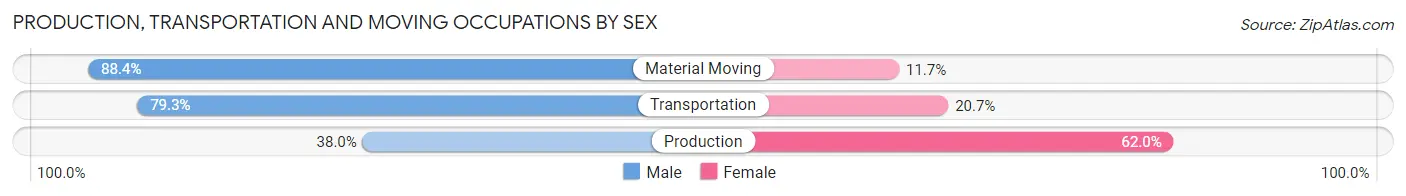
| Occupation | Male | Female |
| Production | 169 (38.0%) | 276 (62.0%) |
| Transportation | 284 (79.3%) | 74 (20.7%) |
| Material Moving | 349 (88.3%) | 46 (11.7%) |
| Total (Category) | 802 (66.9%) | 396 (33.1%) |
| Total (Overall) | 4,135 (49.6%) | 4,202 (50.4%) |
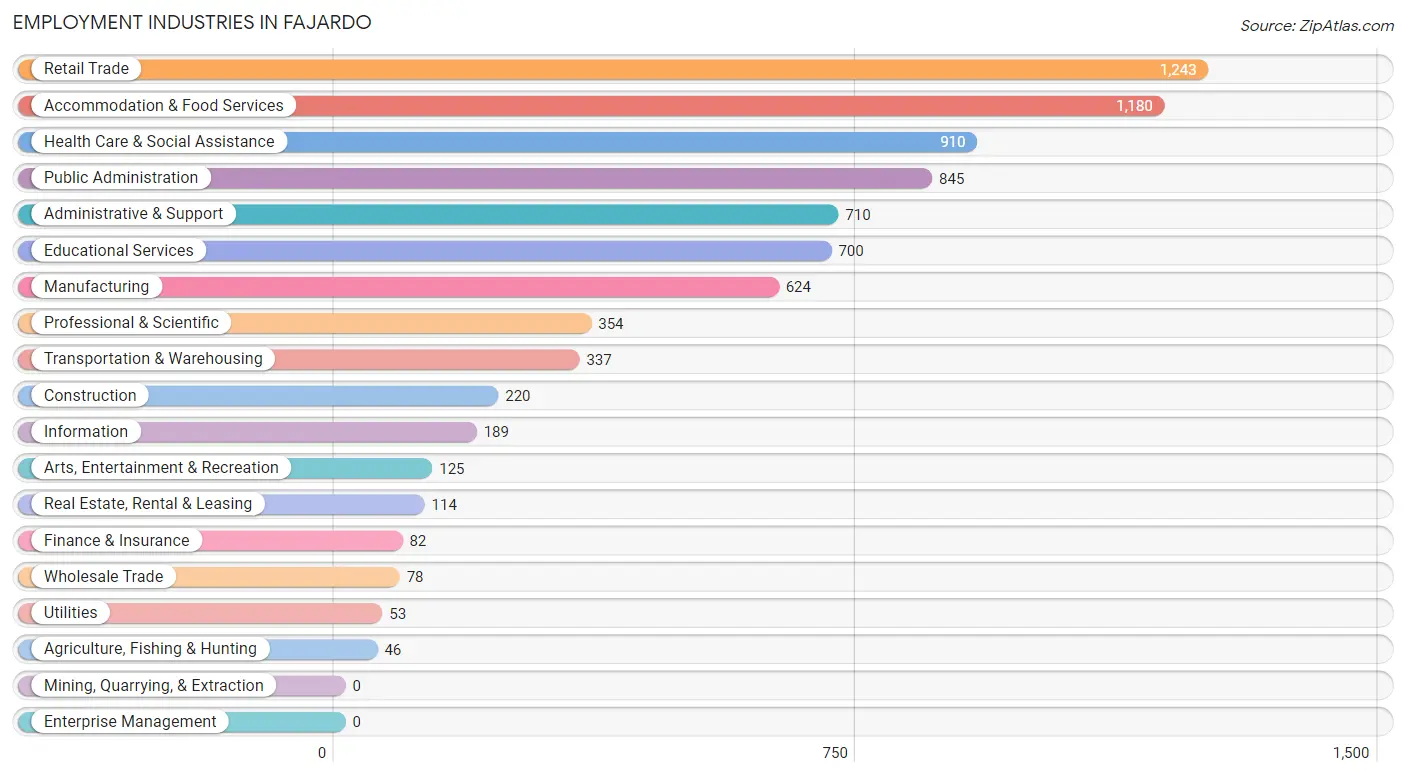
Employment Industries by Sex in Fajardo
Employment Industries in Fajardo
The major employment industries in Fajardo include Retail Trade (1,243 | 14.9%), Accommodation & Food Services (1,180 | 14.1%), Health Care & Social Assistance (910 | 10.9%), Public Administration (845 | 10.1%), and Administrative & Support (710 | 8.5%).
Employment Industries by Sex in Fajardo
The Fajardo industries that see more men than women are Agriculture, Fishing & Hunting (100.0%), Construction (100.0%), and Utilities (100.0%), whereas the industries that tend to have a higher number of women are Information (82.0%), Health Care & Social Assistance (81.9%), and Educational Services (78.3%).
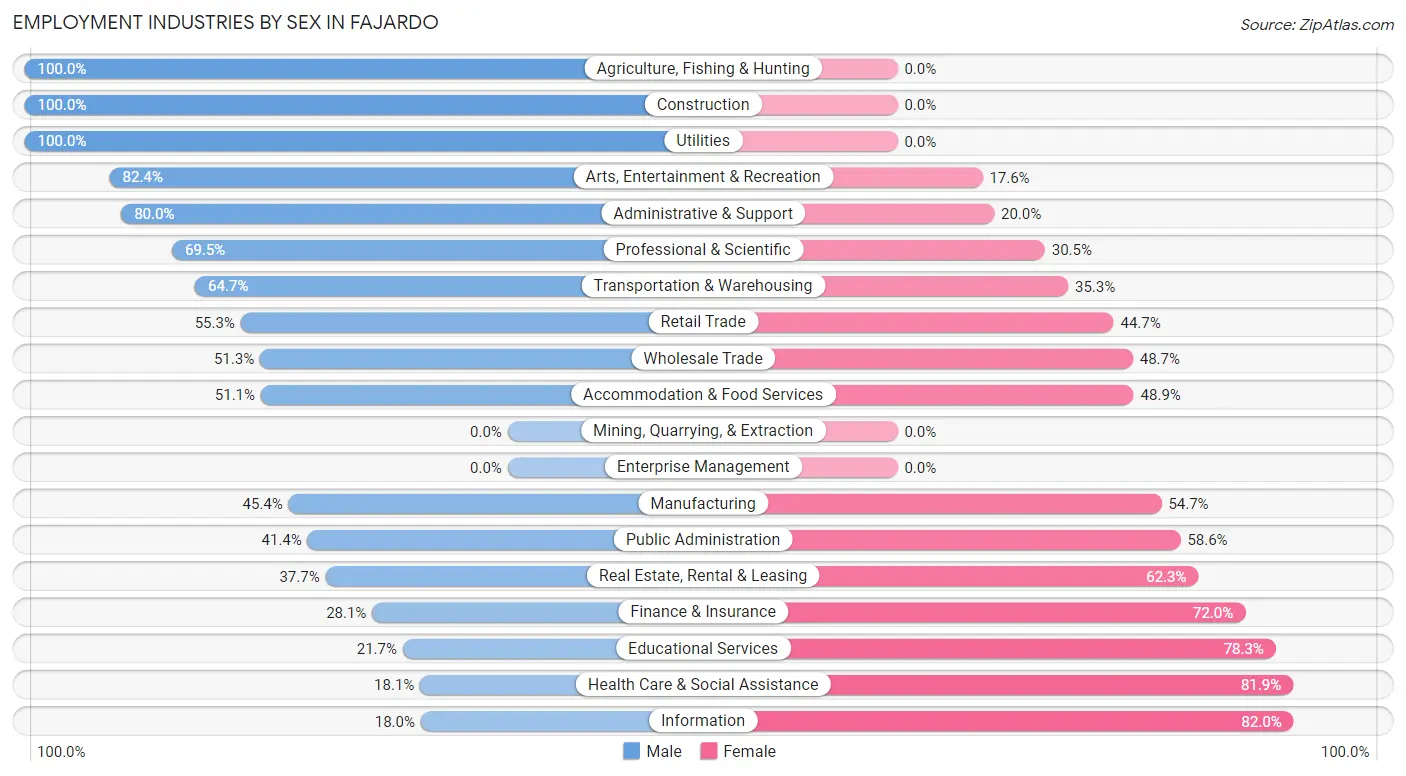
| Industry | Male | Female |
| Agriculture, Fishing & Hunting | 46 (100.0%) | 0 (0.0%) |
| Mining, Quarrying, & Extraction | 0 (0.0%) | 0 (0.0%) |
| Construction | 220 (100.0%) | 0 (0.0%) |
| Manufacturing | 283 (45.4%) | 341 (54.6%) |
| Wholesale Trade | 40 (51.3%) | 38 (48.7%) |
| Retail Trade | 687 (55.3%) | 556 (44.7%) |
| Transportation & Warehousing | 218 (64.7%) | 119 (35.3%) |
| Utilities | 53 (100.0%) | 0 (0.0%) |
| Information | 34 (18.0%) | 155 (82.0%) |
| Finance & Insurance | 23 (28.1%) | 59 (72.0%) |
| Real Estate, Rental & Leasing | 43 (37.7%) | 71 (62.3%) |
| Professional & Scientific | 246 (69.5%) | 108 (30.5%) |
| Enterprise Management | 0 (0.0%) | 0 (0.0%) |
| Administrative & Support | 568 (80.0%) | 142 (20.0%) |
| Educational Services | 152 (21.7%) | 548 (78.3%) |
| Health Care & Social Assistance | 165 (18.1%) | 745 (81.9%) |
| Arts, Entertainment & Recreation | 103 (82.4%) | 22 (17.6%) |
| Accommodation & Food Services | 603 (51.1%) | 577 (48.9%) |
| Public Administration | 350 (41.4%) | 495 (58.6%) |
| Total | 4,135 (49.6%) | 4,202 (50.4%) |
Education in Fajardo
School Enrollment in Fajardo
The most common levels of schooling among the 5,586 students in Fajardo are high school (1,364 | 24.4%), college / undergraduate (1,159 | 20.7%), and elementary school (1,151 | 20.6%).
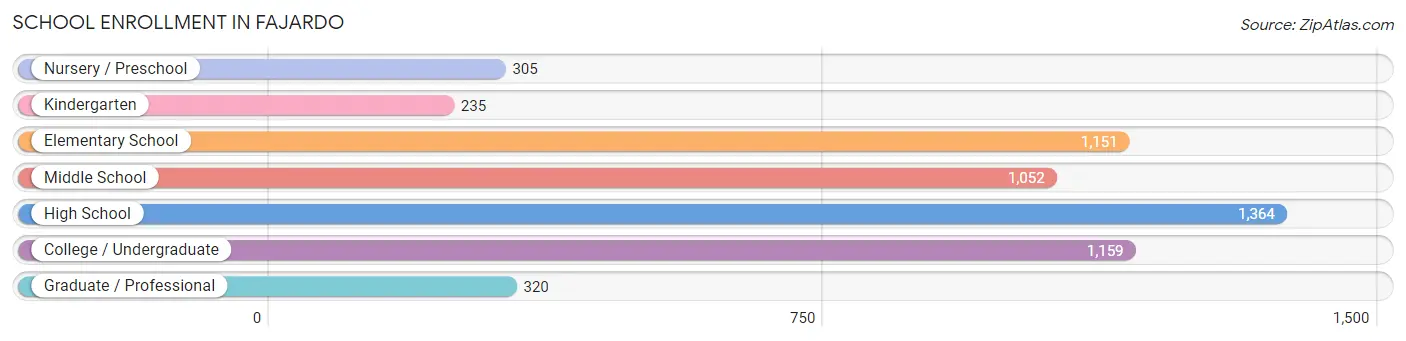
| School Level | # Students | % Students |
| Nursery / Preschool | 305 | 5.5% |
| Kindergarten | 235 | 4.2% |
| Elementary School | 1,151 | 20.6% |
| Middle School | 1,052 | 18.8% |
| High School | 1,364 | 24.4% |
| College / Undergraduate | 1,159 | 20.7% |
| Graduate / Professional | 320 | 5.7% |
| Total | 5,586 | 100.0% |
School Enrollment by Age by Funding Source in Fajardo
Out of a total of 5,586 students who are enrolled in schools in Fajardo, 2,056 (36.8%) attend a private institution, while the remaining 3,530 (63.2%) are enrolled in public schools. The age group of 20 to 24 year olds has the highest likelihood of being enrolled in private schools, with 521 (77.2% in the age bracket) enrolled. Conversely, the age group of 5 to 9 year old has the lowest likelihood of being enrolled in a private school, with 1,026 (79.5% in the age bracket) attending a public institution.
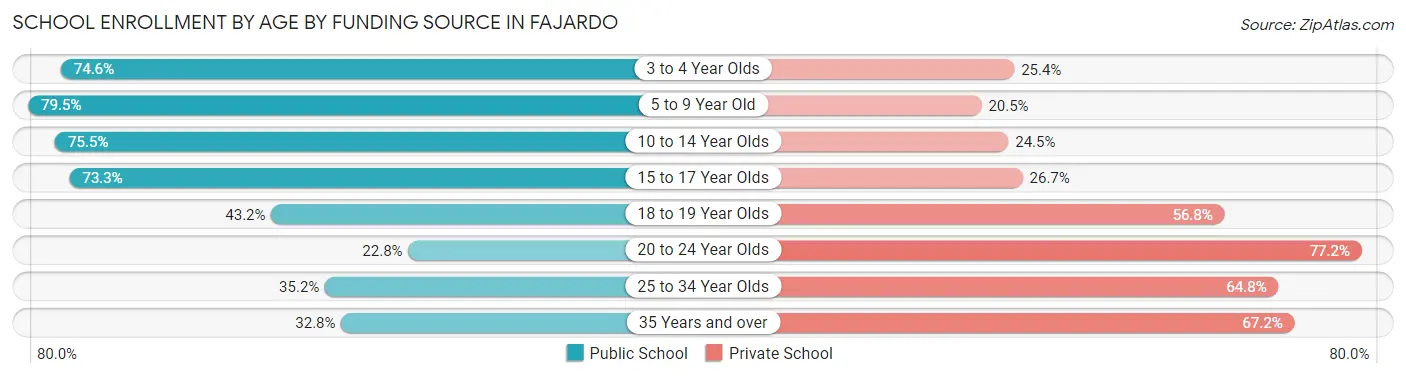
| Age Bracket | Public School | Private School |
| 3 to 4 Year Olds | 226 (74.6%) | 77 (25.4%) |
| 5 to 9 Year Old | 1,026 (79.5%) | 265 (20.5%) |
| 10 to 14 Year Olds | 1,095 (75.5%) | 356 (24.5%) |
| 15 to 17 Year Olds | 663 (73.3%) | 241 (26.7%) |
| 18 to 19 Year Olds | 182 (43.2%) | 239 (56.8%) |
| 20 to 24 Year Olds | 154 (22.8%) | 521 (77.2%) |
| 25 to 34 Year Olds | 125 (35.2%) | 230 (64.8%) |
| 35 Years and over | 61 (32.8%) | 125 (67.2%) |
| Total | 3,530 (63.2%) | 2,056 (36.8%) |
Educational Attainment by Field of Study in Fajardo
Business (1,530 | 26.6%), education (1,187 | 20.7%), science & technology (565 | 9.8%), arts & humanities (541 | 9.4%), and bio, nature & agricultural (531 | 9.2%) are the most common fields of study among 5,746 individuals in Fajardo who have obtained a bachelor's degree or higher.
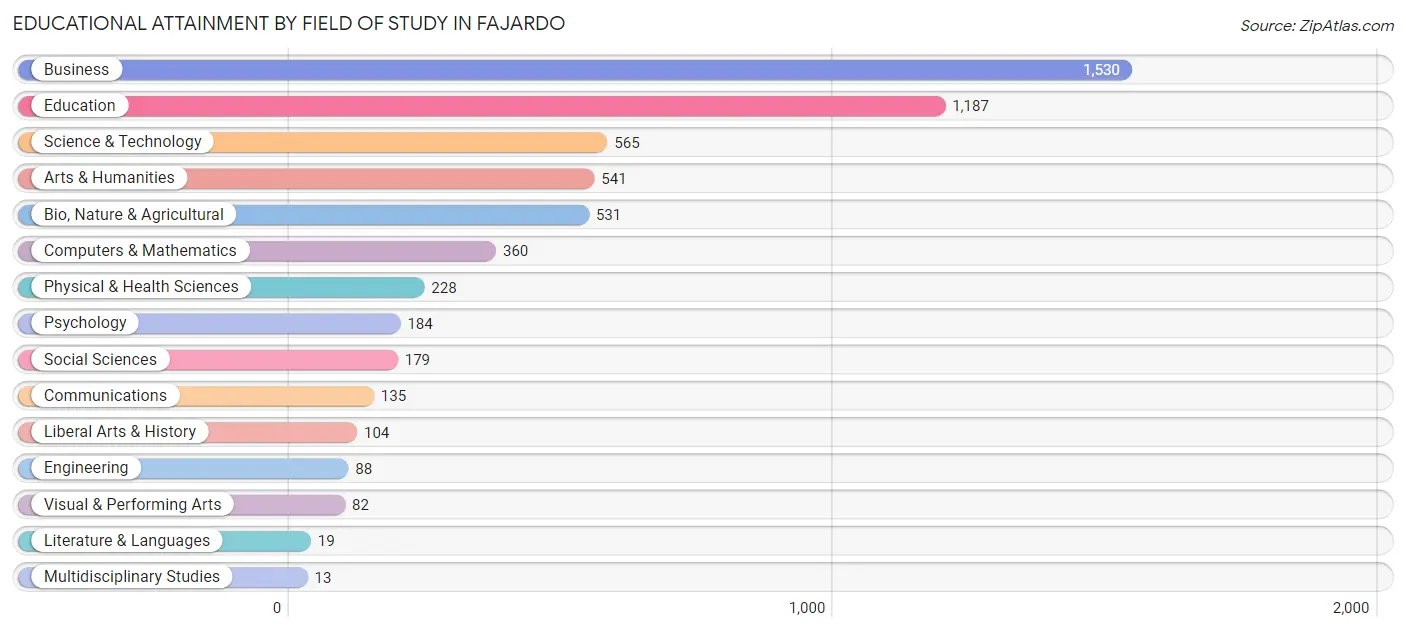
| Field of Study | # Graduates | % Graduates |
| Computers & Mathematics | 360 | 6.3% |
| Bio, Nature & Agricultural | 531 | 9.2% |
| Physical & Health Sciences | 228 | 4.0% |
| Psychology | 184 | 3.2% |
| Social Sciences | 179 | 3.1% |
| Engineering | 88 | 1.5% |
| Multidisciplinary Studies | 13 | 0.2% |
| Science & Technology | 565 | 9.8% |
| Business | 1,530 | 26.6% |
| Education | 1,187 | 20.7% |
| Literature & Languages | 19 | 0.3% |
| Liberal Arts & History | 104 | 1.8% |
| Visual & Performing Arts | 82 | 1.4% |
| Communications | 135 | 2.4% |
| Arts & Humanities | 541 | 9.4% |
| Total | 5,746 | 100.0% |
Transportation & Commute in Fajardo
Vehicle Availability by Sex in Fajardo
The most prevalent vehicle ownership categories in Fajardo are males with 2 vehicles (1,763, accounting for 44.7%) and females with 2 vehicles (1,601, making up 45.5%).
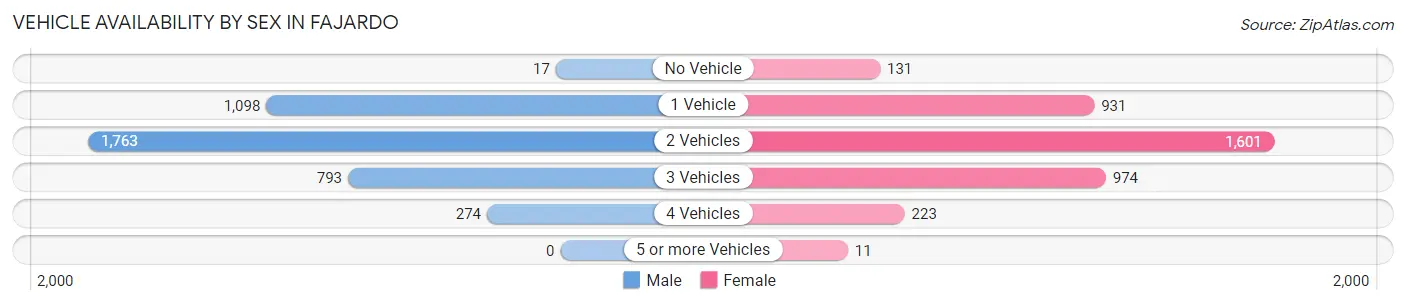
| Vehicles Available | Male | Female |
| No Vehicle | 17 (0.4%) | 131 (3.4%) |
| 1 Vehicle | 1,098 (27.8%) | 931 (24.0%) |
| 2 Vehicles | 1,763 (44.7%) | 1,601 (41.4%) |
| 3 Vehicles | 793 (20.1%) | 974 (25.2%) |
| 4 Vehicles | 274 (7.0%) | 223 (5.8%) |
| 5 or more Vehicles | 0 (0.0%) | 11 (0.3%) |
| Total | 3,945 (100.0%) | 3,871 (100.0%) |
Commute Time in Fajardo
The most frequently occuring commute durations in Fajardo are 15 to 19 minutes (1,552 commuters, 21.5%), 10 to 14 minutes (1,085 commuters, 15.0%), and 20 to 24 minutes (891 commuters, 12.3%).
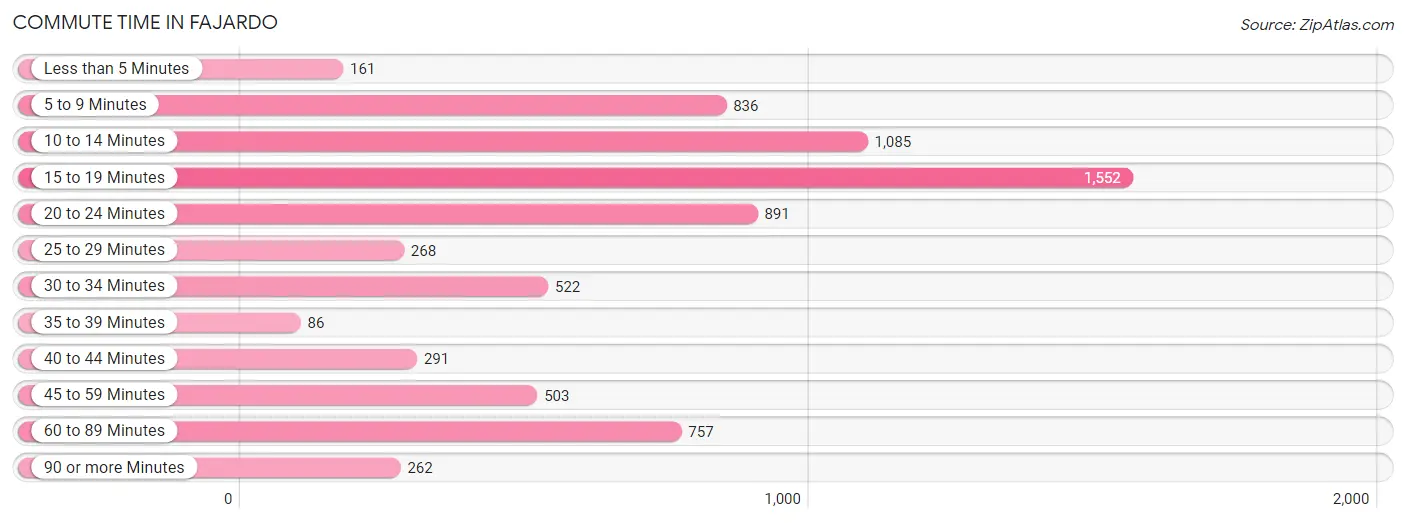
| Commute Time | # Commuters | % Commuters |
| Less than 5 Minutes | 161 | 2.2% |
| 5 to 9 Minutes | 836 | 11.6% |
| 10 to 14 Minutes | 1,085 | 15.0% |
| 15 to 19 Minutes | 1,552 | 21.5% |
| 20 to 24 Minutes | 891 | 12.3% |
| 25 to 29 Minutes | 268 | 3.7% |
| 30 to 34 Minutes | 522 | 7.2% |
| 35 to 39 Minutes | 86 | 1.2% |
| 40 to 44 Minutes | 291 | 4.0% |
| 45 to 59 Minutes | 503 | 7.0% |
| 60 to 89 Minutes | 757 | 10.5% |
| 90 or more Minutes | 262 | 3.6% |
Commute Time by Sex in Fajardo
The most common commute times in Fajardo are 15 to 19 minutes (706 commuters, 19.4%) for males and 15 to 19 minutes (846 commuters, 23.7%) for females.
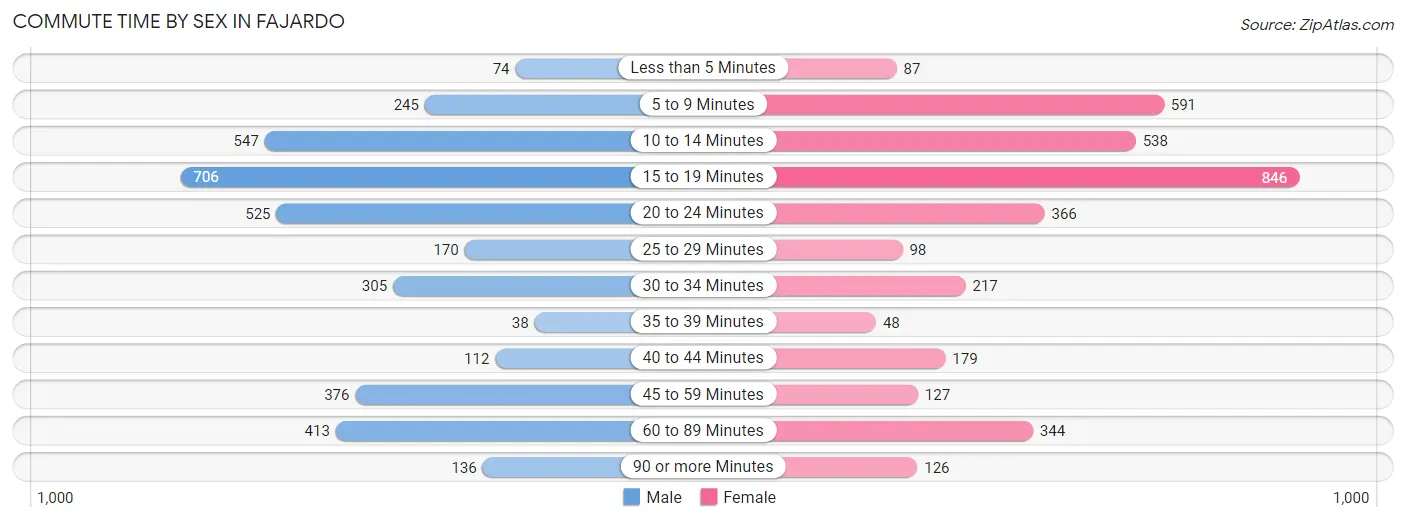
| Commute Time | Male | Female |
| Less than 5 Minutes | 74 (2.0%) | 87 (2.4%) |
| 5 to 9 Minutes | 245 (6.7%) | 591 (16.6%) |
| 10 to 14 Minutes | 547 (15.0%) | 538 (15.1%) |
| 15 to 19 Minutes | 706 (19.4%) | 846 (23.7%) |
| 20 to 24 Minutes | 525 (14.4%) | 366 (10.3%) |
| 25 to 29 Minutes | 170 (4.7%) | 98 (2.8%) |
| 30 to 34 Minutes | 305 (8.4%) | 217 (6.1%) |
| 35 to 39 Minutes | 38 (1.0%) | 48 (1.3%) |
| 40 to 44 Minutes | 112 (3.1%) | 179 (5.0%) |
| 45 to 59 Minutes | 376 (10.3%) | 127 (3.6%) |
| 60 to 89 Minutes | 413 (11.3%) | 344 (9.6%) |
| 90 or more Minutes | 136 (3.7%) | 126 (3.5%) |
Time of Departure to Work by Sex in Fajardo
The most frequent times of departure to work in Fajardo are 7:30 AM to 7:59 AM (522, 14.3%) for males and 7:30 AM to 7:59 AM (564, 15.8%) for females.
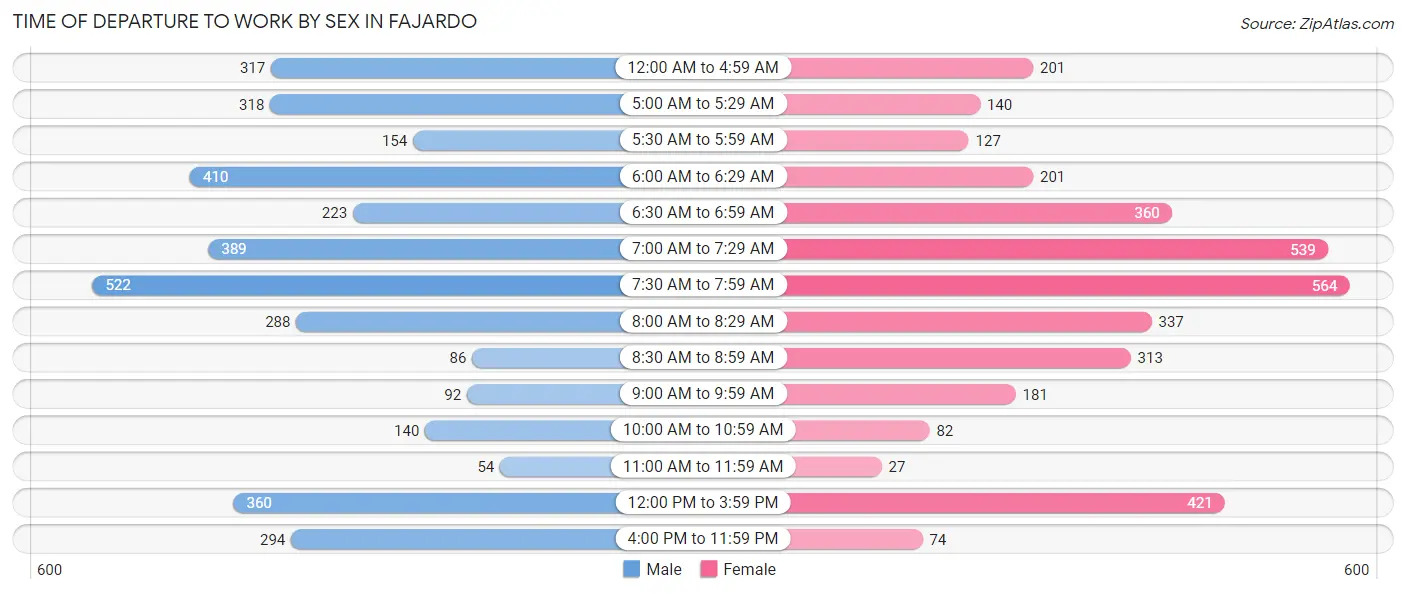
| Time of Departure | Male | Female |
| 12:00 AM to 4:59 AM | 317 (8.7%) | 201 (5.6%) |
| 5:00 AM to 5:29 AM | 318 (8.7%) | 140 (3.9%) |
| 5:30 AM to 5:59 AM | 154 (4.2%) | 127 (3.6%) |
| 6:00 AM to 6:29 AM | 410 (11.2%) | 201 (5.6%) |
| 6:30 AM to 6:59 AM | 223 (6.1%) | 360 (10.1%) |
| 7:00 AM to 7:29 AM | 389 (10.7%) | 539 (15.1%) |
| 7:30 AM to 7:59 AM | 522 (14.3%) | 564 (15.8%) |
| 8:00 AM to 8:29 AM | 288 (7.9%) | 337 (9.5%) |
| 8:30 AM to 8:59 AM | 86 (2.4%) | 313 (8.8%) |
| 9:00 AM to 9:59 AM | 92 (2.5%) | 181 (5.1%) |
| 10:00 AM to 10:59 AM | 140 (3.8%) | 82 (2.3%) |
| 11:00 AM to 11:59 AM | 54 (1.5%) | 27 (0.8%) |
| 12:00 PM to 3:59 PM | 360 (9.9%) | 421 (11.8%) |
| 4:00 PM to 11:59 PM | 294 (8.1%) | 74 (2.1%) |
| Total | 3,647 (100.0%) | 3,567 (100.0%) |
Housing Occupancy in Fajardo
Occupancy by Ownership in Fajardo
Of the total 10,039 dwellings in Fajardo, owner-occupied units account for 6,832 (68.0%), while renter-occupied units make up 3,207 (32.0%).
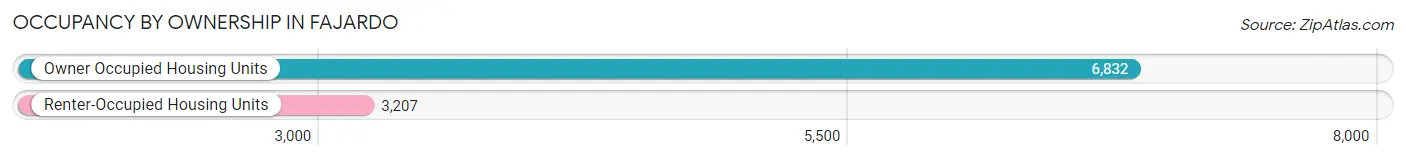
| Occupancy | # Housing Units | % Housing Units |
| Owner Occupied Housing Units | 6,832 | 68.0% |
| Renter-Occupied Housing Units | 3,207 | 32.0% |
| Total Occupied Housing Units | 10,039 | 100.0% |
Occupancy by Household Size in Fajardo
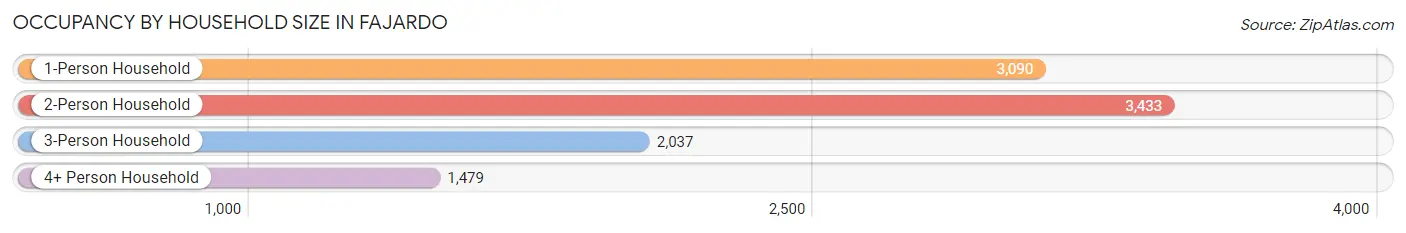
| Household Size | # Housing Units | % Housing Units |
| 1-Person Household | 3,090 | 30.8% |
| 2-Person Household | 3,433 | 34.2% |
| 3-Person Household | 2,037 | 20.3% |
| 4+ Person Household | 1,479 | 14.7% |
| Total Housing Units | 10,039 | 100.0% |
Occupancy by Ownership by Household Size in Fajardo
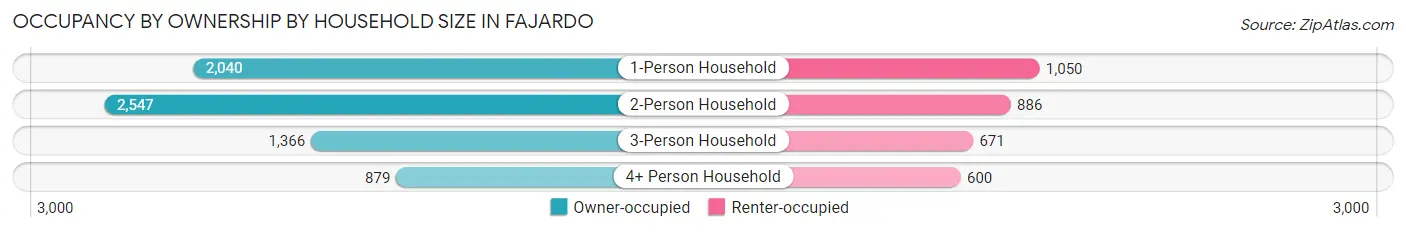
| Household Size | Owner-occupied | Renter-occupied |
| 1-Person Household | 2,040 (66.0%) | 1,050 (34.0%) |
| 2-Person Household | 2,547 (74.2%) | 886 (25.8%) |
| 3-Person Household | 1,366 (67.1%) | 671 (32.9%) |
| 4+ Person Household | 879 (59.4%) | 600 (40.6%) |
| Total Housing Units | 6,832 (68.0%) | 3,207 (32.0%) |
Occupancy by Educational Attainment in Fajardo
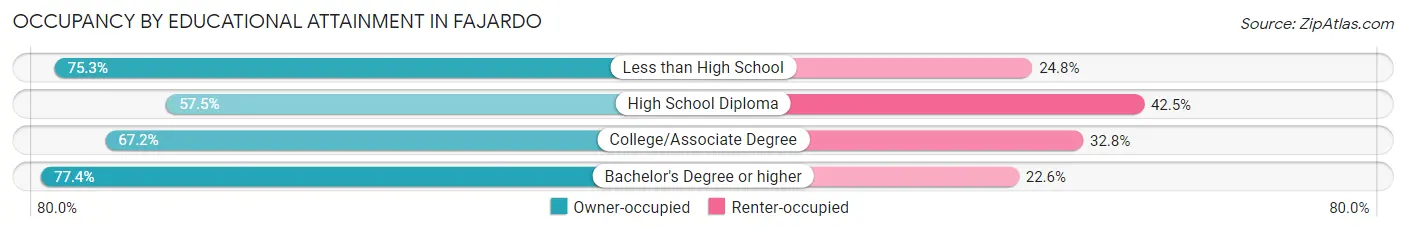
| Household Size | Owner-occupied | Renter-occupied |
| Less than High School | 1,289 (75.2%) | 424 (24.7%) |
| High School Diploma | 1,967 (57.5%) | 1,452 (42.5%) |
| College/Associate Degree | 1,458 (67.2%) | 712 (32.8%) |
| Bachelor's Degree or higher | 2,118 (77.4%) | 619 (22.6%) |
Occupancy by Age of Householder in Fajardo
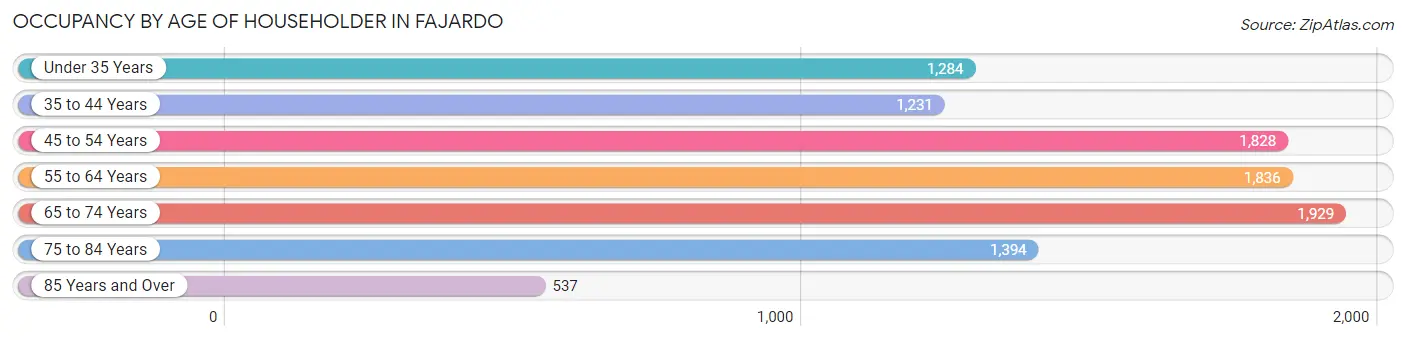
| Age Bracket | # Households | % Households |
| Under 35 Years | 1,284 | 12.8% |
| 35 to 44 Years | 1,231 | 12.3% |
| 45 to 54 Years | 1,828 | 18.2% |
| 55 to 64 Years | 1,836 | 18.3% |
| 65 to 74 Years | 1,929 | 19.2% |
| 75 to 84 Years | 1,394 | 13.9% |
| 85 Years and Over | 537 | 5.3% |
| Total | 10,039 | 100.0% |
Housing Finances in Fajardo
Median Income by Occupancy in Fajardo
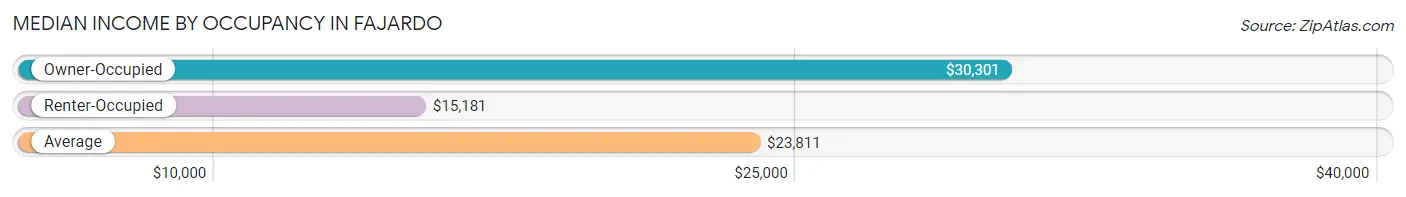
| Occupancy Type | # Households | Median Income |
| Owner-Occupied | 6,832 (68.0%) | $30,301 |
| Renter-Occupied | 3,207 (32.0%) | $15,181 |
| Average | 10,039 (100.0%) | $23,811 |
Occupancy by Householder Income Bracket in Fajardo
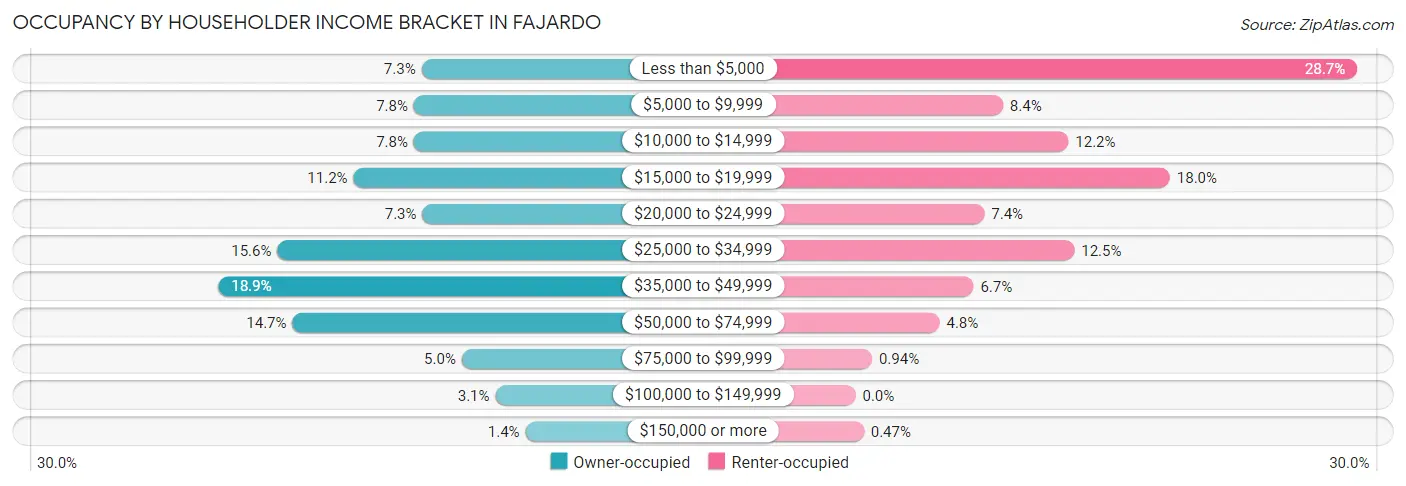
| Income Bracket | Owner-occupied | Renter-occupied |
| Less than $5,000 | 500 (7.3%) | 919 (28.7%) |
| $5,000 to $9,999 | 530 (7.8%) | 270 (8.4%) |
| $10,000 to $14,999 | 530 (7.8%) | 390 (12.2%) |
| $15,000 to $19,999 | 766 (11.2%) | 576 (18.0%) |
| $20,000 to $24,999 | 497 (7.3%) | 236 (7.4%) |
| $25,000 to $34,999 | 1,063 (15.6%) | 401 (12.5%) |
| $35,000 to $49,999 | 1,293 (18.9%) | 216 (6.7%) |
| $50,000 to $74,999 | 1,004 (14.7%) | 154 (4.8%) |
| $75,000 to $99,999 | 343 (5.0%) | 30 (0.9%) |
| $100,000 to $149,999 | 212 (3.1%) | 0 (0.0%) |
| $150,000 or more | 94 (1.4%) | 15 (0.5%) |
| Total | 6,832 (100.0%) | 3,207 (100.0%) |
Monthly Housing Cost Tiers in Fajardo
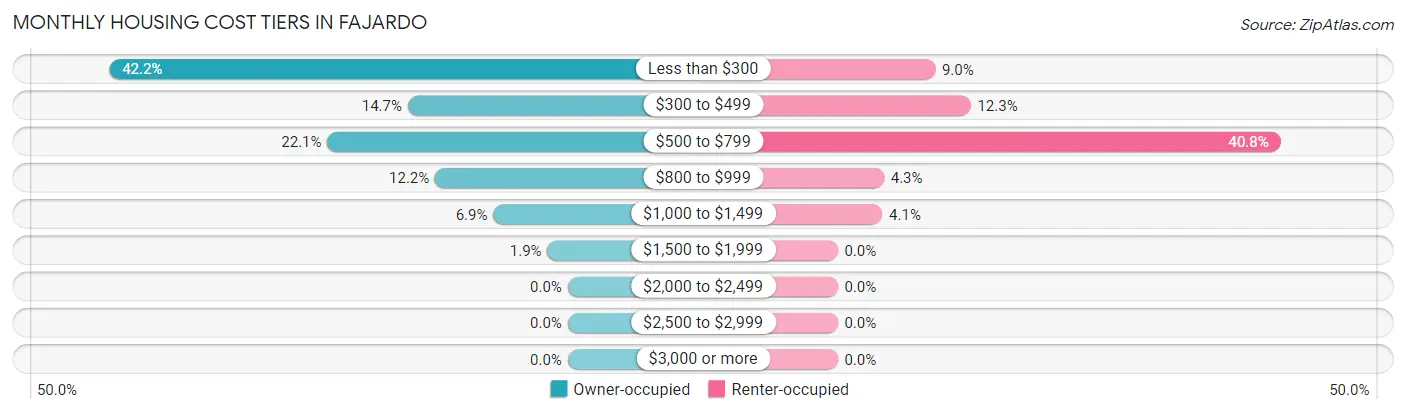
| Monthly Cost | Owner-occupied | Renter-occupied |
| Less than $300 | 2,884 (42.2%) | 288 (9.0%) |
| $300 to $499 | 1,006 (14.7%) | 393 (12.2%) |
| $500 to $799 | 1,512 (22.1%) | 1,308 (40.8%) |
| $800 to $999 | 834 (12.2%) | 137 (4.3%) |
| $1,000 to $1,499 | 468 (6.9%) | 132 (4.1%) |
| $1,500 to $1,999 | 128 (1.9%) | 0 (0.0%) |
| $2,000 to $2,499 | 0 (0.0%) | 0 (0.0%) |
| $2,500 to $2,999 | 0 (0.0%) | 0 (0.0%) |
| $3,000 or more | 0 (0.0%) | 0 (0.0%) |
| Total | 6,832 (100.0%) | 3,207 (100.0%) |
Physical Housing Characteristics in Fajardo
Housing Structures in Fajardo
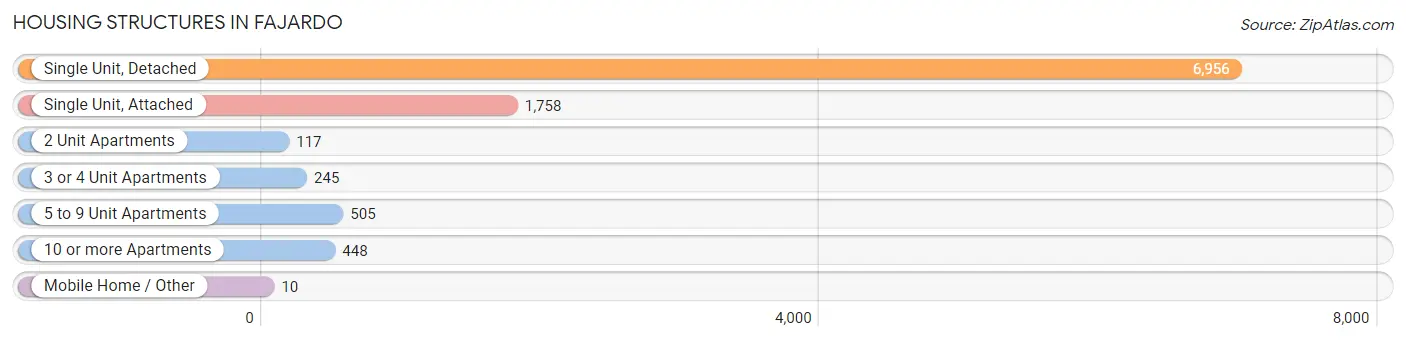
| Structure Type | # Housing Units | % Housing Units |
| Single Unit, Detached | 6,956 | 69.3% |
| Single Unit, Attached | 1,758 | 17.5% |
| 2 Unit Apartments | 117 | 1.2% |
| 3 or 4 Unit Apartments | 245 | 2.4% |
| 5 to 9 Unit Apartments | 505 | 5.0% |
| 10 or more Apartments | 448 | 4.5% |
| Mobile Home / Other | 10 | 0.1% |
| Total | 10,039 | 100.0% |
Housing Structures by Occupancy in Fajardo
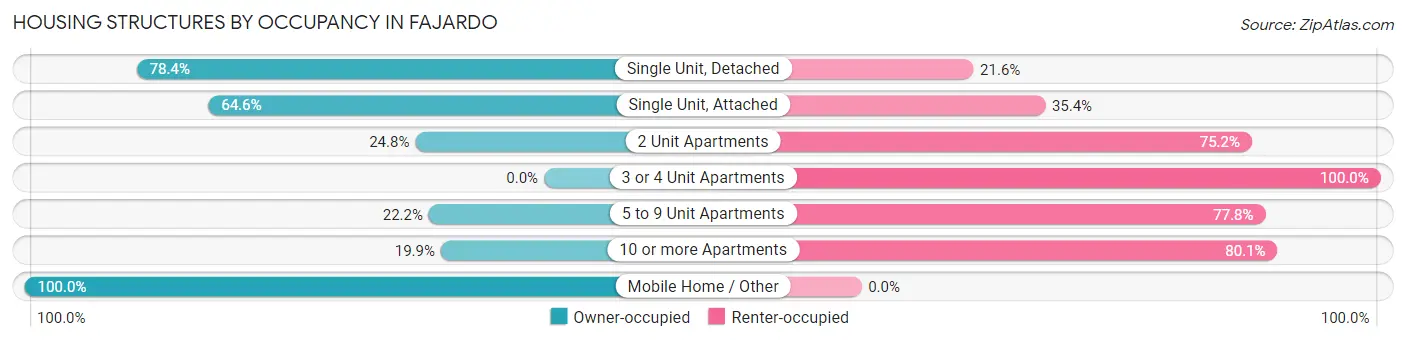
| Structure Type | Owner-occupied | Renter-occupied |
| Single Unit, Detached | 5,456 (78.4%) | 1,500 (21.6%) |
| Single Unit, Attached | 1,136 (64.6%) | 622 (35.4%) |
| 2 Unit Apartments | 29 (24.8%) | 88 (75.2%) |
| 3 or 4 Unit Apartments | 0 (0.0%) | 245 (100.0%) |
| 5 to 9 Unit Apartments | 112 (22.2%) | 393 (77.8%) |
| 10 or more Apartments | 89 (19.9%) | 359 (80.1%) |
| Mobile Home / Other | 10 (100.0%) | 0 (0.0%) |
| Total | 6,832 (68.0%) | 3,207 (32.0%) |
Housing Structures by Number of Rooms in Fajardo
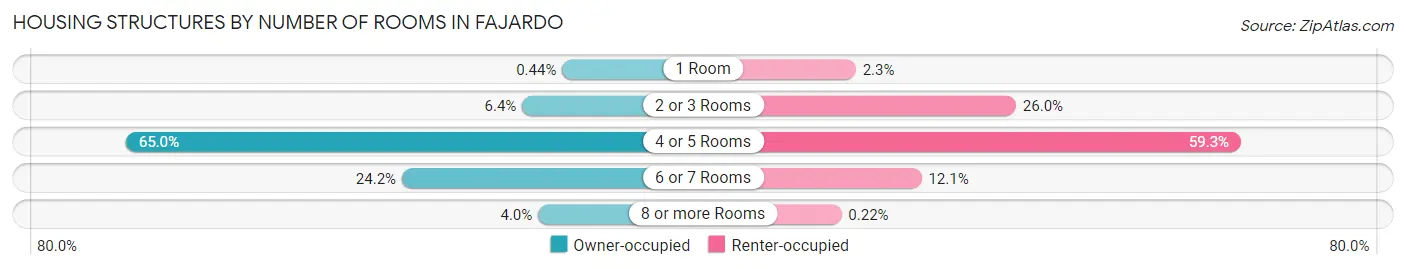
| Number of Rooms | Owner-occupied | Renter-occupied |
| 1 Room | 30 (0.4%) | 75 (2.3%) |
| 2 or 3 Rooms | 435 (6.4%) | 835 (26.0%) |
| 4 or 5 Rooms | 4,442 (65.0%) | 1,903 (59.3%) |
| 6 or 7 Rooms | 1,651 (24.2%) | 387 (12.1%) |
| 8 or more Rooms | 274 (4.0%) | 7 (0.2%) |
| Total | 6,832 (100.0%) | 3,207 (100.0%) |
Housing Structure by Heating Type in Fajardo
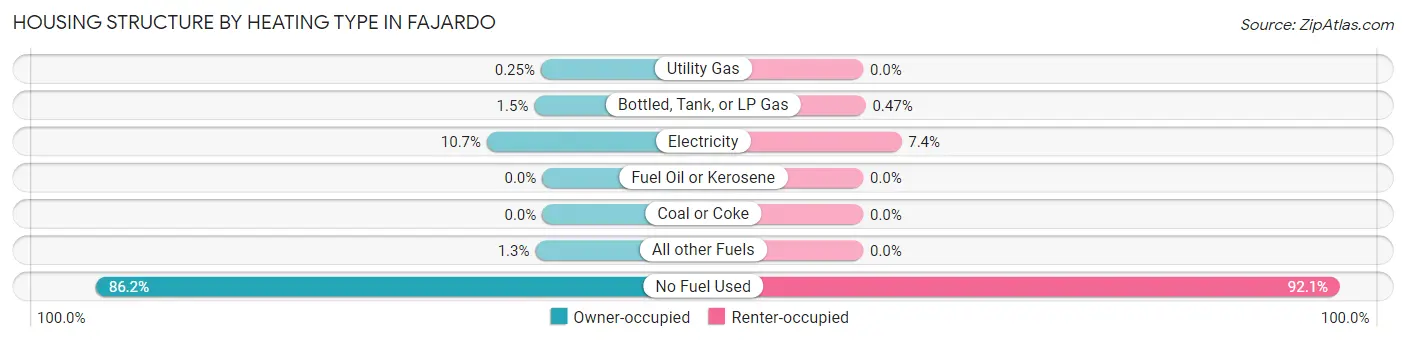
| Heating Type | Owner-occupied | Renter-occupied |
| Utility Gas | 17 (0.3%) | 0 (0.0%) |
| Bottled, Tank, or LP Gas | 104 (1.5%) | 15 (0.5%) |
| Electricity | 729 (10.7%) | 237 (7.4%) |
| Fuel Oil or Kerosene | 0 (0.0%) | 0 (0.0%) |
| Coal or Coke | 0 (0.0%) | 0 (0.0%) |
| All other Fuels | 90 (1.3%) | 0 (0.0%) |
| No Fuel Used | 5,892 (86.2%) | 2,955 (92.1%) |
| Total | 6,832 (100.0%) | 3,207 (100.0%) |
Household Vehicle Usage in Fajardo
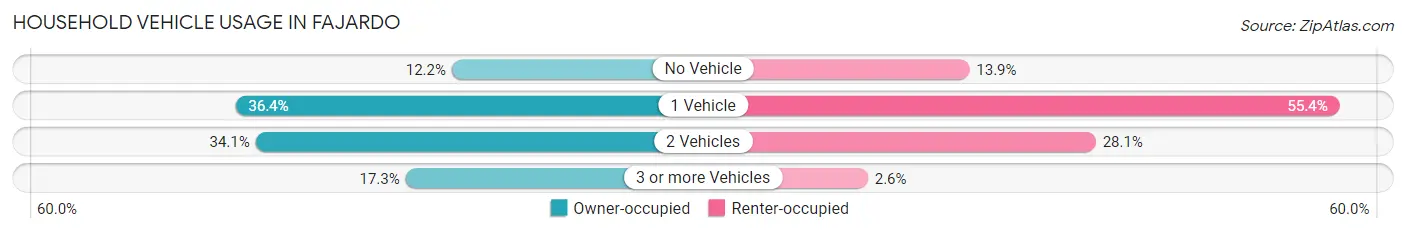
| Vehicles per Household | Owner-occupied | Renter-occupied |
| No Vehicle | 830 (12.1%) | 447 (13.9%) |
| 1 Vehicle | 2,486 (36.4%) | 1,777 (55.4%) |
| 2 Vehicles | 2,332 (34.1%) | 901 (28.1%) |
| 3 or more Vehicles | 1,184 (17.3%) | 82 (2.6%) |
| Total | 6,832 (100.0%) | 3,207 (100.0%) |
Real Estate & Mortgages in Fajardo
Real Estate and Mortgage Overview in Fajardo
| Characteristic | Without Mortgage | With Mortgage |
| Housing Units | 3,799 | 3,033 |
| Median Property Value | $107,300 | $119,400 |
| Median Household Income | $26,287 | $32 |
| Monthly Housing Costs | $188 | $0 |
| Real Estate Taxes | $691 | $2,724 |
Property Value by Mortgage Status in Fajardo
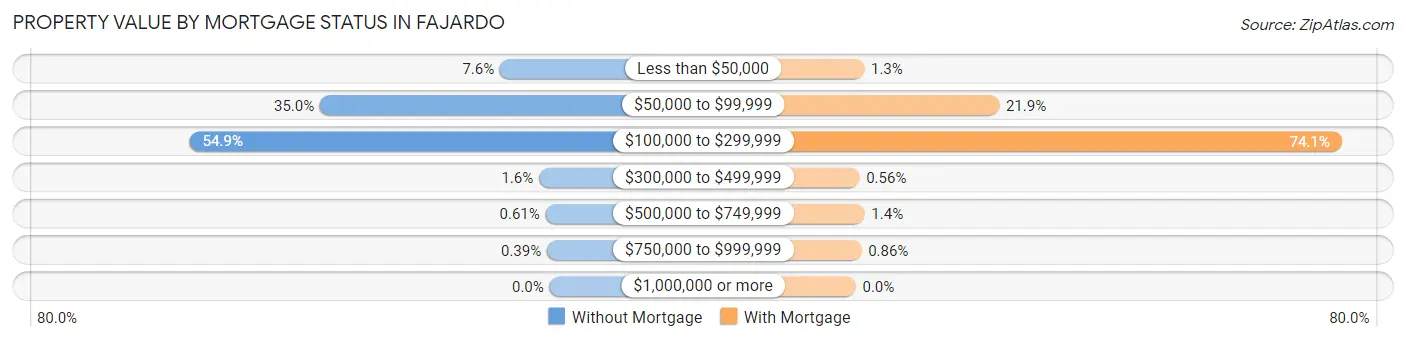
| Property Value | Without Mortgage | With Mortgage |
| Less than $50,000 | 287 (7.5%) | 39 (1.3%) |
| $50,000 to $99,999 | 1,329 (35.0%) | 663 (21.9%) |
| $100,000 to $299,999 | 2,084 (54.9%) | 2,247 (74.1%) |
| $300,000 to $499,999 | 61 (1.6%) | 17 (0.6%) |
| $500,000 to $749,999 | 23 (0.6%) | 41 (1.3%) |
| $750,000 to $999,999 | 15 (0.4%) | 26 (0.9%) |
| $1,000,000 or more | 0 (0.0%) | 0 (0.0%) |
| Total | 3,799 (100.0%) | 3,033 (100.0%) |
Household Income by Mortgage Status in Fajardo
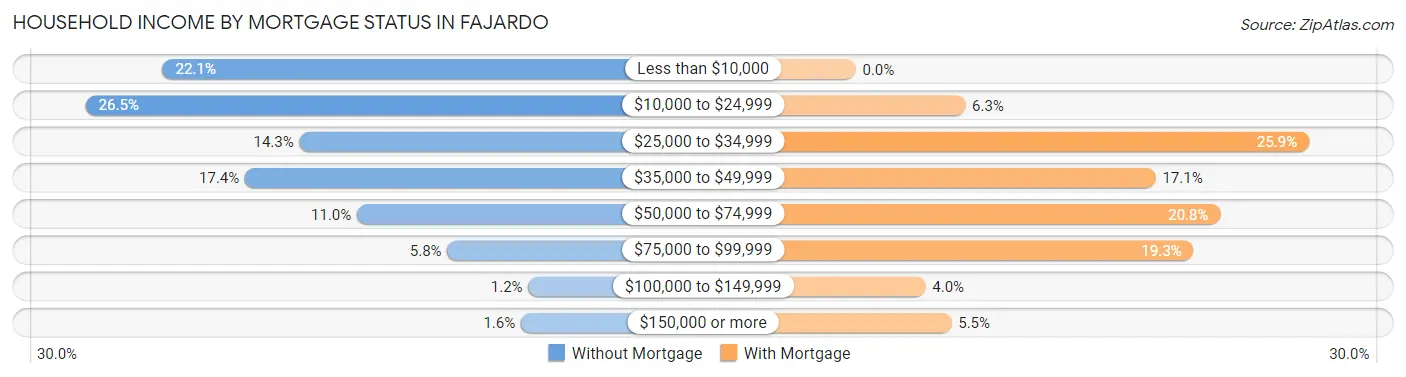
| Household Income | Without Mortgage | With Mortgage |
| Less than $10,000 | 840 (22.1%) | 0 (0.0%) |
| $10,000 to $24,999 | 1,007 (26.5%) | 190 (6.3%) |
| $25,000 to $34,999 | 543 (14.3%) | 786 (25.9%) |
| $35,000 to $49,999 | 661 (17.4%) | 520 (17.1%) |
| $50,000 to $74,999 | 418 (11.0%) | 632 (20.8%) |
| $75,000 to $99,999 | 222 (5.8%) | 586 (19.3%) |
| $100,000 to $149,999 | 46 (1.2%) | 121 (4.0%) |
| $150,000 or more | 62 (1.6%) | 166 (5.5%) |
| Total | 3,799 (100.0%) | 3,033 (100.0%) |
Property Value to Household Income Ratio in Fajardo
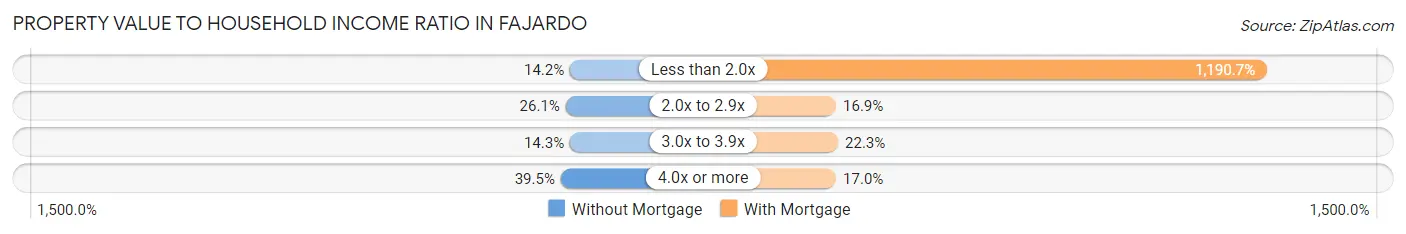
| Value-to-Income Ratio | Without Mortgage | With Mortgage |
| Less than 2.0x | 538 (14.2%) | 36,114 (1,190.7%) |
| 2.0x to 2.9x | 991 (26.1%) | 513 (16.9%) |
| 3.0x to 3.9x | 542 (14.3%) | 676 (22.3%) |
| 4.0x or more | 1,499 (39.5%) | 515 (17.0%) |
| Total | 3,799 (100.0%) | 3,033 (100.0%) |
Real Estate Taxes by Mortgage Status in Fajardo
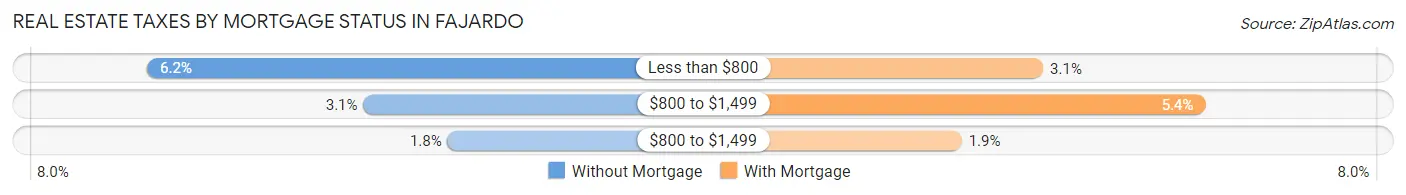
| Property Taxes | Without Mortgage | With Mortgage |
| Less than $800 | 236 (6.2%) | 93 (3.1%) |
| $800 to $1,499 | 116 (3.0%) | 165 (5.4%) |
| $800 to $1,499 | 69 (1.8%) | 57 (1.9%) |
| Total | 3,799 (100.0%) | 3,033 (100.0%) |
Health & Disability in Fajardo
Health Insurance Coverage by Age in Fajardo
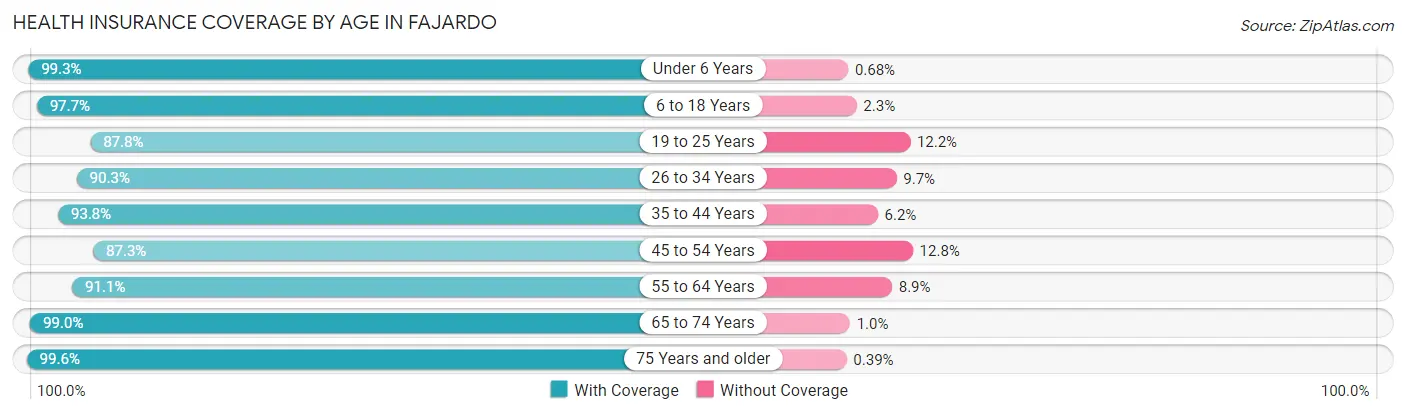
| Age Bracket | With Coverage | Without Coverage |
| Under 6 Years | 1,308 (99.3%) | 9 (0.7%) |
| 6 to 18 Years | 3,841 (97.7%) | 89 (2.3%) |
| 19 to 25 Years | 1,871 (87.8%) | 261 (12.2%) |
| 26 to 34 Years | 2,875 (90.3%) | 309 (9.7%) |
| 35 to 44 Years | 2,463 (93.8%) | 163 (6.2%) |
| 45 to 54 Years | 2,909 (87.3%) | 425 (12.8%) |
| 55 to 64 Years | 2,737 (91.1%) | 266 (8.9%) |
| 65 to 74 Years | 2,839 (99.0%) | 29 (1.0%) |
| 75 Years and older | 3,059 (99.6%) | 12 (0.4%) |
| Total | 23,902 (93.9%) | 1,563 (6.1%) |
Health Insurance Coverage by Citizenship Status in Fajardo
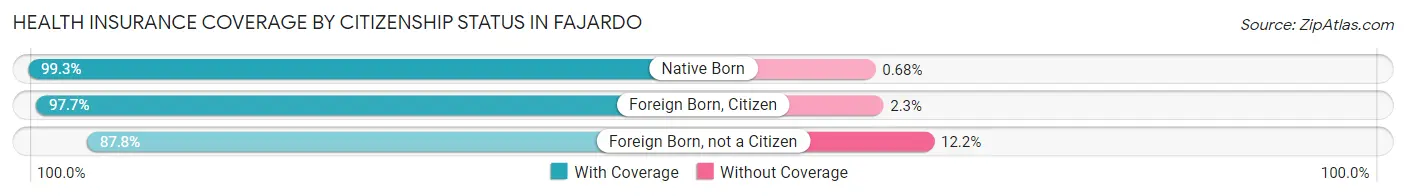
| Citizenship Status | With Coverage | Without Coverage |
| Native Born | 1,308 (99.3%) | 9 (0.7%) |
| Foreign Born, Citizen | 3,841 (97.7%) | 89 (2.3%) |
| Foreign Born, not a Citizen | 1,871 (87.8%) | 261 (12.2%) |
Health Insurance Coverage by Household Income in Fajardo
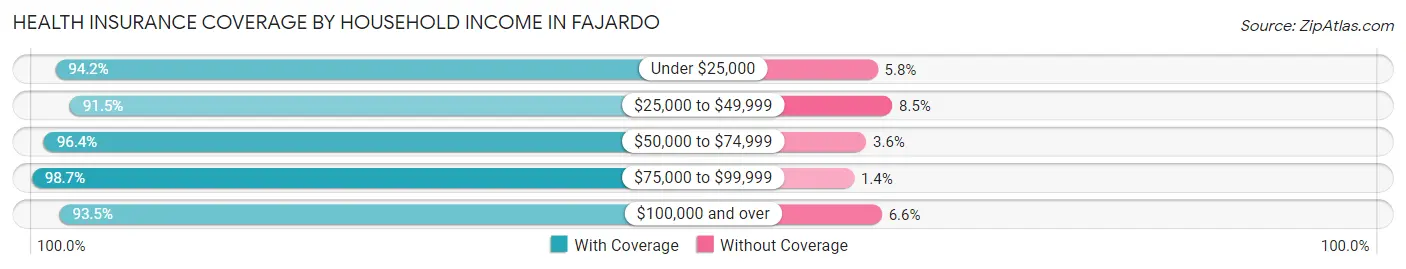
| Household Income | With Coverage | Without Coverage |
| Under $25,000 | 10,410 (94.2%) | 637 (5.8%) |
| $25,000 to $49,999 | 7,499 (91.5%) | 696 (8.5%) |
| $50,000 to $74,999 | 3,569 (96.4%) | 134 (3.6%) |
| $75,000 to $99,999 | 1,246 (98.7%) | 17 (1.3%) |
| $100,000 and over | 1,128 (93.4%) | 79 (6.6%) |
Public vs Private Health Insurance Coverage by Age in Fajardo
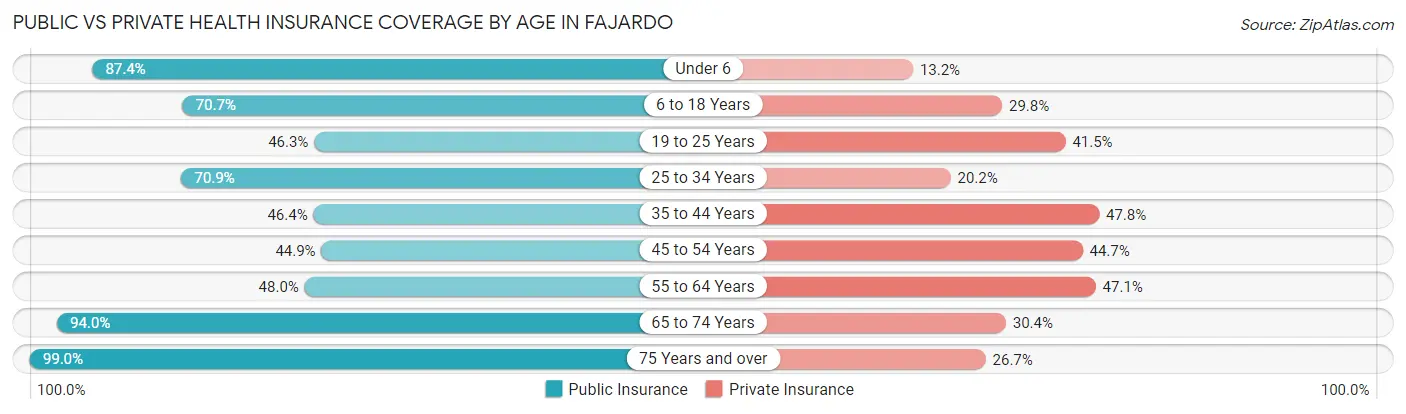
| Age Bracket | Public Insurance | Private Insurance |
| Under 6 | 1,151 (87.4%) | 174 (13.2%) |
| 6 to 18 Years | 2,777 (70.7%) | 1,169 (29.7%) |
| 19 to 25 Years | 986 (46.3%) | 885 (41.5%) |
| 25 to 34 Years | 2,257 (70.9%) | 643 (20.2%) |
| 35 to 44 Years | 1,218 (46.4%) | 1,254 (47.7%) |
| 45 to 54 Years | 1,497 (44.9%) | 1,490 (44.7%) |
| 55 to 64 Years | 1,442 (48.0%) | 1,415 (47.1%) |
| 65 to 74 Years | 2,695 (94.0%) | 873 (30.4%) |
| 75 Years and over | 3,041 (99.0%) | 820 (26.7%) |
| Total | 17,064 (67.0%) | 8,723 (34.3%) |
Disability Status by Sex by Age in Fajardo
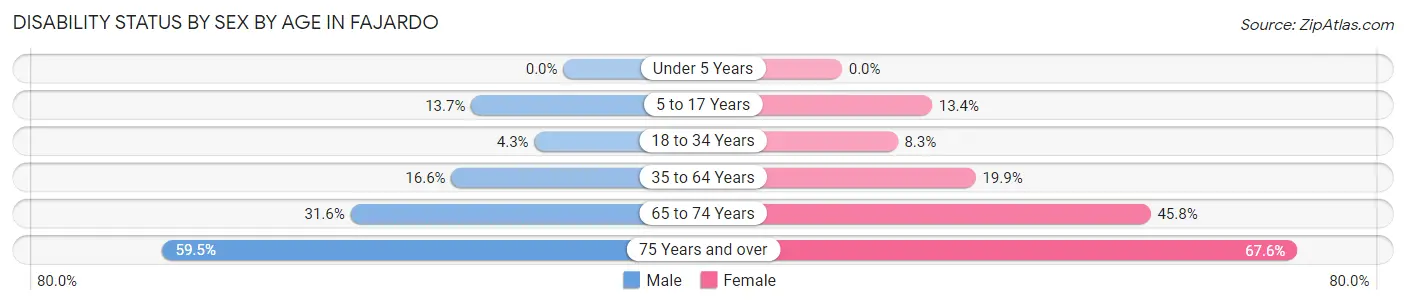
| Age Bracket | Male | Female |
| Under 5 Years | 0 (0.0%) | 0 (0.0%) |
| 5 to 17 Years | 268 (13.7%) | 234 (13.4%) |
| 18 to 34 Years | 116 (4.3%) | 250 (8.3%) |
| 35 to 64 Years | 647 (16.6%) | 1,006 (19.9%) |
| 65 to 74 Years | 412 (31.6%) | 717 (45.8%) |
| 75 Years and over | 701 (59.5%) | 1,280 (67.6%) |
Disability Class by Sex by Age in Fajardo
Disability Class: Hearing Difficulty
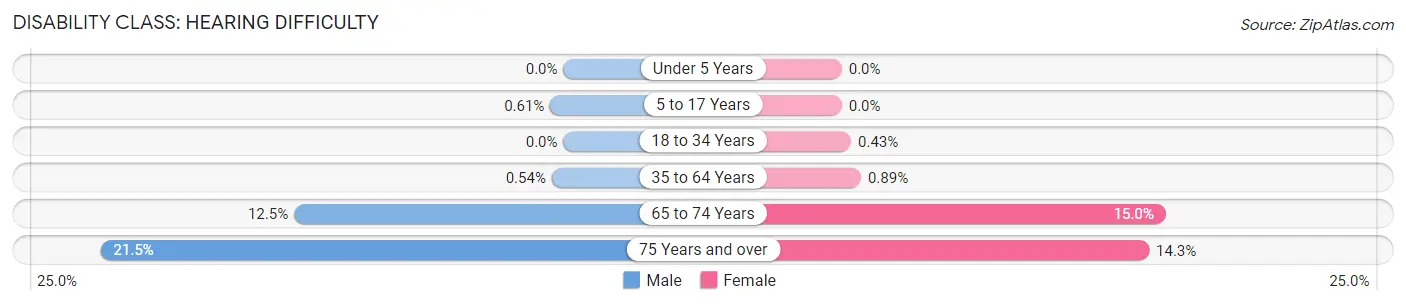
| Age Bracket | Male | Female |
| Under 5 Years | 0 (0.0%) | 0 (0.0%) |
| 5 to 17 Years | 12 (0.6%) | 0 (0.0%) |
| 18 to 34 Years | 0 (0.0%) | 13 (0.4%) |
| 35 to 64 Years | 21 (0.5%) | 45 (0.9%) |
| 65 to 74 Years | 163 (12.5%) | 235 (15.0%) |
| 75 Years and over | 253 (21.5%) | 270 (14.3%) |
Disability Class: Vision Difficulty
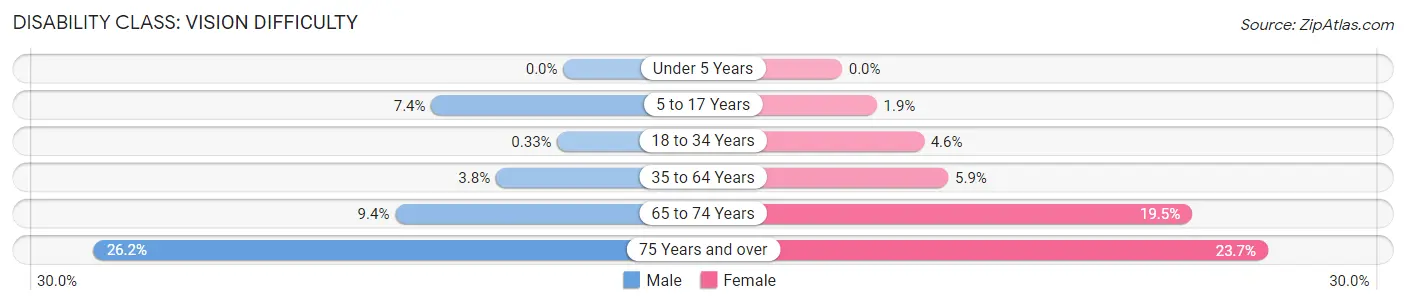
| Age Bracket | Male | Female |
| Under 5 Years | 0 (0.0%) | 0 (0.0%) |
| 5 to 17 Years | 144 (7.3%) | 34 (1.9%) |
| 18 to 34 Years | 9 (0.3%) | 138 (4.6%) |
| 35 to 64 Years | 146 (3.7%) | 300 (5.9%) |
| 65 to 74 Years | 122 (9.4%) | 305 (19.5%) |
| 75 Years and over | 308 (26.2%) | 449 (23.7%) |
Disability Class: Cognitive Difficulty
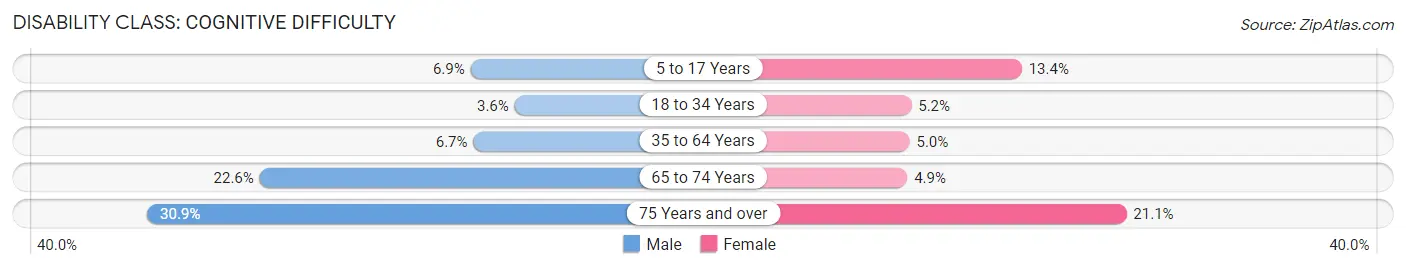
| Age Bracket | Male | Female |
| 5 to 17 Years | 135 (6.9%) | 234 (13.4%) |
| 18 to 34 Years | 98 (3.6%) | 156 (5.2%) |
| 35 to 64 Years | 260 (6.7%) | 255 (5.0%) |
| 65 to 74 Years | 294 (22.6%) | 76 (4.9%) |
| 75 Years and over | 364 (30.9%) | 400 (21.1%) |
Disability Class: Ambulatory Difficulty
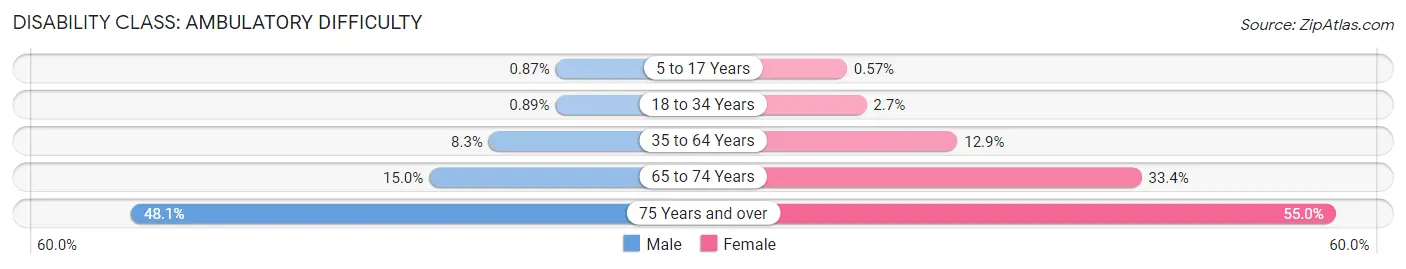
| Age Bracket | Male | Female |
| 5 to 17 Years | 17 (0.9%) | 10 (0.6%) |
| 18 to 34 Years | 24 (0.9%) | 83 (2.7%) |
| 35 to 64 Years | 324 (8.3%) | 652 (12.9%) |
| 65 to 74 Years | 195 (14.9%) | 522 (33.4%) |
| 75 Years and over | 567 (48.1%) | 1,041 (55.0%) |
Disability Class: Self-Care Difficulty
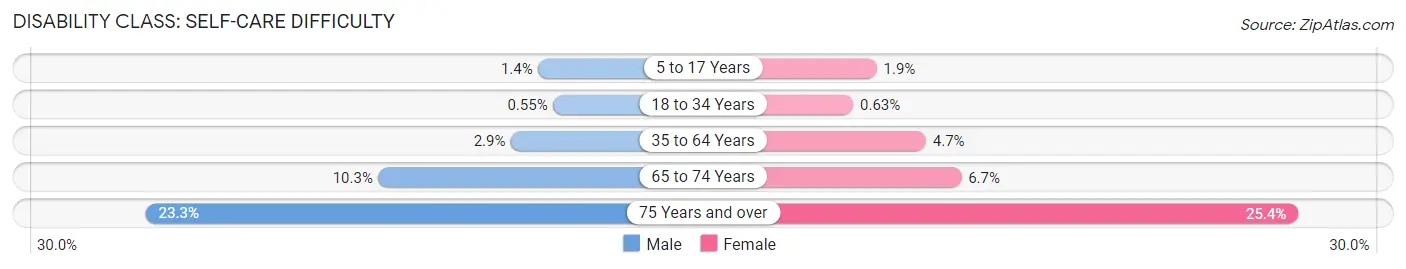
| Age Bracket | Male | Female |
| 5 to 17 Years | 27 (1.4%) | 34 (1.9%) |
| 18 to 34 Years | 15 (0.5%) | 19 (0.6%) |
| 35 to 64 Years | 113 (2.9%) | 237 (4.7%) |
| 65 to 74 Years | 134 (10.3%) | 104 (6.7%) |
| 75 Years and over | 274 (23.3%) | 481 (25.4%) |
Technology Access in Fajardo
Computing Device Access in Fajardo
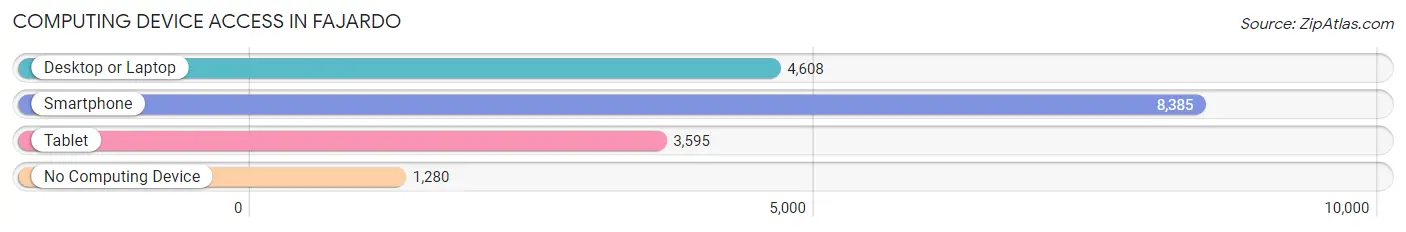
| Device Type | # Households | % Households |
| Desktop or Laptop | 4,608 | 45.9% |
| Smartphone | 8,385 | 83.5% |
| Tablet | 3,595 | 35.8% |
| No Computing Device | 1,280 | 12.8% |
| Total | 10,039 | 100.0% |
Internet Access in Fajardo
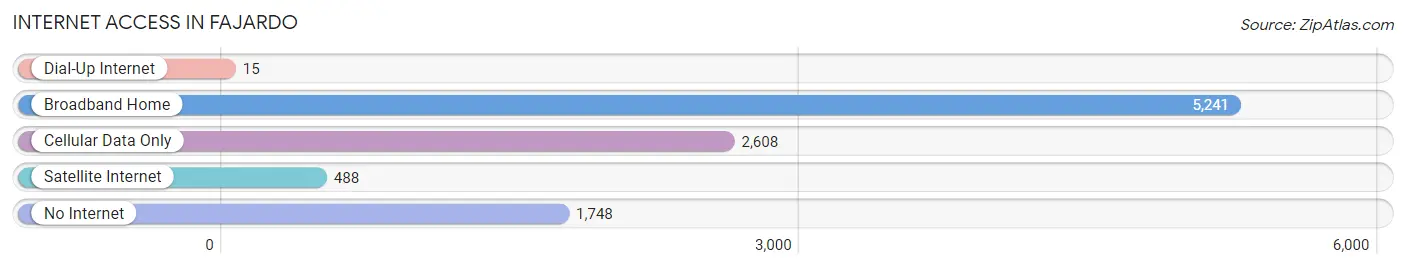
| Internet Type | # Households | % Households |
| Dial-Up Internet | 15 | 0.2% |
| Broadband Home | 5,241 | 52.2% |
| Cellular Data Only | 2,608 | 26.0% |
| Satellite Internet | 488 | 4.9% |
| No Internet | 1,748 | 17.4% |
| Total | 10,039 | 100.0% |
Fajardo Summary
Fajardo, Puerto Rico is a municipality located on the eastern coast of the island of Puerto Rico. It is the capital of the municipality of Fajardo and is located in the northeast corner of the island. The municipality is bordered by the municipalities of Ceiba, Luquillo, and Naguabo. The population of Fajardo was estimated to be 40,845 in 2019.
History
The area of Fajardo was originally inhabited by the Taíno Indians. The first European settlement in the area was established in 1760 by the Spanish. The settlement was named after the Spanish explorer Luis Fajardo. The settlement was destroyed by a hurricane in 1772, but was rebuilt in 1774.
In 1815, Fajardo was declared a municipality by the Spanish government. During the 19th century, the town grew in importance as a port and commercial center. In 1898, Fajardo was occupied by the United States during the Spanish-American War.
Geography
Fajardo is located on the eastern coast of Puerto Rico, in the northeast corner of the island. The municipality covers an area of approximately 44 square miles (114 km2). The terrain is mostly flat, with some hills in the interior. The highest point in the municipality is Cerro La Santa, which has an elevation of 1,065 feet (325 m).
The municipality is bordered by the municipalities of Ceiba, Luquillo, and Naguabo. The municipality is also home to several islands, including Culebra, Vieques, and Palomino.
Economy
The economy of Fajardo is largely based on tourism and fishing. The municipality is home to several resorts and marinas, which attract tourists from around the world. The municipality is also home to several fishing fleets, which provide fresh seafood to the local population.
The municipality is also home to several industrial parks, which are home to several manufacturing and technology companies. The municipality is also home to several pharmaceutical companies, which produce drugs for the local and international markets.
Demographics
As of 2019, the population of Fajardo was estimated to be 40,845. The population is mostly of Puerto Rican descent, with a small minority of African and European descent. The majority of the population is Roman Catholic.
The median household income in Fajardo is $20,845, which is lower than the national average. The unemployment rate in the municipality is 8.2%, which is higher than the national average.
Conclusion
Fajardo, Puerto Rico is a municipality located on the eastern coast of the island of Puerto Rico. It is the capital of the municipality of Fajardo and is bordered by the municipalities of Ceiba, Luquillo, and Naguabo. The population of Fajardo was estimated to be 40,845 in 2019. The economy of Fajardo is largely based on tourism and fishing, and the population is mostly of Puerto Rican descent. The median household income in Fajardo is $20,845, and the unemployment rate is 8.2%.
Common Questions
What is Per Capita Income in Fajardo?
Per Capita income in Fajardo is $14,854.
What is the Median Family Income in Fajardo?
Median Family Income in Fajardo is $27,071.
What is the Median Household income in Fajardo?
Median Household Income in Fajardo is $23,811.
What is Income or Wage Gap in Fajardo?
Income or Wage Gap in Fajardo is 3.4%.
Women in Fajardo earn 96.6 cents for every dollar earned by a man.
What is Family Income Deficit in Fajardo?
Family Income Deficit in Fajardo is $10,723.
Families that are below poverty line in Fajardo earn $10,723 less on average than the poverty threshold level.
What is Inequality or Gini Index in Fajardo?
Inequality or Gini Index in Fajardo is 0.51.
What is the Total Population of Fajardo?
Total Population of Fajardo is 25,573.
What is the Total Male Population of Fajardo?
Total Male Population of Fajardo is 11,683.
What is the Total Female Population of Fajardo?
Total Female Population of Fajardo is 13,890.
What is the Ratio of Males per 100 Females in Fajardo?
There are 84.11 Males per 100 Females in Fajardo.
What is the Ratio of Females per 100 Males in Fajardo?
There are 118.89 Females per 100 Males in Fajardo.
What is the Median Population Age in Fajardo?
Median Population Age in Fajardo is 43.5 Years.
What is the Average Family Size in Fajardo
Average Family Size in Fajardo is 3.1 People.
What is the Average Household Size in Fajardo
Average Household Size in Fajardo is 2.5 People.
How Large is the Labor Force in Fajardo?
There are 10,989 People in the Labor Forcein in Fajardo.
What is the Percentage of People in the Labor Force in Fajardo?
51.6% of People are in the Labor Force in Fajardo.
What is the Unemployment Rate in Fajardo?
Unemployment Rate in Fajardo is 24.0%.