Candelaria, PR Map & Demographics
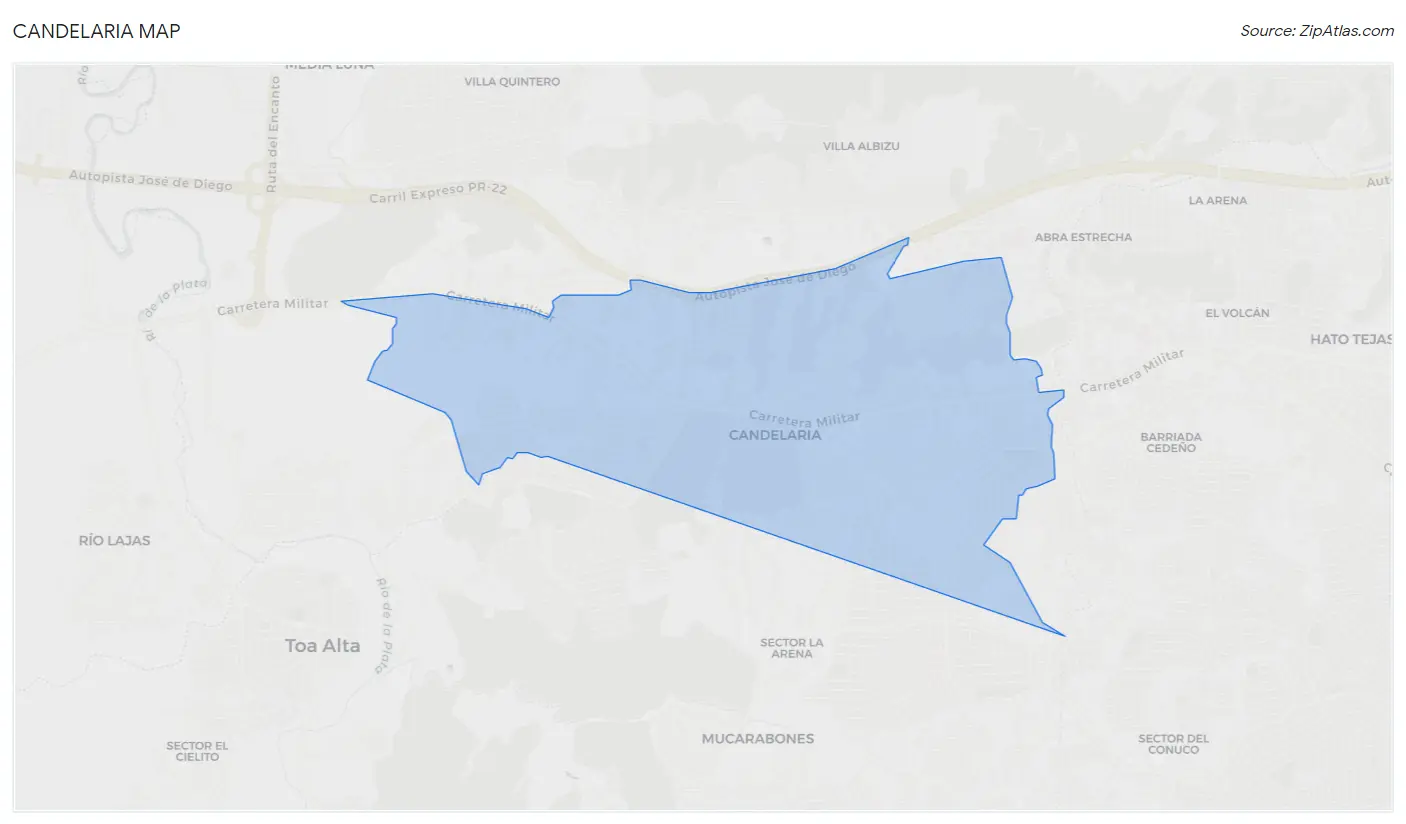
Candelaria Map
Candelaria Overview
$18,092
PER CAPITA INCOME
$39,531
AVG FAMILY INCOME
$35,667
AVG HOUSEHOLD INCOME
10.8%
WAGE / INCOME GAP [ % ]
89.2¢/ $1
WAGE / INCOME GAP [ $ ]
0.44
INEQUALITY / GINI INDEX
14,114
TOTAL POPULATION
6,746
MALE POPULATION
7,368
FEMALE POPULATION
91.56
MALES / 100 FEMALES
109.22
FEMALES / 100 MALES
41.3
MEDIAN AGE
3.1
AVG FAMILY SIZE
2.7
AVG HOUSEHOLD SIZE
6,382
LABOR FORCE [ PEOPLE ]
53.4%
PERCENT IN LABOR FORCE
9.7%
UNEMPLOYMENT RATE
Income in Candelaria
Income Overview in Candelaria
Per Capita Income in Candelaria is $18,092, while median incomes of families and households are $39,531 and $35,667 respectively.
| Characteristic | Number | Measure |
| Per Capita Income | 14,114 | $18,092 |
| Median Family Income | 3,843 | $39,531 |
| Mean Family Income | 3,843 | $49,751 |
| Median Household Income | 5,228 | $35,667 |
| Mean Household Income | 5,228 | $45,418 |
| Income Deficit | 3,843 | $0 |
| Wage / Income Gap (%) | 14,114 | 10.79% |
| Wage / Income Gap ($) | 14,114 | 89.21¢ per $1 |
| Gini / Inequality Index | 14,114 | 0.44 |
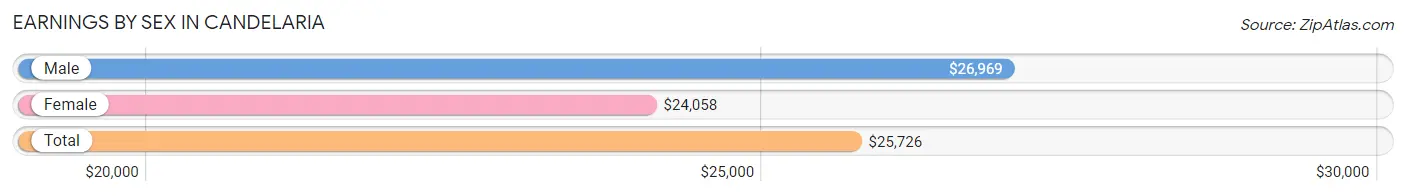
Earnings by Sex in Candelaria
Average Earnings in Candelaria are $25,726, $26,969 for men and $24,058 for women, a difference of 10.8%.
| Sex | Number | Average Earnings |
| Male | 3,106 (51.2%) | $26,969 |
| Female | 2,964 (48.8%) | $24,058 |
| Total | 6,070 (100.0%) | $25,726 |
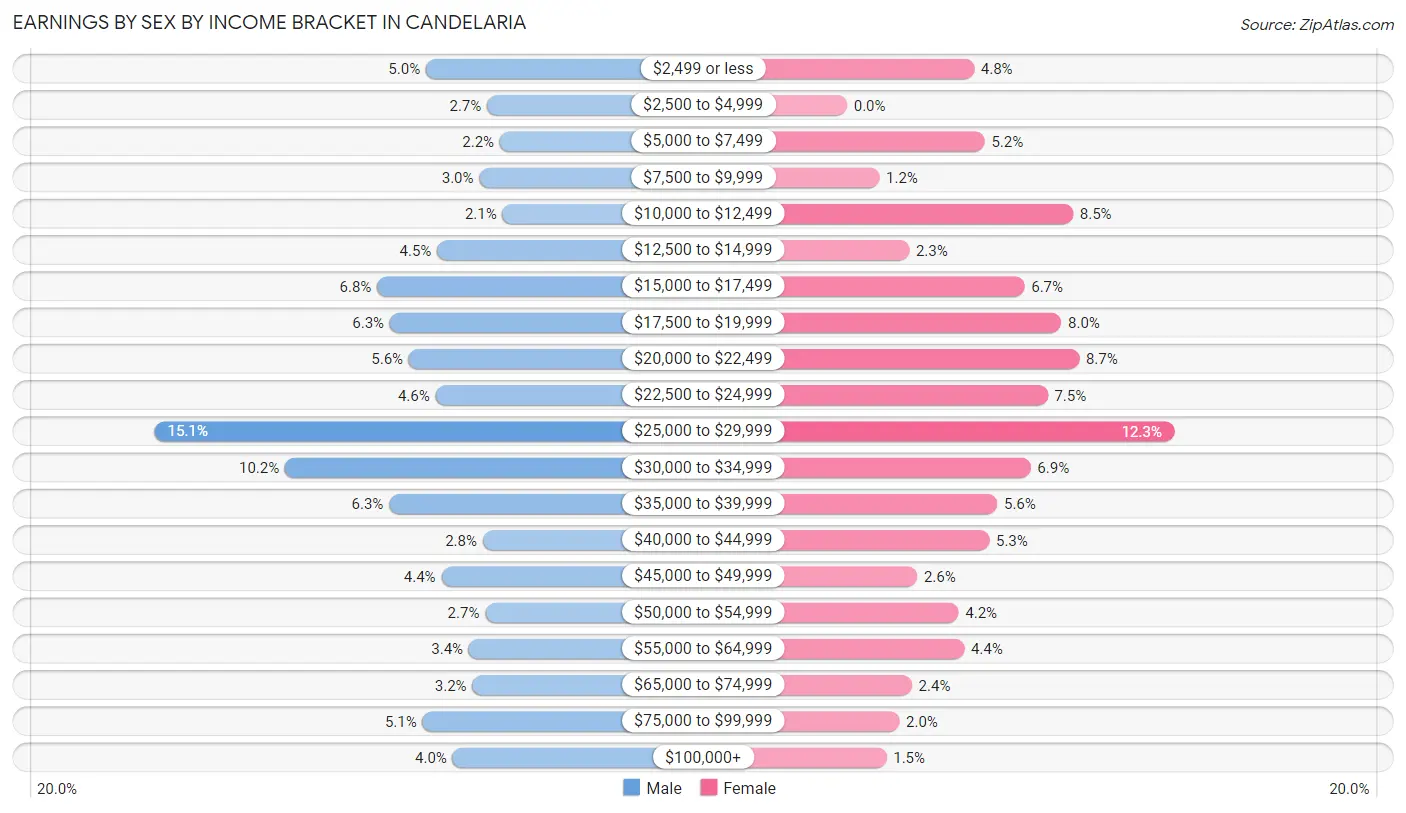
Earnings by Sex by Income Bracket in Candelaria
The most common earnings brackets in Candelaria are $25,000 to $29,999 for men (470 | 15.1%) and $25,000 to $29,999 for women (363 | 12.2%).
| Income | Male | Female |
| $2,499 or less | 154 (5.0%) | 141 (4.8%) |
| $2,500 to $4,999 | 83 (2.7%) | 0 (0.0%) |
| $5,000 to $7,499 | 68 (2.2%) | 153 (5.2%) |
| $7,500 to $9,999 | 92 (3.0%) | 36 (1.2%) |
| $10,000 to $12,499 | 65 (2.1%) | 251 (8.5%) |
| $12,500 to $14,999 | 141 (4.5%) | 69 (2.3%) |
| $15,000 to $17,499 | 211 (6.8%) | 197 (6.7%) |
| $17,500 to $19,999 | 196 (6.3%) | 238 (8.0%) |
| $20,000 to $22,499 | 174 (5.6%) | 258 (8.7%) |
| $22,500 to $24,999 | 143 (4.6%) | 223 (7.5%) |
| $25,000 to $29,999 | 470 (15.1%) | 363 (12.2%) |
| $30,000 to $34,999 | 318 (10.2%) | 204 (6.9%) |
| $35,000 to $39,999 | 197 (6.3%) | 167 (5.6%) |
| $40,000 to $44,999 | 88 (2.8%) | 158 (5.3%) |
| $45,000 to $49,999 | 136 (4.4%) | 78 (2.6%) |
| $50,000 to $54,999 | 85 (2.7%) | 124 (4.2%) |
| $55,000 to $64,999 | 104 (3.4%) | 130 (4.4%) |
| $65,000 to $74,999 | 100 (3.2%) | 72 (2.4%) |
| $75,000 to $99,999 | 158 (5.1%) | 58 (2.0%) |
| $100,000+ | 123 (4.0%) | 44 (1.5%) |
| Total | 3,106 (100.0%) | 2,964 (100.0%) |
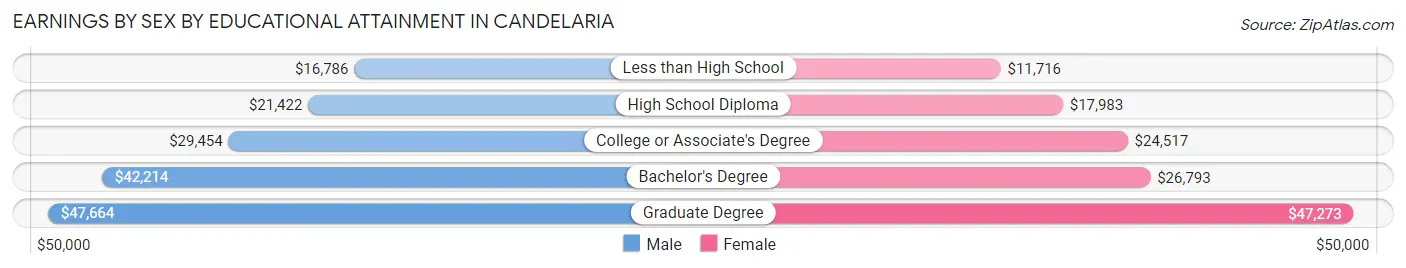
Earnings by Sex by Educational Attainment in Candelaria
Average earnings in Candelaria are $28,422 for men and $25,582 for women, a difference of 10.0%. Men with an educational attainment of graduate degree enjoy the highest average annual earnings of $47,664, while those with less than high school education earn the least with $16,786. Women with an educational attainment of graduate degree earn the most with the average annual earnings of $47,273, while those with less than high school education have the smallest earnings of $11,716.
| Educational Attainment | Male Income | Female Income |
| Less than High School | $16,786 | $11,716 |
| High School Diploma | $21,422 | $17,983 |
| College or Associate's Degree | $29,454 | $24,517 |
| Bachelor's Degree | $42,214 | $26,793 |
| Graduate Degree | $47,664 | $47,273 |
| Total | $28,422 | $25,582 |
Family Income in Candelaria
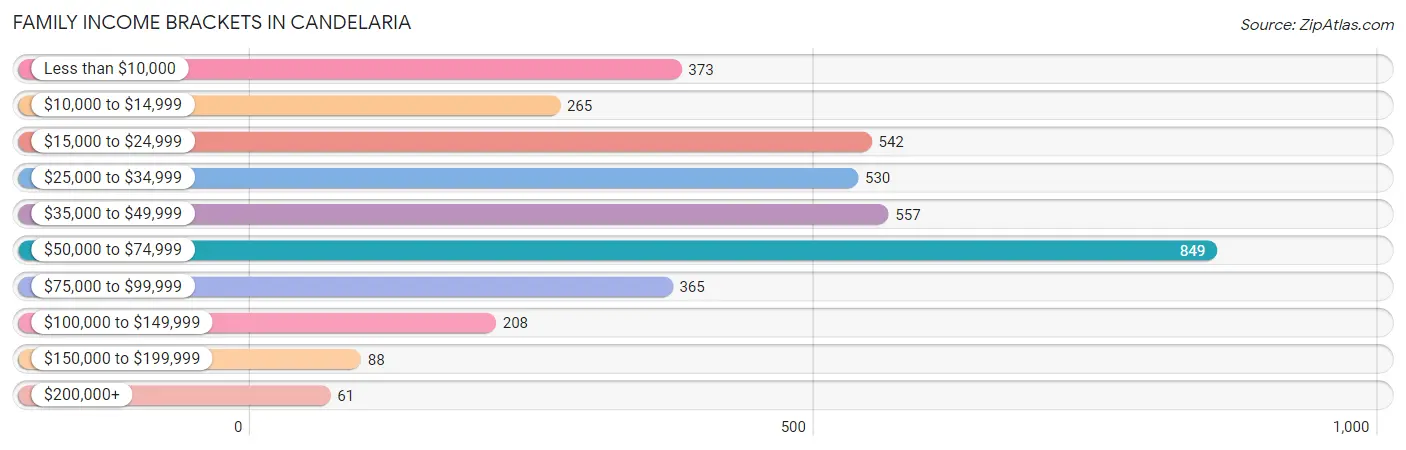
Family Income Brackets in Candelaria
According to the Candelaria family income data, there are 849 families falling into the $50,000 to $74,999 income range, which is the most common income bracket and makes up 22.1% of all families. Conversely, the $200,000+ income bracket is the least frequent group with only 61 families (1.6%) belonging to this category.
| Income Bracket | # Families | % Families |
| Less than $10,000 | 373 | 9.7% |
| $10,000 to $14,999 | 265 | 6.9% |
| $15,000 to $24,999 | 542 | 14.1% |
| $25,000 to $34,999 | 530 | 13.8% |
| $35,000 to $49,999 | 557 | 14.5% |
| $50,000 to $74,999 | 849 | 22.1% |
| $75,000 to $99,999 | 365 | 9.5% |
| $100,000 to $149,999 | 208 | 5.4% |
| $150,000 to $199,999 | 88 | 2.3% |
| $200,000+ | 61 | 1.6% |
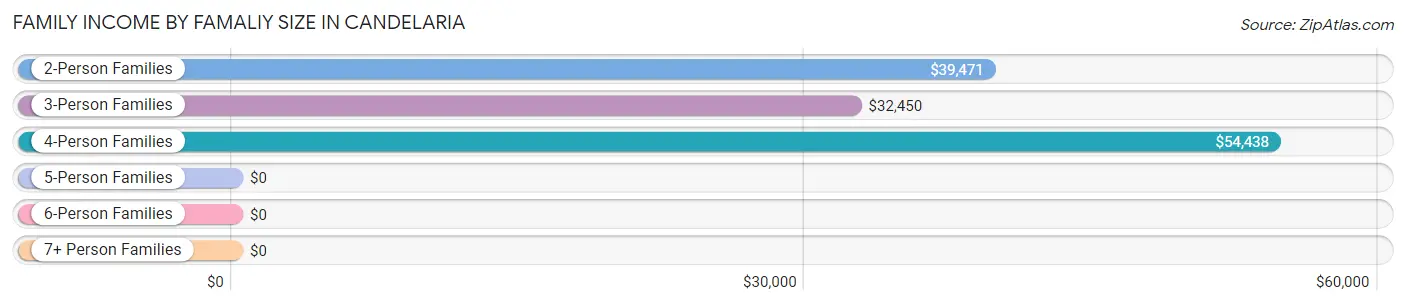
Family Income by Famaliy Size in Candelaria
4-person families (599 | 15.6%) account for the highest median family income in Candelaria with $54,438 per family, while 2-person families (1,937 | 50.4%) have the highest median income of $19,736 per family member.
| Income Bracket | # Families | Median Income |
| 2-Person Families | 1,937 (50.4%) | $39,471 |
| 3-Person Families | 1,108 (28.8%) | $32,450 |
| 4-Person Families | 599 (15.6%) | $54,438 |
| 5-Person Families | 164 (4.3%) | $0 |
| 6-Person Families | 0 (0.0%) | $0 |
| 7+ Person Families | 35 (0.9%) | $0 |
| Total | 3,843 (100.0%) | $39,531 |
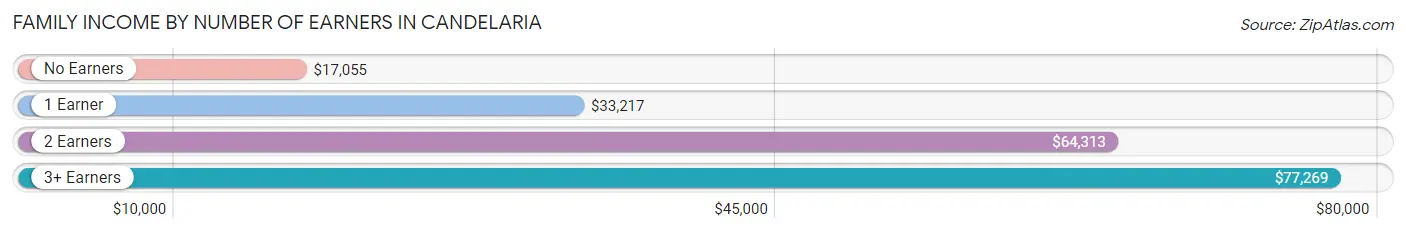
Family Income by Number of Earners in Candelaria
The median family income in Candelaria is $39,531, with families comprising 3+ earners (291) having the highest median family income of $77,269, while families with no earners (1,115) have the lowest median family income of $17,055, accounting for 7.6% and 29.0% of families, respectively.
| Number of Earners | # Families | Median Income |
| No Earners | 1,115 (29.0%) | $17,055 |
| 1 Earner | 1,403 (36.5%) | $33,217 |
| 2 Earners | 1,034 (26.9%) | $64,313 |
| 3+ Earners | 291 (7.6%) | $77,269 |
| Total | 3,843 (100.0%) | $39,531 |
Household Income in Candelaria
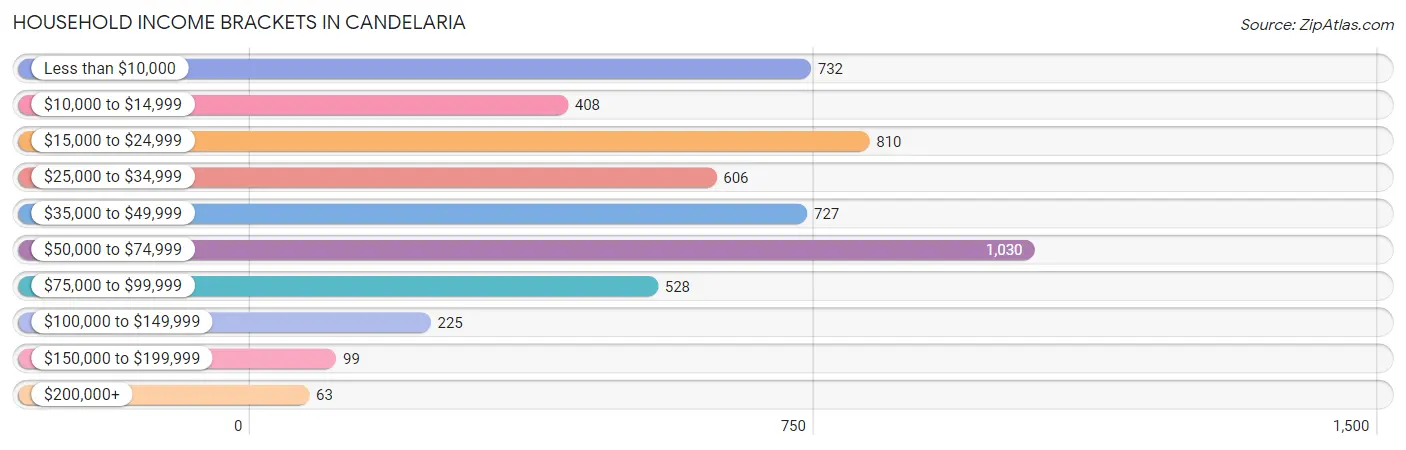
Household Income Brackets in Candelaria
With 1,030 households falling in the category, the $50,000 to $74,999 income range is the most frequent in Candelaria, accounting for 19.7% of all households. In contrast, only 63 households (1.2%) fall into the $200,000+ income bracket, making it the least populous group.
| Income Bracket | # Households | % Households |
| Less than $10,000 | 732 | 14.0% |
| $10,000 to $14,999 | 408 | 7.8% |
| $15,000 to $24,999 | 810 | 15.5% |
| $25,000 to $34,999 | 606 | 11.6% |
| $35,000 to $49,999 | 727 | 13.9% |
| $50,000 to $74,999 | 1,030 | 19.7% |
| $75,000 to $99,999 | 528 | 10.1% |
| $100,000 to $149,999 | 225 | 4.3% |
| $150,000 to $199,999 | 99 | 1.9% |
| $200,000+ | 63 | 1.2% |
Household Income by Householder Age in Candelaria
The median household income in Candelaria is $35,667, with the highest median household income of $47,292 found in the 25 to 44 years age bracket for the primary householder. A total of 1,575 households (30.1%) fall into this category. Meanwhile, the 15 to 24 years age bracket for the primary householder has the lowest median household income of $0, with 46 households (0.9%) in this group.
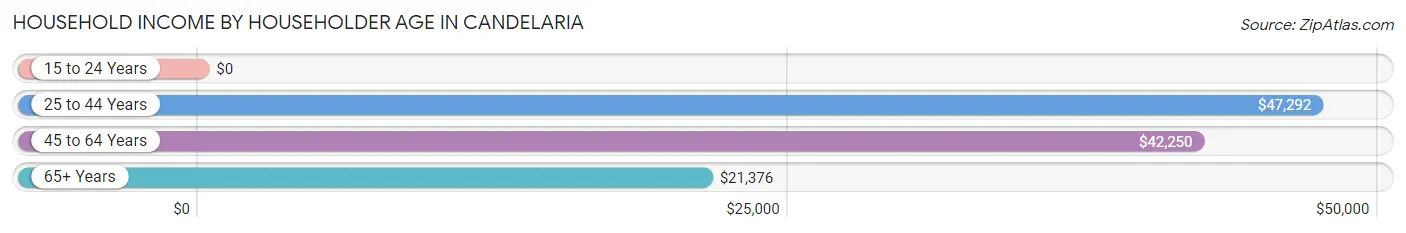
| Income Bracket | # Households | Median Income |
| 15 to 24 Years | 46 (0.9%) | $0 |
| 25 to 44 Years | 1,575 (30.1%) | $47,292 |
| 45 to 64 Years | 1,947 (37.2%) | $42,250 |
| 65+ Years | 1,660 (31.8%) | $21,376 |
| Total | 5,228 (100.0%) | $35,667 |
Poverty in Candelaria
Income Below Poverty by Sex and Age in Candelaria
With 26.0% poverty level for males and 30.1% for females among the residents of Candelaria, 16 and 17 year old males and 15 year old females are the most vulnerable to poverty, with 82 males (75.2%) and 32 females (100.0%) in their respective age groups living below the poverty level.
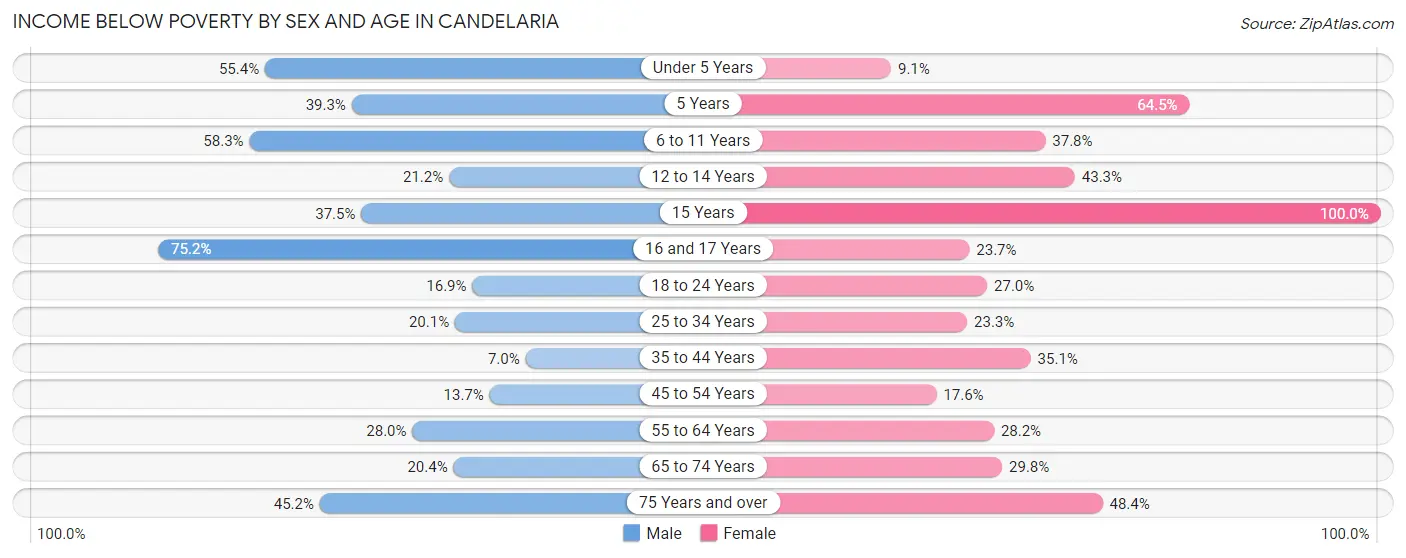
| Age Bracket | Male | Female |
| Under 5 Years | 211 (55.4%) | 17 (9.1%) |
| 5 Years | 11 (39.3%) | 20 (64.5%) |
| 6 to 11 Years | 243 (58.3%) | 221 (37.8%) |
| 12 to 14 Years | 42 (21.2%) | 61 (43.3%) |
| 15 Years | 48 (37.5%) | 32 (100.0%) |
| 16 and 17 Years | 82 (75.2%) | 18 (23.7%) |
| 18 to 24 Years | 113 (16.9%) | 120 (27.0%) |
| 25 to 34 Years | 210 (20.1%) | 248 (23.3%) |
| 35 to 44 Years | 71 (7.0%) | 358 (35.1%) |
| 45 to 54 Years | 96 (13.7%) | 166 (17.6%) |
| 55 to 64 Years | 248 (28.0%) | 301 (28.2%) |
| 65 to 74 Years | 116 (20.4%) | 319 (29.8%) |
| 75 Years and over | 255 (45.2%) | 333 (48.4%) |
| Total | 1,746 (26.0%) | 2,214 (30.1%) |
Income Above Poverty by Sex and Age in Candelaria
According to the poverty statistics in Candelaria, males aged 35 to 44 years and females aged under 5 years are the age groups that are most secure financially, with 93.0% of males and 90.9% of females in these age groups living above the poverty line.
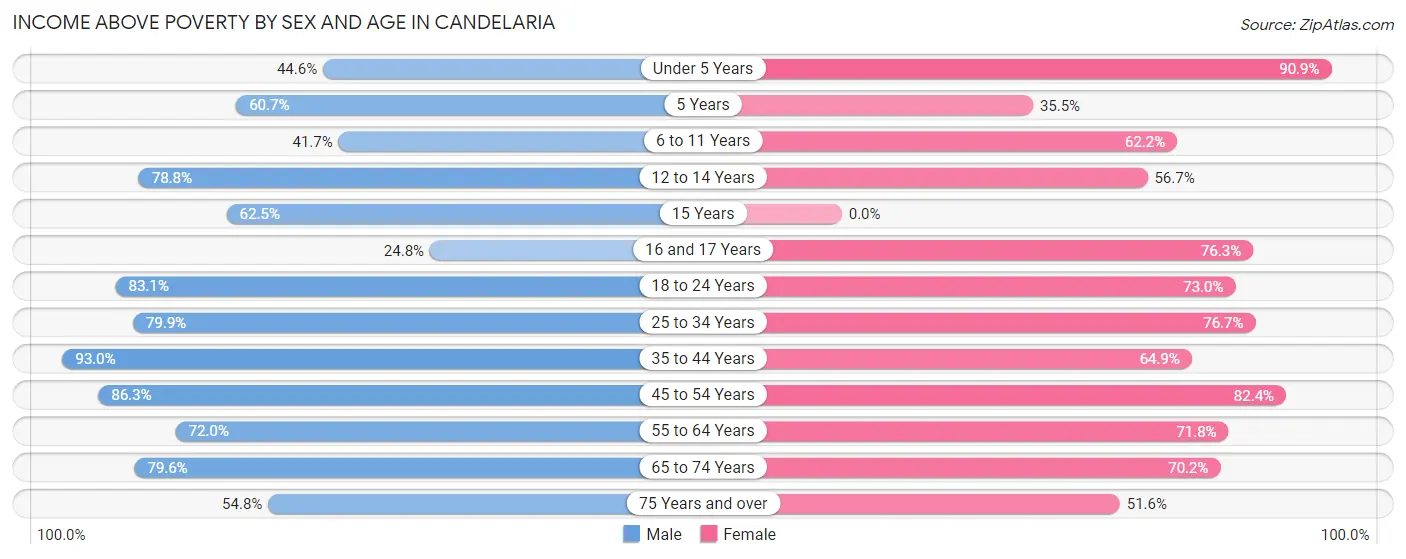
| Age Bracket | Male | Female |
| Under 5 Years | 170 (44.6%) | 169 (90.9%) |
| 5 Years | 17 (60.7%) | 11 (35.5%) |
| 6 to 11 Years | 174 (41.7%) | 364 (62.2%) |
| 12 to 14 Years | 156 (78.8%) | 80 (56.7%) |
| 15 Years | 80 (62.5%) | 0 (0.0%) |
| 16 and 17 Years | 27 (24.8%) | 58 (76.3%) |
| 18 to 24 Years | 556 (83.1%) | 325 (73.0%) |
| 25 to 34 Years | 834 (79.9%) | 818 (76.7%) |
| 35 to 44 Years | 942 (93.0%) | 663 (64.9%) |
| 45 to 54 Years | 605 (86.3%) | 779 (82.4%) |
| 55 to 64 Years | 637 (72.0%) | 765 (71.8%) |
| 65 to 74 Years | 453 (79.6%) | 753 (70.2%) |
| 75 Years and over | 309 (54.8%) | 355 (51.6%) |
| Total | 4,960 (74.0%) | 5,140 (69.9%) |
Income Below Poverty Among Married-Couple Families in Candelaria
The poverty statistics for married-couple families in Candelaria show that 19.7% or 464 of the total 2,352 families live below the poverty line. Families with 3 or 4 children have the highest poverty rate of 100.0%, comprising of 14 families. On the other hand, families with 1 or 2 children have the lowest poverty rate of 18.5%, which includes 113 families.
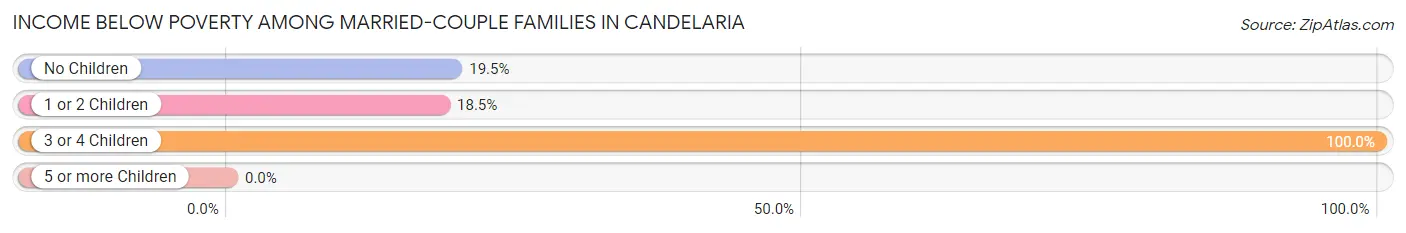
| Children | Above Poverty | Below Poverty |
| No Children | 1,389 (80.5%) | 337 (19.5%) |
| 1 or 2 Children | 499 (81.5%) | 113 (18.5%) |
| 3 or 4 Children | 0 (0.0%) | 14 (100.0%) |
| 5 or more Children | 0 (0.0%) | 0 (0.0%) |
| Total | 1,888 (80.3%) | 464 (19.7%) |
Income Below Poverty Among Single-Parent Households in Candelaria
According to the poverty data in Candelaria, 5.3% or 13 single-father households and 43.7% or 545 single-mother households are living below the poverty line. Among single-father households, those with no children have the highest poverty rate, with 13 households (13.5%) experiencing poverty. Likewise, among single-mother households, those with 3 or 4 children have the highest poverty rate, with 24 households (75.0%) falling below the poverty line.
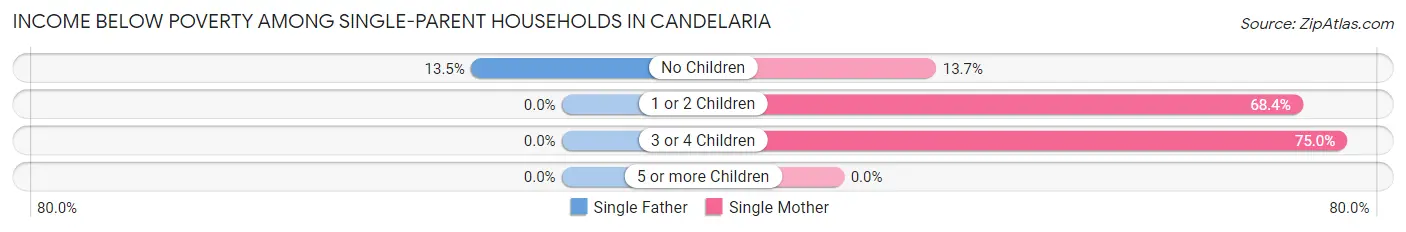
| Children | Single Father | Single Mother |
| No Children | 13 (13.5%) | 78 (13.7%) |
| 1 or 2 Children | 0 (0.0%) | 443 (68.4%) |
| 3 or 4 Children | 0 (0.0%) | 24 (75.0%) |
| 5 or more Children | 0 (0.0%) | 0 (0.0%) |
| Total | 13 (5.3%) | 545 (43.7%) |
Income Below Poverty Among Married-Couple vs Single-Parent Households in Candelaria
The poverty data for Candelaria shows that 464 of the married-couple family households (19.7%) and 558 of the single-parent households (37.4%) are living below the poverty level. Within the married-couple family households, those with 3 or 4 children have the highest poverty rate, with 14 households (100.0%) falling below the poverty line. Among the single-parent households, those with 1 or 2 children have the highest poverty rate, with 443 household (57.2%) living below poverty.
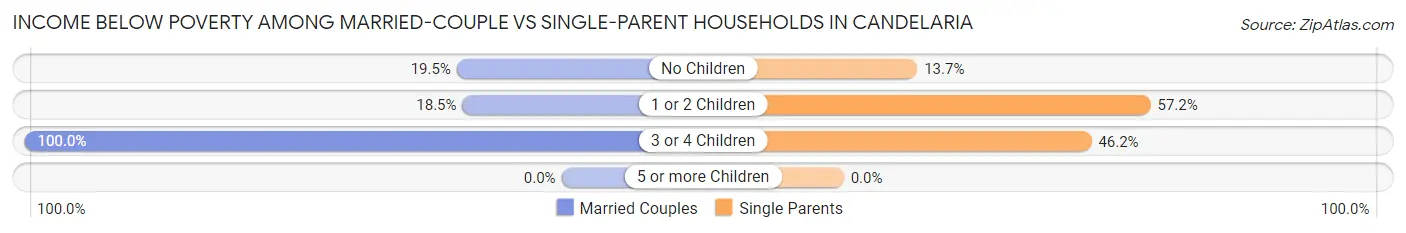
| Children | Married-Couple Families | Single-Parent Households |
| No Children | 337 (19.5%) | 91 (13.7%) |
| 1 or 2 Children | 113 (18.5%) | 443 (57.2%) |
| 3 or 4 Children | 14 (100.0%) | 24 (46.2%) |
| 5 or more Children | 0 (0.0%) | 0 (0.0%) |
| Total | 464 (19.7%) | 558 (37.4%) |
Race in Candelaria
The most populous races in Candelaria are Hispanic or Latino (13,978 | 99.0%), White / Caucasian (5,944 | 42.1%), and Some other Race (4,334 | 30.7%).
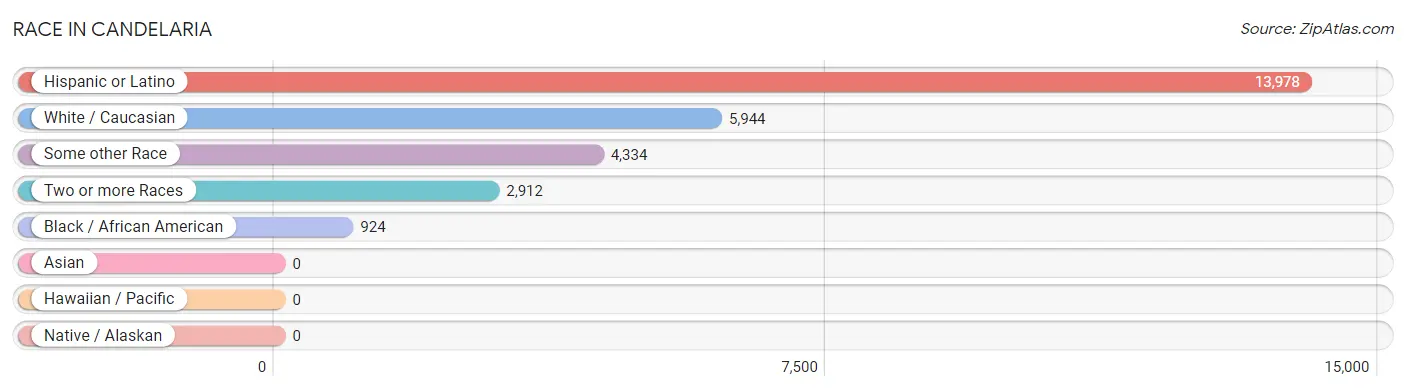
| Race | # Population | % Population |
| Asian | 0 | 0.0% |
| Black / African American | 924 | 6.6% |
| Hawaiian / Pacific | 0 | 0.0% |
| Hispanic or Latino | 13,978 | 99.0% |
| Native / Alaskan | 0 | 0.0% |
| White / Caucasian | 5,944 | 42.1% |
| Two or more Races | 2,912 | 20.6% |
| Some other Race | 4,334 | 30.7% |
| Total | 14,114 | 100.0% |
Ancestry in Candelaria
The most populous ancestries reported in Candelaria are Puerto Rican (13,716 | 97.2%), American (424 | 3.0%), Mexican (101 | 0.7%), Dominican (88 | 0.6%), and Arab (47 | 0.3%), together accounting for 101.9% of all Candelaria residents.
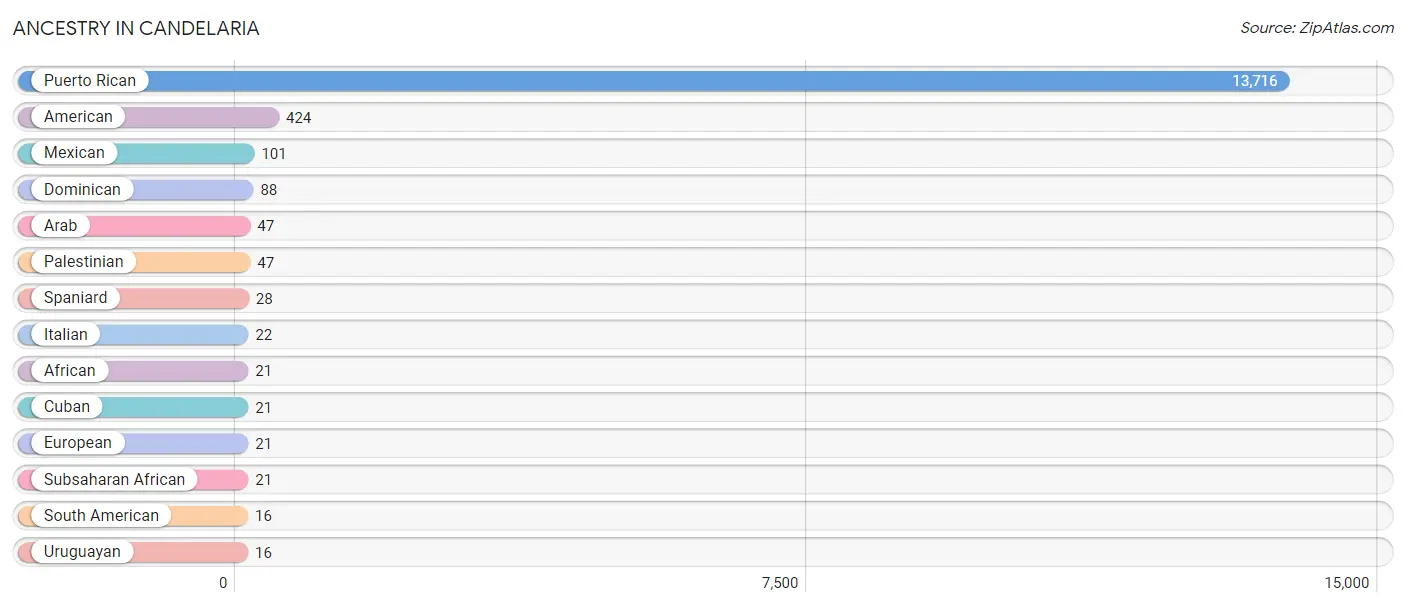
| Ancestry | # Population | % Population |
| African | 21 | 0.2% |
| American | 424 | 3.0% |
| Arab | 47 | 0.3% |
| Cuban | 21 | 0.2% |
| Dominican | 88 | 0.6% |
| European | 21 | 0.2% |
| Italian | 22 | 0.2% |
| Mexican | 101 | 0.7% |
| Palestinian | 47 | 0.3% |
| Puerto Rican | 13,716 | 97.2% |
| South American | 16 | 0.1% |
| Spaniard | 28 | 0.2% |
| Subsaharan African | 21 | 0.2% |
| Uruguayan | 16 | 0.1% | View All 14 Rows |
Immigrants in Candelaria

| Immigration Origin | # Population | % Population | View All 0 Rows |
Sex and Age in Candelaria
Sex and Age in Candelaria
The most populous age groups in Candelaria are 25 to 29 Years (628 | 9.3%) for men and 35 to 39 Years (641 | 8.7%) for women.
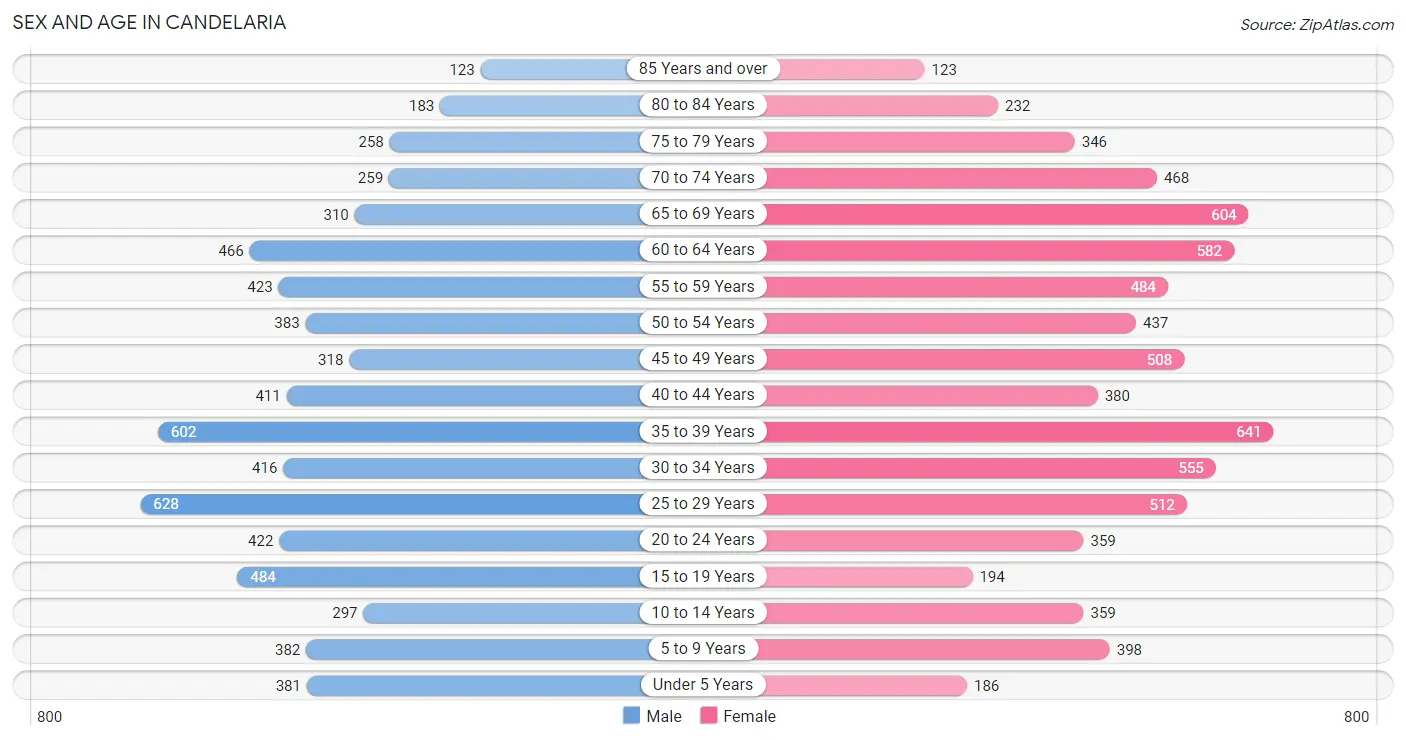
| Age Bracket | Male | Female |
| Under 5 Years | 381 (5.7%) | 186 (2.5%) |
| 5 to 9 Years | 382 (5.7%) | 398 (5.4%) |
| 10 to 14 Years | 297 (4.4%) | 359 (4.9%) |
| 15 to 19 Years | 484 (7.2%) | 194 (2.6%) |
| 20 to 24 Years | 422 (6.3%) | 359 (4.9%) |
| 25 to 29 Years | 628 (9.3%) | 512 (7.0%) |
| 30 to 34 Years | 416 (6.2%) | 555 (7.5%) |
| 35 to 39 Years | 602 (8.9%) | 641 (8.7%) |
| 40 to 44 Years | 411 (6.1%) | 380 (5.2%) |
| 45 to 49 Years | 318 (4.7%) | 508 (6.9%) |
| 50 to 54 Years | 383 (5.7%) | 437 (5.9%) |
| 55 to 59 Years | 423 (6.3%) | 484 (6.6%) |
| 60 to 64 Years | 466 (6.9%) | 582 (7.9%) |
| 65 to 69 Years | 310 (4.6%) | 604 (8.2%) |
| 70 to 74 Years | 259 (3.8%) | 468 (6.4%) |
| 75 to 79 Years | 258 (3.8%) | 346 (4.7%) |
| 80 to 84 Years | 183 (2.7%) | 232 (3.2%) |
| 85 Years and over | 123 (1.8%) | 123 (1.7%) |
| Total | 6,746 (100.0%) | 7,368 (100.0%) |
Families and Households in Candelaria
Median Family Size in Candelaria
The median family size in Candelaria is 3.14 persons per family, with single female/mother families (1,248 | 32.5%) accounting for the largest median family size of 3.29 persons per family. On the other hand, married-couple families (2,352 | 61.2%) represent the smallest median family size with 3.07 persons per family.
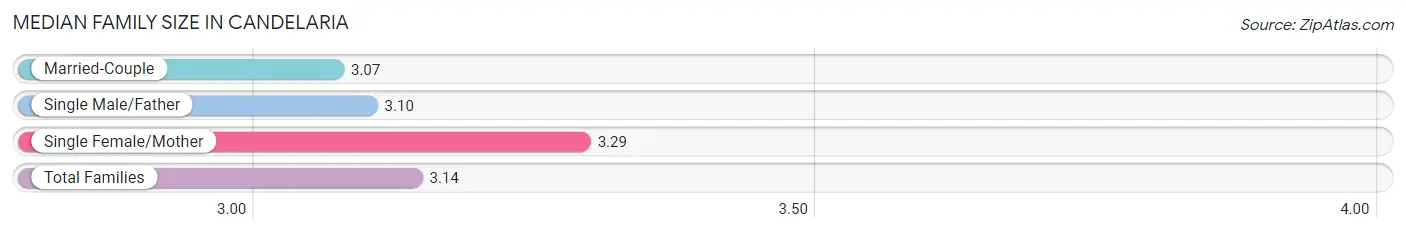
| Family Type | # Families | Family Size |
| Married-Couple | 2,352 (61.2%) | 3.07 |
| Single Male/Father | 243 (6.3%) | 3.10 |
| Single Female/Mother | 1,248 (32.5%) | 3.29 |
| Total Families | 3,843 (100.0%) | 3.14 |
Median Household Size in Candelaria
The median household size in Candelaria is 2.69 persons per household, with single male/father households (243 | 4.6%) accounting for the largest median household size of 3.61 persons per household. non-family households (1,385 | 26.5%) represent the smallest median household size with 1.10 persons per household.
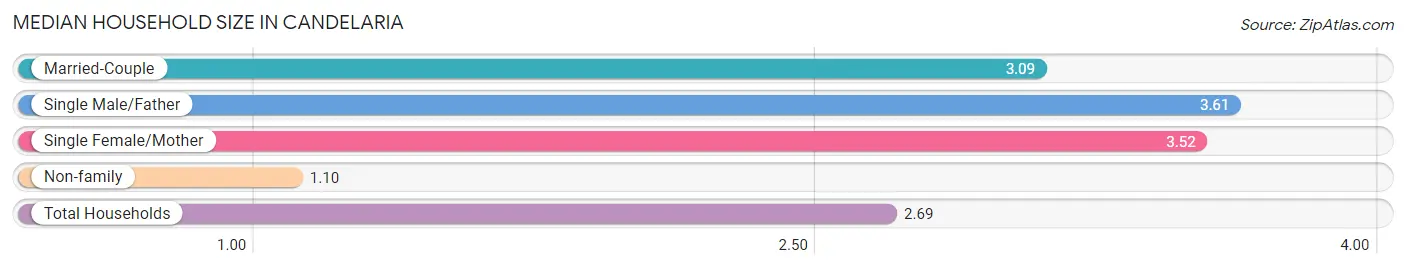
| Household Type | # Households | Household Size |
| Married-Couple | 2,352 (45.0%) | 3.09 |
| Single Male/Father | 243 (4.6%) | 3.61 |
| Single Female/Mother | 1,248 (23.9%) | 3.52 |
| Non-family | 1,385 (26.5%) | 1.10 |
| Total Households | 5,228 (100.0%) | 2.69 |
Household Size by Marriage Status in Candelaria
Out of a total of 5,228 households in Candelaria, 3,843 (73.5%) are family households, while 1,385 (26.5%) are nonfamily households. The most numerous type of family households are 2-person households, comprising 1,672, and the most common type of nonfamily households are 1-person households, comprising 1,251.
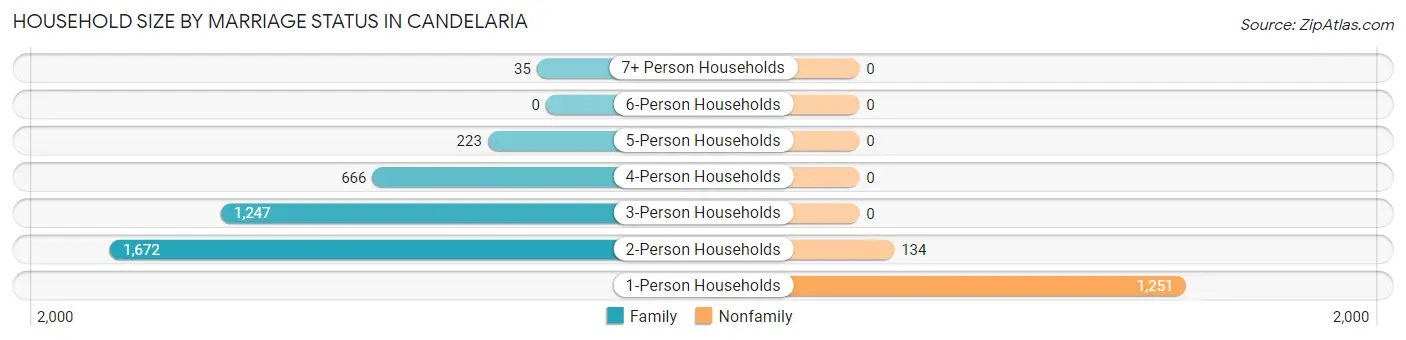
| Household Size | Family Households | Nonfamily Households |
| 1-Person Households | - | 1,251 (23.9%) |
| 2-Person Households | 1,672 (32.0%) | 134 (2.6%) |
| 3-Person Households | 1,247 (23.8%) | 0 (0.0%) |
| 4-Person Households | 666 (12.7%) | 0 (0.0%) |
| 5-Person Households | 223 (4.3%) | 0 (0.0%) |
| 6-Person Households | 0 (0.0%) | 0 (0.0%) |
| 7+ Person Households | 35 (0.7%) | 0 (0.0%) |
| Total | 3,843 (73.5%) | 1,385 (26.5%) |
Female Fertility in Candelaria
Fertility by Age in Candelaria
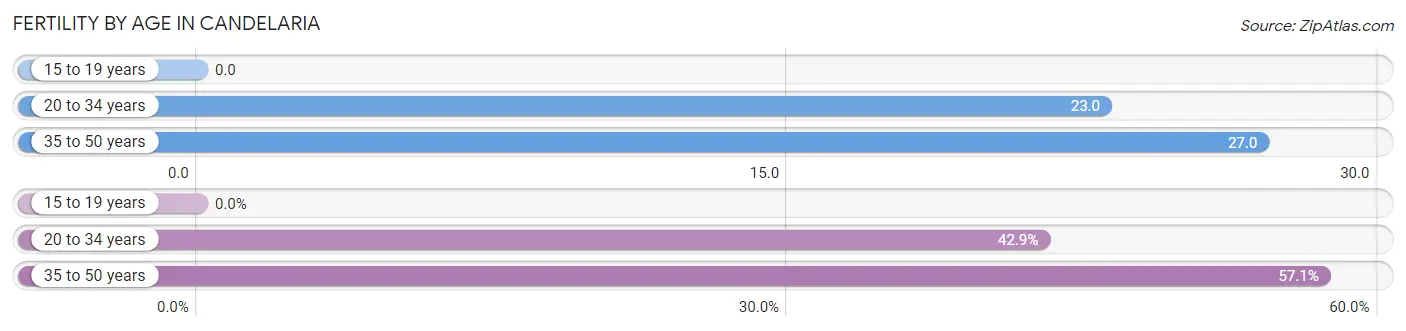
Average fertility rate in Candelaria is 24.0 births per 1,000 women. Women in the age bracket of 35 to 50 years have the highest fertility rate with 27.0 births per 1,000 women. Women in the age bracket of 35 to 50 years acount for 57.1% of all women with births.
| Age Bracket | Women with Births | Births / 1,000 Women |
| 15 to 19 years | 0 (0.0%) | 0.0 |
| 20 to 34 years | 33 (42.9%) | 23.0 |
| 35 to 50 years | 44 (57.1%) | 27.0 |
| Total | 77 (100.0%) | 24.0 |
Fertility by Age by Marriage Status in Candelaria
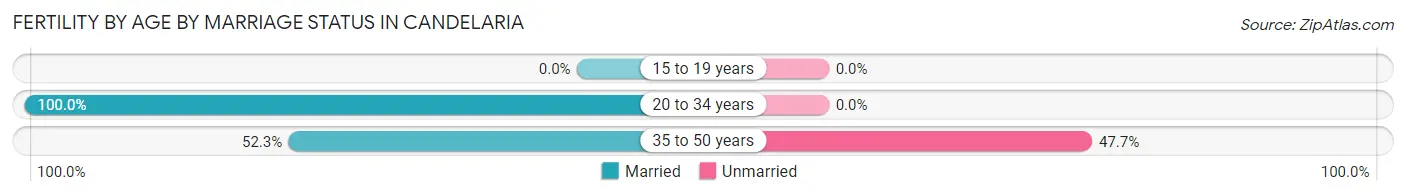
72.7% of women with births (77) in Candelaria are married. The highest percentage of unmarried women with births falls into 35 to 50 years age bracket with 47.7% of them unmarried at the time of birth, while the lowest percentage of unmarried women with births belong to 20 to 34 years age bracket with 0.0% of them unmarried.
| Age Bracket | Married | Unmarried |
| 15 to 19 years | 0 (0.0%) | 0 (0.0%) |
| 20 to 34 years | 33 (100.0%) | 0 (0.0%) |
| 35 to 50 years | 23 (52.3%) | 21 (47.7%) |
| Total | 56 (72.7%) | 21 (27.3%) |
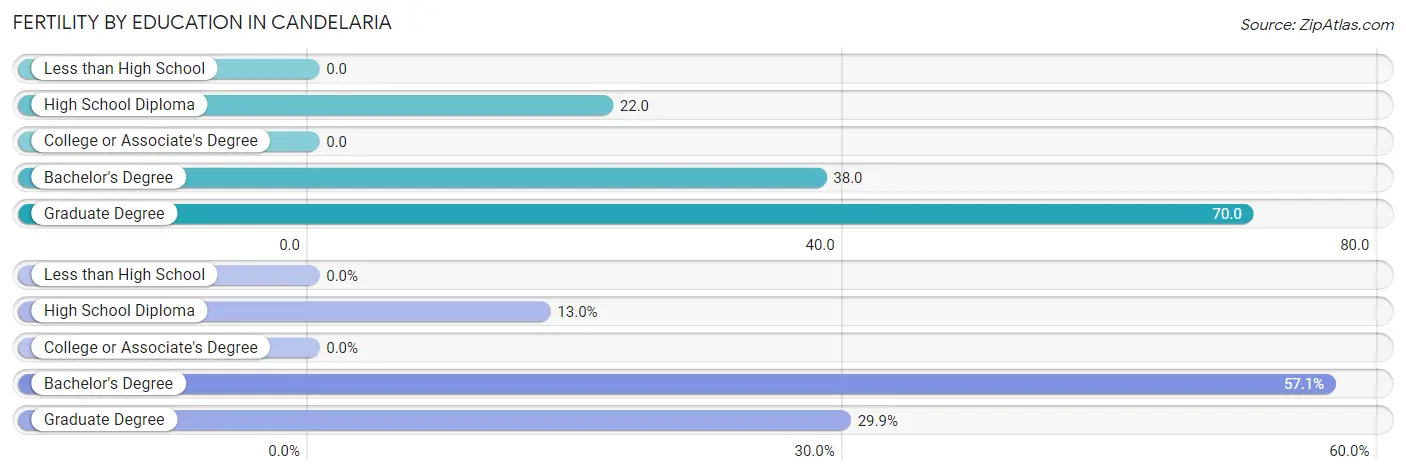
Fertility by Education in Candelaria
| Educational Attainment | Women with Births | Births / 1,000 Women |
| Less than High School | 0 (0.0%) | 0.0 |
| High School Diploma | 10 (13.0%) | 22.0 |
| College or Associate's Degree | 0 (0.0%) | 0.0 |
| Bachelor's Degree | 44 (57.1%) | 38.0 |
| Graduate Degree | 23 (29.9%) | 70.0 |
| Total | 77 (100.0%) | 24.0 |
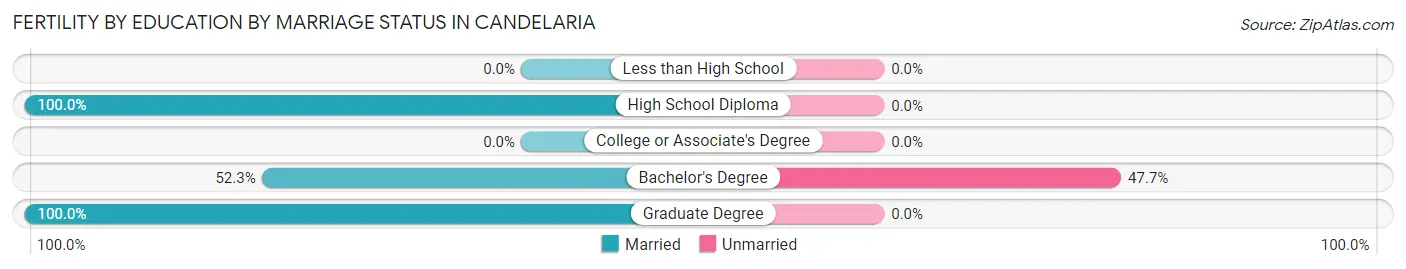
Fertility by Education by Marriage Status in Candelaria
27.3% of women with births in Candelaria are unmarried. Women with the educational attainment of high school diploma are most likely to be married with 100.0% of them married at childbirth, while women with the educational attainment of bachelor's degree are least likely to be married with 47.7% of them unmarried at childbirth.
| Educational Attainment | Married | Unmarried |
| Less than High School | 0 (0.0%) | 0 (0.0%) |
| High School Diploma | 10 (100.0%) | 0 (0.0%) |
| College or Associate's Degree | 0 (0.0%) | 0 (0.0%) |
| Bachelor's Degree | 23 (52.3%) | 21 (47.7%) |
| Graduate Degree | 23 (100.0%) | 0 (0.0%) |
| Total | 56 (72.7%) | 21 (27.3%) |
Employment Characteristics in Candelaria
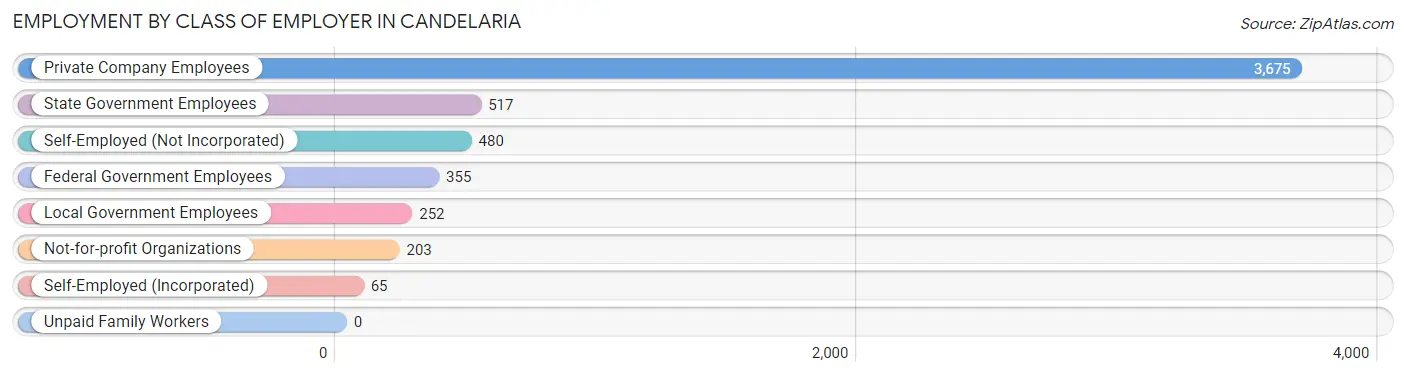
Employment by Class of Employer in Candelaria
Among the 5,547 employed individuals in Candelaria, private company employees (3,675 | 66.2%), state government employees (517 | 9.3%), and self-employed (not incorporated) (480 | 8.6%) make up the most common classes of employment.
| Employer Class | # Employees | % Employees |
| Private Company Employees | 3,675 | 66.2% |
| Self-Employed (Incorporated) | 65 | 1.2% |
| Self-Employed (Not Incorporated) | 480 | 8.6% |
| Not-for-profit Organizations | 203 | 3.7% |
| Local Government Employees | 252 | 4.5% |
| State Government Employees | 517 | 9.3% |
| Federal Government Employees | 355 | 6.4% |
| Unpaid Family Workers | 0 | 0.0% |
| Total | 5,547 | 100.0% |
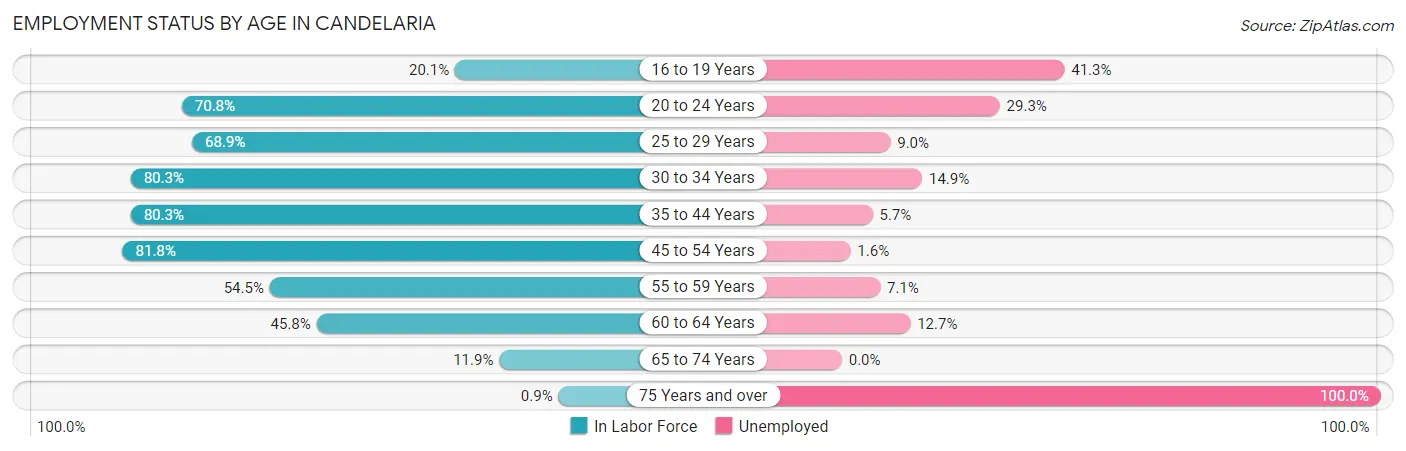
Employment Status by Age in Candelaria
According to the labor force statistics for Candelaria, out of the total population over 16 years of age (11,951), 53.4% or 6,382 individuals are in the labor force, with 9.7% or 619 of them unemployed. The age group with the highest labor force participation rate is 45 to 54 years, with 81.8% or 1,346 individuals in the labor force. Within the labor force, the 75 years and over age range has the highest percentage of unemployed individuals, with 100.0% or 11 of them being unemployed.
| Age Bracket | In Labor Force | Unemployed |
| 16 to 19 Years | 104 (20.1%) | 43 (41.3%) |
| 20 to 24 Years | 553 (70.8%) | 162 (29.3%) |
| 25 to 29 Years | 785 (68.9%) | 71 (9.0%) |
| 30 to 34 Years | 780 (80.3%) | 116 (14.9%) |
| 35 to 44 Years | 1,633 (80.3%) | 93 (5.7%) |
| 45 to 54 Years | 1,346 (81.8%) | 22 (1.6%) |
| 55 to 59 Years | 494 (54.5%) | 35 (7.1%) |
| 60 to 64 Years | 480 (45.8%) | 61 (12.7%) |
| 65 to 74 Years | 195 (11.9%) | 0 (0.0%) |
| 75 Years and over | 11 (0.9%) | 11 (100.0%) |
| Total | 6,382 (53.4%) | 619 (9.7%) |
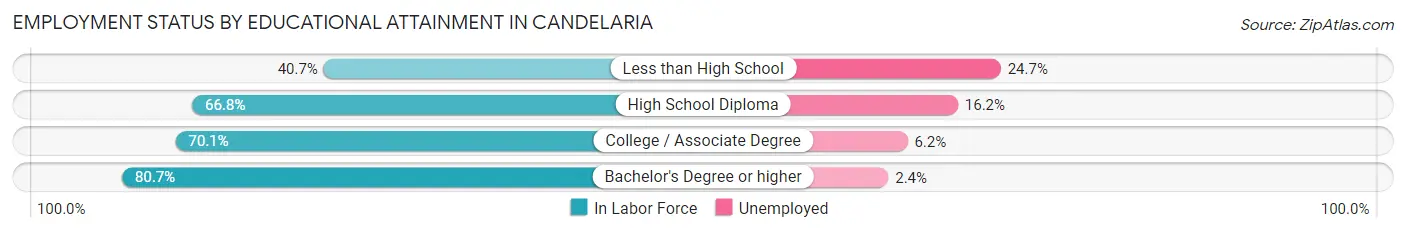
Employment Status by Educational Attainment in Candelaria
According to labor force statistics for Candelaria, 71.2% of individuals (5,515) out of the total population between 25 and 64 years of age (7,746) are in the labor force, with 7.2% or 397 of them being unemployed. The group with the highest labor force participation rate are those with the educational attainment of bachelor's degree or higher, with 80.7% or 2,367 individuals in the labor force. Within the labor force, individuals with less than high school education have the highest percentage of unemployment, with 24.7% or 58 of them being unemployed.
| Educational Attainment | In Labor Force | Unemployed |
| Less than High School | 235 (40.7%) | 143 (24.7%) |
| High School Diploma | 1,019 (66.8%) | 247 (16.2%) |
| College / Associate Degree | 1,899 (70.1%) | 168 (6.2%) |
| Bachelor's Degree or higher | 2,367 (80.7%) | 70 (2.4%) |
| Total | 5,515 (71.2%) | 558 (7.2%) |
Employment Occupations by Sex in Candelaria
Management, Business, Science and Arts Occupations
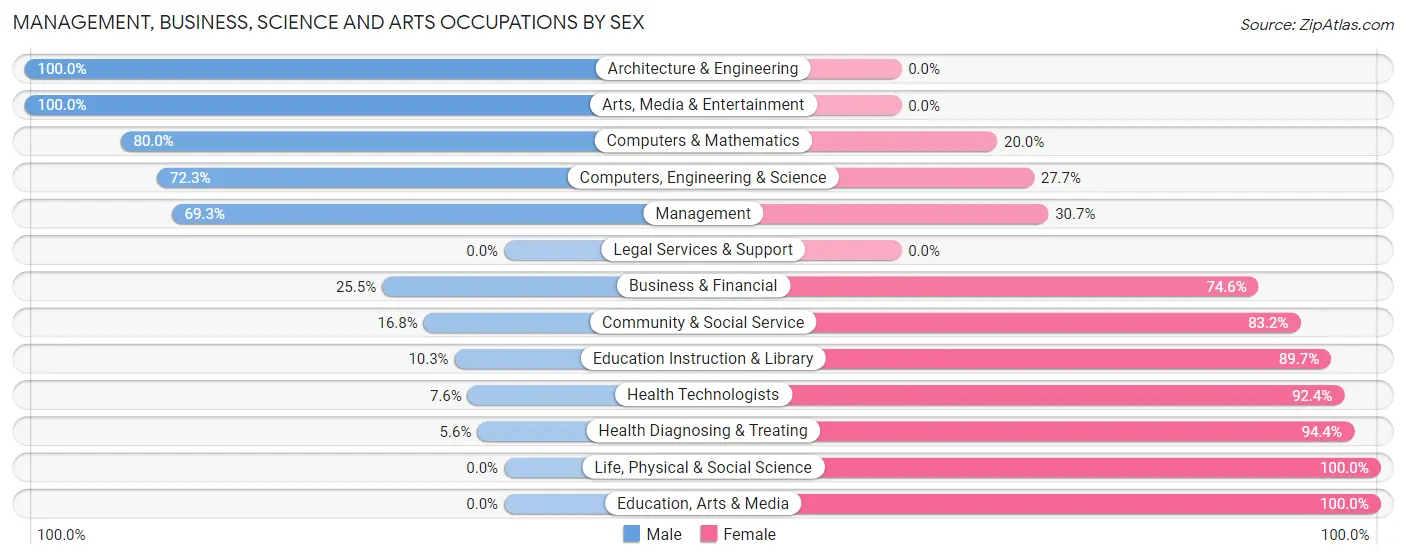
The most common Management, Business, Science and Arts occupations in Candelaria are Business & Financial (499 | 8.8%), Community & Social Service (465 | 8.2%), Management (453 | 8.0%), Education Instruction & Library (397 | 7.0%), and Health Diagnosing & Treating (394 | 7.0%).
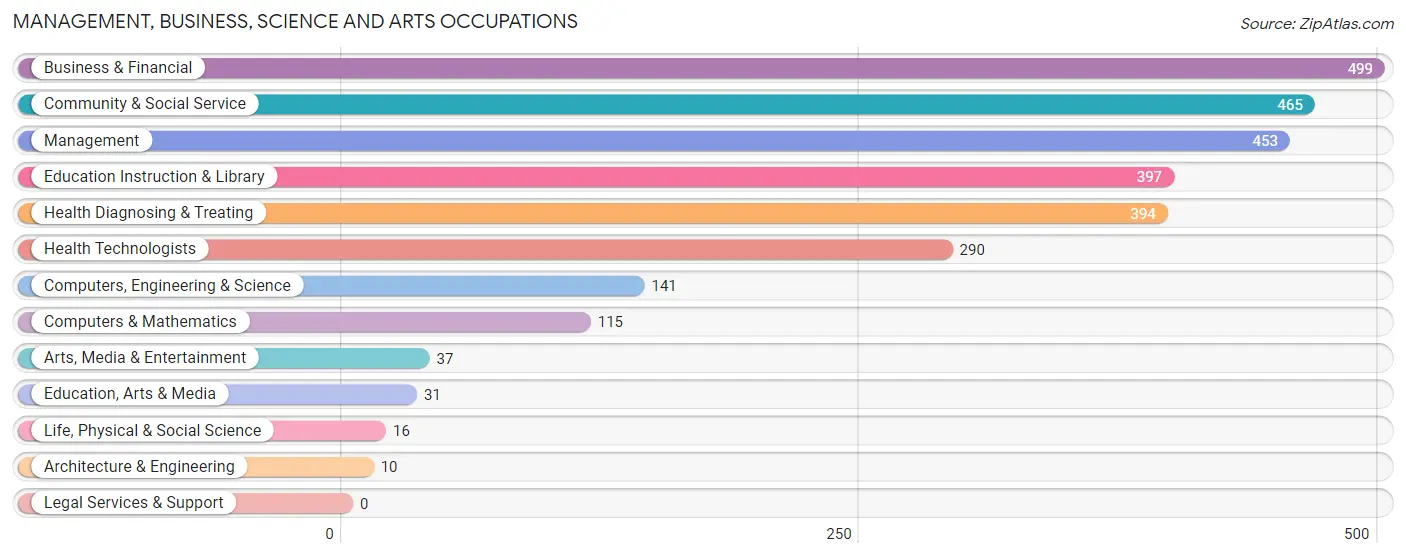
Management, Business, Science and Arts Occupations by Sex
Within the Management, Business, Science and Arts occupations in Candelaria, the most male-oriented occupations are Architecture & Engineering (100.0%), Arts, Media & Entertainment (100.0%), and Computers & Mathematics (80.0%), while the most female-oriented occupations are Life, Physical & Social Science (100.0%), Education, Arts & Media (100.0%), and Health Diagnosing & Treating (94.4%).
| Occupation | Male | Female |
| Management | 314 (69.3%) | 139 (30.7%) |
| Business & Financial | 127 (25.5%) | 372 (74.6%) |
| Computers, Engineering & Science | 102 (72.3%) | 39 (27.7%) |
| Computers & Mathematics | 92 (80.0%) | 23 (20.0%) |
| Architecture & Engineering | 10 (100.0%) | 0 (0.0%) |
| Life, Physical & Social Science | 0 (0.0%) | 16 (100.0%) |
| Community & Social Service | 78 (16.8%) | 387 (83.2%) |
| Education, Arts & Media | 0 (0.0%) | 31 (100.0%) |
| Legal Services & Support | 0 (0.0%) | 0 (0.0%) |
| Education Instruction & Library | 41 (10.3%) | 356 (89.7%) |
| Arts, Media & Entertainment | 37 (100.0%) | 0 (0.0%) |
| Health Diagnosing & Treating | 22 (5.6%) | 372 (94.4%) |
| Health Technologists | 22 (7.6%) | 268 (92.4%) |
| Total (Category) | 643 (32.9%) | 1,309 (67.1%) |
| Total (Overall) | 2,804 (49.5%) | 2,855 (50.4%) |
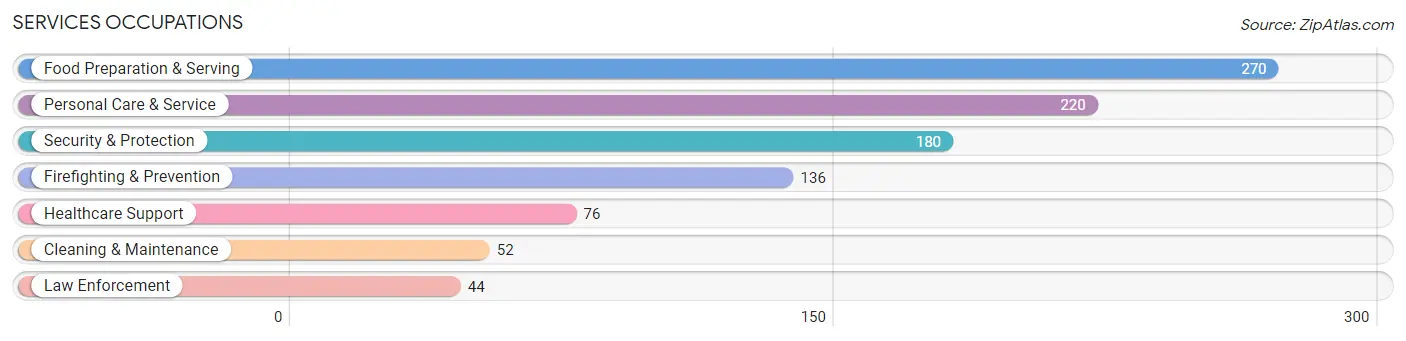
Services Occupations
The most common Services occupations in Candelaria are Food Preparation & Serving (270 | 4.8%), Personal Care & Service (220 | 3.9%), Security & Protection (180 | 3.2%), Firefighting & Prevention (136 | 2.4%), and Healthcare Support (76 | 1.3%).
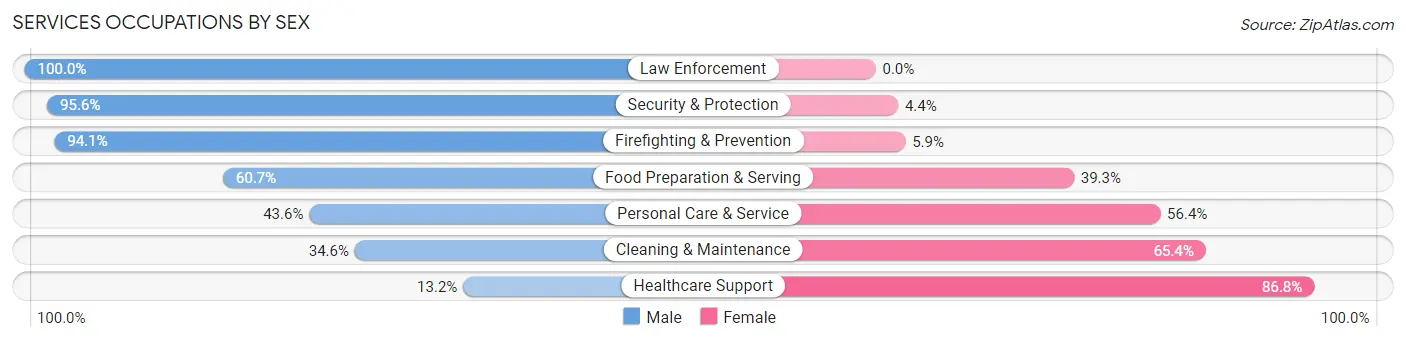
Services Occupations by Sex
Within the Services occupations in Candelaria, the most male-oriented occupations are Law Enforcement (100.0%), Security & Protection (95.6%), and Firefighting & Prevention (94.1%), while the most female-oriented occupations are Healthcare Support (86.8%), Cleaning & Maintenance (65.4%), and Personal Care & Service (56.4%).
| Occupation | Male | Female |
| Healthcare Support | 10 (13.2%) | 66 (86.8%) |
| Security & Protection | 172 (95.6%) | 8 (4.4%) |
| Firefighting & Prevention | 128 (94.1%) | 8 (5.9%) |
| Law Enforcement | 44 (100.0%) | 0 (0.0%) |
| Food Preparation & Serving | 164 (60.7%) | 106 (39.3%) |
| Cleaning & Maintenance | 18 (34.6%) | 34 (65.4%) |
| Personal Care & Service | 96 (43.6%) | 124 (56.4%) |
| Total (Category) | 460 (57.6%) | 338 (42.4%) |
| Total (Overall) | 2,804 (49.5%) | 2,855 (50.4%) |
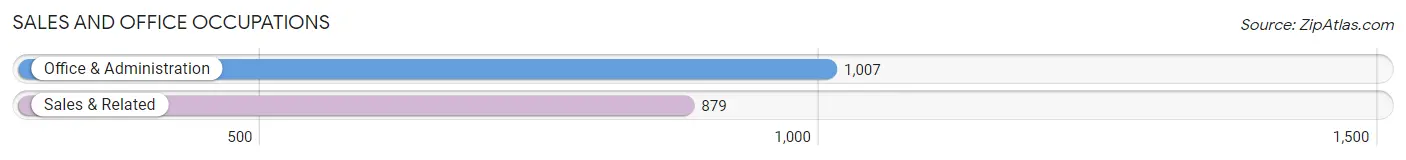
Sales and Office Occupations
The most common Sales and Office occupations in Candelaria are Office & Administration (1,007 | 17.8%), and Sales & Related (879 | 15.5%).
Sales and Office Occupations by Sex
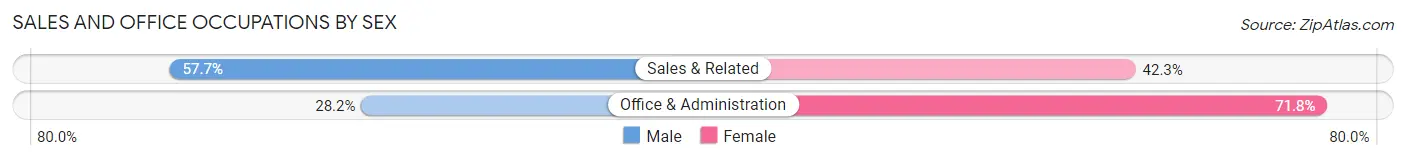
| Occupation | Male | Female |
| Sales & Related | 507 (57.7%) | 372 (42.3%) |
| Office & Administration | 284 (28.2%) | 723 (71.8%) |
| Total (Category) | 791 (41.9%) | 1,095 (58.1%) |
| Total (Overall) | 2,804 (49.5%) | 2,855 (50.4%) |
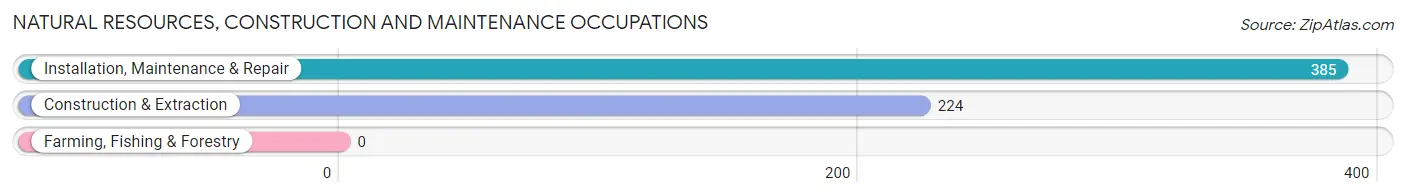
Natural Resources, Construction and Maintenance Occupations
The most common Natural Resources, Construction and Maintenance occupations in Candelaria are Installation, Maintenance & Repair (385 | 6.8%), and Construction & Extraction (224 | 4.0%).
Natural Resources, Construction and Maintenance Occupations by Sex
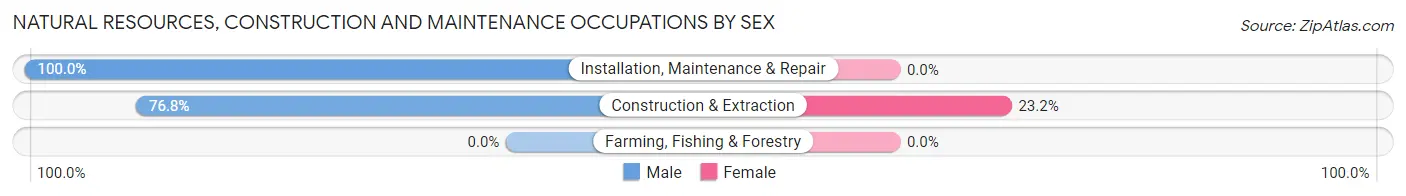
| Occupation | Male | Female |
| Farming, Fishing & Forestry | 0 (0.0%) | 0 (0.0%) |
| Construction & Extraction | 172 (76.8%) | 52 (23.2%) |
| Installation, Maintenance & Repair | 385 (100.0%) | 0 (0.0%) |
| Total (Category) | 557 (91.5%) | 52 (8.5%) |
| Total (Overall) | 2,804 (49.5%) | 2,855 (50.4%) |
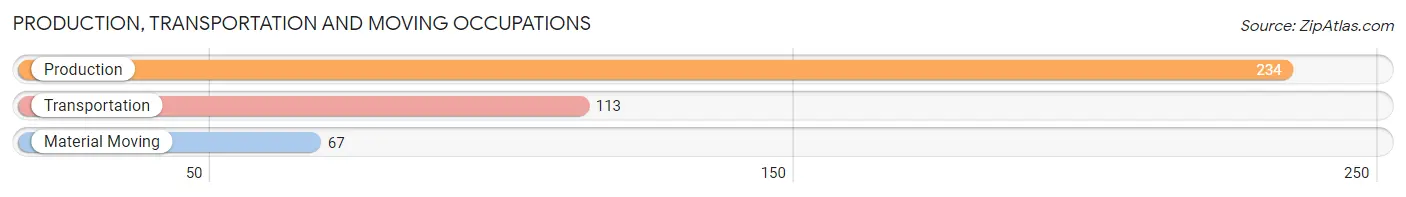
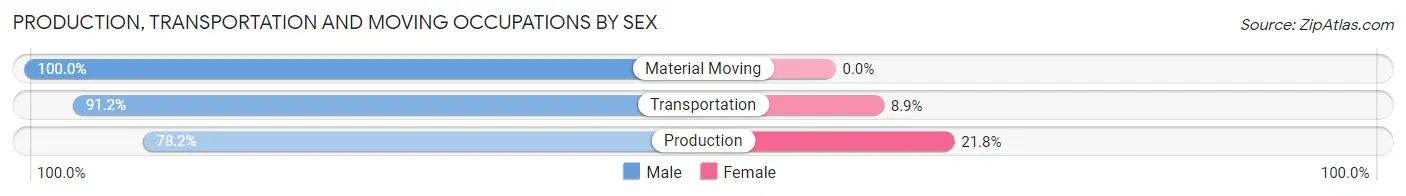
Production, Transportation and Moving Occupations
The most common Production, Transportation and Moving occupations in Candelaria are Production (234 | 4.1%), Transportation (113 | 2.0%), and Material Moving (67 | 1.2%).
Production, Transportation and Moving Occupations by Sex
| Occupation | Male | Female |
| Production | 183 (78.2%) | 51 (21.8%) |
| Transportation | 103 (91.1%) | 10 (8.8%) |
| Material Moving | 67 (100.0%) | 0 (0.0%) |
| Total (Category) | 353 (85.3%) | 61 (14.7%) |
| Total (Overall) | 2,804 (49.5%) | 2,855 (50.4%) |
Employment Industries by Sex in Candelaria
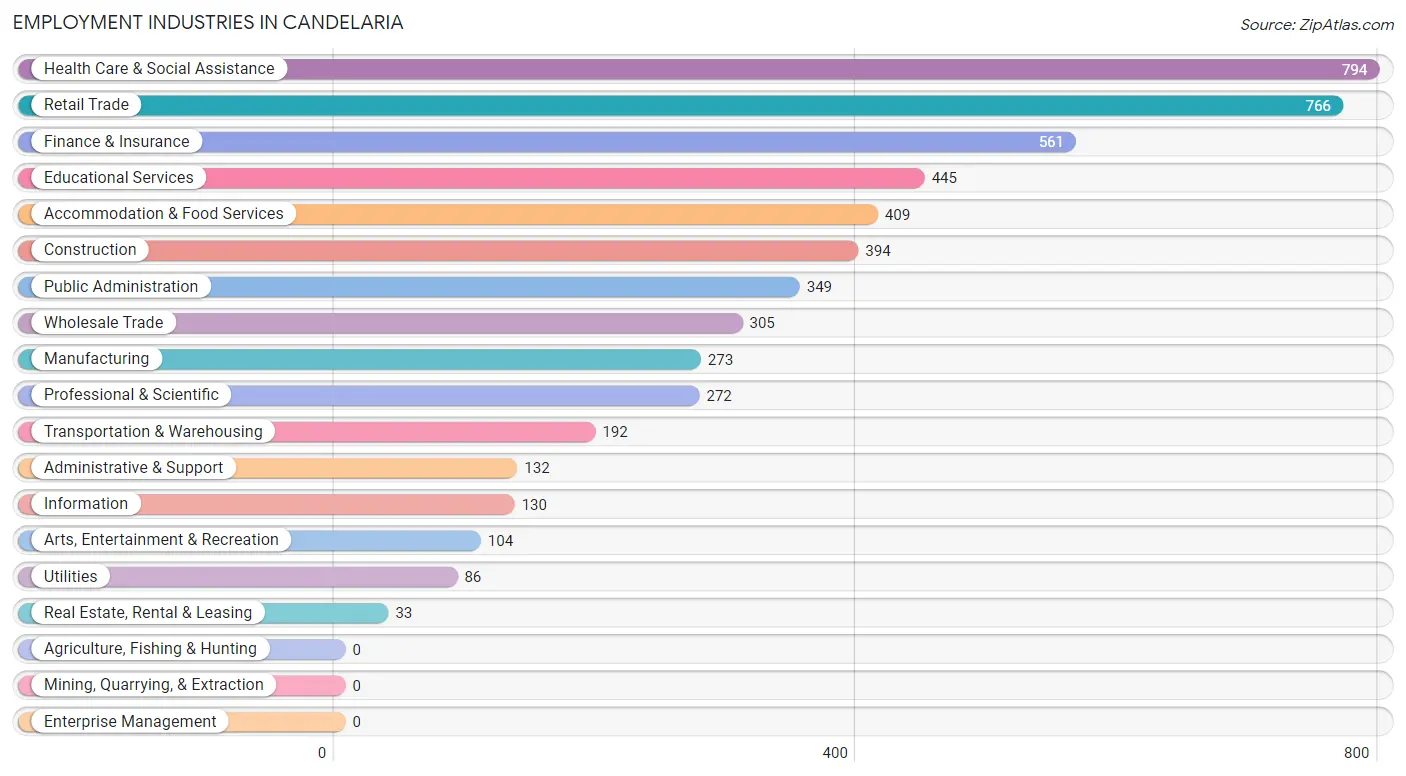
Employment Industries in Candelaria
The major employment industries in Candelaria include Health Care & Social Assistance (794 | 14.0%), Retail Trade (766 | 13.5%), Finance & Insurance (561 | 9.9%), Educational Services (445 | 7.9%), and Accommodation & Food Services (409 | 7.2%).
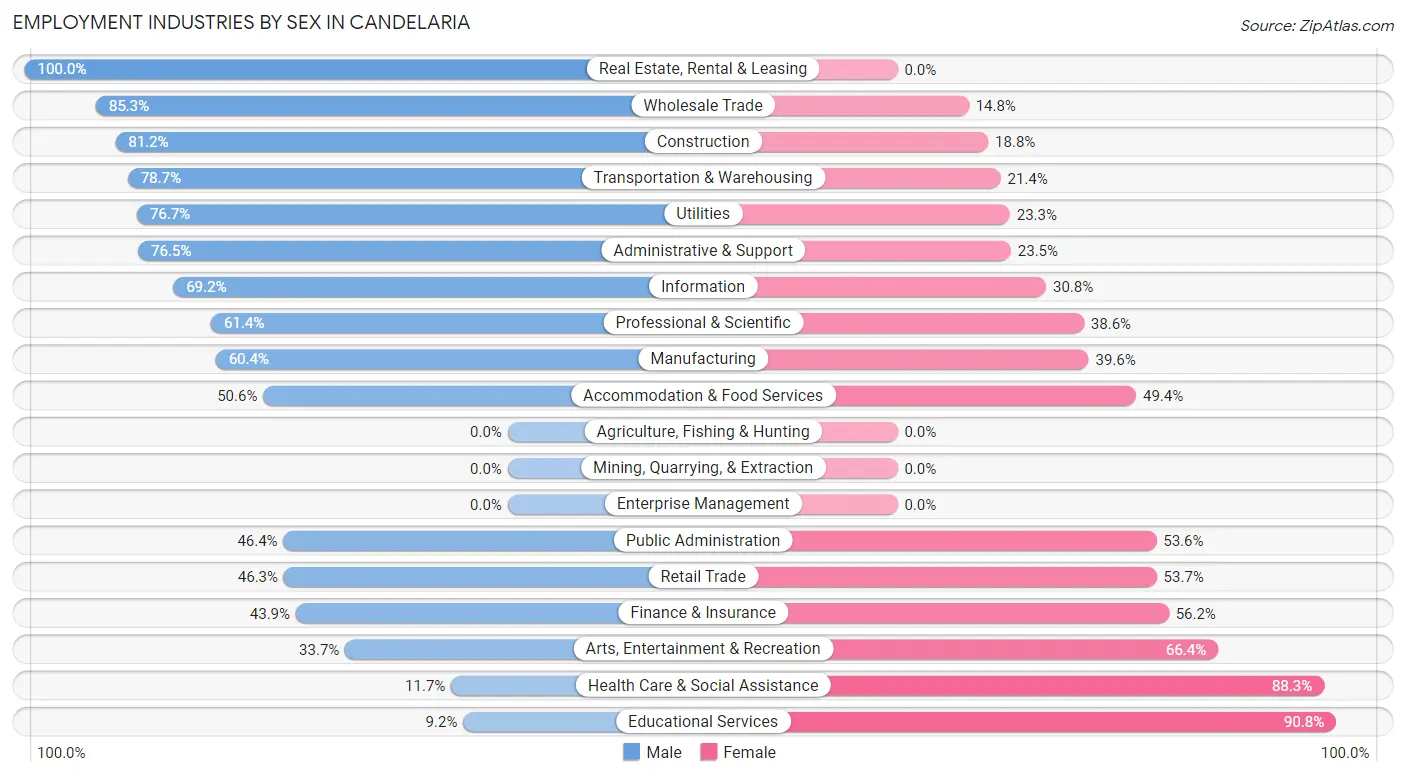
Employment Industries by Sex in Candelaria
The Candelaria industries that see more men than women are Real Estate, Rental & Leasing (100.0%), Wholesale Trade (85.3%), and Construction (81.2%), whereas the industries that tend to have a higher number of women are Educational Services (90.8%), Health Care & Social Assistance (88.3%), and Arts, Entertainment & Recreation (66.3%).
| Industry | Male | Female |
| Agriculture, Fishing & Hunting | 0 (0.0%) | 0 (0.0%) |
| Mining, Quarrying, & Extraction | 0 (0.0%) | 0 (0.0%) |
| Construction | 320 (81.2%) | 74 (18.8%) |
| Manufacturing | 165 (60.4%) | 108 (39.6%) |
| Wholesale Trade | 260 (85.3%) | 45 (14.7%) |
| Retail Trade | 355 (46.3%) | 411 (53.7%) |
| Transportation & Warehousing | 151 (78.6%) | 41 (21.3%) |
| Utilities | 66 (76.7%) | 20 (23.3%) |
| Information | 90 (69.2%) | 40 (30.8%) |
| Finance & Insurance | 246 (43.9%) | 315 (56.1%) |
| Real Estate, Rental & Leasing | 33 (100.0%) | 0 (0.0%) |
| Professional & Scientific | 167 (61.4%) | 105 (38.6%) |
| Enterprise Management | 0 (0.0%) | 0 (0.0%) |
| Administrative & Support | 101 (76.5%) | 31 (23.5%) |
| Educational Services | 41 (9.2%) | 404 (90.8%) |
| Health Care & Social Assistance | 93 (11.7%) | 701 (88.3%) |
| Arts, Entertainment & Recreation | 35 (33.7%) | 69 (66.3%) |
| Accommodation & Food Services | 207 (50.6%) | 202 (49.4%) |
| Public Administration | 162 (46.4%) | 187 (53.6%) |
| Total | 2,804 (49.5%) | 2,855 (50.4%) |
Education in Candelaria
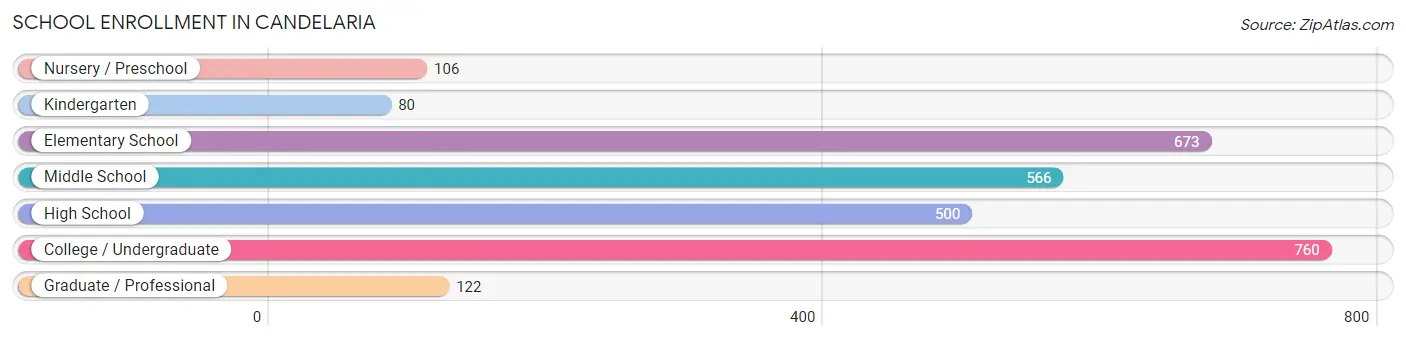
School Enrollment in Candelaria
The most common levels of schooling among the 2,807 students in Candelaria are college / undergraduate (760 | 27.1%), elementary school (673 | 24.0%), and middle school (566 | 20.2%).
| School Level | # Students | % Students |
| Nursery / Preschool | 106 | 3.8% |
| Kindergarten | 80 | 2.9% |
| Elementary School | 673 | 24.0% |
| Middle School | 566 | 20.2% |
| High School | 500 | 17.8% |
| College / Undergraduate | 760 | 27.1% |
| Graduate / Professional | 122 | 4.3% |
| Total | 2,807 | 100.0% |
School Enrollment by Age by Funding Source in Candelaria
Out of a total of 2,807 students who are enrolled in schools in Candelaria, 1,552 (55.3%) attend a private institution, while the remaining 1,255 (44.7%) are enrolled in public schools. The age group of 35 years and over has the highest likelihood of being enrolled in private schools, with 157 (82.6% in the age bracket) enrolled. Conversely, the age group of 5 to 9 year old has the lowest likelihood of being enrolled in a private school, with 412 (52.8% in the age bracket) attending a public institution.
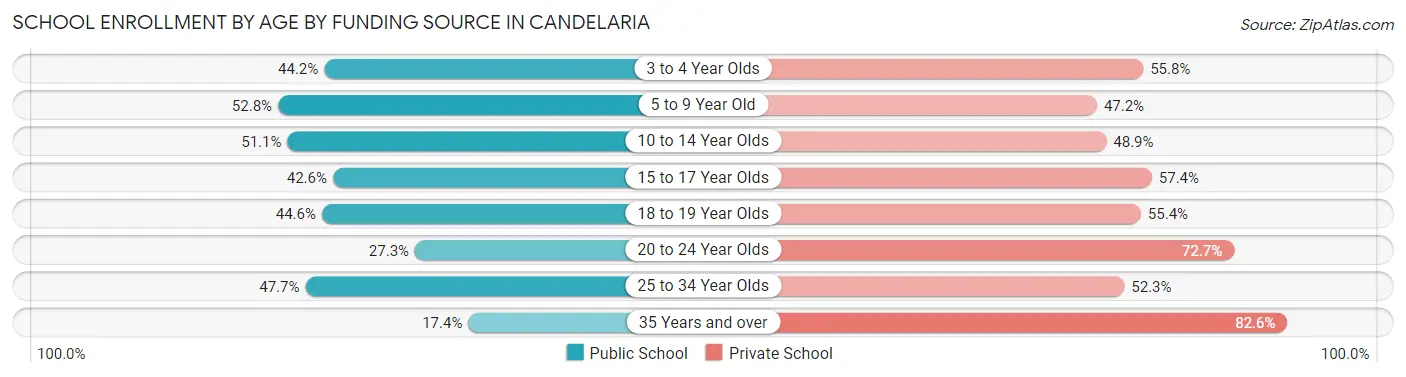
| Age Bracket | Public School | Private School |
| 3 to 4 Year Olds | 42 (44.2%) | 53 (55.8%) |
| 5 to 9 Year Old | 412 (52.8%) | 368 (47.2%) |
| 10 to 14 Year Olds | 335 (51.1%) | 321 (48.9%) |
| 15 to 17 Year Olds | 135 (42.6%) | 182 (57.4%) |
| 18 to 19 Year Olds | 100 (44.6%) | 124 (55.4%) |
| 20 to 24 Year Olds | 83 (27.3%) | 221 (72.7%) |
| 25 to 34 Year Olds | 115 (47.7%) | 126 (52.3%) |
| 35 Years and over | 33 (17.4%) | 157 (82.6%) |
| Total | 1,255 (44.7%) | 1,552 (55.3%) |
Educational Attainment by Field of Study in Candelaria
Business (1,057 | 30.2%), education (677 | 19.3%), science & technology (427 | 12.2%), bio, nature & agricultural (205 | 5.9%), and engineering (201 | 5.7%) are the most common fields of study among 3,504 individuals in Candelaria who have obtained a bachelor's degree or higher.
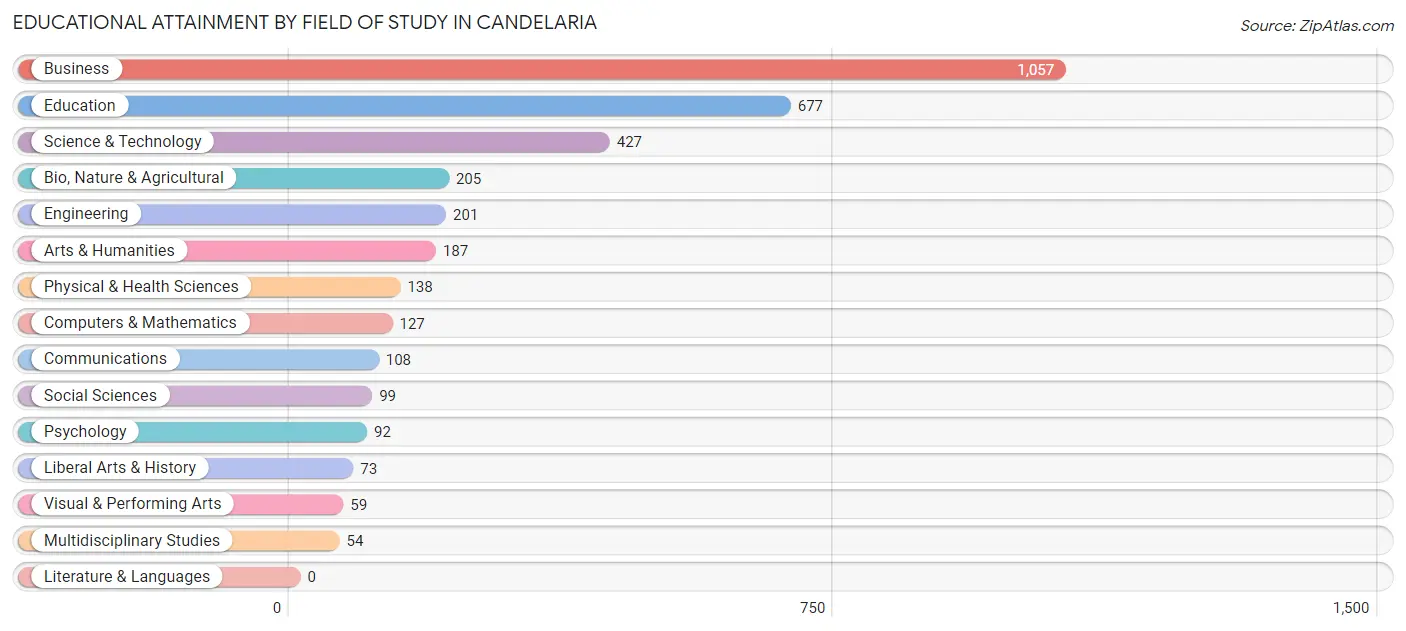
| Field of Study | # Graduates | % Graduates |
| Computers & Mathematics | 127 | 3.6% |
| Bio, Nature & Agricultural | 205 | 5.9% |
| Physical & Health Sciences | 138 | 3.9% |
| Psychology | 92 | 2.6% |
| Social Sciences | 99 | 2.8% |
| Engineering | 201 | 5.7% |
| Multidisciplinary Studies | 54 | 1.5% |
| Science & Technology | 427 | 12.2% |
| Business | 1,057 | 30.2% |
| Education | 677 | 19.3% |
| Literature & Languages | 0 | 0.0% |
| Liberal Arts & History | 73 | 2.1% |
| Visual & Performing Arts | 59 | 1.7% |
| Communications | 108 | 3.1% |
| Arts & Humanities | 187 | 5.3% |
| Total | 3,504 | 100.0% |
Transportation & Commute in Candelaria
Vehicle Availability by Sex in Candelaria
The most prevalent vehicle ownership categories in Candelaria are males with 2 vehicles (1,233, accounting for 44.2%) and females with 2 vehicles (1,245, making up 44.9%).
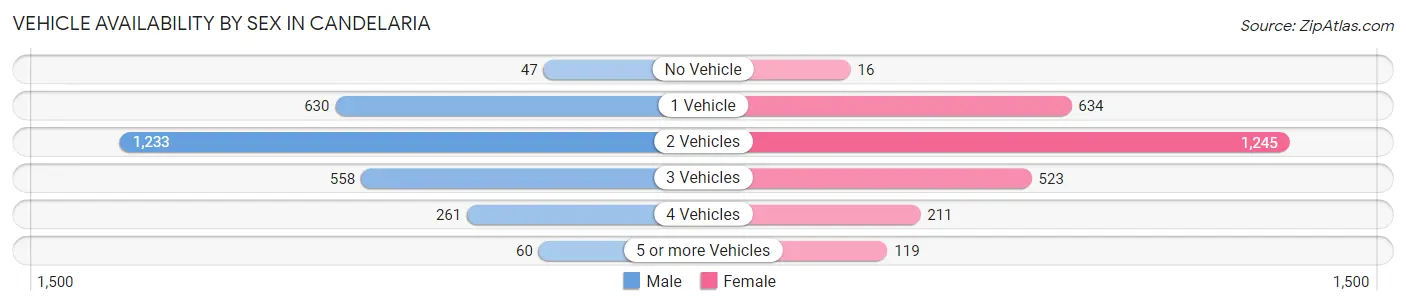
| Vehicles Available | Male | Female |
| No Vehicle | 47 (1.7%) | 16 (0.6%) |
| 1 Vehicle | 630 (22.6%) | 634 (23.1%) |
| 2 Vehicles | 1,233 (44.2%) | 1,245 (45.3%) |
| 3 Vehicles | 558 (20.0%) | 523 (19.0%) |
| 4 Vehicles | 261 (9.4%) | 211 (7.7%) |
| 5 or more Vehicles | 60 (2.1%) | 119 (4.3%) |
| Total | 2,789 (100.0%) | 2,748 (100.0%) |
Commute Time in Candelaria
The most frequently occuring commute durations in Candelaria are 30 to 34 minutes (1,199 commuters, 24.2%), 45 to 59 minutes (818 commuters, 16.5%), and 60 to 89 minutes (639 commuters, 12.9%).
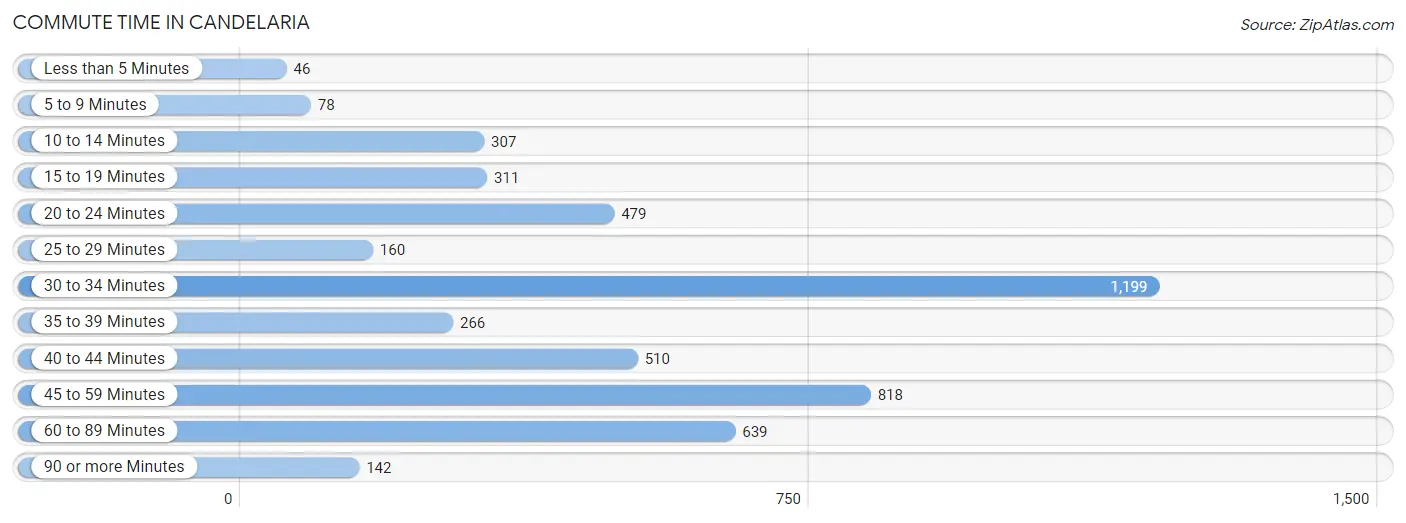
| Commute Time | # Commuters | % Commuters |
| Less than 5 Minutes | 46 | 0.9% |
| 5 to 9 Minutes | 78 | 1.6% |
| 10 to 14 Minutes | 307 | 6.2% |
| 15 to 19 Minutes | 311 | 6.3% |
| 20 to 24 Minutes | 479 | 9.7% |
| 25 to 29 Minutes | 160 | 3.2% |
| 30 to 34 Minutes | 1,199 | 24.2% |
| 35 to 39 Minutes | 266 | 5.4% |
| 40 to 44 Minutes | 510 | 10.3% |
| 45 to 59 Minutes | 818 | 16.5% |
| 60 to 89 Minutes | 639 | 12.9% |
| 90 or more Minutes | 142 | 2.9% |
Commute Time by Sex in Candelaria
The most common commute times in Candelaria are 30 to 34 minutes (691 commuters, 27.5%) for males and 30 to 34 minutes (508 commuters, 20.8%) for females.
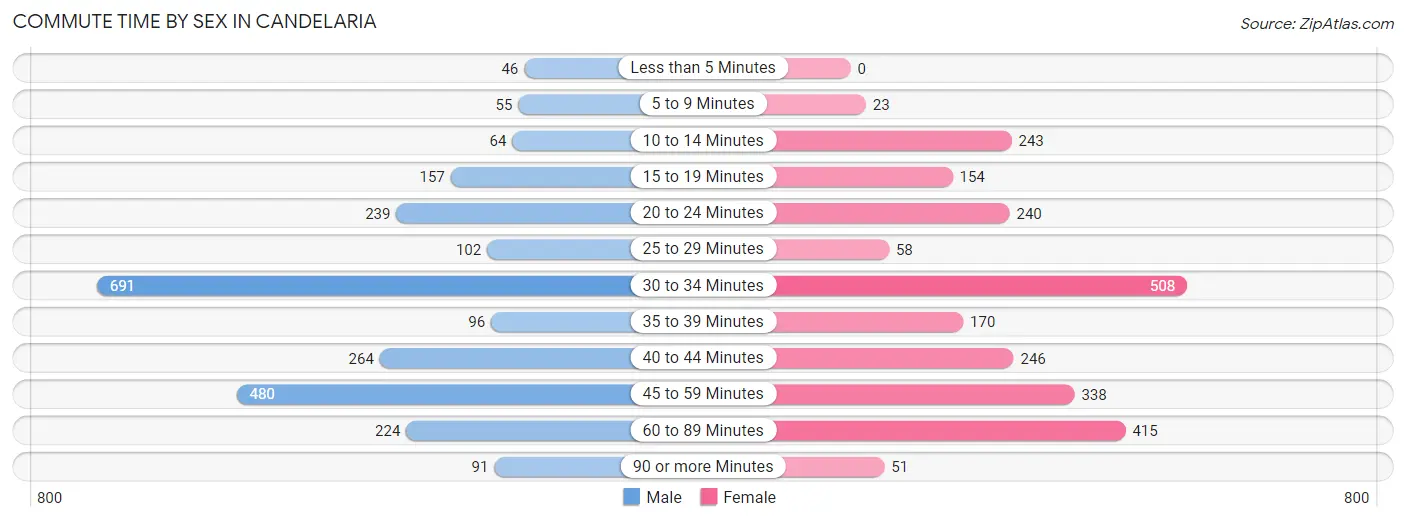
| Commute Time | Male | Female |
| Less than 5 Minutes | 46 (1.8%) | 0 (0.0%) |
| 5 to 9 Minutes | 55 (2.2%) | 23 (0.9%) |
| 10 to 14 Minutes | 64 (2.5%) | 243 (9.9%) |
| 15 to 19 Minutes | 157 (6.3%) | 154 (6.3%) |
| 20 to 24 Minutes | 239 (9.5%) | 240 (9.8%) |
| 25 to 29 Minutes | 102 (4.1%) | 58 (2.4%) |
| 30 to 34 Minutes | 691 (27.5%) | 508 (20.8%) |
| 35 to 39 Minutes | 96 (3.8%) | 170 (7.0%) |
| 40 to 44 Minutes | 264 (10.5%) | 246 (10.1%) |
| 45 to 59 Minutes | 480 (19.1%) | 338 (13.8%) |
| 60 to 89 Minutes | 224 (8.9%) | 415 (17.0%) |
| 90 or more Minutes | 91 (3.6%) | 51 (2.1%) |
Time of Departure to Work by Sex in Candelaria
The most frequent times of departure to work in Candelaria are 6:00 AM to 6:29 AM (344, 13.7%) for males and 6:30 AM to 6:59 AM (576, 23.5%) for females.
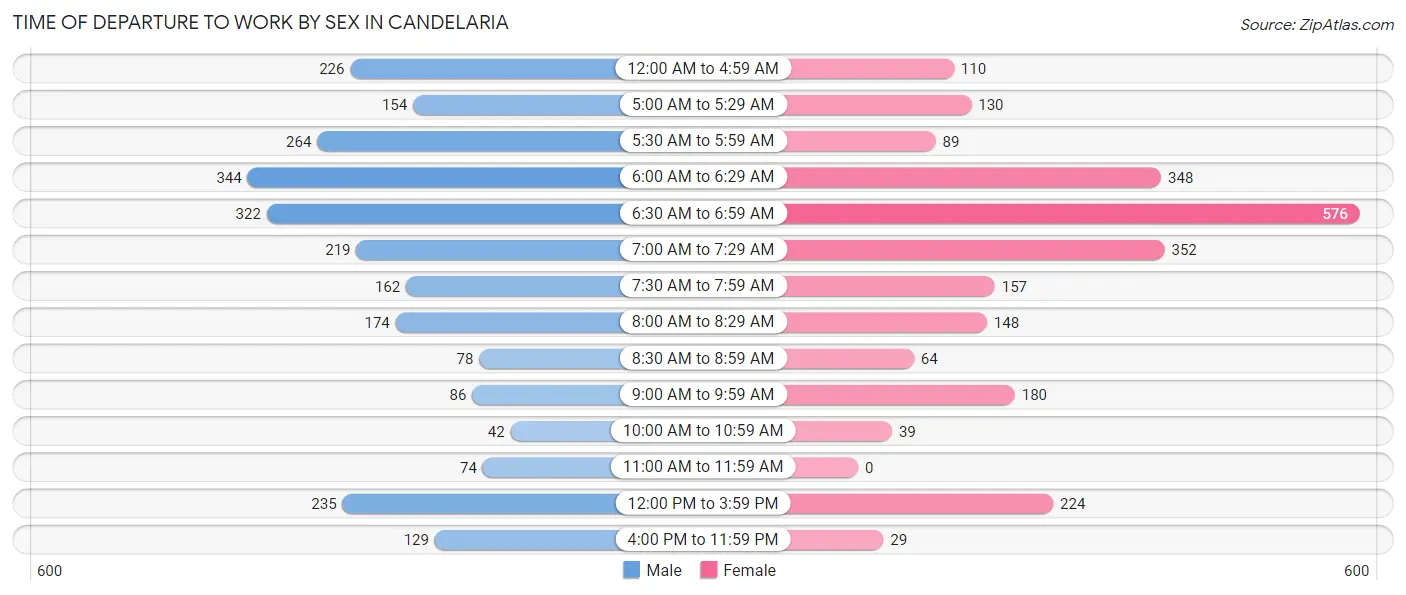
| Time of Departure | Male | Female |
| 12:00 AM to 4:59 AM | 226 (9.0%) | 110 (4.5%) |
| 5:00 AM to 5:29 AM | 154 (6.1%) | 130 (5.3%) |
| 5:30 AM to 5:59 AM | 264 (10.5%) | 89 (3.6%) |
| 6:00 AM to 6:29 AM | 344 (13.7%) | 348 (14.2%) |
| 6:30 AM to 6:59 AM | 322 (12.8%) | 576 (23.5%) |
| 7:00 AM to 7:29 AM | 219 (8.7%) | 352 (14.4%) |
| 7:30 AM to 7:59 AM | 162 (6.5%) | 157 (6.4%) |
| 8:00 AM to 8:29 AM | 174 (6.9%) | 148 (6.0%) |
| 8:30 AM to 8:59 AM | 78 (3.1%) | 64 (2.6%) |
| 9:00 AM to 9:59 AM | 86 (3.4%) | 180 (7.4%) |
| 10:00 AM to 10:59 AM | 42 (1.7%) | 39 (1.6%) |
| 11:00 AM to 11:59 AM | 74 (2.9%) | 0 (0.0%) |
| 12:00 PM to 3:59 PM | 235 (9.4%) | 224 (9.2%) |
| 4:00 PM to 11:59 PM | 129 (5.1%) | 29 (1.2%) |
| Total | 2,509 (100.0%) | 2,446 (100.0%) |
Housing Occupancy in Candelaria
Occupancy by Ownership in Candelaria
Of the total 5,228 dwellings in Candelaria, owner-occupied units account for 3,962 (75.8%), while renter-occupied units make up 1,266 (24.2%).
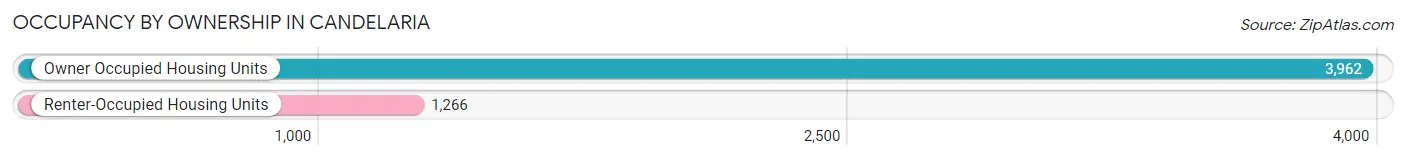
| Occupancy | # Housing Units | % Housing Units |
| Owner Occupied Housing Units | 3,962 | 75.8% |
| Renter-Occupied Housing Units | 1,266 | 24.2% |
| Total Occupied Housing Units | 5,228 | 100.0% |
Occupancy by Household Size in Candelaria
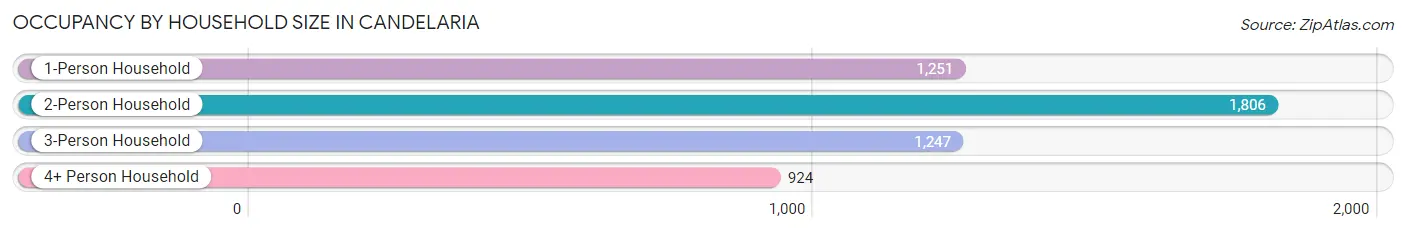
| Household Size | # Housing Units | % Housing Units |
| 1-Person Household | 1,251 | 23.9% |
| 2-Person Household | 1,806 | 34.5% |
| 3-Person Household | 1,247 | 23.8% |
| 4+ Person Household | 924 | 17.7% |
| Total Housing Units | 5,228 | 100.0% |
Occupancy by Ownership by Household Size in Candelaria
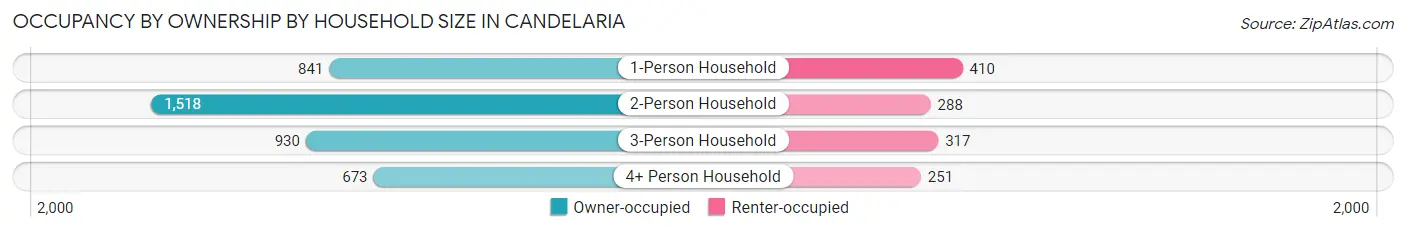
| Household Size | Owner-occupied | Renter-occupied |
| 1-Person Household | 841 (67.2%) | 410 (32.8%) |
| 2-Person Household | 1,518 (84.1%) | 288 (16.0%) |
| 3-Person Household | 930 (74.6%) | 317 (25.4%) |
| 4+ Person Household | 673 (72.8%) | 251 (27.2%) |
| Total Housing Units | 3,962 (75.8%) | 1,266 (24.2%) |
Occupancy by Educational Attainment in Candelaria
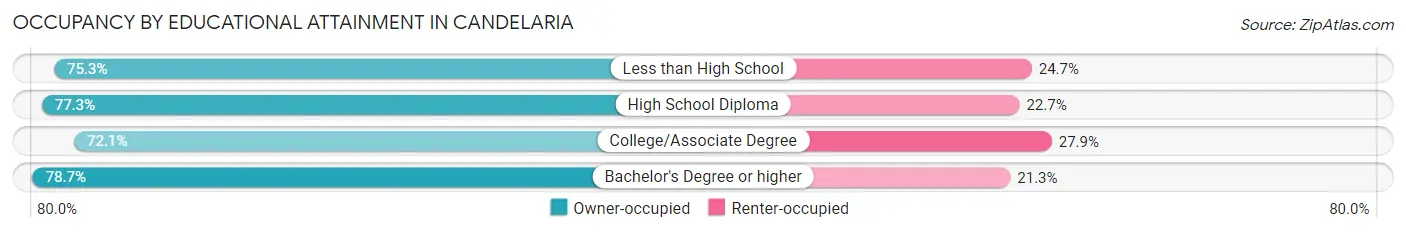
| Household Size | Owner-occupied | Renter-occupied |
| Less than High School | 473 (75.3%) | 155 (24.7%) |
| High School Diploma | 758 (77.3%) | 223 (22.7%) |
| College/Associate Degree | 1,292 (72.1%) | 499 (27.9%) |
| Bachelor's Degree or higher | 1,439 (78.7%) | 389 (21.3%) |
Occupancy by Age of Householder in Candelaria
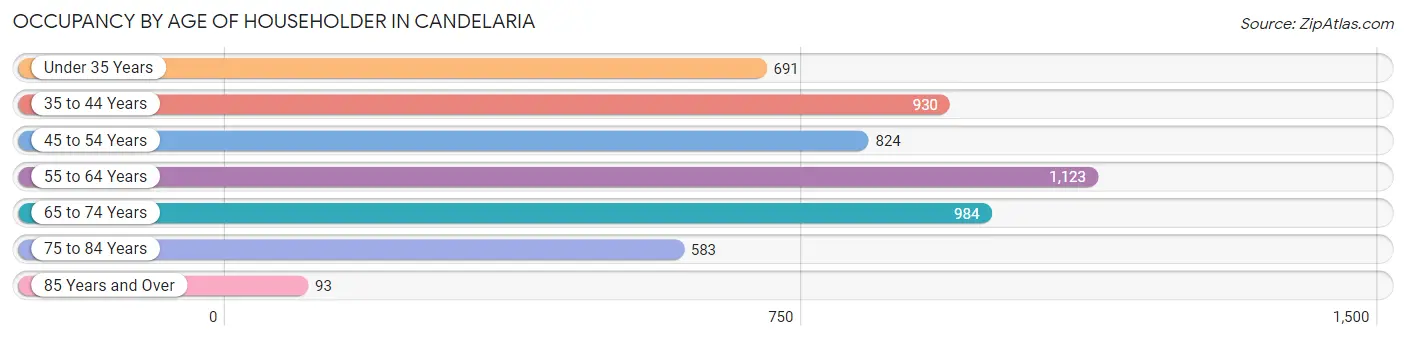
| Age Bracket | # Households | % Households |
| Under 35 Years | 691 | 13.2% |
| 35 to 44 Years | 930 | 17.8% |
| 45 to 54 Years | 824 | 15.8% |
| 55 to 64 Years | 1,123 | 21.5% |
| 65 to 74 Years | 984 | 18.8% |
| 75 to 84 Years | 583 | 11.2% |
| 85 Years and Over | 93 | 1.8% |
| Total | 5,228 | 100.0% |
Housing Finances in Candelaria
Median Income by Occupancy in Candelaria
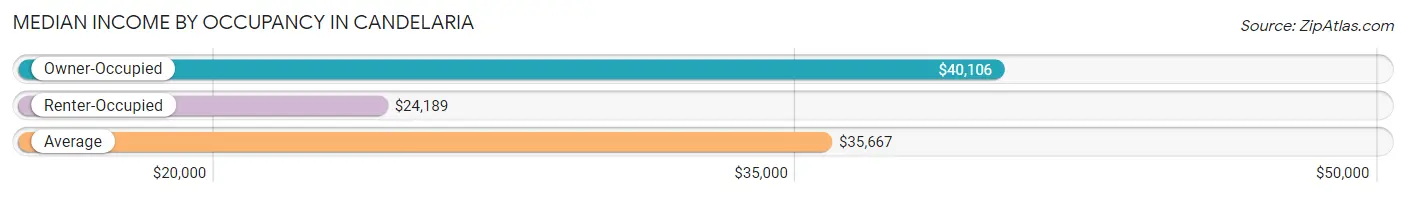
| Occupancy Type | # Households | Median Income |
| Owner-Occupied | 3,962 (75.8%) | $40,106 |
| Renter-Occupied | 1,266 (24.2%) | $24,189 |
| Average | 5,228 (100.0%) | $35,667 |
Occupancy by Householder Income Bracket in Candelaria
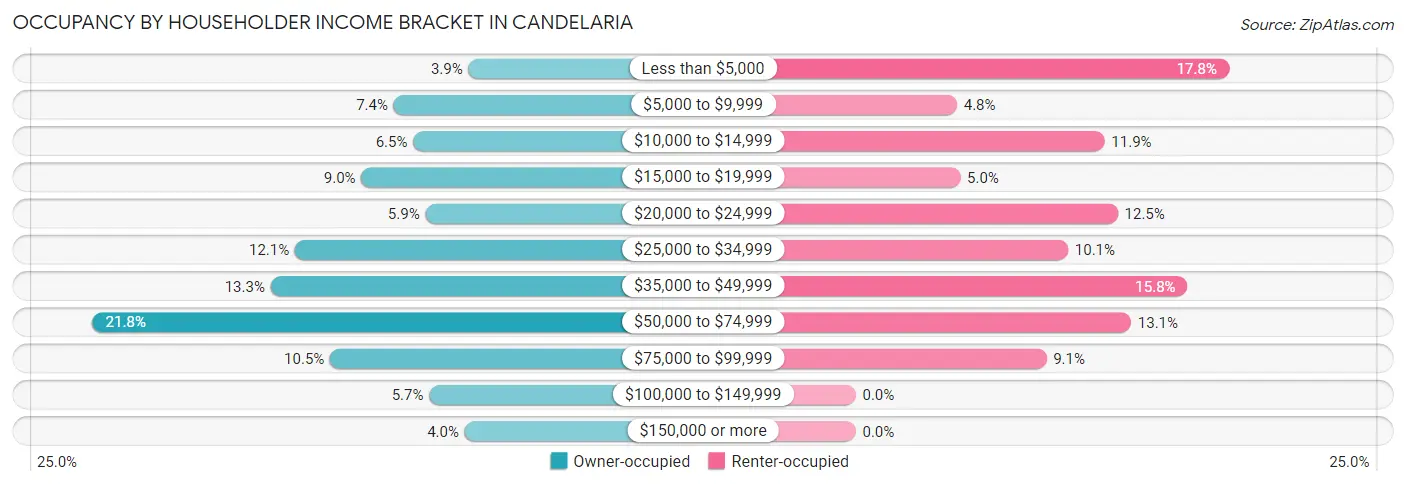
| Income Bracket | Owner-occupied | Renter-occupied |
| Less than $5,000 | 153 (3.9%) | 225 (17.8%) |
| $5,000 to $9,999 | 294 (7.4%) | 61 (4.8%) |
| $10,000 to $14,999 | 257 (6.5%) | 150 (11.8%) |
| $15,000 to $19,999 | 355 (9.0%) | 63 (5.0%) |
| $20,000 to $24,999 | 234 (5.9%) | 158 (12.5%) |
| $25,000 to $34,999 | 480 (12.1%) | 128 (10.1%) |
| $35,000 to $49,999 | 526 (13.3%) | 200 (15.8%) |
| $50,000 to $74,999 | 862 (21.8%) | 166 (13.1%) |
| $75,000 to $99,999 | 414 (10.4%) | 115 (9.1%) |
| $100,000 to $149,999 | 227 (5.7%) | 0 (0.0%) |
| $150,000 or more | 160 (4.0%) | 0 (0.0%) |
| Total | 3,962 (100.0%) | 1,266 (100.0%) |
Monthly Housing Cost Tiers in Candelaria
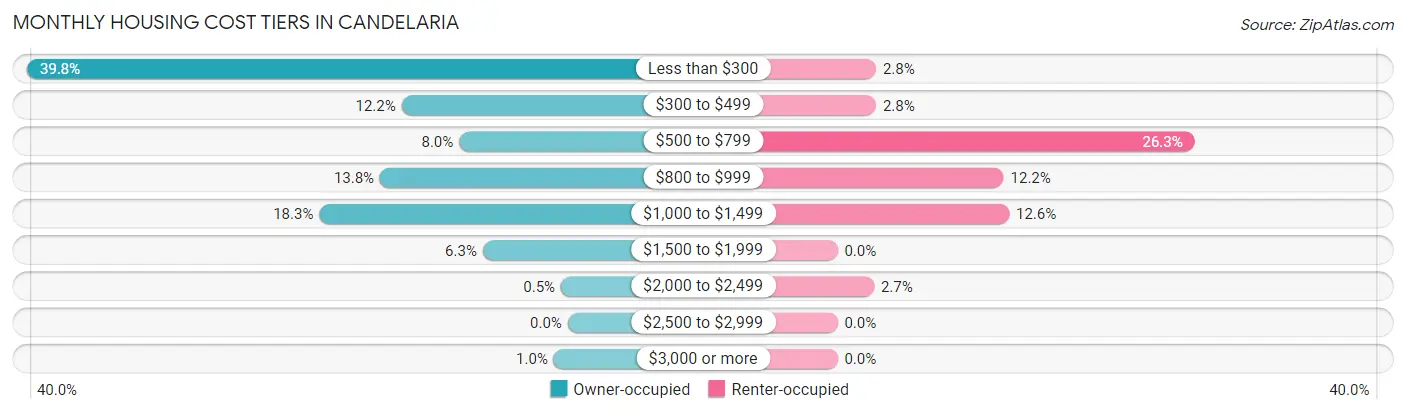
| Monthly Cost | Owner-occupied | Renter-occupied |
| Less than $300 | 1,578 (39.8%) | 36 (2.8%) |
| $300 to $499 | 485 (12.2%) | 36 (2.8%) |
| $500 to $799 | 317 (8.0%) | 333 (26.3%) |
| $800 to $999 | 548 (13.8%) | 155 (12.2%) |
| $1,000 to $1,499 | 725 (18.3%) | 160 (12.6%) |
| $1,500 to $1,999 | 248 (6.3%) | 0 (0.0%) |
| $2,000 to $2,499 | 20 (0.5%) | 34 (2.7%) |
| $2,500 to $2,999 | 0 (0.0%) | 0 (0.0%) |
| $3,000 or more | 41 (1.0%) | 0 (0.0%) |
| Total | 3,962 (100.0%) | 1,266 (100.0%) |
Physical Housing Characteristics in Candelaria
Housing Structures in Candelaria
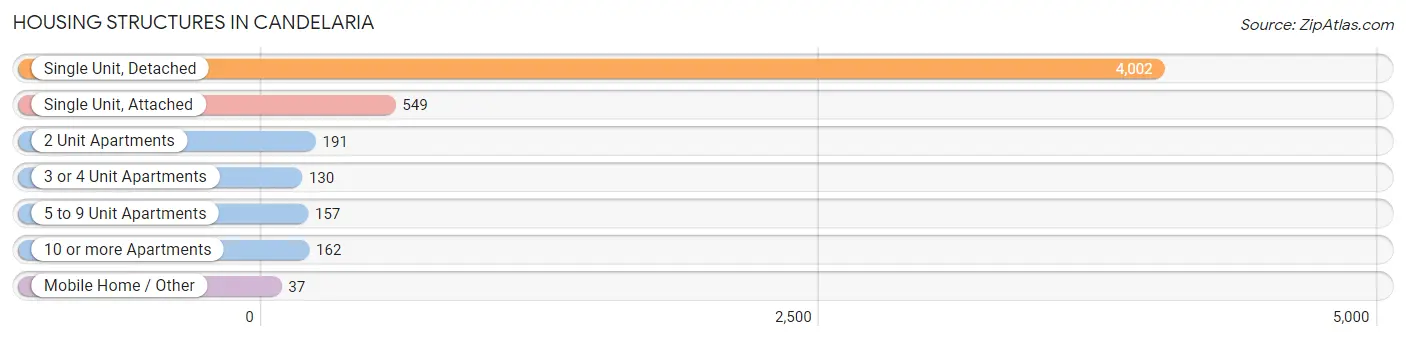
| Structure Type | # Housing Units | % Housing Units |
| Single Unit, Detached | 4,002 | 76.5% |
| Single Unit, Attached | 549 | 10.5% |
| 2 Unit Apartments | 191 | 3.6% |
| 3 or 4 Unit Apartments | 130 | 2.5% |
| 5 to 9 Unit Apartments | 157 | 3.0% |
| 10 or more Apartments | 162 | 3.1% |
| Mobile Home / Other | 37 | 0.7% |
| Total | 5,228 | 100.0% |
Housing Structures by Occupancy in Candelaria
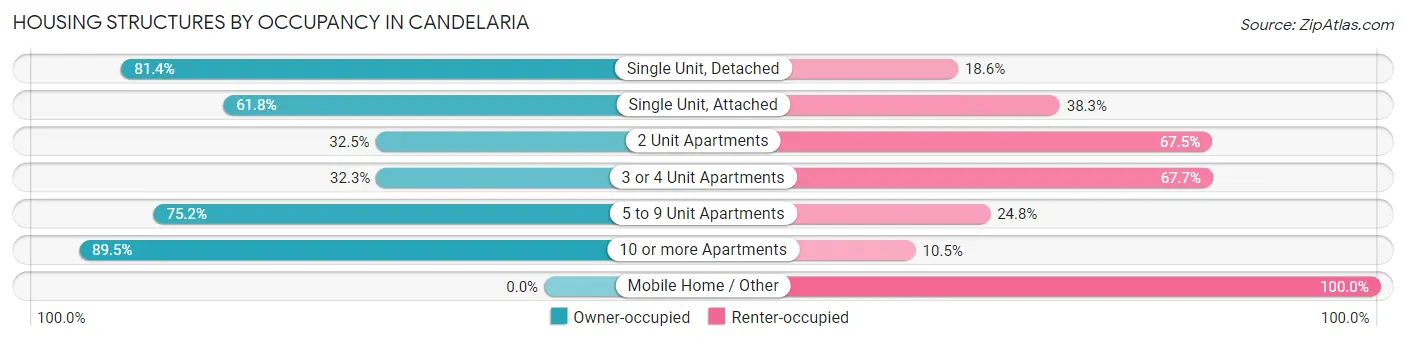
| Structure Type | Owner-occupied | Renter-occupied |
| Single Unit, Detached | 3,256 (81.4%) | 746 (18.6%) |
| Single Unit, Attached | 339 (61.8%) | 210 (38.3%) |
| 2 Unit Apartments | 62 (32.5%) | 129 (67.5%) |
| 3 or 4 Unit Apartments | 42 (32.3%) | 88 (67.7%) |
| 5 to 9 Unit Apartments | 118 (75.2%) | 39 (24.8%) |
| 10 or more Apartments | 145 (89.5%) | 17 (10.5%) |
| Mobile Home / Other | 0 (0.0%) | 37 (100.0%) |
| Total | 3,962 (75.8%) | 1,266 (24.2%) |
Housing Structures by Number of Rooms in Candelaria
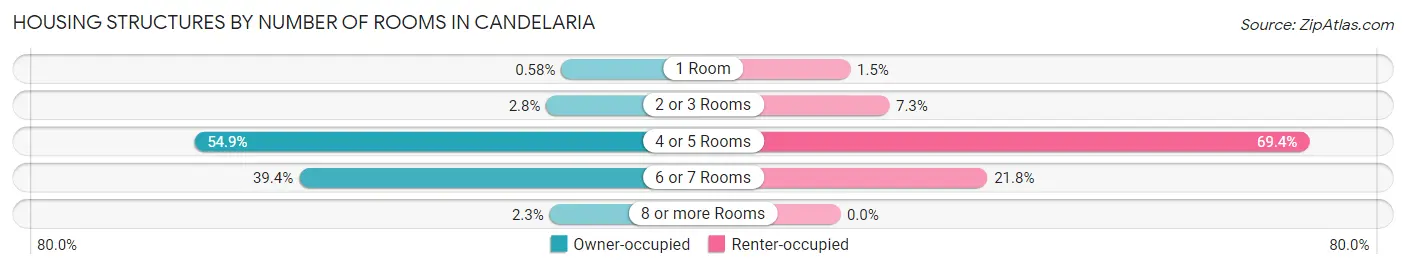
| Number of Rooms | Owner-occupied | Renter-occupied |
| 1 Room | 23 (0.6%) | 19 (1.5%) |
| 2 or 3 Rooms | 111 (2.8%) | 92 (7.3%) |
| 4 or 5 Rooms | 2,175 (54.9%) | 879 (69.4%) |
| 6 or 7 Rooms | 1,561 (39.4%) | 276 (21.8%) |
| 8 or more Rooms | 92 (2.3%) | 0 (0.0%) |
| Total | 3,962 (100.0%) | 1,266 (100.0%) |
Housing Structure by Heating Type in Candelaria
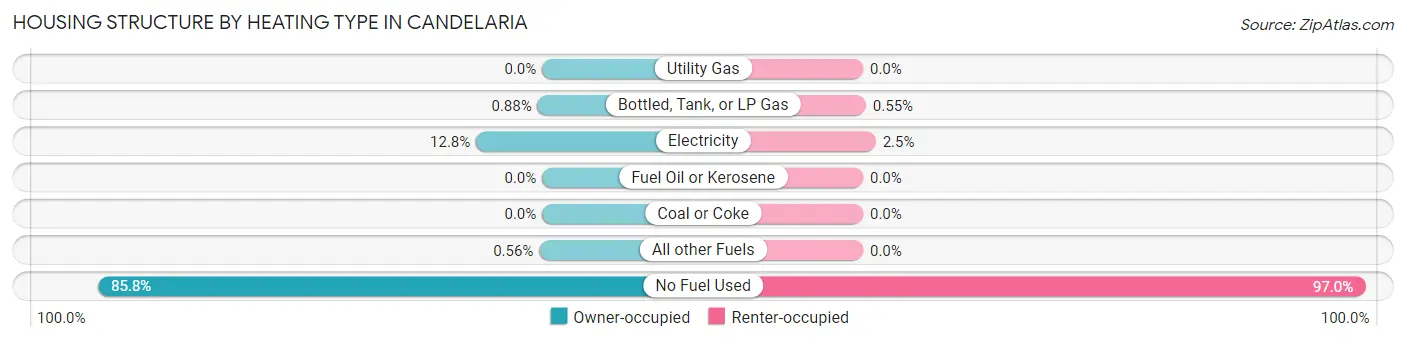
| Heating Type | Owner-occupied | Renter-occupied |
| Utility Gas | 0 (0.0%) | 0 (0.0%) |
| Bottled, Tank, or LP Gas | 35 (0.9%) | 7 (0.5%) |
| Electricity | 505 (12.8%) | 31 (2.5%) |
| Fuel Oil or Kerosene | 0 (0.0%) | 0 (0.0%) |
| Coal or Coke | 0 (0.0%) | 0 (0.0%) |
| All other Fuels | 22 (0.6%) | 0 (0.0%) |
| No Fuel Used | 3,400 (85.8%) | 1,228 (97.0%) |
| Total | 3,962 (100.0%) | 1,266 (100.0%) |
Household Vehicle Usage in Candelaria
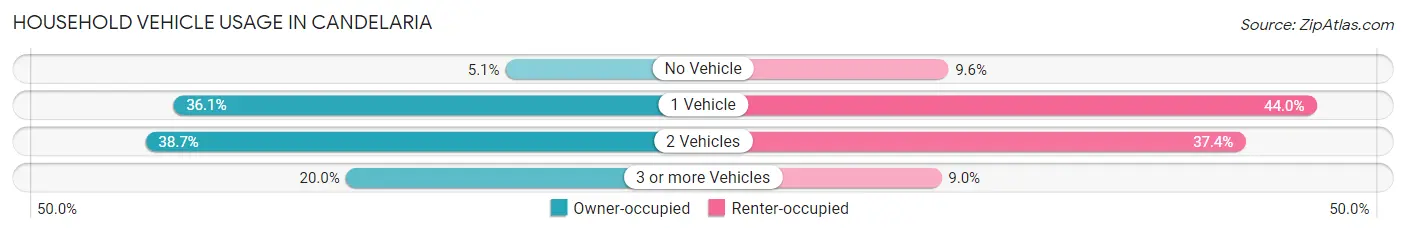
| Vehicles per Household | Owner-occupied | Renter-occupied |
| No Vehicle | 203 (5.1%) | 122 (9.6%) |
| 1 Vehicle | 1,431 (36.1%) | 557 (44.0%) |
| 2 Vehicles | 1,534 (38.7%) | 473 (37.4%) |
| 3 or more Vehicles | 794 (20.0%) | 114 (9.0%) |
| Total | 3,962 (100.0%) | 1,266 (100.0%) |
Real Estate & Mortgages in Candelaria
Real Estate and Mortgage Overview in Candelaria
| Characteristic | Without Mortgage | With Mortgage |
| Housing Units | 2,108 | 1,854 |
| Median Property Value | $130,800 | $147,800 |
| Median Household Income | $26,136 | $104 |
| Monthly Housing Costs | $226 | $41 |
| Real Estate Taxes | $476 | $1,715 |
Property Value by Mortgage Status in Candelaria
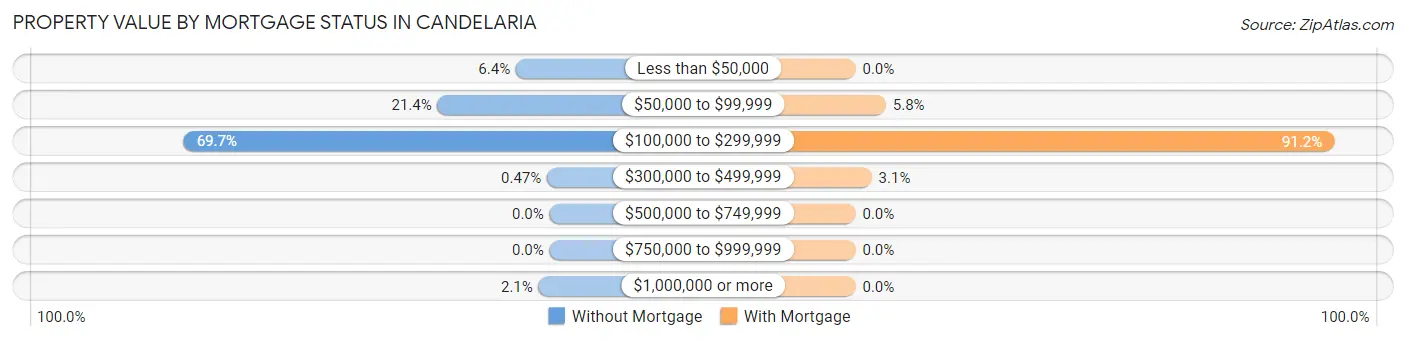
| Property Value | Without Mortgage | With Mortgage |
| Less than $50,000 | 135 (6.4%) | 0 (0.0%) |
| $50,000 to $99,999 | 450 (21.3%) | 107 (5.8%) |
| $100,000 to $299,999 | 1,469 (69.7%) | 1,690 (91.1%) |
| $300,000 to $499,999 | 10 (0.5%) | 57 (3.1%) |
| $500,000 to $749,999 | 0 (0.0%) | 0 (0.0%) |
| $750,000 to $999,999 | 0 (0.0%) | 0 (0.0%) |
| $1,000,000 or more | 44 (2.1%) | 0 (0.0%) |
| Total | 2,108 (100.0%) | 1,854 (100.0%) |
Household Income by Mortgage Status in Candelaria
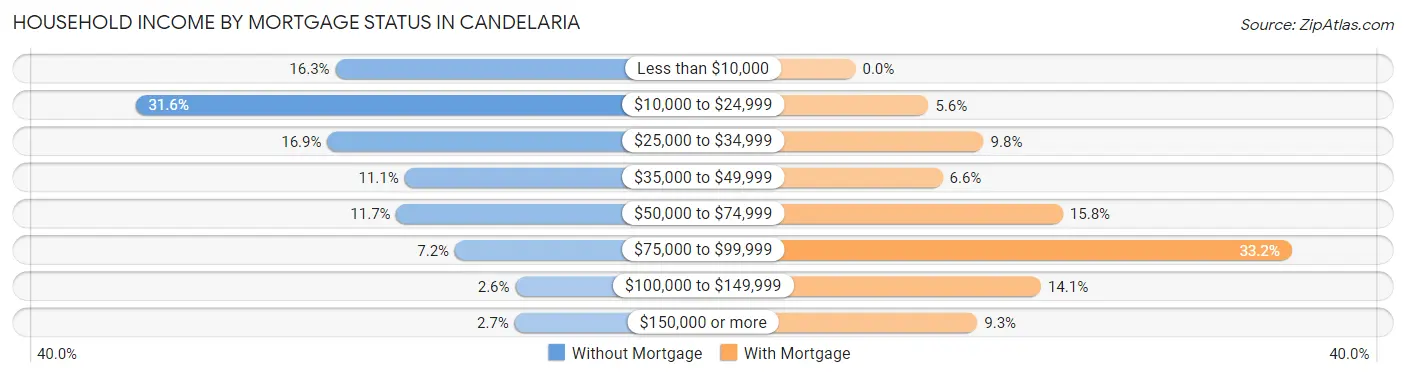
| Household Income | Without Mortgage | With Mortgage |
| Less than $10,000 | 344 (16.3%) | 0 (0.0%) |
| $10,000 to $24,999 | 665 (31.6%) | 103 (5.6%) |
| $25,000 to $34,999 | 357 (16.9%) | 181 (9.8%) |
| $35,000 to $49,999 | 233 (11.1%) | 123 (6.6%) |
| $50,000 to $74,999 | 246 (11.7%) | 293 (15.8%) |
| $75,000 to $99,999 | 152 (7.2%) | 616 (33.2%) |
| $100,000 to $149,999 | 55 (2.6%) | 262 (14.1%) |
| $150,000 or more | 56 (2.7%) | 172 (9.3%) |
| Total | 2,108 (100.0%) | 1,854 (100.0%) |
Property Value to Household Income Ratio in Candelaria
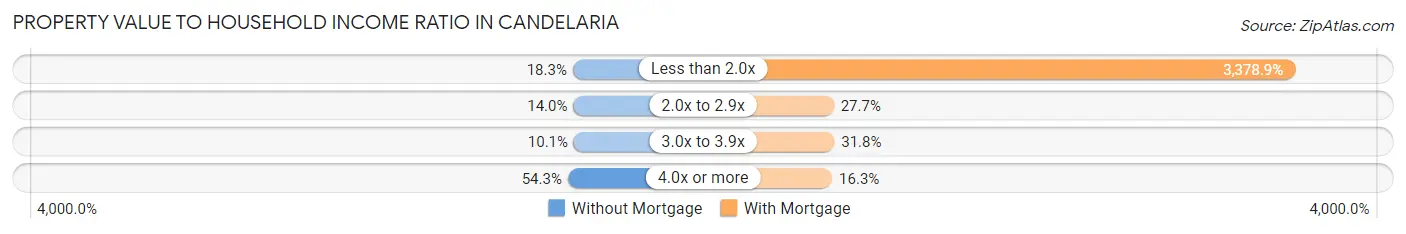
| Value-to-Income Ratio | Without Mortgage | With Mortgage |
| Less than 2.0x | 385 (18.3%) | 62,644 (3,378.9%) |
| 2.0x to 2.9x | 294 (14.0%) | 514 (27.7%) |
| 3.0x to 3.9x | 212 (10.1%) | 589 (31.8%) |
| 4.0x or more | 1,144 (54.3%) | 303 (16.3%) |
| Total | 2,108 (100.0%) | 1,854 (100.0%) |
Real Estate Taxes by Mortgage Status in Candelaria
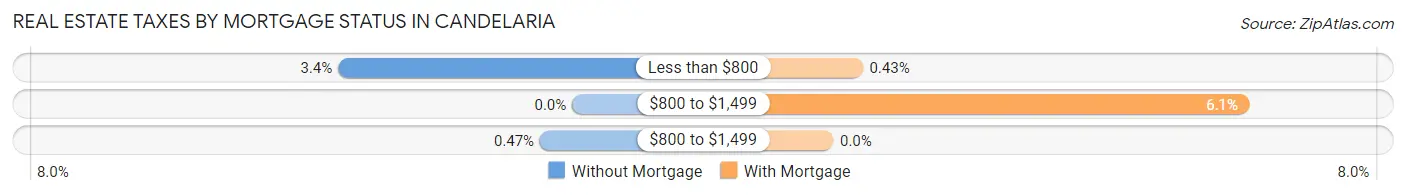
| Property Taxes | Without Mortgage | With Mortgage |
| Less than $800 | 72 (3.4%) | 8 (0.4%) |
| $800 to $1,499 | 0 (0.0%) | 113 (6.1%) |
| $800 to $1,499 | 10 (0.5%) | 0 (0.0%) |
| Total | 2,108 (100.0%) | 1,854 (100.0%) |
Health & Disability in Candelaria
Health Insurance Coverage by Age in Candelaria
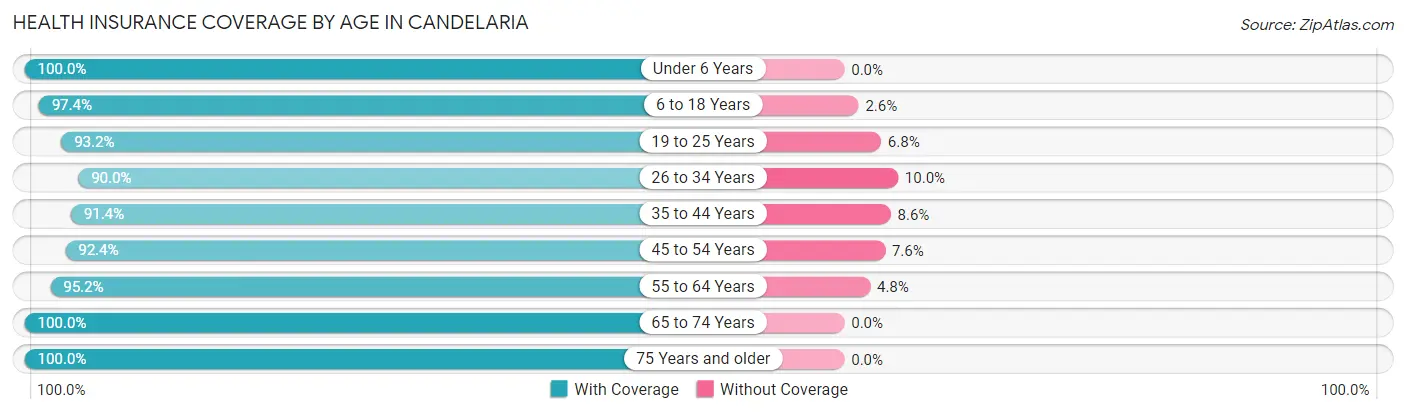
| Age Bracket | With Coverage | Without Coverage |
| Under 6 Years | 644 (100.0%) | 0 (0.0%) |
| 6 to 18 Years | 1,878 (97.4%) | 51 (2.6%) |
| 19 to 25 Years | 1,105 (93.2%) | 81 (6.8%) |
| 26 to 34 Years | 1,575 (90.0%) | 175 (10.0%) |
| 35 to 44 Years | 1,821 (91.4%) | 172 (8.6%) |
| 45 to 54 Years | 1,521 (92.4%) | 125 (7.6%) |
| 55 to 64 Years | 1,845 (95.2%) | 93 (4.8%) |
| 65 to 74 Years | 1,641 (100.0%) | 0 (0.0%) |
| 75 Years and older | 1,252 (100.0%) | 0 (0.0%) |
| Total | 13,282 (95.0%) | 697 (5.0%) |
Health Insurance Coverage by Citizenship Status in Candelaria
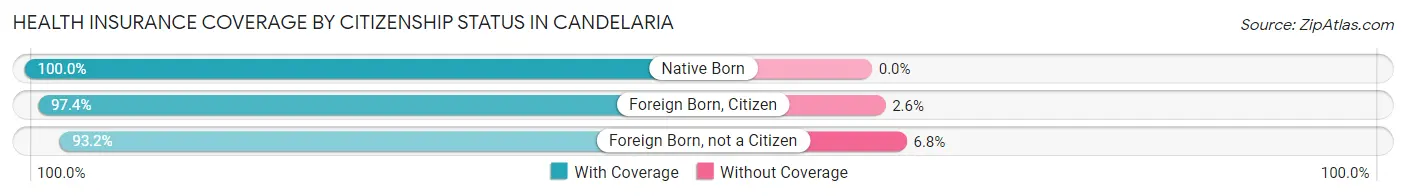
| Citizenship Status | With Coverage | Without Coverage |
| Native Born | 644 (100.0%) | 0 (0.0%) |
| Foreign Born, Citizen | 1,878 (97.4%) | 51 (2.6%) |
| Foreign Born, not a Citizen | 1,105 (93.2%) | 81 (6.8%) |
Health Insurance Coverage by Household Income in Candelaria
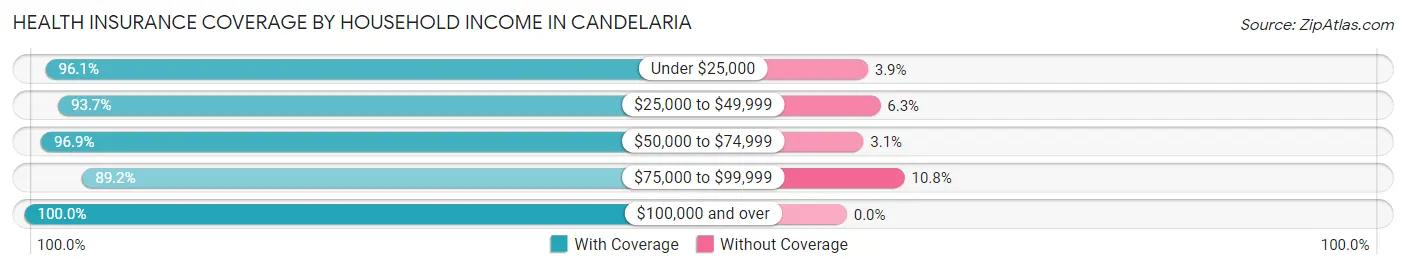
| Household Income | With Coverage | Without Coverage |
| Under $25,000 | 3,961 (96.1%) | 162 (3.9%) |
| $25,000 to $49,999 | 3,448 (93.7%) | 231 (6.3%) |
| $50,000 to $74,999 | 3,033 (96.9%) | 97 (3.1%) |
| $75,000 to $99,999 | 1,549 (89.2%) | 188 (10.8%) |
| $100,000 and over | 1,270 (100.0%) | 0 (0.0%) |
Public vs Private Health Insurance Coverage by Age in Candelaria
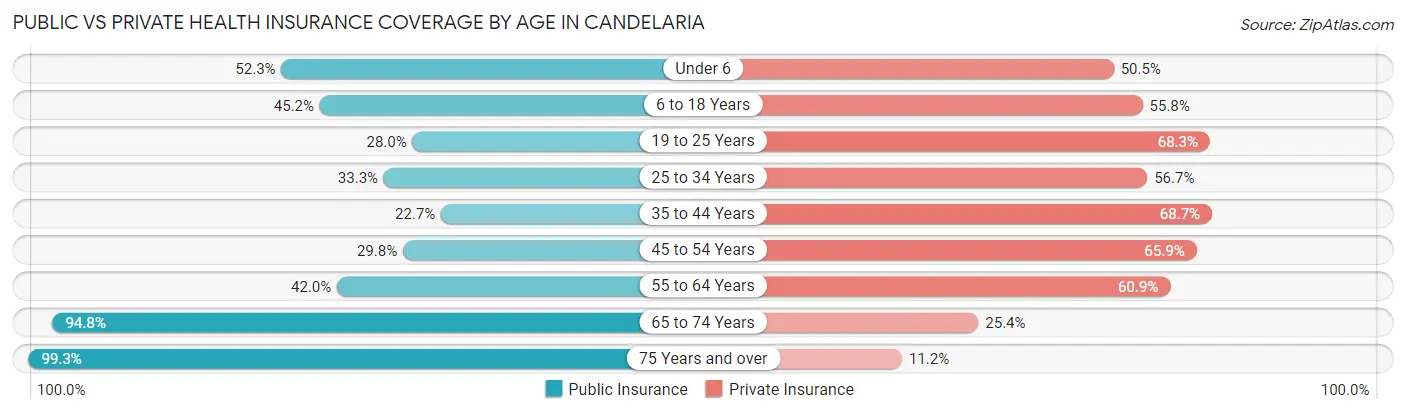
| Age Bracket | Public Insurance | Private Insurance |
| Under 6 | 337 (52.3%) | 325 (50.5%) |
| 6 to 18 Years | 872 (45.2%) | 1,077 (55.8%) |
| 19 to 25 Years | 332 (28.0%) | 810 (68.3%) |
| 25 to 34 Years | 583 (33.3%) | 992 (56.7%) |
| 35 to 44 Years | 452 (22.7%) | 1,369 (68.7%) |
| 45 to 54 Years | 490 (29.8%) | 1,084 (65.9%) |
| 55 to 64 Years | 814 (42.0%) | 1,181 (60.9%) |
| 65 to 74 Years | 1,556 (94.8%) | 416 (25.4%) |
| 75 Years and over | 1,243 (99.3%) | 140 (11.2%) |
| Total | 6,679 (47.8%) | 7,394 (52.9%) |
Disability Status by Sex by Age in Candelaria
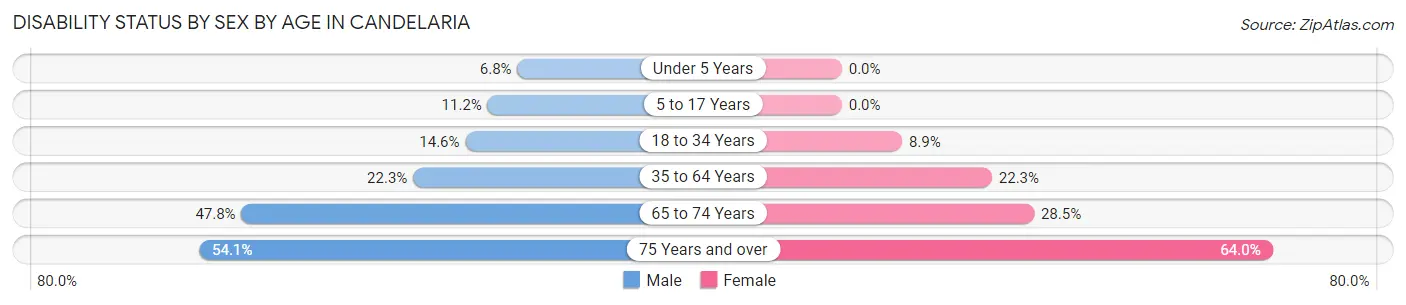
| Age Bracket | Male | Female |
| Under 5 Years | 26 (6.8%) | 0 (0.0%) |
| 5 to 17 Years | 103 (11.2%) | 0 (0.0%) |
| 18 to 34 Years | 240 (14.5%) | 135 (8.9%) |
| 35 to 64 Years | 572 (22.3%) | 671 (22.3%) |
| 65 to 74 Years | 272 (47.8%) | 306 (28.5%) |
| 75 Years and over | 305 (54.1%) | 440 (63.9%) |
Disability Class by Sex by Age in Candelaria
Disability Class: Hearing Difficulty
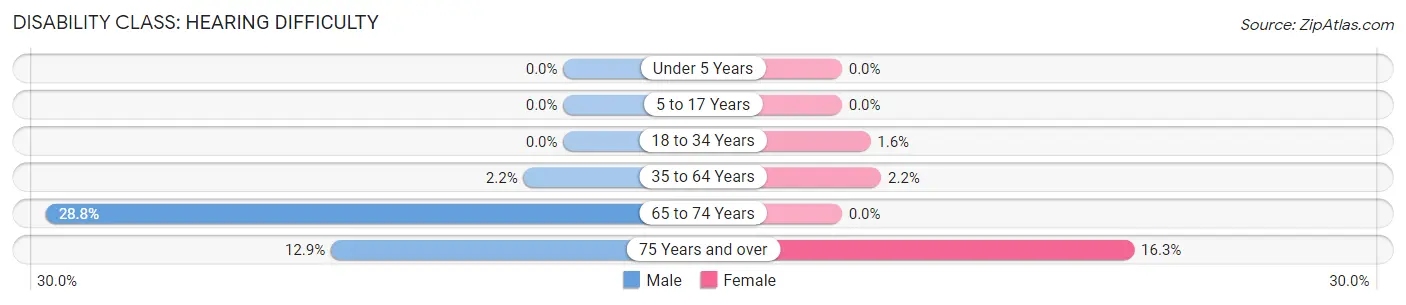
| Age Bracket | Male | Female |
| Under 5 Years | 0 (0.0%) | 0 (0.0%) |
| 5 to 17 Years | 0 (0.0%) | 0 (0.0%) |
| 18 to 34 Years | 0 (0.0%) | 24 (1.6%) |
| 35 to 64 Years | 57 (2.2%) | 66 (2.2%) |
| 65 to 74 Years | 164 (28.8%) | 0 (0.0%) |
| 75 Years and over | 73 (12.9%) | 112 (16.3%) |
Disability Class: Vision Difficulty
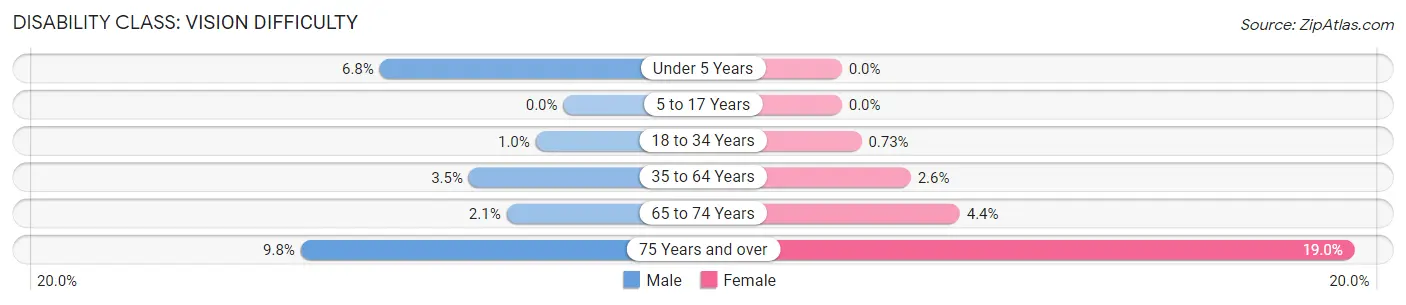
| Age Bracket | Male | Female |
| Under 5 Years | 26 (6.8%) | 0 (0.0%) |
| 5 to 17 Years | 0 (0.0%) | 0 (0.0%) |
| 18 to 34 Years | 17 (1.0%) | 11 (0.7%) |
| 35 to 64 Years | 90 (3.5%) | 77 (2.6%) |
| 65 to 74 Years | 12 (2.1%) | 47 (4.4%) |
| 75 Years and over | 55 (9.8%) | 131 (19.0%) |
Disability Class: Cognitive Difficulty
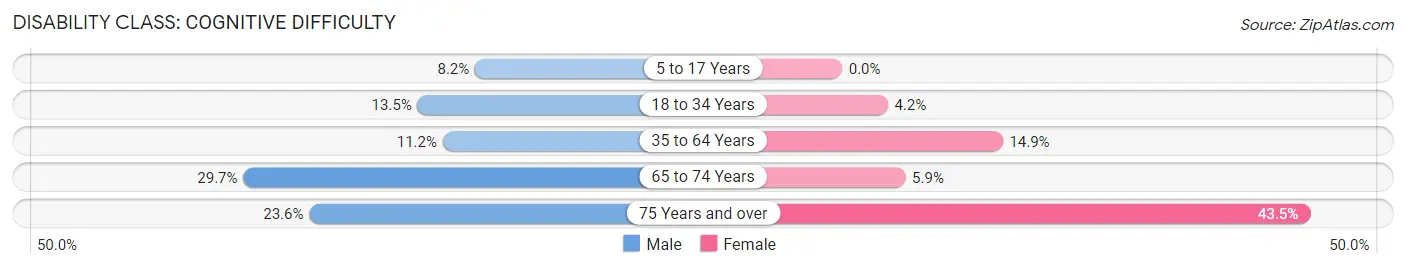
| Age Bracket | Male | Female |
| 5 to 17 Years | 75 (8.2%) | 0 (0.0%) |
| 18 to 34 Years | 223 (13.5%) | 64 (4.2%) |
| 35 to 64 Years | 287 (11.2%) | 449 (14.9%) |
| 65 to 74 Years | 169 (29.7%) | 63 (5.9%) |
| 75 Years and over | 133 (23.6%) | 299 (43.5%) |
Disability Class: Ambulatory Difficulty
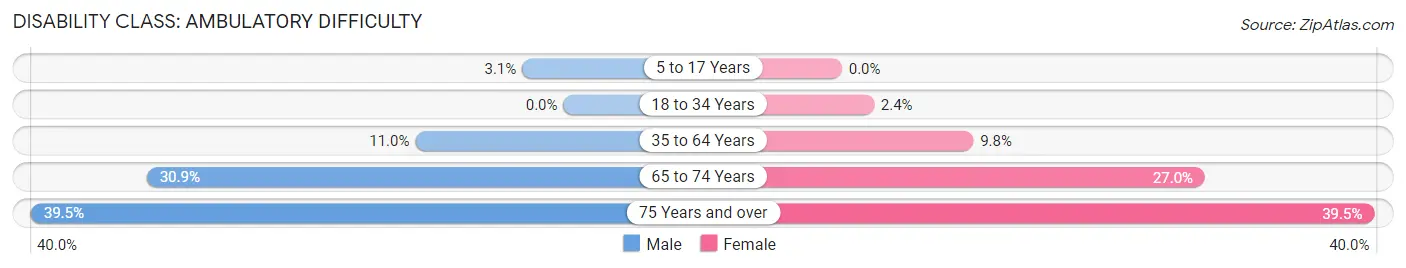
| Age Bracket | Male | Female |
| 5 to 17 Years | 28 (3.1%) | 0 (0.0%) |
| 18 to 34 Years | 0 (0.0%) | 36 (2.4%) |
| 35 to 64 Years | 282 (11.0%) | 294 (9.8%) |
| 65 to 74 Years | 176 (30.9%) | 289 (27.0%) |
| 75 Years and over | 223 (39.5%) | 272 (39.5%) |
Disability Class: Self-Care Difficulty
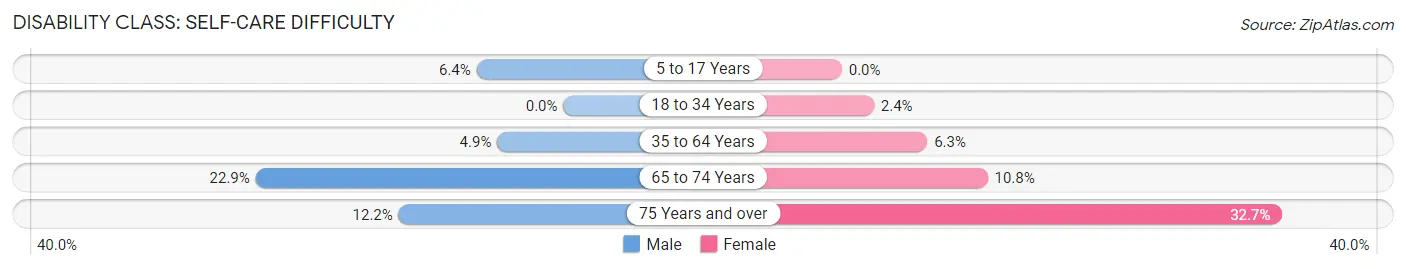
| Age Bracket | Male | Female |
| 5 to 17 Years | 59 (6.4%) | 0 (0.0%) |
| 18 to 34 Years | 0 (0.0%) | 36 (2.4%) |
| 35 to 64 Years | 126 (4.9%) | 191 (6.3%) |
| 65 to 74 Years | 130 (22.9%) | 116 (10.8%) |
| 75 Years and over | 69 (12.2%) | 225 (32.7%) |
Technology Access in Candelaria
Computing Device Access in Candelaria
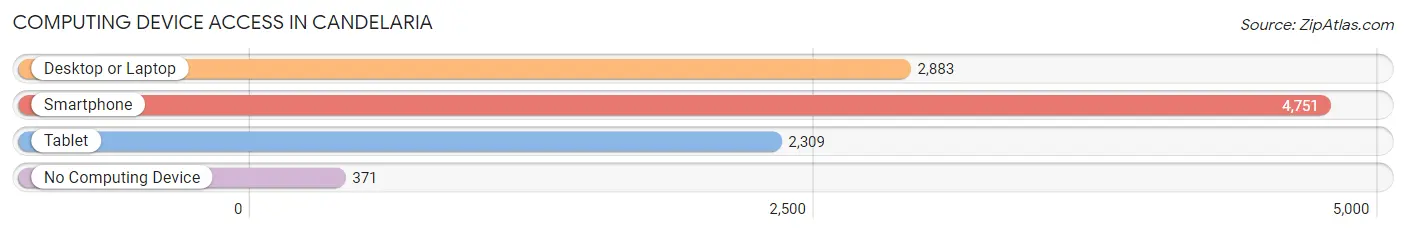
| Device Type | # Households | % Households |
| Desktop or Laptop | 2,883 | 55.1% |
| Smartphone | 4,751 | 90.9% |
| Tablet | 2,309 | 44.2% |
| No Computing Device | 371 | 7.1% |
| Total | 5,228 | 100.0% |
Internet Access in Candelaria
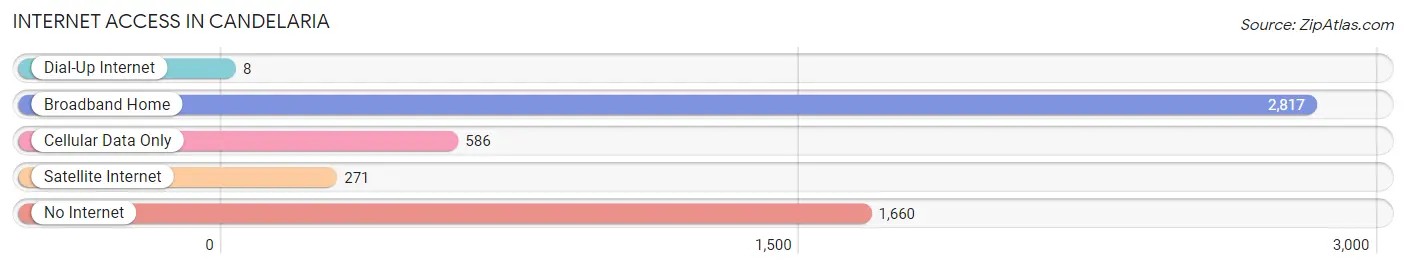
| Internet Type | # Households | % Households |
| Dial-Up Internet | 8 | 0.2% |
| Broadband Home | 2,817 | 53.9% |
| Cellular Data Only | 586 | 11.2% |
| Satellite Internet | 271 | 5.2% |
| No Internet | 1,660 | 31.8% |
| Total | 5,228 | 100.0% |
Candelaria Summary
Candelaria is a municipality located in the western region of Puerto Rico. It is part of the Mayagüez metropolitan area and is bordered by the municipalities of San Germán, Lajas, and Maricao. The municipality is home to a population of approximately 11,000 people, as of the 2010 census.
History
The area of Candelaria was originally inhabited by the Taíno Indians, who were the indigenous people of Puerto Rico. The Taíno Indians were the first to inhabit the area, and they named the area “Candelaria”, which means “place of light”. The area was later colonized by the Spanish in the 16th century, and the town was officially founded in 1737.
During the 19th century, the town experienced a period of economic growth and development. The town was home to several sugar plantations, and the economy was largely based on the production of sugar cane. The town also had a thriving cattle industry, and the town was known for its production of leather goods.
In the late 19th century, the town experienced a period of decline due to the abolition of slavery and the decline of the sugar industry. The town was also affected by the Spanish-American War, which resulted in the loss of many of its citizens.
Geography
Candelaria is located in the western region of Puerto Rico, and is bordered by the municipalities of San Germán, Lajas, and Maricao. The municipality is located in the Mayagüez metropolitan area, and is situated in the foothills of the Cordillera Central mountain range. The municipality covers an area of approximately 24 square miles, and is home to a population of approximately 11,000 people, as of the 2010 census.
The municipality is home to several rivers, including the Rio Grande de Arecibo, the Rio Grande de Manatí, and the Rio Grande de Loíza. The municipality is also home to several lakes, including the Laguna de la Torrecilla, the Laguna de la Torrecilla, and the Laguna de la Torrecilla.
Economy
The economy of Candelaria is largely based on agriculture and tourism. The municipality is home to several farms, which produce a variety of crops, including sugar cane, coffee, bananas, and plantains. The municipality is also home to several tourist attractions, including the Cueva del Indio, the Cueva de los Indios, and the Cueva de los Indios.
The municipality is also home to several manufacturing companies, which produce a variety of products, including leather goods, furniture, and clothing. The municipality is also home to several retail stores, which sell a variety of goods, including food, clothing, and electronics.
Demographics
As of the 2010 census, the population of Candelaria was 11,000 people. The population is largely of Hispanic descent, with the majority of the population being of Puerto Rican descent. The population is also largely Roman Catholic, with the majority of the population being affiliated with the Roman Catholic Church.
The median household income in Candelaria is $17,000, and the median age is 37 years old. The unemployment rate in the municipality is 8.3%, and the poverty rate is 28.3%. The majority of the population is employed in the agricultural and tourism industries.
Conclusion
Candelaria is a municipality located in the western region of Puerto Rico. It is part of the Mayagüez metropolitan area and is bordered by the municipalities of San Germán, Lajas, and Maricao. The municipality is home to a population of approximately 11,000 people, as of the 2010 census. The economy of Candelaria is largely based on agriculture and tourism, and the population is largely of Hispanic descent. The median household income in Candelaria is $17,000, and the median age is 37 years old. The unemployment rate in the municipality is 8.3%, and the poverty rate is 28.3%.
Common Questions
What is Per Capita Income in Candelaria?
Per Capita income in Candelaria is $18,092.
What is the Median Family Income in Candelaria?
Median Family Income in Candelaria is $39,531.
What is the Median Household income in Candelaria?
Median Household Income in Candelaria is $35,667.
What is Income or Wage Gap in Candelaria?
Income or Wage Gap in Candelaria is 10.8%.
Women in Candelaria earn 89.2 cents for every dollar earned by a man.
What is Inequality or Gini Index in Candelaria?
Inequality or Gini Index in Candelaria is 0.44.
What is the Total Population of Candelaria?
Total Population of Candelaria is 14,114.
What is the Total Male Population of Candelaria?
Total Male Population of Candelaria is 6,746.
What is the Total Female Population of Candelaria?
Total Female Population of Candelaria is 7,368.
What is the Ratio of Males per 100 Females in Candelaria?
There are 91.56 Males per 100 Females in Candelaria.
What is the Ratio of Females per 100 Males in Candelaria?
There are 109.22 Females per 100 Males in Candelaria.
What is the Median Population Age in Candelaria?
Median Population Age in Candelaria is 41.3 Years.
What is the Average Family Size in Candelaria
Average Family Size in Candelaria is 3.1 People.
What is the Average Household Size in Candelaria
Average Household Size in Candelaria is 2.7 People.
How Large is the Labor Force in Candelaria?
There are 6,382 People in the Labor Forcein in Candelaria.
What is the Percentage of People in the Labor Force in Candelaria?
53.4% of People are in the Labor Force in Candelaria.
What is the Unemployment Rate in Candelaria?
Unemployment Rate in Candelaria is 9.7%.