San Lorenzo Municipio, PR Map & Demographics
San Lorenzo Municipio Map
San Lorenzo Municipio Overview
$12,220
PER CAPITA INCOME
$24,792
AVG FAMILY INCOME
$19,629
AVG HOUSEHOLD INCOME
7.4%
WAGE / INCOME GAP [ % ]
92.6¢/ $1
WAGE / INCOME GAP [ $ ]
$10,428
FAMILY INCOME DEFICIT
0.50
INEQUALITY / GINI INDEX
37,552
TOTAL POPULATION
18,251
MALE POPULATION
19,301
FEMALE POPULATION
94.56
MALES / 100 FEMALES
105.75
FEMALES / 100 MALES
43.8
MEDIAN AGE
3.4
AVG FAMILY SIZE
2.7
AVG HOUSEHOLD SIZE
12,818
LABOR FORCE [ PEOPLE ]
39.8%
PERCENT IN LABOR FORCE
8.3%
UNEMPLOYMENT RATE
San Lorenzo Municipio Area Codes
Income in San Lorenzo Municipio
Income Overview in San Lorenzo Municipio
Per Capita Income in San Lorenzo Municipio is $12,220, while median incomes of families and households are $24,792 and $19,629 respectively.
| Characteristic | Number | Measure |
| Per Capita Income | 37,552 | $12,220 |
| Median Family Income | 8,982 | $24,792 |
| Mean Family Income | 8,982 | $34,095 |
| Median Household Income | 13,775 | $19,629 |
| Mean Household Income | 13,775 | $29,453 |
| Income Deficit | 8,982 | $10,428 |
| Wage / Income Gap (%) | 37,552 | 7.42% |
| Wage / Income Gap ($) | 37,552 | 92.58¢ per $1 |
| Gini / Inequality Index | 37,552 | 0.50 |
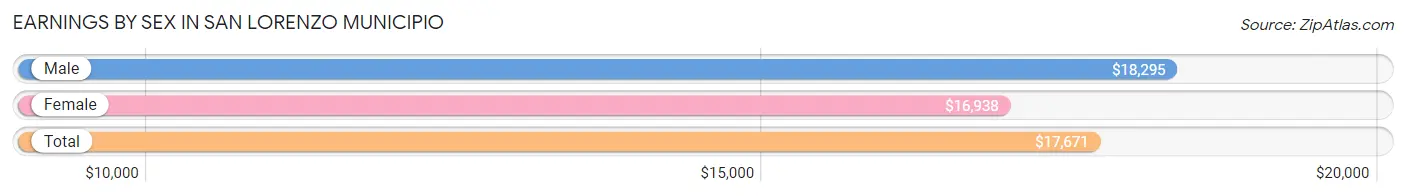
Earnings by Sex in San Lorenzo Municipio
Average Earnings in San Lorenzo Municipio are $17,671, $18,295 for men and $16,938 for women, a difference of 7.4%.
| Sex | Number | Average Earnings |
| Male | 6,552 (50.9%) | $18,295 |
| Female | 6,326 (49.1%) | $16,938 |
| Total | 12,878 (100.0%) | $17,671 |
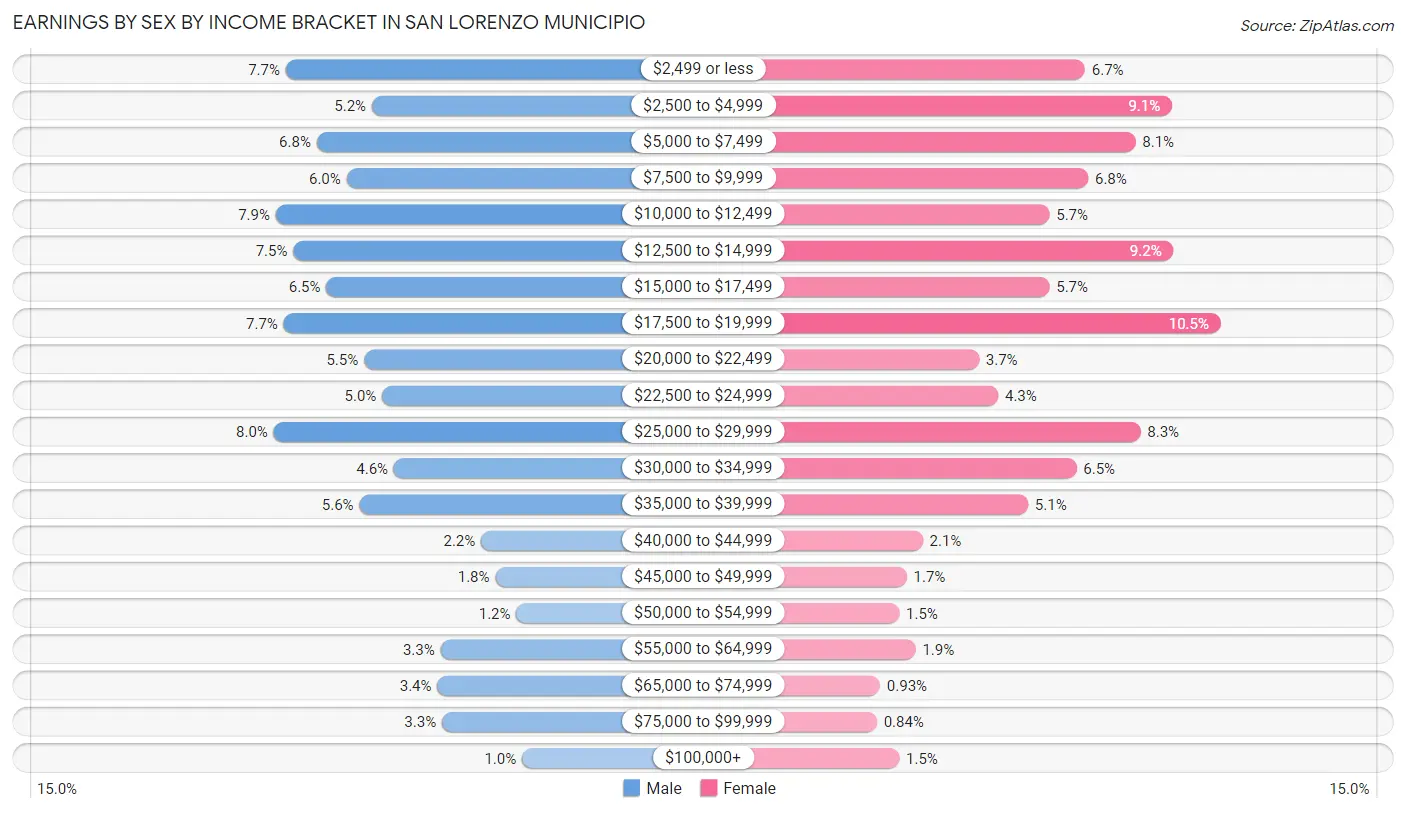
Earnings by Sex by Income Bracket in San Lorenzo Municipio
The most common earnings brackets in San Lorenzo Municipio are $25,000 to $29,999 for men (524 | 8.0%) and $17,500 to $19,999 for women (665 | 10.5%).
| Income | Male | Female |
| $2,499 or less | 502 (7.7%) | 423 (6.7%) |
| $2,500 to $4,999 | 343 (5.2%) | 578 (9.1%) |
| $5,000 to $7,499 | 445 (6.8%) | 513 (8.1%) |
| $7,500 to $9,999 | 390 (5.9%) | 429 (6.8%) |
| $10,000 to $12,499 | 520 (7.9%) | 360 (5.7%) |
| $12,500 to $14,999 | 488 (7.4%) | 581 (9.2%) |
| $15,000 to $17,499 | 427 (6.5%) | 360 (5.7%) |
| $17,500 to $19,999 | 506 (7.7%) | 665 (10.5%) |
| $20,000 to $22,499 | 358 (5.5%) | 235 (3.7%) |
| $22,500 to $24,999 | 324 (5.0%) | 269 (4.3%) |
| $25,000 to $29,999 | 524 (8.0%) | 522 (8.3%) |
| $30,000 to $34,999 | 303 (4.6%) | 408 (6.5%) |
| $35,000 to $39,999 | 366 (5.6%) | 322 (5.1%) |
| $40,000 to $44,999 | 142 (2.2%) | 135 (2.1%) |
| $45,000 to $49,999 | 116 (1.8%) | 106 (1.7%) |
| $50,000 to $54,999 | 77 (1.2%) | 93 (1.5%) |
| $55,000 to $64,999 | 217 (3.3%) | 122 (1.9%) |
| $65,000 to $74,999 | 223 (3.4%) | 59 (0.9%) |
| $75,000 to $99,999 | 214 (3.3%) | 53 (0.8%) |
| $100,000+ | 67 (1.0%) | 93 (1.5%) |
| Total | 6,552 (100.0%) | 6,326 (100.0%) |
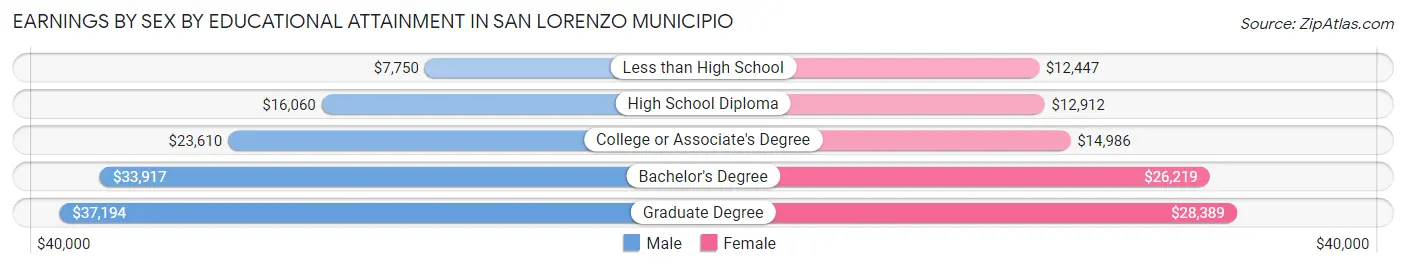
Earnings by Sex by Educational Attainment in San Lorenzo Municipio
Average earnings in San Lorenzo Municipio are $19,314 for men and $18,291 for women, a difference of 5.3%. Men with an educational attainment of graduate degree enjoy the highest average annual earnings of $37,194, while those with less than high school education earn the least with $7,750. Women with an educational attainment of graduate degree earn the most with the average annual earnings of $28,389, while those with less than high school education have the smallest earnings of $12,447.
| Educational Attainment | Male Income | Female Income |
| Less than High School | $7,750 | $12,447 |
| High School Diploma | $16,060 | $12,912 |
| College or Associate's Degree | $23,610 | $14,986 |
| Bachelor's Degree | $33,917 | $26,219 |
| Graduate Degree | $37,194 | $28,389 |
| Total | $19,314 | $18,291 |
Family Income in San Lorenzo Municipio
Family Income Brackets in San Lorenzo Municipio
According to the San Lorenzo Municipio family income data, there are 1,868 families falling into the $15,000 to $24,999 income range, which is the most common income bracket and makes up 20.8% of all families. Conversely, the $200,000+ income bracket is the least frequent group with only 9 families (0.1%) belonging to this category.
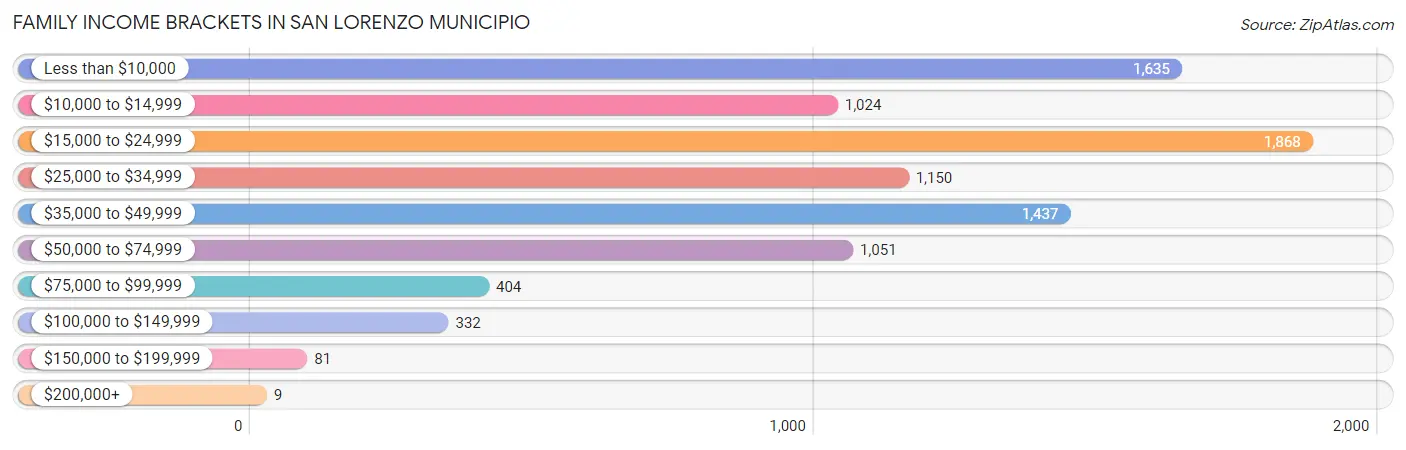
| Income Bracket | # Families | % Families |
| Less than $10,000 | 1,635 | 18.2% |
| $10,000 to $14,999 | 1,024 | 11.4% |
| $15,000 to $24,999 | 1,868 | 20.8% |
| $25,000 to $34,999 | 1,150 | 12.8% |
| $35,000 to $49,999 | 1,437 | 16.0% |
| $50,000 to $74,999 | 1,051 | 11.7% |
| $75,000 to $99,999 | 404 | 4.5% |
| $100,000 to $149,999 | 332 | 3.7% |
| $150,000 to $199,999 | 81 | 0.9% |
| $200,000+ | 9 | 0.1% |
Family Income by Famaliy Size in San Lorenzo Municipio
6-person families (81 | 0.9%) account for the highest median family income in San Lorenzo Municipio with $56,140 per family, while 2-person families (4,501 | 50.1%) have the highest median income of $10,703 per family member.
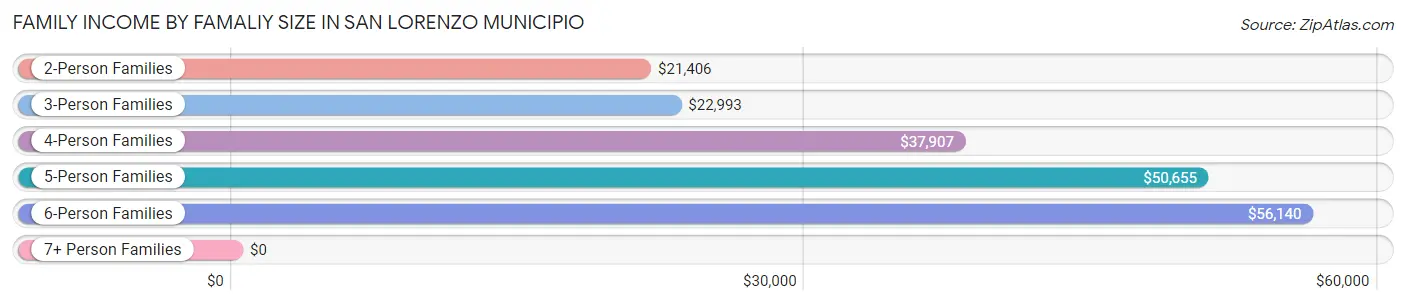
| Income Bracket | # Families | Median Income |
| 2-Person Families | 4,501 (50.1%) | $21,406 |
| 3-Person Families | 2,394 (26.7%) | $22,993 |
| 4-Person Families | 1,628 (18.1%) | $37,907 |
| 5-Person Families | 328 (3.6%) | $50,655 |
| 6-Person Families | 81 (0.9%) | $56,140 |
| 7+ Person Families | 50 (0.6%) | $0 |
| Total | 8,982 (100.0%) | $24,792 |
Family Income by Number of Earners in San Lorenzo Municipio
The median family income in San Lorenzo Municipio is $24,792, with families comprising 3+ earners (312) having the highest median family income of $61,154, while families with no earners (3,546) have the lowest median family income of $17,170, accounting for 3.5% and 39.5% of families, respectively.
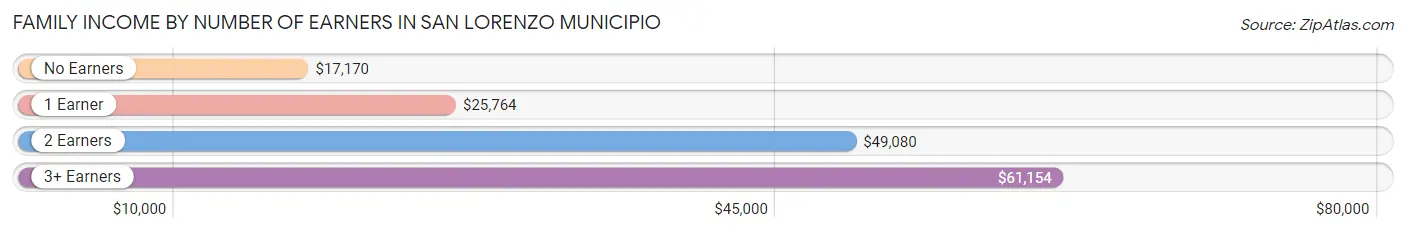
| Number of Earners | # Families | Median Income |
| No Earners | 3,546 (39.5%) | $17,170 |
| 1 Earner | 3,285 (36.6%) | $25,764 |
| 2 Earners | 1,839 (20.5%) | $49,080 |
| 3+ Earners | 312 (3.5%) | $61,154 |
| Total | 8,982 (100.0%) | $24,792 |
Household Income in San Lorenzo Municipio
Household Income Brackets in San Lorenzo Municipio
With 3,582 households falling in the category, the less than $10,000 income range is the most frequent in San Lorenzo Municipio, accounting for 26.0% of all households. In contrast, only 55 households (0.4%) fall into the $200,000+ income bracket, making it the least populous group.
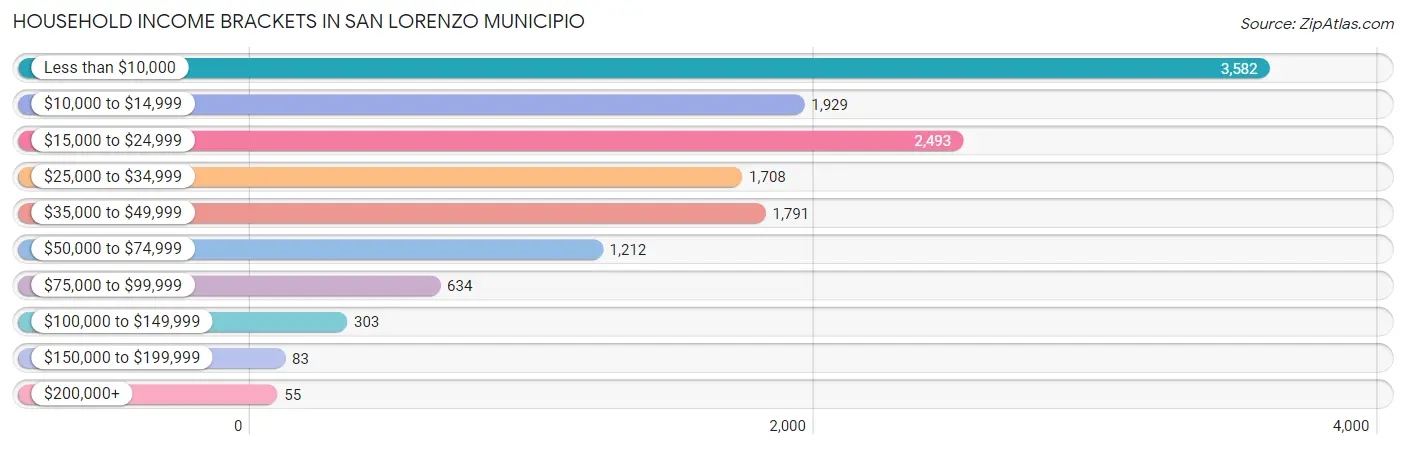
| Income Bracket | # Households | % Households |
| Less than $10,000 | 3,582 | 26.0% |
| $10,000 to $14,999 | 1,929 | 14.0% |
| $15,000 to $24,999 | 2,493 | 18.1% |
| $25,000 to $34,999 | 1,708 | 12.4% |
| $35,000 to $49,999 | 1,791 | 13.0% |
| $50,000 to $74,999 | 1,212 | 8.8% |
| $75,000 to $99,999 | 634 | 4.6% |
| $100,000 to $149,999 | 303 | 2.2% |
| $150,000 to $199,999 | 83 | 0.6% |
| $200,000+ | 55 | 0.4% |
Household Income by Householder Age in San Lorenzo Municipio
The median household income in San Lorenzo Municipio is $19,629, with the highest median household income of $26,040 found in the 25 to 44 years age bracket for the primary householder. A total of 3,433 households (24.9%) fall into this category. Meanwhile, the 15 to 24 years age bracket for the primary householder has the lowest median household income of $0, with 139 households (1.0%) in this group.
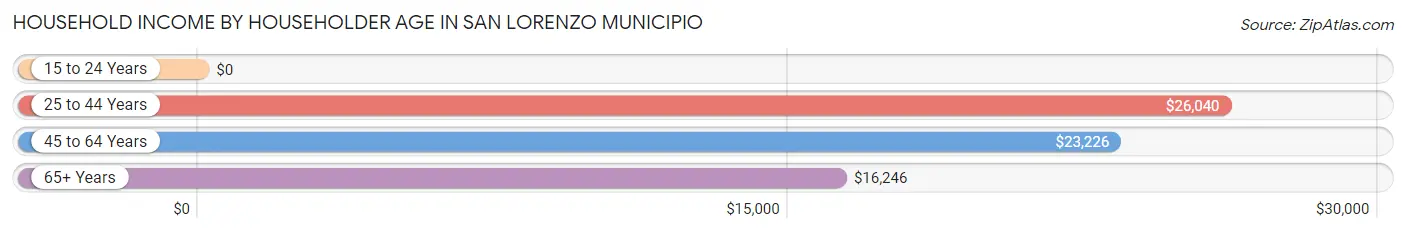
| Income Bracket | # Households | Median Income |
| 15 to 24 Years | 139 (1.0%) | $0 |
| 25 to 44 Years | 3,433 (24.9%) | $26,040 |
| 45 to 64 Years | 5,104 (37.0%) | $23,226 |
| 65+ Years | 5,099 (37.0%) | $16,246 |
| Total | 13,775 (100.0%) | $19,629 |
Poverty in San Lorenzo Municipio
Income Below Poverty by Sex and Age in San Lorenzo Municipio
With 44.6% poverty level for males and 45.9% for females among the residents of San Lorenzo Municipio, under 5 year old males and 6 to 11 year old females are the most vulnerable to poverty, with 505 males (79.0%) and 694 females (61.7%) in their respective age groups living below the poverty level.
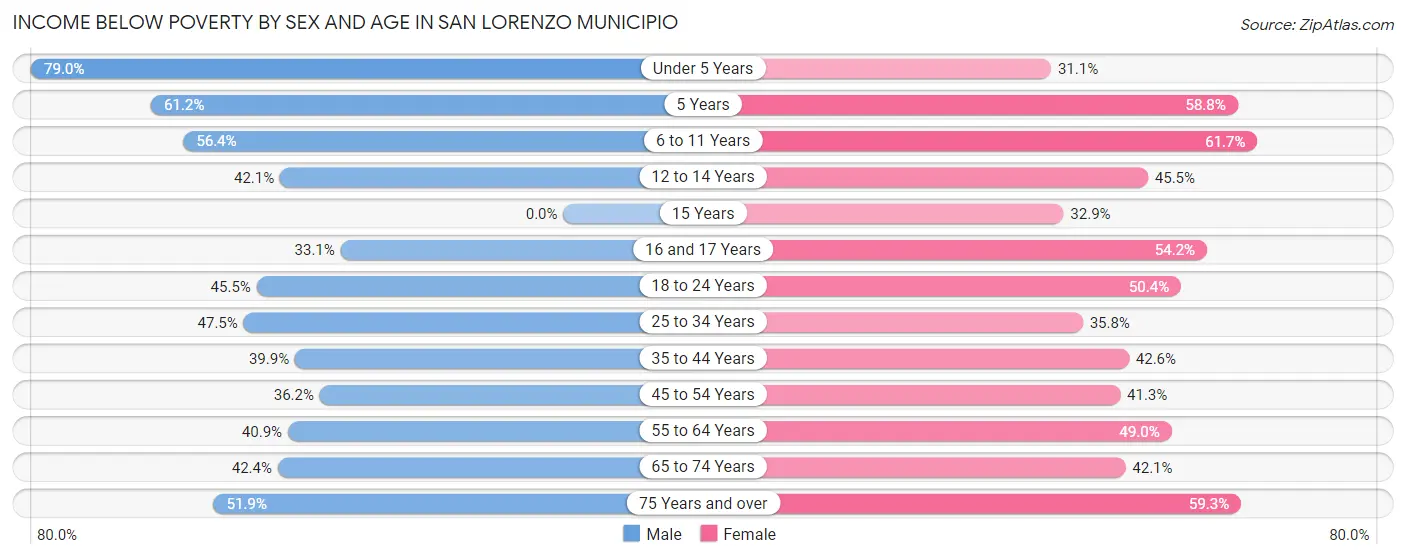
| Age Bracket | Male | Female |
| Under 5 Years | 505 (79.0%) | 191 (31.1%) |
| 5 Years | 120 (61.2%) | 57 (58.8%) |
| 6 to 11 Years | 729 (56.4%) | 694 (61.7%) |
| 12 to 14 Years | 175 (42.1%) | 275 (45.5%) |
| 15 Years | 0 (0.0%) | 52 (32.9%) |
| 16 and 17 Years | 177 (33.1%) | 277 (54.2%) |
| 18 to 24 Years | 766 (45.5%) | 830 (50.4%) |
| 25 to 34 Years | 1,123 (47.5%) | 887 (35.8%) |
| 35 to 44 Years | 899 (39.9%) | 1,035 (42.6%) |
| 45 to 54 Years | 879 (36.2%) | 1,072 (41.3%) |
| 55 to 64 Years | 1,074 (40.9%) | 1,409 (49.0%) |
| 65 to 74 Years | 848 (42.4%) | 948 (42.1%) |
| 75 Years and over | 843 (51.9%) | 1,096 (59.3%) |
| Total | 8,138 (44.6%) | 8,823 (45.9%) |
Income Above Poverty by Sex and Age in San Lorenzo Municipio
According to the poverty statistics in San Lorenzo Municipio, males aged 15 years and females aged under 5 years are the age groups that are most secure financially, with 100.0% of males and 68.9% of females in these age groups living above the poverty line.
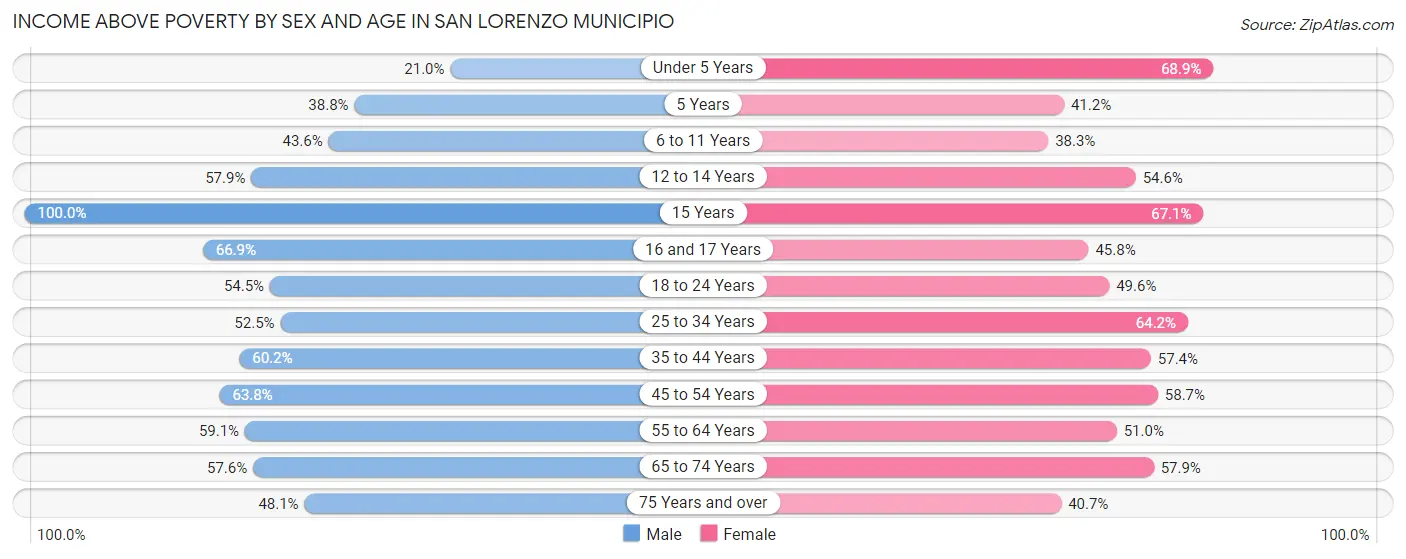
| Age Bracket | Male | Female |
| Under 5 Years | 134 (21.0%) | 424 (68.9%) |
| 5 Years | 76 (38.8%) | 40 (41.2%) |
| 6 to 11 Years | 563 (43.6%) | 431 (38.3%) |
| 12 to 14 Years | 241 (57.9%) | 330 (54.5%) |
| 15 Years | 171 (100.0%) | 106 (67.1%) |
| 16 and 17 Years | 358 (66.9%) | 234 (45.8%) |
| 18 to 24 Years | 916 (54.5%) | 818 (49.6%) |
| 25 to 34 Years | 1,242 (52.5%) | 1,593 (64.2%) |
| 35 to 44 Years | 1,357 (60.2%) | 1,393 (57.4%) |
| 45 to 54 Years | 1,551 (63.8%) | 1,522 (58.7%) |
| 55 to 64 Years | 1,552 (59.1%) | 1,468 (51.0%) |
| 65 to 74 Years | 1,152 (57.6%) | 1,303 (57.9%) |
| 75 Years and over | 780 (48.1%) | 753 (40.7%) |
| Total | 10,093 (55.4%) | 10,415 (54.1%) |
Income Below Poverty Among Married-Couple Families in San Lorenzo Municipio
The poverty statistics for married-couple families in San Lorenzo Municipio show that 29.6% or 1,535 of the total 5,186 families live below the poverty line. Families with no children have the highest poverty rate of 31.7%, comprising of 1,089 families. On the other hand, families with 3 or 4 children have the lowest poverty rate of 0.0%, which includes 0 families.
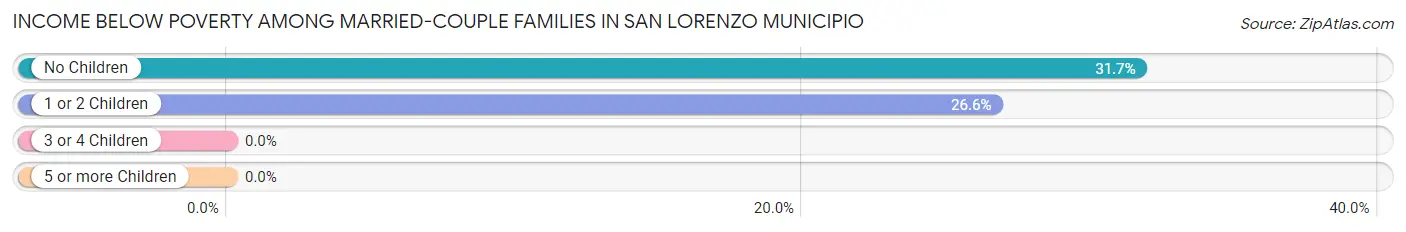
| Children | Above Poverty | Below Poverty |
| No Children | 2,351 (68.3%) | 1,089 (31.7%) |
| 1 or 2 Children | 1,228 (73.4%) | 446 (26.6%) |
| 3 or 4 Children | 72 (100.0%) | 0 (0.0%) |
| 5 or more Children | 0 (0.0%) | 0 (0.0%) |
| Total | 3,651 (70.4%) | 1,535 (29.6%) |
Income Below Poverty Among Single-Parent Households in San Lorenzo Municipio
According to the poverty data in San Lorenzo Municipio, 51.0% or 494 single-father households and 66.4% or 1,878 single-mother households are living below the poverty line. Among single-father households, those with 3 or 4 children have the highest poverty rate, with 35 households (55.6%) experiencing poverty. Likewise, among single-mother households, those with 3 or 4 children have the highest poverty rate, with 155 households (100.0%) falling below the poverty line.
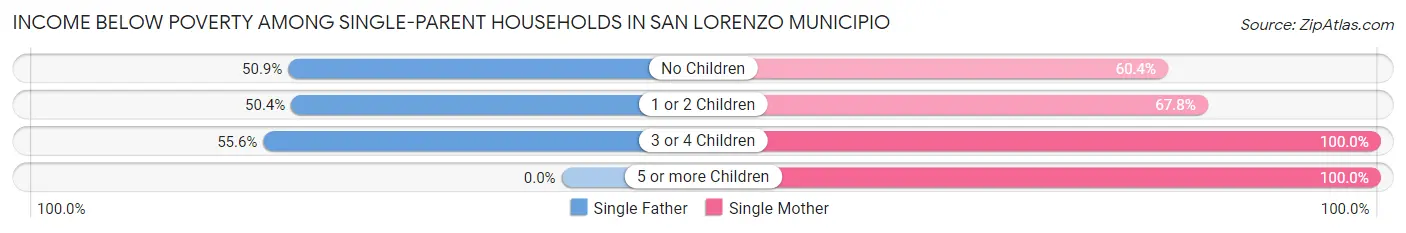
| Children | Single Father | Single Mother |
| No Children | 248 (50.9%) | 774 (60.4%) |
| 1 or 2 Children | 211 (50.4%) | 927 (67.8%) |
| 3 or 4 Children | 35 (55.6%) | 155 (100.0%) |
| 5 or more Children | 0 (0.0%) | 22 (100.0%) |
| Total | 494 (51.0%) | 1,878 (66.4%) |
Income Below Poverty Among Married-Couple vs Single-Parent Households in San Lorenzo Municipio
The poverty data for San Lorenzo Municipio shows that 1,535 of the married-couple family households (29.6%) and 2,372 of the single-parent households (62.5%) are living below the poverty level. Within the married-couple family households, those with no children have the highest poverty rate, with 1,089 households (31.7%) falling below the poverty line. Among the single-parent households, those with 5 or more children have the highest poverty rate, with 22 household (100.0%) living below poverty.
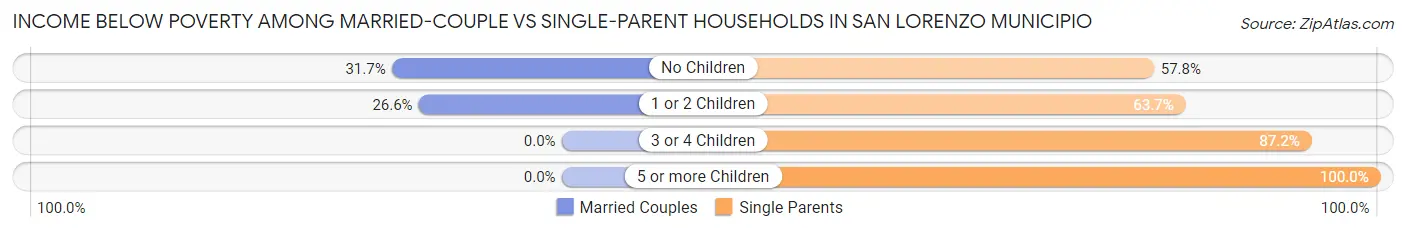
| Children | Married-Couple Families | Single-Parent Households |
| No Children | 1,089 (31.7%) | 1,022 (57.8%) |
| 1 or 2 Children | 446 (26.6%) | 1,138 (63.7%) |
| 3 or 4 Children | 0 (0.0%) | 190 (87.2%) |
| 5 or more Children | 0 (0.0%) | 22 (100.0%) |
| Total | 1,535 (29.6%) | 2,372 (62.5%) |
Race in San Lorenzo Municipio
The most populous races in San Lorenzo Municipio are Hispanic or Latino (37,420 | 99.7%), Some other Race (20,143 | 53.6%), and Black / African American (10,801 | 28.8%).
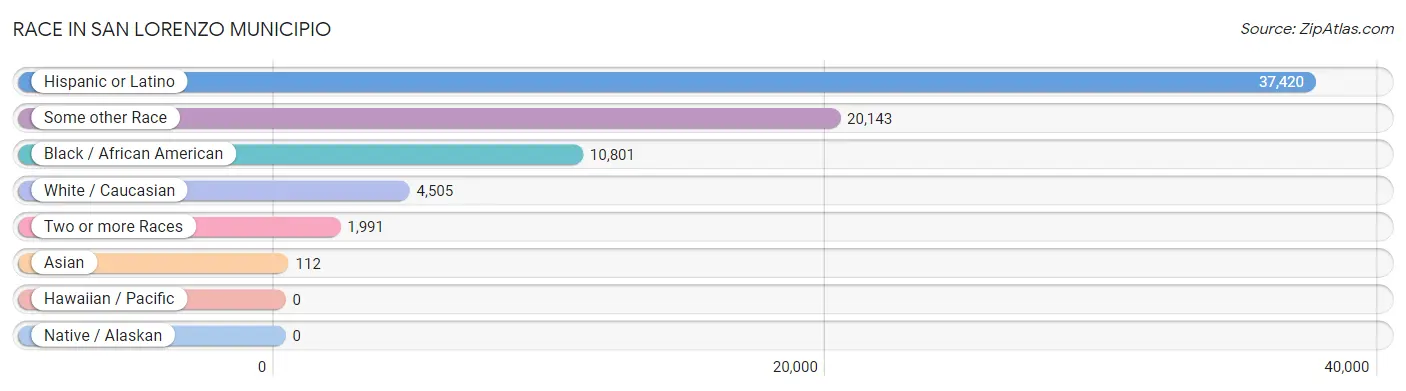
| Race | # Population | % Population |
| Asian | 112 | 0.3% |
| Black / African American | 10,801 | 28.8% |
| Hawaiian / Pacific | 0 | 0.0% |
| Hispanic or Latino | 37,420 | 99.7% |
| Native / Alaskan | 0 | 0.0% |
| White / Caucasian | 4,505 | 12.0% |
| Two or more Races | 1,991 | 5.3% |
| Some other Race | 20,143 | 53.6% |
| Total | 37,552 | 100.0% |
Ancestry in San Lorenzo Municipio
The most populous ancestries reported in San Lorenzo Municipio are Puerto Rican (37,252 | 99.2%), Central American Indian (194 | 0.5%), American (154 | 0.4%), Indian (Asian) (112 | 0.3%), and Colombian (96 | 0.3%), together accounting for 100.7% of all San Lorenzo Municipio residents.
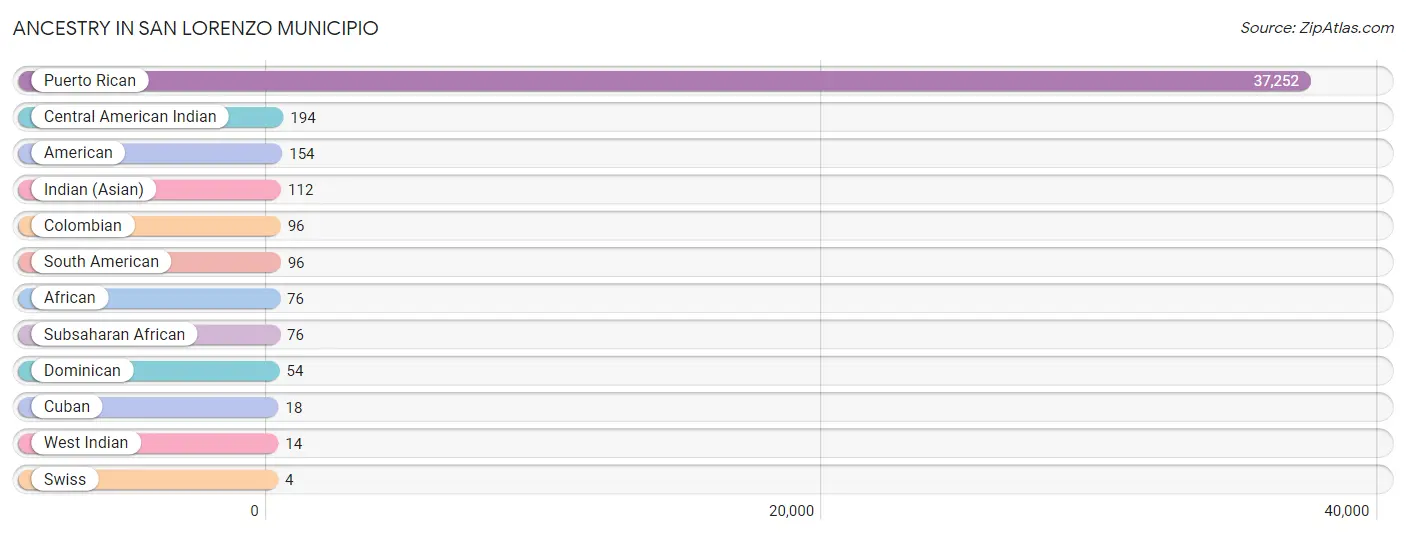
| Ancestry | # Population | % Population |
| African | 76 | 0.2% |
| American | 154 | 0.4% |
| Central American Indian | 194 | 0.5% |
| Colombian | 96 | 0.3% |
| Cuban | 18 | 0.1% |
| Dominican | 54 | 0.1% |
| Indian (Asian) | 112 | 0.3% |
| Puerto Rican | 37,252 | 99.2% |
| South American | 96 | 0.3% |
| Subsaharan African | 76 | 0.2% |
| Swiss | 4 | 0.0% |
| West Indian | 14 | 0.0% | View All 12 Rows |
Immigrants in San Lorenzo Municipio

| Immigration Origin | # Population | % Population | View All 0 Rows |
Sex and Age in San Lorenzo Municipio
Sex and Age in San Lorenzo Municipio
The most populous age groups in San Lorenzo Municipio are 55 to 59 Years (1,325 | 7.3%) for men and 60 to 64 Years (1,536 | 8.0%) for women.
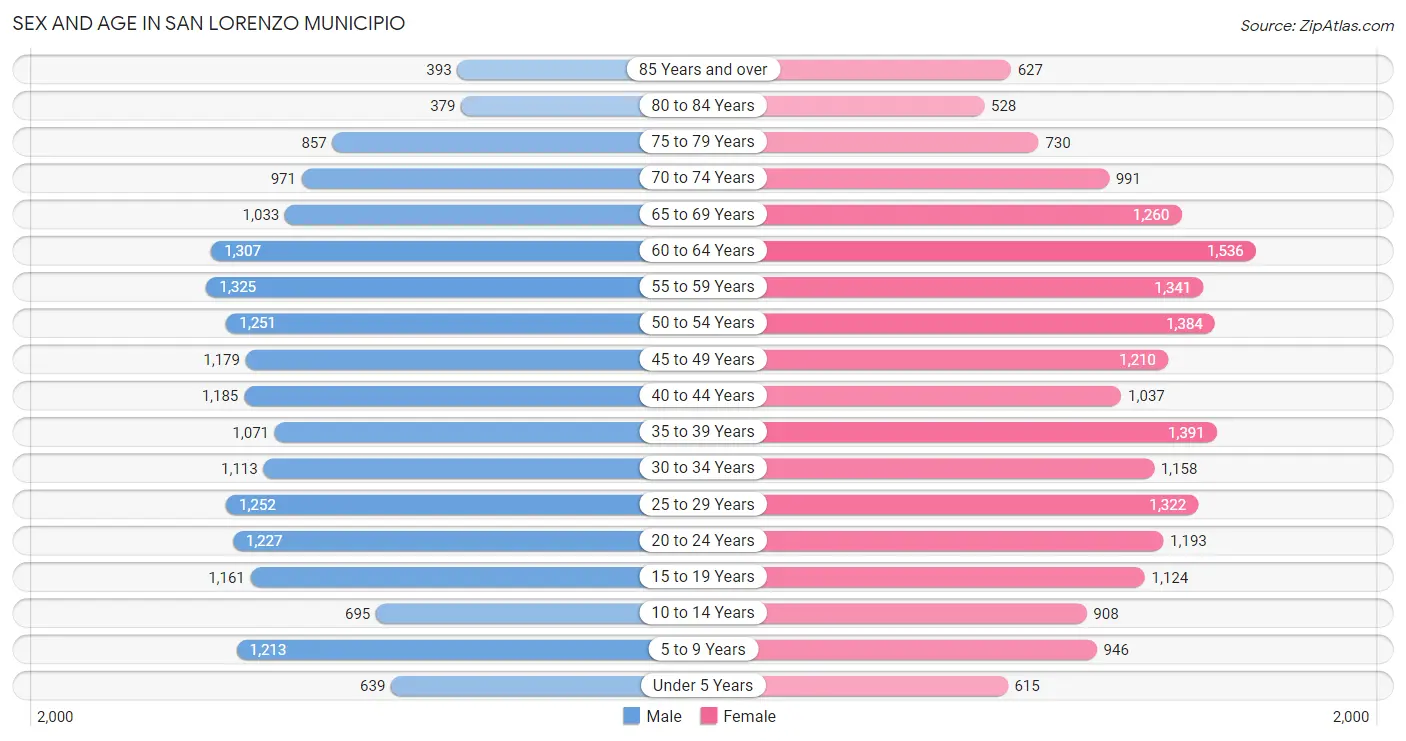
| Age Bracket | Male | Female |
| Under 5 Years | 639 (3.5%) | 615 (3.2%) |
| 5 to 9 Years | 1,213 (6.7%) | 946 (4.9%) |
| 10 to 14 Years | 695 (3.8%) | 908 (4.7%) |
| 15 to 19 Years | 1,161 (6.4%) | 1,124 (5.8%) |
| 20 to 24 Years | 1,227 (6.7%) | 1,193 (6.2%) |
| 25 to 29 Years | 1,252 (6.9%) | 1,322 (6.9%) |
| 30 to 34 Years | 1,113 (6.1%) | 1,158 (6.0%) |
| 35 to 39 Years | 1,071 (5.9%) | 1,391 (7.2%) |
| 40 to 44 Years | 1,185 (6.5%) | 1,037 (5.4%) |
| 45 to 49 Years | 1,179 (6.5%) | 1,210 (6.3%) |
| 50 to 54 Years | 1,251 (6.9%) | 1,384 (7.2%) |
| 55 to 59 Years | 1,325 (7.3%) | 1,341 (7.0%) |
| 60 to 64 Years | 1,307 (7.2%) | 1,536 (8.0%) |
| 65 to 69 Years | 1,033 (5.7%) | 1,260 (6.5%) |
| 70 to 74 Years | 971 (5.3%) | 991 (5.1%) |
| 75 to 79 Years | 857 (4.7%) | 730 (3.8%) |
| 80 to 84 Years | 379 (2.1%) | 528 (2.7%) |
| 85 Years and over | 393 (2.1%) | 627 (3.3%) |
| Total | 18,251 (100.0%) | 19,301 (100.0%) |
Families and Households in San Lorenzo Municipio
Median Family Size in San Lorenzo Municipio
The median family size in San Lorenzo Municipio is 3.44 persons per family, with single male/father families (969 | 10.8%) accounting for the largest median family size of 3.58 persons per family. On the other hand, single female/mother families (2,827 | 31.5%) represent the smallest median family size with 3.40 persons per family.
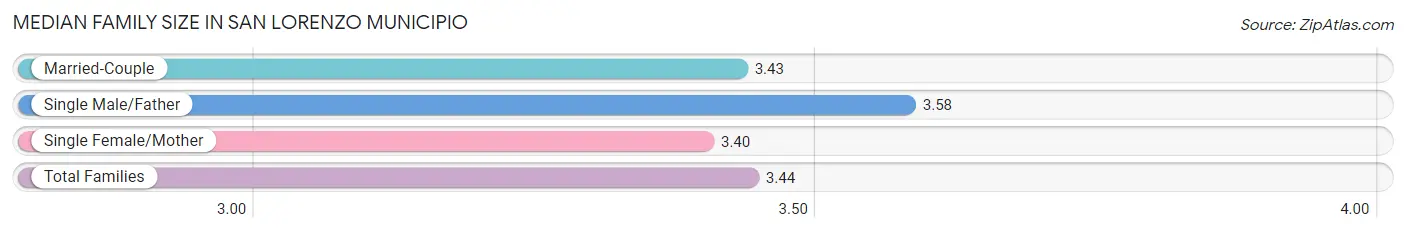
| Family Type | # Families | Family Size |
| Married-Couple | 5,186 (57.7%) | 3.43 |
| Single Male/Father | 969 (10.8%) | 3.58 |
| Single Female/Mother | 2,827 (31.5%) | 3.40 |
| Total Families | 8,982 (100.0%) | 3.44 |
Median Household Size in San Lorenzo Municipio
The median household size in San Lorenzo Municipio is 2.72 persons per household, with single male/father households (969 | 7.0%) accounting for the largest median household size of 4.24 persons per household. non-family households (4,793 | 34.8%) represent the smallest median household size with 1.14 persons per household.
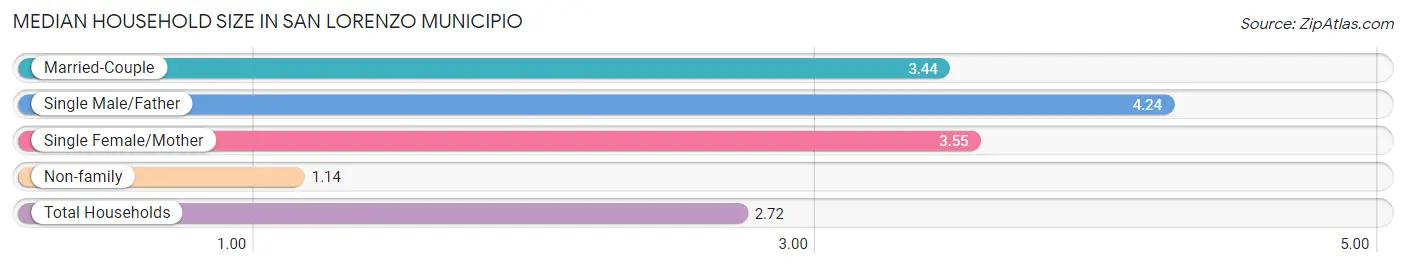
| Household Type | # Households | Household Size |
| Married-Couple | 5,186 (37.7%) | 3.44 |
| Single Male/Father | 969 (7.0%) | 4.24 |
| Single Female/Mother | 2,827 (20.5%) | 3.55 |
| Non-family | 4,793 (34.8%) | 1.14 |
| Total Households | 13,775 (100.0%) | 2.72 |
Household Size by Marriage Status in San Lorenzo Municipio
Out of a total of 13,775 households in San Lorenzo Municipio, 8,982 (65.2%) are family households, while 4,793 (34.8%) are nonfamily households. The most numerous type of family households are 2-person households, comprising 3,949, and the most common type of nonfamily households are 1-person households, comprising 4,165.
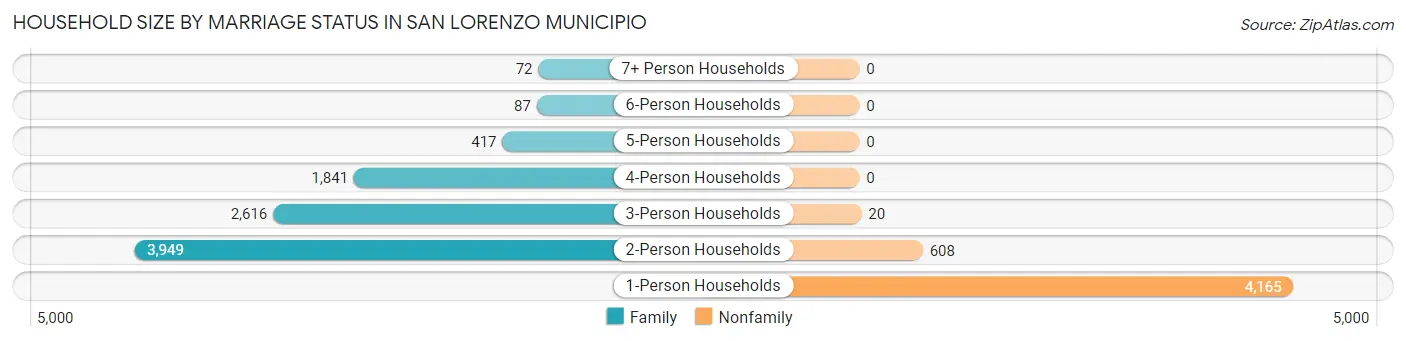
| Household Size | Family Households | Nonfamily Households |
| 1-Person Households | - | 4,165 (30.2%) |
| 2-Person Households | 3,949 (28.7%) | 608 (4.4%) |
| 3-Person Households | 2,616 (19.0%) | 20 (0.2%) |
| 4-Person Households | 1,841 (13.4%) | 0 (0.0%) |
| 5-Person Households | 417 (3.0%) | 0 (0.0%) |
| 6-Person Households | 87 (0.6%) | 0 (0.0%) |
| 7+ Person Households | 72 (0.5%) | 0 (0.0%) |
| Total | 8,982 (65.2%) | 4,793 (34.8%) |
Female Fertility in San Lorenzo Municipio
Fertility by Age in San Lorenzo Municipio
Average fertility rate in San Lorenzo Municipio is 13.0 births per 1,000 women. Women in the age bracket of 15 to 19 years have the highest fertility rate with 25.0 births per 1,000 women. Women in the age bracket of 20 to 34 years acount for 49.1% of all women with births.
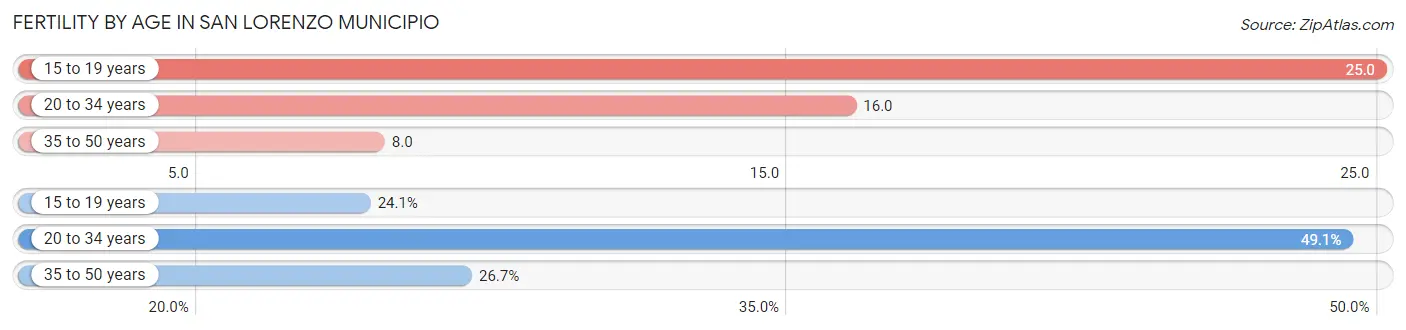
| Age Bracket | Women with Births | Births / 1,000 Women |
| 15 to 19 years | 28 (24.1%) | 25.0 |
| 20 to 34 years | 57 (49.1%) | 16.0 |
| 35 to 50 years | 31 (26.7%) | 8.0 |
| Total | 116 (100.0%) | 13.0 |
Fertility by Age by Marriage Status in San Lorenzo Municipio
26.7% of women with births (116) in San Lorenzo Municipio are married. The highest percentage of unmarried women with births falls into 15 to 19 years age bracket with 100.0% of them unmarried at the time of birth, while the lowest percentage of unmarried women with births belong to 35 to 50 years age bracket with 0.0% of them unmarried.
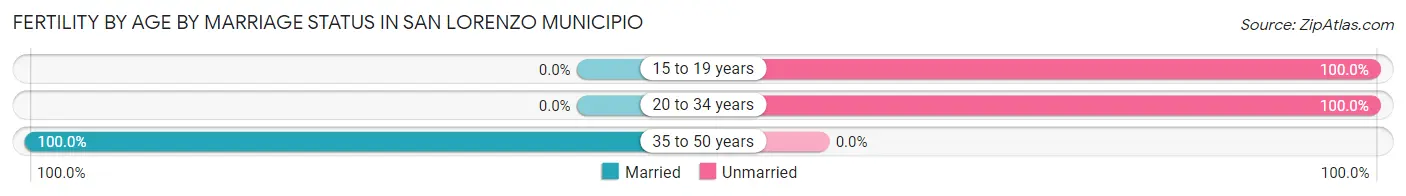
| Age Bracket | Married | Unmarried |
| 15 to 19 years | 0 (0.0%) | 28 (100.0%) |
| 20 to 34 years | 0 (0.0%) | 57 (100.0%) |
| 35 to 50 years | 31 (100.0%) | 0 (0.0%) |
| Total | 31 (26.7%) | 85 (73.3%) |
Fertility by Education in San Lorenzo Municipio
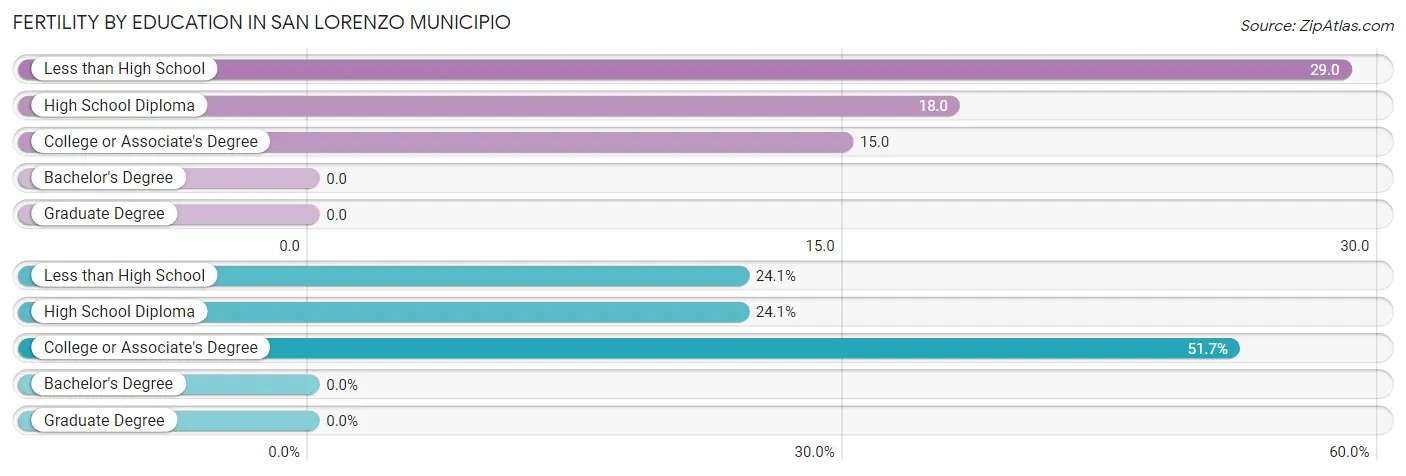
| Educational Attainment | Women with Births | Births / 1,000 Women |
| Less than High School | 28 (24.1%) | 29.0 |
| High School Diploma | 28 (24.1%) | 18.0 |
| College or Associate's Degree | 60 (51.7%) | 15.0 |
| Bachelor's Degree | 0 (0.0%) | 0.0 |
| Graduate Degree | 0 (0.0%) | 0.0 |
| Total | 116 (100.0%) | 13.0 |
Fertility by Education by Marriage Status in San Lorenzo Municipio
73.3% of women with births in San Lorenzo Municipio are unmarried. Women with the educational attainment of college or associate's degree are most likely to be married with 51.7% of them married at childbirth, while women with the educational attainment of less than high school are least likely to be married with 100.0% of them unmarried at childbirth.
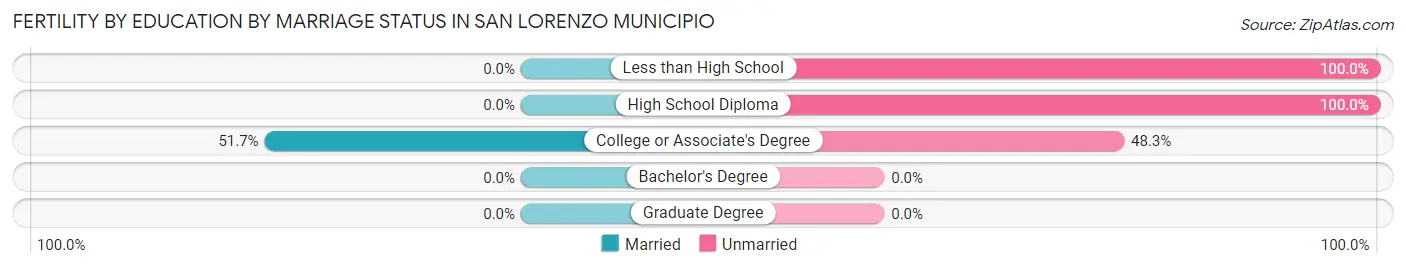
| Educational Attainment | Married | Unmarried |
| Less than High School | 0 (0.0%) | 28 (100.0%) |
| High School Diploma | 0 (0.0%) | 28 (100.0%) |
| College or Associate's Degree | 31 (51.7%) | 29 (48.3%) |
| Bachelor's Degree | 0 (0.0%) | 0 (0.0%) |
| Graduate Degree | 0 (0.0%) | 0 (0.0%) |
| Total | 31 (26.7%) | 85 (73.3%) |
Employment Characteristics in San Lorenzo Municipio
Employment by Class of Employer in San Lorenzo Municipio
Among the 11,316 employed individuals in San Lorenzo Municipio, private company employees (7,610 | 67.2%), state government employees (1,405 | 12.4%), and self-employed (not incorporated) (1,368 | 12.1%) make up the most common classes of employment.
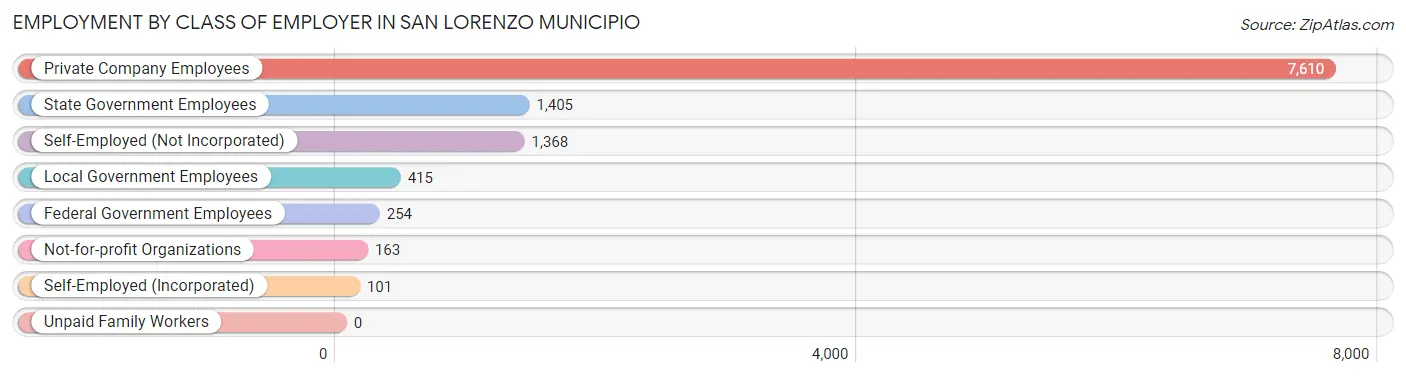
| Employer Class | # Employees | % Employees |
| Private Company Employees | 7,610 | 67.2% |
| Self-Employed (Incorporated) | 101 | 0.9% |
| Self-Employed (Not Incorporated) | 1,368 | 12.1% |
| Not-for-profit Organizations | 163 | 1.4% |
| Local Government Employees | 415 | 3.7% |
| State Government Employees | 1,405 | 12.4% |
| Federal Government Employees | 254 | 2.2% |
| Unpaid Family Workers | 0 | 0.0% |
| Total | 11,316 | 100.0% |
Employment Status by Age in San Lorenzo Municipio
According to the labor force statistics for San Lorenzo Municipio, out of the total population over 16 years of age (32,207), 39.8% or 12,818 individuals are in the labor force, with 8.3% or 1,064 of them unemployed. The age group with the highest labor force participation rate is 35 to 44 years, with 75.2% or 3,522 individuals in the labor force. Within the labor force, the 16 to 19 years age range has the highest percentage of unemployed individuals, with 31.8% or 74 of them being unemployed.
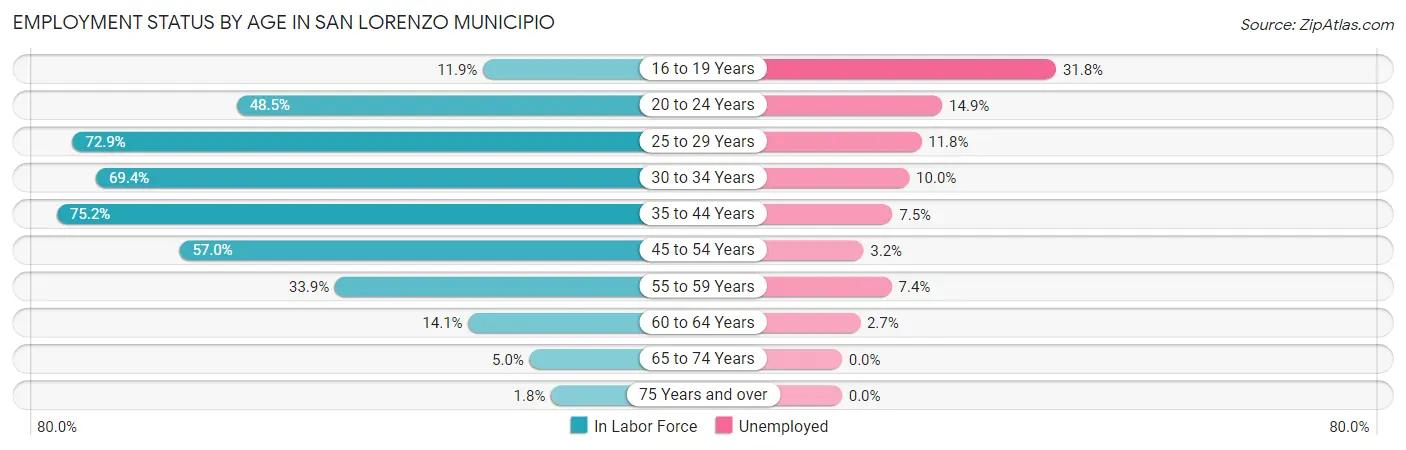
| Age Bracket | In Labor Force | Unemployed |
| 16 to 19 Years | 233 (11.9%) | 74 (31.8%) |
| 20 to 24 Years | 1,174 (48.5%) | 175 (14.9%) |
| 25 to 29 Years | 1,876 (72.9%) | 221 (11.8%) |
| 30 to 34 Years | 1,576 (69.4%) | 158 (10.0%) |
| 35 to 44 Years | 3,522 (75.2%) | 264 (7.5%) |
| 45 to 54 Years | 2,864 (57.0%) | 92 (3.2%) |
| 55 to 59 Years | 904 (33.9%) | 67 (7.4%) |
| 60 to 64 Years | 401 (14.1%) | 11 (2.7%) |
| 65 to 74 Years | 213 (5.0%) | 0 (0.0%) |
| 75 Years and over | 63 (1.8%) | 0 (0.0%) |
| Total | 12,818 (39.8%) | 1,064 (8.3%) |
Employment Status by Educational Attainment in San Lorenzo Municipio
According to labor force statistics for San Lorenzo Municipio, 55.5% of individuals (11,134) out of the total population between 25 and 64 years of age (20,062) are in the labor force, with 7.3% or 813 of them being unemployed. The group with the highest labor force participation rate are those with the educational attainment of bachelor's degree or higher, with 77.3% or 3,545 individuals in the labor force. Within the labor force, individuals with less than high school education have the highest percentage of unemployment, with 15.8% or 115 of them being unemployed.
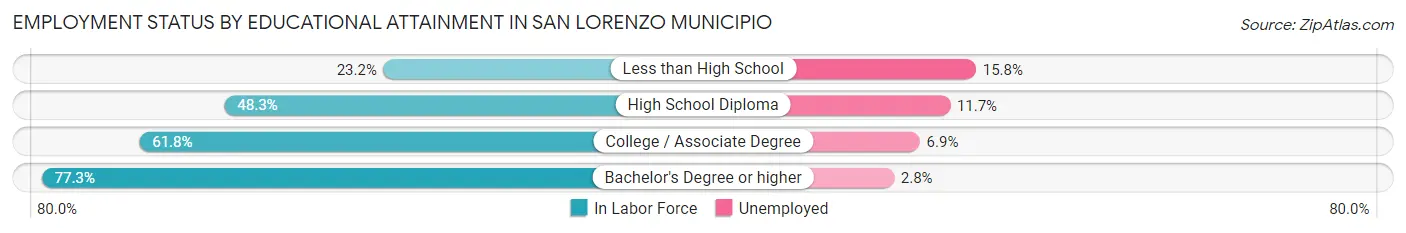
| Educational Attainment | In Labor Force | Unemployed |
| Less than High School | 731 (23.2%) | 498 (15.8%) |
| High School Diploma | 2,674 (48.3%) | 648 (11.7%) |
| College / Associate Degree | 4,195 (61.8%) | 468 (6.9%) |
| Bachelor's Degree or higher | 3,545 (77.3%) | 128 (2.8%) |
| Total | 11,134 (55.5%) | 1,465 (7.3%) |
Employment Occupations by Sex in San Lorenzo Municipio
Management, Business, Science and Arts Occupations
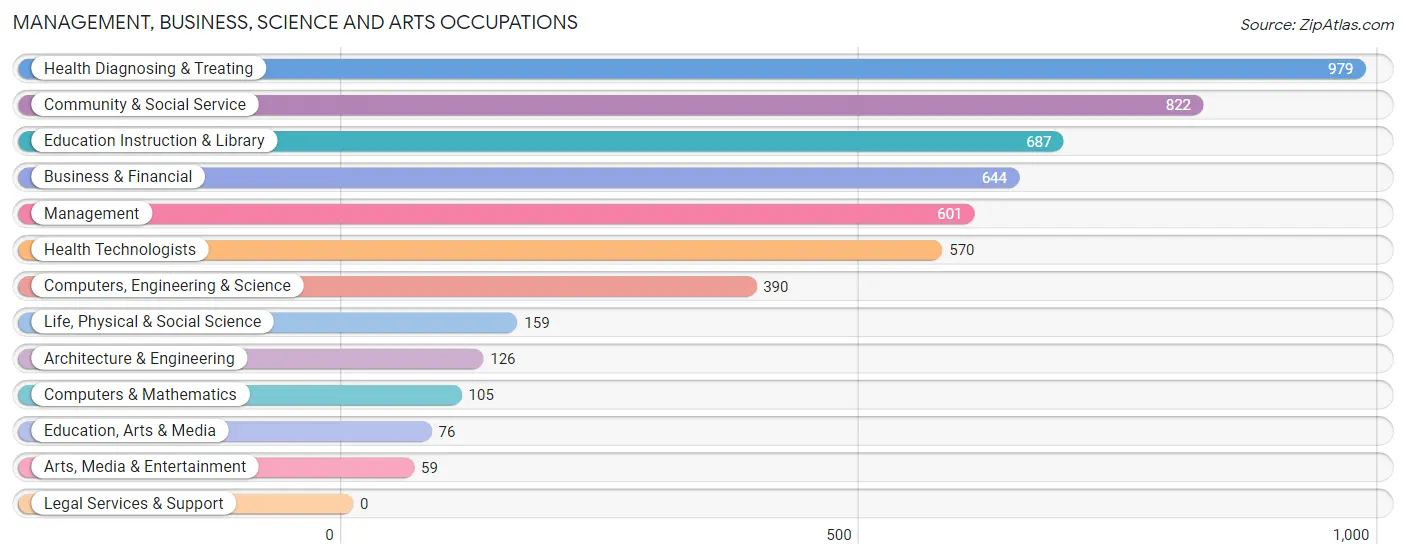
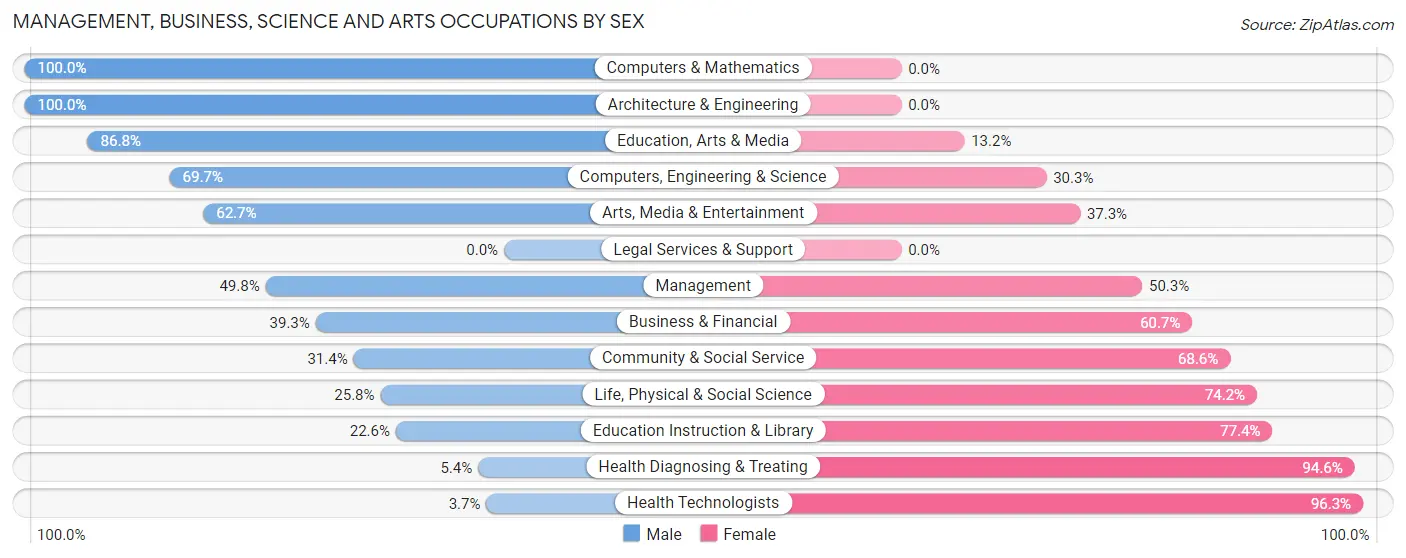
The most common Management, Business, Science and Arts occupations in San Lorenzo Municipio are Health Diagnosing & Treating (979 | 8.4%), Community & Social Service (822 | 7.0%), Education Instruction & Library (687 | 5.9%), Business & Financial (644 | 5.5%), and Management (601 | 5.1%).
Management, Business, Science and Arts Occupations by Sex
Within the Management, Business, Science and Arts occupations in San Lorenzo Municipio, the most male-oriented occupations are Computers & Mathematics (100.0%), Architecture & Engineering (100.0%), and Education, Arts & Media (86.8%), while the most female-oriented occupations are Health Technologists (96.3%), Health Diagnosing & Treating (94.6%), and Education Instruction & Library (77.4%).
| Occupation | Male | Female |
| Management | 299 (49.7%) | 302 (50.2%) |
| Business & Financial | 253 (39.3%) | 391 (60.7%) |
| Computers, Engineering & Science | 272 (69.7%) | 118 (30.3%) |
| Computers & Mathematics | 105 (100.0%) | 0 (0.0%) |
| Architecture & Engineering | 126 (100.0%) | 0 (0.0%) |
| Life, Physical & Social Science | 41 (25.8%) | 118 (74.2%) |
| Community & Social Service | 258 (31.4%) | 564 (68.6%) |
| Education, Arts & Media | 66 (86.8%) | 10 (13.2%) |
| Legal Services & Support | 0 (0.0%) | 0 (0.0%) |
| Education Instruction & Library | 155 (22.6%) | 532 (77.4%) |
| Arts, Media & Entertainment | 37 (62.7%) | 22 (37.3%) |
| Health Diagnosing & Treating | 53 (5.4%) | 926 (94.6%) |
| Health Technologists | 21 (3.7%) | 549 (96.3%) |
| Total (Category) | 1,135 (33.0%) | 2,301 (67.0%) |
| Total (Overall) | 6,007 (51.2%) | 5,716 (48.8%) |
Services Occupations
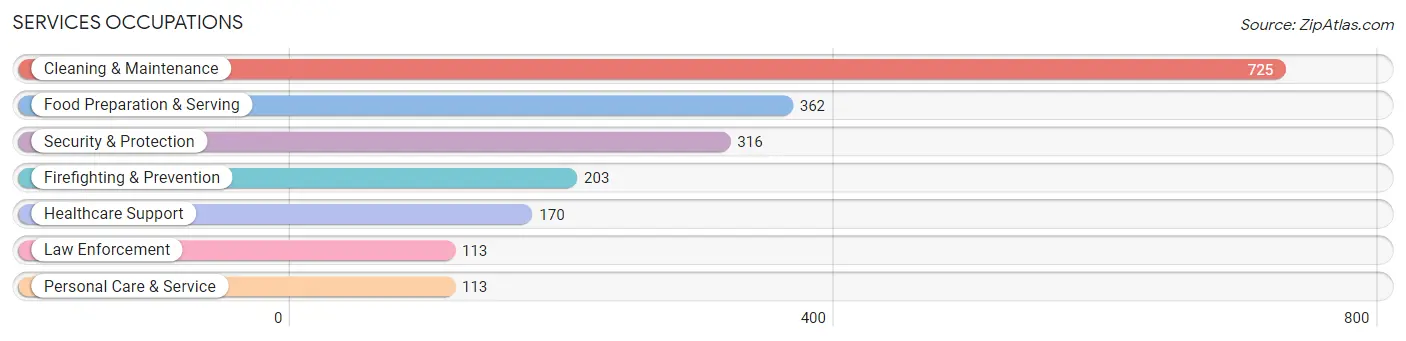
The most common Services occupations in San Lorenzo Municipio are Cleaning & Maintenance (725 | 6.2%), Food Preparation & Serving (362 | 3.1%), Security & Protection (316 | 2.7%), Firefighting & Prevention (203 | 1.7%), and Healthcare Support (170 | 1.5%).
Services Occupations by Sex
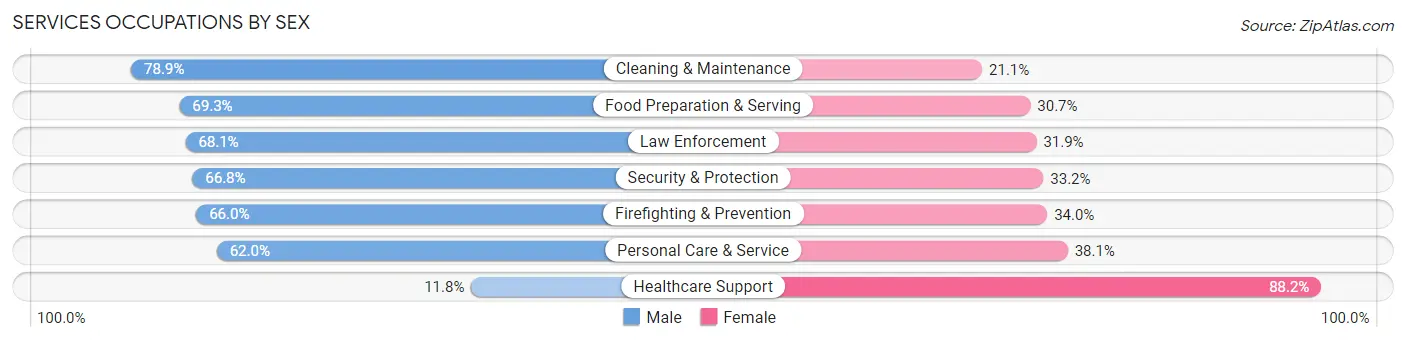
Within the Services occupations in San Lorenzo Municipio, the most male-oriented occupations are Cleaning & Maintenance (78.9%), Food Preparation & Serving (69.3%), and Law Enforcement (68.1%), while the most female-oriented occupations are Healthcare Support (88.2%), Personal Care & Service (38.1%), and Firefighting & Prevention (34.0%).
| Occupation | Male | Female |
| Healthcare Support | 20 (11.8%) | 150 (88.2%) |
| Security & Protection | 211 (66.8%) | 105 (33.2%) |
| Firefighting & Prevention | 134 (66.0%) | 69 (34.0%) |
| Law Enforcement | 77 (68.1%) | 36 (31.9%) |
| Food Preparation & Serving | 251 (69.3%) | 111 (30.7%) |
| Cleaning & Maintenance | 572 (78.9%) | 153 (21.1%) |
| Personal Care & Service | 70 (62.0%) | 43 (38.1%) |
| Total (Category) | 1,124 (66.7%) | 562 (33.3%) |
| Total (Overall) | 6,007 (51.2%) | 5,716 (48.8%) |
Sales and Office Occupations
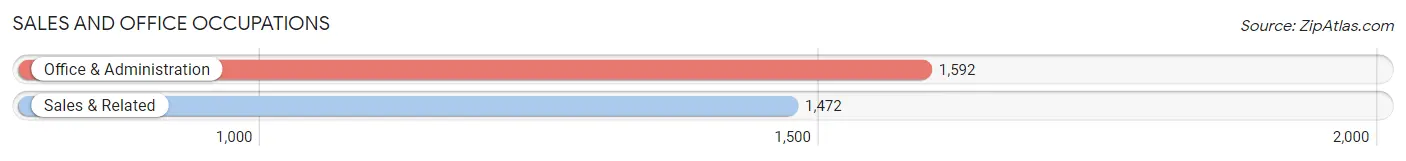
The most common Sales and Office occupations in San Lorenzo Municipio are Office & Administration (1,592 | 13.6%), and Sales & Related (1,472 | 12.6%).
Sales and Office Occupations by Sex
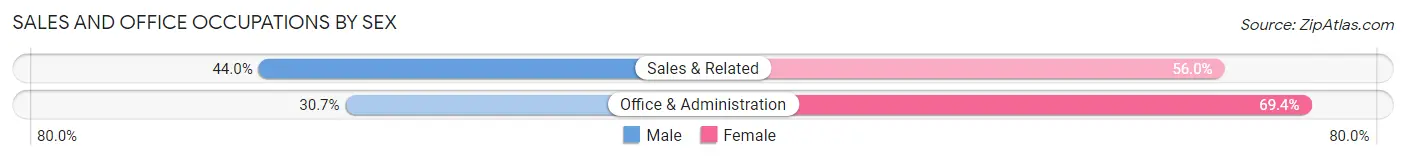
| Occupation | Male | Female |
| Sales & Related | 648 (44.0%) | 824 (56.0%) |
| Office & Administration | 488 (30.6%) | 1,104 (69.4%) |
| Total (Category) | 1,136 (37.1%) | 1,928 (62.9%) |
| Total (Overall) | 6,007 (51.2%) | 5,716 (48.8%) |
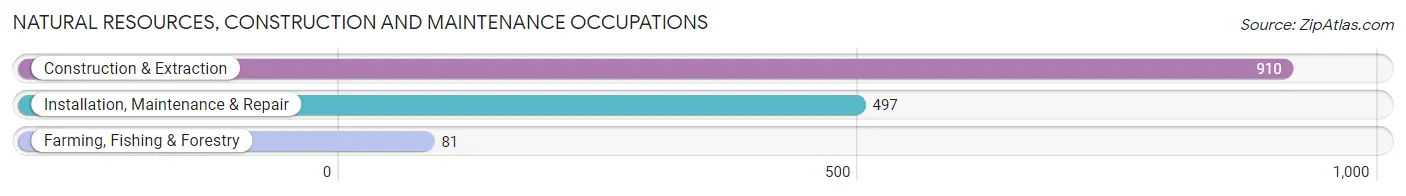
Natural Resources, Construction and Maintenance Occupations
The most common Natural Resources, Construction and Maintenance occupations in San Lorenzo Municipio are Construction & Extraction (910 | 7.8%), Installation, Maintenance & Repair (497 | 4.2%), and Farming, Fishing & Forestry (81 | 0.7%).
Natural Resources, Construction and Maintenance Occupations by Sex
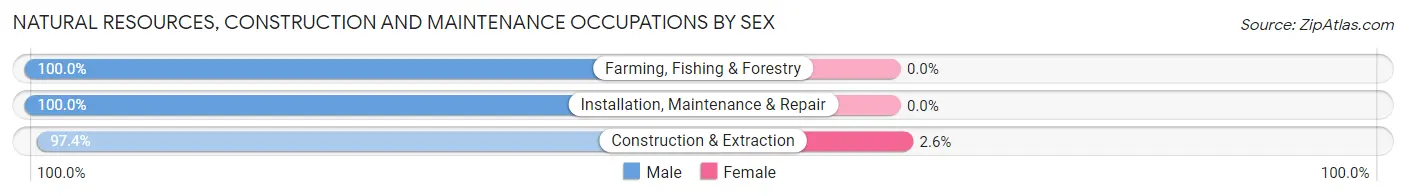
| Occupation | Male | Female |
| Farming, Fishing & Forestry | 81 (100.0%) | 0 (0.0%) |
| Construction & Extraction | 886 (97.4%) | 24 (2.6%) |
| Installation, Maintenance & Repair | 497 (100.0%) | 0 (0.0%) |
| Total (Category) | 1,464 (98.4%) | 24 (1.6%) |
| Total (Overall) | 6,007 (51.2%) | 5,716 (48.8%) |
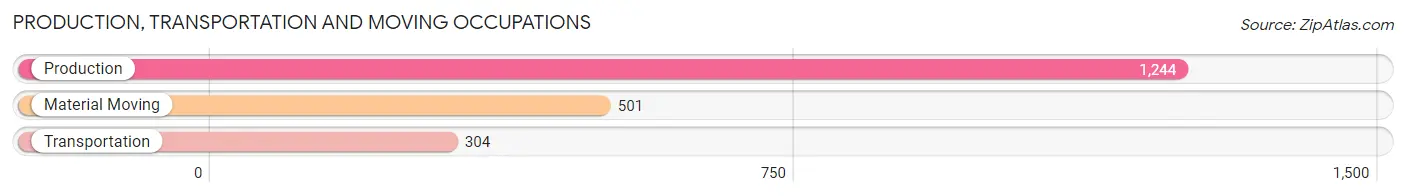
Production, Transportation and Moving Occupations
The most common Production, Transportation and Moving occupations in San Lorenzo Municipio are Production (1,244 | 10.6%), Material Moving (501 | 4.3%), and Transportation (304 | 2.6%).
Production, Transportation and Moving Occupations by Sex
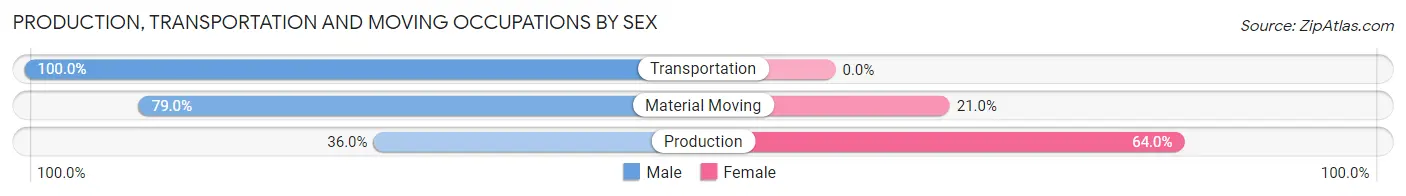
| Occupation | Male | Female |
| Production | 448 (36.0%) | 796 (64.0%) |
| Transportation | 304 (100.0%) | 0 (0.0%) |
| Material Moving | 396 (79.0%) | 105 (21.0%) |
| Total (Category) | 1,148 (56.0%) | 901 (44.0%) |
| Total (Overall) | 6,007 (51.2%) | 5,716 (48.8%) |
Employment Industries by Sex in San Lorenzo Municipio
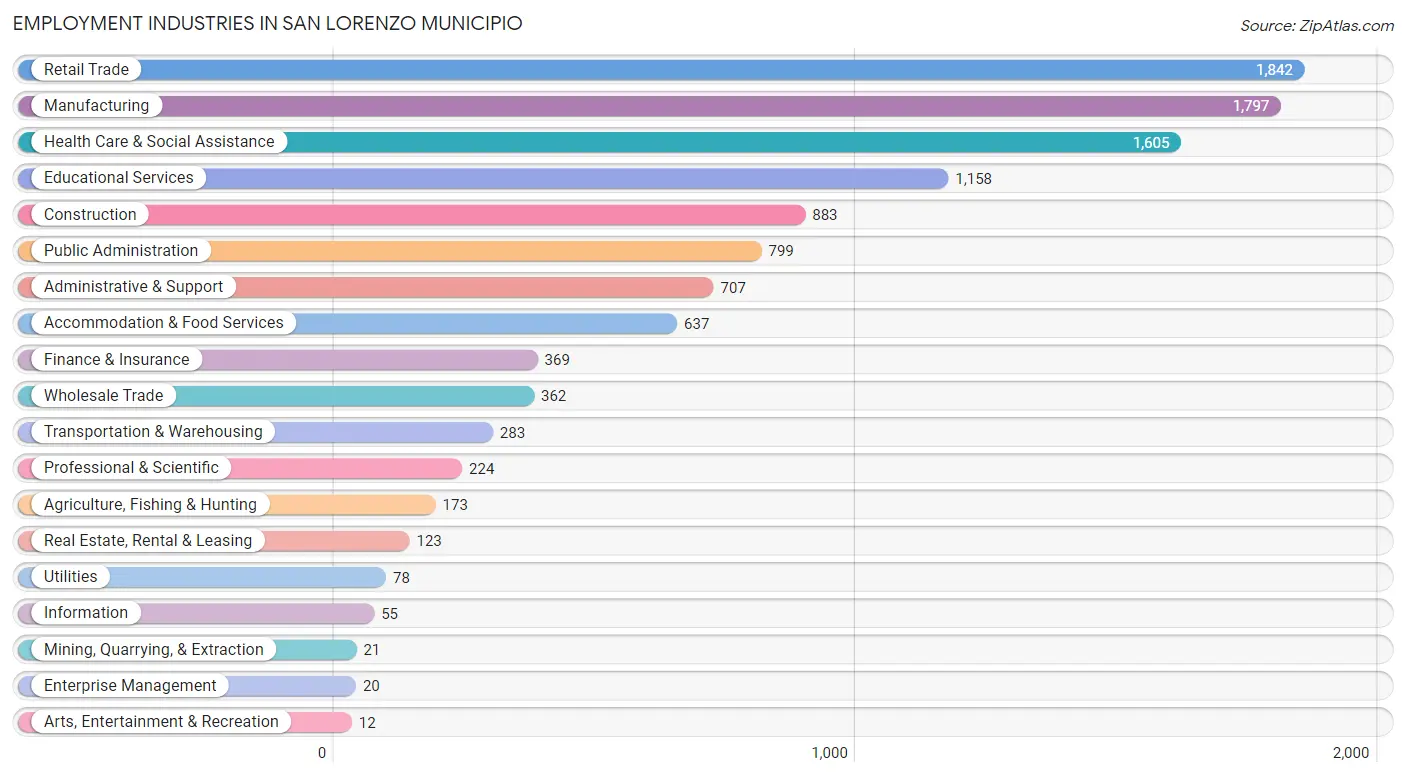
Employment Industries in San Lorenzo Municipio
The major employment industries in San Lorenzo Municipio include Retail Trade (1,842 | 15.7%), Manufacturing (1,797 | 15.3%), Health Care & Social Assistance (1,605 | 13.7%), Educational Services (1,158 | 9.9%), and Construction (883 | 7.5%).
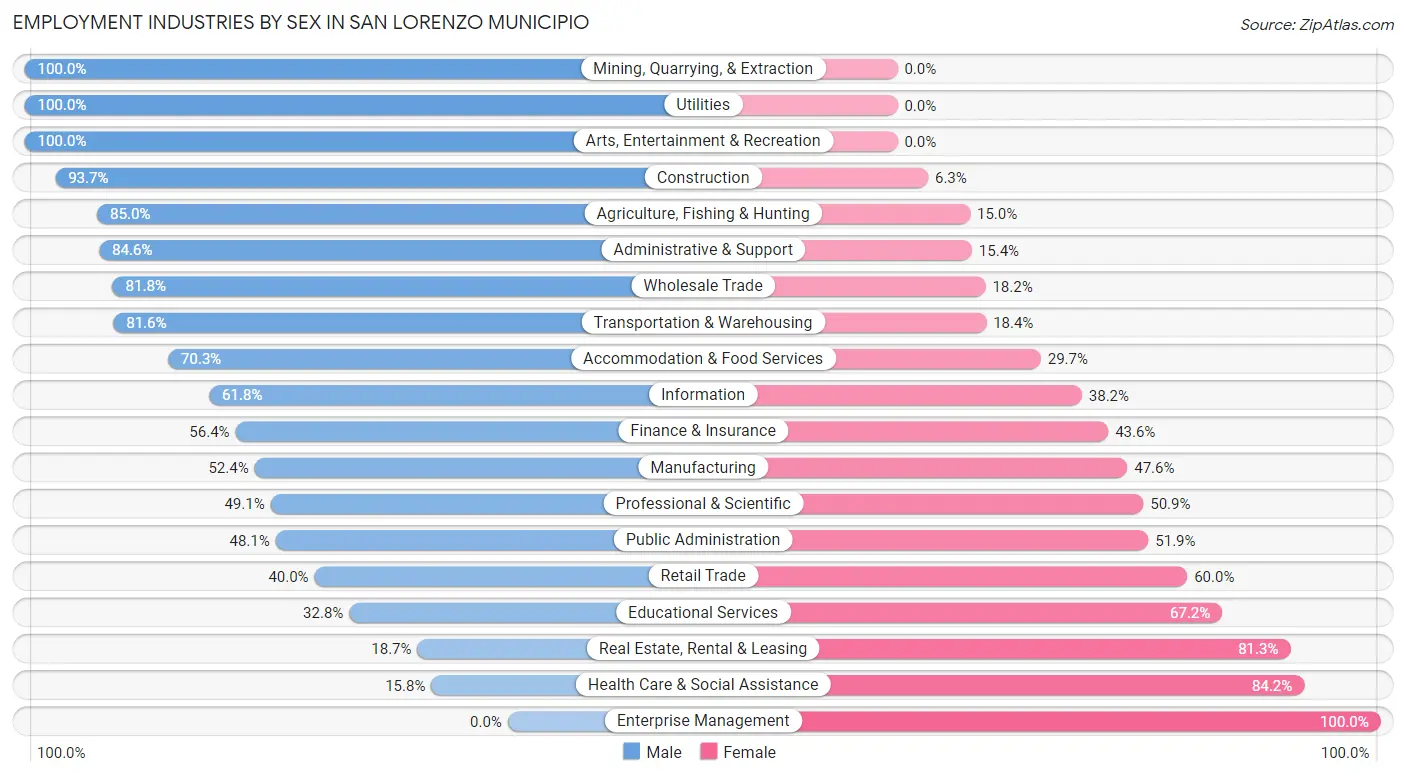
Employment Industries by Sex in San Lorenzo Municipio
The San Lorenzo Municipio industries that see more men than women are Mining, Quarrying, & Extraction (100.0%), Utilities (100.0%), and Arts, Entertainment & Recreation (100.0%), whereas the industries that tend to have a higher number of women are Enterprise Management (100.0%), Health Care & Social Assistance (84.2%), and Real Estate, Rental & Leasing (81.3%).
| Industry | Male | Female |
| Agriculture, Fishing & Hunting | 147 (85.0%) | 26 (15.0%) |
| Mining, Quarrying, & Extraction | 21 (100.0%) | 0 (0.0%) |
| Construction | 827 (93.7%) | 56 (6.3%) |
| Manufacturing | 942 (52.4%) | 855 (47.6%) |
| Wholesale Trade | 296 (81.8%) | 66 (18.2%) |
| Retail Trade | 737 (40.0%) | 1,105 (60.0%) |
| Transportation & Warehousing | 231 (81.6%) | 52 (18.4%) |
| Utilities | 78 (100.0%) | 0 (0.0%) |
| Information | 34 (61.8%) | 21 (38.2%) |
| Finance & Insurance | 208 (56.4%) | 161 (43.6%) |
| Real Estate, Rental & Leasing | 23 (18.7%) | 100 (81.3%) |
| Professional & Scientific | 110 (49.1%) | 114 (50.9%) |
| Enterprise Management | 0 (0.0%) | 20 (100.0%) |
| Administrative & Support | 598 (84.6%) | 109 (15.4%) |
| Educational Services | 380 (32.8%) | 778 (67.2%) |
| Health Care & Social Assistance | 254 (15.8%) | 1,351 (84.2%) |
| Arts, Entertainment & Recreation | 12 (100.0%) | 0 (0.0%) |
| Accommodation & Food Services | 448 (70.3%) | 189 (29.7%) |
| Public Administration | 384 (48.1%) | 415 (51.9%) |
| Total | 6,007 (51.2%) | 5,716 (48.8%) |
Education in San Lorenzo Municipio
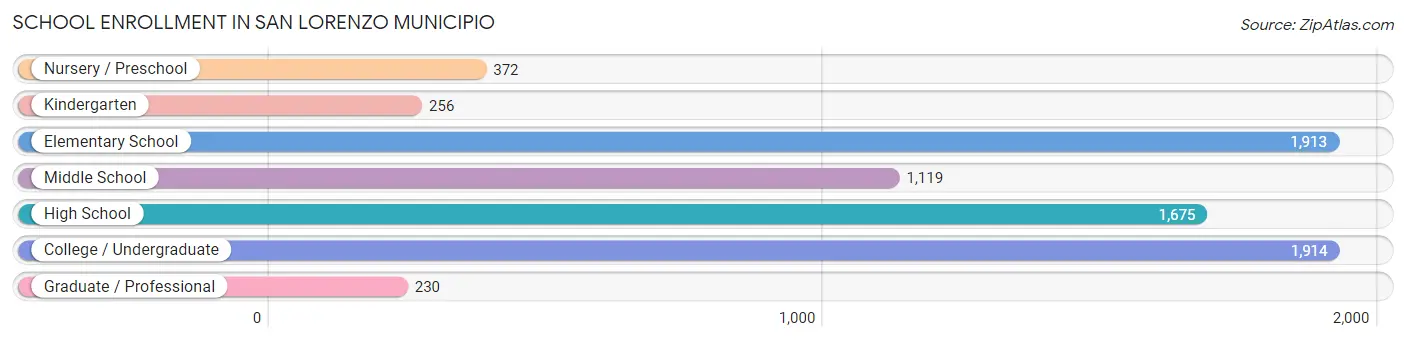
School Enrollment in San Lorenzo Municipio
The most common levels of schooling among the 7,479 students in San Lorenzo Municipio are college / undergraduate (1,914 | 25.6%), elementary school (1,913 | 25.6%), and high school (1,675 | 22.4%).
| School Level | # Students | % Students |
| Nursery / Preschool | 372 | 5.0% |
| Kindergarten | 256 | 3.4% |
| Elementary School | 1,913 | 25.6% |
| Middle School | 1,119 | 15.0% |
| High School | 1,675 | 22.4% |
| College / Undergraduate | 1,914 | 25.6% |
| Graduate / Professional | 230 | 3.1% |
| Total | 7,479 | 100.0% |
School Enrollment by Age by Funding Source in San Lorenzo Municipio
Out of a total of 7,479 students who are enrolled in schools in San Lorenzo Municipio, 2,423 (32.4%) attend a private institution, while the remaining 5,056 (67.6%) are enrolled in public schools. The age group of 35 years and over has the highest likelihood of being enrolled in private schools, with 162 (83.5% in the age bracket) enrolled. Conversely, the age group of 10 to 14 year olds has the lowest likelihood of being enrolled in a private school, with 1,317 (82.2% in the age bracket) attending a public institution.
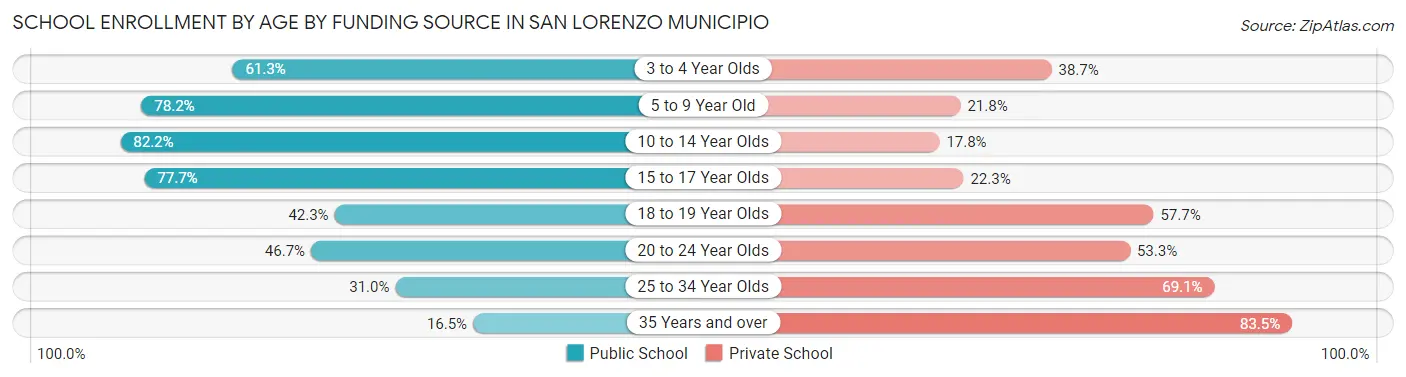
| Age Bracket | Public School | Private School |
| 3 to 4 Year Olds | 239 (61.3%) | 151 (38.7%) |
| 5 to 9 Year Old | 1,640 (78.2%) | 456 (21.8%) |
| 10 to 14 Year Olds | 1,317 (82.2%) | 286 (17.8%) |
| 15 to 17 Year Olds | 992 (77.7%) | 285 (22.3%) |
| 18 to 19 Year Olds | 247 (42.3%) | 337 (57.7%) |
| 20 to 24 Year Olds | 525 (46.7%) | 600 (53.3%) |
| 25 to 34 Year Olds | 65 (30.9%) | 145 (69.1%) |
| 35 Years and over | 32 (16.5%) | 162 (83.5%) |
| Total | 5,056 (67.6%) | 2,423 (32.4%) |
Educational Attainment by Field of Study in San Lorenzo Municipio
Business (1,539 | 27.7%), education (1,279 | 23.1%), science & technology (657 | 11.8%), arts & humanities (362 | 6.5%), and psychology (330 | 5.9%) are the most common fields of study among 5,548 individuals in San Lorenzo Municipio who have obtained a bachelor's degree or higher.
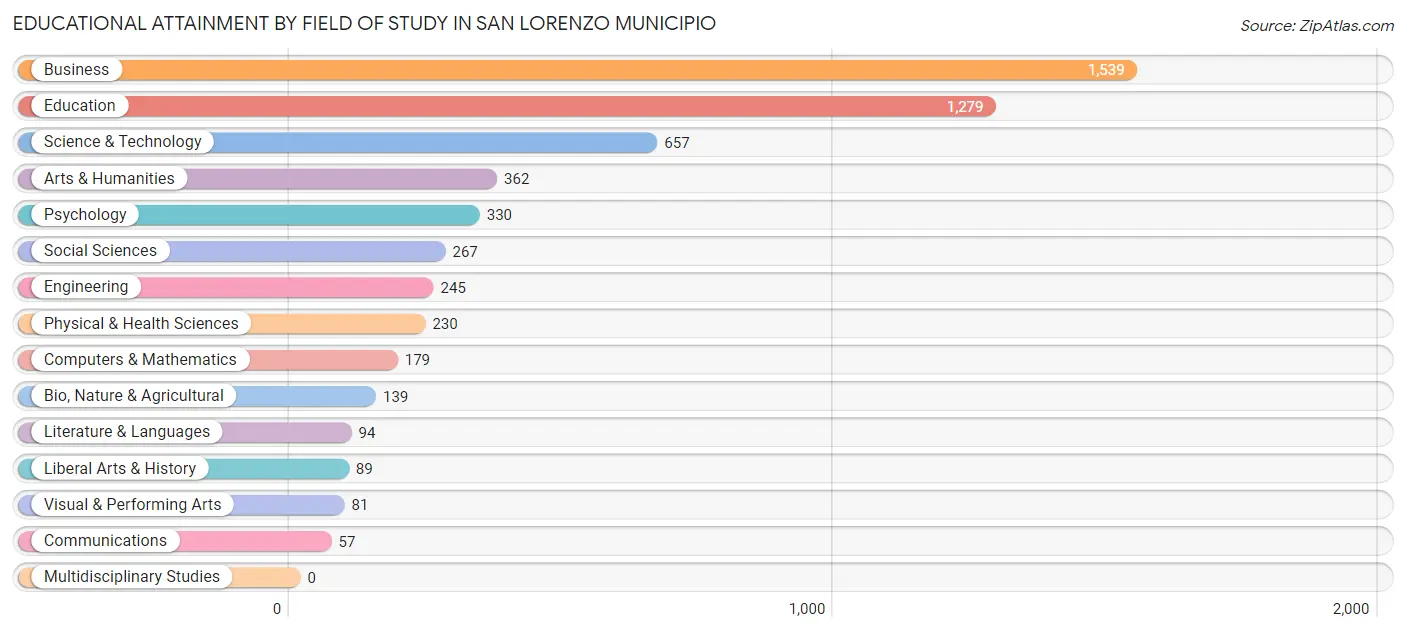
| Field of Study | # Graduates | % Graduates |
| Computers & Mathematics | 179 | 3.2% |
| Bio, Nature & Agricultural | 139 | 2.5% |
| Physical & Health Sciences | 230 | 4.2% |
| Psychology | 330 | 5.9% |
| Social Sciences | 267 | 4.8% |
| Engineering | 245 | 4.4% |
| Multidisciplinary Studies | 0 | 0.0% |
| Science & Technology | 657 | 11.8% |
| Business | 1,539 | 27.7% |
| Education | 1,279 | 23.1% |
| Literature & Languages | 94 | 1.7% |
| Liberal Arts & History | 89 | 1.6% |
| Visual & Performing Arts | 81 | 1.5% |
| Communications | 57 | 1.0% |
| Arts & Humanities | 362 | 6.5% |
| Total | 5,548 | 100.0% |
Transportation & Commute in San Lorenzo Municipio
Vehicle Availability by Sex in San Lorenzo Municipio
The most prevalent vehicle ownership categories in San Lorenzo Municipio are males with 2 vehicles (2,344, accounting for 40.4%) and females with 2 vehicles (1,657, making up 42.5%).
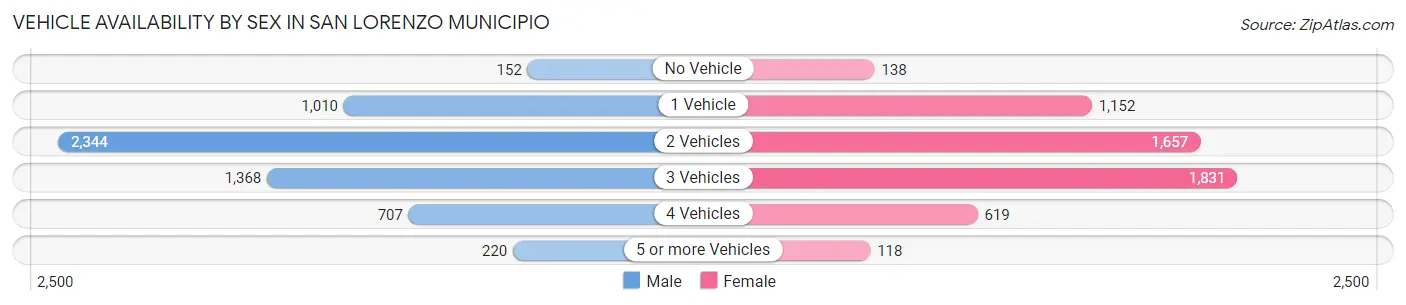
| Vehicles Available | Male | Female |
| No Vehicle | 152 (2.6%) | 138 (2.5%) |
| 1 Vehicle | 1,010 (17.4%) | 1,152 (20.9%) |
| 2 Vehicles | 2,344 (40.4%) | 1,657 (30.0%) |
| 3 Vehicles | 1,368 (23.6%) | 1,831 (33.2%) |
| 4 Vehicles | 707 (12.2%) | 619 (11.2%) |
| 5 or more Vehicles | 220 (3.8%) | 118 (2.1%) |
| Total | 5,801 (100.0%) | 5,515 (100.0%) |
Commute Time in San Lorenzo Municipio
The most frequently occuring commute durations in San Lorenzo Municipio are 30 to 34 minutes (2,511 commuters, 22.2%), 60 to 89 minutes (1,520 commuters, 13.4%), and 20 to 24 minutes (1,146 commuters, 10.1%).
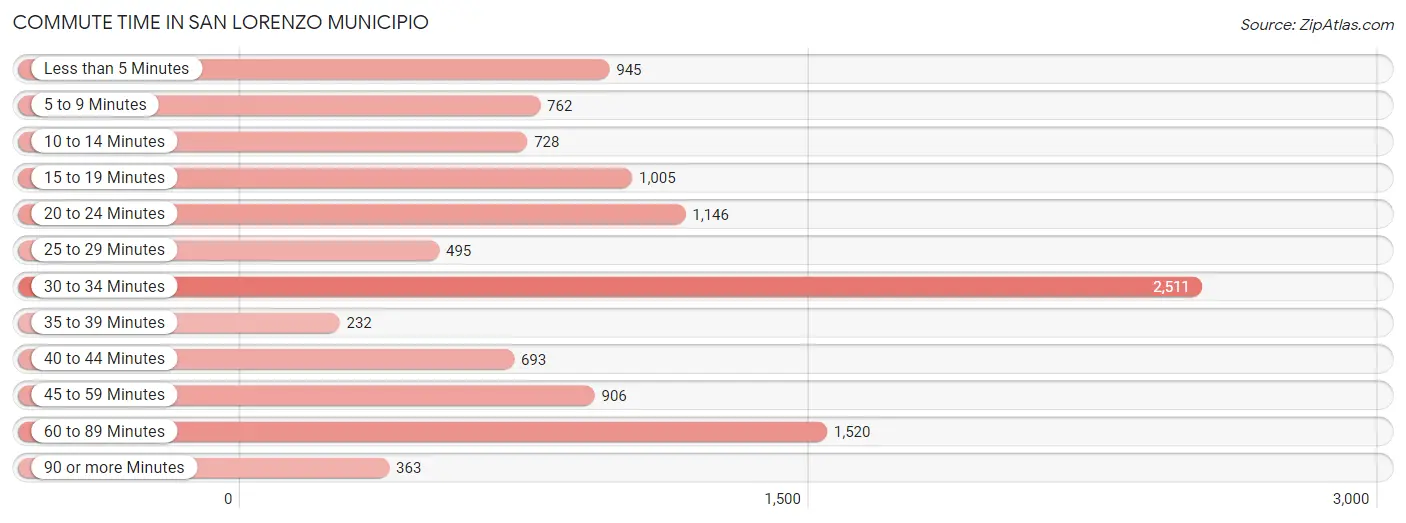
| Commute Time | # Commuters | % Commuters |
| Less than 5 Minutes | 945 | 8.4% |
| 5 to 9 Minutes | 762 | 6.7% |
| 10 to 14 Minutes | 728 | 6.4% |
| 15 to 19 Minutes | 1,005 | 8.9% |
| 20 to 24 Minutes | 1,146 | 10.1% |
| 25 to 29 Minutes | 495 | 4.4% |
| 30 to 34 Minutes | 2,511 | 22.2% |
| 35 to 39 Minutes | 232 | 2.1% |
| 40 to 44 Minutes | 693 | 6.1% |
| 45 to 59 Minutes | 906 | 8.0% |
| 60 to 89 Minutes | 1,520 | 13.4% |
| 90 or more Minutes | 363 | 3.2% |
Commute Time by Sex in San Lorenzo Municipio
The most common commute times in San Lorenzo Municipio are 30 to 34 minutes (1,245 commuters, 21.5%) for males and 30 to 34 minutes (1,266 commuters, 23.0%) for females.
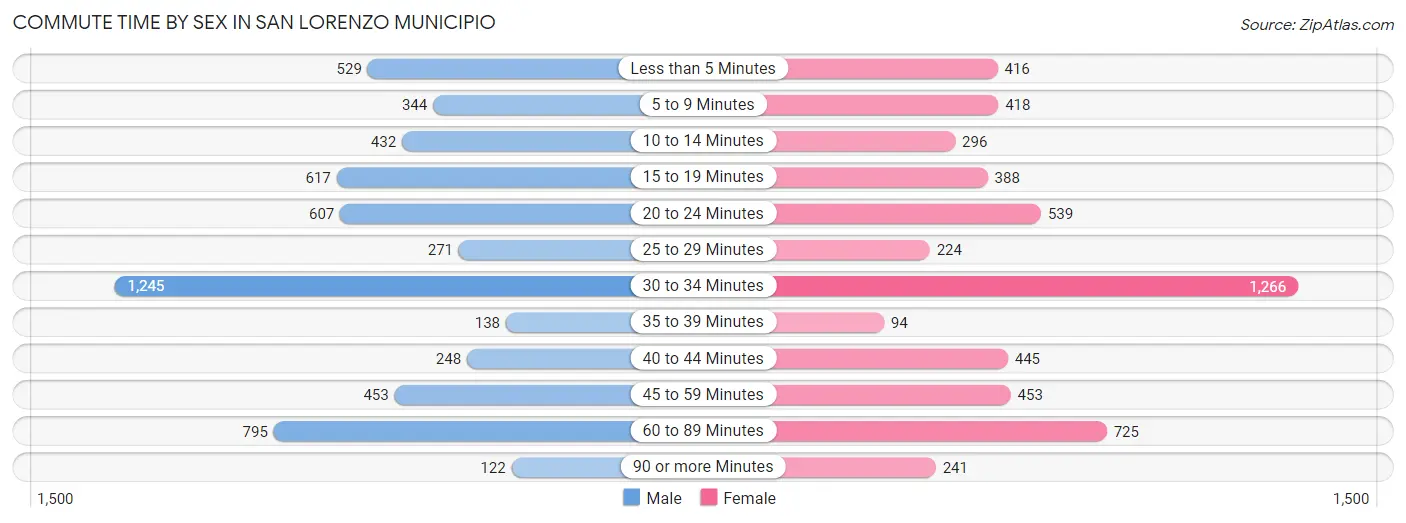
| Commute Time | Male | Female |
| Less than 5 Minutes | 529 (9.1%) | 416 (7.6%) |
| 5 to 9 Minutes | 344 (5.9%) | 418 (7.6%) |
| 10 to 14 Minutes | 432 (7.4%) | 296 (5.4%) |
| 15 to 19 Minutes | 617 (10.6%) | 388 (7.0%) |
| 20 to 24 Minutes | 607 (10.5%) | 539 (9.8%) |
| 25 to 29 Minutes | 271 (4.7%) | 224 (4.1%) |
| 30 to 34 Minutes | 1,245 (21.5%) | 1,266 (23.0%) |
| 35 to 39 Minutes | 138 (2.4%) | 94 (1.7%) |
| 40 to 44 Minutes | 248 (4.3%) | 445 (8.1%) |
| 45 to 59 Minutes | 453 (7.8%) | 453 (8.2%) |
| 60 to 89 Minutes | 795 (13.7%) | 725 (13.2%) |
| 90 or more Minutes | 122 (2.1%) | 241 (4.4%) |
Time of Departure to Work by Sex in San Lorenzo Municipio
The most frequent times of departure to work in San Lorenzo Municipio are 6:00 AM to 6:29 AM (1,004, 17.3%) for males and 7:00 AM to 7:29 AM (990, 18.0%) for females.
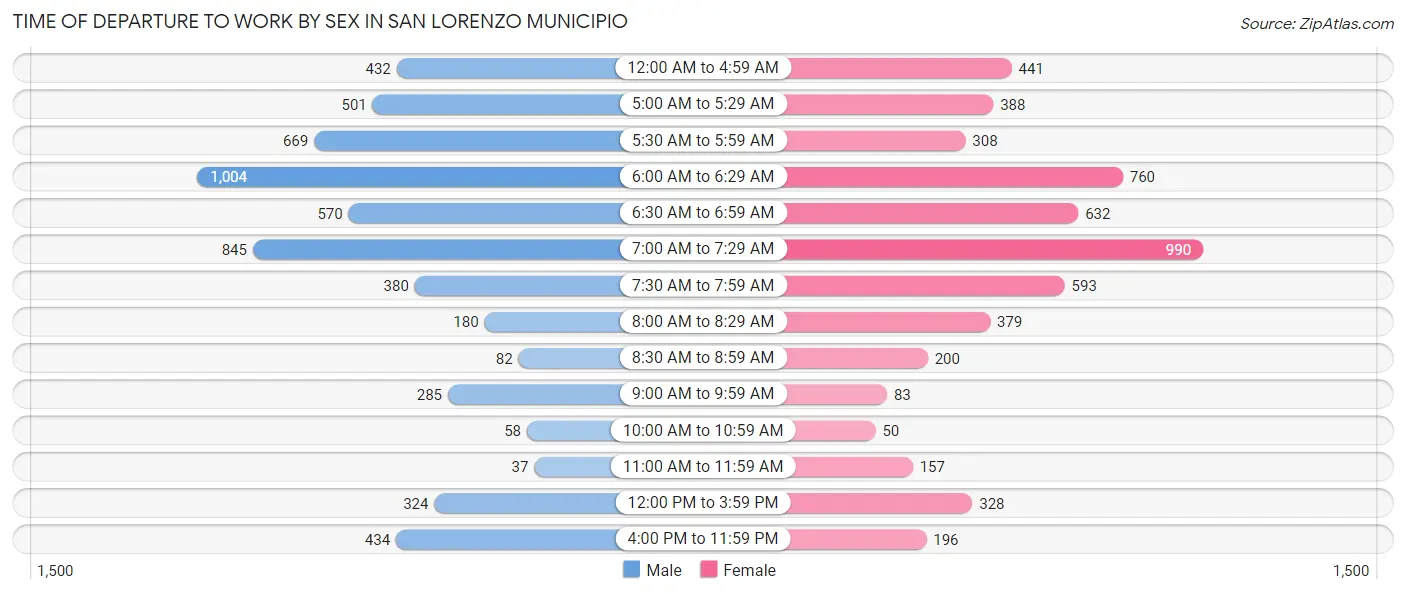
| Time of Departure | Male | Female |
| 12:00 AM to 4:59 AM | 432 (7.4%) | 441 (8.0%) |
| 5:00 AM to 5:29 AM | 501 (8.6%) | 388 (7.0%) |
| 5:30 AM to 5:59 AM | 669 (11.5%) | 308 (5.6%) |
| 6:00 AM to 6:29 AM | 1,004 (17.3%) | 760 (13.8%) |
| 6:30 AM to 6:59 AM | 570 (9.8%) | 632 (11.5%) |
| 7:00 AM to 7:29 AM | 845 (14.6%) | 990 (18.0%) |
| 7:30 AM to 7:59 AM | 380 (6.6%) | 593 (10.8%) |
| 8:00 AM to 8:29 AM | 180 (3.1%) | 379 (6.9%) |
| 8:30 AM to 8:59 AM | 82 (1.4%) | 200 (3.6%) |
| 9:00 AM to 9:59 AM | 285 (4.9%) | 83 (1.5%) |
| 10:00 AM to 10:59 AM | 58 (1.0%) | 50 (0.9%) |
| 11:00 AM to 11:59 AM | 37 (0.6%) | 157 (2.9%) |
| 12:00 PM to 3:59 PM | 324 (5.6%) | 328 (6.0%) |
| 4:00 PM to 11:59 PM | 434 (7.5%) | 196 (3.6%) |
| Total | 5,801 (100.0%) | 5,505 (100.0%) |
Housing Occupancy in San Lorenzo Municipio
Occupancy by Ownership in San Lorenzo Municipio
Of the total 13,775 dwellings in San Lorenzo Municipio, owner-occupied units account for 9,944 (72.2%), while renter-occupied units make up 3,831 (27.8%).
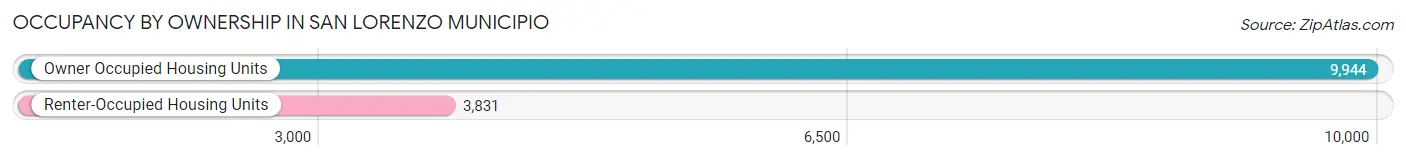
| Occupancy | # Housing Units | % Housing Units |
| Owner Occupied Housing Units | 9,944 | 72.2% |
| Renter-Occupied Housing Units | 3,831 | 27.8% |
| Total Occupied Housing Units | 13,775 | 100.0% |
Occupancy by Household Size in San Lorenzo Municipio
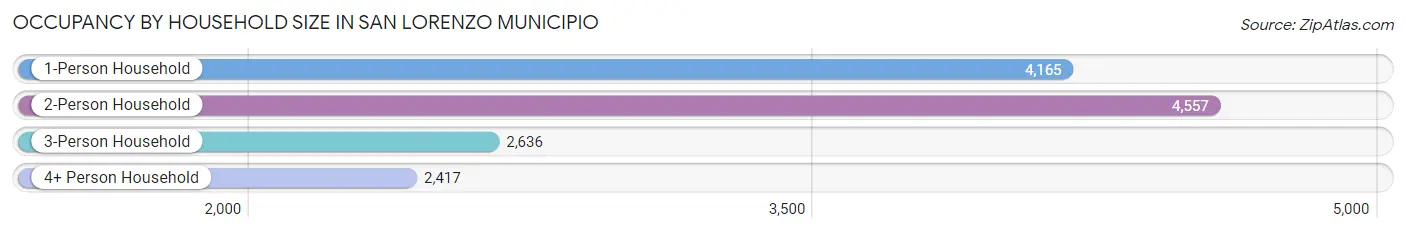
| Household Size | # Housing Units | % Housing Units |
| 1-Person Household | 4,165 | 30.2% |
| 2-Person Household | 4,557 | 33.1% |
| 3-Person Household | 2,636 | 19.1% |
| 4+ Person Household | 2,417 | 17.5% |
| Total Housing Units | 13,775 | 100.0% |
Occupancy by Ownership by Household Size in San Lorenzo Municipio
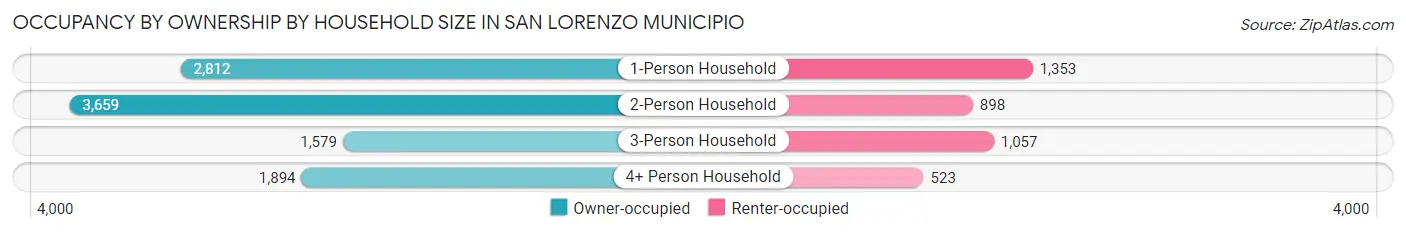
| Household Size | Owner-occupied | Renter-occupied |
| 1-Person Household | 2,812 (67.5%) | 1,353 (32.5%) |
| 2-Person Household | 3,659 (80.3%) | 898 (19.7%) |
| 3-Person Household | 1,579 (59.9%) | 1,057 (40.1%) |
| 4+ Person Household | 1,894 (78.4%) | 523 (21.6%) |
| Total Housing Units | 9,944 (72.2%) | 3,831 (27.8%) |
Occupancy by Educational Attainment in San Lorenzo Municipio
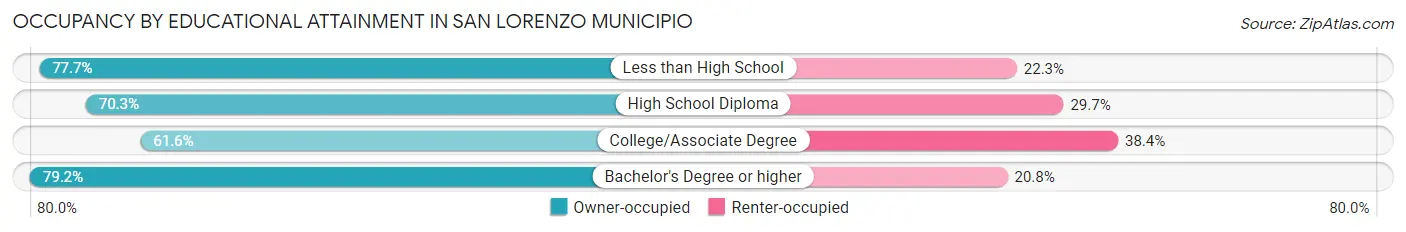
| Household Size | Owner-occupied | Renter-occupied |
| Less than High School | 3,418 (77.7%) | 982 (22.3%) |
| High School Diploma | 2,311 (70.3%) | 977 (29.7%) |
| College/Associate Degree | 2,122 (61.6%) | 1,321 (38.4%) |
| Bachelor's Degree or higher | 2,093 (79.2%) | 551 (20.8%) |
Occupancy by Age of Householder in San Lorenzo Municipio
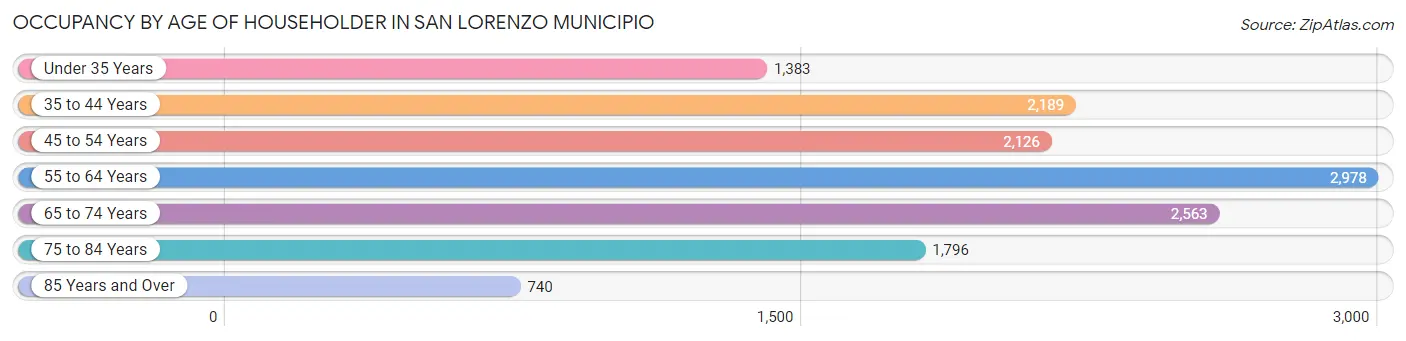
| Age Bracket | # Households | % Households |
| Under 35 Years | 1,383 | 10.0% |
| 35 to 44 Years | 2,189 | 15.9% |
| 45 to 54 Years | 2,126 | 15.4% |
| 55 to 64 Years | 2,978 | 21.6% |
| 65 to 74 Years | 2,563 | 18.6% |
| 75 to 84 Years | 1,796 | 13.0% |
| 85 Years and Over | 740 | 5.4% |
| Total | 13,775 | 100.0% |
Housing Finances in San Lorenzo Municipio
Median Income by Occupancy in San Lorenzo Municipio
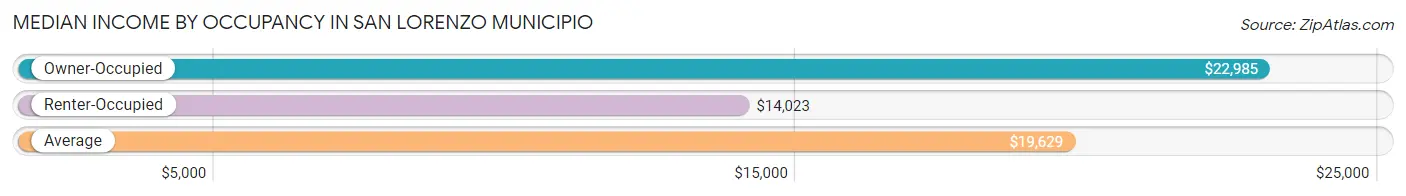
| Occupancy Type | # Households | Median Income |
| Owner-Occupied | 9,944 (72.2%) | $22,985 |
| Renter-Occupied | 3,831 (27.8%) | $14,023 |
| Average | 13,775 (100.0%) | $19,629 |
Occupancy by Householder Income Bracket in San Lorenzo Municipio
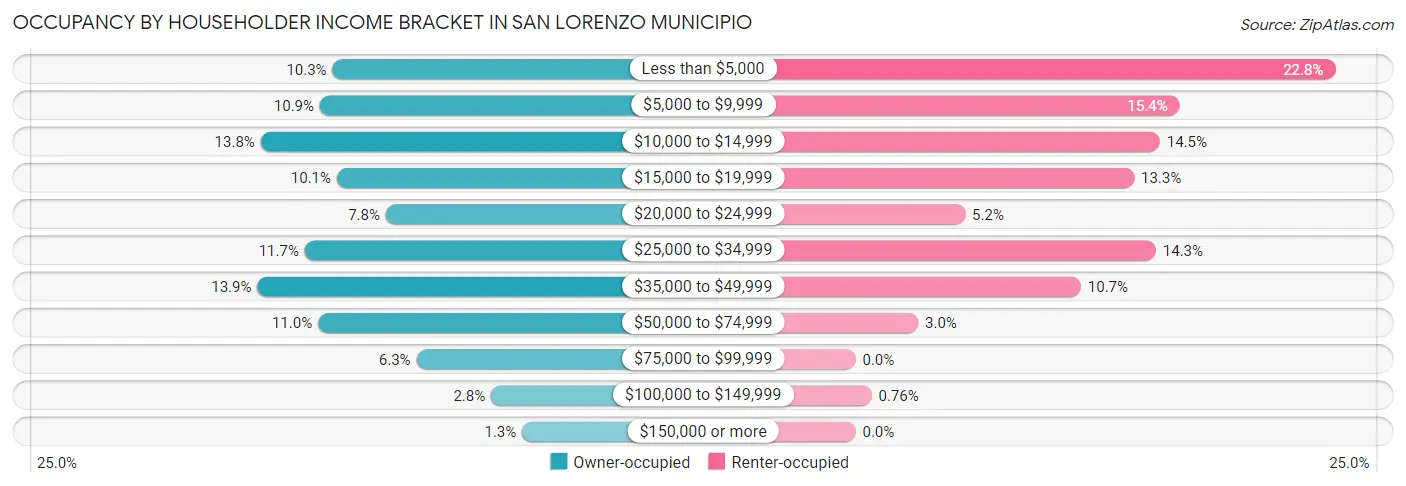
| Income Bracket | Owner-occupied | Renter-occupied |
| Less than $5,000 | 1,028 (10.3%) | 875 (22.8%) |
| $5,000 to $9,999 | 1,088 (10.9%) | 591 (15.4%) |
| $10,000 to $14,999 | 1,368 (13.8%) | 555 (14.5%) |
| $15,000 to $19,999 | 1,007 (10.1%) | 508 (13.3%) |
| $20,000 to $24,999 | 776 (7.8%) | 200 (5.2%) |
| $25,000 to $34,999 | 1,159 (11.7%) | 548 (14.3%) |
| $35,000 to $49,999 | 1,384 (13.9%) | 411 (10.7%) |
| $50,000 to $74,999 | 1,097 (11.0%) | 114 (3.0%) |
| $75,000 to $99,999 | 630 (6.3%) | 0 (0.0%) |
| $100,000 to $149,999 | 277 (2.8%) | 29 (0.8%) |
| $150,000 or more | 130 (1.3%) | 0 (0.0%) |
| Total | 9,944 (100.0%) | 3,831 (100.0%) |
Monthly Housing Cost Tiers in San Lorenzo Municipio
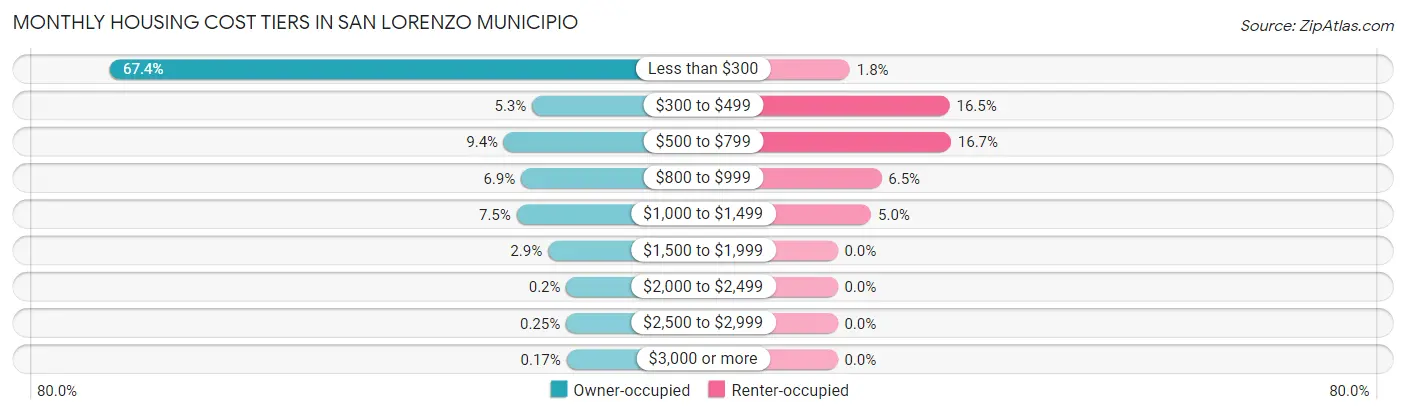
| Monthly Cost | Owner-occupied | Renter-occupied |
| Less than $300 | 6,703 (67.4%) | 70 (1.8%) |
| $300 to $499 | 522 (5.2%) | 633 (16.5%) |
| $500 to $799 | 935 (9.4%) | 640 (16.7%) |
| $800 to $999 | 684 (6.9%) | 248 (6.5%) |
| $1,000 to $1,499 | 749 (7.5%) | 190 (5.0%) |
| $1,500 to $1,999 | 289 (2.9%) | 0 (0.0%) |
| $2,000 to $2,499 | 20 (0.2%) | 0 (0.0%) |
| $2,500 to $2,999 | 25 (0.3%) | 0 (0.0%) |
| $3,000 or more | 17 (0.2%) | 0 (0.0%) |
| Total | 9,944 (100.0%) | 3,831 (100.0%) |
Physical Housing Characteristics in San Lorenzo Municipio
Housing Structures in San Lorenzo Municipio
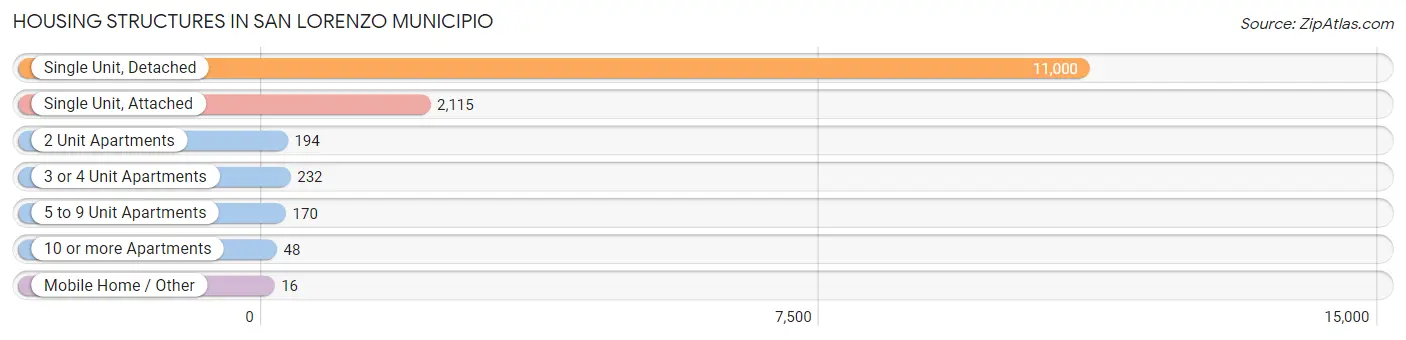
| Structure Type | # Housing Units | % Housing Units |
| Single Unit, Detached | 11,000 | 79.8% |
| Single Unit, Attached | 2,115 | 15.3% |
| 2 Unit Apartments | 194 | 1.4% |
| 3 or 4 Unit Apartments | 232 | 1.7% |
| 5 to 9 Unit Apartments | 170 | 1.2% |
| 10 or more Apartments | 48 | 0.4% |
| Mobile Home / Other | 16 | 0.1% |
| Total | 13,775 | 100.0% |
Housing Structures by Occupancy in San Lorenzo Municipio
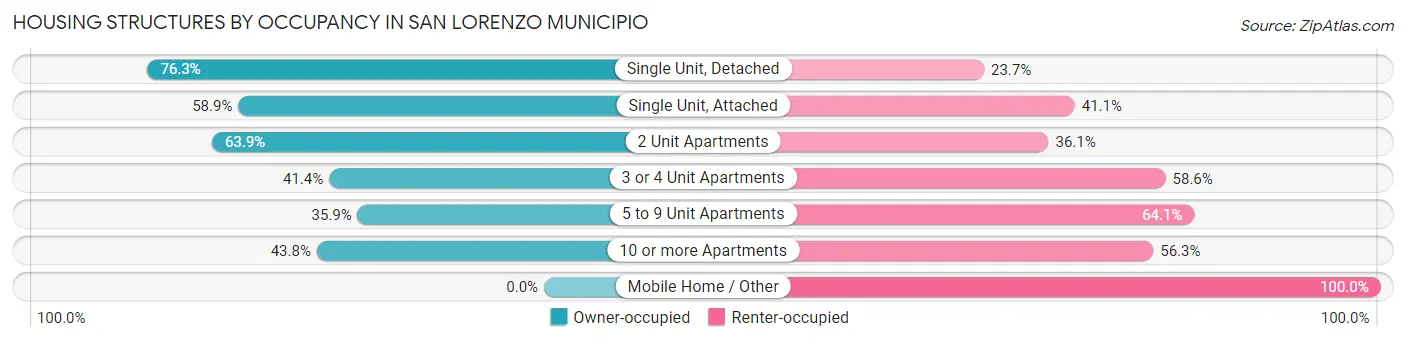
| Structure Type | Owner-occupied | Renter-occupied |
| Single Unit, Detached | 8,397 (76.3%) | 2,603 (23.7%) |
| Single Unit, Attached | 1,245 (58.9%) | 870 (41.1%) |
| 2 Unit Apartments | 124 (63.9%) | 70 (36.1%) |
| 3 or 4 Unit Apartments | 96 (41.4%) | 136 (58.6%) |
| 5 to 9 Unit Apartments | 61 (35.9%) | 109 (64.1%) |
| 10 or more Apartments | 21 (43.8%) | 27 (56.2%) |
| Mobile Home / Other | 0 (0.0%) | 16 (100.0%) |
| Total | 9,944 (72.2%) | 3,831 (27.8%) |
Housing Structures by Number of Rooms in San Lorenzo Municipio
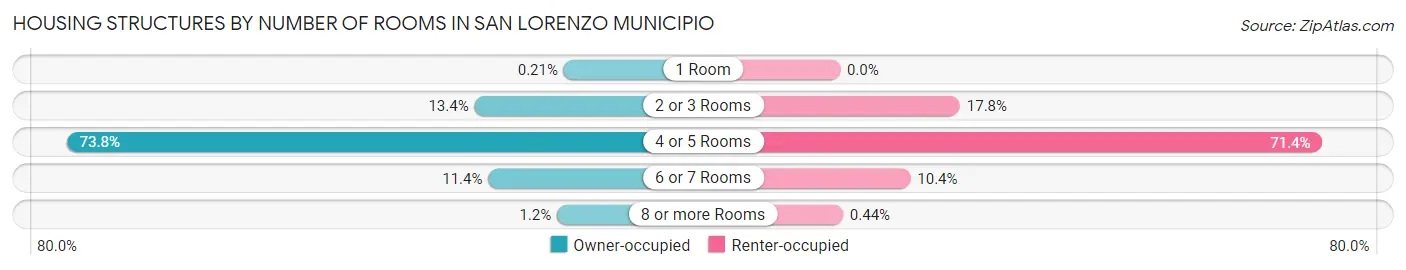
| Number of Rooms | Owner-occupied | Renter-occupied |
| 1 Room | 21 (0.2%) | 0 (0.0%) |
| 2 or 3 Rooms | 1,335 (13.4%) | 680 (17.7%) |
| 4 or 5 Rooms | 7,336 (73.8%) | 2,735 (71.4%) |
| 6 or 7 Rooms | 1,133 (11.4%) | 399 (10.4%) |
| 8 or more Rooms | 119 (1.2%) | 17 (0.4%) |
| Total | 9,944 (100.0%) | 3,831 (100.0%) |
Housing Structure by Heating Type in San Lorenzo Municipio
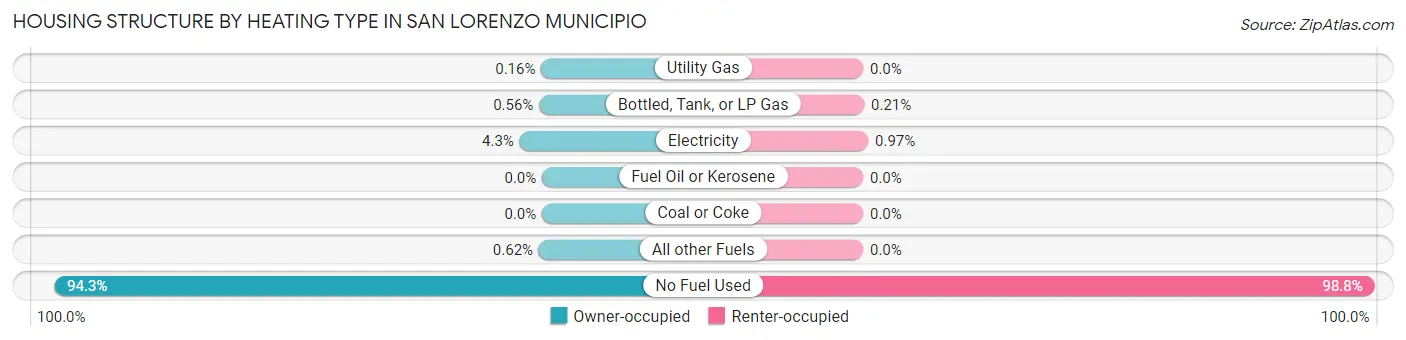
| Heating Type | Owner-occupied | Renter-occupied |
| Utility Gas | 16 (0.2%) | 0 (0.0%) |
| Bottled, Tank, or LP Gas | 56 (0.6%) | 8 (0.2%) |
| Electricity | 432 (4.3%) | 37 (1.0%) |
| Fuel Oil or Kerosene | 0 (0.0%) | 0 (0.0%) |
| Coal or Coke | 0 (0.0%) | 0 (0.0%) |
| All other Fuels | 62 (0.6%) | 0 (0.0%) |
| No Fuel Used | 9,378 (94.3%) | 3,786 (98.8%) |
| Total | 9,944 (100.0%) | 3,831 (100.0%) |
Household Vehicle Usage in San Lorenzo Municipio
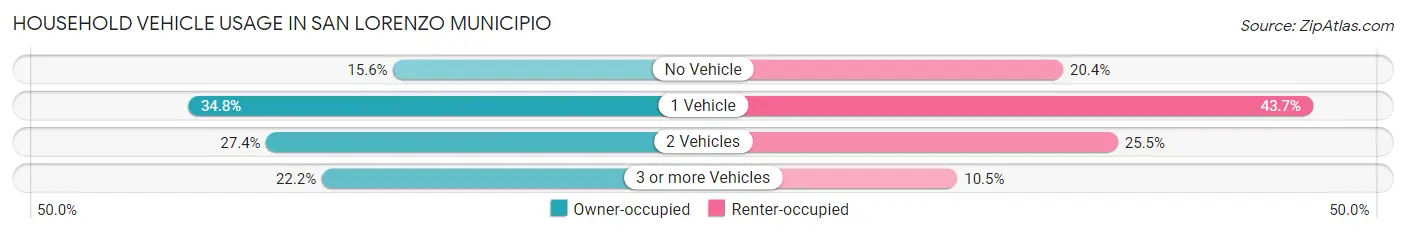
| Vehicles per Household | Owner-occupied | Renter-occupied |
| No Vehicle | 1,548 (15.6%) | 780 (20.4%) |
| 1 Vehicle | 3,456 (34.7%) | 1,673 (43.7%) |
| 2 Vehicles | 2,728 (27.4%) | 976 (25.5%) |
| 3 or more Vehicles | 2,212 (22.2%) | 402 (10.5%) |
| Total | 9,944 (100.0%) | 3,831 (100.0%) |
Real Estate & Mortgages in San Lorenzo Municipio
Real Estate and Mortgage Overview in San Lorenzo Municipio
| Characteristic | Without Mortgage | With Mortgage |
| Housing Units | 7,272 | 2,672 |
| Median Property Value | $98,400 | $146,800 |
| Median Household Income | $17,630 | $87 |
| Monthly Housing Costs | $141 | $17 |
| Real Estate Taxes | $199 | $2,460 |
Property Value by Mortgage Status in San Lorenzo Municipio
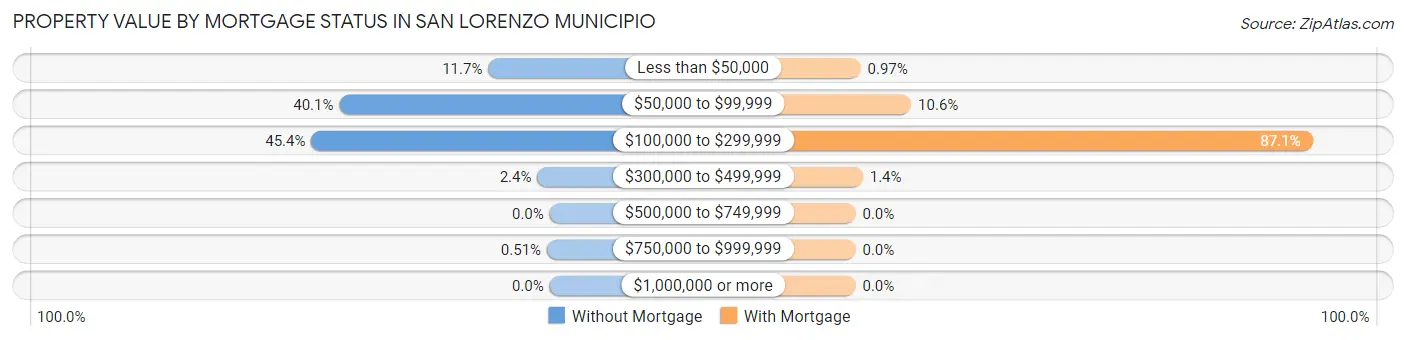
| Property Value | Without Mortgage | With Mortgage |
| Less than $50,000 | 850 (11.7%) | 26 (1.0%) |
| $50,000 to $99,999 | 2,913 (40.1%) | 283 (10.6%) |
| $100,000 to $299,999 | 3,301 (45.4%) | 2,326 (87.1%) |
| $300,000 to $499,999 | 171 (2.4%) | 37 (1.4%) |
| $500,000 to $749,999 | 0 (0.0%) | 0 (0.0%) |
| $750,000 to $999,999 | 37 (0.5%) | 0 (0.0%) |
| $1,000,000 or more | 0 (0.0%) | 0 (0.0%) |
| Total | 7,272 (100.0%) | 2,672 (100.0%) |
Household Income by Mortgage Status in San Lorenzo Municipio
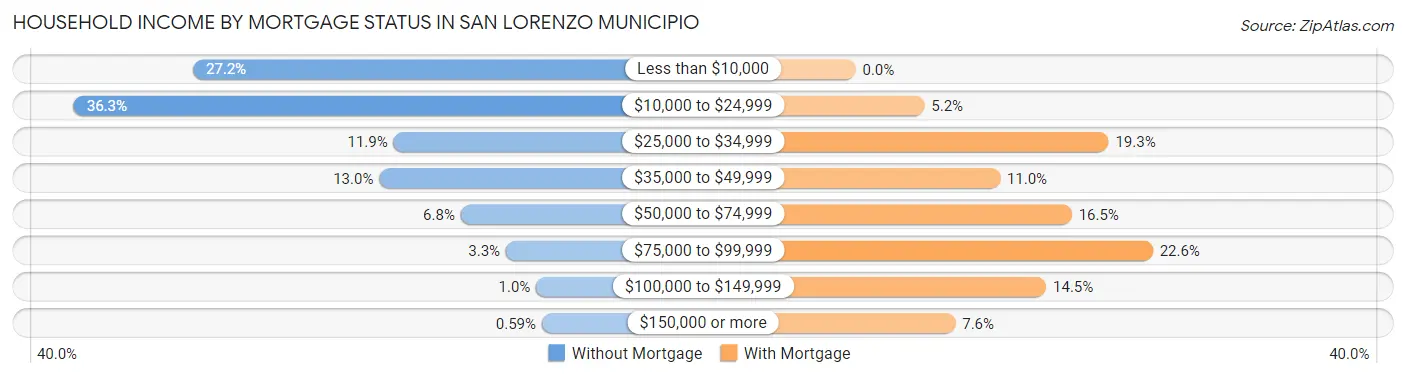
| Household Income | Without Mortgage | With Mortgage |
| Less than $10,000 | 1,976 (27.2%) | 0 (0.0%) |
| $10,000 to $24,999 | 2,636 (36.2%) | 140 (5.2%) |
| $25,000 to $34,999 | 865 (11.9%) | 515 (19.3%) |
| $35,000 to $49,999 | 944 (13.0%) | 294 (11.0%) |
| $50,000 to $74,999 | 492 (6.8%) | 440 (16.5%) |
| $75,000 to $99,999 | 242 (3.3%) | 605 (22.6%) |
| $100,000 to $149,999 | 74 (1.0%) | 388 (14.5%) |
| $150,000 or more | 43 (0.6%) | 203 (7.6%) |
| Total | 7,272 (100.0%) | 2,672 (100.0%) |
Property Value to Household Income Ratio in San Lorenzo Municipio
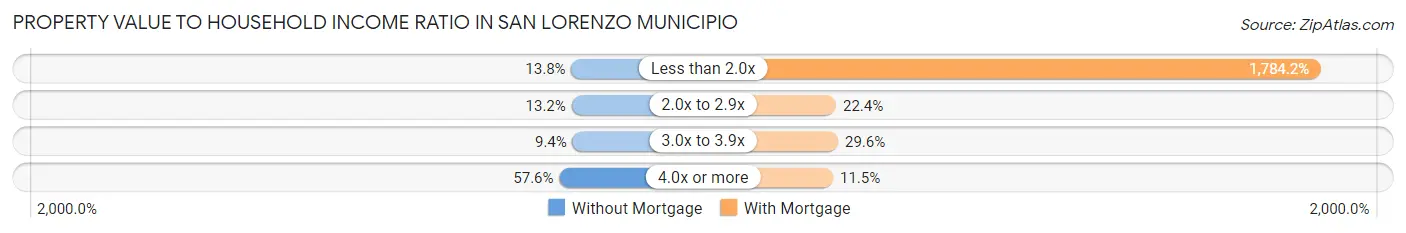
| Value-to-Income Ratio | Without Mortgage | With Mortgage |
| Less than 2.0x | 1,002 (13.8%) | 47,675 (1,784.2%) |
| 2.0x to 2.9x | 958 (13.2%) | 598 (22.4%) |
| 3.0x to 3.9x | 684 (9.4%) | 792 (29.6%) |
| 4.0x or more | 4,189 (57.6%) | 307 (11.5%) |
| Total | 7,272 (100.0%) | 2,672 (100.0%) |
Real Estate Taxes by Mortgage Status in San Lorenzo Municipio
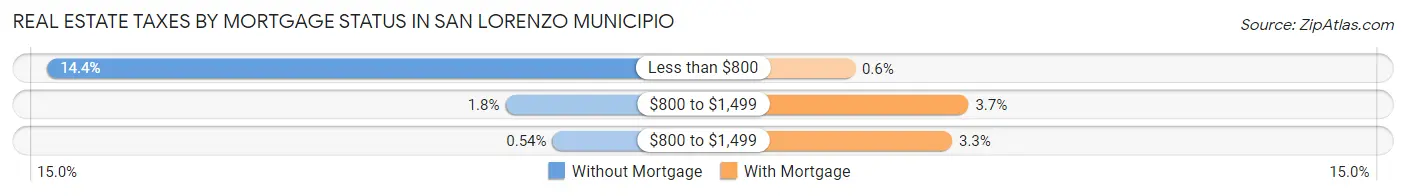
| Property Taxes | Without Mortgage | With Mortgage |
| Less than $800 | 1,046 (14.4%) | 16 (0.6%) |
| $800 to $1,499 | 133 (1.8%) | 99 (3.7%) |
| $800 to $1,499 | 39 (0.5%) | 87 (3.3%) |
| Total | 7,272 (100.0%) | 2,672 (100.0%) |
Health & Disability in San Lorenzo Municipio
Health Insurance Coverage by Age in San Lorenzo Municipio
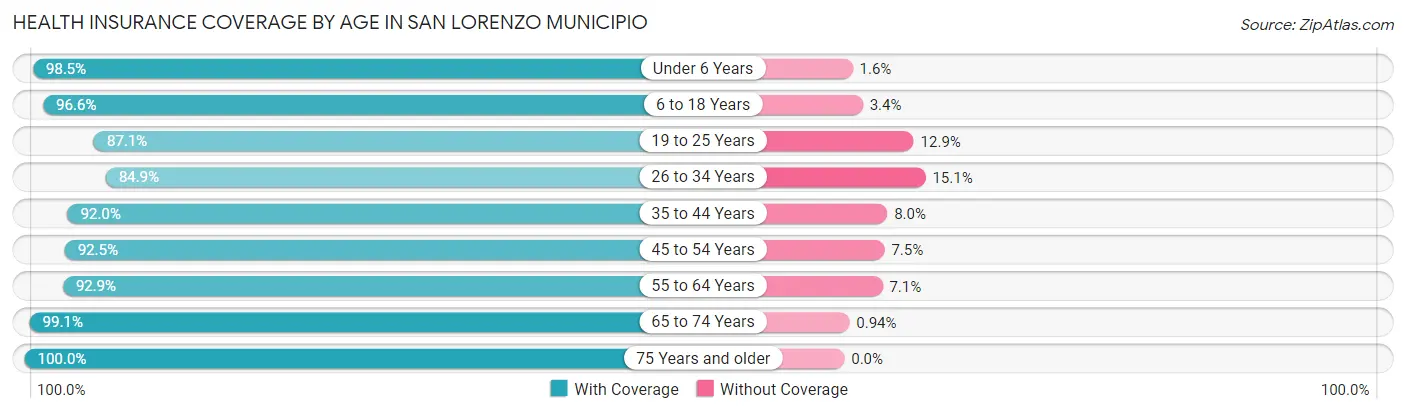
| Age Bracket | With Coverage | Without Coverage |
| Under 6 Years | 1,523 (98.5%) | 24 (1.5%) |
| 6 to 18 Years | 5,243 (96.6%) | 187 (3.4%) |
| 19 to 25 Years | 2,917 (87.1%) | 433 (12.9%) |
| 26 to 34 Years | 3,594 (84.9%) | 641 (15.1%) |
| 35 to 44 Years | 4,291 (92.0%) | 373 (8.0%) |
| 45 to 54 Years | 4,631 (92.5%) | 375 (7.5%) |
| 55 to 64 Years | 5,112 (92.9%) | 391 (7.1%) |
| 65 to 74 Years | 4,211 (99.1%) | 40 (0.9%) |
| 75 Years and older | 3,472 (100.0%) | 0 (0.0%) |
| Total | 34,994 (93.4%) | 2,464 (6.6%) |
Health Insurance Coverage by Citizenship Status in San Lorenzo Municipio
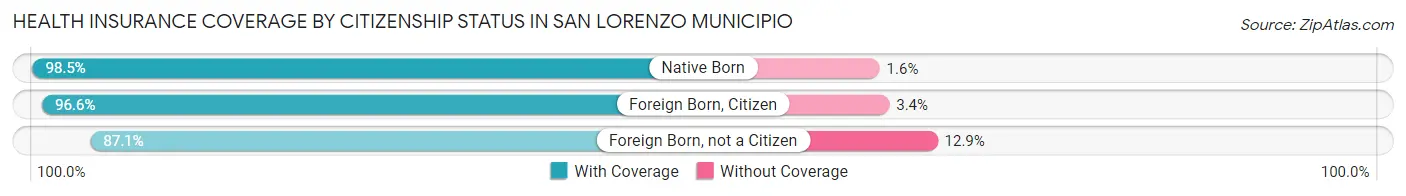
| Citizenship Status | With Coverage | Without Coverage |
| Native Born | 1,523 (98.5%) | 24 (1.5%) |
| Foreign Born, Citizen | 5,243 (96.6%) | 187 (3.4%) |
| Foreign Born, not a Citizen | 2,917 (87.1%) | 433 (12.9%) |
Health Insurance Coverage by Household Income in San Lorenzo Municipio
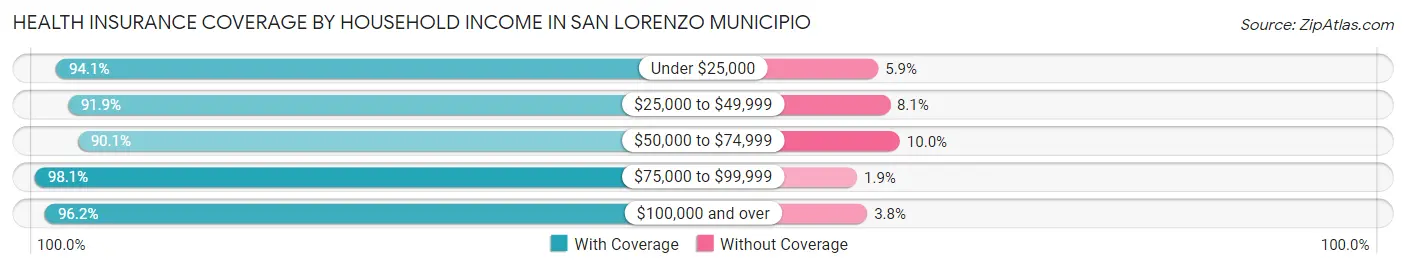
| Household Income | With Coverage | Without Coverage |
| Under $25,000 | 16,459 (94.1%) | 1,032 (5.9%) |
| $25,000 to $49,999 | 9,548 (91.9%) | 839 (8.1%) |
| $50,000 to $74,999 | 4,143 (90.0%) | 458 (10.0%) |
| $75,000 to $99,999 | 2,791 (98.1%) | 55 (1.9%) |
| $100,000 and over | 2,008 (96.2%) | 80 (3.8%) |
Public vs Private Health Insurance Coverage by Age in San Lorenzo Municipio
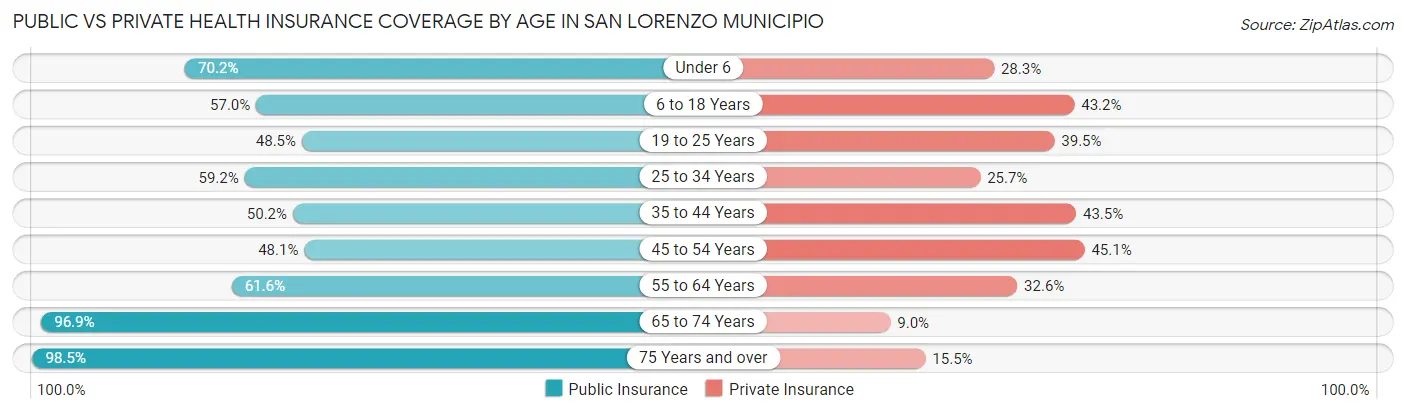
| Age Bracket | Public Insurance | Private Insurance |
| Under 6 | 1,086 (70.2%) | 437 (28.2%) |
| 6 to 18 Years | 3,097 (57.0%) | 2,343 (43.1%) |
| 19 to 25 Years | 1,626 (48.5%) | 1,322 (39.5%) |
| 25 to 34 Years | 2,506 (59.2%) | 1,088 (25.7%) |
| 35 to 44 Years | 2,342 (50.2%) | 2,028 (43.5%) |
| 45 to 54 Years | 2,408 (48.1%) | 2,255 (45.1%) |
| 55 to 64 Years | 3,387 (61.6%) | 1,791 (32.6%) |
| 65 to 74 Years | 4,119 (96.9%) | 383 (9.0%) |
| 75 Years and over | 3,421 (98.5%) | 539 (15.5%) |
| Total | 23,992 (64.0%) | 12,186 (32.5%) |
Disability Status by Sex by Age in San Lorenzo Municipio
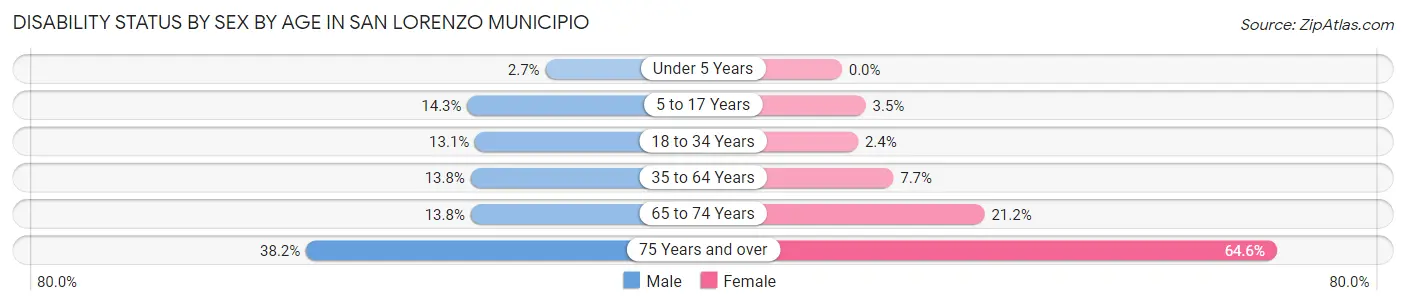
| Age Bracket | Male | Female |
| Under 5 Years | 17 (2.7%) | 0 (0.0%) |
| 5 to 17 Years | 372 (14.2%) | 89 (3.5%) |
| 18 to 34 Years | 530 (13.1%) | 99 (2.4%) |
| 35 to 64 Years | 1,001 (13.8%) | 604 (7.6%) |
| 65 to 74 Years | 275 (13.8%) | 477 (21.2%) |
| 75 Years and over | 620 (38.2%) | 1,194 (64.6%) |
Disability Class by Sex by Age in San Lorenzo Municipio
Disability Class: Hearing Difficulty
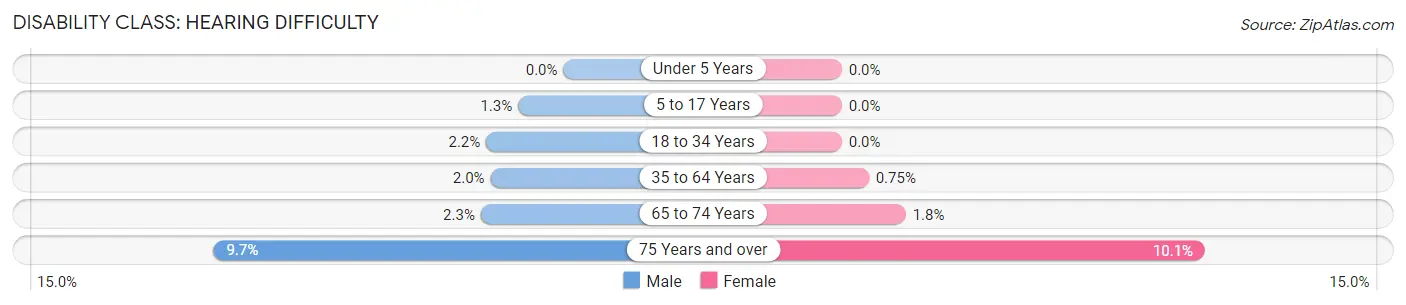
| Age Bracket | Male | Female |
| Under 5 Years | 0 (0.0%) | 0 (0.0%) |
| 5 to 17 Years | 33 (1.3%) | 0 (0.0%) |
| 18 to 34 Years | 87 (2.1%) | 0 (0.0%) |
| 35 to 64 Years | 148 (2.0%) | 59 (0.7%) |
| 65 to 74 Years | 46 (2.3%) | 40 (1.8%) |
| 75 Years and over | 158 (9.7%) | 187 (10.1%) |
Disability Class: Vision Difficulty
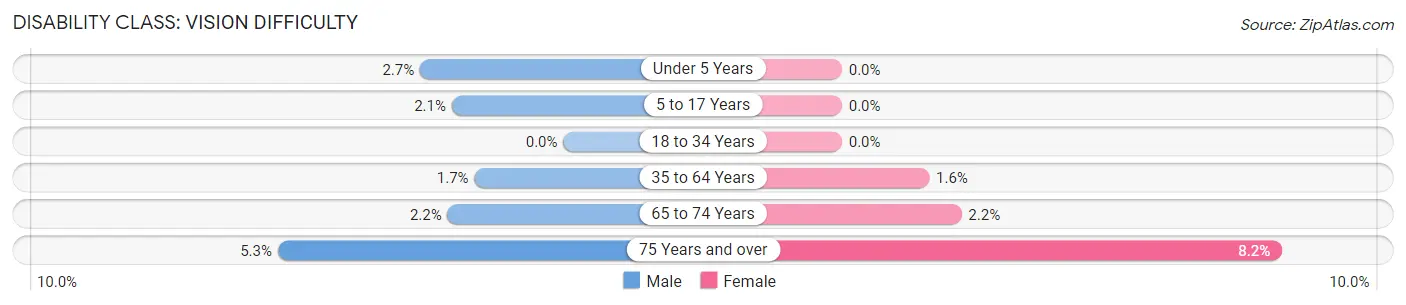
| Age Bracket | Male | Female |
| Under 5 Years | 17 (2.7%) | 0 (0.0%) |
| 5 to 17 Years | 54 (2.1%) | 0 (0.0%) |
| 18 to 34 Years | 0 (0.0%) | 0 (0.0%) |
| 35 to 64 Years | 120 (1.7%) | 128 (1.6%) |
| 65 to 74 Years | 43 (2.1%) | 50 (2.2%) |
| 75 Years and over | 86 (5.3%) | 151 (8.2%) |
Disability Class: Cognitive Difficulty
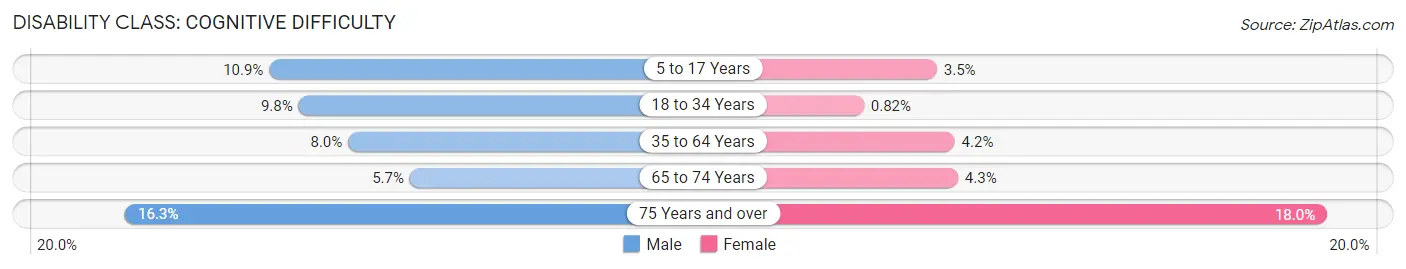
| Age Bracket | Male | Female |
| 5 to 17 Years | 285 (10.9%) | 89 (3.5%) |
| 18 to 34 Years | 398 (9.8%) | 34 (0.8%) |
| 35 to 64 Years | 581 (8.0%) | 331 (4.2%) |
| 65 to 74 Years | 114 (5.7%) | 97 (4.3%) |
| 75 Years and over | 264 (16.3%) | 333 (18.0%) |
Disability Class: Ambulatory Difficulty
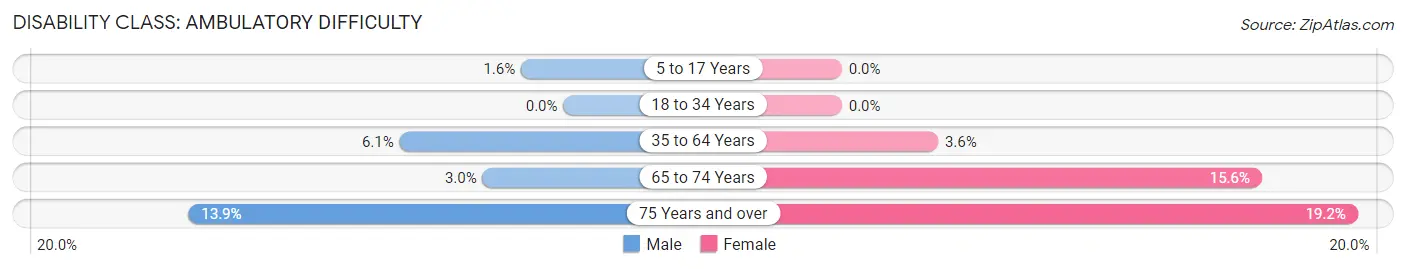
| Age Bracket | Male | Female |
| 5 to 17 Years | 41 (1.6%) | 0 (0.0%) |
| 18 to 34 Years | 0 (0.0%) | 0 (0.0%) |
| 35 to 64 Years | 442 (6.1%) | 282 (3.6%) |
| 65 to 74 Years | 60 (3.0%) | 351 (15.6%) |
| 75 Years and over | 226 (13.9%) | 354 (19.2%) |
Disability Class: Self-Care Difficulty
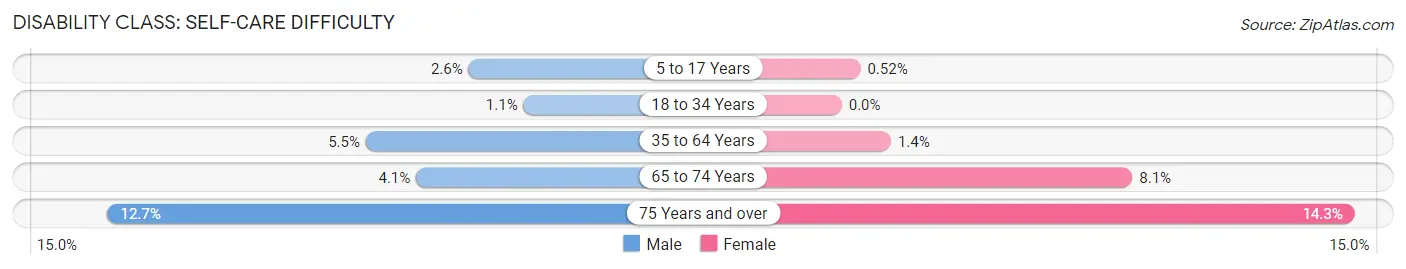
| Age Bracket | Male | Female |
| 5 to 17 Years | 69 (2.6%) | 13 (0.5%) |
| 18 to 34 Years | 45 (1.1%) | 0 (0.0%) |
| 35 to 64 Years | 400 (5.5%) | 108 (1.4%) |
| 65 to 74 Years | 82 (4.1%) | 182 (8.1%) |
| 75 Years and over | 206 (12.7%) | 264 (14.3%) |
Technology Access in San Lorenzo Municipio
Computing Device Access in San Lorenzo Municipio
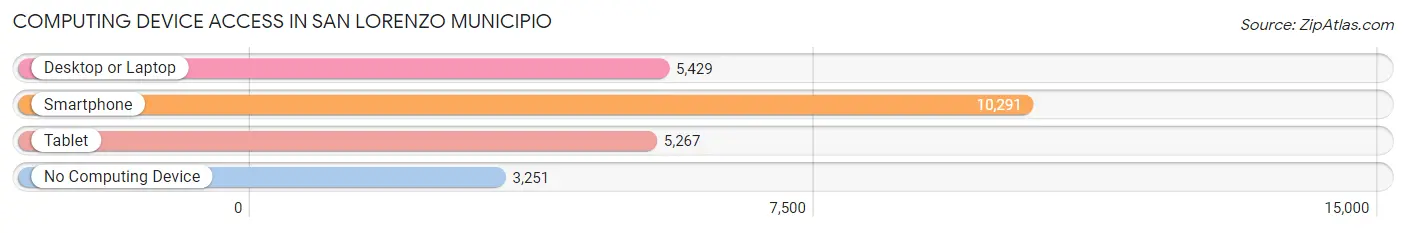
| Device Type | # Households | % Households |
| Desktop or Laptop | 5,429 | 39.4% |
| Smartphone | 10,291 | 74.7% |
| Tablet | 5,267 | 38.2% |
| No Computing Device | 3,251 | 23.6% |
| Total | 13,775 | 100.0% |
Internet Access in San Lorenzo Municipio
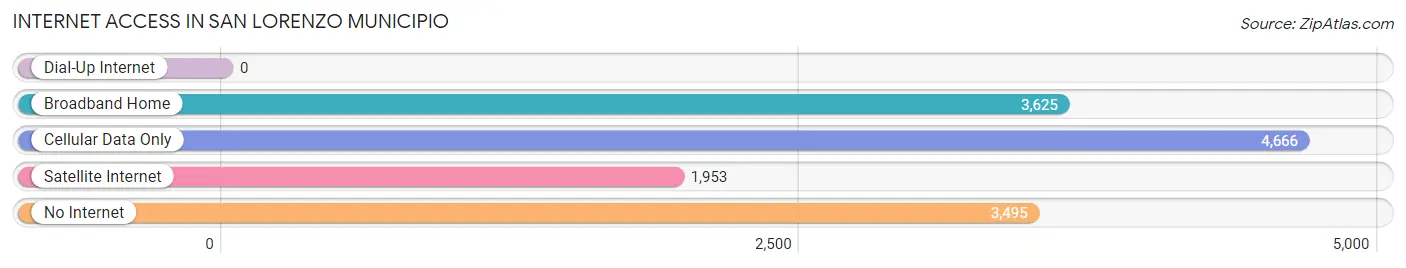
| Internet Type | # Households | % Households |
| Dial-Up Internet | 0 | 0.0% |
| Broadband Home | 3,625 | 26.3% |
| Cellular Data Only | 4,666 | 33.9% |
| Satellite Internet | 1,953 | 14.2% |
| No Internet | 3,495 | 25.4% |
| Total | 13,775 | 100.0% |
San Lorenzo Municipio Summary
San Lorenzo Municipio is a municipality located in the southeastern region of Puerto Rico. It is part of the San Juan-Caguas-Guaynabo Metropolitan Statistical Area. As of the 2010 census, the municipality had a population of 33,110.
History
San Lorenzo Municipio was founded in 1737 by Don Juan de Aponte y Díaz. It was originally part of the town of Coamo, but was later separated and established as its own municipality. The town was named after San Lorenzo, the patron saint of the town.
The town was an important agricultural center in the 19th century, and was known for its production of sugar cane, coffee, and tobacco. The town was also home to several factories, including a cigar factory and a textile mill.
Geography
San Lorenzo Municipio is located in the southeastern region of Puerto Rico, about 20 miles south of San Juan. It is bordered by the municipalities of Coamo, Santa Isabel, and Salinas. The municipality covers an area of approximately 24 square miles.
The terrain of San Lorenzo Municipio is mostly flat, with some hills in the northern part of the municipality. The climate is tropical, with temperatures ranging from the mid-70s to the mid-80s.
Economy
The economy of San Lorenzo Municipio is largely based on agriculture. The main crops grown in the municipality are sugar cane, coffee, and tobacco. The town is also home to several factories, including a cigar factory and a textile mill.
In addition to agriculture and manufacturing, San Lorenzo Municipio is home to several tourist attractions, including the San Lorenzo Beach, the San Lorenzo River, and the San Lorenzo National Park.
Demographics
As of the 2010 census, the population of San Lorenzo Municipio was 33,110. The population is mostly of Puerto Rican descent, with a small percentage of African and European descent. The median age of the population is 37.
The majority of the population (90%) is Roman Catholic. The official language of the municipality is Spanish, although English is also spoken.
The median household income in San Lorenzo Municipio is $20,000, and the poverty rate is 28%. The unemployment rate is 11%.
Common Questions
What is Per Capita Income in San Lorenzo Municipio?
Per Capita income in San Lorenzo Municipio is $12,220.
What is the Median Family Income in San Lorenzo Municipio?
Median Family Income in San Lorenzo Municipio is $24,792.
What is the Median Household income in San Lorenzo Municipio?
Median Household Income in San Lorenzo Municipio is $19,629.
What is Income or Wage Gap in San Lorenzo Municipio?
Income or Wage Gap in San Lorenzo Municipio is 7.4%.
Women in San Lorenzo Municipio earn 92.6 cents for every dollar earned by a man.
What is Family Income Deficit in San Lorenzo Municipio?
Family Income Deficit in San Lorenzo Municipio is $10,428.
Families that are below poverty line in San Lorenzo Municipio earn $10,428 less on average than the poverty threshold level.
What is Inequality or Gini Index in San Lorenzo Municipio?
Inequality or Gini Index in San Lorenzo Municipio is 0.50.
What is the Total Population of San Lorenzo Municipio?
Total Population of San Lorenzo Municipio is 37,552.
What is the Total Male Population of San Lorenzo Municipio?
Total Male Population of San Lorenzo Municipio is 18,251.
What is the Total Female Population of San Lorenzo Municipio?
Total Female Population of San Lorenzo Municipio is 19,301.
What is the Ratio of Males per 100 Females in San Lorenzo Municipio?
There are 94.56 Males per 100 Females in San Lorenzo Municipio.
What is the Ratio of Females per 100 Males in San Lorenzo Municipio?
There are 105.75 Females per 100 Males in San Lorenzo Municipio.
What is the Median Population Age in San Lorenzo Municipio?
Median Population Age in San Lorenzo Municipio is 43.8 Years.
What is the Average Family Size in San Lorenzo Municipio
Average Family Size in San Lorenzo Municipio is 3.4 People.
What is the Average Household Size in San Lorenzo Municipio
Average Household Size in San Lorenzo Municipio is 2.7 People.
How Large is the Labor Force in San Lorenzo Municipio?
There are 12,818 People in the Labor Forcein in San Lorenzo Municipio.
What is the Percentage of People in the Labor Force in San Lorenzo Municipio?
39.8% of People are in the Labor Force in San Lorenzo Municipio.
What is the Unemployment Rate in San Lorenzo Municipio?
Unemployment Rate in San Lorenzo Municipio is 8.3%.