Ponce, PR Map & Demographics
Ponce Map
Ponce Overview
$14,176
PER CAPITA INCOME
$25,050
AVG FAMILY INCOME
$19,076
AVG HOUSEHOLD INCOME
1.4%
WAGE / INCOME GAP [ % ]
98.6¢/ $1
WAGE / INCOME GAP [ $ ]
$12,264
FAMILY INCOME DEFICIT
0.58
INEQUALITY / GINI INDEX
110,867
TOTAL POPULATION
51,210
MALE POPULATION
59,657
FEMALE POPULATION
85.84
MALES / 100 FEMALES
116.49
FEMALES / 100 MALES
43.6
MEDIAN AGE
3.2
AVG FAMILY SIZE
2.5
AVG HOUSEHOLD SIZE
36,012
LABOR FORCE [ PEOPLE ]
38.6%
PERCENT IN LABOR FORCE
12.7%
UNEMPLOYMENT RATE
Income in Ponce
Income Overview in Ponce
Per Capita Income in Ponce is $14,176, while median incomes of families and households are $25,050 and $19,076 respectively.
| Characteristic | Number | Measure |
| Per Capita Income | 110,867 | $14,176 |
| Median Family Income | 27,024 | $25,050 |
| Mean Family Income | 27,024 | $38,766 |
| Median Household Income | 44,332 | $19,076 |
| Mean Household Income | 44,332 | $32,940 |
| Income Deficit | 27,024 | $12,264 |
| Wage / Income Gap (%) | 110,867 | 1.36% |
| Wage / Income Gap ($) | 110,867 | 98.64¢ per $1 |
| Gini / Inequality Index | 110,867 | 0.58 |
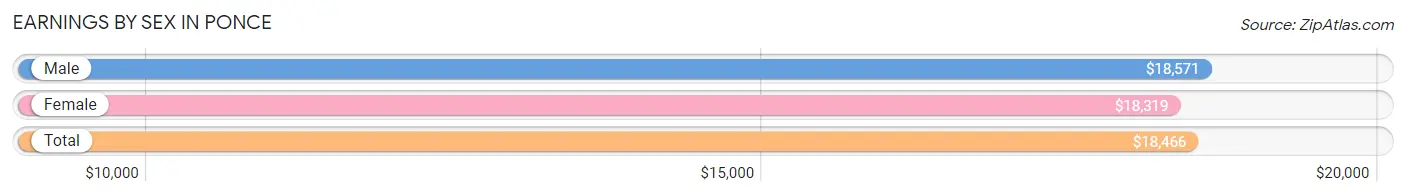
Earnings by Sex in Ponce
Average Earnings in Ponce are $18,466, $18,571 for men and $18,319 for women, a difference of 1.4%.
| Sex | Number | Average Earnings |
| Male | 17,921 (52.3%) | $18,571 |
| Female | 16,342 (47.7%) | $18,319 |
| Total | 34,263 (100.0%) | $18,466 |
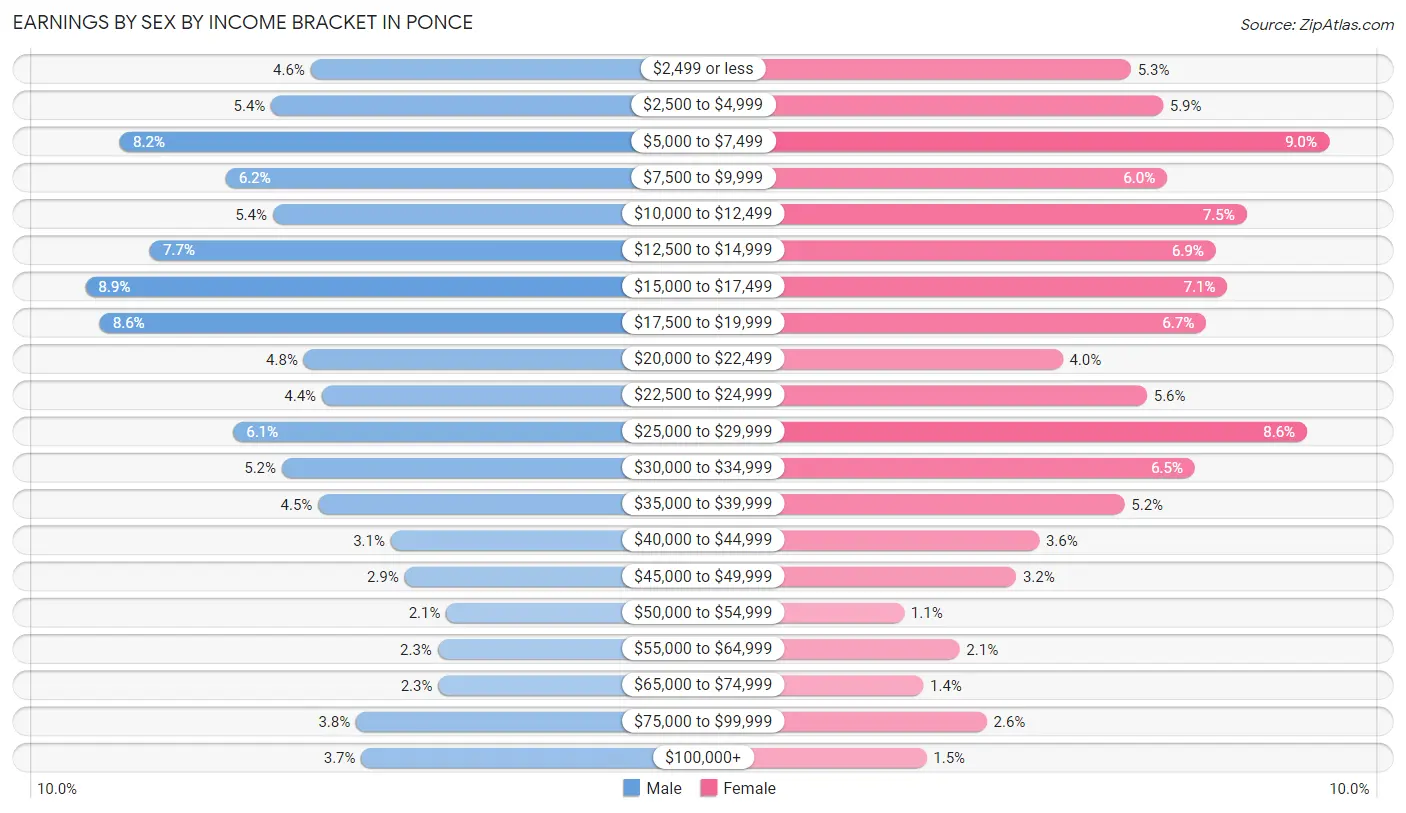
Earnings by Sex by Income Bracket in Ponce
The most common earnings brackets in Ponce are $15,000 to $17,499 for men (1,588 | 8.9%) and $5,000 to $7,499 for women (1,475 | 9.0%).
| Income | Male | Female |
| $2,499 or less | 831 (4.6%) | 870 (5.3%) |
| $2,500 to $4,999 | 964 (5.4%) | 967 (5.9%) |
| $5,000 to $7,499 | 1,472 (8.2%) | 1,475 (9.0%) |
| $7,500 to $9,999 | 1,117 (6.2%) | 980 (6.0%) |
| $10,000 to $12,499 | 958 (5.3%) | 1,224 (7.5%) |
| $12,500 to $14,999 | 1,371 (7.6%) | 1,130 (6.9%) |
| $15,000 to $17,499 | 1,588 (8.9%) | 1,165 (7.1%) |
| $17,500 to $19,999 | 1,540 (8.6%) | 1,099 (6.7%) |
| $20,000 to $22,499 | 854 (4.8%) | 660 (4.0%) |
| $22,500 to $24,999 | 794 (4.4%) | 918 (5.6%) |
| $25,000 to $29,999 | 1,091 (6.1%) | 1,409 (8.6%) |
| $30,000 to $34,999 | 928 (5.2%) | 1,065 (6.5%) |
| $35,000 to $39,999 | 806 (4.5%) | 849 (5.2%) |
| $40,000 to $44,999 | 563 (3.1%) | 588 (3.6%) |
| $45,000 to $49,999 | 517 (2.9%) | 518 (3.2%) |
| $50,000 to $54,999 | 377 (2.1%) | 175 (1.1%) |
| $55,000 to $64,999 | 405 (2.3%) | 345 (2.1%) |
| $65,000 to $74,999 | 404 (2.2%) | 233 (1.4%) |
| $75,000 to $99,999 | 679 (3.8%) | 428 (2.6%) |
| $100,000+ | 662 (3.7%) | 244 (1.5%) |
| Total | 17,921 (100.0%) | 16,342 (100.0%) |
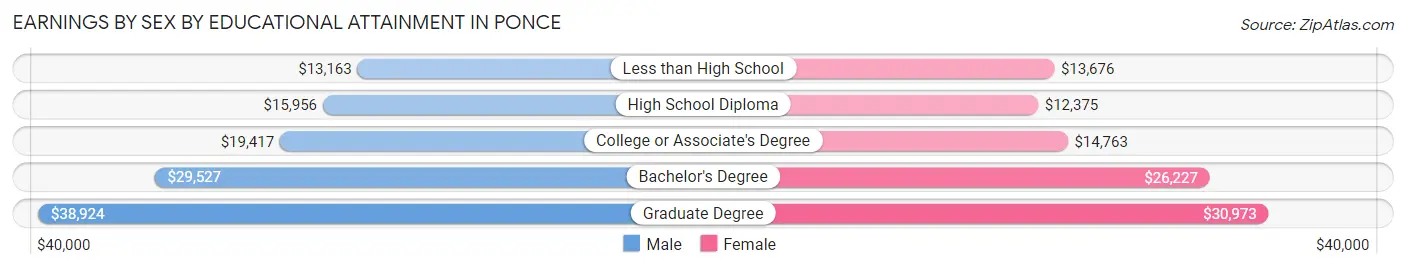
Earnings by Sex by Educational Attainment in Ponce
Average earnings in Ponce are $19,727 for men and $19,787 for women, a difference of 0.3%. Men with an educational attainment of graduate degree enjoy the highest average annual earnings of $38,924, while those with less than high school education earn the least with $13,163. Women with an educational attainment of graduate degree earn the most with the average annual earnings of $30,973, while those with high school diploma education have the smallest earnings of $12,375.
| Educational Attainment | Male Income | Female Income |
| Less than High School | $13,163 | $13,676 |
| High School Diploma | $15,956 | $12,375 |
| College or Associate's Degree | $19,417 | $14,763 |
| Bachelor's Degree | $29,527 | $26,227 |
| Graduate Degree | $38,924 | $30,973 |
| Total | $19,727 | $19,787 |
Family Income in Ponce
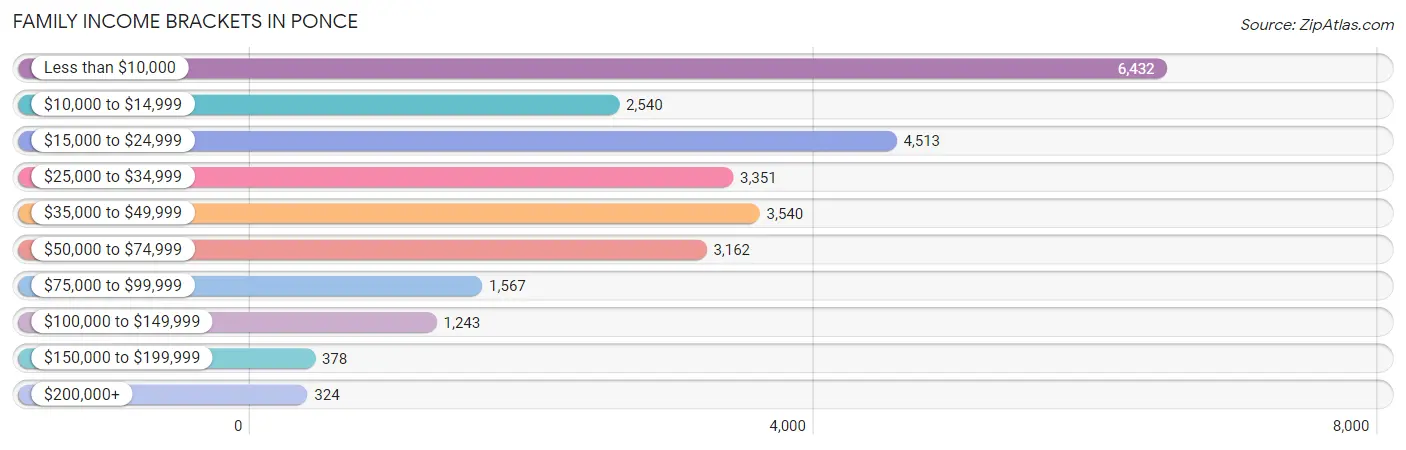
Family Income Brackets in Ponce
According to the Ponce family income data, there are 6,432 families falling into the less than $10,000 income range, which is the most common income bracket and makes up 23.8% of all families. Conversely, the $200,000+ income bracket is the least frequent group with only 324 families (1.2%) belonging to this category.
| Income Bracket | # Families | % Families |
| Less than $10,000 | 6,432 | 23.8% |
| $10,000 to $14,999 | 2,540 | 9.4% |
| $15,000 to $24,999 | 4,513 | 16.7% |
| $25,000 to $34,999 | 3,351 | 12.4% |
| $35,000 to $49,999 | 3,540 | 13.1% |
| $50,000 to $74,999 | 3,162 | 11.7% |
| $75,000 to $99,999 | 1,567 | 5.8% |
| $100,000 to $149,999 | 1,243 | 4.6% |
| $150,000 to $199,999 | 378 | 1.4% |
| $200,000+ | 324 | 1.2% |
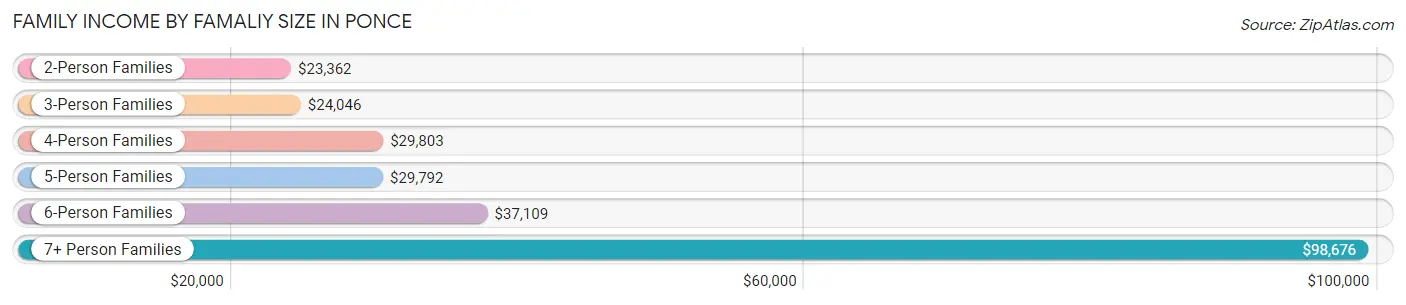
Family Income by Famaliy Size in Ponce
7+ person families (120 | 0.4%) account for the highest median family income in Ponce with $98,676 per family, while 7+ person families (120 | 0.4%) have the highest median income of $14,097 per family member.
| Income Bracket | # Families | Median Income |
| 2-Person Families | 12,585 (46.6%) | $23,362 |
| 3-Person Families | 8,516 (31.5%) | $24,046 |
| 4-Person Families | 4,062 (15.0%) | $29,803 |
| 5-Person Families | 1,314 (4.9%) | $29,792 |
| 6-Person Families | 427 (1.6%) | $37,109 |
| 7+ Person Families | 120 (0.4%) | $98,676 |
| Total | 27,024 (100.0%) | $25,050 |
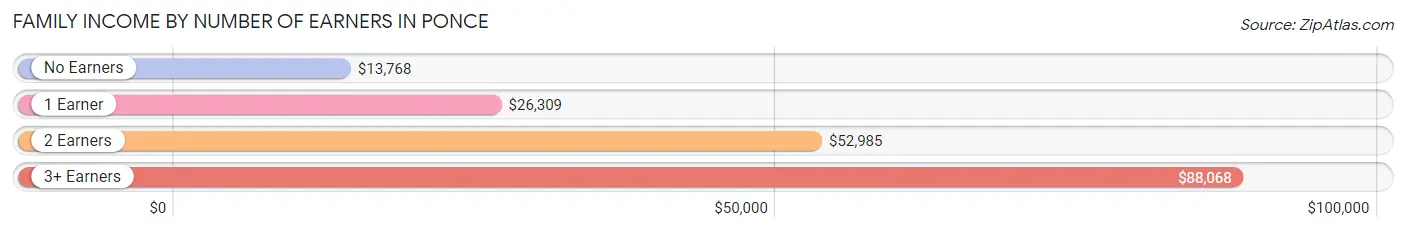
Family Income by Number of Earners in Ponce
The median family income in Ponce is $25,050, with families comprising 3+ earners (967) having the highest median family income of $88,068, while families with no earners (11,035) have the lowest median family income of $13,768, accounting for 3.6% and 40.8% of families, respectively.
| Number of Earners | # Families | Median Income |
| No Earners | 11,035 (40.8%) | $13,768 |
| 1 Earner | 10,273 (38.0%) | $26,309 |
| 2 Earners | 4,749 (17.6%) | $52,985 |
| 3+ Earners | 967 (3.6%) | $88,068 |
| Total | 27,024 (100.0%) | $25,050 |
Household Income in Ponce
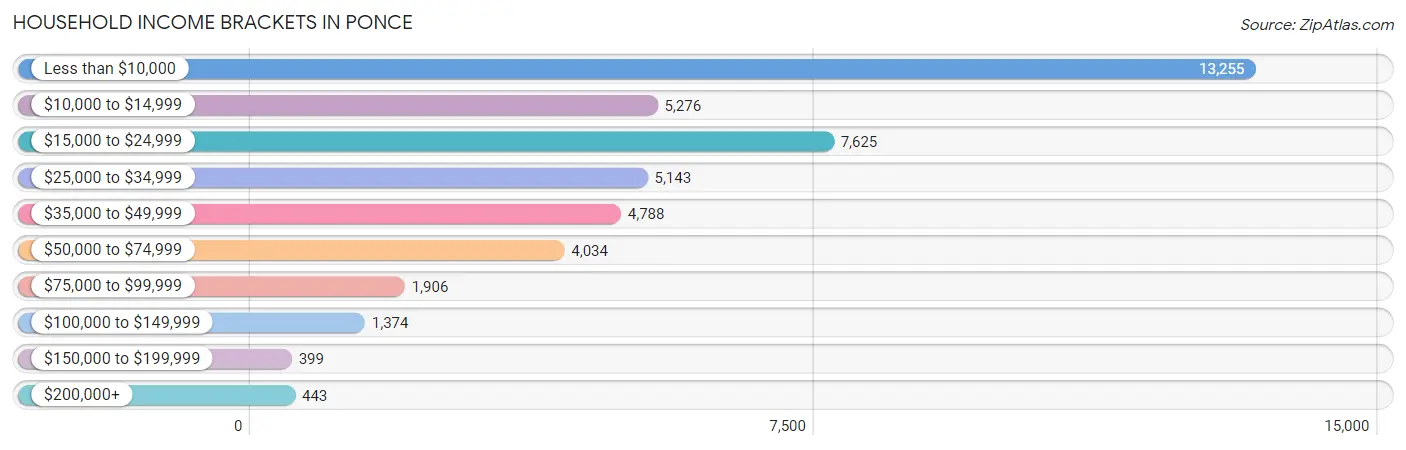
Household Income Brackets in Ponce
With 13,255 households falling in the category, the less than $10,000 income range is the most frequent in Ponce, accounting for 29.9% of all households. In contrast, only 399 households (0.9%) fall into the $150,000 to $199,999 income bracket, making it the least populous group.
| Income Bracket | # Households | % Households |
| Less than $10,000 | 13,255 | 29.9% |
| $10,000 to $14,999 | 5,276 | 11.9% |
| $15,000 to $24,999 | 7,625 | 17.2% |
| $25,000 to $34,999 | 5,143 | 11.6% |
| $35,000 to $49,999 | 4,788 | 10.8% |
| $50,000 to $74,999 | 4,034 | 9.1% |
| $75,000 to $99,999 | 1,906 | 4.3% |
| $100,000 to $149,999 | 1,374 | 3.1% |
| $150,000 to $199,999 | 399 | 0.9% |
| $200,000+ | 443 | 1.0% |
Household Income by Householder Age in Ponce
The median household income in Ponce is $19,076, with the highest median household income of $24,227 found in the 45 to 64 years age bracket for the primary householder. A total of 14,902 households (33.6%) fall into this category. Meanwhile, the 15 to 24 years age bracket for the primary householder has the lowest median household income of $6,156, with 936 households (2.1%) in this group.
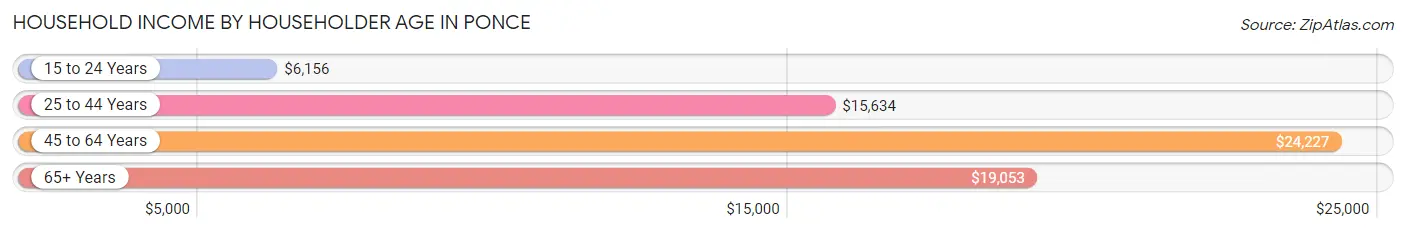
| Income Bracket | # Households | Median Income |
| 15 to 24 Years | 936 (2.1%) | $6,156 |
| 25 to 44 Years | 10,707 (24.1%) | $15,634 |
| 45 to 64 Years | 14,902 (33.6%) | $24,227 |
| 65+ Years | 17,787 (40.1%) | $19,053 |
| Total | 44,332 (100.0%) | $19,076 |
Poverty in Ponce
Income Below Poverty by Sex and Age in Ponce
With 47.6% poverty level for males and 51.9% for females among the residents of Ponce, 5 year old males and under 5 year old females are the most vulnerable to poverty, with 418 males (71.7%) and 1,571 females (74.8%) in their respective age groups living below the poverty level.
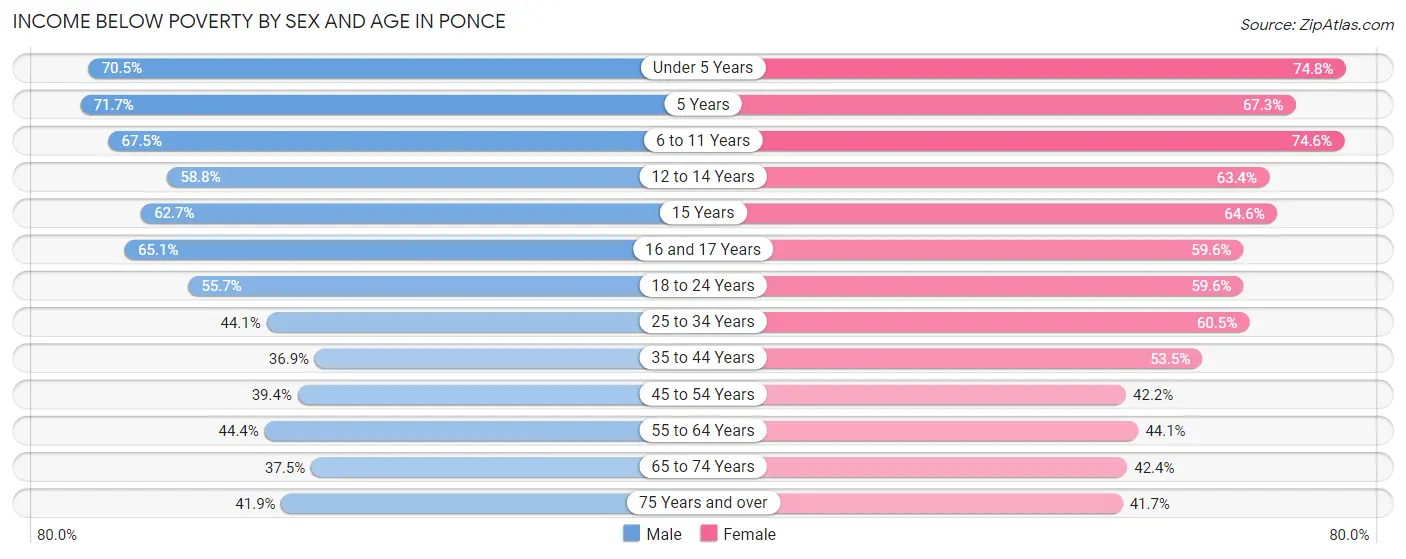
| Age Bracket | Male | Female |
| Under 5 Years | 1,520 (70.5%) | 1,571 (74.8%) |
| 5 Years | 418 (71.7%) | 434 (67.3%) |
| 6 to 11 Years | 2,517 (67.5%) | 2,443 (74.6%) |
| 12 to 14 Years | 1,046 (58.8%) | 1,251 (63.4%) |
| 15 Years | 398 (62.7%) | 408 (64.6%) |
| 16 and 17 Years | 878 (65.1%) | 777 (59.6%) |
| 18 to 24 Years | 3,153 (55.7%) | 3,130 (59.6%) |
| 25 to 34 Years | 3,067 (44.1%) | 4,190 (60.5%) |
| 35 to 44 Years | 1,969 (36.9%) | 3,465 (53.5%) |
| 45 to 54 Years | 2,272 (39.4%) | 2,759 (42.2%) |
| 55 to 64 Years | 2,598 (44.4%) | 3,648 (44.1%) |
| 65 to 74 Years | 2,230 (37.5%) | 3,413 (42.4%) |
| 75 Years and over | 2,148 (41.9%) | 3,252 (41.7%) |
| Total | 24,214 (47.6%) | 30,741 (51.9%) |
Income Above Poverty by Sex and Age in Ponce
According to the poverty statistics in Ponce, males aged 35 to 44 years and females aged 75 years and over are the age groups that are most secure financially, with 63.1% of males and 58.3% of females in these age groups living above the poverty line.
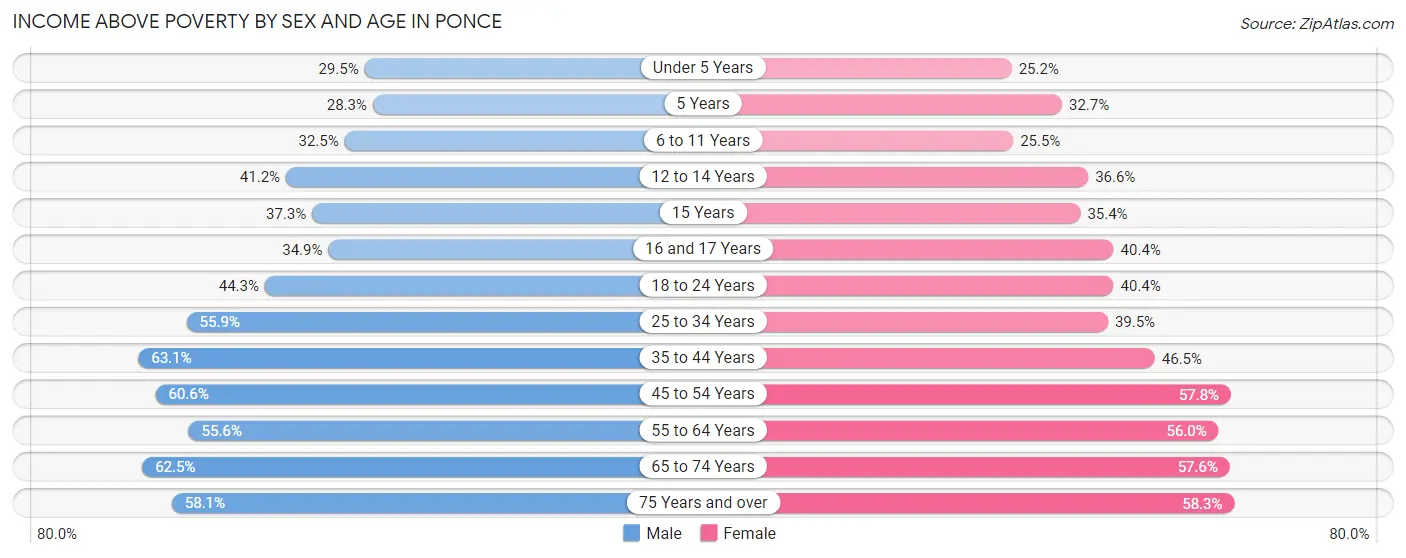
| Age Bracket | Male | Female |
| Under 5 Years | 637 (29.5%) | 530 (25.2%) |
| 5 Years | 165 (28.3%) | 211 (32.7%) |
| 6 to 11 Years | 1,211 (32.5%) | 834 (25.5%) |
| 12 to 14 Years | 733 (41.2%) | 722 (36.6%) |
| 15 Years | 237 (37.3%) | 224 (35.4%) |
| 16 and 17 Years | 471 (34.9%) | 526 (40.4%) |
| 18 to 24 Years | 2,511 (44.3%) | 2,118 (40.4%) |
| 25 to 34 Years | 3,892 (55.9%) | 2,738 (39.5%) |
| 35 to 44 Years | 3,369 (63.1%) | 3,011 (46.5%) |
| 45 to 54 Years | 3,489 (60.6%) | 3,776 (57.8%) |
| 55 to 64 Years | 3,258 (55.6%) | 4,634 (55.9%) |
| 65 to 74 Years | 3,721 (62.5%) | 4,637 (57.6%) |
| 75 Years and over | 2,982 (58.1%) | 4,544 (58.3%) |
| Total | 26,676 (52.4%) | 28,505 (48.1%) |
Income Below Poverty Among Married-Couple Families in Ponce
The poverty statistics for married-couple families in Ponce show that 30.4% or 4,153 of the total 13,674 families live below the poverty line. Families with 3 or 4 children have the highest poverty rate of 43.4%, comprising of 234 families. On the other hand, families with no children have the lowest poverty rate of 29.2%, which includes 2,943 families.
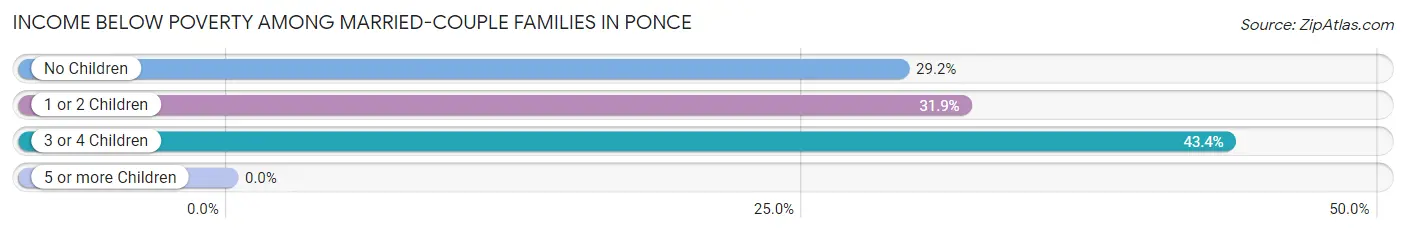
| Children | Above Poverty | Below Poverty |
| No Children | 7,134 (70.8%) | 2,943 (29.2%) |
| 1 or 2 Children | 2,082 (68.1%) | 976 (31.9%) |
| 3 or 4 Children | 305 (56.6%) | 234 (43.4%) |
| 5 or more Children | 0 (0.0%) | 0 (0.0%) |
| Total | 9,521 (69.6%) | 4,153 (30.4%) |
Income Below Poverty Among Single-Parent Households in Ponce
According to the poverty data in Ponce, 57.0% or 1,478 single-father households and 64.8% or 6,968 single-mother households are living below the poverty line. Among single-father households, those with 1 or 2 children have the highest poverty rate, with 831 households (74.1%) experiencing poverty. Likewise, among single-mother households, those with 5 or more children have the highest poverty rate, with 39 households (100.0%) falling below the poverty line.
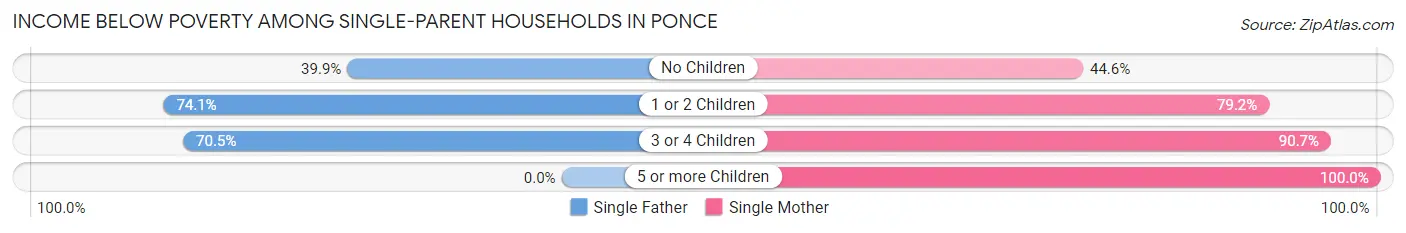
| Children | Single Father | Single Mother |
| No Children | 511 (39.9%) | 2,138 (44.6%) |
| 1 or 2 Children | 831 (74.1%) | 4,007 (79.2%) |
| 3 or 4 Children | 136 (70.5%) | 784 (90.7%) |
| 5 or more Children | 0 (0.0%) | 39 (100.0%) |
| Total | 1,478 (57.0%) | 6,968 (64.8%) |
Income Below Poverty Among Married-Couple vs Single-Parent Households in Ponce
The poverty data for Ponce shows that 4,153 of the married-couple family households (30.4%) and 8,446 of the single-parent households (63.3%) are living below the poverty level. Within the married-couple family households, those with 3 or 4 children have the highest poverty rate, with 234 households (43.4%) falling below the poverty line. Among the single-parent households, those with 5 or more children have the highest poverty rate, with 39 household (100.0%) living below poverty.
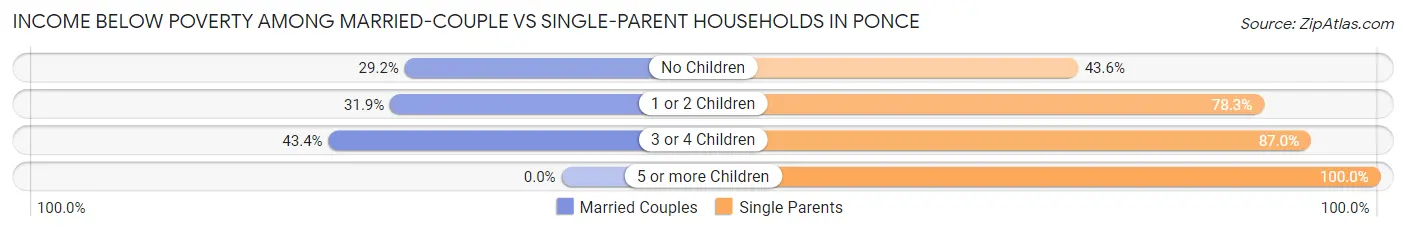
| Children | Married-Couple Families | Single-Parent Households |
| No Children | 2,943 (29.2%) | 2,649 (43.6%) |
| 1 or 2 Children | 976 (31.9%) | 4,838 (78.3%) |
| 3 or 4 Children | 234 (43.4%) | 920 (87.0%) |
| 5 or more Children | 0 (0.0%) | 39 (100.0%) |
| Total | 4,153 (30.4%) | 8,446 (63.3%) |
Race in Ponce
The most populous races in Ponce are Hispanic or Latino (110,019 | 99.2%), White / Caucasian (61,028 | 55.0%), and Two or more Races (32,945 | 29.7%).
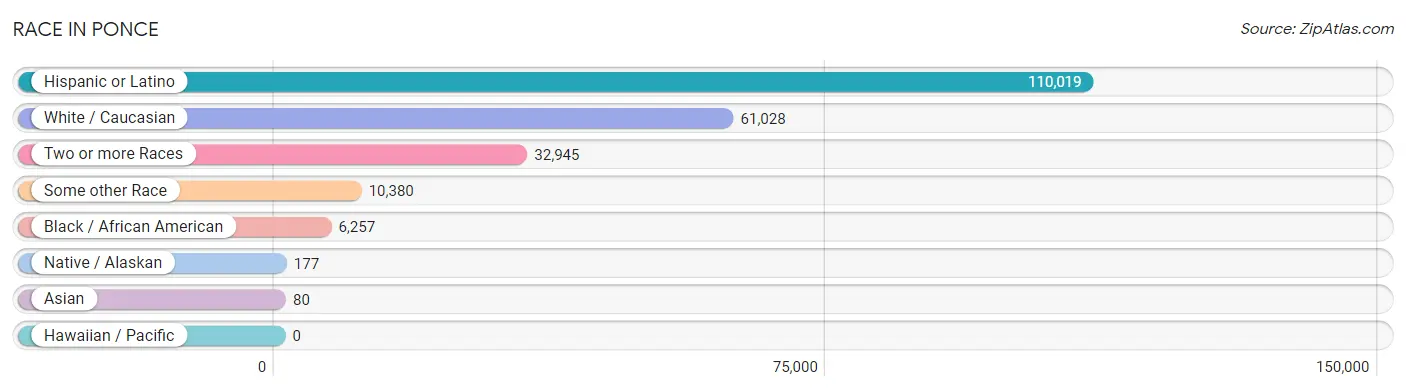
| Race | # Population | % Population |
| Asian | 80 | 0.1% |
| Black / African American | 6,257 | 5.6% |
| Hawaiian / Pacific | 0 | 0.0% |
| Hispanic or Latino | 110,019 | 99.2% |
| Native / Alaskan | 177 | 0.2% |
| White / Caucasian | 61,028 | 55.0% |
| Two or more Races | 32,945 | 29.7% |
| Some other Race | 10,380 | 9.4% |
| Total | 110,867 | 100.0% |
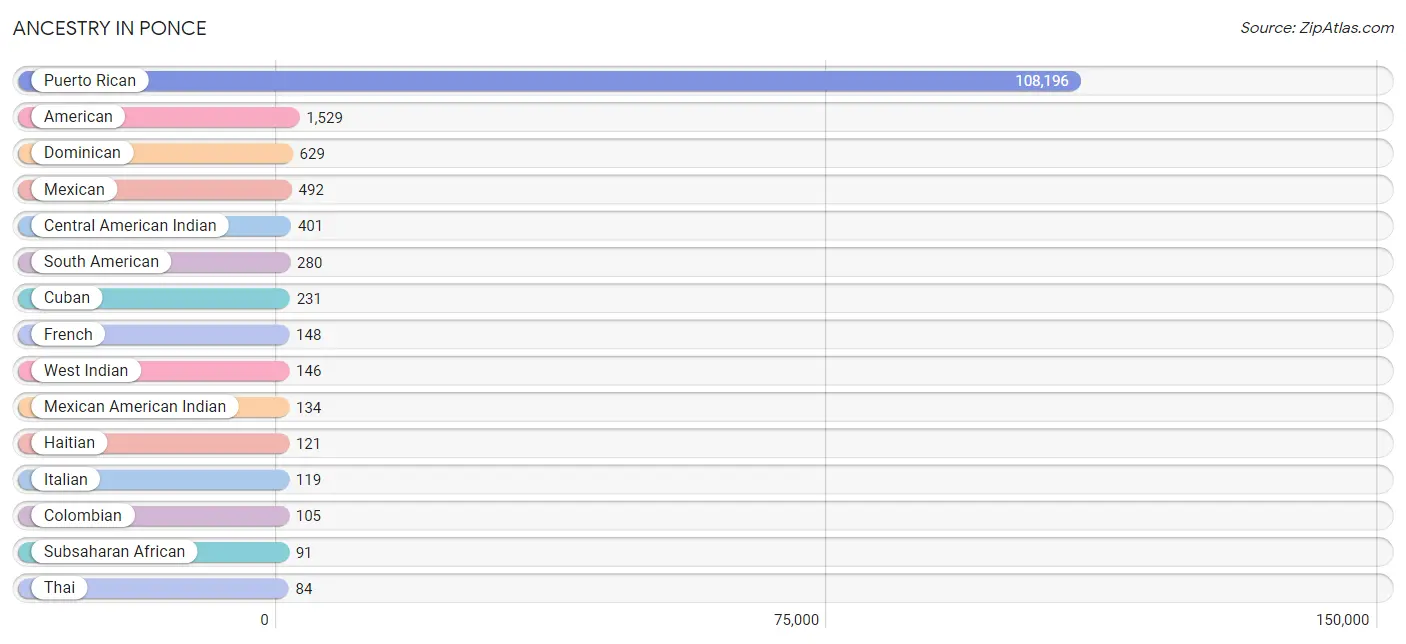
Ancestry in Ponce
The most populous ancestries reported in Ponce are Puerto Rican (108,196 | 97.6%), American (1,529 | 1.4%), Dominican (629 | 0.6%), Mexican (492 | 0.4%), and Central American Indian (401 | 0.4%), together accounting for 100.3% of all Ponce residents.
| Ancestry | # Population | % Population |
| African | 81 | 0.1% |
| American | 1,529 | 1.4% |
| Arab | 21 | 0.0% |
| Argentinean | 9 | 0.0% |
| Brazilian | 53 | 0.1% |
| British | 27 | 0.0% |
| British West Indian | 17 | 0.0% |
| Bulgarian | 10 | 0.0% |
| Central American | 47 | 0.0% |
| Central American Indian | 401 | 0.4% |
| Chilean | 66 | 0.1% |
| Colombian | 105 | 0.1% |
| Costa Rican | 22 | 0.0% |
| Cuban | 231 | 0.2% |
| Dominican | 629 | 0.6% |
| Ecuadorian | 8 | 0.0% |
| Egyptian | 8 | 0.0% |
| English | 32 | 0.0% |
| European | 27 | 0.0% |
| French | 148 | 0.1% |
| German | 19 | 0.0% |
| Guatemalan | 9 | 0.0% |
| Haitian | 121 | 0.1% |
| Indian (Asian) | 39 | 0.0% |
| Irish | 34 | 0.0% |
| Italian | 119 | 0.1% |
| Mexican | 492 | 0.4% |
| Mexican American Indian | 134 | 0.1% |
| Nigerian | 10 | 0.0% |
| Northern European | 23 | 0.0% |
| Norwegian | 9 | 0.0% |
| Palestinian | 13 | 0.0% |
| Panamanian | 8 | 0.0% |
| Portuguese | 12 | 0.0% |
| Puerto Rican | 108,196 | 97.6% |
| Salvadoran | 8 | 0.0% |
| South American | 280 | 0.3% |
| Spaniard | 57 | 0.1% |
| Spanish American Indian | 21 | 0.0% |
| Subsaharan African | 91 | 0.1% |
| Thai | 84 | 0.1% |
| Uruguayan | 10 | 0.0% |
| Venezuelan | 82 | 0.1% |
| West Indian | 146 | 0.1% | View All 44 Rows |
Immigrants in Ponce

| Immigration Origin | # Population | % Population | View All 0 Rows |
Sex and Age in Ponce
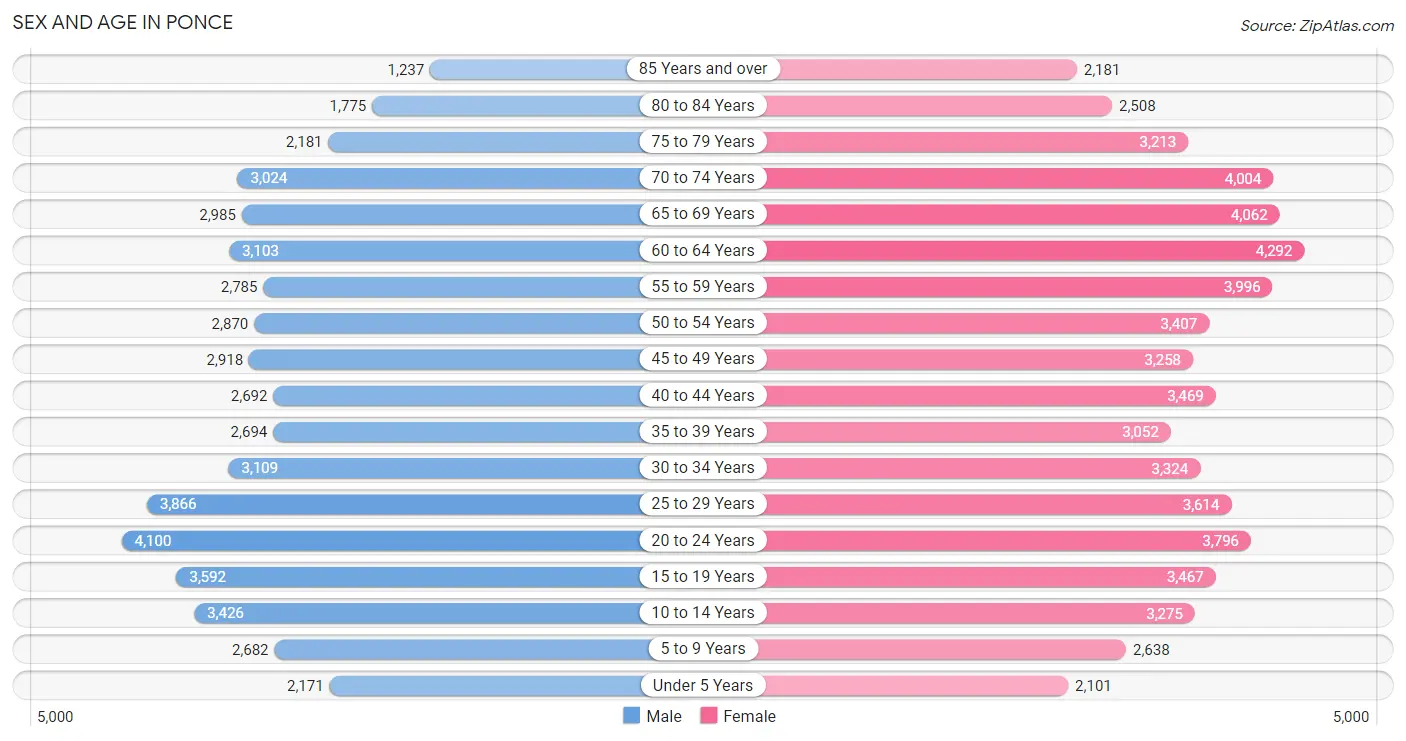
Sex and Age in Ponce
The most populous age groups in Ponce are 20 to 24 Years (4,100 | 8.0%) for men and 60 to 64 Years (4,292 | 7.2%) for women.
| Age Bracket | Male | Female |
| Under 5 Years | 2,171 (4.2%) | 2,101 (3.5%) |
| 5 to 9 Years | 2,682 (5.2%) | 2,638 (4.4%) |
| 10 to 14 Years | 3,426 (6.7%) | 3,275 (5.5%) |
| 15 to 19 Years | 3,592 (7.0%) | 3,467 (5.8%) |
| 20 to 24 Years | 4,100 (8.0%) | 3,796 (6.4%) |
| 25 to 29 Years | 3,866 (7.5%) | 3,614 (6.1%) |
| 30 to 34 Years | 3,109 (6.1%) | 3,324 (5.6%) |
| 35 to 39 Years | 2,694 (5.3%) | 3,052 (5.1%) |
| 40 to 44 Years | 2,692 (5.3%) | 3,469 (5.8%) |
| 45 to 49 Years | 2,918 (5.7%) | 3,258 (5.5%) |
| 50 to 54 Years | 2,870 (5.6%) | 3,407 (5.7%) |
| 55 to 59 Years | 2,785 (5.4%) | 3,996 (6.7%) |
| 60 to 64 Years | 3,103 (6.1%) | 4,292 (7.2%) |
| 65 to 69 Years | 2,985 (5.8%) | 4,062 (6.8%) |
| 70 to 74 Years | 3,024 (5.9%) | 4,004 (6.7%) |
| 75 to 79 Years | 2,181 (4.3%) | 3,213 (5.4%) |
| 80 to 84 Years | 1,775 (3.5%) | 2,508 (4.2%) |
| 85 Years and over | 1,237 (2.4%) | 2,181 (3.7%) |
| Total | 51,210 (100.0%) | 59,657 (100.0%) |
Families and Households in Ponce
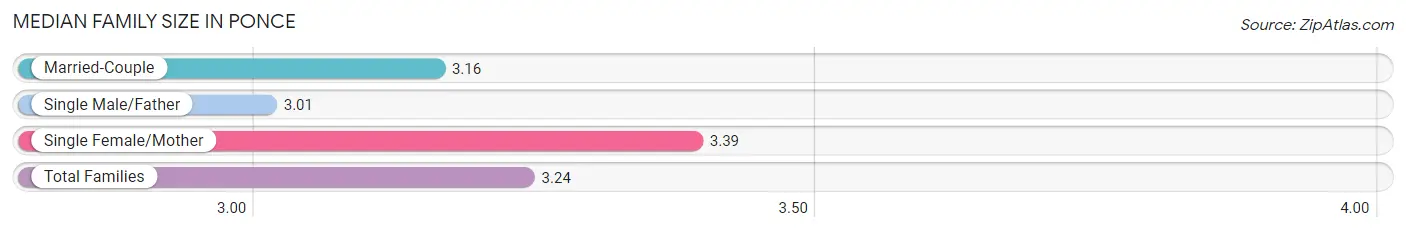
Median Family Size in Ponce
The median family size in Ponce is 3.24 persons per family, with single female/mother families (10,756 | 39.8%) accounting for the largest median family size of 3.39 persons per family. On the other hand, single male/father families (2,594 | 9.6%) represent the smallest median family size with 3.01 persons per family.
| Family Type | # Families | Family Size |
| Married-Couple | 13,674 (50.6%) | 3.16 |
| Single Male/Father | 2,594 (9.6%) | 3.01 |
| Single Female/Mother | 10,756 (39.8%) | 3.39 |
| Total Families | 27,024 (100.0%) | 3.24 |
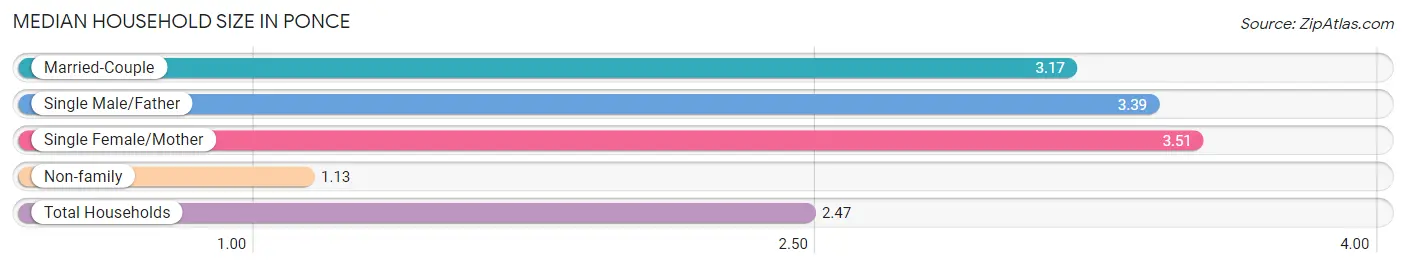
Median Household Size in Ponce
The median household size in Ponce is 2.47 persons per household, with single female/mother households (10,756 | 24.3%) accounting for the largest median household size of 3.51 persons per household. non-family households (17,308 | 39.0%) represent the smallest median household size with 1.13 persons per household.
| Household Type | # Households | Household Size |
| Married-Couple | 13,674 (30.8%) | 3.17 |
| Single Male/Father | 2,594 (5.9%) | 3.39 |
| Single Female/Mother | 10,756 (24.3%) | 3.51 |
| Non-family | 17,308 (39.0%) | 1.13 |
| Total Households | 44,332 (100.0%) | 2.47 |
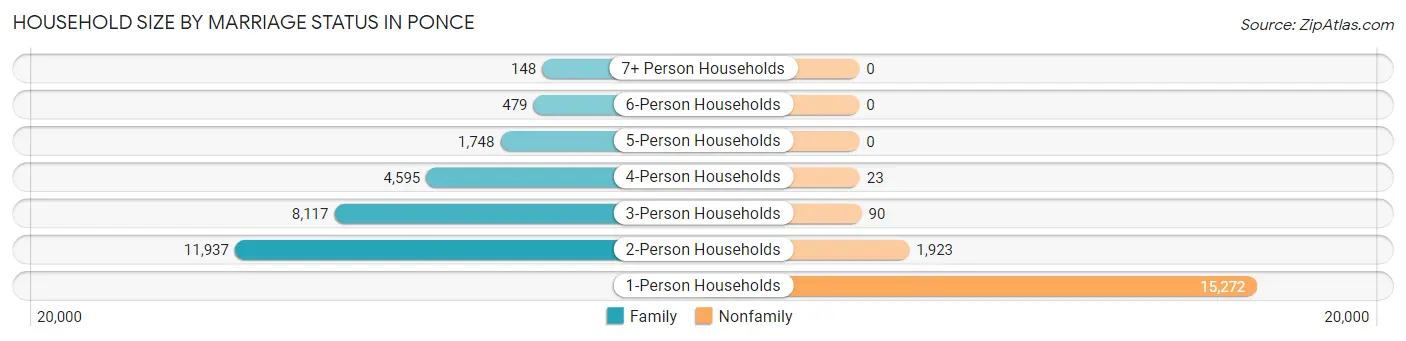
Household Size by Marriage Status in Ponce
Out of a total of 44,332 households in Ponce, 27,024 (61.0%) are family households, while 17,308 (39.0%) are nonfamily households. The most numerous type of family households are 2-person households, comprising 11,937, and the most common type of nonfamily households are 1-person households, comprising 15,272.
| Household Size | Family Households | Nonfamily Households |
| 1-Person Households | - | 15,272 (34.4%) |
| 2-Person Households | 11,937 (26.9%) | 1,923 (4.3%) |
| 3-Person Households | 8,117 (18.3%) | 90 (0.2%) |
| 4-Person Households | 4,595 (10.4%) | 23 (0.1%) |
| 5-Person Households | 1,748 (3.9%) | 0 (0.0%) |
| 6-Person Households | 479 (1.1%) | 0 (0.0%) |
| 7+ Person Households | 148 (0.3%) | 0 (0.0%) |
| Total | 27,024 (61.0%) | 17,308 (39.0%) |
Female Fertility in Ponce
Fertility by Age in Ponce
Average fertility rate in Ponce is 34.0 births per 1,000 women. Women in the age bracket of 20 to 34 years have the highest fertility rate with 65.0 births per 1,000 women. Women in the age bracket of 20 to 34 years acount for 83.3% of all women with births.
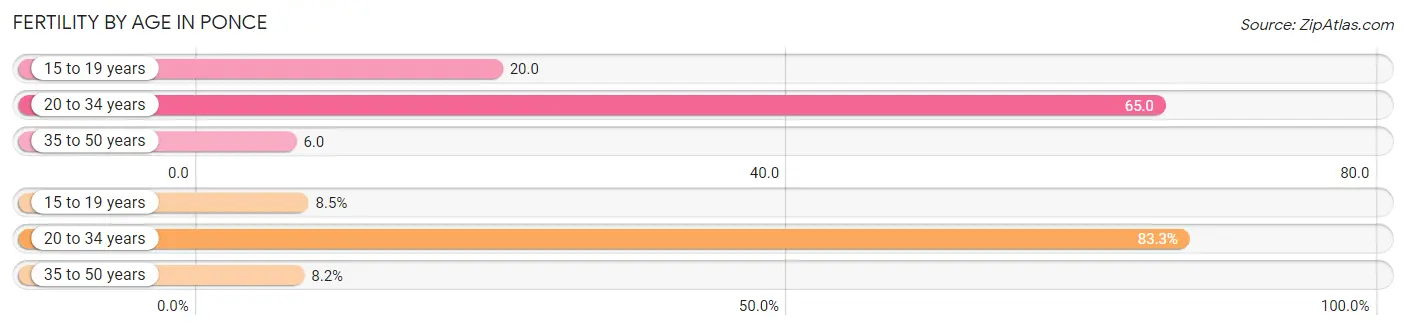
| Age Bracket | Women with Births | Births / 1,000 Women |
| 15 to 19 years | 71 (8.5%) | 20.0 |
| 20 to 34 years | 693 (83.3%) | 65.0 |
| 35 to 50 years | 68 (8.2%) | 6.0 |
| Total | 832 (100.0%) | 34.0 |
Fertility by Age by Marriage Status in Ponce
22.8% of women with births (832) in Ponce are married. The highest percentage of unmarried women with births falls into 15 to 19 years age bracket with 100.0% of them unmarried at the time of birth, while the lowest percentage of unmarried women with births belong to 35 to 50 years age bracket with 50.0% of them unmarried.
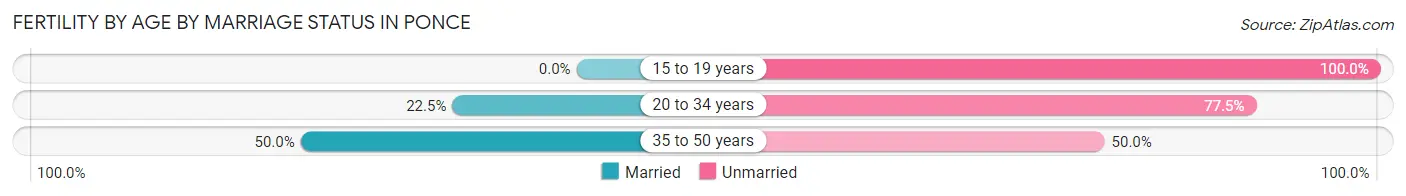
| Age Bracket | Married | Unmarried |
| 15 to 19 years | 0 (0.0%) | 71 (100.0%) |
| 20 to 34 years | 156 (22.5%) | 537 (77.5%) |
| 35 to 50 years | 34 (50.0%) | 34 (50.0%) |
| Total | 190 (22.8%) | 642 (77.2%) |
Fertility by Education in Ponce
Average fertility rate in Ponce is 34.0 births per 1,000 women. Women with the education attainment of graduate degree have the highest fertility rate of 74.0 births per 1,000 women, while women with the education attainment of less than high school have the lowest fertility at 7.0 births per 1,000 women. Women with the education attainment of college or associate's degree represent 29.2% of all women with births.
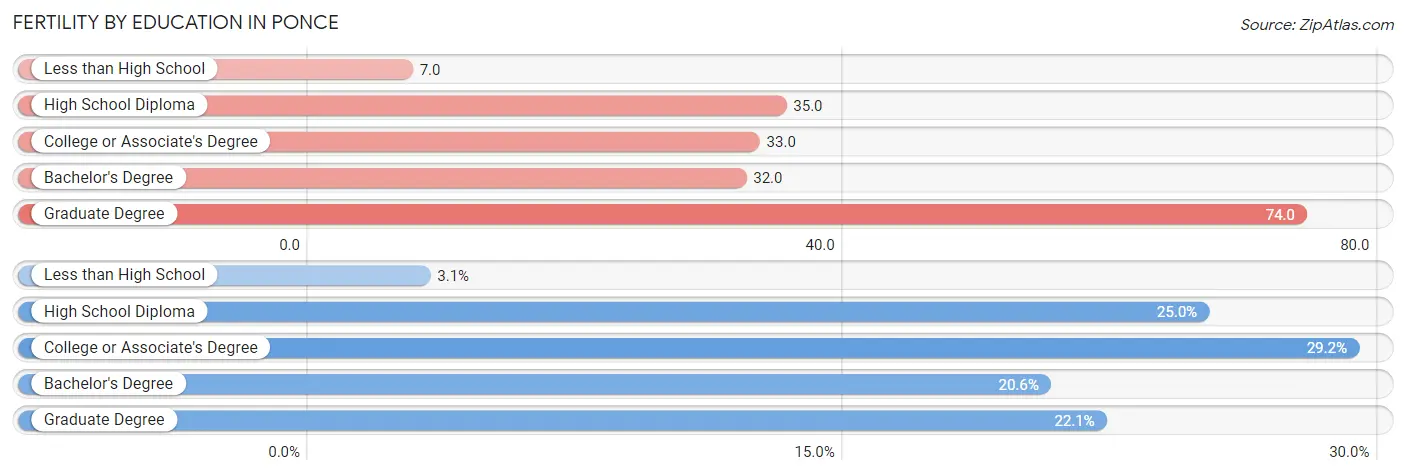
| Educational Attainment | Women with Births | Births / 1,000 Women |
| Less than High School | 26 (3.1%) | 7.0 |
| High School Diploma | 208 (25.0%) | 35.0 |
| College or Associate's Degree | 243 (29.2%) | 33.0 |
| Bachelor's Degree | 171 (20.5%) | 32.0 |
| Graduate Degree | 184 (22.1%) | 74.0 |
| Total | 832 (100.0%) | 34.0 |
Fertility by Education by Marriage Status in Ponce
77.2% of women with births in Ponce are unmarried. Women with the educational attainment of bachelor's degree are most likely to be married with 64.3% of them married at childbirth, while women with the educational attainment of less than high school are least likely to be married with 100.0% of them unmarried at childbirth.
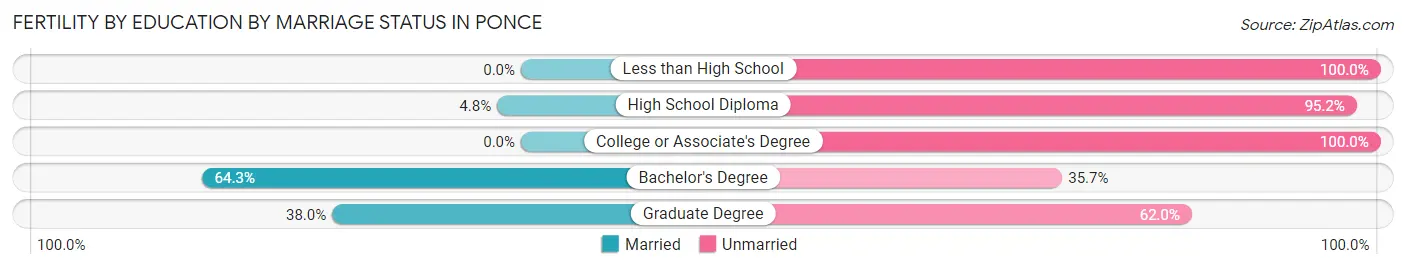
| Educational Attainment | Married | Unmarried |
| Less than High School | 0 (0.0%) | 26 (100.0%) |
| High School Diploma | 10 (4.8%) | 198 (95.2%) |
| College or Associate's Degree | 0 (0.0%) | 243 (100.0%) |
| Bachelor's Degree | 110 (64.3%) | 61 (35.7%) |
| Graduate Degree | 70 (38.0%) | 114 (62.0%) |
| Total | 190 (22.8%) | 642 (77.2%) |
Employment Characteristics in Ponce
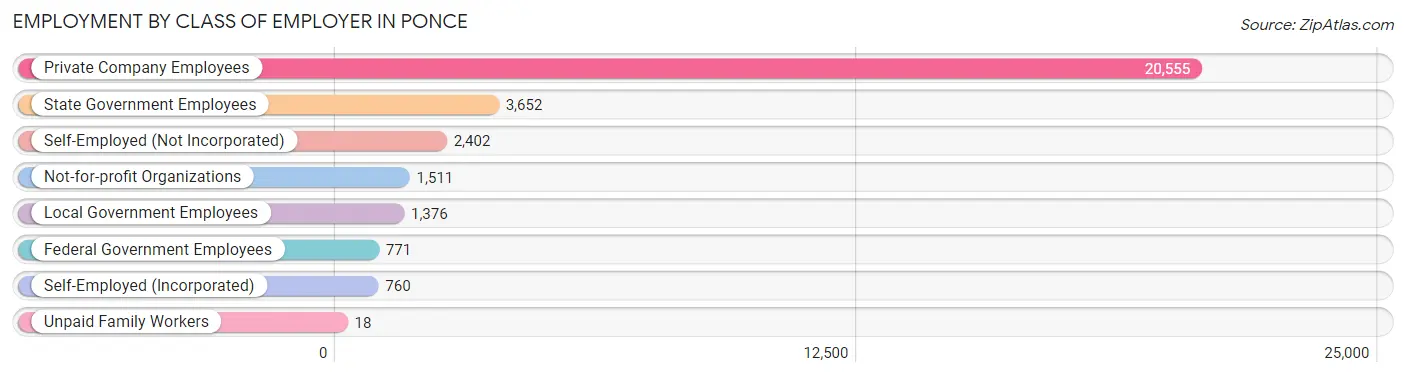
Employment by Class of Employer in Ponce
Among the 31,045 employed individuals in Ponce, private company employees (20,555 | 66.2%), state government employees (3,652 | 11.8%), and self-employed (not incorporated) (2,402 | 7.7%) make up the most common classes of employment.
| Employer Class | # Employees | % Employees |
| Private Company Employees | 20,555 | 66.2% |
| Self-Employed (Incorporated) | 760 | 2.5% |
| Self-Employed (Not Incorporated) | 2,402 | 7.7% |
| Not-for-profit Organizations | 1,511 | 4.9% |
| Local Government Employees | 1,376 | 4.4% |
| State Government Employees | 3,652 | 11.8% |
| Federal Government Employees | 771 | 2.5% |
| Unpaid Family Workers | 18 | 0.1% |
| Total | 31,045 | 100.0% |
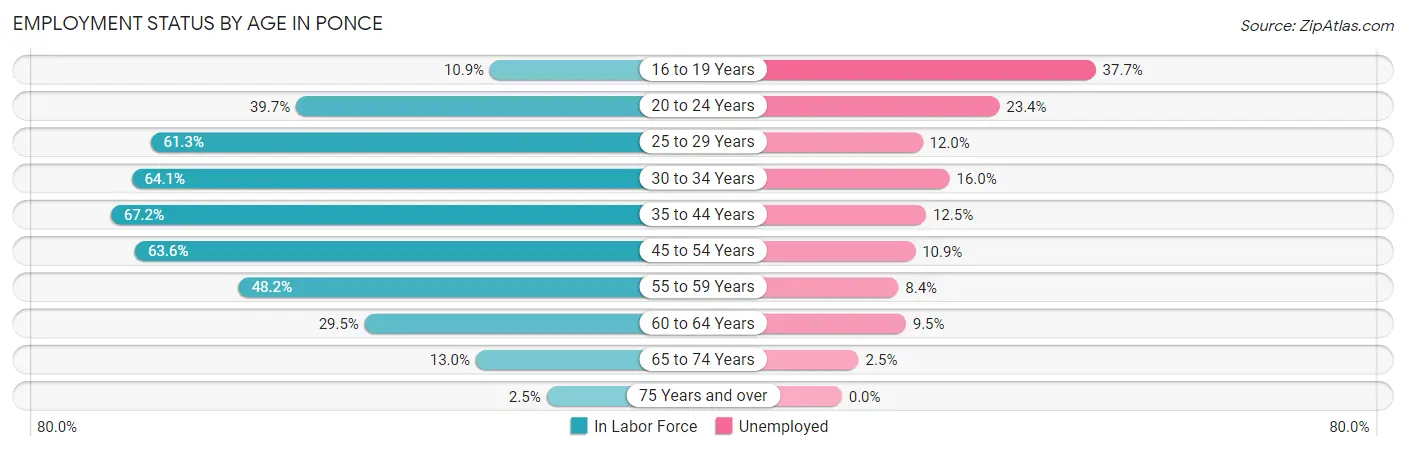
Employment Status by Age in Ponce
According to the labor force statistics for Ponce, out of the total population over 16 years of age (93,295), 38.6% or 36,012 individuals are in the labor force, with 12.7% or 4,574 of them unemployed. The age group with the highest labor force participation rate is 35 to 44 years, with 67.2% or 8,002 individuals in the labor force. Within the labor force, the 16 to 19 years age range has the highest percentage of unemployed individuals, with 37.7% or 238 of them being unemployed.
| Age Bracket | In Labor Force | Unemployed |
| 16 to 19 Years | 630 (10.9%) | 238 (37.7%) |
| 20 to 24 Years | 3,135 (39.7%) | 734 (23.4%) |
| 25 to 29 Years | 4,585 (61.3%) | 550 (12.0%) |
| 30 to 34 Years | 4,124 (64.1%) | 660 (16.0%) |
| 35 to 44 Years | 8,002 (67.2%) | 1,000 (12.5%) |
| 45 to 54 Years | 7,920 (63.6%) | 863 (10.9%) |
| 55 to 59 Years | 3,268 (48.2%) | 275 (8.4%) |
| 60 to 64 Years | 2,182 (29.5%) | 207 (9.5%) |
| 65 to 74 Years | 1,830 (13.0%) | 46 (2.5%) |
| 75 Years and over | 327 (2.5%) | 0 (0.0%) |
| Total | 36,012 (38.6%) | 4,574 (12.7%) |
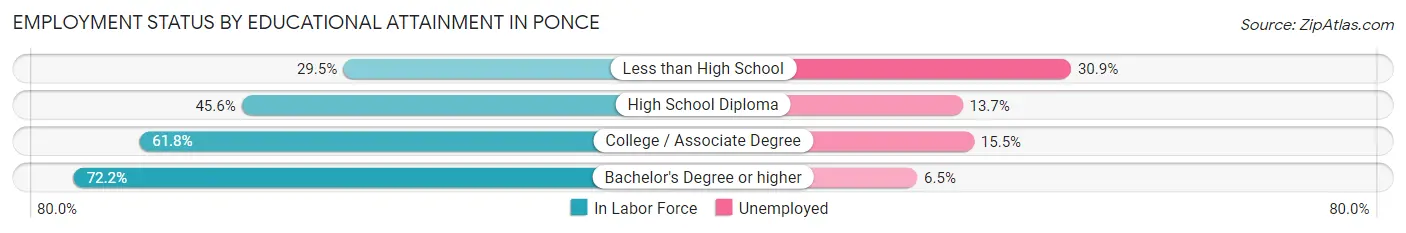
Employment Status by Educational Attainment in Ponce
According to labor force statistics for Ponce, 57.4% of individuals (30,106) out of the total population between 25 and 64 years of age (52,449) are in the labor force, with 11.8% or 3,553 of them being unemployed. The group with the highest labor force participation rate are those with the educational attainment of bachelor's degree or higher, with 72.2% or 13,837 individuals in the labor force. Within the labor force, individuals with less than high school education have the highest percentage of unemployment, with 30.9% or 529 of them being unemployed.
| Educational Attainment | In Labor Force | Unemployed |
| Less than High School | 1,712 (29.5%) | 1,794 (30.9%) |
| High School Diploma | 6,910 (45.6%) | 2,076 (13.7%) |
| College / Associate Degree | 7,617 (61.8%) | 1,910 (15.5%) |
| Bachelor's Degree or higher | 13,837 (72.2%) | 1,246 (6.5%) |
| Total | 30,106 (57.4%) | 6,189 (11.8%) |
Employment Occupations by Sex in Ponce
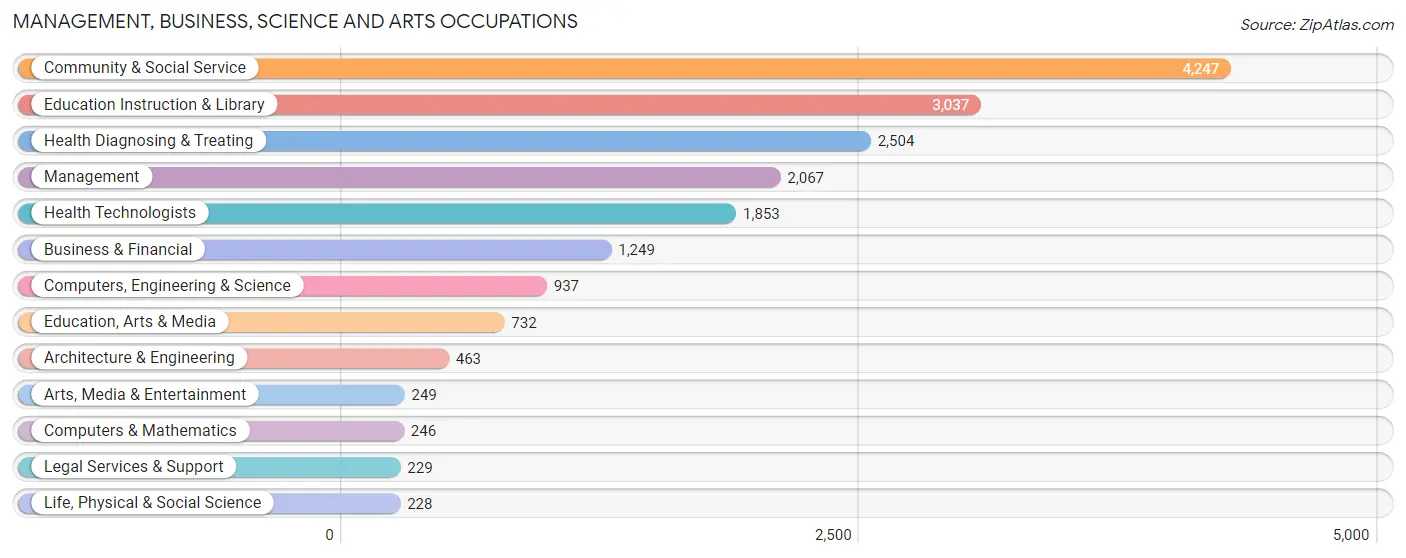
Management, Business, Science and Arts Occupations
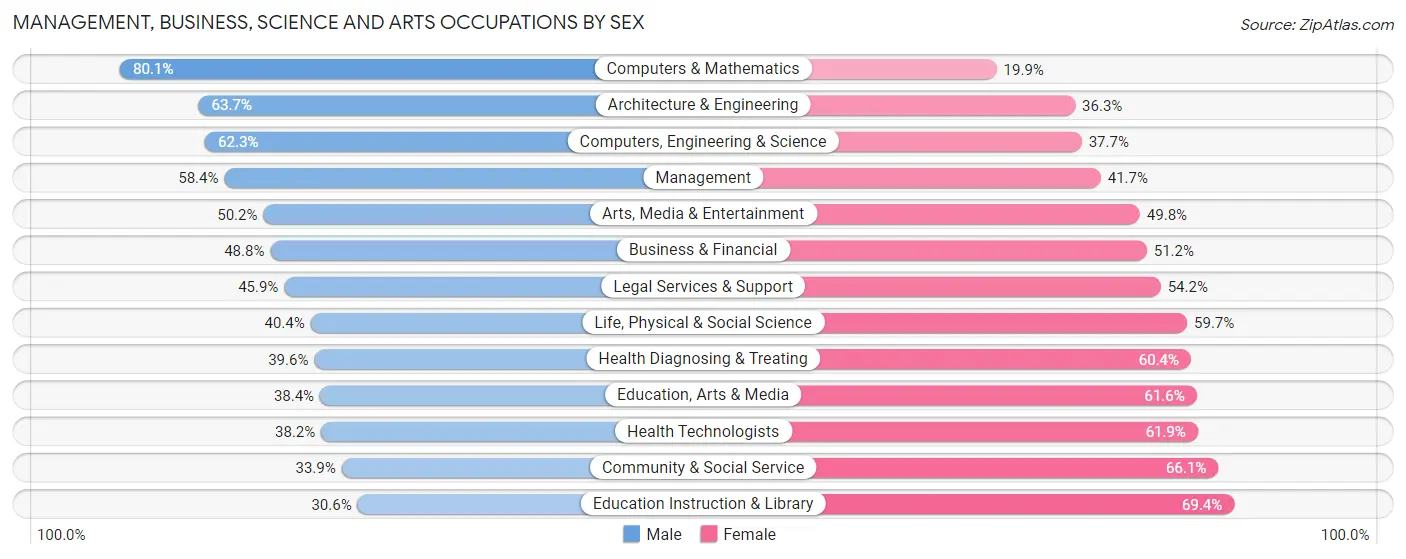
The most common Management, Business, Science and Arts occupations in Ponce are Community & Social Service (4,247 | 13.5%), Education Instruction & Library (3,037 | 9.7%), Health Diagnosing & Treating (2,504 | 8.0%), Management (2,067 | 6.6%), and Health Technologists (1,853 | 5.9%).
Management, Business, Science and Arts Occupations by Sex
Within the Management, Business, Science and Arts occupations in Ponce, the most male-oriented occupations are Computers & Mathematics (80.1%), Architecture & Engineering (63.7%), and Computers, Engineering & Science (62.3%), while the most female-oriented occupations are Education Instruction & Library (69.4%), Community & Social Service (66.1%), and Health Technologists (61.9%).
| Occupation | Male | Female |
| Management | 1,206 (58.4%) | 861 (41.6%) |
| Business & Financial | 609 (48.8%) | 640 (51.2%) |
| Computers, Engineering & Science | 584 (62.3%) | 353 (37.7%) |
| Computers & Mathematics | 197 (80.1%) | 49 (19.9%) |
| Architecture & Engineering | 295 (63.7%) | 168 (36.3%) |
| Life, Physical & Social Science | 92 (40.4%) | 136 (59.7%) |
| Community & Social Service | 1,439 (33.9%) | 2,808 (66.1%) |
| Education, Arts & Media | 281 (38.4%) | 451 (61.6%) |
| Legal Services & Support | 105 (45.9%) | 124 (54.1%) |
| Education Instruction & Library | 928 (30.6%) | 2,109 (69.4%) |
| Arts, Media & Entertainment | 125 (50.2%) | 124 (49.8%) |
| Health Diagnosing & Treating | 991 (39.6%) | 1,513 (60.4%) |
| Health Technologists | 707 (38.2%) | 1,146 (61.9%) |
| Total (Category) | 4,829 (43.9%) | 6,175 (56.1%) |
| Total (Overall) | 16,359 (52.1%) | 15,016 (47.9%) |
Services Occupations
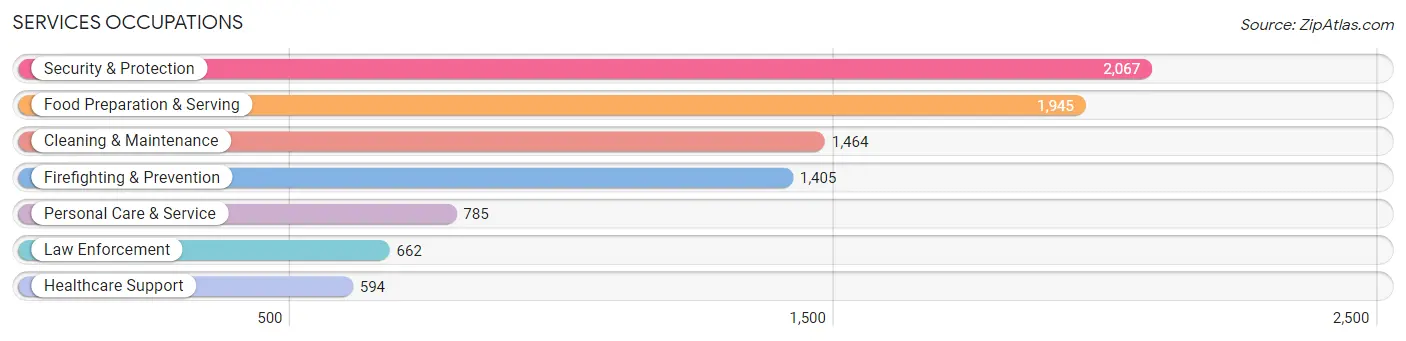
The most common Services occupations in Ponce are Security & Protection (2,067 | 6.6%), Food Preparation & Serving (1,945 | 6.2%), Cleaning & Maintenance (1,464 | 4.7%), Firefighting & Prevention (1,405 | 4.5%), and Personal Care & Service (785 | 2.5%).
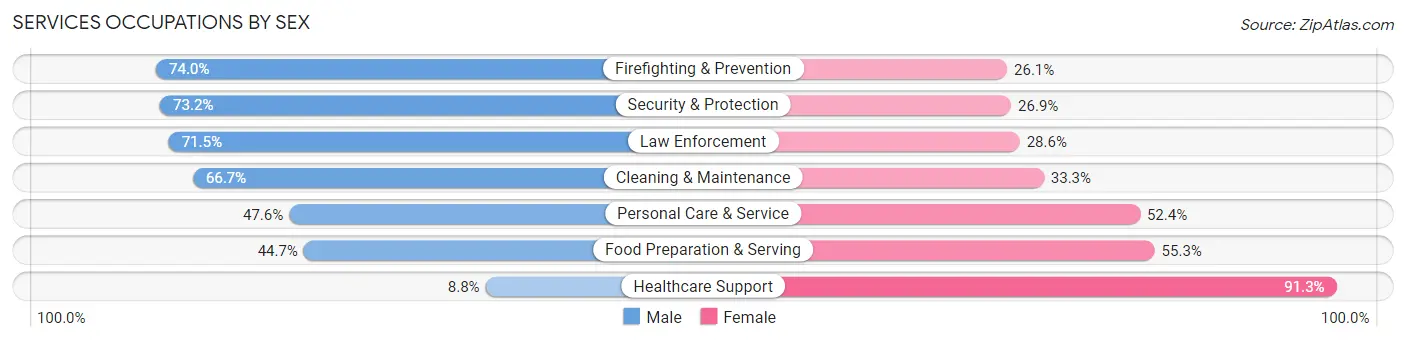
Services Occupations by Sex
Within the Services occupations in Ponce, the most male-oriented occupations are Firefighting & Prevention (74.0%), Security & Protection (73.2%), and Law Enforcement (71.5%), while the most female-oriented occupations are Healthcare Support (91.2%), Food Preparation & Serving (55.3%), and Personal Care & Service (52.4%).
| Occupation | Male | Female |
| Healthcare Support | 52 (8.7%) | 542 (91.2%) |
| Security & Protection | 1,512 (73.2%) | 555 (26.9%) |
| Firefighting & Prevention | 1,039 (74.0%) | 366 (26.1%) |
| Law Enforcement | 473 (71.5%) | 189 (28.5%) |
| Food Preparation & Serving | 870 (44.7%) | 1,075 (55.3%) |
| Cleaning & Maintenance | 976 (66.7%) | 488 (33.3%) |
| Personal Care & Service | 374 (47.6%) | 411 (52.4%) |
| Total (Category) | 3,784 (55.2%) | 3,071 (44.8%) |
| Total (Overall) | 16,359 (52.1%) | 15,016 (47.9%) |
Sales and Office Occupations
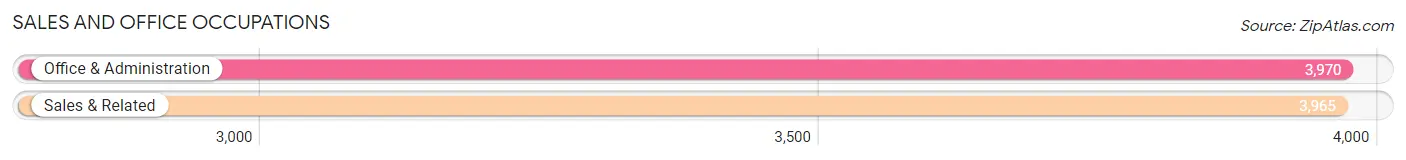
The most common Sales and Office occupations in Ponce are Office & Administration (3,970 | 12.7%), and Sales & Related (3,965 | 12.6%).
Sales and Office Occupations by Sex

| Occupation | Male | Female |
| Sales & Related | 1,749 (44.1%) | 2,216 (55.9%) |
| Office & Administration | 1,296 (32.6%) | 2,674 (67.4%) |
| Total (Category) | 3,045 (38.4%) | 4,890 (61.6%) |
| Total (Overall) | 16,359 (52.1%) | 15,016 (47.9%) |
Natural Resources, Construction and Maintenance Occupations
The most common Natural Resources, Construction and Maintenance occupations in Ponce are Construction & Extraction (1,345 | 4.3%), Installation, Maintenance & Repair (904 | 2.9%), and Farming, Fishing & Forestry (132 | 0.4%).
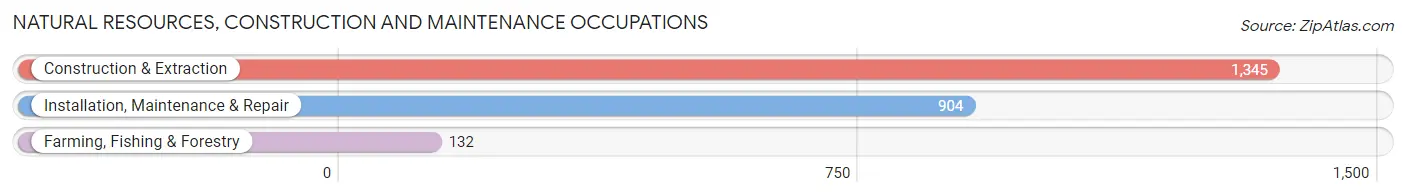
Natural Resources, Construction and Maintenance Occupations by Sex
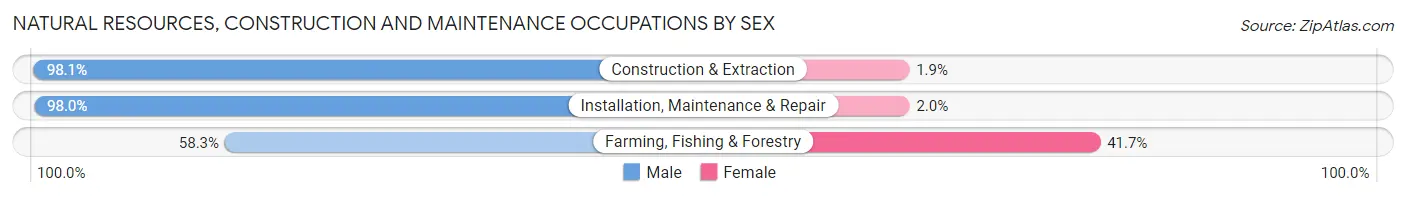
| Occupation | Male | Female |
| Farming, Fishing & Forestry | 77 (58.3%) | 55 (41.7%) |
| Construction & Extraction | 1,319 (98.1%) | 26 (1.9%) |
| Installation, Maintenance & Repair | 886 (98.0%) | 18 (2.0%) |
| Total (Category) | 2,282 (95.8%) | 99 (4.2%) |
| Total (Overall) | 16,359 (52.1%) | 15,016 (47.9%) |
Production, Transportation and Moving Occupations
The most common Production, Transportation and Moving occupations in Ponce are Production (1,536 | 4.9%), Material Moving (929 | 3.0%), and Transportation (735 | 2.3%).
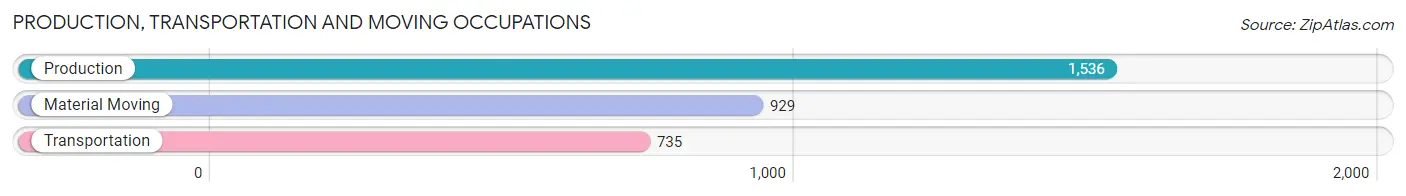
Production, Transportation and Moving Occupations by Sex
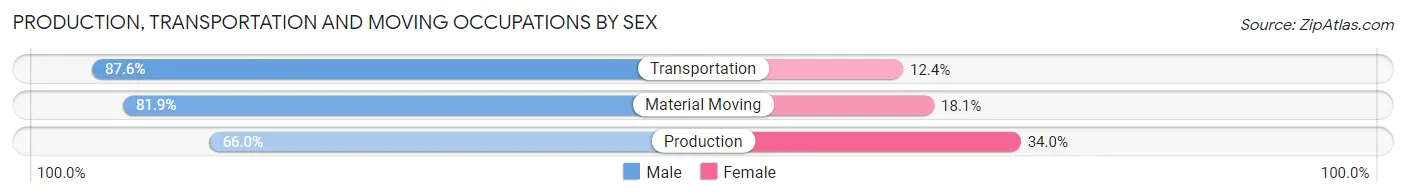
| Occupation | Male | Female |
| Production | 1,014 (66.0%) | 522 (34.0%) |
| Transportation | 644 (87.6%) | 91 (12.4%) |
| Material Moving | 761 (81.9%) | 168 (18.1%) |
| Total (Category) | 2,419 (75.6%) | 781 (24.4%) |
| Total (Overall) | 16,359 (52.1%) | 15,016 (47.9%) |
Employment Industries by Sex in Ponce
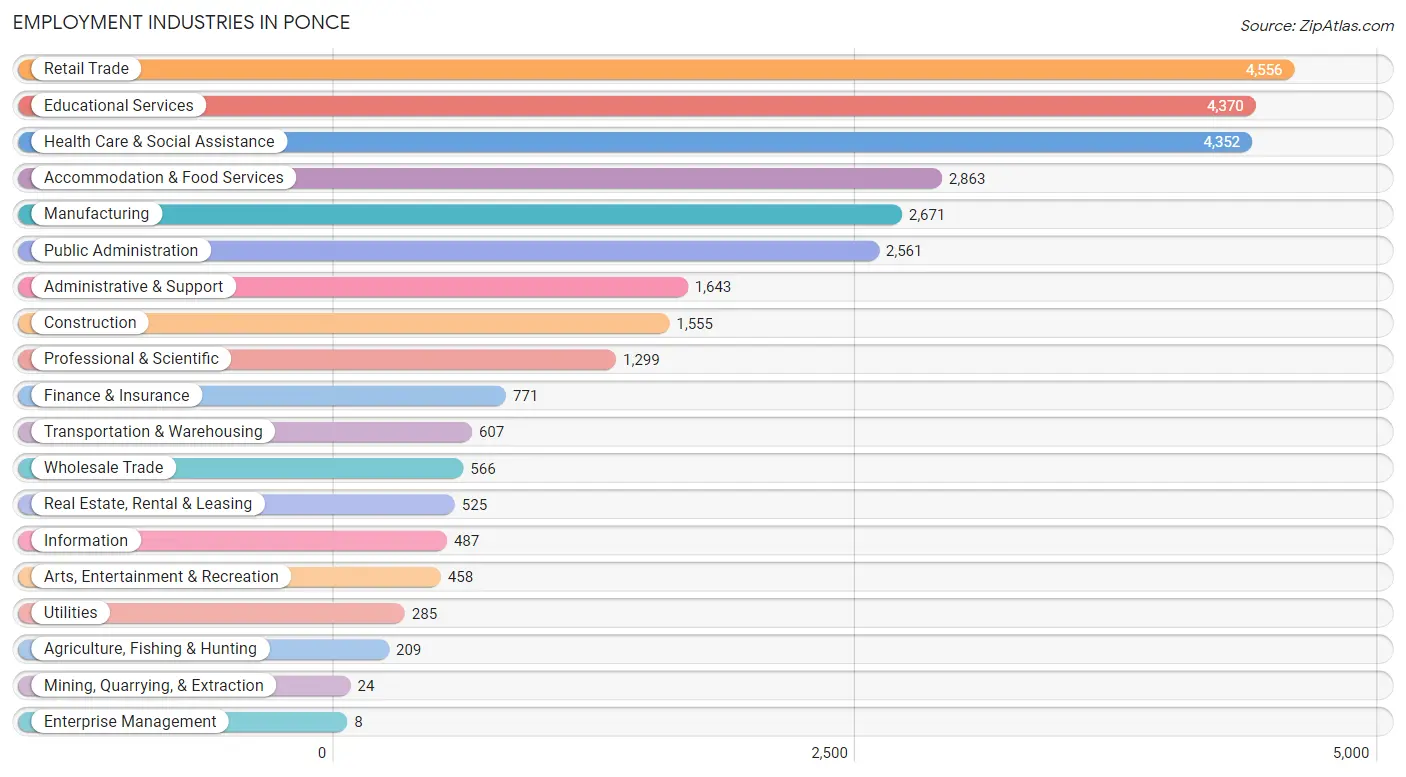
Employment Industries in Ponce
The major employment industries in Ponce include Retail Trade (4,556 | 14.5%), Educational Services (4,370 | 13.9%), Health Care & Social Assistance (4,352 | 13.9%), Accommodation & Food Services (2,863 | 9.1%), and Manufacturing (2,671 | 8.5%).
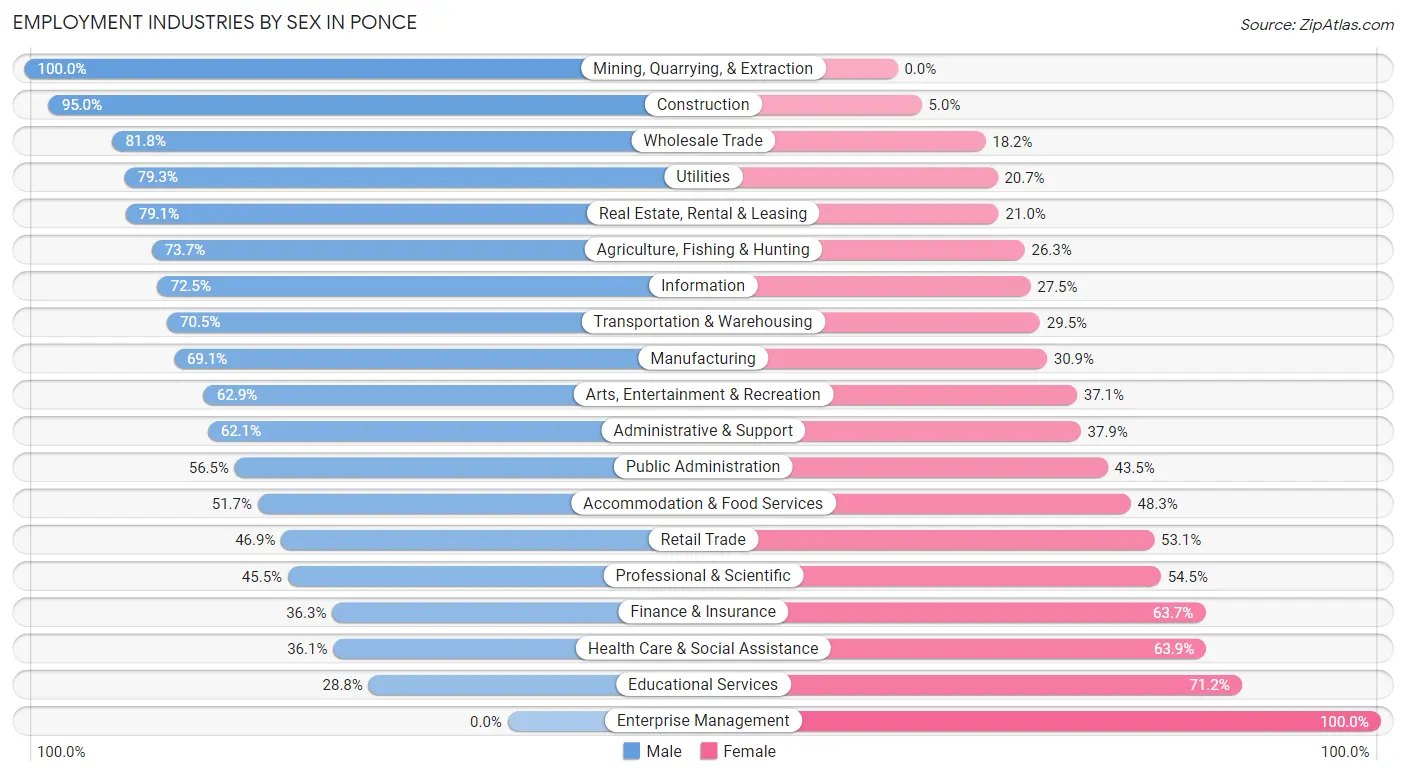
Employment Industries by Sex in Ponce
The Ponce industries that see more men than women are Mining, Quarrying, & Extraction (100.0%), Construction (95.0%), and Wholesale Trade (81.8%), whereas the industries that tend to have a higher number of women are Enterprise Management (100.0%), Educational Services (71.2%), and Health Care & Social Assistance (63.9%).
| Industry | Male | Female |
| Agriculture, Fishing & Hunting | 154 (73.7%) | 55 (26.3%) |
| Mining, Quarrying, & Extraction | 24 (100.0%) | 0 (0.0%) |
| Construction | 1,477 (95.0%) | 78 (5.0%) |
| Manufacturing | 1,845 (69.1%) | 826 (30.9%) |
| Wholesale Trade | 463 (81.8%) | 103 (18.2%) |
| Retail Trade | 2,136 (46.9%) | 2,420 (53.1%) |
| Transportation & Warehousing | 428 (70.5%) | 179 (29.5%) |
| Utilities | 226 (79.3%) | 59 (20.7%) |
| Information | 353 (72.5%) | 134 (27.5%) |
| Finance & Insurance | 280 (36.3%) | 491 (63.7%) |
| Real Estate, Rental & Leasing | 415 (79.0%) | 110 (20.9%) |
| Professional & Scientific | 591 (45.5%) | 708 (54.5%) |
| Enterprise Management | 0 (0.0%) | 8 (100.0%) |
| Administrative & Support | 1,020 (62.1%) | 623 (37.9%) |
| Educational Services | 1,258 (28.8%) | 3,112 (71.2%) |
| Health Care & Social Assistance | 1,572 (36.1%) | 2,780 (63.9%) |
| Arts, Entertainment & Recreation | 288 (62.9%) | 170 (37.1%) |
| Accommodation & Food Services | 1,481 (51.7%) | 1,382 (48.3%) |
| Public Administration | 1,447 (56.5%) | 1,114 (43.5%) |
| Total | 16,359 (52.1%) | 15,016 (47.9%) |
Education in Ponce
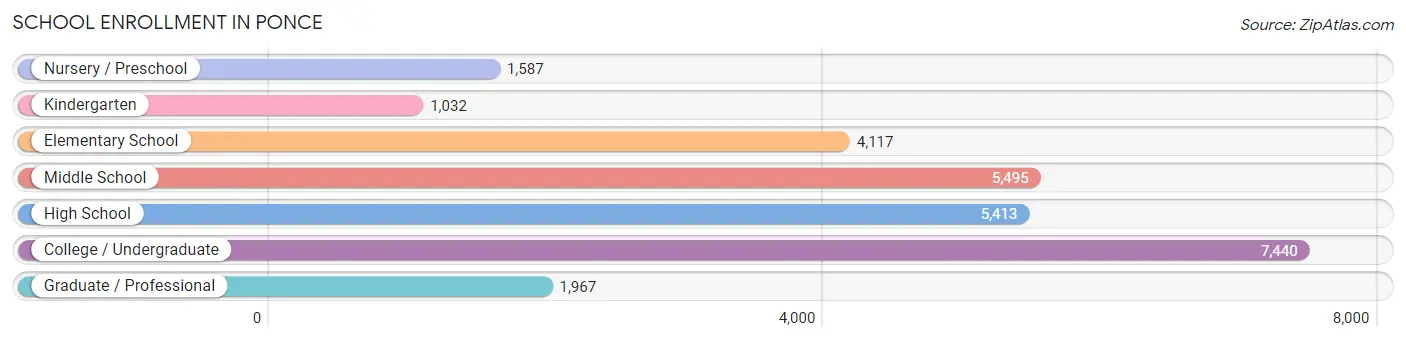
School Enrollment in Ponce
The most common levels of schooling among the 27,051 students in Ponce are college / undergraduate (7,440 | 27.5%), middle school (5,495 | 20.3%), and high school (5,413 | 20.0%).
| School Level | # Students | % Students |
| Nursery / Preschool | 1,587 | 5.9% |
| Kindergarten | 1,032 | 3.8% |
| Elementary School | 4,117 | 15.2% |
| Middle School | 5,495 | 20.3% |
| High School | 5,413 | 20.0% |
| College / Undergraduate | 7,440 | 27.5% |
| Graduate / Professional | 1,967 | 7.3% |
| Total | 27,051 | 100.0% |
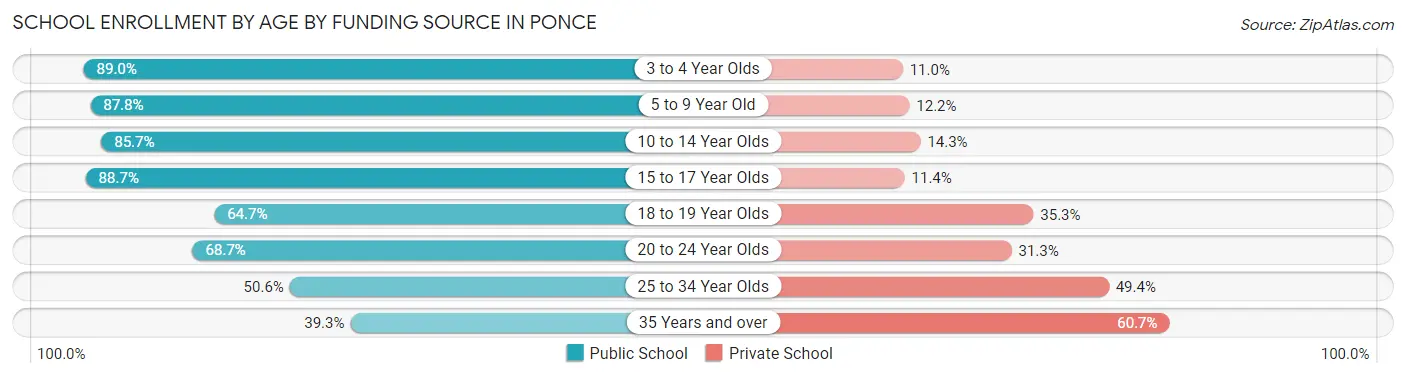
School Enrollment by Age by Funding Source in Ponce
Out of a total of 27,051 students who are enrolled in schools in Ponce, 6,168 (22.8%) attend a private institution, while the remaining 20,883 (77.2%) are enrolled in public schools. The age group of 35 years and over has the highest likelihood of being enrolled in private schools, with 791 (60.7% in the age bracket) enrolled. Conversely, the age group of 3 to 4 year olds has the lowest likelihood of being enrolled in a private school, with 1,181 (89.0% in the age bracket) attending a public institution.
| Age Bracket | Public School | Private School |
| 3 to 4 Year Olds | 1,181 (89.0%) | 146 (11.0%) |
| 5 to 9 Year Old | 4,597 (87.8%) | 641 (12.2%) |
| 10 to 14 Year Olds | 5,662 (85.7%) | 945 (14.3%) |
| 15 to 17 Year Olds | 3,389 (88.6%) | 434 (11.4%) |
| 18 to 19 Year Olds | 1,382 (64.7%) | 755 (35.3%) |
| 20 to 24 Year Olds | 3,025 (68.7%) | 1,376 (31.3%) |
| 25 to 34 Year Olds | 1,121 (50.6%) | 1,093 (49.4%) |
| 35 Years and over | 513 (39.3%) | 791 (60.7%) |
| Total | 20,883 (77.2%) | 6,168 (22.8%) |
Educational Attainment by Field of Study in Ponce
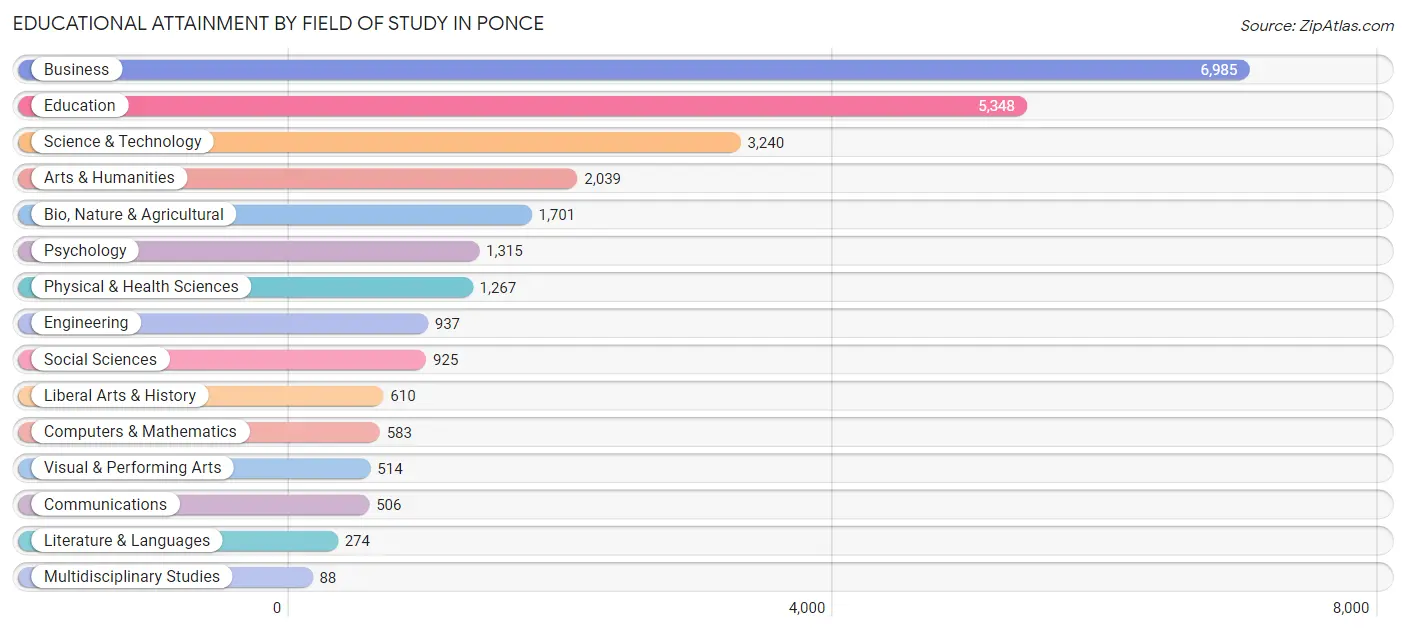
Business (6,985 | 26.5%), education (5,348 | 20.3%), science & technology (3,240 | 12.3%), arts & humanities (2,039 | 7.7%), and bio, nature & agricultural (1,701 | 6.5%) are the most common fields of study among 26,332 individuals in Ponce who have obtained a bachelor's degree or higher.
| Field of Study | # Graduates | % Graduates |
| Computers & Mathematics | 583 | 2.2% |
| Bio, Nature & Agricultural | 1,701 | 6.5% |
| Physical & Health Sciences | 1,267 | 4.8% |
| Psychology | 1,315 | 5.0% |
| Social Sciences | 925 | 3.5% |
| Engineering | 937 | 3.6% |
| Multidisciplinary Studies | 88 | 0.3% |
| Science & Technology | 3,240 | 12.3% |
| Business | 6,985 | 26.5% |
| Education | 5,348 | 20.3% |
| Literature & Languages | 274 | 1.0% |
| Liberal Arts & History | 610 | 2.3% |
| Visual & Performing Arts | 514 | 1.9% |
| Communications | 506 | 1.9% |
| Arts & Humanities | 2,039 | 7.7% |
| Total | 26,332 | 100.0% |
Transportation & Commute in Ponce
Vehicle Availability by Sex in Ponce
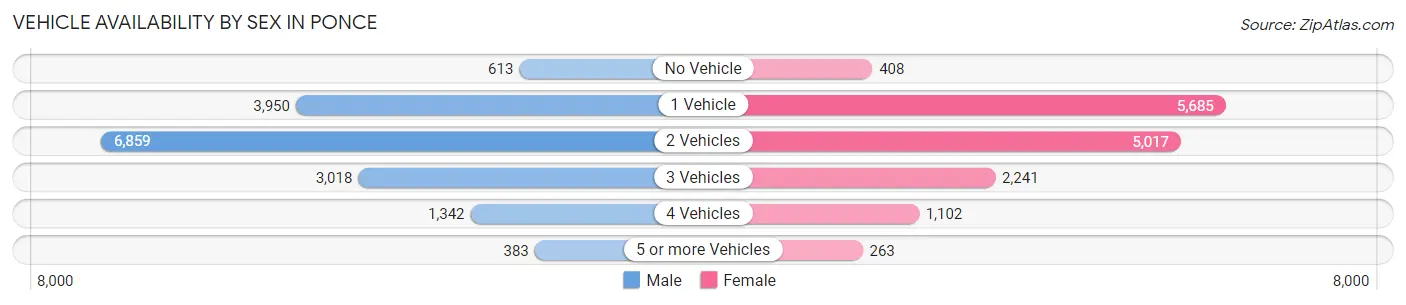
The most prevalent vehicle ownership categories in Ponce are males with 2 vehicles (6,859, accounting for 42.4%) and females with 2 vehicles (5,017, making up 46.6%).
| Vehicles Available | Male | Female |
| No Vehicle | 613 (3.8%) | 408 (2.8%) |
| 1 Vehicle | 3,950 (24.4%) | 5,685 (38.6%) |
| 2 Vehicles | 6,859 (42.4%) | 5,017 (34.1%) |
| 3 Vehicles | 3,018 (18.7%) | 2,241 (15.2%) |
| 4 Vehicles | 1,342 (8.3%) | 1,102 (7.5%) |
| 5 or more Vehicles | 383 (2.4%) | 263 (1.8%) |
| Total | 16,165 (100.0%) | 14,716 (100.0%) |
Commute Time in Ponce
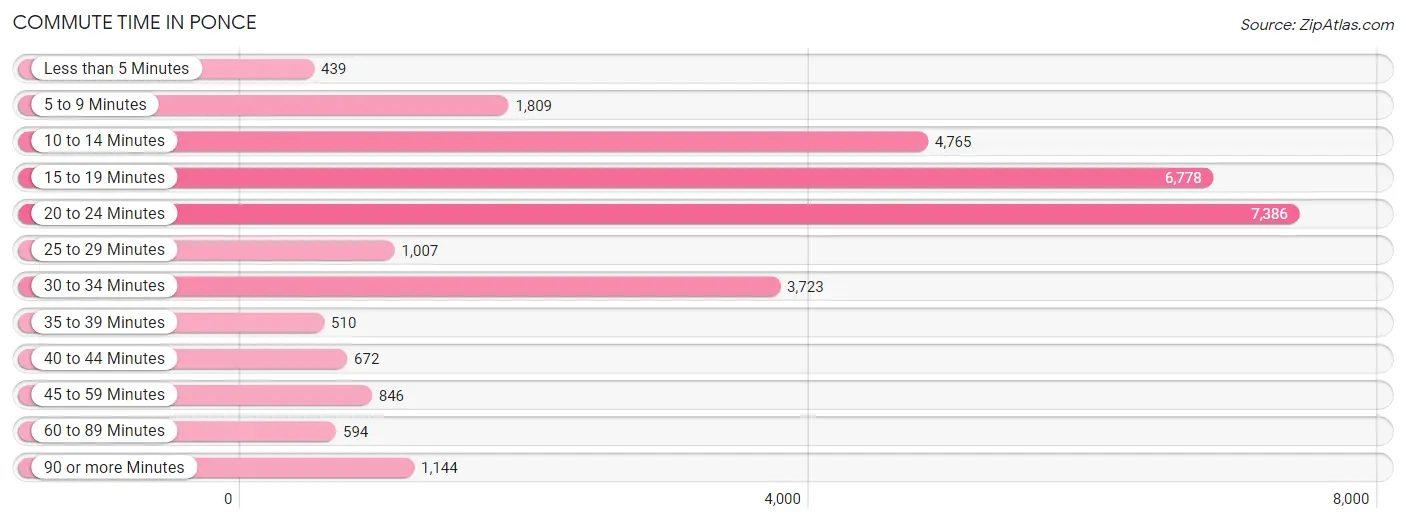
The most frequently occuring commute durations in Ponce are 20 to 24 minutes (7,386 commuters, 24.9%), 15 to 19 minutes (6,778 commuters, 22.8%), and 10 to 14 minutes (4,765 commuters, 16.1%).
| Commute Time | # Commuters | % Commuters |
| Less than 5 Minutes | 439 | 1.5% |
| 5 to 9 Minutes | 1,809 | 6.1% |
| 10 to 14 Minutes | 4,765 | 16.1% |
| 15 to 19 Minutes | 6,778 | 22.8% |
| 20 to 24 Minutes | 7,386 | 24.9% |
| 25 to 29 Minutes | 1,007 | 3.4% |
| 30 to 34 Minutes | 3,723 | 12.6% |
| 35 to 39 Minutes | 510 | 1.7% |
| 40 to 44 Minutes | 672 | 2.3% |
| 45 to 59 Minutes | 846 | 2.9% |
| 60 to 89 Minutes | 594 | 2.0% |
| 90 or more Minutes | 1,144 | 3.9% |
Commute Time by Sex in Ponce
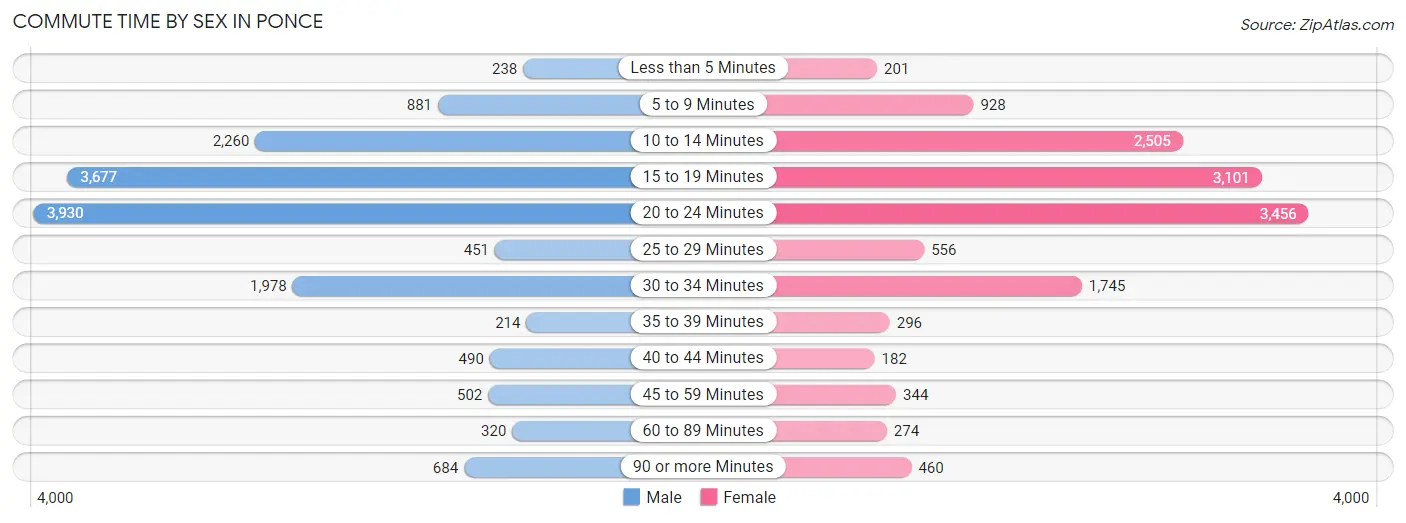
The most common commute times in Ponce are 20 to 24 minutes (3,930 commuters, 25.2%) for males and 20 to 24 minutes (3,456 commuters, 24.6%) for females.
| Commute Time | Male | Female |
| Less than 5 Minutes | 238 (1.5%) | 201 (1.4%) |
| 5 to 9 Minutes | 881 (5.6%) | 928 (6.6%) |
| 10 to 14 Minutes | 2,260 (14.5%) | 2,505 (17.8%) |
| 15 to 19 Minutes | 3,677 (23.5%) | 3,101 (22.1%) |
| 20 to 24 Minutes | 3,930 (25.2%) | 3,456 (24.6%) |
| 25 to 29 Minutes | 451 (2.9%) | 556 (4.0%) |
| 30 to 34 Minutes | 1,978 (12.7%) | 1,745 (12.4%) |
| 35 to 39 Minutes | 214 (1.4%) | 296 (2.1%) |
| 40 to 44 Minutes | 490 (3.1%) | 182 (1.3%) |
| 45 to 59 Minutes | 502 (3.2%) | 344 (2.5%) |
| 60 to 89 Minutes | 320 (2.1%) | 274 (1.9%) |
| 90 or more Minutes | 684 (4.4%) | 460 (3.3%) |
Time of Departure to Work by Sex in Ponce
The most frequent times of departure to work in Ponce are 7:00 AM to 7:29 AM (2,710, 17.3%) for males and 7:00 AM to 7:29 AM (2,754, 19.6%) for females.
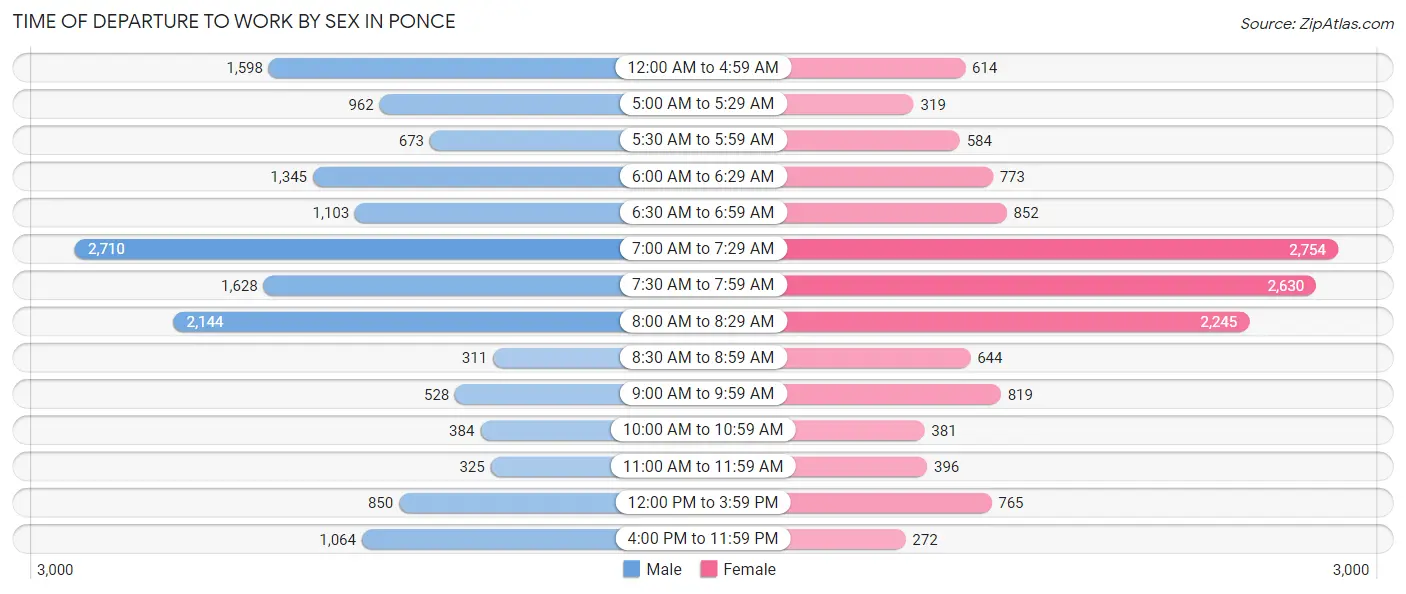
| Time of Departure | Male | Female |
| 12:00 AM to 4:59 AM | 1,598 (10.2%) | 614 (4.4%) |
| 5:00 AM to 5:29 AM | 962 (6.2%) | 319 (2.3%) |
| 5:30 AM to 5:59 AM | 673 (4.3%) | 584 (4.2%) |
| 6:00 AM to 6:29 AM | 1,345 (8.6%) | 773 (5.5%) |
| 6:30 AM to 6:59 AM | 1,103 (7.1%) | 852 (6.1%) |
| 7:00 AM to 7:29 AM | 2,710 (17.3%) | 2,754 (19.6%) |
| 7:30 AM to 7:59 AM | 1,628 (10.4%) | 2,630 (18.7%) |
| 8:00 AM to 8:29 AM | 2,144 (13.7%) | 2,245 (16.0%) |
| 8:30 AM to 8:59 AM | 311 (2.0%) | 644 (4.6%) |
| 9:00 AM to 9:59 AM | 528 (3.4%) | 819 (5.8%) |
| 10:00 AM to 10:59 AM | 384 (2.5%) | 381 (2.7%) |
| 11:00 AM to 11:59 AM | 325 (2.1%) | 396 (2.8%) |
| 12:00 PM to 3:59 PM | 850 (5.4%) | 765 (5.4%) |
| 4:00 PM to 11:59 PM | 1,064 (6.8%) | 272 (1.9%) |
| Total | 15,625 (100.0%) | 14,048 (100.0%) |
Housing Occupancy in Ponce
Occupancy by Ownership in Ponce
Of the total 44,332 dwellings in Ponce, owner-occupied units account for 30,014 (67.7%), while renter-occupied units make up 14,318 (32.3%).
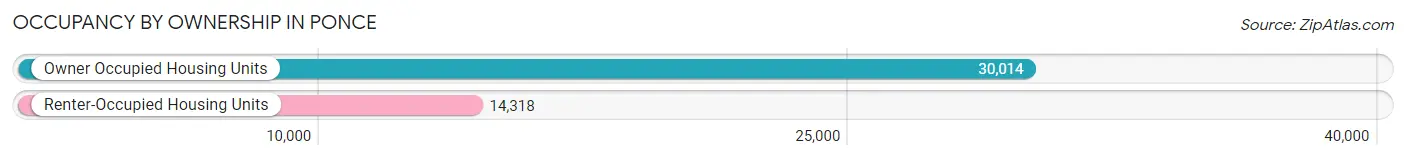
| Occupancy | # Housing Units | % Housing Units |
| Owner Occupied Housing Units | 30,014 | 67.7% |
| Renter-Occupied Housing Units | 14,318 | 32.3% |
| Total Occupied Housing Units | 44,332 | 100.0% |
Occupancy by Household Size in Ponce
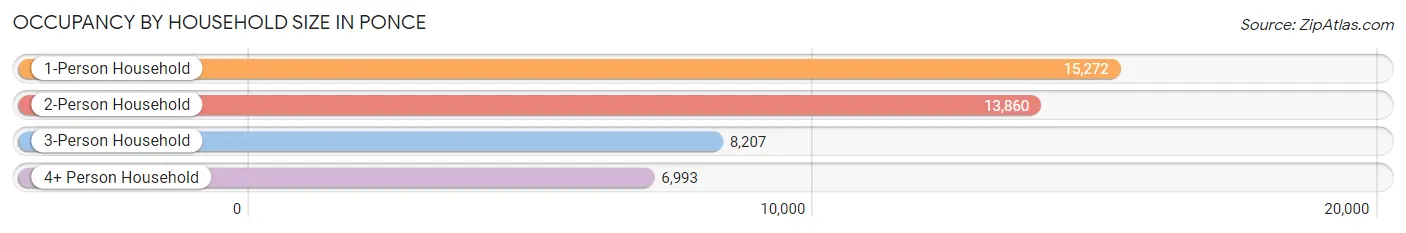
| Household Size | # Housing Units | % Housing Units |
| 1-Person Household | 15,272 | 34.4% |
| 2-Person Household | 13,860 | 31.3% |
| 3-Person Household | 8,207 | 18.5% |
| 4+ Person Household | 6,993 | 15.8% |
| Total Housing Units | 44,332 | 100.0% |
Occupancy by Ownership by Household Size in Ponce
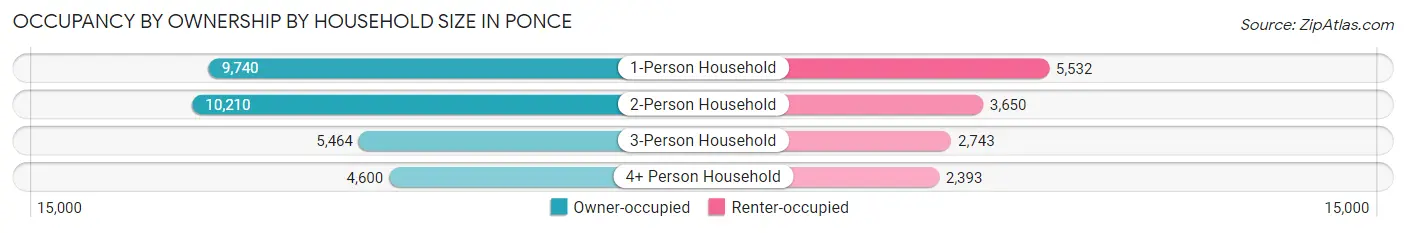
| Household Size | Owner-occupied | Renter-occupied |
| 1-Person Household | 9,740 (63.8%) | 5,532 (36.2%) |
| 2-Person Household | 10,210 (73.7%) | 3,650 (26.3%) |
| 3-Person Household | 5,464 (66.6%) | 2,743 (33.4%) |
| 4+ Person Household | 4,600 (65.8%) | 2,393 (34.2%) |
| Total Housing Units | 30,014 (67.7%) | 14,318 (32.3%) |
Occupancy by Educational Attainment in Ponce
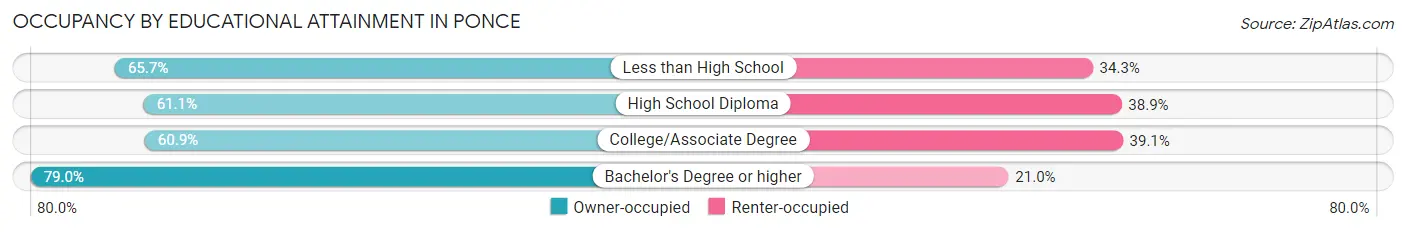
| Household Size | Owner-occupied | Renter-occupied |
| Less than High School | 5,835 (65.7%) | 3,052 (34.3%) |
| High School Diploma | 7,680 (61.1%) | 4,889 (38.9%) |
| College/Associate Degree | 5,311 (60.9%) | 3,408 (39.1%) |
| Bachelor's Degree or higher | 11,188 (79.0%) | 2,969 (21.0%) |
Occupancy by Age of Householder in Ponce
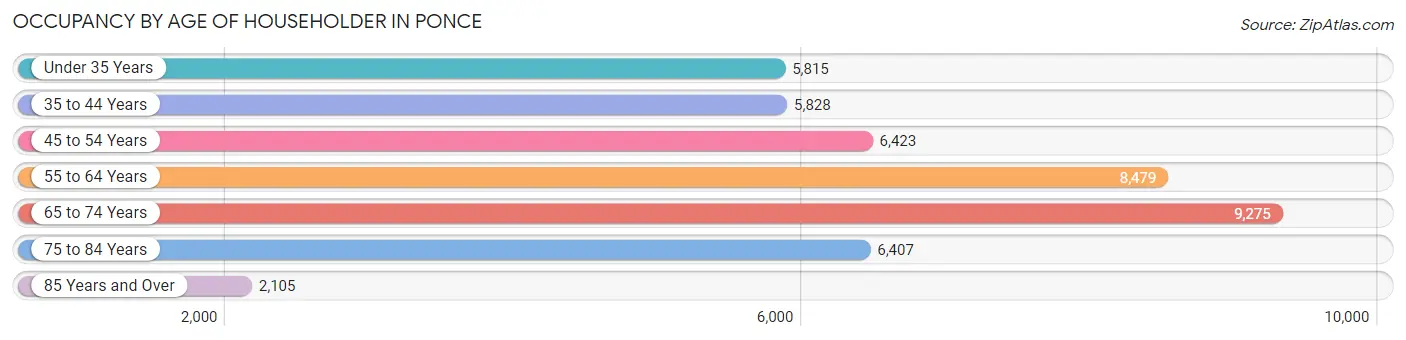
| Age Bracket | # Households | % Households |
| Under 35 Years | 5,815 | 13.1% |
| 35 to 44 Years | 5,828 | 13.2% |
| 45 to 54 Years | 6,423 | 14.5% |
| 55 to 64 Years | 8,479 | 19.1% |
| 65 to 74 Years | 9,275 | 20.9% |
| 75 to 84 Years | 6,407 | 14.4% |
| 85 Years and Over | 2,105 | 4.8% |
| Total | 44,332 | 100.0% |
Housing Finances in Ponce
Median Income by Occupancy in Ponce
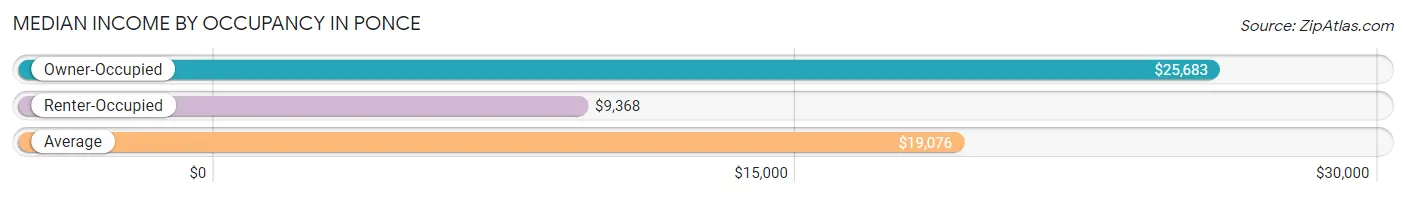
| Occupancy Type | # Households | Median Income |
| Owner-Occupied | 30,014 (67.7%) | $25,683 |
| Renter-Occupied | 14,318 (32.3%) | $9,368 |
| Average | 44,332 (100.0%) | $19,076 |
Occupancy by Householder Income Bracket in Ponce
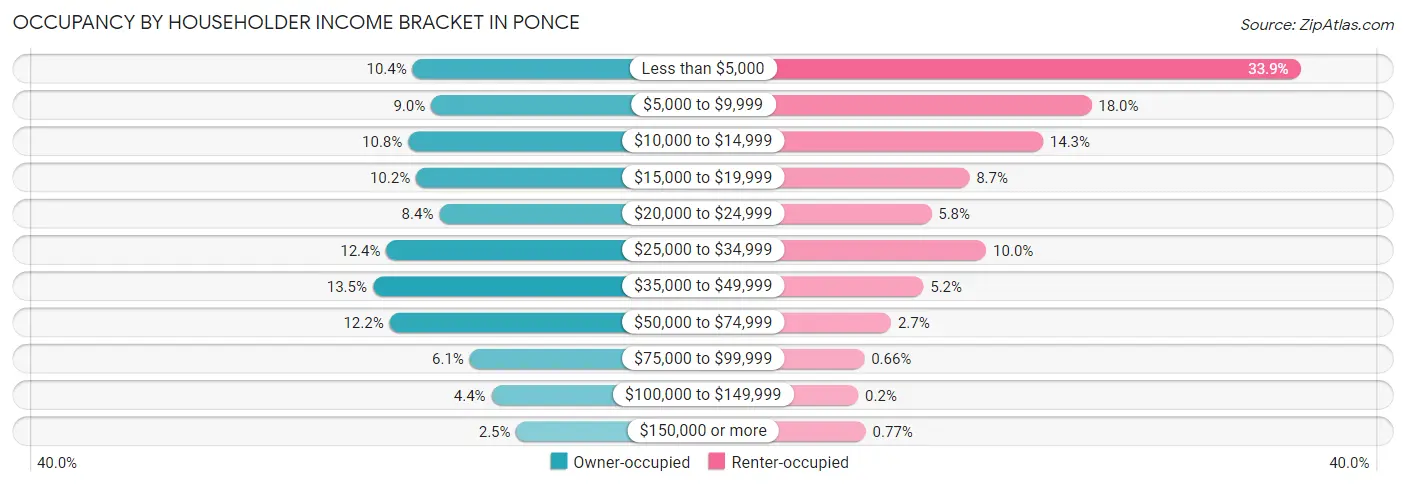
| Income Bracket | Owner-occupied | Renter-occupied |
| Less than $5,000 | 3,133 (10.4%) | 4,852 (33.9%) |
| $5,000 to $9,999 | 2,709 (9.0%) | 2,572 (18.0%) |
| $10,000 to $14,999 | 3,236 (10.8%) | 2,043 (14.3%) |
| $15,000 to $19,999 | 3,056 (10.2%) | 1,240 (8.7%) |
| $20,000 to $24,999 | 2,525 (8.4%) | 826 (5.8%) |
| $25,000 to $34,999 | 3,735 (12.4%) | 1,425 (10.0%) |
| $35,000 to $49,999 | 4,042 (13.5%) | 739 (5.2%) |
| $50,000 to $74,999 | 3,662 (12.2%) | 387 (2.7%) |
| $75,000 to $99,999 | 1,827 (6.1%) | 95 (0.7%) |
| $100,000 to $149,999 | 1,330 (4.4%) | 29 (0.2%) |
| $150,000 or more | 759 (2.5%) | 110 (0.8%) |
| Total | 30,014 (100.0%) | 14,318 (100.0%) |
Monthly Housing Cost Tiers in Ponce
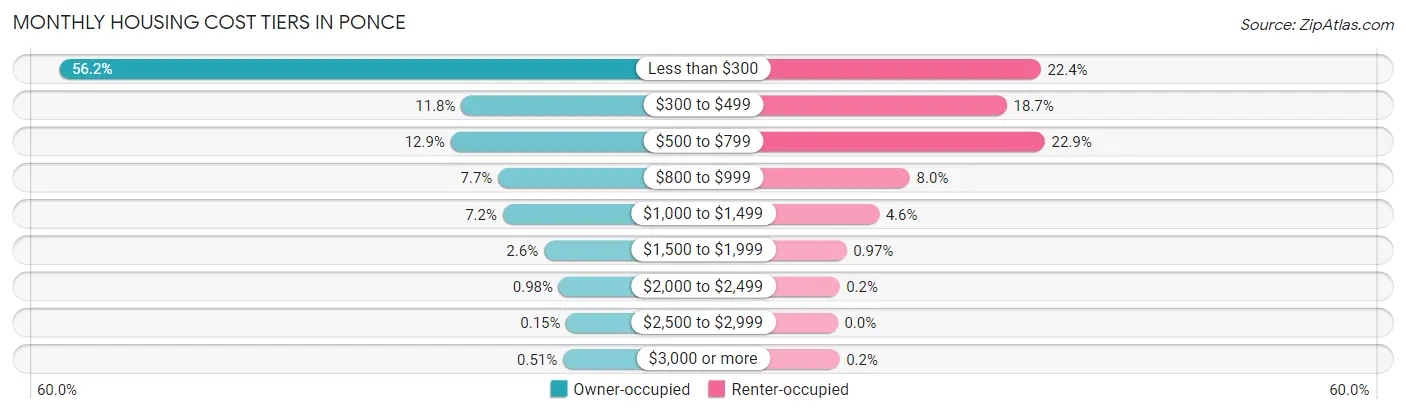
| Monthly Cost | Owner-occupied | Renter-occupied |
| Less than $300 | 16,868 (56.2%) | 3,212 (22.4%) |
| $300 to $499 | 3,528 (11.7%) | 2,674 (18.7%) |
| $500 to $799 | 3,882 (12.9%) | 3,278 (22.9%) |
| $800 to $999 | 2,306 (7.7%) | 1,142 (8.0%) |
| $1,000 to $1,499 | 2,153 (7.2%) | 653 (4.6%) |
| $1,500 to $1,999 | 786 (2.6%) | 139 (1.0%) |
| $2,000 to $2,499 | 293 (1.0%) | 28 (0.2%) |
| $2,500 to $2,999 | 46 (0.2%) | 0 (0.0%) |
| $3,000 or more | 152 (0.5%) | 29 (0.2%) |
| Total | 30,014 (100.0%) | 14,318 (100.0%) |
Physical Housing Characteristics in Ponce
Housing Structures in Ponce
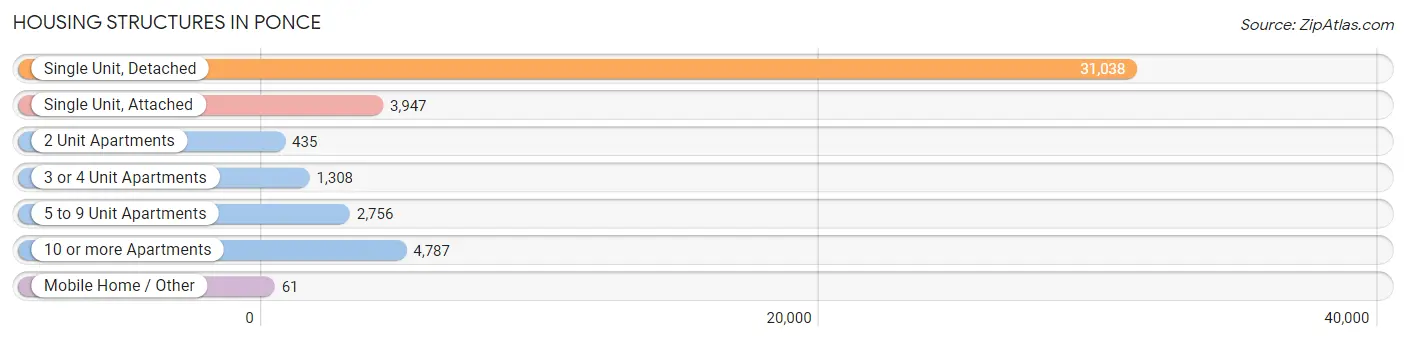
| Structure Type | # Housing Units | % Housing Units |
| Single Unit, Detached | 31,038 | 70.0% |
| Single Unit, Attached | 3,947 | 8.9% |
| 2 Unit Apartments | 435 | 1.0% |
| 3 or 4 Unit Apartments | 1,308 | 2.9% |
| 5 to 9 Unit Apartments | 2,756 | 6.2% |
| 10 or more Apartments | 4,787 | 10.8% |
| Mobile Home / Other | 61 | 0.1% |
| Total | 44,332 | 100.0% |
Housing Structures by Occupancy in Ponce
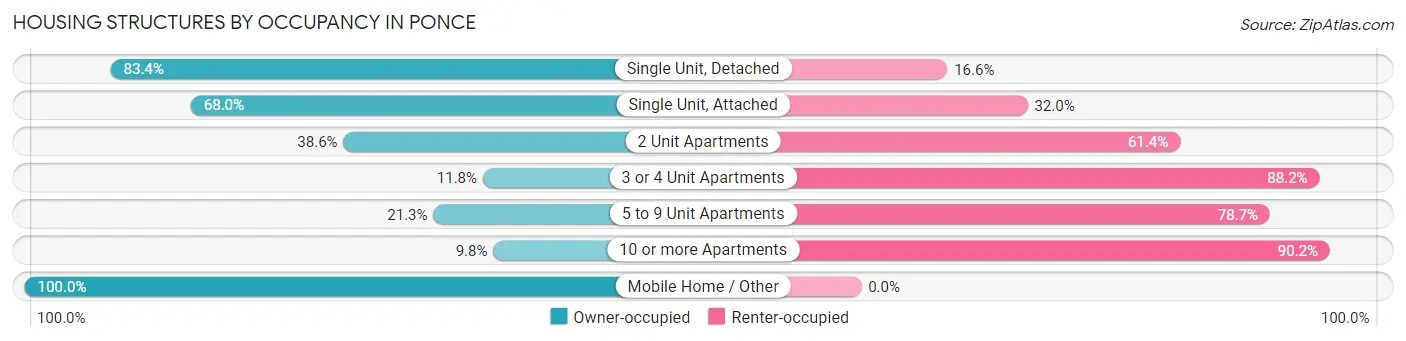
| Structure Type | Owner-occupied | Renter-occupied |
| Single Unit, Detached | 25,894 (83.4%) | 5,144 (16.6%) |
| Single Unit, Attached | 2,683 (68.0%) | 1,264 (32.0%) |
| 2 Unit Apartments | 168 (38.6%) | 267 (61.4%) |
| 3 or 4 Unit Apartments | 154 (11.8%) | 1,154 (88.2%) |
| 5 to 9 Unit Apartments | 587 (21.3%) | 2,169 (78.7%) |
| 10 or more Apartments | 467 (9.8%) | 4,320 (90.2%) |
| Mobile Home / Other | 61 (100.0%) | 0 (0.0%) |
| Total | 30,014 (67.7%) | 14,318 (32.3%) |
Housing Structures by Number of Rooms in Ponce
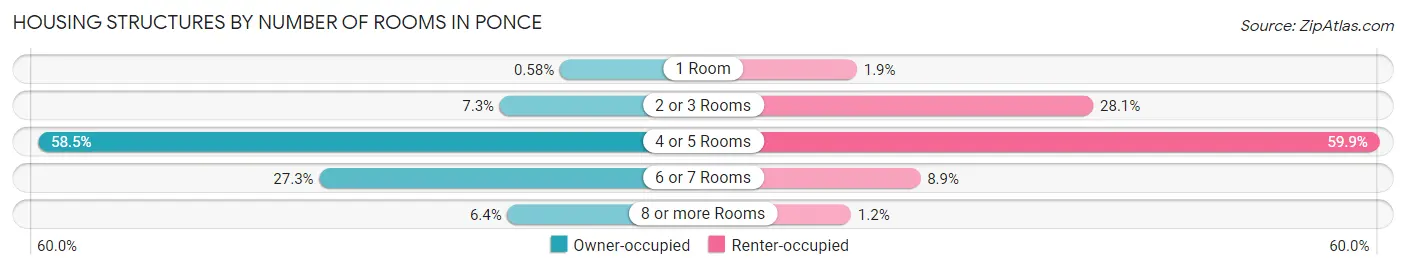
| Number of Rooms | Owner-occupied | Renter-occupied |
| 1 Room | 175 (0.6%) | 268 (1.9%) |
| 2 or 3 Rooms | 2,176 (7.2%) | 4,024 (28.1%) |
| 4 or 5 Rooms | 17,555 (58.5%) | 8,576 (59.9%) |
| 6 or 7 Rooms | 8,187 (27.3%) | 1,276 (8.9%) |
| 8 or more Rooms | 1,921 (6.4%) | 174 (1.2%) |
| Total | 30,014 (100.0%) | 14,318 (100.0%) |
Housing Structure by Heating Type in Ponce
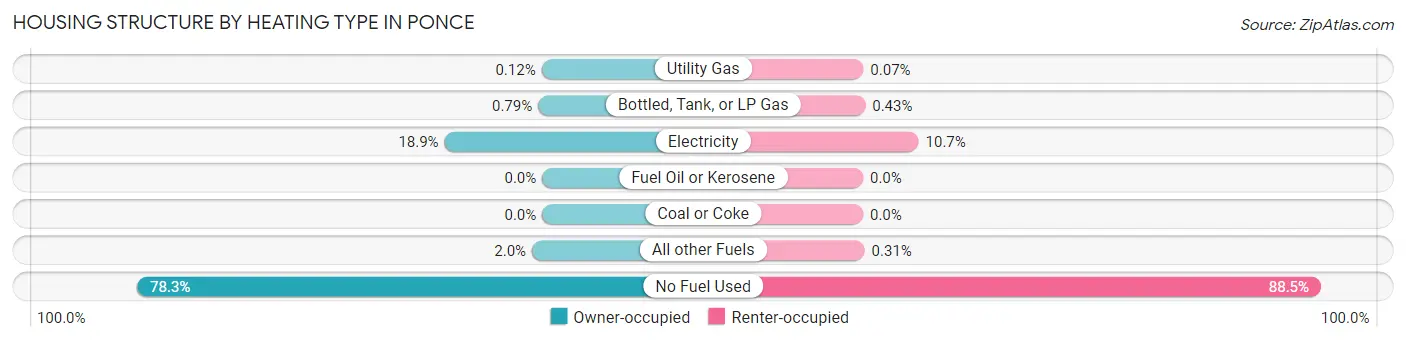
| Heating Type | Owner-occupied | Renter-occupied |
| Utility Gas | 36 (0.1%) | 10 (0.1%) |
| Bottled, Tank, or LP Gas | 238 (0.8%) | 61 (0.4%) |
| Electricity | 5,663 (18.9%) | 1,538 (10.7%) |
| Fuel Oil or Kerosene | 0 (0.0%) | 0 (0.0%) |
| Coal or Coke | 0 (0.0%) | 0 (0.0%) |
| All other Fuels | 588 (2.0%) | 44 (0.3%) |
| No Fuel Used | 23,489 (78.3%) | 12,665 (88.5%) |
| Total | 30,014 (100.0%) | 14,318 (100.0%) |
Household Vehicle Usage in Ponce
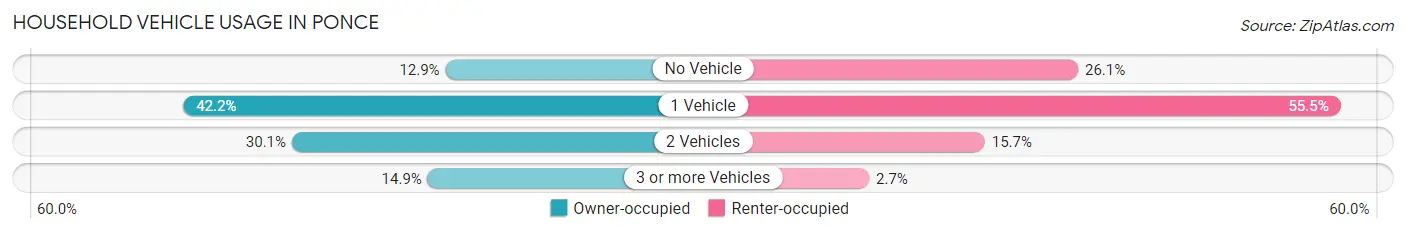
| Vehicles per Household | Owner-occupied | Renter-occupied |
| No Vehicle | 3,861 (12.9%) | 3,738 (26.1%) |
| 1 Vehicle | 12,674 (42.2%) | 7,948 (55.5%) |
| 2 Vehicles | 9,023 (30.1%) | 2,244 (15.7%) |
| 3 or more Vehicles | 4,456 (14.8%) | 388 (2.7%) |
| Total | 30,014 (100.0%) | 14,318 (100.0%) |
Real Estate & Mortgages in Ponce
Real Estate and Mortgage Overview in Ponce
| Characteristic | Without Mortgage | With Mortgage |
| Housing Units | 20,835 | 9,179 |
| Median Property Value | $99,900 | $129,900 |
| Median Household Income | $20,511 | $470 |
| Monthly Housing Costs | $184 | $134 |
| Real Estate Taxes | $645 | $8,349 |
Property Value by Mortgage Status in Ponce
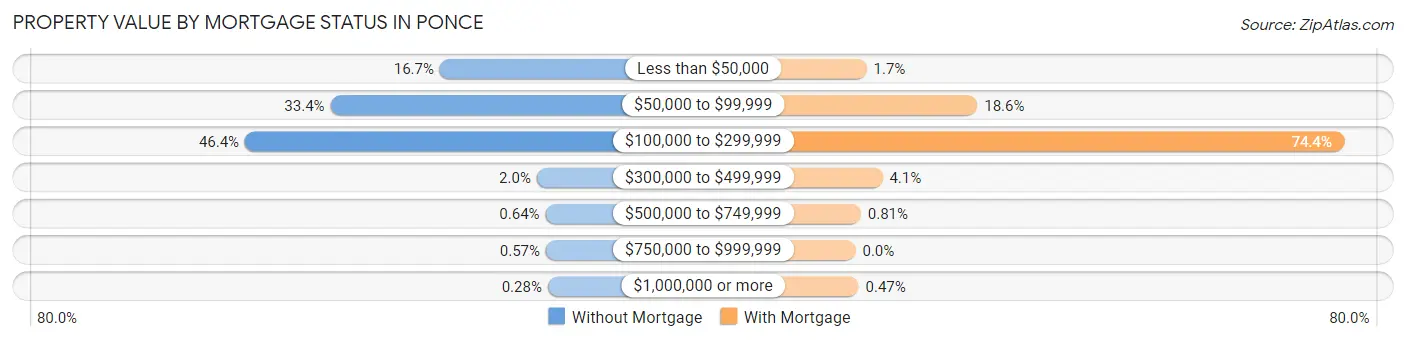
| Property Value | Without Mortgage | With Mortgage |
| Less than $50,000 | 3,486 (16.7%) | 155 (1.7%) |
| $50,000 to $99,999 | 6,959 (33.4%) | 1,703 (18.5%) |
| $100,000 to $299,999 | 9,672 (46.4%) | 6,828 (74.4%) |
| $300,000 to $499,999 | 408 (2.0%) | 376 (4.1%) |
| $500,000 to $749,999 | 133 (0.6%) | 74 (0.8%) |
| $750,000 to $999,999 | 118 (0.6%) | 0 (0.0%) |
| $1,000,000 or more | 59 (0.3%) | 43 (0.5%) |
| Total | 20,835 (100.0%) | 9,179 (100.0%) |
Household Income by Mortgage Status in Ponce
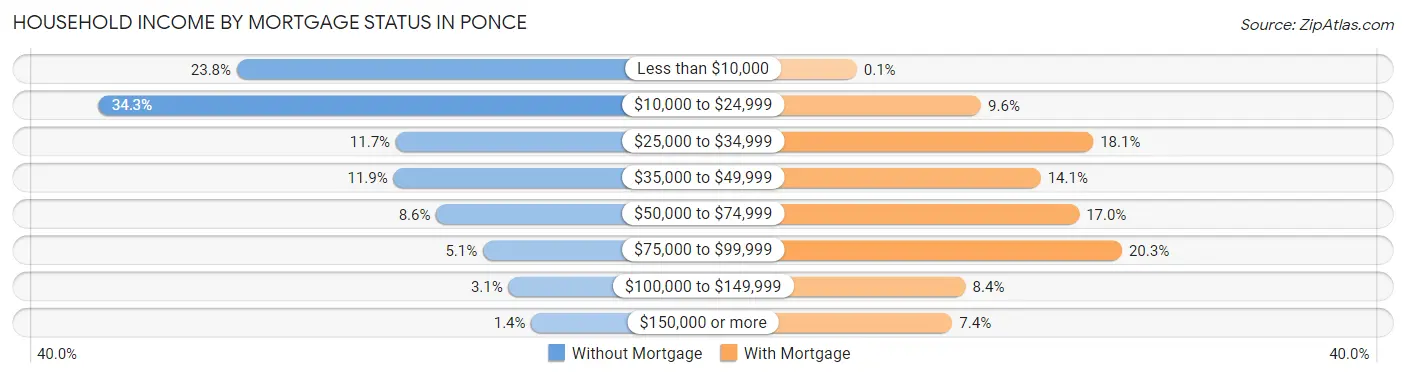
| Household Income | Without Mortgage | With Mortgage |
| Less than $10,000 | 4,964 (23.8%) | 9 (0.1%) |
| $10,000 to $24,999 | 7,155 (34.3%) | 878 (9.6%) |
| $25,000 to $34,999 | 2,440 (11.7%) | 1,662 (18.1%) |
| $35,000 to $49,999 | 2,478 (11.9%) | 1,295 (14.1%) |
| $50,000 to $74,999 | 1,799 (8.6%) | 1,564 (17.0%) |
| $75,000 to $99,999 | 1,057 (5.1%) | 1,863 (20.3%) |
| $100,000 to $149,999 | 653 (3.1%) | 770 (8.4%) |
| $150,000 or more | 289 (1.4%) | 677 (7.4%) |
| Total | 20,835 (100.0%) | 9,179 (100.0%) |
Property Value to Household Income Ratio in Ponce
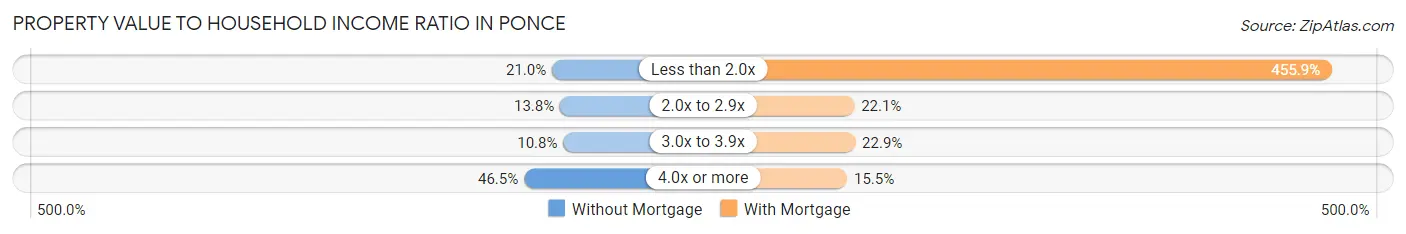
| Value-to-Income Ratio | Without Mortgage | With Mortgage |
| Less than 2.0x | 4,379 (21.0%) | 41,847 (455.9%) |
| 2.0x to 2.9x | 2,877 (13.8%) | 2,025 (22.1%) |
| 3.0x to 3.9x | 2,252 (10.8%) | 2,105 (22.9%) |
| 4.0x or more | 9,686 (46.5%) | 1,425 (15.5%) |
| Total | 20,835 (100.0%) | 9,179 (100.0%) |
Real Estate Taxes by Mortgage Status in Ponce
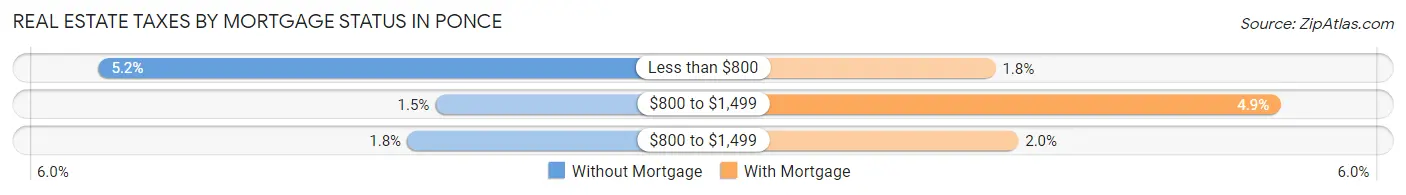
| Property Taxes | Without Mortgage | With Mortgage |
| Less than $800 | 1,081 (5.2%) | 163 (1.8%) |
| $800 to $1,499 | 313 (1.5%) | 451 (4.9%) |
| $800 to $1,499 | 377 (1.8%) | 186 (2.0%) |
| Total | 20,835 (100.0%) | 9,179 (100.0%) |
Health & Disability in Ponce
Health Insurance Coverage by Age in Ponce
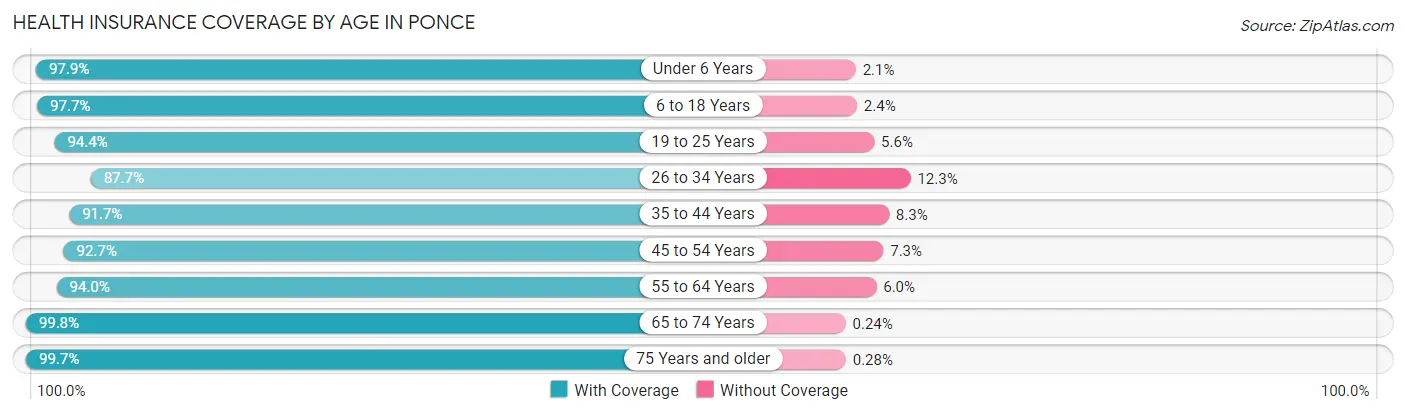
| Age Bracket | With Coverage | Without Coverage |
| Under 6 Years | 5,380 (97.9%) | 117 (2.1%) |
| 6 to 18 Years | 15,851 (97.7%) | 381 (2.4%) |
| 19 to 25 Years | 10,385 (94.4%) | 613 (5.6%) |
| 26 to 34 Years | 10,801 (87.7%) | 1,521 (12.3%) |
| 35 to 44 Years | 10,831 (91.7%) | 983 (8.3%) |
| 45 to 54 Years | 11,386 (92.7%) | 893 (7.3%) |
| 55 to 64 Years | 13,295 (94.0%) | 843 (6.0%) |
| 65 to 74 Years | 13,967 (99.8%) | 34 (0.2%) |
| 75 Years and older | 12,890 (99.7%) | 36 (0.3%) |
| Total | 104,786 (95.1%) | 5,421 (4.9%) |
Health Insurance Coverage by Citizenship Status in Ponce
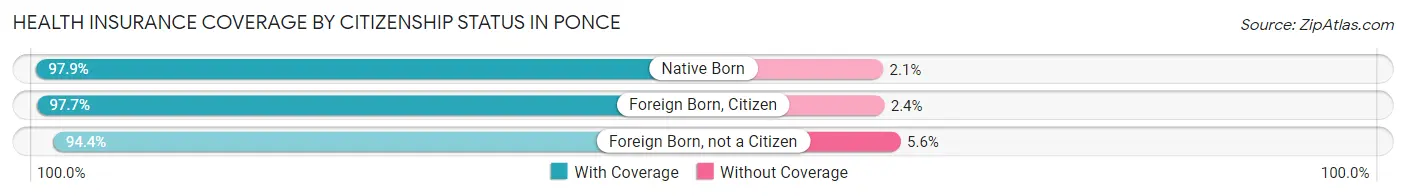
| Citizenship Status | With Coverage | Without Coverage |
| Native Born | 5,380 (97.9%) | 117 (2.1%) |
| Foreign Born, Citizen | 15,851 (97.7%) | 381 (2.4%) |
| Foreign Born, not a Citizen | 10,385 (94.4%) | 613 (5.6%) |
Health Insurance Coverage by Household Income in Ponce
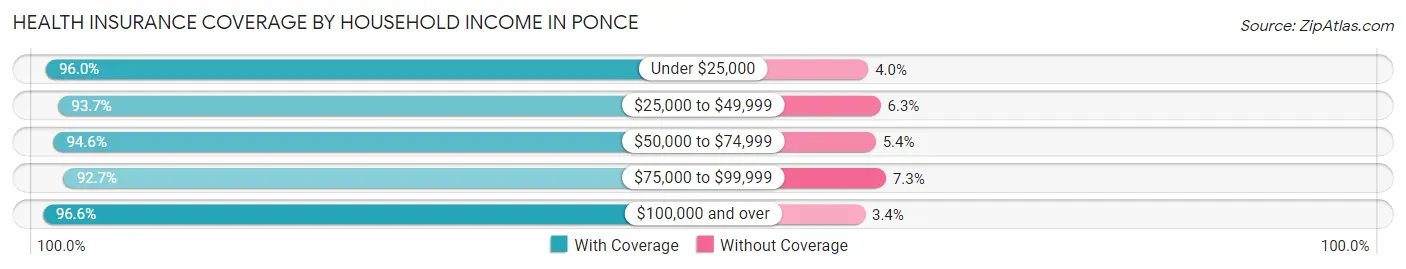
| Household Income | With Coverage | Without Coverage |
| Under $25,000 | 53,595 (96.0%) | 2,238 (4.0%) |
| $25,000 to $49,999 | 25,440 (93.7%) | 1,721 (6.3%) |
| $50,000 to $74,999 | 11,733 (94.6%) | 672 (5.4%) |
| $75,000 to $99,999 | 5,574 (92.7%) | 441 (7.3%) |
| $100,000 and over | 7,758 (96.6%) | 275 (3.4%) |
Public vs Private Health Insurance Coverage by Age in Ponce
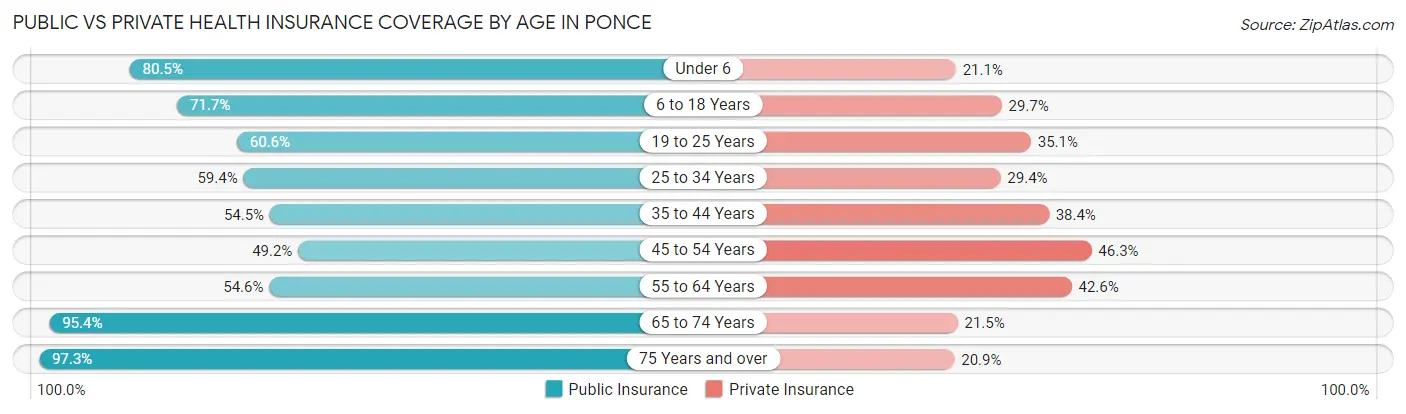
| Age Bracket | Public Insurance | Private Insurance |
| Under 6 | 4,425 (80.5%) | 1,162 (21.1%) |
| 6 to 18 Years | 11,637 (71.7%) | 4,814 (29.7%) |
| 19 to 25 Years | 6,666 (60.6%) | 3,858 (35.1%) |
| 25 to 34 Years | 7,316 (59.4%) | 3,628 (29.4%) |
| 35 to 44 Years | 6,434 (54.5%) | 4,537 (38.4%) |
| 45 to 54 Years | 6,044 (49.2%) | 5,689 (46.3%) |
| 55 to 64 Years | 7,716 (54.6%) | 6,029 (42.6%) |
| 65 to 74 Years | 13,360 (95.4%) | 3,008 (21.5%) |
| 75 Years and over | 12,581 (97.3%) | 2,699 (20.9%) |
| Total | 76,179 (69.1%) | 35,424 (32.1%) |
Disability Status by Sex by Age in Ponce
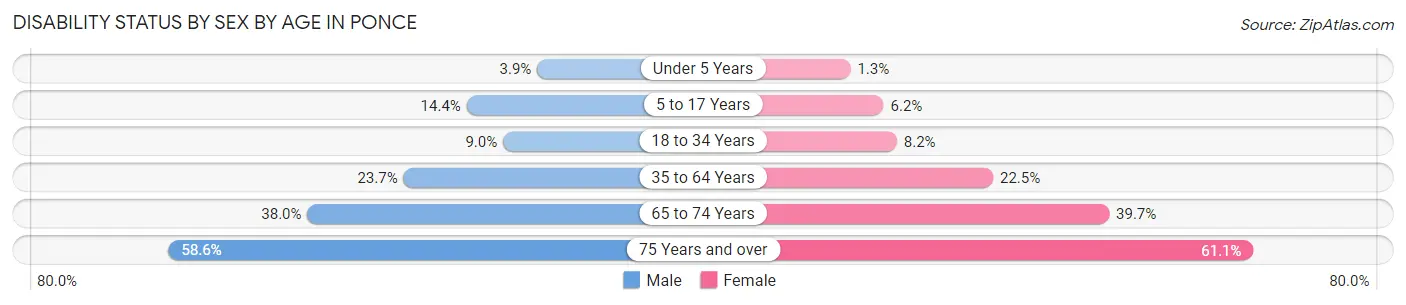
| Age Bracket | Male | Female |
| Under 5 Years | 84 (3.9%) | 27 (1.3%) |
| 5 to 17 Years | 1,161 (14.4%) | 487 (6.2%) |
| 18 to 34 Years | 1,128 (8.9%) | 1,002 (8.2%) |
| 35 to 64 Years | 4,021 (23.7%) | 4,782 (22.5%) |
| 65 to 74 Years | 2,262 (38.0%) | 3,195 (39.7%) |
| 75 Years and over | 3,008 (58.6%) | 4,764 (61.1%) |
Disability Class by Sex by Age in Ponce
Disability Class: Hearing Difficulty
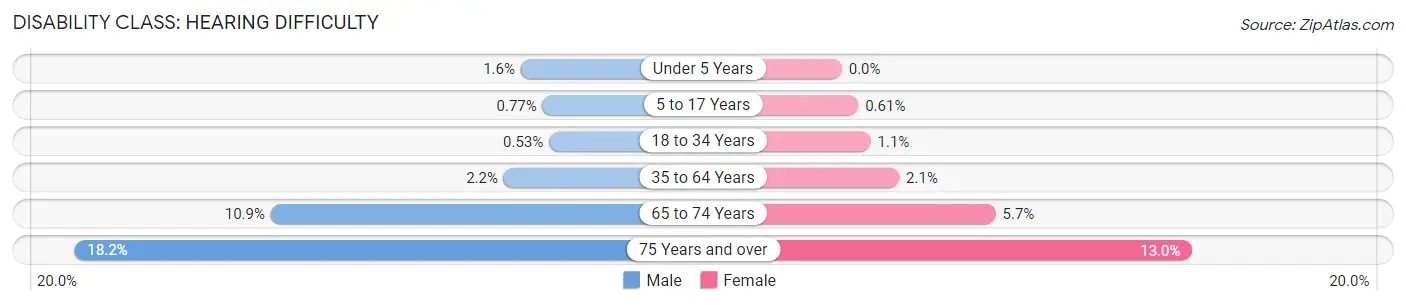
| Age Bracket | Male | Female |
| Under 5 Years | 34 (1.6%) | 0 (0.0%) |
| 5 to 17 Years | 62 (0.8%) | 48 (0.6%) |
| 18 to 34 Years | 67 (0.5%) | 131 (1.1%) |
| 35 to 64 Years | 374 (2.2%) | 453 (2.1%) |
| 65 to 74 Years | 646 (10.9%) | 460 (5.7%) |
| 75 Years and over | 931 (18.1%) | 1,014 (13.0%) |
Disability Class: Vision Difficulty
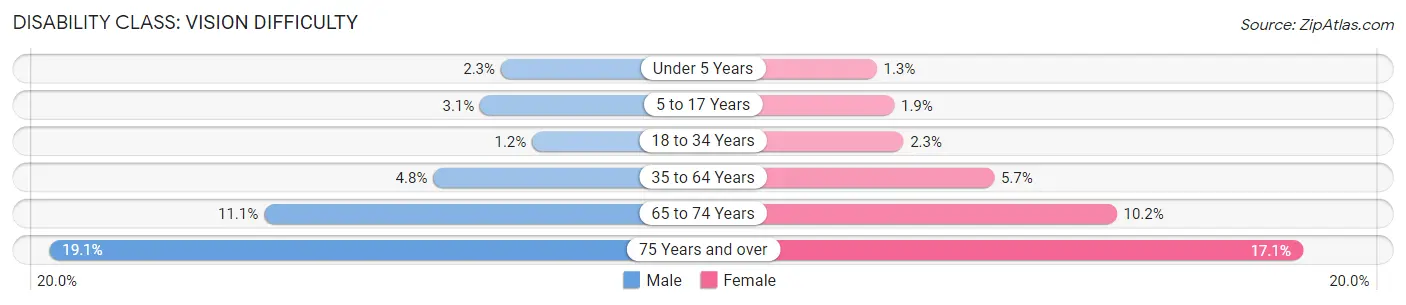
| Age Bracket | Male | Female |
| Under 5 Years | 50 (2.3%) | 27 (1.3%) |
| 5 to 17 Years | 250 (3.1%) | 152 (1.9%) |
| 18 to 34 Years | 146 (1.2%) | 279 (2.3%) |
| 35 to 64 Years | 818 (4.8%) | 1,202 (5.7%) |
| 65 to 74 Years | 661 (11.1%) | 821 (10.2%) |
| 75 Years and over | 979 (19.1%) | 1,334 (17.1%) |
Disability Class: Cognitive Difficulty
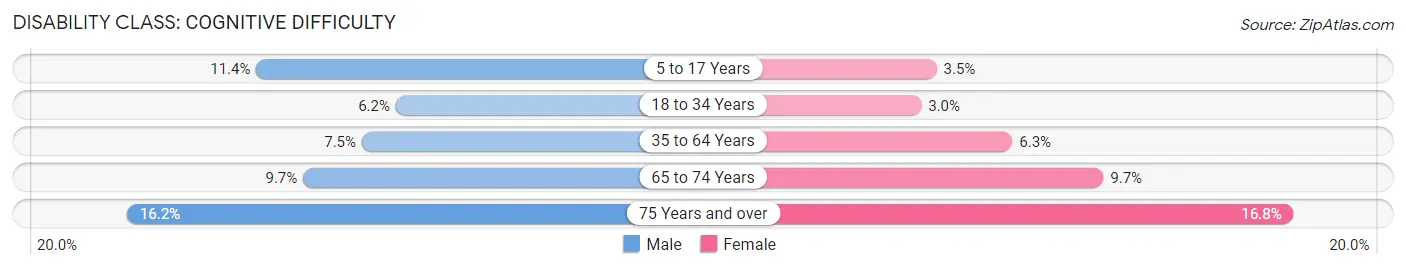
| Age Bracket | Male | Female |
| 5 to 17 Years | 922 (11.4%) | 276 (3.5%) |
| 18 to 34 Years | 784 (6.2%) | 361 (2.9%) |
| 35 to 64 Years | 1,267 (7.5%) | 1,348 (6.3%) |
| 65 to 74 Years | 575 (9.7%) | 782 (9.7%) |
| 75 Years and over | 831 (16.2%) | 1,307 (16.8%) |
Disability Class: Ambulatory Difficulty
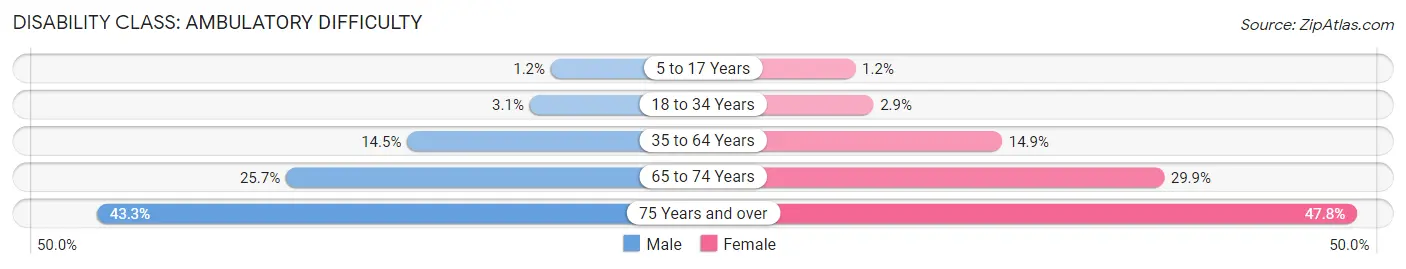
| Age Bracket | Male | Female |
| 5 to 17 Years | 94 (1.2%) | 97 (1.2%) |
| 18 to 34 Years | 393 (3.1%) | 358 (2.9%) |
| 35 to 64 Years | 2,455 (14.5%) | 3,161 (14.8%) |
| 65 to 74 Years | 1,532 (25.7%) | 2,405 (29.9%) |
| 75 Years and over | 2,221 (43.3%) | 3,727 (47.8%) |
Disability Class: Self-Care Difficulty
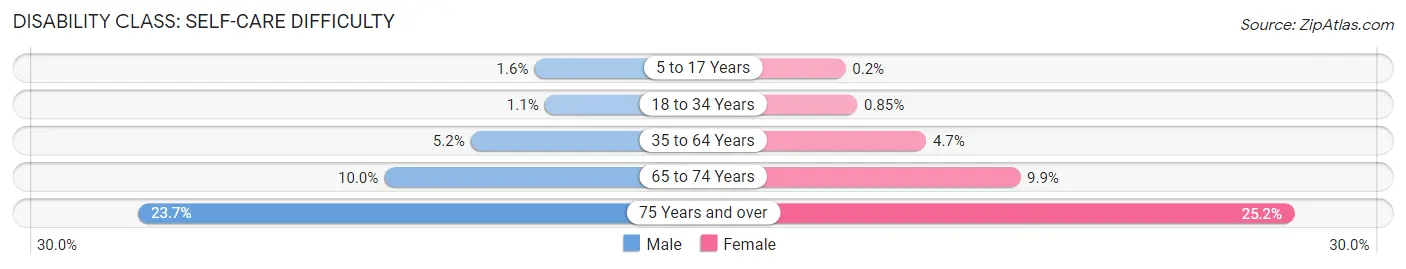
| Age Bracket | Male | Female |
| 5 to 17 Years | 131 (1.6%) | 16 (0.2%) |
| 18 to 34 Years | 133 (1.1%) | 104 (0.9%) |
| 35 to 64 Years | 875 (5.2%) | 999 (4.7%) |
| 65 to 74 Years | 594 (10.0%) | 799 (9.9%) |
| 75 Years and over | 1,215 (23.7%) | 1,962 (25.2%) |
Technology Access in Ponce
Computing Device Access in Ponce
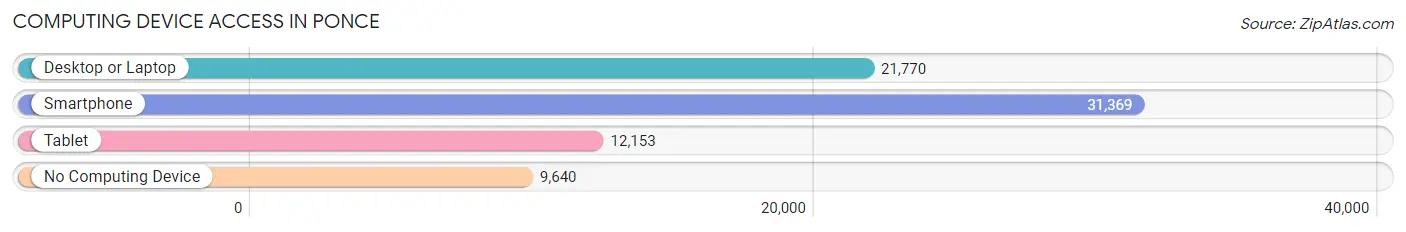
| Device Type | # Households | % Households |
| Desktop or Laptop | 21,770 | 49.1% |
| Smartphone | 31,369 | 70.8% |
| Tablet | 12,153 | 27.4% |
| No Computing Device | 9,640 | 21.7% |
| Total | 44,332 | 100.0% |
Internet Access in Ponce
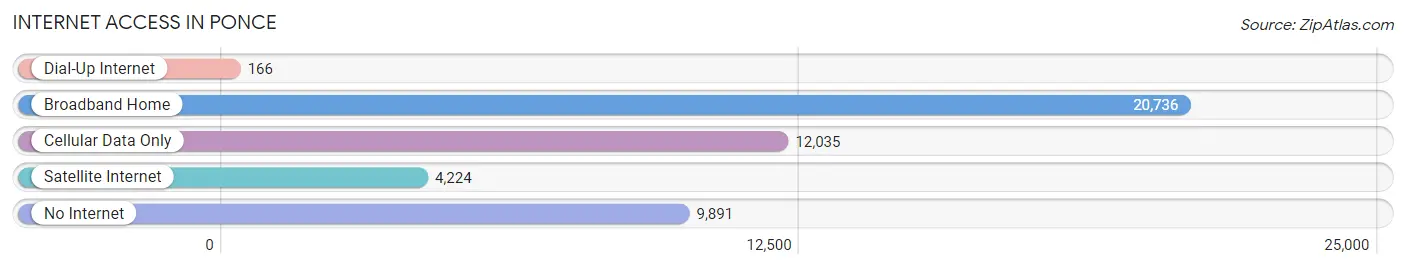
| Internet Type | # Households | % Households |
| Dial-Up Internet | 166 | 0.4% |
| Broadband Home | 20,736 | 46.8% |
| Cellular Data Only | 12,035 | 27.2% |
| Satellite Internet | 4,224 | 9.5% |
| No Internet | 9,891 | 22.3% |
| Total | 44,332 | 100.0% |
Ponce Summary
Ponce is a city located in the southern coast of Puerto Rico, and is the second largest city in the island. It is known as the “Pearl of the South” and is the birthplace of Puerto Rican culture and identity. The city was founded in 1692 by Juan Ponce de Leon, and has since become a major port and commercial center.
Geography
Ponce is located in the southern coast of Puerto Rico, and is bordered by the Caribbean Sea to the south, the Cordillera Central mountain range to the north, and the Caribbean National Forest to the east. The city covers an area of approximately 77 square miles, and is divided into several districts, including the historic downtown area, the beachfront area, and the industrial zone. The city is also home to several rivers, including the Rio Portugues, Rio Bucana, and Rio Cerrillos.
Climate
Ponce has a tropical climate, with temperatures ranging from the mid-70s to the mid-90s throughout the year. The city experiences a wet season from May to November, and a dry season from December to April. The city also experiences occasional hurricanes and tropical storms.
Economy
Ponce is an important economic center in Puerto Rico, and is home to a variety of industries, including manufacturing, tourism, and agriculture. The city is also home to several universities, including the University of Puerto Rico at Ponce, and the Interamerican University of Puerto Rico.
The city is also home to several major companies, including the pharmaceutical company Pfizer, the telecommunications company AT&T, and the banking company Banco Popular. The city is also home to several shopping malls, including Plaza del Caribe and Plaza del Sur.
Demographics
As of the 2010 census, Ponce had a population of 166,327, making it the second largest city in Puerto Rico. The city is home to a diverse population, with the majority of the population being of Hispanic or Latino descent. The city is also home to a large African American population, as well as a small population of Asian Americans.
The city is also home to a variety of religious denominations, including Roman Catholicism, Protestantism, and Judaism. The city is also home to a variety of languages, including Spanish, English, and French.
Conclusion
Ponce is an important city in Puerto Rico, and is home to a diverse population and a variety of industries. The city is known for its rich history and culture, and is an important economic center in the island. The city is also home to several universities, companies, and shopping malls, making it an important destination for tourists and locals alike.
Common Questions
What is Per Capita Income in Ponce?
Per Capita income in Ponce is $14,176.
What is the Median Family Income in Ponce?
Median Family Income in Ponce is $25,050.
What is the Median Household income in Ponce?
Median Household Income in Ponce is $19,076.
What is Income or Wage Gap in Ponce?
Income or Wage Gap in Ponce is 1.4%.
Women in Ponce earn 98.6 cents for every dollar earned by a man.
What is Family Income Deficit in Ponce?
Family Income Deficit in Ponce is $12,264.
Families that are below poverty line in Ponce earn $12,264 less on average than the poverty threshold level.
What is Inequality or Gini Index in Ponce?
Inequality or Gini Index in Ponce is 0.58.
What is the Total Population of Ponce?
Total Population of Ponce is 110,867.
What is the Total Male Population of Ponce?
Total Male Population of Ponce is 51,210.
What is the Total Female Population of Ponce?
Total Female Population of Ponce is 59,657.
What is the Ratio of Males per 100 Females in Ponce?
There are 85.84 Males per 100 Females in Ponce.
What is the Ratio of Females per 100 Males in Ponce?
There are 116.49 Females per 100 Males in Ponce.
What is the Median Population Age in Ponce?
Median Population Age in Ponce is 43.6 Years.
What is the Average Family Size in Ponce
Average Family Size in Ponce is 3.2 People.
What is the Average Household Size in Ponce
Average Household Size in Ponce is 2.5 People.
How Large is the Labor Force in Ponce?
There are 36,012 People in the Labor Forcein in Ponce.
What is the Percentage of People in the Labor Force in Ponce?
38.6% of People are in the Labor Force in Ponce.
What is the Unemployment Rate in Ponce?
Unemployment Rate in Ponce is 12.7%.