Area Code 939 Map & Demographics
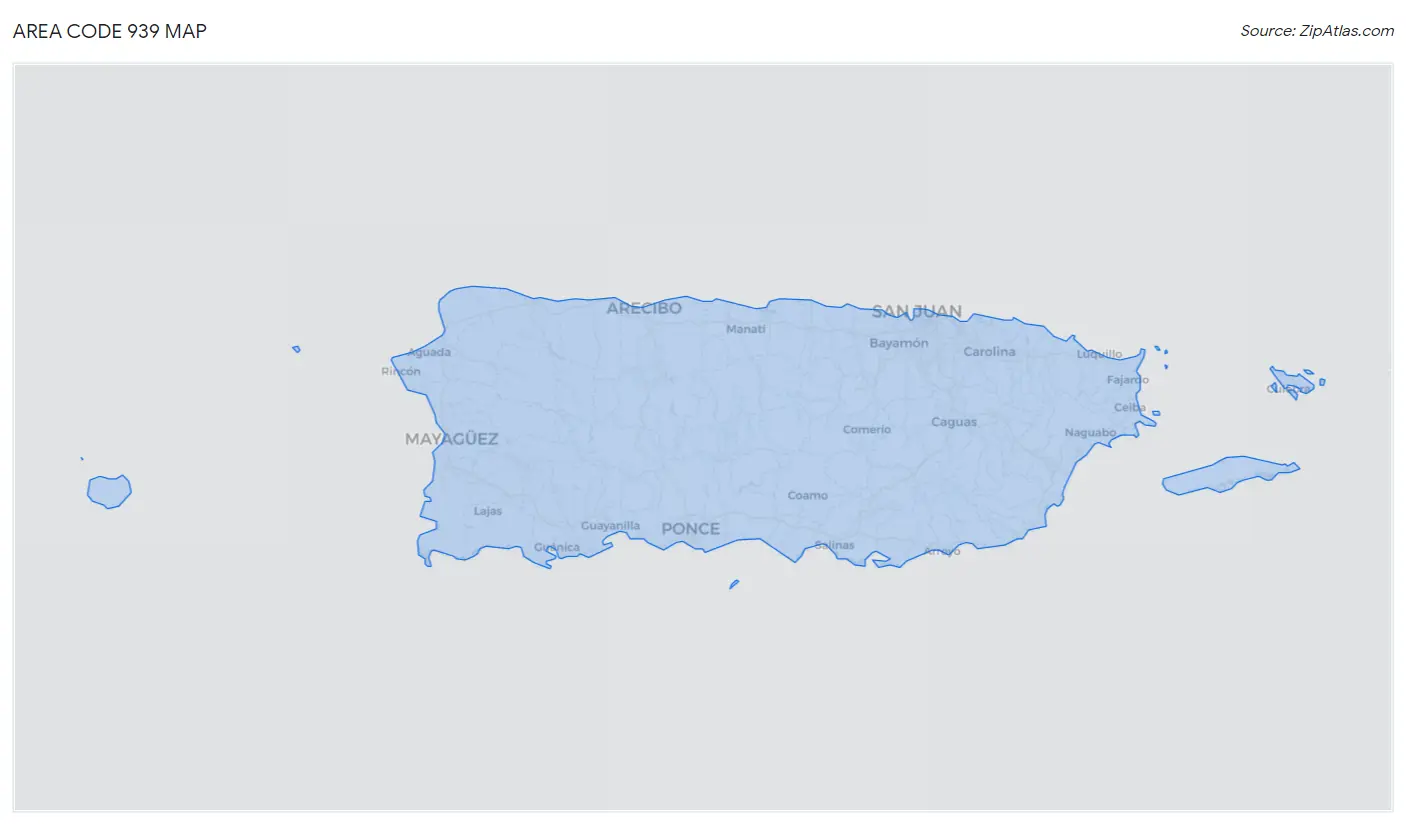
Area Code 939 Map
Area Code 939 Overview
$18,112
PER CAPITA INCOME
$33,910
AVG FAMILY INCOME
$26,584
AVG HOUSEHOLD INCOME
10.4%
WAGE / INCOME GAP [ % ]
89.6¢/ $1
WAGE / INCOME GAP [ $ ]
$11,334
FAMILY INCOME DEFICIT
25.91
INEQUALITY / GINI INDEX
1,462,252
TOTAL POPULATION
685,396
MALE POPULATION
776,856
FEMALE POPULATION
88.23
MALES / 100 FEMALES
113.34
FEMALES / 100 MALES
44.4
MEDIAN AGE
3.3
AVG FAMILY SIZE
2.6
AVG HOUSEHOLD SIZE
570,622
LABOR FORCE [ PEOPLE ]
45.7%
PERCENT IN LABOR FORCE
13.6%
UNEMPLOYMENT RATE
Nearby Area Codes
Income in Area Code 939
Income Overview in Area Code 939
Per Capita Income in Area Code 939 is $18,112, while median incomes of families and households are $33,910 and $26,584 respectively.
| Characteristic | Number | Measure |
| Per Capita Income | 1,462,252 | $18,112 |
| Median Family Income | 358,972 | $33,910 |
| Mean Family Income | 358,972 | $2,454,251 |
| Median Household Income | 557,993 | $26,584 |
| Mean Household Income | 557,993 | $2,039,619 |
| Income Deficit | 358,972 | $11,334 |
| Wage / Income Gap (%) | 1,462,252 | 10.38% |
| Wage / Income Gap ($) | 1,462,252 | 89.62¢ per $1 |
| Gini / Inequality Index | 1,462,252 | 25.91 |
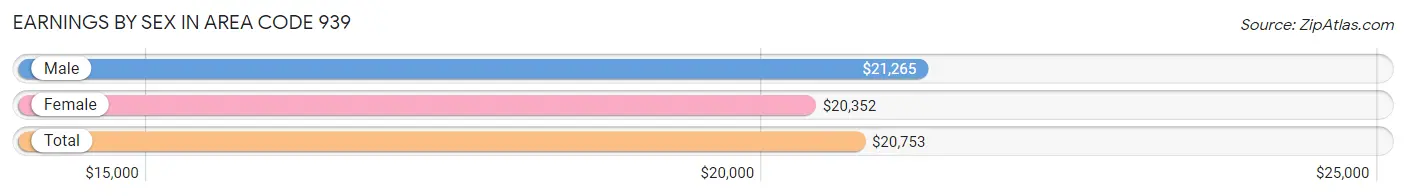
Earnings by Sex in Area Code 939
Average Earnings in Area Code 939 are $20,753, $21,265 for men and $20,352 for women, a difference of 4.3%.
| Sex | Number | Average Earnings |
| Male | 283,358 (51.5%) | $21,265 |
| Female | 266,663 (48.5%) | $20,352 |
| Total | 550,021 (100.0%) | $20,753 |
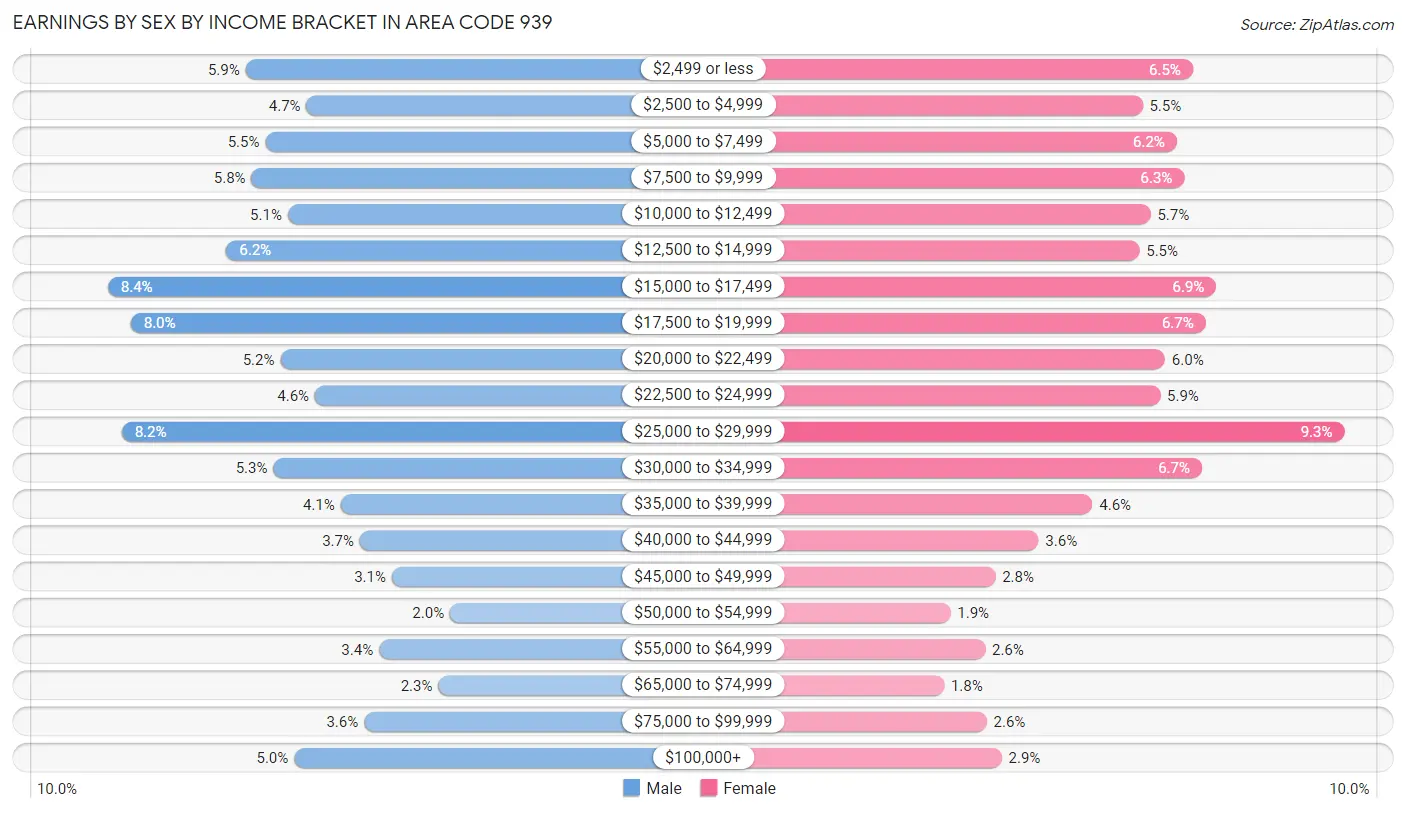
Earnings by Sex by Income Bracket in Area Code 939
The most common earnings brackets in Area Code 939 are $15,000 to $17,499 for men (23,904 | 8.4%) and $25,000 to $29,999 for women (24,866 | 9.3%).
| Income | Male | Female |
| $2,499 or less | 16,606 (5.9%) | 17,290 (6.5%) |
| $2,500 to $4,999 | 13,383 (4.7%) | 14,780 (5.5%) |
| $5,000 to $7,499 | 15,558 (5.5%) | 16,482 (6.2%) |
| $7,500 to $9,999 | 16,280 (5.8%) | 16,858 (6.3%) |
| $10,000 to $12,499 | 14,370 (5.1%) | 15,184 (5.7%) |
| $12,500 to $14,999 | 17,632 (6.2%) | 14,604 (5.5%) |
| $15,000 to $17,499 | 23,904 (8.4%) | 18,444 (6.9%) |
| $17,500 to $19,999 | 22,707 (8.0%) | 17,929 (6.7%) |
| $20,000 to $22,499 | 14,763 (5.2%) | 15,905 (6.0%) |
| $22,500 to $24,999 | 12,909 (4.6%) | 15,651 (5.9%) |
| $25,000 to $29,999 | 23,189 (8.2%) | 24,866 (9.3%) |
| $30,000 to $34,999 | 15,121 (5.3%) | 17,733 (6.7%) |
| $35,000 to $39,999 | 11,552 (4.1%) | 12,276 (4.6%) |
| $40,000 to $44,999 | 10,540 (3.7%) | 9,580 (3.6%) |
| $45,000 to $49,999 | 8,836 (3.1%) | 7,400 (2.8%) |
| $50,000 to $54,999 | 5,756 (2.0%) | 5,184 (1.9%) |
| $55,000 to $64,999 | 9,519 (3.4%) | 6,913 (2.6%) |
| $65,000 to $74,999 | 6,387 (2.2%) | 4,859 (1.8%) |
| $75,000 to $99,999 | 10,322 (3.6%) | 6,986 (2.6%) |
| $100,000+ | 14,024 (5.0%) | 7,739 (2.9%) |
| Total | 283,358 (100.0%) | 266,663 (100.0%) |
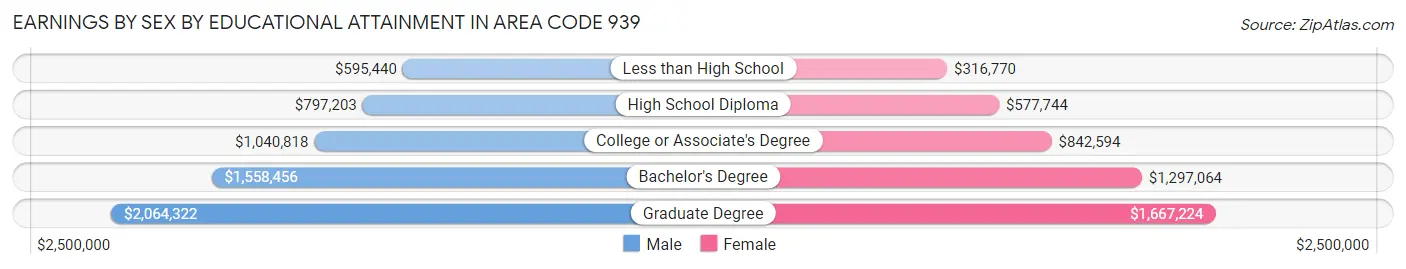
Earnings by Sex by Educational Attainment in Area Code 939
Average earnings in Area Code 939 are $1,123,559 for men and $1,075,164 for women, a difference of 4.3%. Men with an educational attainment of graduate degree enjoy the highest average annual earnings of $2,064,322, while those with less than high school education earn the least with $595,440. Women with an educational attainment of graduate degree earn the most with the average annual earnings of $1,667,224, while those with less than high school education have the smallest earnings of $316,770.
| Educational Attainment | Male Income | Female Income |
| Less than High School | $595,440 | $316,770 |
| High School Diploma | $797,203 | $577,744 |
| College or Associate's Degree | $1,040,818 | $842,594 |
| Bachelor's Degree | $1,558,456 | $1,297,064 |
| Graduate Degree | $2,064,322 | $1,667,224 |
| Total | $1,123,559 | $1,075,164 |
Family Income in Area Code 939
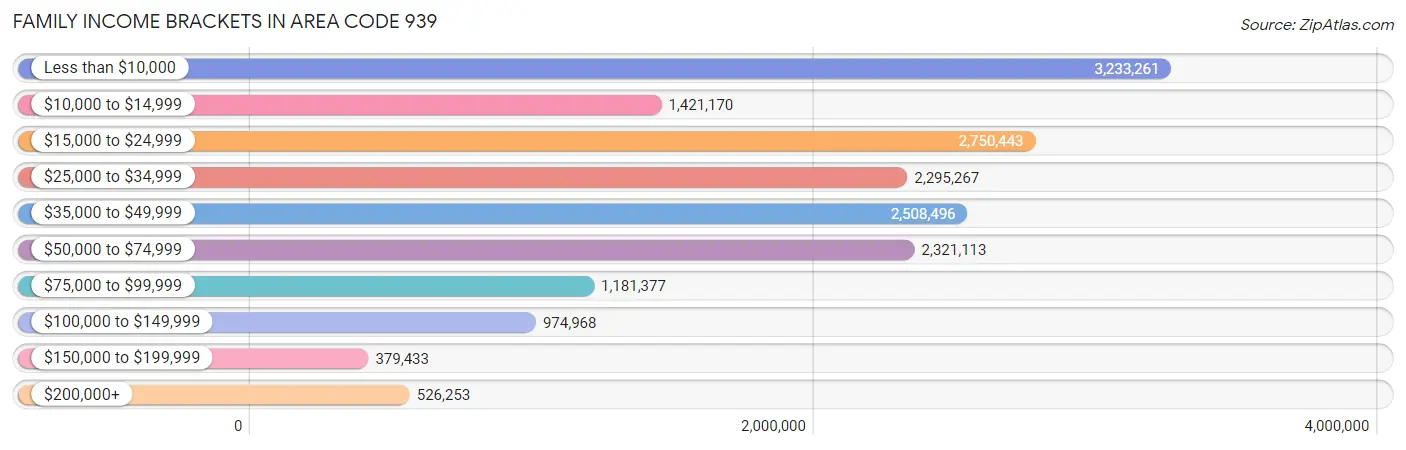
Family Income Brackets in Area Code 939
According to the Area Code 939 family income data, there are 3,233,261 families falling into the less than $10,000 income range, which is the most common income bracket and makes up 900.7% of all families. Conversely, the $150,000 to $199,999 income bracket is the least frequent group with only 379,433 families (105.7%) belonging to this category.
| Income Bracket | # Families | % Families |
| Less than $10,000 | 3,233,261 | 900.7% |
| $10,000 to $14,999 | 1,421,170 | 395.9% |
| $15,000 to $24,999 | 2,750,443 | 766.2% |
| $25,000 to $34,999 | 2,295,267 | 639.4% |
| $35,000 to $49,999 | 2,508,496 | 698.8% |
| $50,000 to $74,999 | 2,321,113 | 646.6% |
| $75,000 to $99,999 | 1,181,377 | 329.1% |
| $100,000 to $149,999 | 974,968 | 271.6% |
| $150,000 to $199,999 | 379,433 | 105.7% |
| $200,000+ | 526,253 | 146.6% |
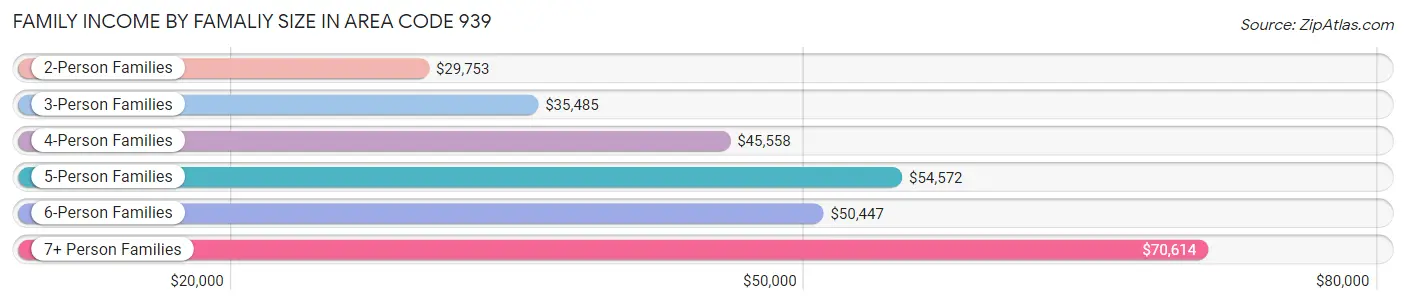
Family Income by Famaliy Size in Area Code 939
7+ person families (1,872 | 0.5%) account for the highest median family income in Area Code 939 with $70,614 per family, while 2-person families (177,302 | 49.4%) have the highest median income of $14,877 per family member.
| Income Bracket | # Families | Median Income |
| 2-Person Families | 177,302 (49.4%) | $29,753 |
| 3-Person Families | 103,663 (28.9%) | $35,485 |
| 4-Person Families | 55,073 (15.3%) | $45,558 |
| 5-Person Families | 17,204 (4.8%) | $54,572 |
| 6-Person Families | 3,858 (1.1%) | $50,447 |
| 7+ Person Families | 1,872 (0.5%) | $70,614 |
| Total | 358,972 (100.0%) | $33,910 |
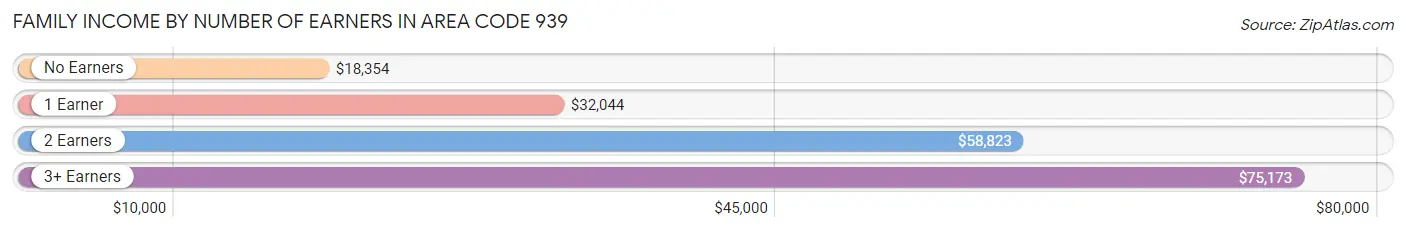
Family Income by Number of Earners in Area Code 939
The median family income in Area Code 939 is $33,910, with families comprising 3+ earners (18,596) having the highest median family income of $75,173, while families with no earners (121,055) have the lowest median family income of $18,354, accounting for 5.2% and 33.7% of families, respectively.
| Number of Earners | # Families | Median Income |
| No Earners | 121,055 (33.7%) | $18,354 |
| 1 Earner | 134,467 (37.5%) | $32,044 |
| 2 Earners | 84,854 (23.6%) | $58,823 |
| 3+ Earners | 18,596 (5.2%) | $75,173 |
| Total | 358,972 (100.0%) | $33,910 |
Household Income in Area Code 939
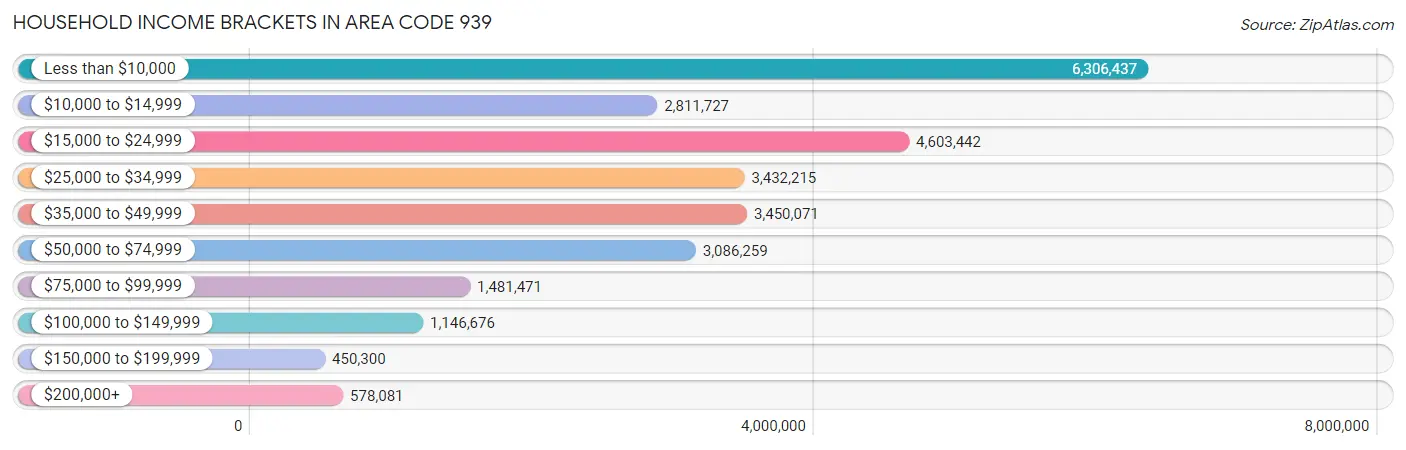
Household Income Brackets in Area Code 939
With 6,306,437 households falling in the category, the less than $10,000 income range is the most frequent in Area Code 939, accounting for 1,130.2% of all households. In contrast, only 450,300 households (80.7%) fall into the $150,000 to $199,999 income bracket, making it the least populous group.
| Income Bracket | # Households | % Households |
| Less than $10,000 | 6,306,437 | 1,130.2% |
| $10,000 to $14,999 | 2,811,727 | 503.9% |
| $15,000 to $24,999 | 4,603,442 | 825.0% |
| $25,000 to $34,999 | 3,432,215 | 615.1% |
| $35,000 to $49,999 | 3,450,071 | 618.3% |
| $50,000 to $74,999 | 3,086,259 | 553.1% |
| $75,000 to $99,999 | 1,481,471 | 265.5% |
| $100,000 to $149,999 | 1,146,676 | 205.5% |
| $150,000 to $199,999 | 450,300 | 80.7% |
| $200,000+ | 578,081 | 103.6% |
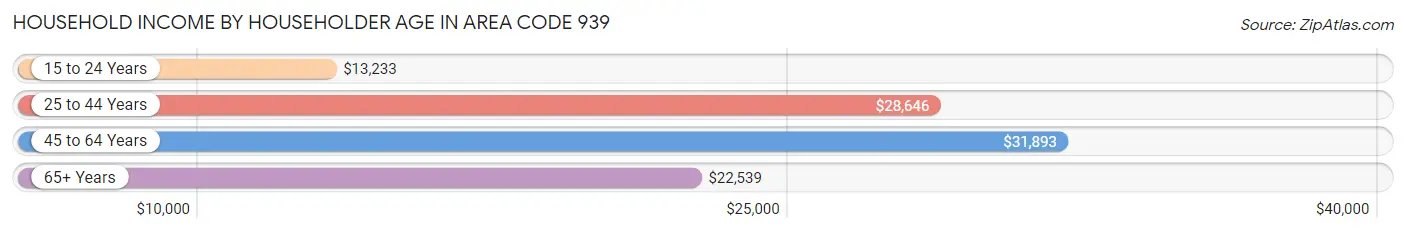
Household Income by Householder Age in Area Code 939
The median household income in Area Code 939 is $26,584, with the highest median household income of $31,893 found in the 45 to 64 years age bracket for the primary householder. A total of 206,519 households (37.0%) fall into this category. Meanwhile, the 15 to 24 years age bracket for the primary householder has the lowest median household income of $13,233, with 10,696 households (1.9%) in this group.
| Income Bracket | # Households | Median Income |
| 15 to 24 Years | 10,696 (1.9%) | $13,233 |
| 25 to 44 Years | 133,018 (23.8%) | $28,646 |
| 45 to 64 Years | 206,519 (37.0%) | $31,893 |
| 65+ Years | 207,760 (37.2%) | $22,539 |
| Total | 557,993 (100.0%) | $26,584 |
Poverty in Area Code 939
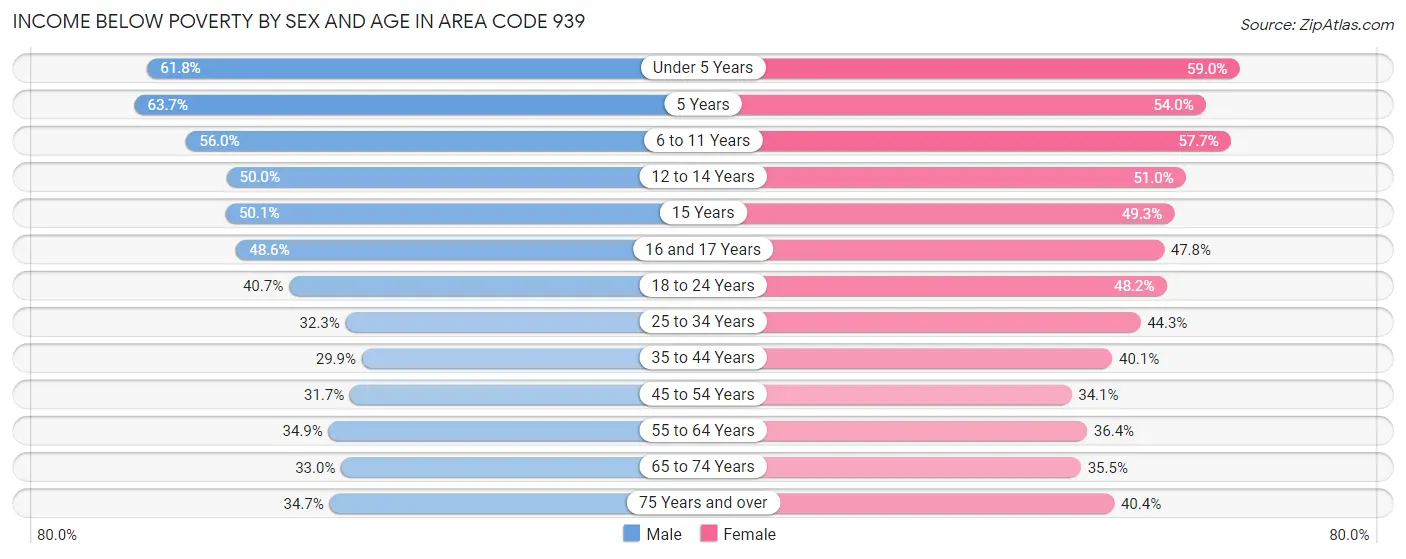
Income Below Poverty by Sex and Age in Area Code 939
With 37.7% poverty level for males and 41.8% for females among the residents of Area Code 939, 5 year old males and under 5 year old females are the most vulnerable to poverty, with 3,942 males (63.7%) and 14,318 females (59.0%) in their respective age groups living below the poverty level.
| Age Bracket | Male | Female |
| Under 5 Years | 15,778 (61.8%) | 14,318 (59.0%) |
| 5 Years | 3,942 (63.7%) | 3,404 (54.0%) |
| 6 to 11 Years | 24,174 (56.0%) | 24,060 (57.7%) |
| 12 to 14 Years | 12,399 (50.0%) | 12,433 (51.0%) |
| 15 Years | 3,966 (50.1%) | 3,835 (49.3%) |
| 16 and 17 Years | 8,737 (48.5%) | 8,366 (47.8%) |
| 18 to 24 Years | 28,873 (40.7%) | 31,918 (48.2%) |
| 25 to 34 Years | 29,734 (32.3%) | 42,395 (44.3%) |
| 35 to 44 Years | 23,976 (29.9%) | 36,745 (40.1%) |
| 45 to 54 Years | 26,819 (31.7%) | 33,664 (34.1%) |
| 55 to 64 Years | 30,595 (34.9%) | 39,489 (36.4%) |
| 65 to 74 Years | 24,291 (33.0%) | 33,826 (35.5%) |
| 75 Years and over | 22,112 (34.7%) | 37,550 (40.4%) |
| Total | 255,396 (37.7%) | 322,003 (41.8%) |
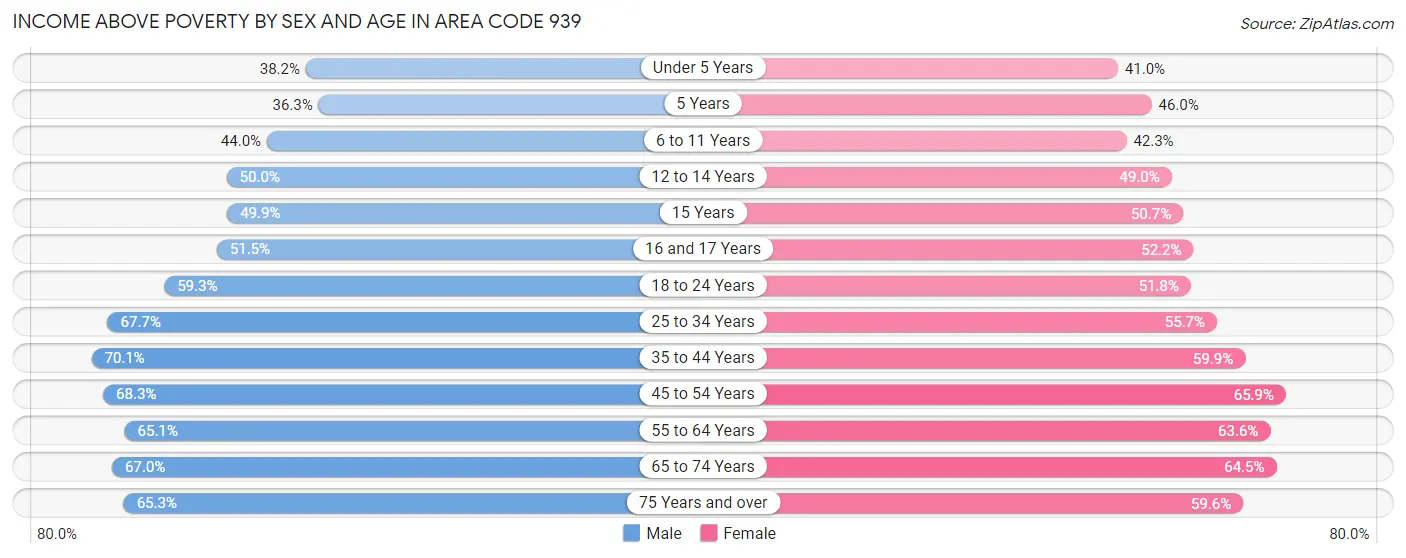
Income Above Poverty by Sex and Age in Area Code 939
According to the poverty statistics in Area Code 939, males aged 35 to 44 years and females aged 45 to 54 years are the age groups that are most secure financially, with 70.1% of males and 65.9% of females in these age groups living above the poverty line.
| Age Bracket | Male | Female |
| Under 5 Years | 9,771 (38.2%) | 9,948 (41.0%) |
| 5 Years | 2,250 (36.3%) | 2,899 (46.0%) |
| 6 to 11 Years | 19,007 (44.0%) | 17,620 (42.3%) |
| 12 to 14 Years | 12,392 (50.0%) | 11,931 (49.0%) |
| 15 Years | 3,951 (49.9%) | 3,937 (50.7%) |
| 16 and 17 Years | 9,258 (51.4%) | 9,132 (52.2%) |
| 18 to 24 Years | 42,006 (59.3%) | 34,335 (51.8%) |
| 25 to 34 Years | 62,248 (67.7%) | 53,282 (55.7%) |
| 35 to 44 Years | 56,124 (70.1%) | 54,817 (59.9%) |
| 45 to 54 Years | 57,872 (68.3%) | 65,117 (65.9%) |
| 55 to 64 Years | 57,174 (65.1%) | 68,994 (63.6%) |
| 65 to 74 Years | 49,355 (67.0%) | 61,513 (64.5%) |
| 75 Years and over | 41,568 (65.3%) | 55,350 (59.6%) |
| Total | 422,976 (62.4%) | 448,875 (58.2%) |
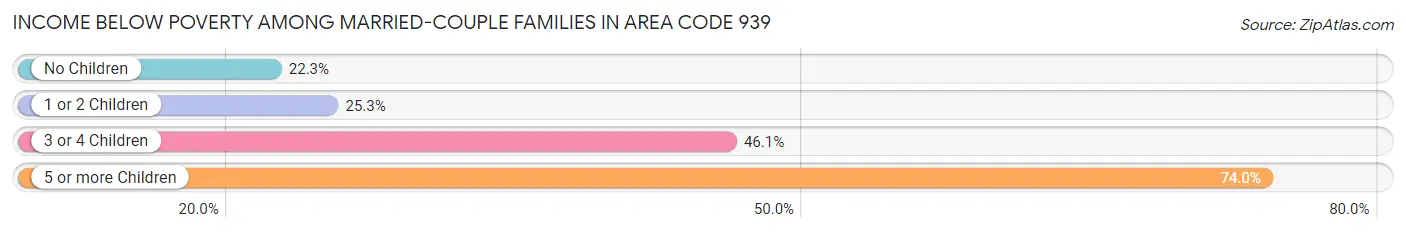
Income Below Poverty Among Married-Couple Families in Area Code 939
The poverty statistics for married-couple families in Area Code 939 show that 23.6% or 46,196 of the total 195,317 families live below the poverty line. Families with 5 or more children have the highest poverty rate of 74.0%, comprising of 174 families. On the other hand, families with no children have the lowest poverty rate of 22.3%, which includes 31,399 families.
| Children | Above Poverty | Below Poverty |
| No Children | 109,477 (77.7%) | 31,399 (22.3%) |
| 1 or 2 Children | 37,164 (74.8%) | 12,557 (25.3%) |
| 3 or 4 Children | 2,419 (53.9%) | 2,066 (46.1%) |
| 5 or more Children | 61 (26.0%) | 174 (74.0%) |
| Total | 149,121 (76.3%) | 46,196 (23.6%) |
Income Below Poverty Among Single-Parent Households in Area Code 939
According to the poverty data in Area Code 939, 44.2% or 15,952 single-father households and 53.5% or 68,310 single-mother households are living below the poverty line. Among single-father households, those with 5 or more children have the highest poverty rate, with 49 households (100.0%) experiencing poverty. Likewise, among single-mother households, those with 5 or more children have the highest poverty rate, with 182 households (96.3%) falling below the poverty line.
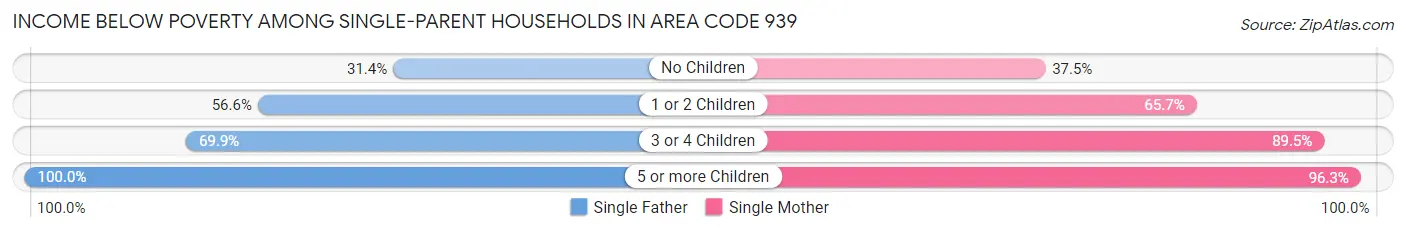
| Children | Single Father | Single Mother |
| No Children | 5,829 (31.4%) | 23,222 (37.5%) |
| 1 or 2 Children | 8,978 (56.6%) | 38,059 (65.7%) |
| 3 or 4 Children | 1,096 (69.9%) | 6,847 (89.5%) |
| 5 or more Children | 49 (100.0%) | 182 (96.3%) |
| Total | 15,952 (44.2%) | 68,310 (53.5%) |
Income Below Poverty Among Married-Couple vs Single-Parent Households in Area Code 939
The poverty data for Area Code 939 shows that 46,196 of the married-couple family households (23.6%) and 84,262 of the single-parent households (51.5%) are living below the poverty level. Within the married-couple family households, those with 5 or more children have the highest poverty rate, with 174 households (74.0%) falling below the poverty line. Among the single-parent households, those with 5 or more children have the highest poverty rate, with 231 household (97.1%) living below poverty.
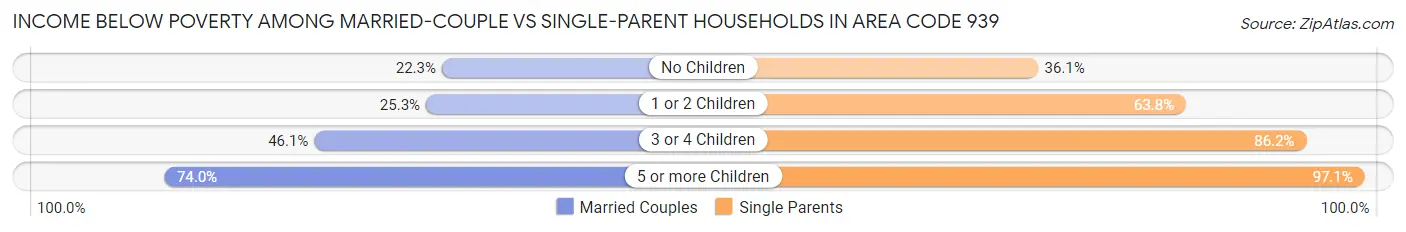
| Children | Married-Couple Families | Single-Parent Households |
| No Children | 31,399 (22.3%) | 29,051 (36.1%) |
| 1 or 2 Children | 12,557 (25.3%) | 47,037 (63.8%) |
| 3 or 4 Children | 2,066 (46.1%) | 7,943 (86.2%) |
| 5 or more Children | 174 (74.0%) | 231 (97.1%) |
| Total | 46,196 (23.6%) | 84,262 (51.5%) |
Race in Area Code 939
The most populous races in Area Code 939 are Hispanic or Latino (1,442,210 | 98.6%), White / Caucasian (620,501 | 42.4%), and Two or more Races (388,088 | 26.5%).
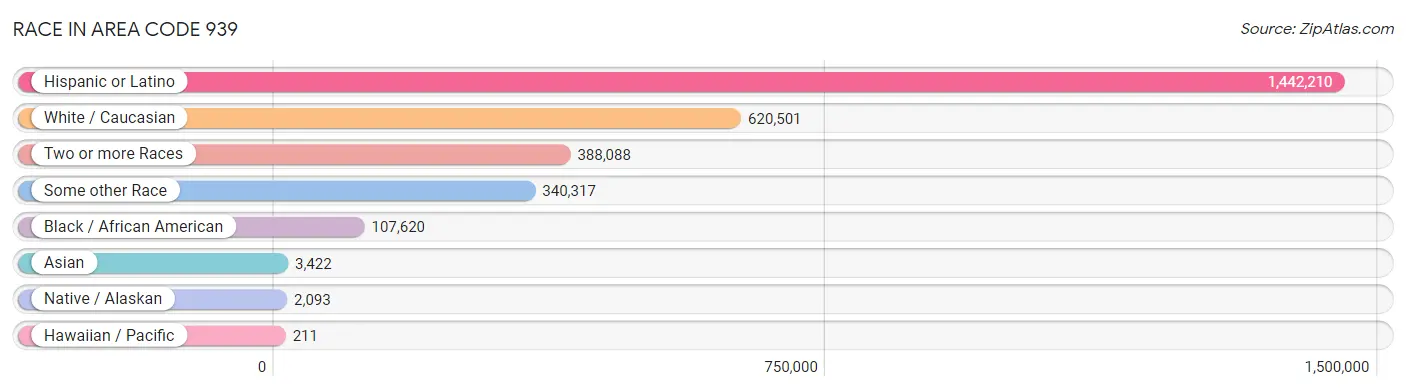
| Race | # Population | % Population |
| Asian | 3,422 | 0.2% |
| Black / African American | 107,620 | 7.4% |
| Hawaiian / Pacific | 211 | 0.0% |
| Hispanic or Latino | 1,442,210 | 98.6% |
| Native / Alaskan | 2,093 | 0.1% |
| White / Caucasian | 620,501 | 42.4% |
| Two or more Races | 388,088 | 26.5% |
| Some other Race | 340,317 | 23.3% |
| Total | 1,462,252 | 100.0% |
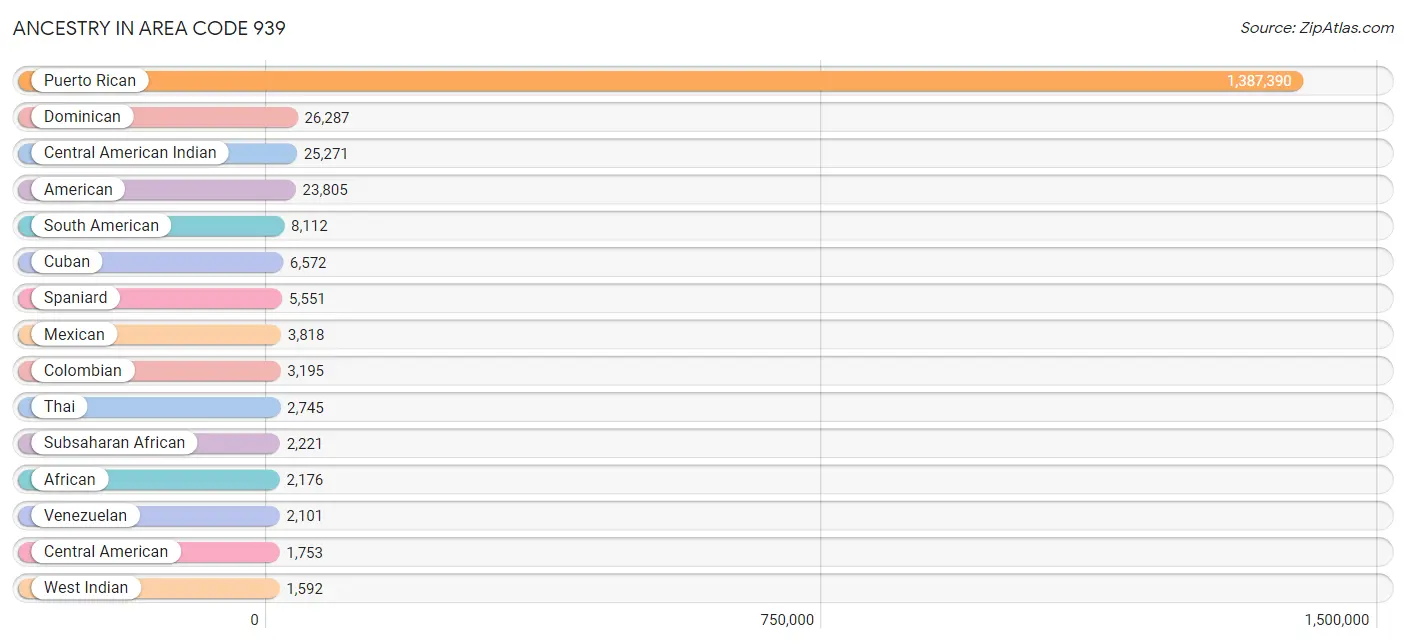
Ancestry in Area Code 939
The most populous ancestries reported in Area Code 939 are Puerto Rican (1,387,390 | 94.9%), Dominican (26,287 | 1.8%), Central American Indian (25,271 | 1.7%), American (23,805 | 1.6%), and South American (8,112 | 0.5%), together accounting for 100.6% of all Area Code 939 residents.
| Ancestry | # Population | % Population |
| African | 2,176 | 0.2% |
| American | 23,805 | 1.6% |
| Apache | 14 | 0.0% |
| Arab | 760 | 0.1% |
| Argentinean | 508 | 0.0% |
| Australian | 25 | 0.0% |
| Austrian | 43 | 0.0% |
| Barbadian | 18 | 0.0% |
| Basque | 20 | 0.0% |
| Belgian | 11 | 0.0% |
| Bhutanese | 8 | 0.0% |
| Bolivian | 22 | 0.0% |
| Brazilian | 102 | 0.0% |
| British | 328 | 0.0% |
| British West Indian | 259 | 0.0% |
| Bulgarian | 27 | 0.0% |
| Burmese | 172 | 0.0% |
| Canadian | 9 | 0.0% |
| Central American | 1,753 | 0.1% |
| Central American Indian | 25,271 | 1.7% |
| Cherokee | 27 | 0.0% |
| Chilean | 449 | 0.0% |
| Colombian | 3,195 | 0.2% |
| Costa Rican | 317 | 0.0% |
| Croatian | 9 | 0.0% |
| Cuban | 6,572 | 0.4% |
| Czech | 45 | 0.0% |
| Czechoslovakian | 9 | 0.0% |
| Danish | 29 | 0.0% |
| Dominican | 26,287 | 1.8% |
| Dutch | 150 | 0.0% |
| Dutch West Indian | 62 | 0.0% |
| Ecuadorian | 682 | 0.1% |
| Egyptian | 8 | 0.0% |
| English | 376 | 0.0% |
| European | 755 | 0.1% |
| Fijian | 10 | 0.0% |
| Finnish | 11 | 0.0% |
| French | 1,362 | 0.1% |
| French Canadian | 66 | 0.0% |
| German | 847 | 0.1% |
| Greek | 127 | 0.0% |
| Guamanian / Chamorro | 8 | 0.0% |
| Guatemalan | 112 | 0.0% |
| Guyanese | 12 | 0.0% |
| Haitian | 304 | 0.0% |
| Honduran | 329 | 0.0% |
| Hungarian | 13 | 0.0% |
| Indian (Asian) | 1,429 | 0.1% |
| Inupiat | 16 | 0.0% |
| Iranian | 89 | 0.0% |
| Iraqi | 19 | 0.0% |
| Irish | 791 | 0.1% |
| Israeli | 8 | 0.0% |
| Italian | 1,533 | 0.1% |
| Jamaican | 45 | 0.0% |
| Korean | 275 | 0.0% |
| Laotian | 37 | 0.0% |
| Lebanese | 131 | 0.0% |
| Liberian | 12 | 0.0% |
| Lithuanian | 14 | 0.0% |
| Mexican | 3,818 | 0.3% |
| Mexican American Indian | 168 | 0.0% |
| Native Hawaiian | 65 | 0.0% |
| Navajo | 12 | 0.0% |
| Nicaraguan | 249 | 0.0% |
| Nigerian | 18 | 0.0% |
| Northern European | 9 | 0.0% |
| Norwegian | 45 | 0.0% |
| Osage | 16 | 0.0% |
| Palestinian | 437 | 0.0% |
| Panamanian | 480 | 0.0% |
| Paraguayan | 43 | 0.0% |
| Peruvian | 1,000 | 0.1% |
| Polish | 224 | 0.0% |
| Portuguese | 337 | 0.0% |
| Pueblo | 4 | 0.0% |
| Puerto Rican | 1,387,390 | 94.9% |
| Romanian | 34 | 0.0% |
| Russian | 81 | 0.0% |
| Salvadoran | 266 | 0.0% |
| Samoan | 65 | 0.0% |
| Scotch-Irish | 17 | 0.0% |
| Scottish | 126 | 0.0% |
| Serbian | 9 | 0.0% |
| South American | 8,112 | 0.5% |
| South American Indian | 141 | 0.0% |
| Spaniard | 5,551 | 0.4% |
| Spanish | 29 | 0.0% |
| Spanish American Indian | 296 | 0.0% |
| Sri Lankan | 50 | 0.0% |
| Subsaharan African | 2,221 | 0.2% |
| Swedish | 50 | 0.0% |
| Swiss | 17 | 0.0% |
| Syrian | 31 | 0.0% |
| Thai | 2,745 | 0.2% |
| Trinidadian and Tobagonian | 55 | 0.0% |
| U.S. Virgin Islander | 210 | 0.0% |
| Ukrainian | 17 | 0.0% |
| Uruguayan | 112 | 0.0% |
| Venezuelan | 2,101 | 0.1% |
| Welsh | 4 | 0.0% |
| West Indian | 1,592 | 0.1% | View All 103 Rows |
Immigrants in Area Code 939

| Immigration Origin | # Population | % Population | View All 0 Rows |
Sex and Age in Area Code 939
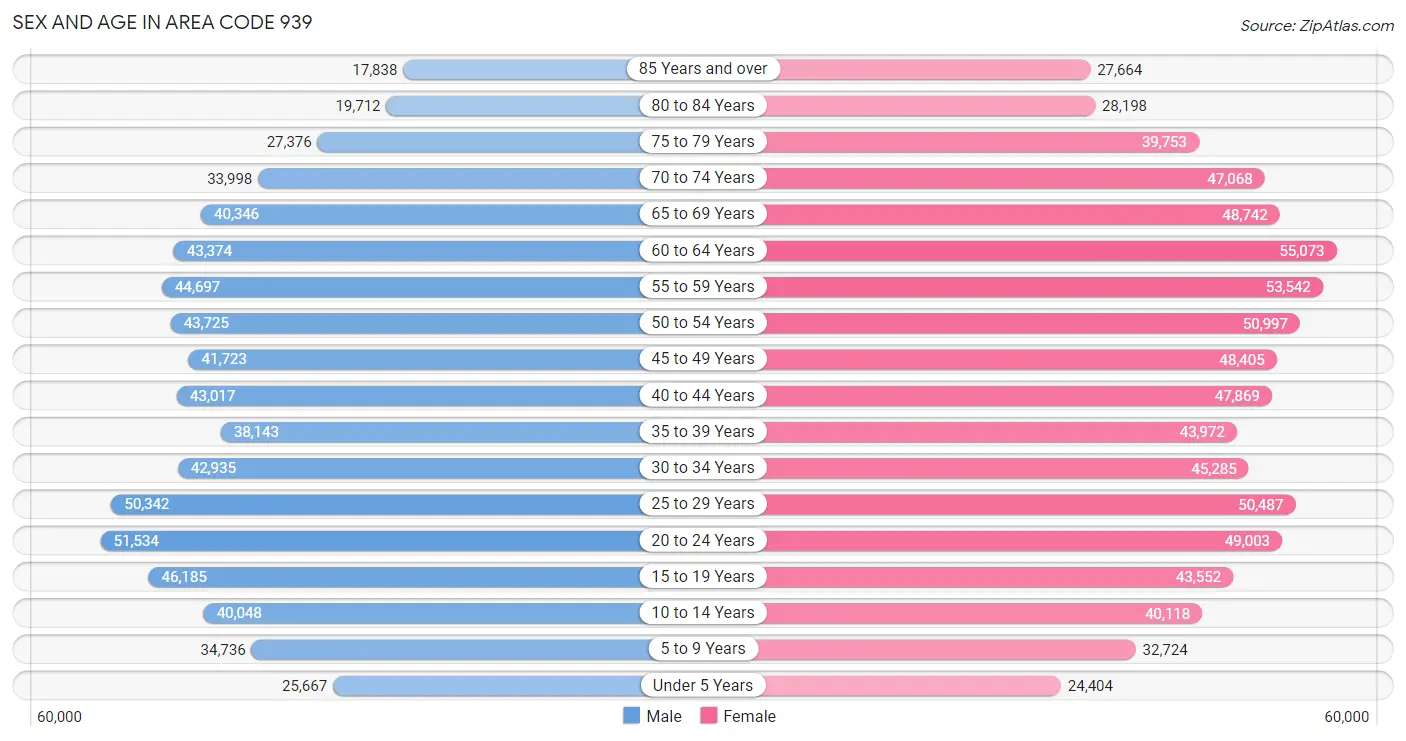
Sex and Age in Area Code 939
The most populous age groups in Area Code 939 are 20 to 24 Years (51,534 | 7.5%) for men and 60 to 64 Years (55,073 | 7.1%) for women.
| Age Bracket | Male | Female |
| Under 5 Years | 25,667 (3.7%) | 24,404 (3.1%) |
| 5 to 9 Years | 34,736 (5.1%) | 32,724 (4.2%) |
| 10 to 14 Years | 40,048 (5.8%) | 40,118 (5.2%) |
| 15 to 19 Years | 46,185 (6.7%) | 43,552 (5.6%) |
| 20 to 24 Years | 51,534 (7.5%) | 49,003 (6.3%) |
| 25 to 29 Years | 50,342 (7.3%) | 50,487 (6.5%) |
| 30 to 34 Years | 42,935 (6.3%) | 45,285 (5.8%) |
| 35 to 39 Years | 38,143 (5.6%) | 43,972 (5.7%) |
| 40 to 44 Years | 43,017 (6.3%) | 47,869 (6.2%) |
| 45 to 49 Years | 41,723 (6.1%) | 48,405 (6.2%) |
| 50 to 54 Years | 43,725 (6.4%) | 50,997 (6.6%) |
| 55 to 59 Years | 44,697 (6.5%) | 53,542 (6.9%) |
| 60 to 64 Years | 43,374 (6.3%) | 55,073 (7.1%) |
| 65 to 69 Years | 40,346 (5.9%) | 48,742 (6.3%) |
| 70 to 74 Years | 33,998 (5.0%) | 47,068 (6.1%) |
| 75 to 79 Years | 27,376 (4.0%) | 39,753 (5.1%) |
| 80 to 84 Years | 19,712 (2.9%) | 28,198 (3.6%) |
| 85 Years and over | 17,838 (2.6%) | 27,664 (3.6%) |
| Total | 685,396 (100.0%) | 776,856 (100.0%) |
Families and Households in Area Code 939
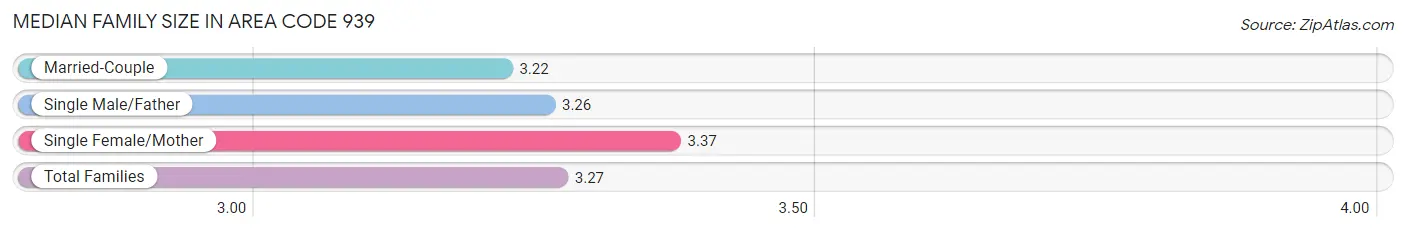
Median Family Size in Area Code 939
The median family size in Area Code 939 is 3.27 persons per family, with single female/mother families (127,592 | 35.5%) accounting for the largest median family size of 3.3702 persons per family. On the other hand, married-couple families (195,317 | 54.4%) represent the smallest median family size with 3.22 persons per family.
| Family Type | # Families | Family Size |
| Married-Couple | 195,317 (54.4%) | 3.22 |
| Single Male/Father | 36,063 (10.1%) | 3.26 |
| Single Female/Mother | 127,592 (35.5%) | 3.37 |
| Total Families | 358,972 (100.0%) | 3.27 |
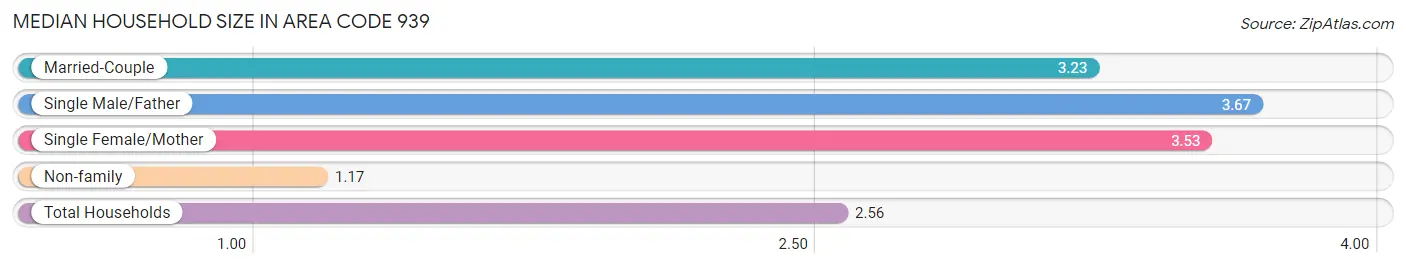
Median Household Size in Area Code 939
The median household size in Area Code 939 is 2.56 persons per household, with single male/father households (36,063 | 6.5%) accounting for the largest median household size of 3.66816 persons per household. non-family households (199,021 | 35.7%) represent the smallest median household size with 1.17 persons per household.
| Household Type | # Households | Household Size |
| Married-Couple | 195,317 (35.0%) | 3.23 |
| Single Male/Father | 36,063 (6.5%) | 3.67 |
| Single Female/Mother | 127,592 (22.9%) | 3.53 |
| Non-family | 199,021 (35.7%) | 1.17 |
| Total Households | 557,993 (100.0%) | 2.56 |
Household Size by Marriage Status in Area Code 939
Out of a total of 557,993 households in Area Code 939, 358,972 (64.3%) are family households, while 199,021 (35.7%) are nonfamily households. The most numerous type of family households are 2-person households, comprising 161,108, and the most common type of nonfamily households are 1-person households, comprising 170,464.
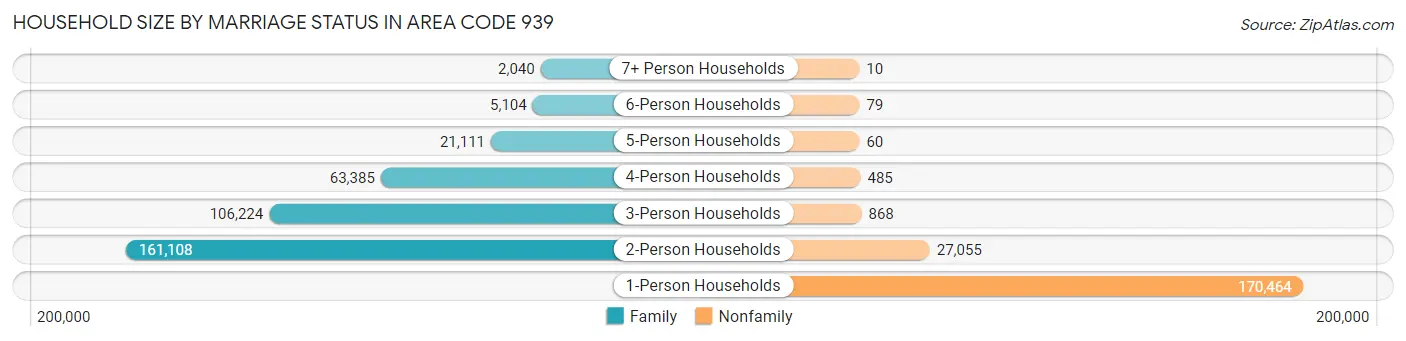
| Household Size | Family Households | Nonfamily Households |
| 1-Person Households | - | 170,464 (30.5%) |
| 2-Person Households | 161,108 (28.9%) | 27,055 (4.9%) |
| 3-Person Households | 106,224 (19.0%) | 868 (0.2%) |
| 4-Person Households | 63,385 (11.4%) | 485 (0.1%) |
| 5-Person Households | 21,111 (3.8%) | 60 (0.0%) |
| 6-Person Households | 5,104 (0.9%) | 79 (0.0%) |
| 7+ Person Households | 2,040 (0.4%) | 10 (0.0%) |
| Total | 358,972 (64.3%) | 199,021 (35.7%) |
Female Fertility in Area Code 939
Fertility by Age in Area Code 939
Average fertility rate in Area Code 939 is 29.1 births per 1,000 women. Women in the age bracket of 20 to 34 years have the highest fertility rate with 50.4 births per 1,000 women. Women in the age bracket of 20 to 34 years acount for 74.5% of all women with births.
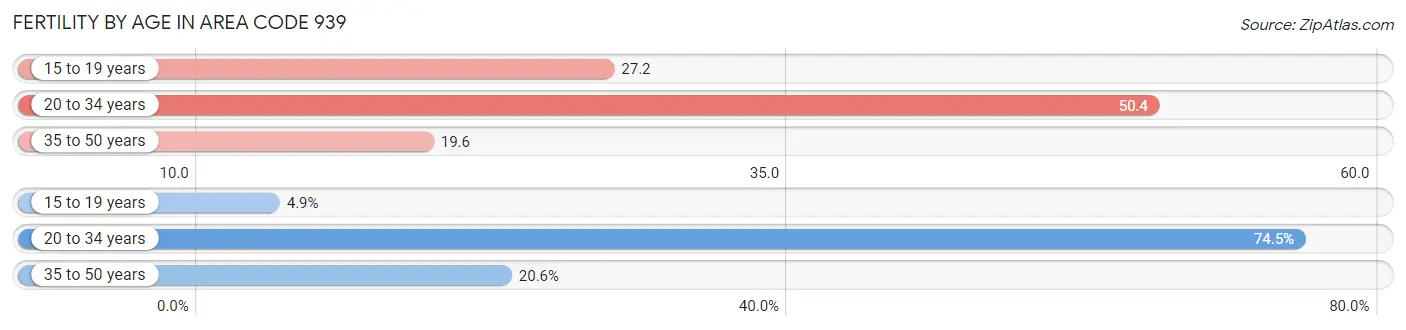
| Age Bracket | Women with Births | Births / 1,000 Women |
| 15 to 19 years | 466 (4.9%) | 27.2 |
| 20 to 34 years | 7,122 (74.5%) | 50.4 |
| 35 to 50 years | 1,971 (20.6%) | 19.6 |
| Total | 9,559 (100.0%) | 29.1 |
Fertility by Age by Marriage Status in Area Code 939
34.4% of women with births (9,559) in Area Code 939 are married. The highest percentage of unmarried women with births falls into 15 to 19 years age bracket with 91.6% of them unmarried at the time of birth, while the lowest percentage of unmarried women with births belong to 35 to 50 years age bracket with 66.0% of them unmarried.
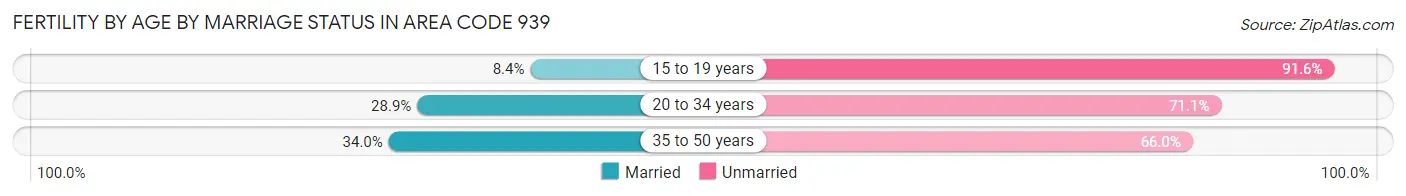
| Age Bracket | Married | Unmarried |
| 15 to 19 years | 39 (8.4%) | 427 (91.6%) |
| 20 to 34 years | 2,056 (28.9%) | 5,066 (71.1%) |
| 35 to 50 years | 671 (34.0%) | 1,300 (66.0%) |
| Total | 3,291 (34.4%) | 6,268 (65.6%) |
Fertility by Education in Area Code 939
Average fertility rate in Area Code 939 is 29.1 births per 1,000 women. Women with the education attainment of graduate degree have the highest fertility rate of 63.0 births per 1,000 women, while women with the education attainment of less than high school have the lowest fertility at 32.4 births per 1,000 women. Women with the education attainment of college or associate's degree represent 40.1% of all women with births.
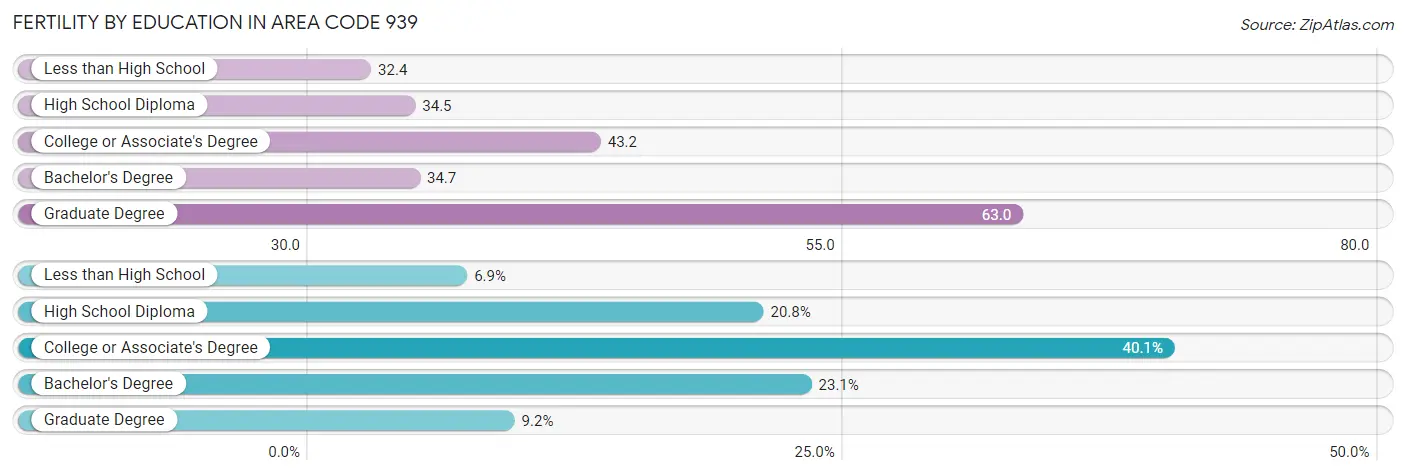
| Educational Attainment | Women with Births | Births / 1,000 Women |
| Less than High School | 662 (6.9%) | 32.4 |
| High School Diploma | 1,989 (20.8%) | 34.5 |
| College or Associate's Degree | 3,829 (40.1%) | 43.2 |
| Bachelor's Degree | 2,204 (23.1%) | 34.7 |
| Graduate Degree | 875 (9.1%) | 63.0 |
| Total | 9,559 (100.0%) | 29.1 |
Fertility by Education by Marriage Status in Area Code 939
65.6% of women with births in Area Code 939 are unmarried. Women with the educational attainment of bachelor's degree are most likely to be married with 37.0% of them married at childbirth, while women with the educational attainment of less than high school are least likely to be married with 93.5% of them unmarried at childbirth.
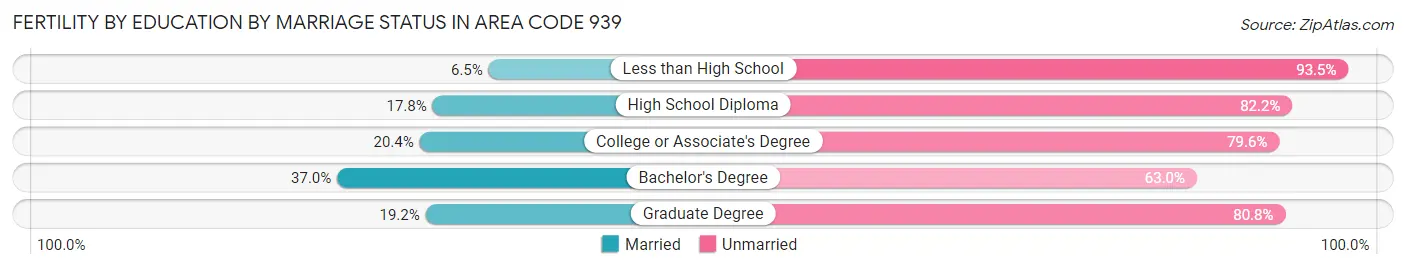
| Educational Attainment | Married | Unmarried |
| Less than High School | 43 (6.5%) | 619 (93.5%) |
| High School Diploma | 354 (17.8%) | 1,635 (82.2%) |
| College or Associate's Degree | 782 (20.4%) | 3,047 (79.6%) |
| Bachelor's Degree | 816 (37.0%) | 1,388 (63.0%) |
| Graduate Degree | 168 (19.2%) | 707 (80.8%) |
| Total | 3,291 (34.4%) | 6,268 (65.6%) |
Employment Characteristics in Area Code 939
Employment by Class of Employer in Area Code 939
Among the 489,005 employed individuals in Area Code 939, private company employees (309,795 | 63.3%), state government employees (53,285 | 10.9%), and self-employed (not incorporated) (51,325 | 10.5%) make up the most common classes of employment.
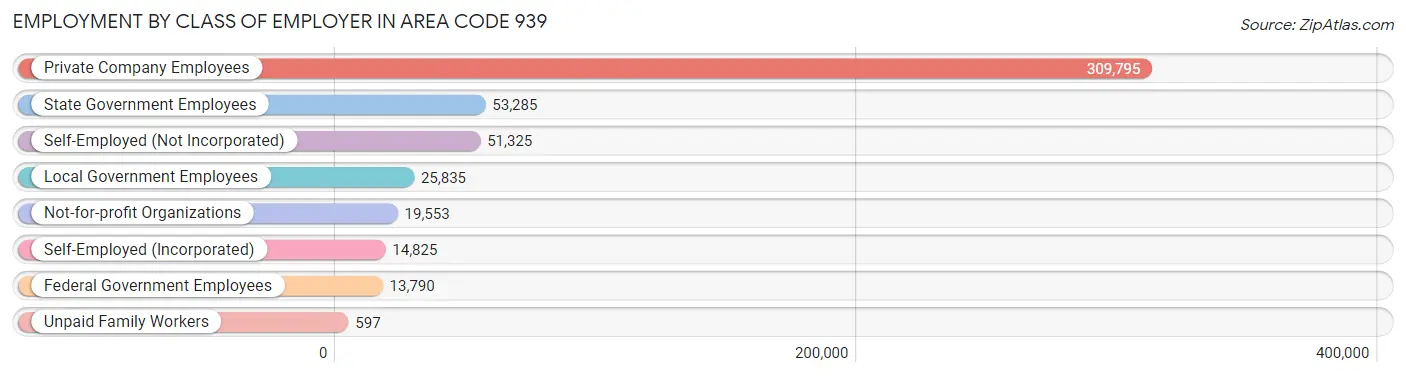
| Employer Class | # Employees | % Employees |
| Private Company Employees | 309,795 | 63.3% |
| Self-Employed (Incorporated) | 14,825 | 3.0% |
| Self-Employed (Not Incorporated) | 51,325 | 10.5% |
| Not-for-profit Organizations | 19,553 | 4.0% |
| Local Government Employees | 25,835 | 5.3% |
| State Government Employees | 53,285 | 10.9% |
| Federal Government Employees | 13,790 | 2.8% |
| Unpaid Family Workers | 597 | 0.1% |
| Total | 489,005 | 100.0% |
Employment Status by Age in Area Code 939
According to the labor force statistics for Area Code 939, out of the total population over 16 years of age (1,248,793), 45.7% or 570,574 individuals are in the labor force, with 13.6% or 77,826 of them unemployed. The age group with the highest labor force participation rate is 30 to 34 years, with 75.9% or 66,994 individuals in the labor force. Within the labor force, the 16 to 19 years age range has the highest percentage of unemployed individuals, with 1,940.5% or 225,370 of them being unemployed.

| Age Bracket | In Labor Force | Unemployed |
| 16 to 19 Years | 11,616 (15.7%) | 225,370 (1,940.5%) |
| 20 to 24 Years | 51,690 (51.4%) | 672,176 (1,300.5%) |
| 25 to 29 Years | 71,025 (70.4%) | 682,257 (960.6%) |
| 30 to 34 Years | 66,991 (75.9%) | 414,224 (618.3%) |
| 35 to 44 Years | 130,143 (75.2%) | 728,965 (560.1%) |
| 45 to 54 Years | 124,906 (67.6%) | 630,635 (504.9%) |
| 55 to 59 Years | 52,538 (53.5%) | 257,016 (489.2%) |
| 60 to 64 Years | 34,722 (35.3%) | 99,027 (285.2%) |
| 65 to 74 Years | 23,322 (13.7%) | 44,067 (188.9%) |
| 75 Years and over | 6,326 (3.9%) | 4,845 (76.6%) |
| Total | 570,622 (45.7%) | 77,808 (13.6%) |
Employment Status by Educational Attainment in Area Code 939
According to labor force statistics for Area Code 939, 64.5% of individuals (479,316) out of the total population between 25 and 64 years of age (743,586) are in the labor force, with 589.6% or 2,826,047 of them being unemployed. The group with the highest labor force participation rate are those with the educational attainment of bachelor's degree or higher, with 76.0% or 200,561 individuals in the labor force. Within the labor force, individuals with less than high school education have the highest percentage of unemployment, with 1,168.9% or 395,369 of them being unemployed.
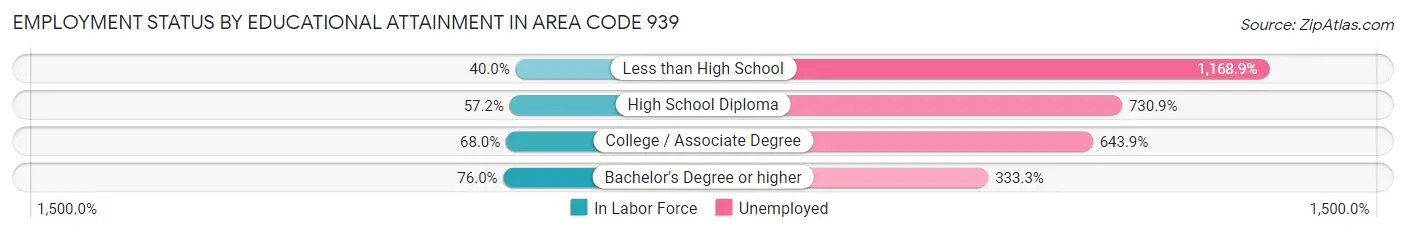
| Educational Attainment | In Labor Force | Unemployed |
| Less than High School | 33,821 (40.0%) | 988,188 (1,168.9%) |
| High School Diploma | 108,098 (57.2%) | 1,381,174 (730.9%) |
| College / Associate Degree | 140,179 (68.0%) | 1,326,930 (643.9%) |
| Bachelor's Degree or higher | 200,565 (76.0%) | 879,912 (333.3%) |
| Total | 479,279 (64.5%) | 4,384,183 (589.6%) |
Employment Occupations by Sex in Area Code 939
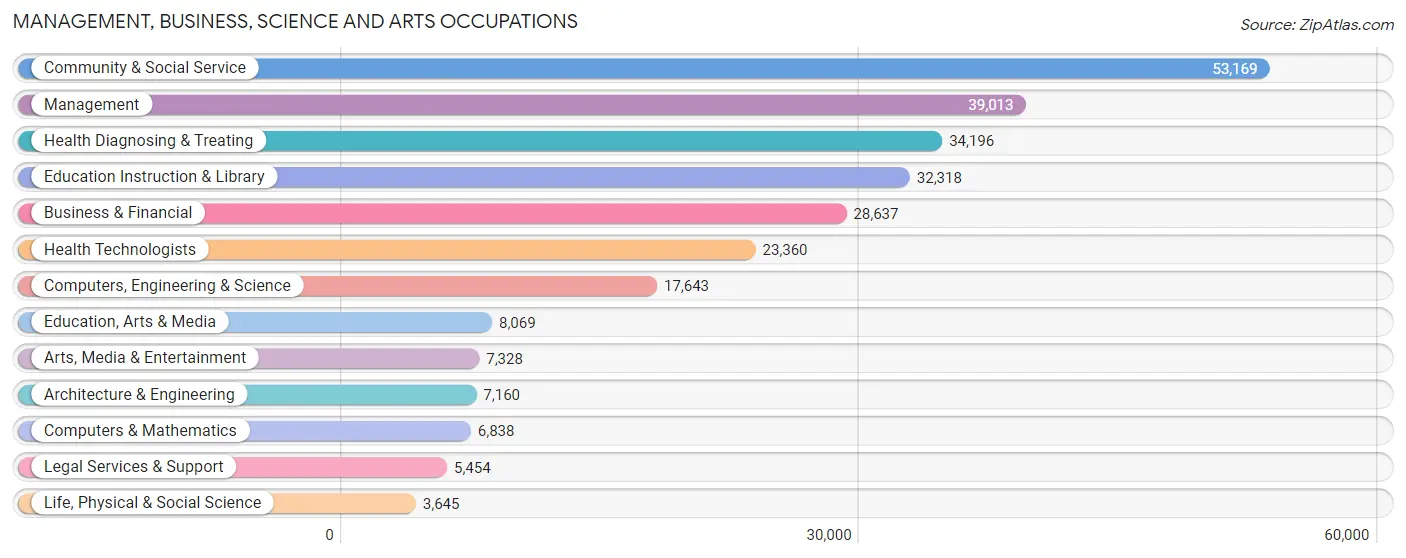
Management, Business, Science and Arts Occupations
The most common Management, Business, Science and Arts occupations in Area Code 939 are Community & Social Service (53,169 | 10.6%), Management (39,013 | 7.8%), Health Diagnosing & Treating (34,196 | 6.8%), Education Instruction & Library (32,318 | 6.4%), and Business & Financial (28,637 | 5.7%).
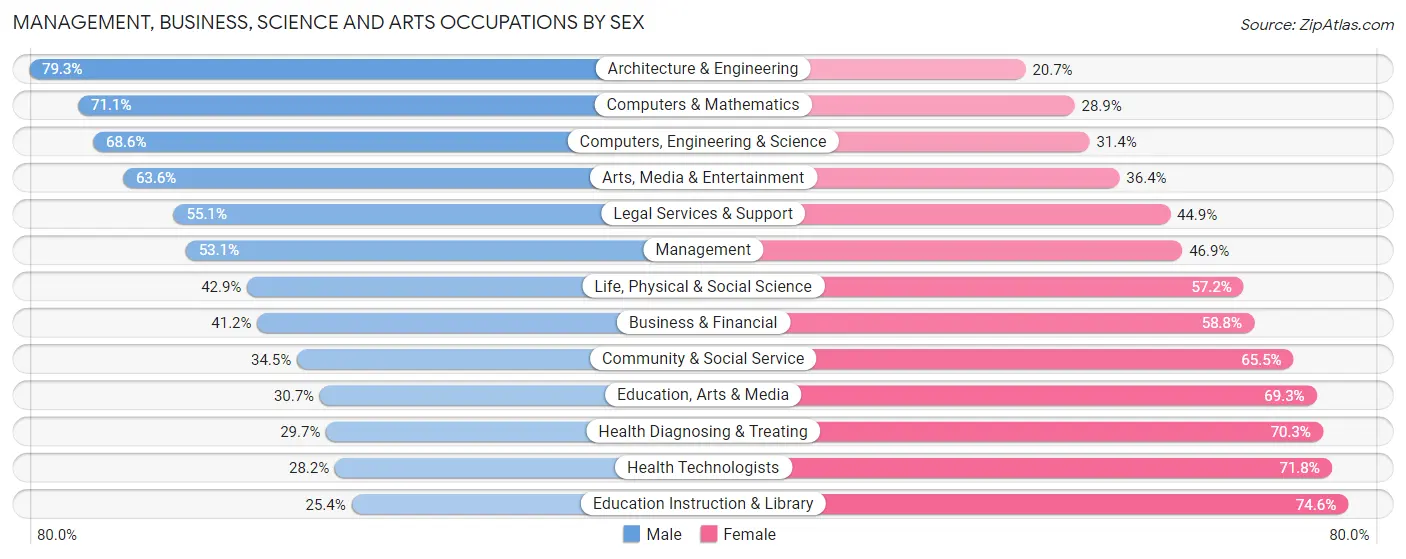
Management, Business, Science and Arts Occupations by Sex
Within the Management, Business, Science and Arts occupations in Area Code 939, the most male-oriented occupations are Architecture & Engineering (79.3%), Computers & Mathematics (71.1%), and Computers, Engineering & Science (68.6%), while the most female-oriented occupations are Education Instruction & Library (74.6%), Health Technologists (71.8%), and Health Diagnosing & Treating (70.3%).
| Occupation | Male | Female |
| Management | 20,717 (53.1%) | 18,296 (46.9%) |
| Business & Financial | 11,787 (41.2%) | 16,850 (58.8%) |
| Computers, Engineering & Science | 12,097 (68.6%) | 5,546 (31.4%) |
| Computers & Mathematics | 4,860 (71.1%) | 1,978 (28.9%) |
| Architecture & Engineering | 5,675 (79.3%) | 1,485 (20.7%) |
| Life, Physical & Social Science | 1,562 (42.8%) | 2,083 (57.2%) |
| Community & Social Service | 18,365 (34.5%) | 34,804 (65.5%) |
| Education, Arts & Media | 2,478 (30.7%) | 5,591 (69.3%) |
| Legal Services & Support | 3,007 (55.1%) | 2,447 (44.9%) |
| Education Instruction & Library | 8,221 (25.4%) | 24,097 (74.6%) |
| Arts, Media & Entertainment | 4,659 (63.6%) | 2,669 (36.4%) |
| Health Diagnosing & Treating | 10,144 (29.7%) | 24,052 (70.3%) |
| Health Technologists | 6,586 (28.2%) | 16,774 (71.8%) |
| Total (Category) | 73,110 (42.3%) | 99,548 (57.7%) |
| Total (Overall) | 257,475 (51.3%) | 244,332 (48.7%) |
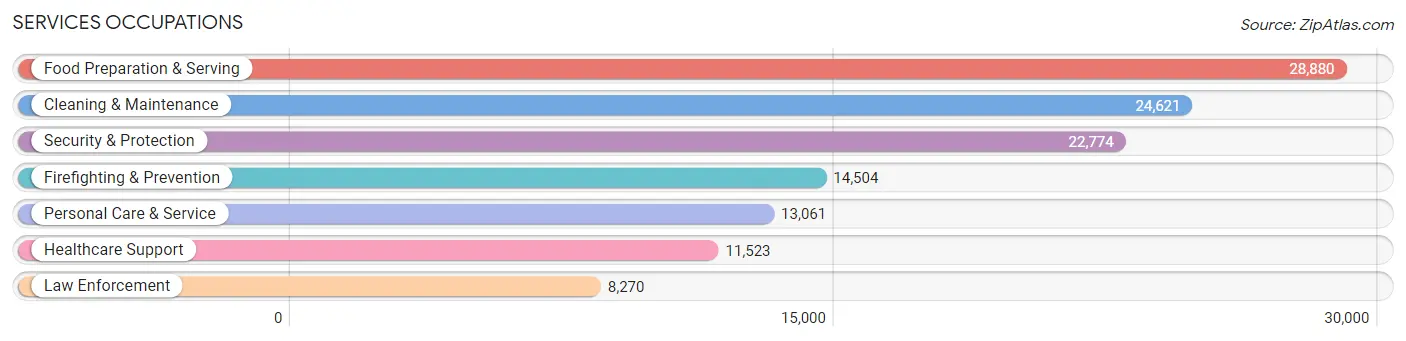
Services Occupations
The most common Services occupations in Area Code 939 are Food Preparation & Serving (28,880 | 5.8%), Cleaning & Maintenance (24,621 | 4.9%), Security & Protection (22,774 | 4.5%), Firefighting & Prevention (14,504 | 2.9%), and Personal Care & Service (13,061 | 2.6%).
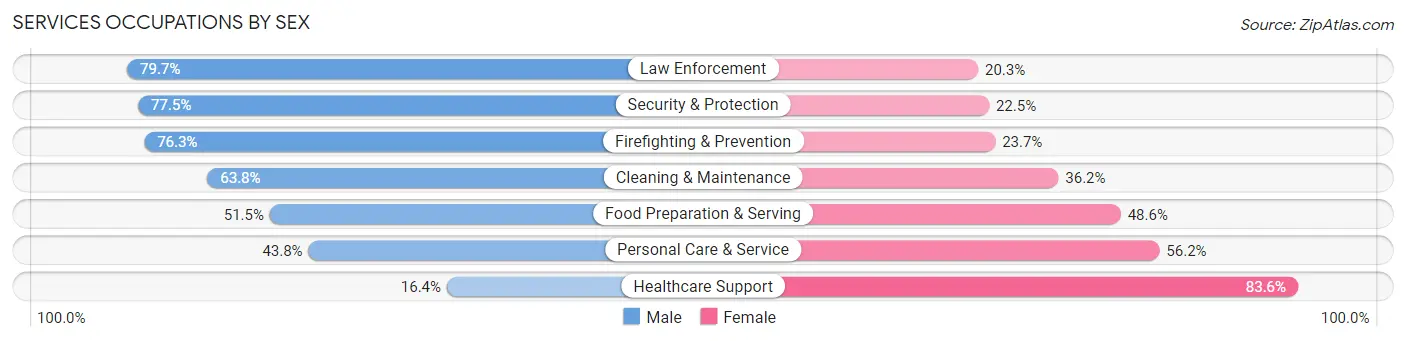
Services Occupations by Sex
Within the Services occupations in Area Code 939, the most male-oriented occupations are Law Enforcement (79.7%), Security & Protection (77.5%), and Firefighting & Prevention (76.3%), while the most female-oriented occupations are Healthcare Support (83.6%), Personal Care & Service (56.2%), and Food Preparation & Serving (48.5%).
| Occupation | Male | Female |
| Healthcare Support | 1,887 (16.4%) | 9,636 (83.6%) |
| Security & Protection | 17,659 (77.5%) | 5,115 (22.5%) |
| Firefighting & Prevention | 11,068 (76.3%) | 3,436 (23.7%) |
| Law Enforcement | 6,591 (79.7%) | 1,679 (20.3%) |
| Food Preparation & Serving | 14,860 (51.4%) | 14,020 (48.5%) |
| Cleaning & Maintenance | 15,709 (63.8%) | 8,912 (36.2%) |
| Personal Care & Service | 5,720 (43.8%) | 7,341 (56.2%) |
| Total (Category) | 55,835 (55.4%) | 45,024 (44.6%) |
| Total (Overall) | 257,475 (51.3%) | 244,332 (48.7%) |
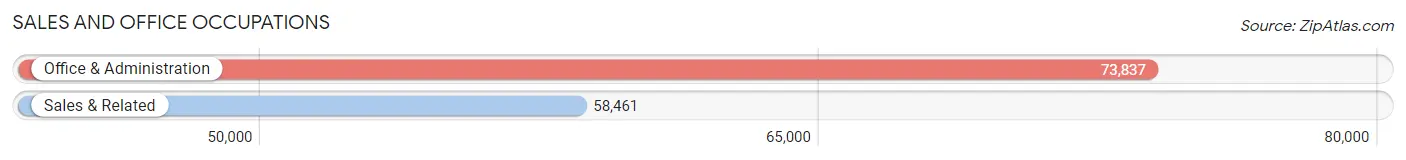
Sales and Office Occupations
The most common Sales and Office occupations in Area Code 939 are Office & Administration (73,837 | 14.7%), and Sales & Related (58,461 | 11.7%).
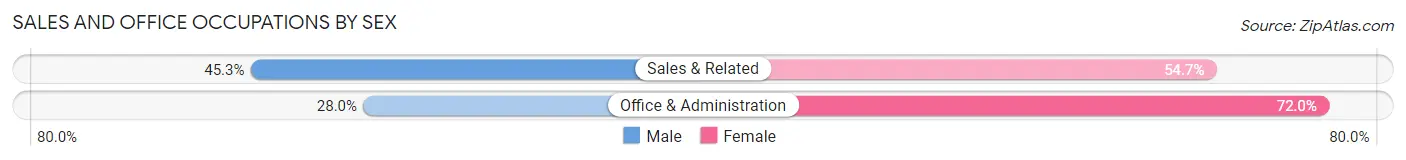
Sales and Office Occupations by Sex
| Occupation | Male | Female |
| Sales & Related | 26,469 (45.3%) | 31,992 (54.7%) |
| Office & Administration | 20,643 (28.0%) | 53,194 (72.0%) |
| Total (Category) | 47,112 (35.6%) | 85,186 (64.4%) |
| Total (Overall) | 257,475 (51.3%) | 244,332 (48.7%) |
Natural Resources, Construction and Maintenance Occupations
The most common Natural Resources, Construction and Maintenance occupations in Area Code 939 are Construction & Extraction (20,565 | 4.1%), Installation, Maintenance & Repair (17,774 | 3.5%), and Farming, Fishing & Forestry (3,235 | 0.6%).
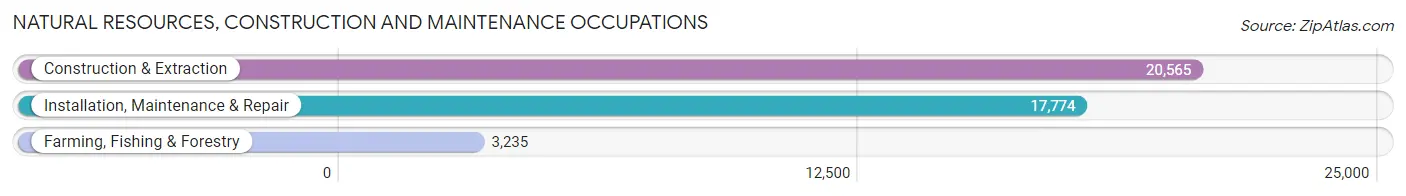
Natural Resources, Construction and Maintenance Occupations by Sex
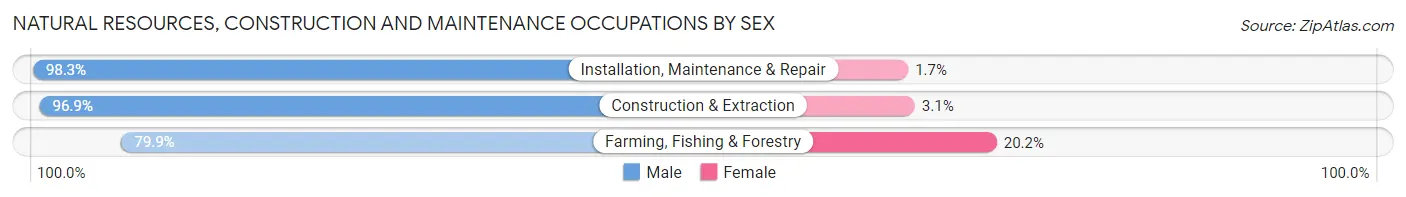
| Occupation | Male | Female |
| Farming, Fishing & Forestry | 2,583 (79.8%) | 652 (20.2%) |
| Construction & Extraction | 19,923 (96.9%) | 642 (3.1%) |
| Installation, Maintenance & Repair | 17,466 (98.3%) | 308 (1.7%) |
| Total (Category) | 39,972 (96.2%) | 1,602 (3.8%) |
| Total (Overall) | 257,475 (51.3%) | 244,332 (48.7%) |
Production, Transportation and Moving Occupations
The most common Production, Transportation and Moving occupations in Area Code 939 are Production (24,421 | 4.9%), Material Moving (15,448 | 3.1%), and Transportation (14,549 | 2.9%).
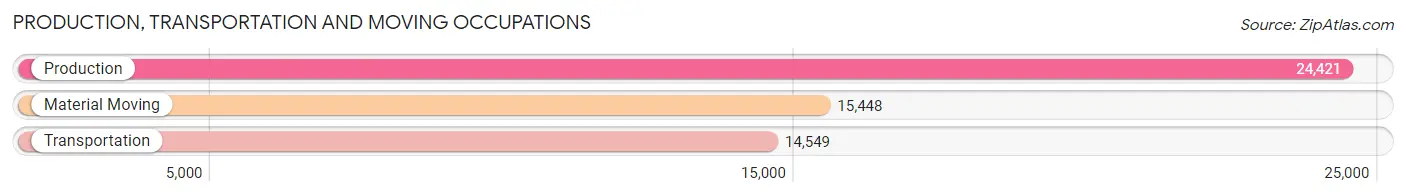
Production, Transportation and Moving Occupations by Sex
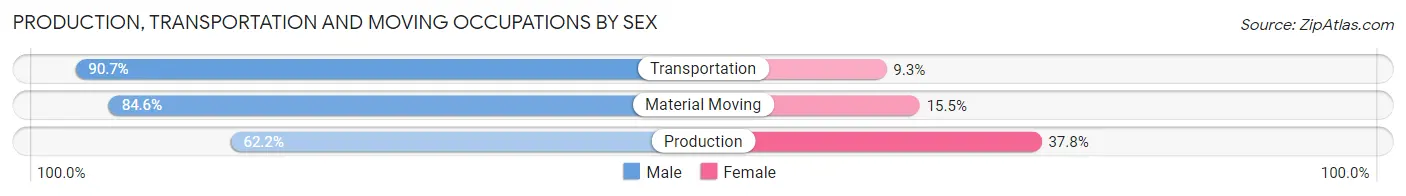
| Occupation | Male | Female |
| Production | 15,192 (62.2%) | 9,229 (37.8%) |
| Transportation | 13,192 (90.7%) | 1,357 (9.3%) |
| Material Moving | 13,062 (84.6%) | 2,386 (15.4%) |
| Total (Category) | 41,446 (76.2%) | 12,972 (23.8%) |
| Total (Overall) | 257,475 (51.3%) | 244,332 (48.7%) |
Employment Industries by Sex in Area Code 939
Employment Industries in Area Code 939
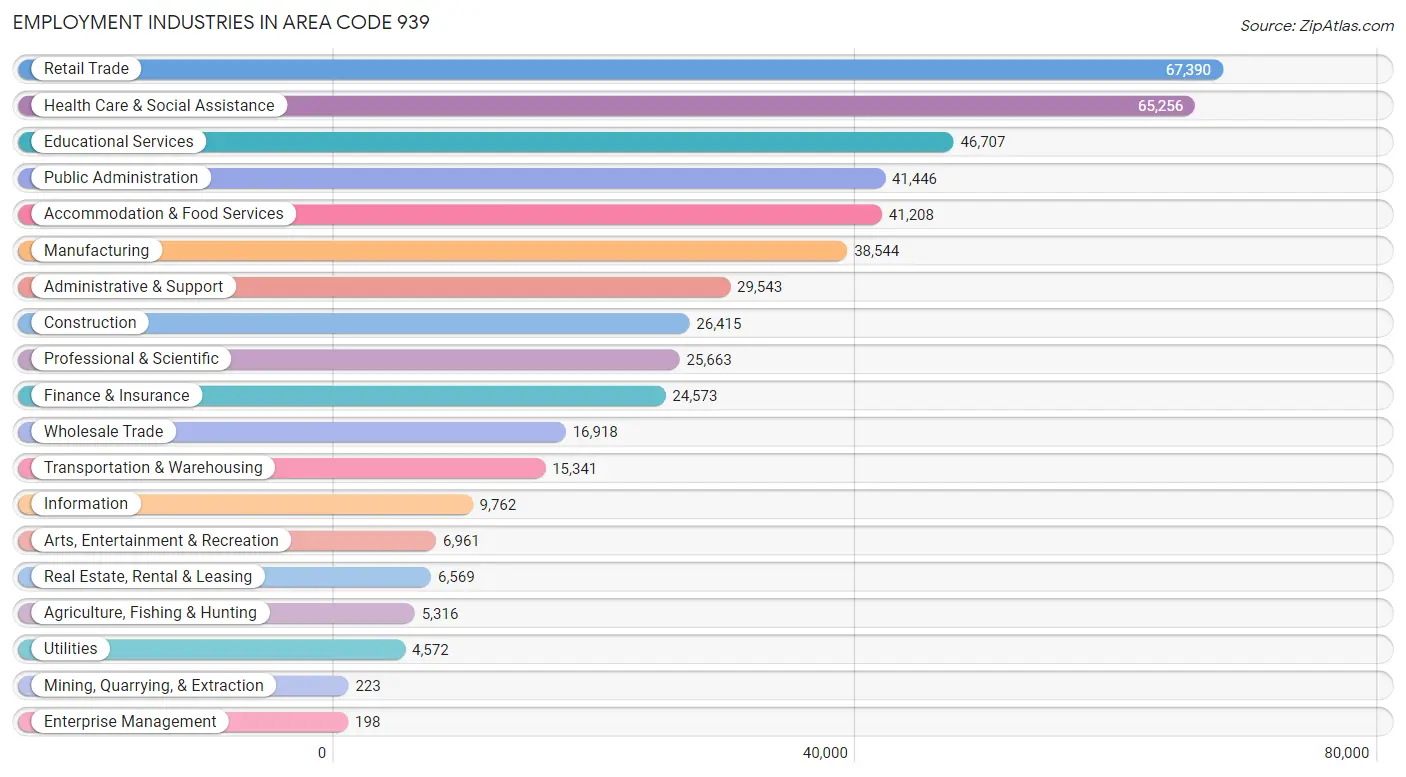
The major employment industries in Area Code 939 include Retail Trade (67,390 | 13.4%), Health Care & Social Assistance (65,256 | 13.0%), Educational Services (46,707 | 9.3%), Public Administration (41,446 | 8.3%), and Accommodation & Food Services (41,208 | 8.2%).
Employment Industries by Sex in Area Code 939
The Area Code 939 industries that see more men than women are Construction (90.8%), Agriculture, Fishing & Hunting (80.1%), and Mining, Quarrying, & Extraction (76.7%), whereas the industries that tend to have a higher number of women are Health Care & Social Assistance (74.7%), Educational Services (72.2%), and Enterprise Management (68.7%).

| Industry | Male | Female |
| Agriculture, Fishing & Hunting | 4,256 (80.1%) | 1,060 (19.9%) |
| Mining, Quarrying, & Extraction | 171 (76.7%) | 52 (23.3%) |
| Construction | 23,990 (90.8%) | 2,425 (9.2%) |
| Manufacturing | 23,379 (60.7%) | 15,165 (39.3%) |
| Wholesale Trade | 12,247 (72.4%) | 4,671 (27.6%) |
| Retail Trade | 32,986 (48.9%) | 34,404 (51.0%) |
| Transportation & Warehousing | 11,744 (76.5%) | 3,597 (23.4%) |
| Utilities | 3,415 (74.7%) | 1,157 (25.3%) |
| Information | 5,541 (56.8%) | 4,221 (43.2%) |
| Finance & Insurance | 8,894 (36.2%) | 15,679 (63.8%) |
| Real Estate, Rental & Leasing | 3,499 (53.3%) | 3,070 (46.7%) |
| Professional & Scientific | 14,159 (55.2%) | 11,504 (44.8%) |
| Enterprise Management | 62 (31.3%) | 136 (68.7%) |
| Administrative & Support | 20,653 (69.9%) | 8,890 (30.1%) |
| Educational Services | 12,986 (27.8%) | 33,721 (72.2%) |
| Health Care & Social Assistance | 16,512 (25.3%) | 48,744 (74.7%) |
| Arts, Entertainment & Recreation | 4,502 (64.7%) | 2,459 (35.3%) |
| Accommodation & Food Services | 21,404 (51.9%) | 19,804 (48.1%) |
| Public Administration | 21,186 (51.1%) | 20,260 (48.9%) |
| Total | 257,475 (51.3%) | 244,332 (48.7%) |
Education in Area Code 939
School Enrollment in Area Code 939
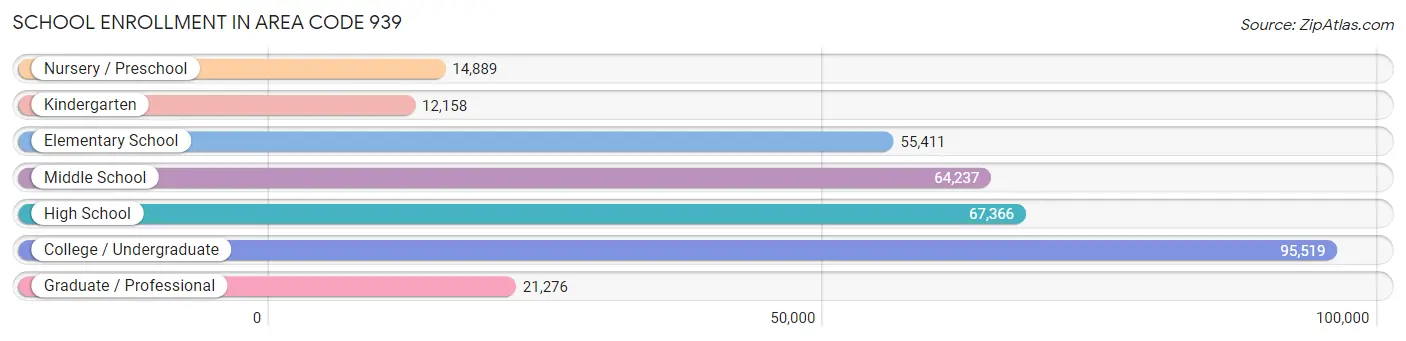
The most common levels of schooling among the 330,856 students in Area Code 939 are college / undergraduate (95,519 | 28.9%), high school (67,366 | 20.4%), and middle school (64,237 | 19.4%).
| School Level | # Students | % Students |
| Nursery / Preschool | 14,889 | 4.5% |
| Kindergarten | 12,158 | 3.7% |
| Elementary School | 55,411 | 16.8% |
| Middle School | 64,237 | 19.4% |
| High School | 67,366 | 20.4% |
| College / Undergraduate | 95,519 | 28.9% |
| Graduate / Professional | 21,276 | 6.4% |
| Total | 330,856 | 100.0% |
School Enrollment by Age by Funding Source in Area Code 939
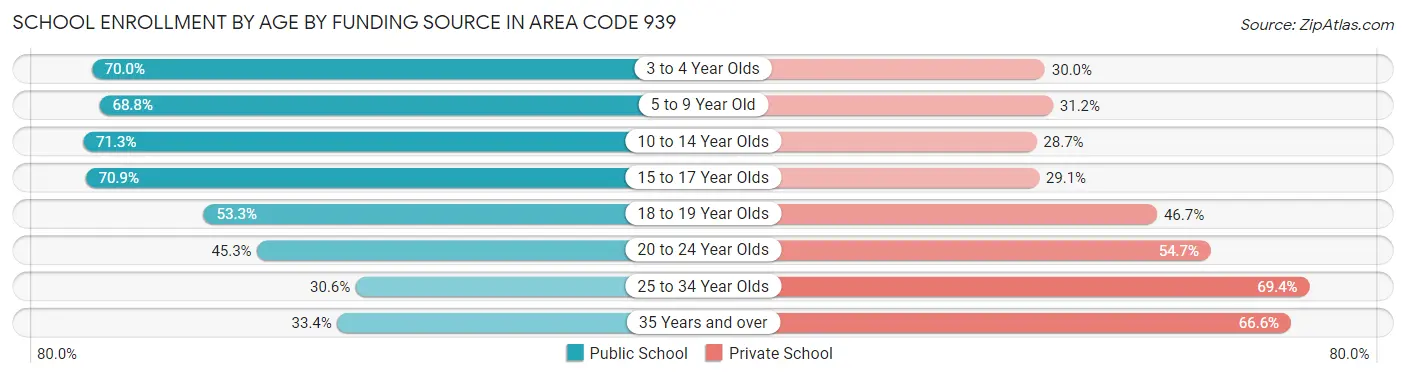
Out of a total of 330,856 students who are enrolled in schools in Area Code 939, 132,582 (40.1%) attend a private institution, while the remaining 198,274 (59.9%) are enrolled in public schools. The age group of 25 to 34 year olds has the highest likelihood of being enrolled in private schools, with 17,796 (69.4% in the age bracket) enrolled. Conversely, the age group of 10 to 14 year olds has the lowest likelihood of being enrolled in a private school, with 56,280 (71.3% in the age bracket) attending a public institution.
| Age Bracket | Public School | Private School |
| 3 to 4 Year Olds | 9,295 (70.0%) | 3,980 (30.0%) |
| 5 to 9 Year Old | 45,056 (68.8%) | 20,403 (31.2%) |
| 10 to 14 Year Olds | 56,280 (71.3%) | 22,673 (28.7%) |
| 15 to 17 Year Olds | 35,099 (70.9%) | 14,400 (29.1%) |
| 18 to 19 Year Olds | 15,570 (53.3%) | 13,634 (46.7%) |
| 20 to 24 Year Olds | 23,531 (45.3%) | 28,418 (54.7%) |
| 25 to 34 Year Olds | 7,848 (30.6%) | 17,796 (69.4%) |
| 35 Years and over | 5,628 (33.4%) | 11,245 (66.6%) |
| Total | 198,274 (59.9%) | 132,582 (40.1%) |
Educational Attainment by Field of Study in Area Code 939
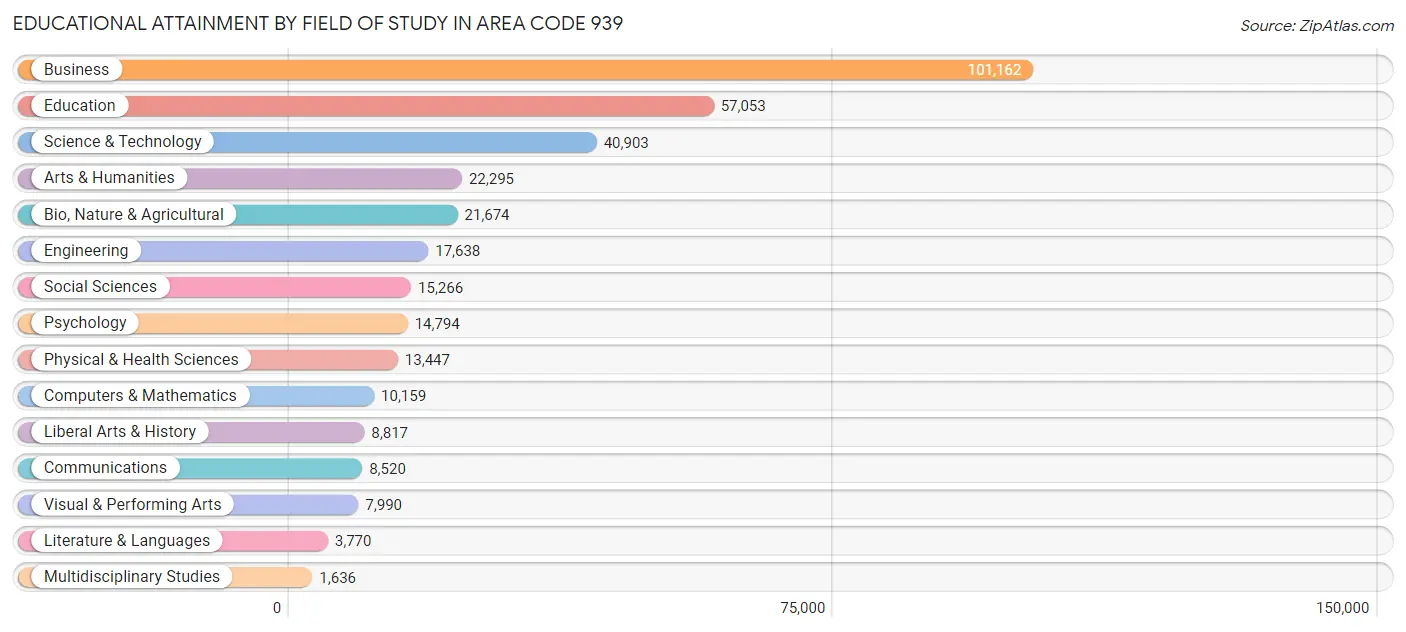
Business (101,162 | 29.3%), education (57,053 | 16.5%), science & technology (40,903 | 11.8%), arts & humanities (22,295 | 6.5%), and bio, nature & agricultural (21,674 | 6.3%) are the most common fields of study among 345,124 individuals in Area Code 939 who have obtained a bachelor's degree or higher.
| Field of Study | # Graduates | % Graduates |
| Computers & Mathematics | 10,159 | 2.9% |
| Bio, Nature & Agricultural | 21,674 | 6.3% |
| Physical & Health Sciences | 13,447 | 3.9% |
| Psychology | 14,794 | 4.3% |
| Social Sciences | 15,266 | 4.4% |
| Engineering | 17,638 | 5.1% |
| Multidisciplinary Studies | 1,636 | 0.5% |
| Science & Technology | 40,903 | 11.8% |
| Business | 101,162 | 29.3% |
| Education | 57,053 | 16.5% |
| Literature & Languages | 3,770 | 1.1% |
| Liberal Arts & History | 8,817 | 2.5% |
| Visual & Performing Arts | 7,990 | 2.3% |
| Communications | 8,520 | 2.5% |
| Arts & Humanities | 22,295 | 6.5% |
| Total | 345,124 | 100.0% |
Transportation & Commute in Area Code 939
Vehicle Availability by Sex in Area Code 939
The most prevalent vehicle ownership categories in Area Code 939 are males with 2 vehicles (108,319, accounting for 43.0%) and females with 2 vehicles (94,055, making up 45.9%).
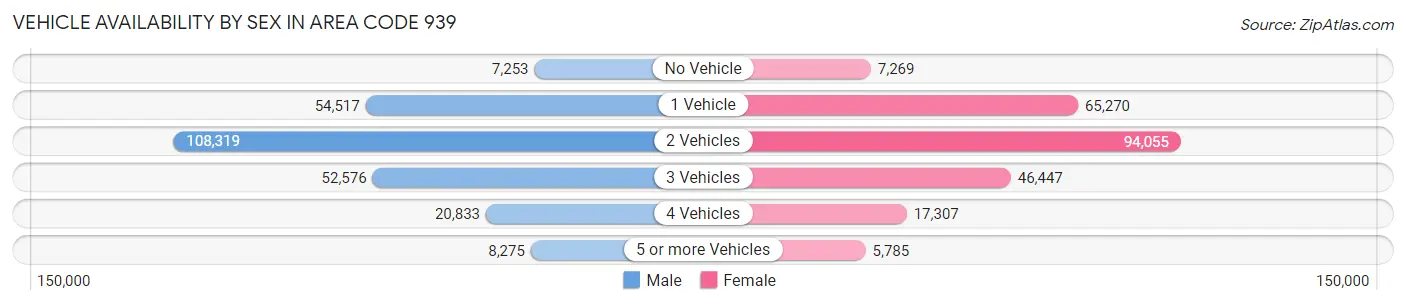
| Vehicles Available | Male | Female |
| No Vehicle | 7,253 (2.9%) | 7,269 (3.1%) |
| 1 Vehicle | 54,517 (21.6%) | 65,270 (27.6%) |
| 2 Vehicles | 108,319 (43.0%) | 94,055 (39.8%) |
| 3 Vehicles | 52,576 (20.9%) | 46,447 (19.7%) |
| 4 Vehicles | 20,833 (8.3%) | 17,307 (7.3%) |
| 5 or more Vehicles | 8,275 (3.3%) | 5,785 (2.5%) |
| Total | 251,773 (100.0%) | 236,133 (100.0%) |
Commute Time in Area Code 939
The most frequently occuring commute durations in Area Code 939 are 30 to 34 minutes (78,731 commuters, 17.0%), 15 to 19 minutes (74,618 commuters, 16.1%), and 20 to 24 minutes (68,606 commuters, 14.8%).
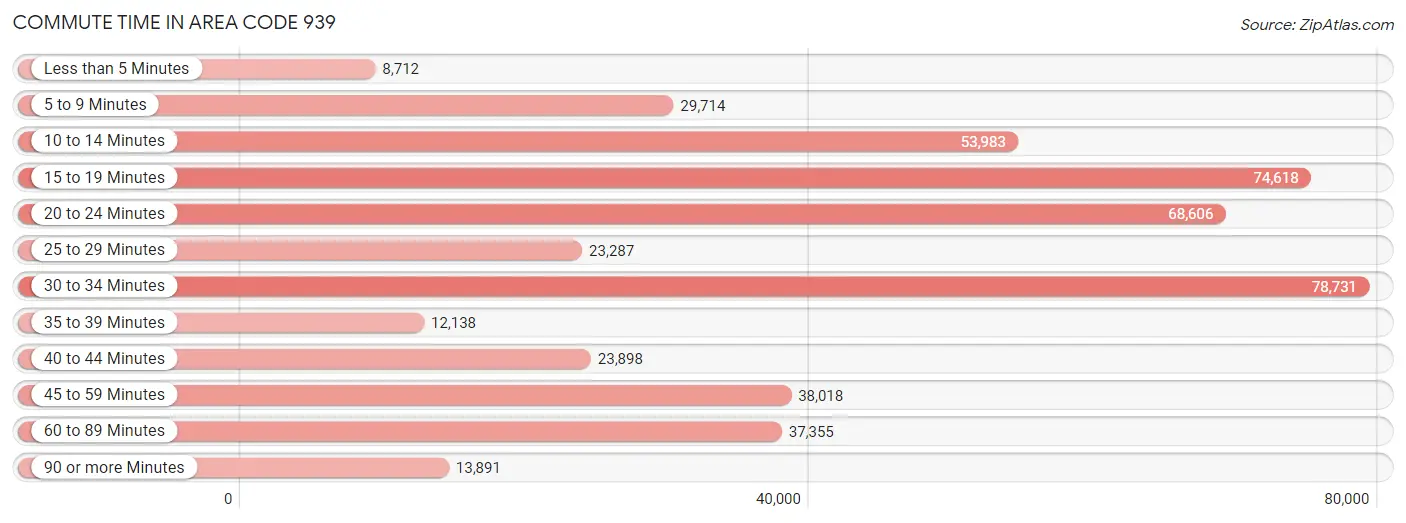
| Commute Time | # Commuters | % Commuters |
| Less than 5 Minutes | 8,712 | 1.9% |
| 5 to 9 Minutes | 29,714 | 6.4% |
| 10 to 14 Minutes | 53,983 | 11.7% |
| 15 to 19 Minutes | 74,618 | 16.1% |
| 20 to 24 Minutes | 68,606 | 14.8% |
| 25 to 29 Minutes | 23,287 | 5.0% |
| 30 to 34 Minutes | 78,731 | 17.0% |
| 35 to 39 Minutes | 12,138 | 2.6% |
| 40 to 44 Minutes | 23,898 | 5.2% |
| 45 to 59 Minutes | 38,018 | 8.2% |
| 60 to 89 Minutes | 37,355 | 8.1% |
| 90 or more Minutes | 13,891 | 3.0% |
Commute Time by Sex in Area Code 939
The most common commute times in Area Code 939 are 30 to 34 minutes (42,165 commuters, 17.6%) for males and 15 to 19 minutes (37,214 commuters, 16.7%) for females.
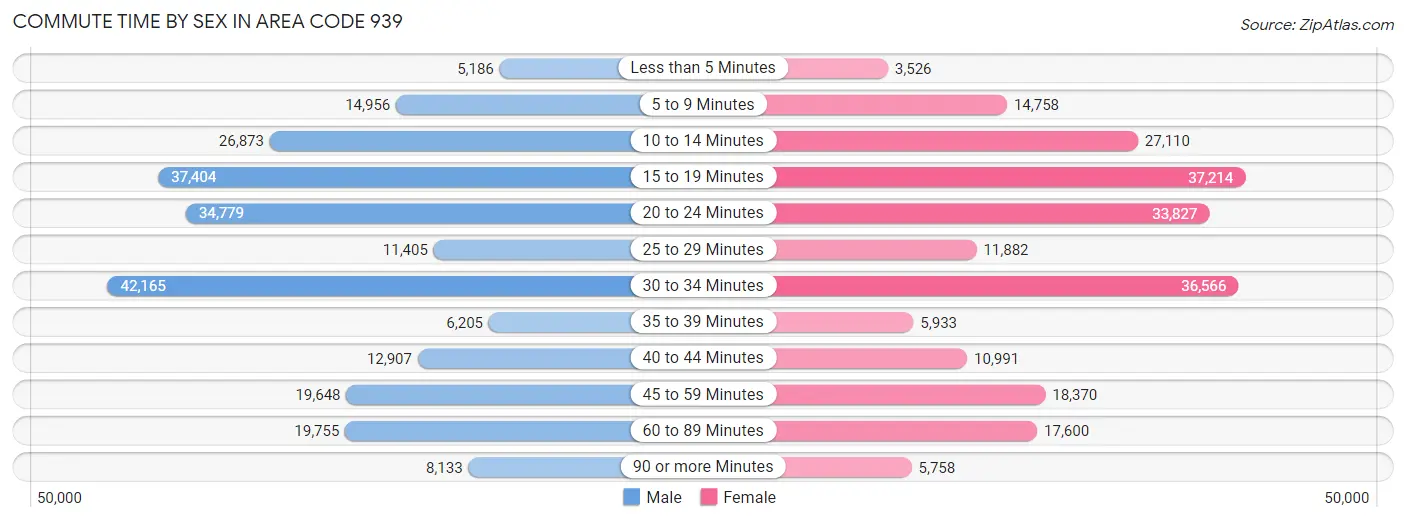
| Commute Time | Male | Female |
| Less than 5 Minutes | 5,186 (2.2%) | 3,526 (1.6%) |
| 5 to 9 Minutes | 14,956 (6.2%) | 14,758 (6.6%) |
| 10 to 14 Minutes | 26,873 (11.2%) | 27,110 (12.1%) |
| 15 to 19 Minutes | 37,404 (15.6%) | 37,214 (16.7%) |
| 20 to 24 Minutes | 34,779 (14.5%) | 33,827 (15.1%) |
| 25 to 29 Minutes | 11,405 (4.8%) | 11,882 (5.3%) |
| 30 to 34 Minutes | 42,165 (17.6%) | 36,566 (16.4%) |
| 35 to 39 Minutes | 6,205 (2.6%) | 5,933 (2.6%) |
| 40 to 44 Minutes | 12,907 (5.4%) | 10,991 (4.9%) |
| 45 to 59 Minutes | 19,648 (8.2%) | 18,370 (8.2%) |
| 60 to 89 Minutes | 19,755 (8.3%) | 17,600 (7.9%) |
| 90 or more Minutes | 8,133 (3.4%) | 5,758 (2.6%) |
Time of Departure to Work by Sex in Area Code 939
The most frequent times of departure to work in Area Code 939 are 7:00 AM to 7:29 AM (36,637, 15.3%) for males and 7:00 AM to 7:29 AM (43,591, 19.5%) for females.
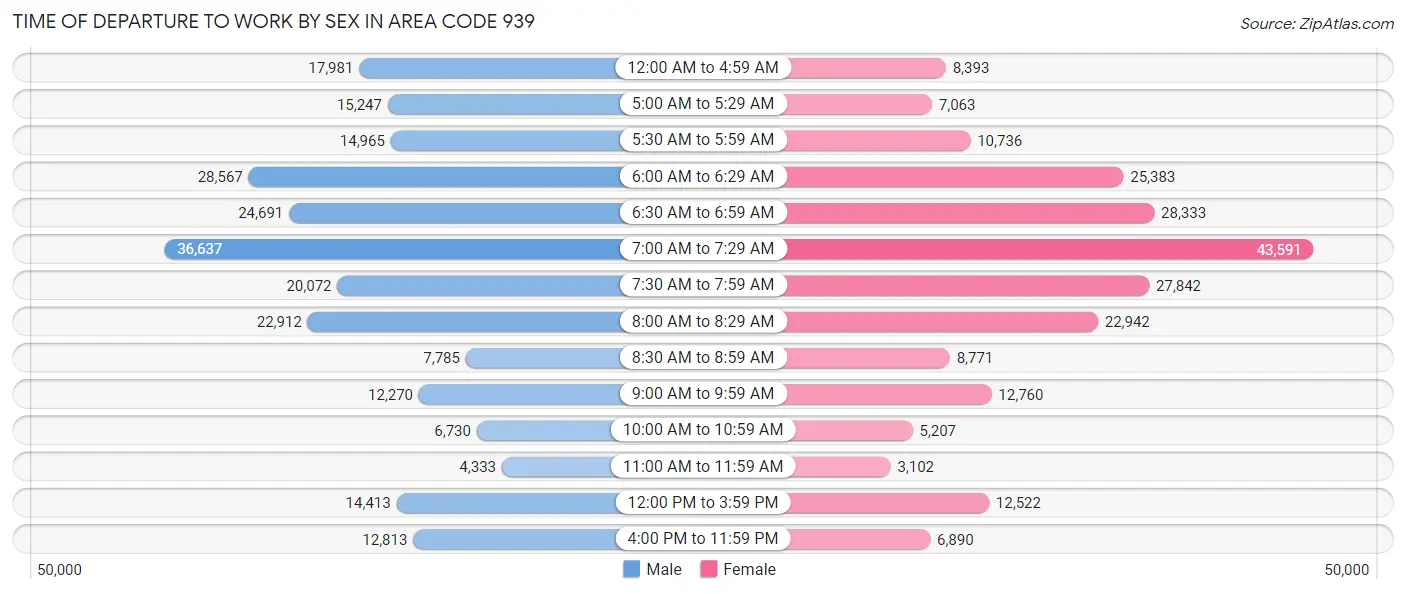
| Time of Departure | Male | Female |
| 12:00 AM to 4:59 AM | 17,981 (7.5%) | 8,393 (3.7%) |
| 5:00 AM to 5:29 AM | 15,247 (6.4%) | 7,063 (3.2%) |
| 5:30 AM to 5:59 AM | 14,965 (6.2%) | 10,736 (4.8%) |
| 6:00 AM to 6:29 AM | 28,567 (11.9%) | 25,383 (11.4%) |
| 6:30 AM to 6:59 AM | 24,691 (10.3%) | 28,333 (12.7%) |
| 7:00 AM to 7:29 AM | 36,637 (15.3%) | 43,591 (19.5%) |
| 7:30 AM to 7:59 AM | 20,072 (8.4%) | 27,842 (12.5%) |
| 8:00 AM to 8:29 AM | 22,912 (9.6%) | 22,942 (10.3%) |
| 8:30 AM to 8:59 AM | 7,785 (3.3%) | 8,771 (3.9%) |
| 9:00 AM to 9:59 AM | 12,270 (5.1%) | 12,760 (5.7%) |
| 10:00 AM to 10:59 AM | 6,730 (2.8%) | 5,207 (2.3%) |
| 11:00 AM to 11:59 AM | 4,333 (1.8%) | 3,102 (1.4%) |
| 12:00 PM to 3:59 PM | 14,413 (6.0%) | 12,522 (5.6%) |
| 4:00 PM to 11:59 PM | 12,813 (5.3%) | 6,890 (3.1%) |
| Total | 239,416 (100.0%) | 223,535 (100.0%) |
Housing Occupancy in Area Code 939
Occupancy by Ownership in Area Code 939
Of the total 557,993 dwellings in Area Code 939, owner-occupied units account for 377,243 (67.6%), while renter-occupied units make up 180,750 (32.4%).
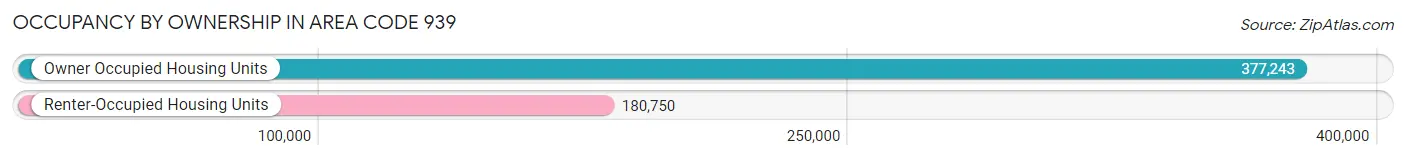
| Occupancy | # Housing Units | % Housing Units |
| Owner Occupied Housing Units | 377,243 | 67.6% |
| Renter-Occupied Housing Units | 180,750 | 32.4% |
| Total Occupied Housing Units | 557,993 | 100.0% |
Occupancy by Household Size in Area Code 939
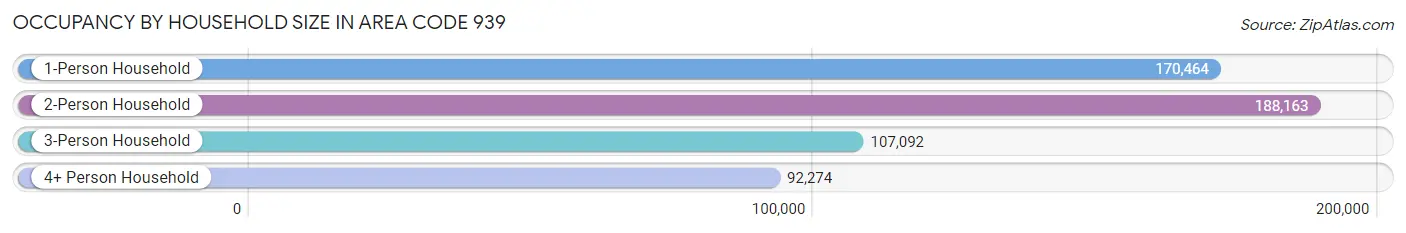
| Household Size | # Housing Units | % Housing Units |
| 1-Person Household | 170,464 | 30.5% |
| 2-Person Household | 188,163 | 33.7% |
| 3-Person Household | 107,092 | 19.2% |
| 4+ Person Household | 92,274 | 16.5% |
| Total Housing Units | 557,993 | 100.0% |
Occupancy by Ownership by Household Size in Area Code 939
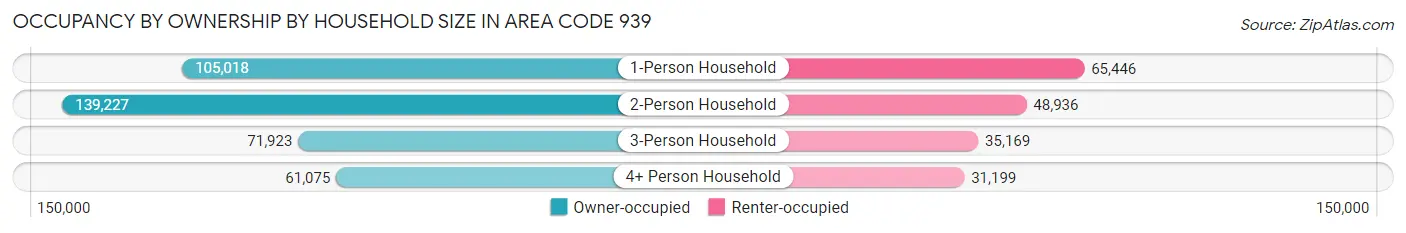
| Household Size | Owner-occupied | Renter-occupied |
| 1-Person Household | 105,018 (61.6%) | 65,446 (38.4%) |
| 2-Person Household | 139,227 (74.0%) | 48,936 (26.0%) |
| 3-Person Household | 71,923 (67.2%) | 35,169 (32.8%) |
| 4+ Person Household | 61,075 (66.2%) | 31,199 (33.8%) |
| Total Housing Units | 377,243 (67.6%) | 180,750 (32.4%) |
Occupancy by Educational Attainment in Area Code 939
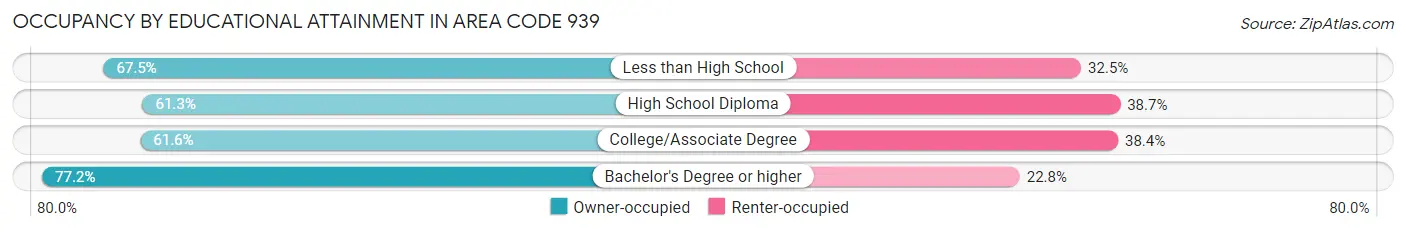
| Household Size | Owner-occupied | Renter-occupied |
| Less than High School | 70,336 (67.5%) | 33,881 (32.5%) |
| High School Diploma | 86,605 (61.3%) | 54,702 (38.7%) |
| College/Associate Degree | 82,911 (61.6%) | 51,630 (38.4%) |
| Bachelor's Degree or higher | 137,391 (77.2%) | 40,537 (22.8%) |
Occupancy by Age of Householder in Area Code 939
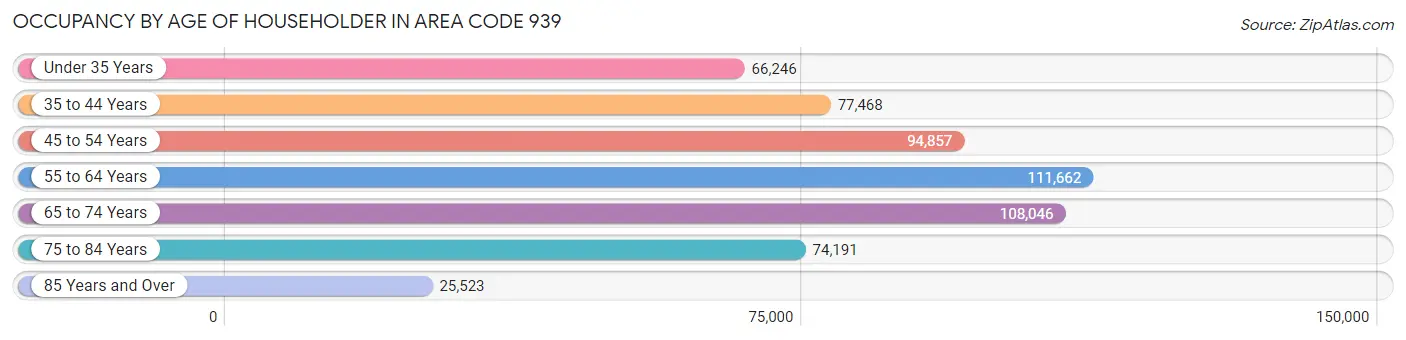
| Age Bracket | # Households | % Households |
| Under 35 Years | 66,246 | 11.9% |
| 35 to 44 Years | 77,468 | 13.9% |
| 45 to 54 Years | 94,857 | 17.0% |
| 55 to 64 Years | 111,662 | 20.0% |
| 65 to 74 Years | 108,046 | 19.4% |
| 75 to 84 Years | 74,191 | 13.3% |
| 85 Years and Over | 25,523 | 4.6% |
| Total | 557,993 | 100.0% |
Housing Finances in Area Code 939
Median Income by Occupancy in Area Code 939
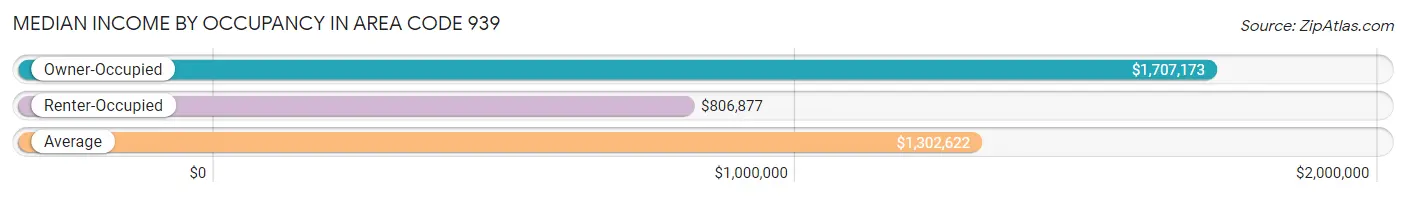
| Occupancy Type | # Households | Median Income |
| Owner-Occupied | 377,243 (67.6%) | $1,707,173 |
| Renter-Occupied | 180,750 (32.4%) | $806,877 |
| Average | 557,993 (100.0%) | $1,302,622 |
Occupancy by Householder Income Bracket in Area Code 939
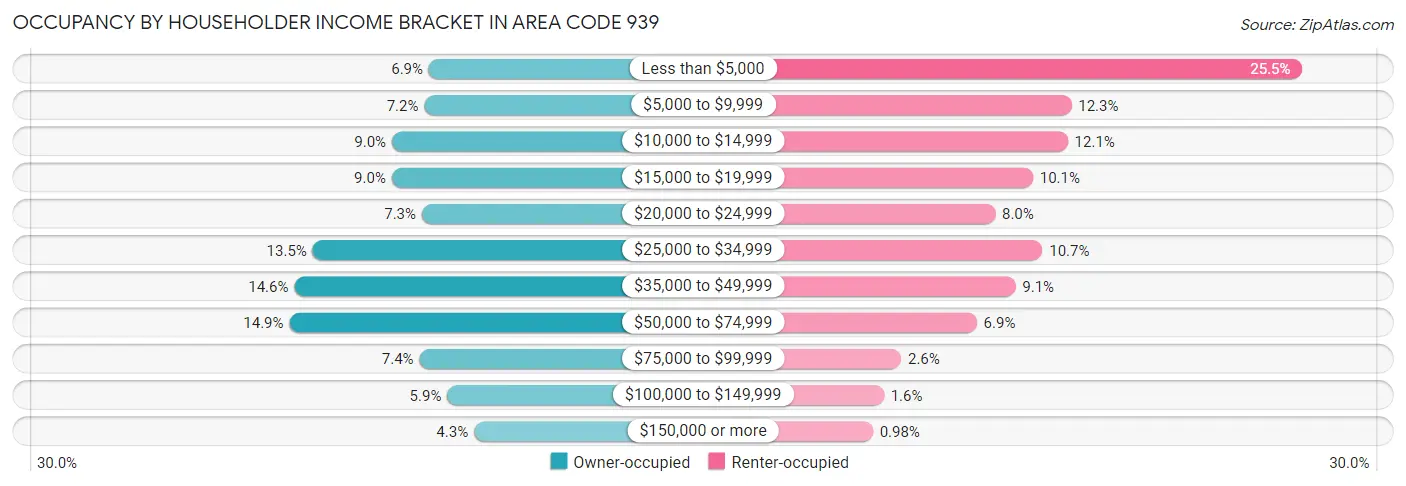
| Income Bracket | Owner-occupied | Renter-occupied |
| Less than $5,000 | 26,038 (6.9%) | 46,153 (25.5%) |
| $5,000 to $9,999 | 27,010 (7.2%) | 22,292 (12.3%) |
| $10,000 to $14,999 | 33,993 (9.0%) | 21,910 (12.1%) |
| $15,000 to $19,999 | 34,031 (9.0%) | 18,318 (10.1%) |
| $20,000 to $24,999 | 27,522 (7.3%) | 14,404 (8.0%) |
| $25,000 to $34,999 | 51,075 (13.5%) | 19,281 (10.7%) |
| $35,000 to $49,999 | 55,055 (14.6%) | 16,510 (9.1%) |
| $50,000 to $74,999 | 56,084 (14.9%) | 12,504 (6.9%) |
| $75,000 to $99,999 | 28,053 (7.4%) | 4,705 (2.6%) |
| $100,000 to $149,999 | 22,087 (5.9%) | 2,910 (1.6%) |
| $150,000 or more | 16,295 (4.3%) | 1,763 (1.0%) |
| Total | 377,243 (100.0%) | 180,750 (100.0%) |
Monthly Housing Cost Tiers in Area Code 939
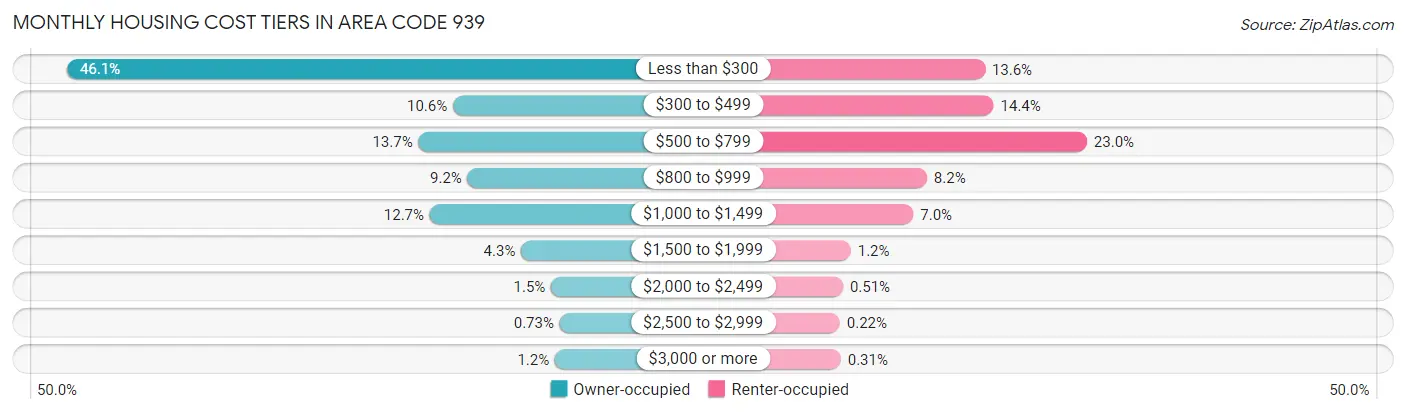
| Monthly Cost | Owner-occupied | Renter-occupied |
| Less than $300 | 173,901 (46.1%) | 24,552 (13.6%) |
| $300 to $499 | 39,828 (10.6%) | 25,987 (14.4%) |
| $500 to $799 | 51,827 (13.7%) | 41,516 (23.0%) |
| $800 to $999 | 34,731 (9.2%) | 14,887 (8.2%) |
| $1,000 to $1,499 | 47,888 (12.7%) | 12,643 (7.0%) |
| $1,500 to $1,999 | 16,164 (4.3%) | 2,227 (1.2%) |
| $2,000 to $2,499 | 5,724 (1.5%) | 930 (0.5%) |
| $2,500 to $2,999 | 2,756 (0.7%) | 391 (0.2%) |
| $3,000 or more | 4,424 (1.2%) | 560 (0.3%) |
| Total | 377,243 (100.0%) | 180,750 (100.0%) |
Physical Housing Characteristics in Area Code 939
Housing Structures in Area Code 939
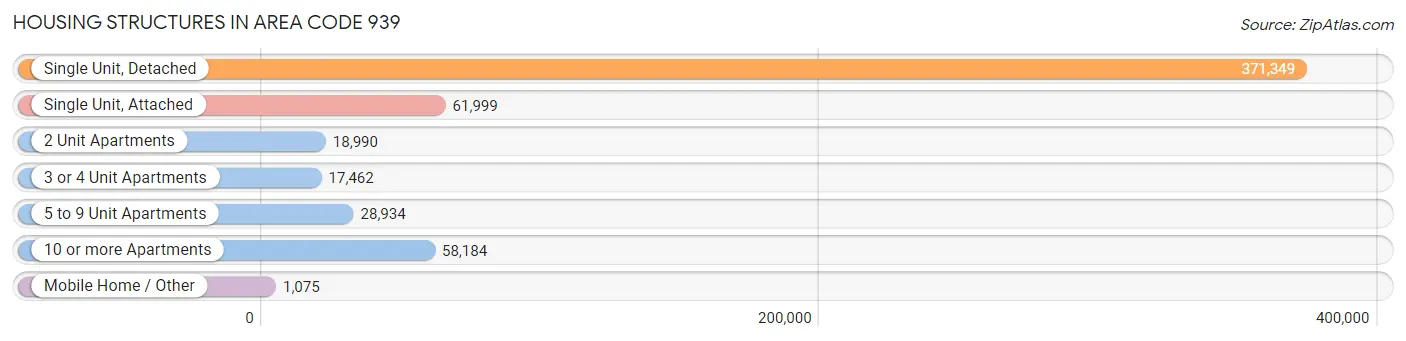
| Structure Type | # Housing Units | % Housing Units |
| Single Unit, Detached | 371,349 | 66.5% |
| Single Unit, Attached | 61,999 | 11.1% |
| 2 Unit Apartments | 18,990 | 3.4% |
| 3 or 4 Unit Apartments | 17,462 | 3.1% |
| 5 to 9 Unit Apartments | 28,934 | 5.2% |
| 10 or more Apartments | 58,184 | 10.4% |
| Mobile Home / Other | 1,075 | 0.2% |
| Total | 557,993 | 100.0% |
Housing Structures by Occupancy in Area Code 939
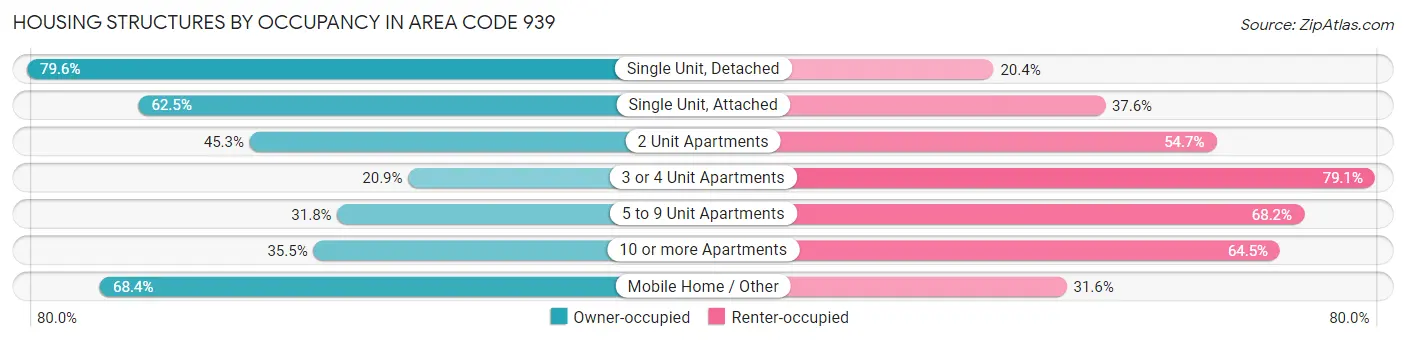
| Structure Type | Owner-occupied | Renter-occupied |
| Single Unit, Detached | 295,672 (79.6%) | 75,677 (20.4%) |
| Single Unit, Attached | 38,720 (62.5%) | 23,279 (37.6%) |
| 2 Unit Apartments | 8,604 (45.3%) | 10,386 (54.7%) |
| 3 or 4 Unit Apartments | 3,648 (20.9%) | 13,814 (79.1%) |
| 5 to 9 Unit Apartments | 9,206 (31.8%) | 19,728 (68.2%) |
| 10 or more Apartments | 20,658 (35.5%) | 37,526 (64.5%) |
| Mobile Home / Other | 735 (68.4%) | 340 (31.6%) |
| Total | 377,243 (67.6%) | 180,750 (32.4%) |
Housing Structures by Number of Rooms in Area Code 939
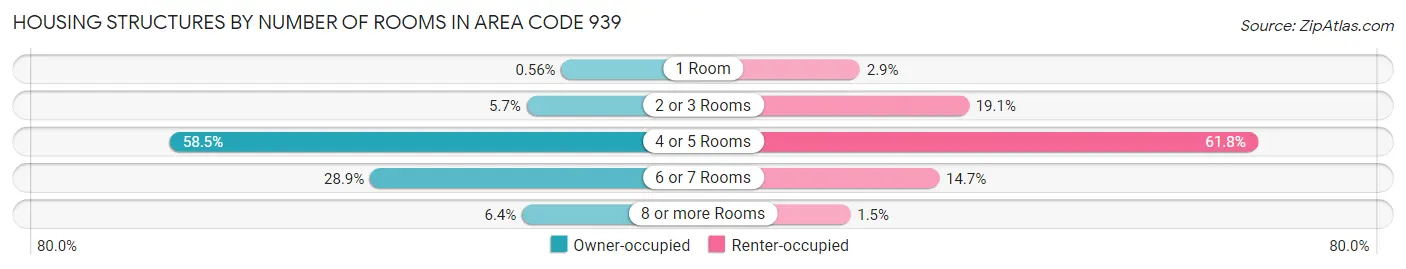
| Number of Rooms | Owner-occupied | Renter-occupied |
| 1 Room | 2,096 (0.6%) | 5,314 (2.9%) |
| 2 or 3 Rooms | 21,491 (5.7%) | 34,445 (19.1%) |
| 4 or 5 Rooms | 220,688 (58.5%) | 111,699 (61.8%) |
| 6 or 7 Rooms | 108,892 (28.9%) | 26,525 (14.7%) |
| 8 or more Rooms | 24,076 (6.4%) | 2,767 (1.5%) |
| Total | 377,243 (100.0%) | 180,750 (100.0%) |
Housing Structure by Heating Type in Area Code 939
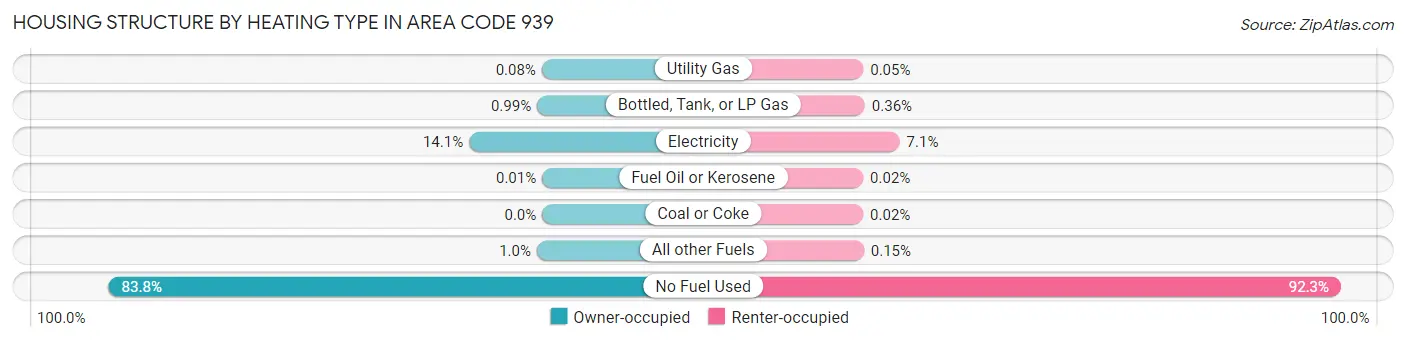
| Heating Type | Owner-occupied | Renter-occupied |
| Utility Gas | 320 (0.1%) | 87 (0.1%) |
| Bottled, Tank, or LP Gas | 3,739 (1.0%) | 658 (0.4%) |
| Electricity | 53,318 (14.1%) | 12,770 (7.1%) |
| Fuel Oil or Kerosene | 31 (0.0%) | 39 (0.0%) |
| Coal or Coke | 0 (0.0%) | 41 (0.0%) |
| All other Fuels | 3,877 (1.0%) | 277 (0.2%) |
| No Fuel Used | 315,958 (83.8%) | 166,878 (92.3%) |
| Total | 377,243 (100.0%) | 180,750 (100.0%) |
Household Vehicle Usage in Area Code 939
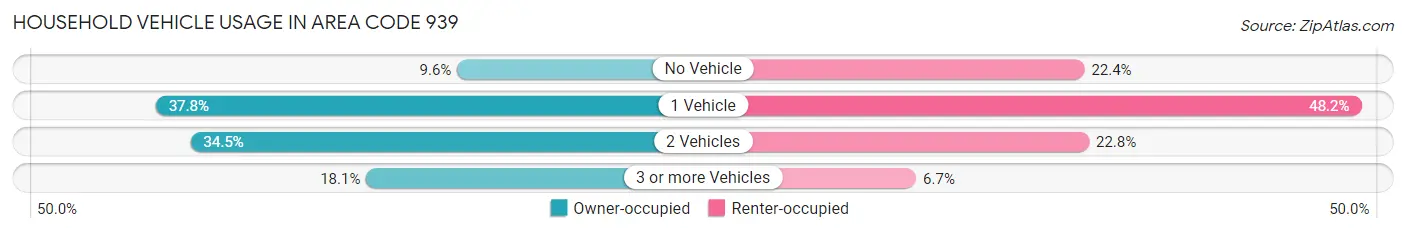
| Vehicles per Household | Owner-occupied | Renter-occupied |
| No Vehicle | 36,300 (9.6%) | 40,422 (22.4%) |
| 1 Vehicle | 142,431 (37.8%) | 87,119 (48.2%) |
| 2 Vehicles | 130,211 (34.5%) | 41,184 (22.8%) |
| 3 or more Vehicles | 68,301 (18.1%) | 12,025 (6.7%) |
| Total | 377,243 (100.0%) | 180,750 (100.0%) |
Real Estate & Mortgages in Area Code 939
Real Estate and Mortgage Overview in Area Code 939
| Characteristic | Without Mortgage | With Mortgage |
| Housing Units | 222,101 | 155,142 |
| Median Property Value | $6,650,400 | $7,794,100 |
| Median Household Income | $1,306,320 | $10,307 |
| Monthly Housing Costs | $10,502 | $4,283 |
| Real Estate Taxes | $29,407 | $122,651 |
Property Value by Mortgage Status in Area Code 939

| Property Value | Without Mortgage | With Mortgage |
| Less than $50,000 | 21,189 (9.5%) | 2,139 (1.4%) |
| $50,000 to $99,999 | 69,155 (31.1%) | 20,615 (13.3%) |
| $100,000 to $299,999 | 118,050 (53.1%) | 118,711 (76.5%) |
| $300,000 to $499,999 | 8,560 (3.8%) | 9,177 (5.9%) |
| $500,000 to $749,999 | 2,447 (1.1%) | 2,488 (1.6%) |
| $750,000 to $999,999 | 666 (0.3%) | 928 (0.6%) |
| $1,000,000 or more | 2,034 (0.9%) | 1,084 (0.7%) |
| Total | 222,101 (100.0%) | 155,142 (100.0%) |
Household Income by Mortgage Status in Area Code 939
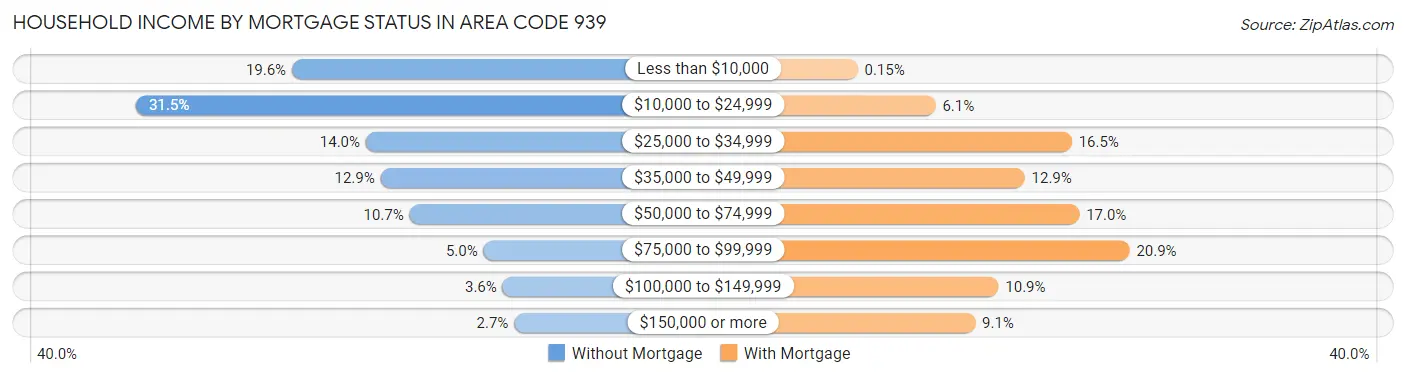
| Household Income | Without Mortgage | With Mortgage |
| Less than $10,000 | 43,596 (19.6%) | 229 (0.2%) |
| $10,000 to $24,999 | 69,994 (31.5%) | 9,452 (6.1%) |
| $25,000 to $34,999 | 31,087 (14.0%) | 25,552 (16.5%) |
| $35,000 to $49,999 | 28,616 (12.9%) | 19,988 (12.9%) |
| $50,000 to $74,999 | 23,703 (10.7%) | 26,439 (17.0%) |
| $75,000 to $99,999 | 11,166 (5.0%) | 32,381 (20.9%) |
| $100,000 to $149,999 | 7,951 (3.6%) | 16,887 (10.9%) |
| $150,000 or more | 5,988 (2.7%) | 14,136 (9.1%) |
| Total | 222,101 (100.0%) | 155,142 (100.0%) |
Property Value to Household Income Ratio in Area Code 939
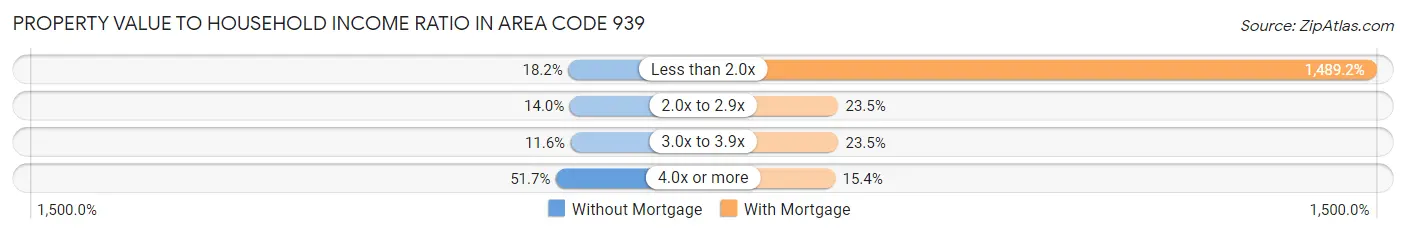
| Value-to-Income Ratio | Without Mortgage | With Mortgage |
| Less than 2.0x | 40,372 (18.2%) | 2,310,387 (1,489.2%) |
| 2.0x to 2.9x | 31,036 (14.0%) | 36,462 (23.5%) |
| 3.0x to 3.9x | 25,784 (11.6%) | 36,461 (23.5%) |
| 4.0x or more | 114,829 (51.7%) | 23,863 (15.4%) |
| Total | 222,101 (100.0%) | 155,142 (100.0%) |
Real Estate Taxes by Mortgage Status in Area Code 939
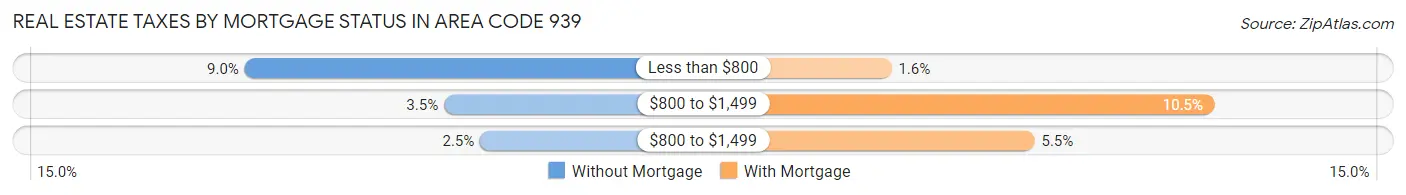
| Property Taxes | Without Mortgage | With Mortgage |
| Less than $800 | 19,915 (9.0%) | 2,481 (1.6%) |
| $800 to $1,499 | 7,787 (3.5%) | 16,225 (10.5%) |
| $800 to $1,499 | 5,598 (2.5%) | 8,569 (5.5%) |
| Total | 222,101 (100.0%) | 155,142 (100.0%) |
Health & Disability in Area Code 939
Health Insurance Coverage by Age in Area Code 939
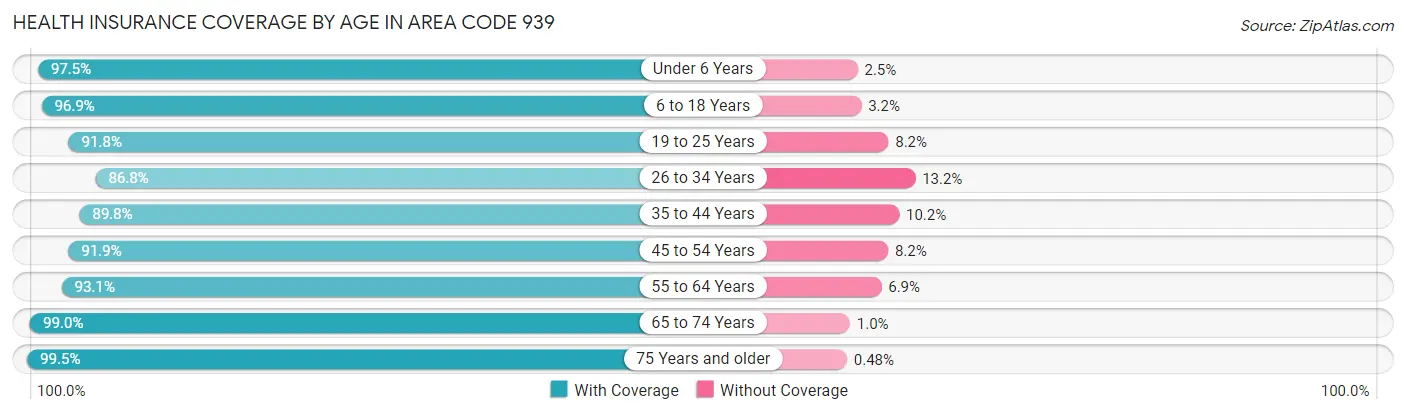
| Age Bracket | With Coverage | Without Coverage |
| Under 6 Years | 61,026 (97.5%) | 1,544 (2.5%) |
| 6 to 18 Years | 199,411 (96.9%) | 6,480 (3.2%) |
| 19 to 25 Years | 129,768 (91.8%) | 11,595 (8.2%) |
| 26 to 34 Years | 142,416 (86.8%) | 21,695 (13.2%) |
| 35 to 44 Years | 153,789 (89.8%) | 17,481 (10.2%) |
| 45 to 54 Years | 168,230 (91.8%) | 14,924 (8.2%) |
| 55 to 64 Years | 182,655 (93.1%) | 13,540 (6.9%) |
| 65 to 74 Years | 167,250 (99.0%) | 1,735 (1.0%) |
| 75 Years and older | 155,821 (99.5%) | 759 (0.5%) |
| Total | 1,360,366 (93.8%) | 89,753 (6.2%) |
Health Insurance Coverage by Citizenship Status in Area Code 939
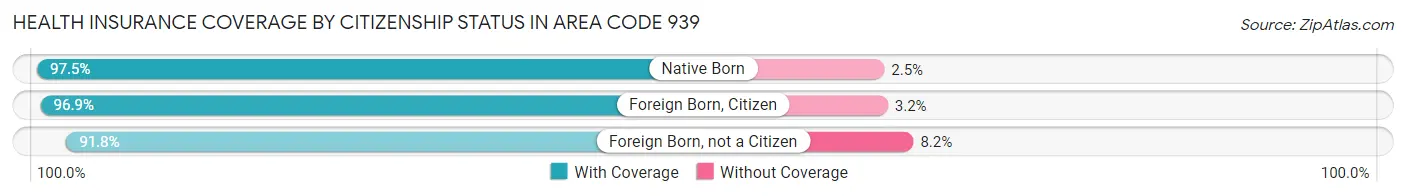
| Citizenship Status | With Coverage | Without Coverage |
| Native Born | 61,026 (97.5%) | 1,544 (2.5%) |
| Foreign Born, Citizen | 199,411 (96.9%) | 6,480 (3.2%) |
| Foreign Born, not a Citizen | 129,768 (91.8%) | 11,595 (8.2%) |
Health Insurance Coverage by Household Income in Area Code 939
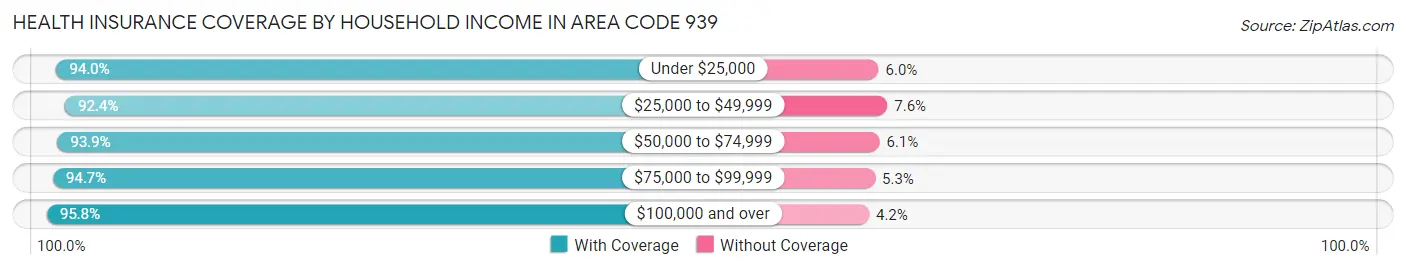
| Household Income | With Coverage | Without Coverage |
| Under $25,000 | 547,679 (94.0%) | 34,713 (6.0%) |
| $25,000 to $49,999 | 359,276 (92.4%) | 29,509 (7.6%) |
| $50,000 to $74,999 | 203,546 (93.9%) | 13,315 (6.1%) |
| $75,000 to $99,999 | 104,253 (94.7%) | 5,835 (5.3%) |
| $100,000 and over | 139,578 (95.8%) | 6,068 (4.2%) |
Public vs Private Health Insurance Coverage by Age in Area Code 939
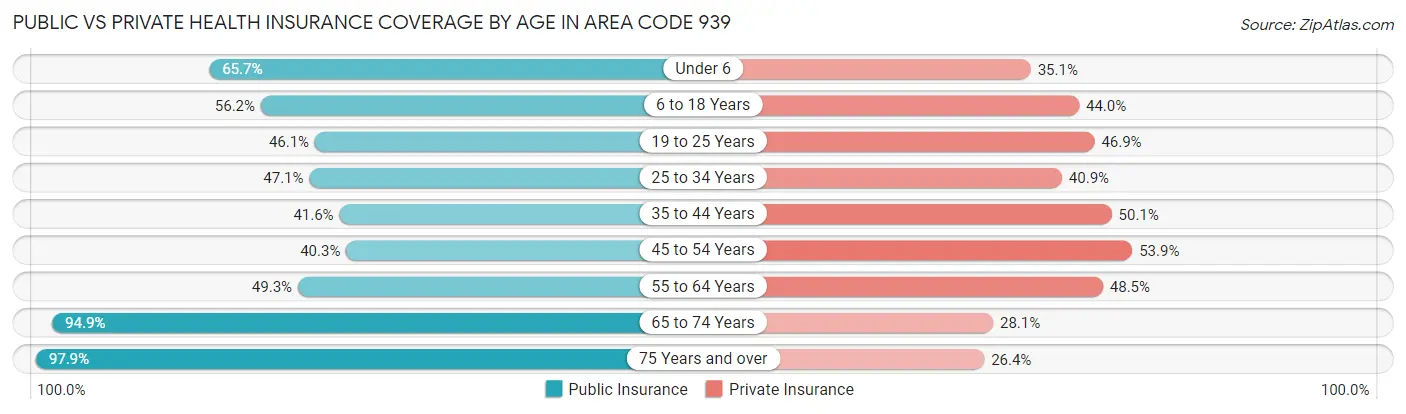
| Age Bracket | Public Insurance | Private Insurance |
| Under 6 | 41,122 (65.7%) | 21,942 (35.1%) |
| 6 to 18 Years | 115,612 (56.1%) | 90,664 (44.0%) |
| 19 to 25 Years | 65,182 (46.1%) | 66,302 (46.9%) |
| 25 to 34 Years | 77,363 (47.1%) | 67,052 (40.9%) |
| 35 to 44 Years | 71,176 (41.6%) | 85,764 (50.1%) |
| 45 to 54 Years | 73,814 (40.3%) | 98,736 (53.9%) |
| 55 to 64 Years | 96,668 (49.3%) | 95,072 (48.5%) |
| 65 to 74 Years | 160,331 (94.9%) | 47,441 (28.1%) |
| 75 Years and over | 153,289 (97.9%) | 41,378 (26.4%) |
| Total | 854,557 (58.9%) | 614,351 (42.4%) |
Disability Status by Sex by Age in Area Code 939
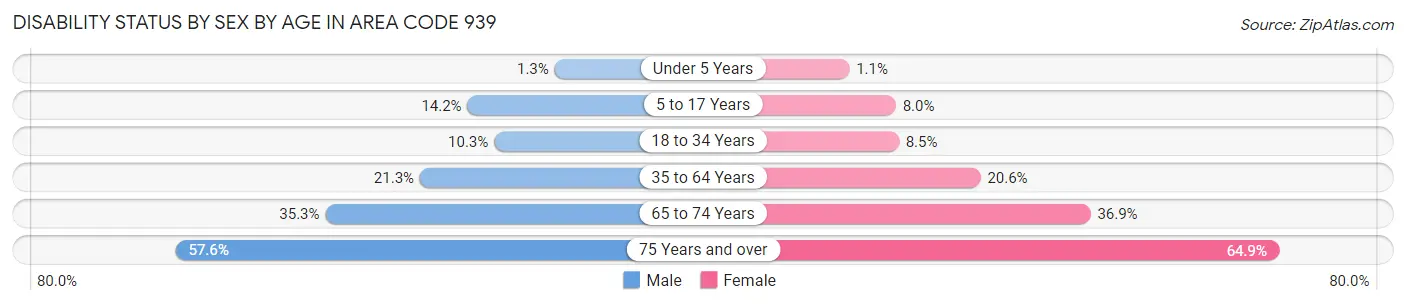
| Age Bracket | Male | Female |
| Under 5 Years | 332 (1.3%) | 268 (1.1%) |
| 5 to 17 Years | 14,316 (14.2%) | 7,853 (8.0%) |
| 18 to 34 Years | 16,717 (10.3%) | 13,747 (8.5%) |
| 35 to 64 Years | 53,667 (21.3%) | 61,475 (20.6%) |
| 65 to 74 Years | 26,029 (35.3%) | 35,203 (36.9%) |
| 75 Years and over | 36,668 (57.6%) | 60,270 (64.9%) |
Disability Class by Sex by Age in Area Code 939
Disability Class: Hearing Difficulty
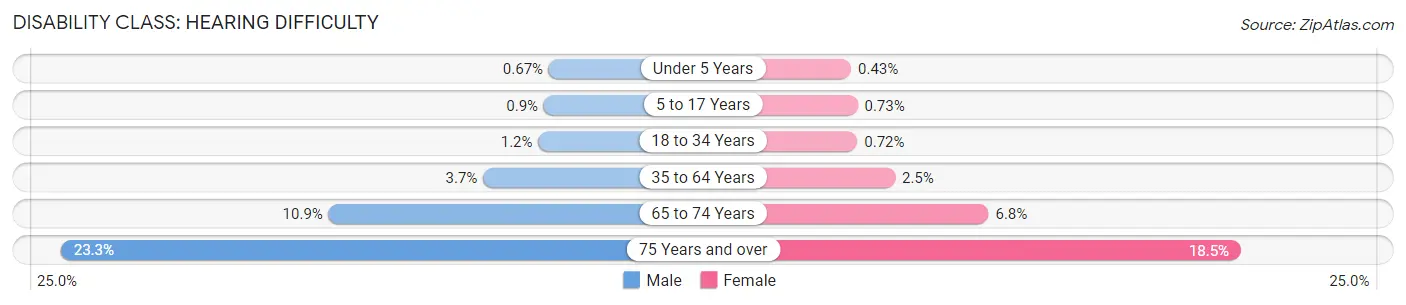
| Age Bracket | Male | Female |
| Under 5 Years | 171 (0.7%) | 106 (0.4%) |
| 5 to 17 Years | 906 (0.9%) | 714 (0.7%) |
| 18 to 34 Years | 1,887 (1.2%) | 1,179 (0.7%) |
| 35 to 64 Years | 9,384 (3.7%) | 7,362 (2.5%) |
| 65 to 74 Years | 8,019 (10.9%) | 6,496 (6.8%) |
| 75 Years and over | 14,848 (23.3%) | 17,201 (18.5%) |
Disability Class: Vision Difficulty
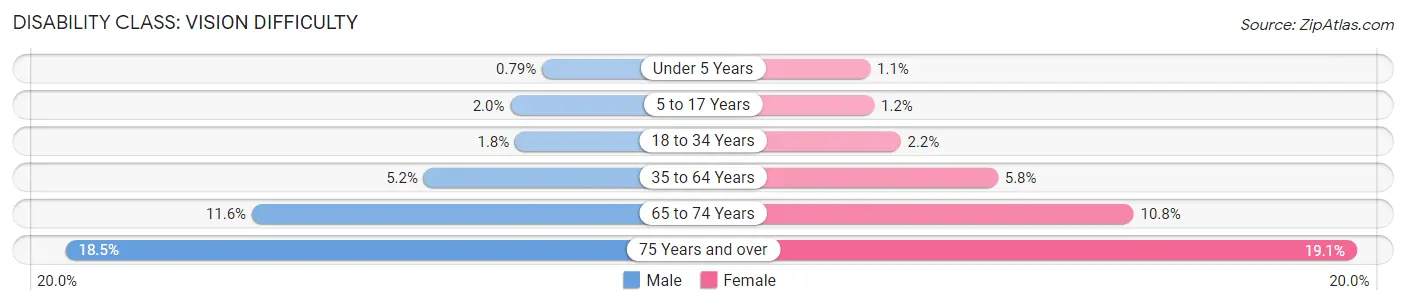
| Age Bracket | Male | Female |
| Under 5 Years | 201 (0.8%) | 257 (1.1%) |
| 5 to 17 Years | 1,983 (2.0%) | 1,175 (1.2%) |
| 18 to 34 Years | 2,913 (1.8%) | 3,543 (2.2%) |
| 35 to 64 Years | 13,050 (5.2%) | 17,301 (5.8%) |
| 65 to 74 Years | 8,513 (11.6%) | 10,323 (10.8%) |
| 75 Years and over | 11,768 (18.5%) | 17,761 (19.1%) |
Disability Class: Cognitive Difficulty
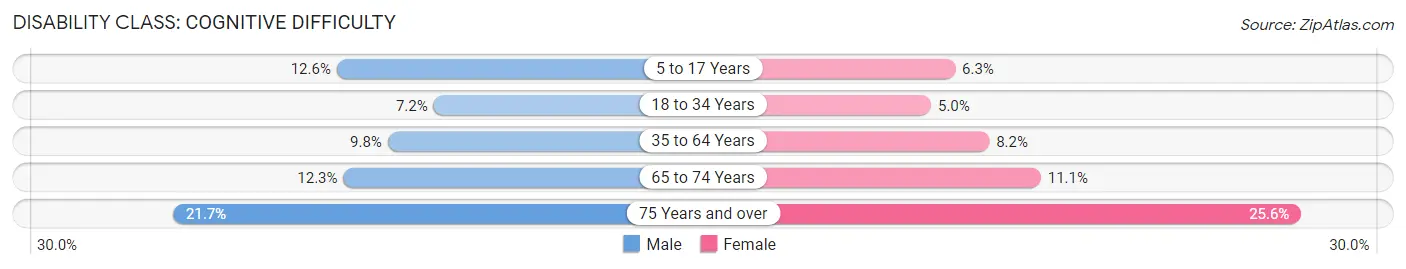
| Age Bracket | Male | Female |
| 5 to 17 Years | 12,685 (12.6%) | 6,185 (6.3%) |
| 18 to 34 Years | 11,757 (7.2%) | 8,091 (5.0%) |
| 35 to 64 Years | 24,652 (9.8%) | 24,507 (8.2%) |
| 65 to 74 Years | 9,018 (12.2%) | 10,561 (11.1%) |
| 75 Years and over | 13,846 (21.7%) | 23,766 (25.6%) |
Disability Class: Ambulatory Difficulty
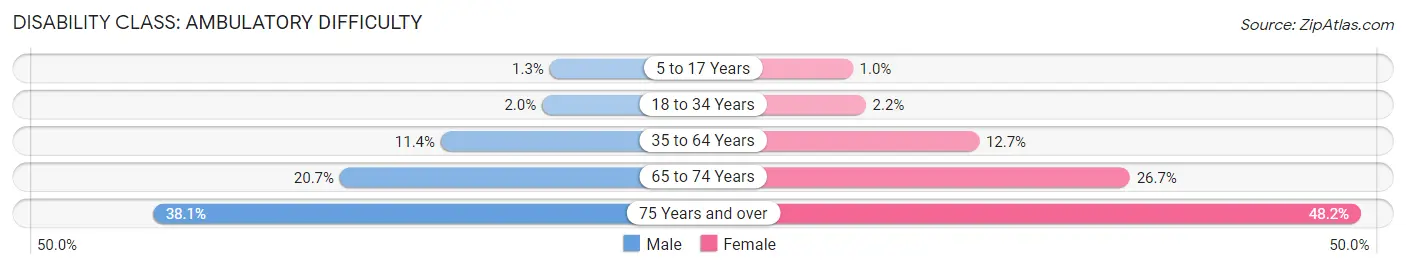
| Age Bracket | Male | Female |
| 5 to 17 Years | 1,281 (1.3%) | 985 (1.0%) |
| 18 to 34 Years | 3,216 (2.0%) | 3,593 (2.2%) |
| 35 to 64 Years | 28,642 (11.4%) | 38,022 (12.7%) |
| 65 to 74 Years | 15,272 (20.7%) | 25,474 (26.7%) |
| 75 Years and over | 24,268 (38.1%) | 44,759 (48.2%) |
Disability Class: Self-Care Difficulty
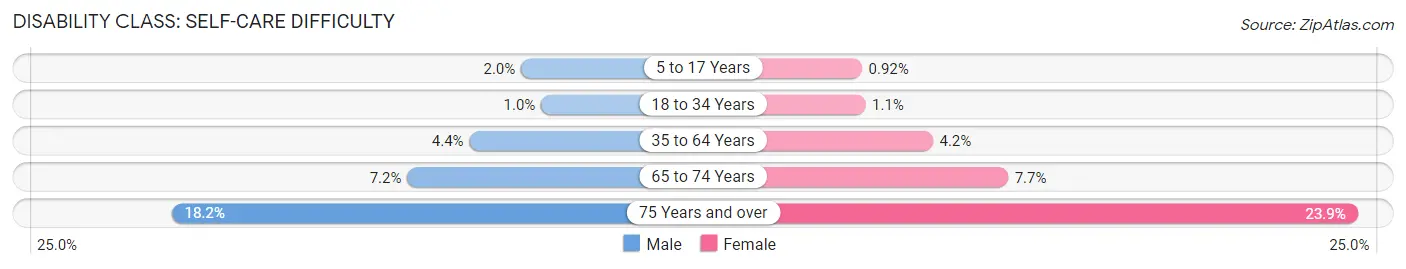
| Age Bracket | Male | Female |
| 5 to 17 Years | 1,970 (2.0%) | 898 (0.9%) |
| 18 to 34 Years | 1,668 (1.0%) | 1,750 (1.1%) |
| 35 to 64 Years | 10,979 (4.4%) | 12,584 (4.2%) |
| 65 to 74 Years | 5,332 (7.2%) | 7,344 (7.7%) |
| 75 Years and over | 11,577 (18.2%) | 22,231 (23.9%) |
Technology Access in Area Code 939
Computing Device Access in Area Code 939
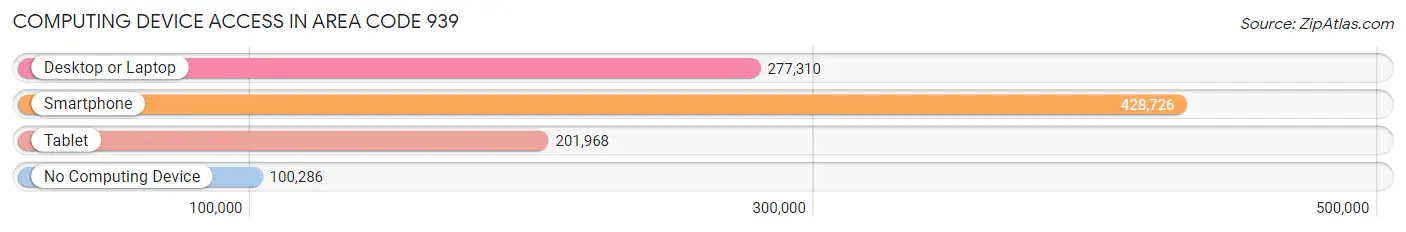
| Device Type | # Households | % Households |
| Desktop or Laptop | 277,310 | 49.7% |
| Smartphone | 428,726 | 76.8% |
| Tablet | 201,968 | 36.2% |
| No Computing Device | 100,286 | 18.0% |
| Total | 557,993 | 100.0% |
Internet Access in Area Code 939
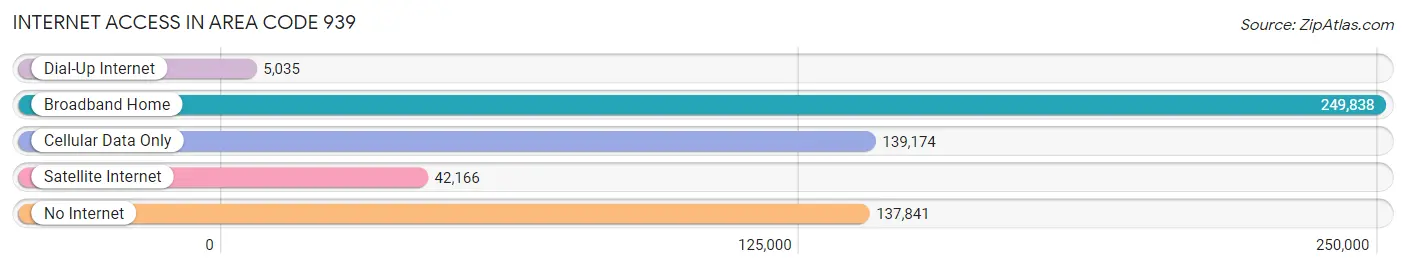
| Internet Type | # Households | % Households |
| Dial-Up Internet | 5,035 | 0.9% |
| Broadband Home | 249,838 | 44.8% |
| Cellular Data Only | 139,174 | 24.9% |
| Satellite Internet | 42,166 | 7.6% |
| No Internet | 137,841 | 24.7% |
| Total | 557,993 | 100.0% |
Area Code 939 Summary
Geography
Area code 939 is a telephone area code in the North American Numbering Plan (NANP) for Puerto Rico. It was created in 2001 when the original area code, 809, was split. The 939 area code covers the entire island of Puerto Rico.
Social
The 939 area code is a symbol of Puerto Rico's identity and culture. It is a reminder of the island's unique history and its place in the world. It is also a reminder of the strong ties between Puerto Rico and the United States.
Economics
The 939 area code is an important part of the Puerto Rican economy. It is used by businesses and individuals to communicate with each other and with customers and suppliers around the world. It is also used by government agencies to provide services to citizens.
Demographics
The 939 area code is used by a diverse population. It is used by people of all ages, races, and backgrounds. It is also used by people from different parts of the world, including the United States, Latin America, and the Caribbean.
Common Questions
What is Per Capita Income in Area Code 939?
Per Capita income in Area Code 939 is $18,112.
What is the Median Family Income in Area Code 939?
Median Family Income in Area Code 939 is $33,910.
What is the Median Household income in Area Code 939?
Median Household Income in Area Code 939 is $26,584.
What is Income or Wage Gap in Area Code 939?
Income or Wage Gap in Area Code 939 is 10.4%.
Women in Area Code 939 earn 89.6 cents for every dollar earned by a man.
What is Family Income Deficit in Area Code 939?
Family Income Deficit in Area Code 939 is $11,334.
Families that are below poverty line in Area Code 939 earn $11,334 less on average than the poverty threshold level.
What is Inequality or Gini Index in Area Code 939?
Inequality or Gini Index in Area Code 939 is 25.91.
What is the Total Population of Area Code 939?
Total Population of Area Code 939 is 1,462,252.
What is the Total Male Population of Area Code 939?
Total Male Population of Area Code 939 is 685,396.
What is the Total Female Population of Area Code 939?
Total Female Population of Area Code 939 is 776,856.
What is the Ratio of Males per 100 Females in Area Code 939?
There are 88.23 Males per 100 Females in Area Code 939.
What is the Ratio of Females per 100 Males in Area Code 939?
There are 113.34 Females per 100 Males in Area Code 939.
What is the Median Population Age in Area Code 939?
Median Population Age in Area Code 939 is 44.4 Years.
What is the Average Family Size in Area Code 939
Average Family Size in Area Code 939 is 3.3 People.
What is the Average Household Size in Area Code 939
Average Household Size in Area Code 939 is 2.6 People.
How Large is the Labor Force in Area Code 939?
There are 570,622 People in the Labor Forcein in Area Code 939.
What is the Percentage of People in the Labor Force in Area Code 939?
45.7% of People are in the Labor Force in Area Code 939.
What is the Unemployment Rate in Area Code 939?
Unemployment Rate in Area Code 939 is 13.6%.