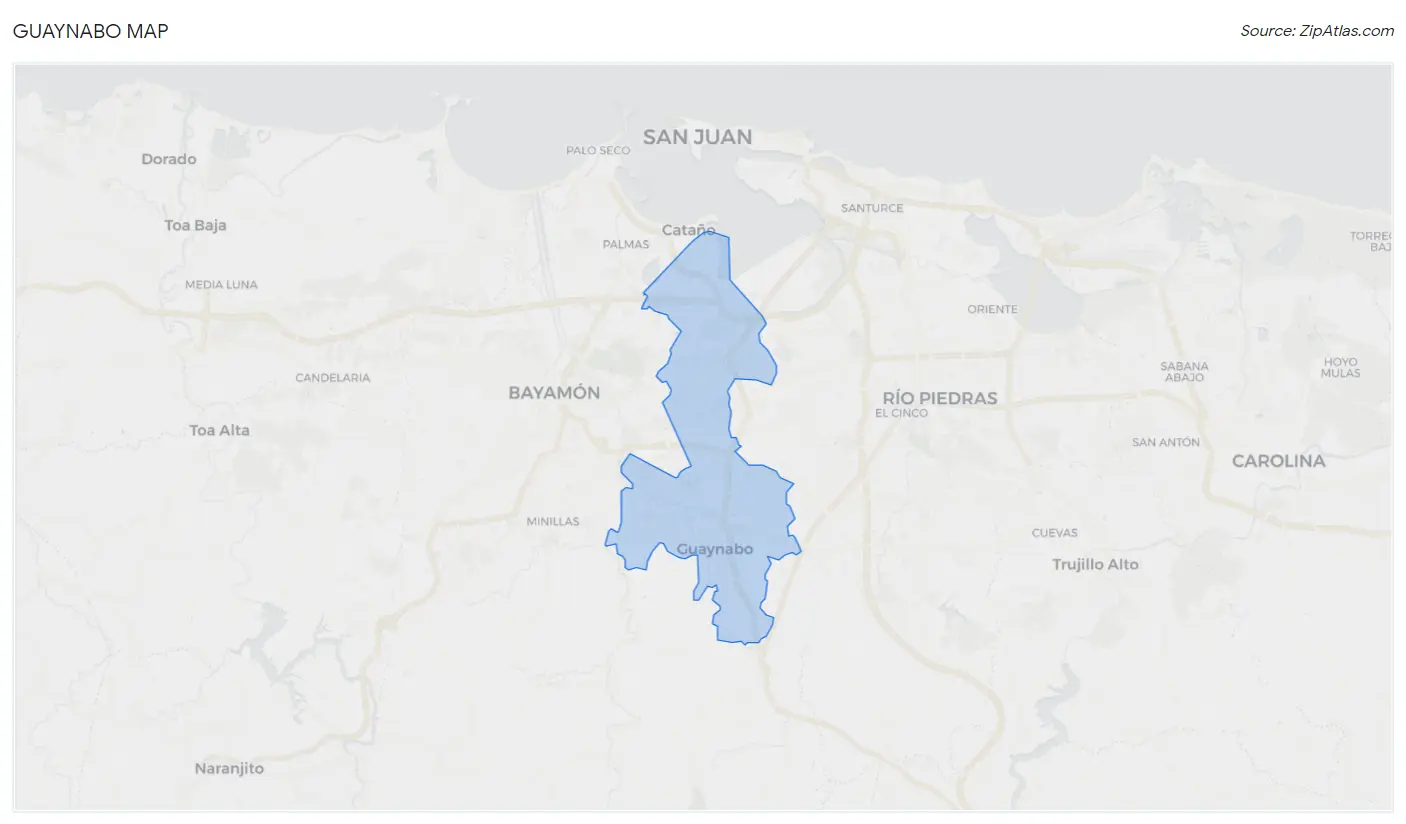
Guaynabo, PR Map & Demographics
Guaynabo Map
Guaynabo Overview
$32,208
PER CAPITA INCOME
$65,160
AVG FAMILY INCOME
$50,640
AVG HOUSEHOLD INCOME
13.4%
WAGE / INCOME GAP [ % ]
86.6¢/ $1
WAGE / INCOME GAP [ $ ]
$10,174
FAMILY INCOME DEFICIT
0.54
INEQUALITY / GINI INDEX
70,167
TOTAL POPULATION
32,305
MALE POPULATION
37,862
FEMALE POPULATION
85.32
MALES / 100 FEMALES
117.20
FEMALES / 100 MALES
46.6
MEDIAN AGE
3.3
AVG FAMILY SIZE
2.6
AVG HOUSEHOLD SIZE
32,195
LABOR FORCE [ PEOPLE ]
52.6%
PERCENT IN LABOR FORCE
8.1%
UNEMPLOYMENT RATE
Income in Guaynabo
Income Overview in Guaynabo
Per Capita Income in Guaynabo is $32,208, while median incomes of families and households are $65,160 and $50,640 respectively.
| Characteristic | Number | Measure |
| Per Capita Income | 70,167 | $32,208 |
| Median Family Income | 17,028 | $65,160 |
| Mean Family Income | 17,028 | $95,091 |
| Median Household Income | 26,931 | $50,640 |
| Mean Household Income | 26,931 | $79,073 |
| Income Deficit | 17,028 | $10,174 |
| Wage / Income Gap (%) | 70,167 | 13.40% |
| Wage / Income Gap ($) | 70,167 | 86.60¢ per $1 |
| Gini / Inequality Index | 70,167 | 0.54 |
Earnings by Sex in Guaynabo
Average Earnings in Guaynabo are $29,803, $32,431 for men and $28,085 for women, a difference of 13.4%.
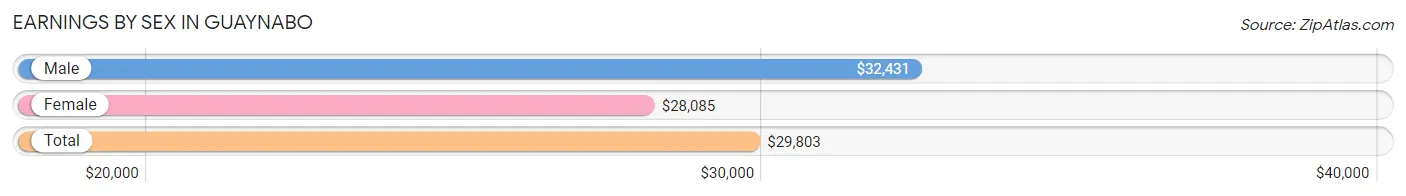
| Sex | Number | Average Earnings |
| Male | 16,212 (51.2%) | $32,431 |
| Female | 15,475 (48.8%) | $28,085 |
| Total | 31,687 (100.0%) | $29,803 |
Earnings by Sex by Income Bracket in Guaynabo
The most common earnings brackets in Guaynabo are $100,000+ for men (2,545 | 15.7%) and $100,000+ for women (1,385 | 8.9%).
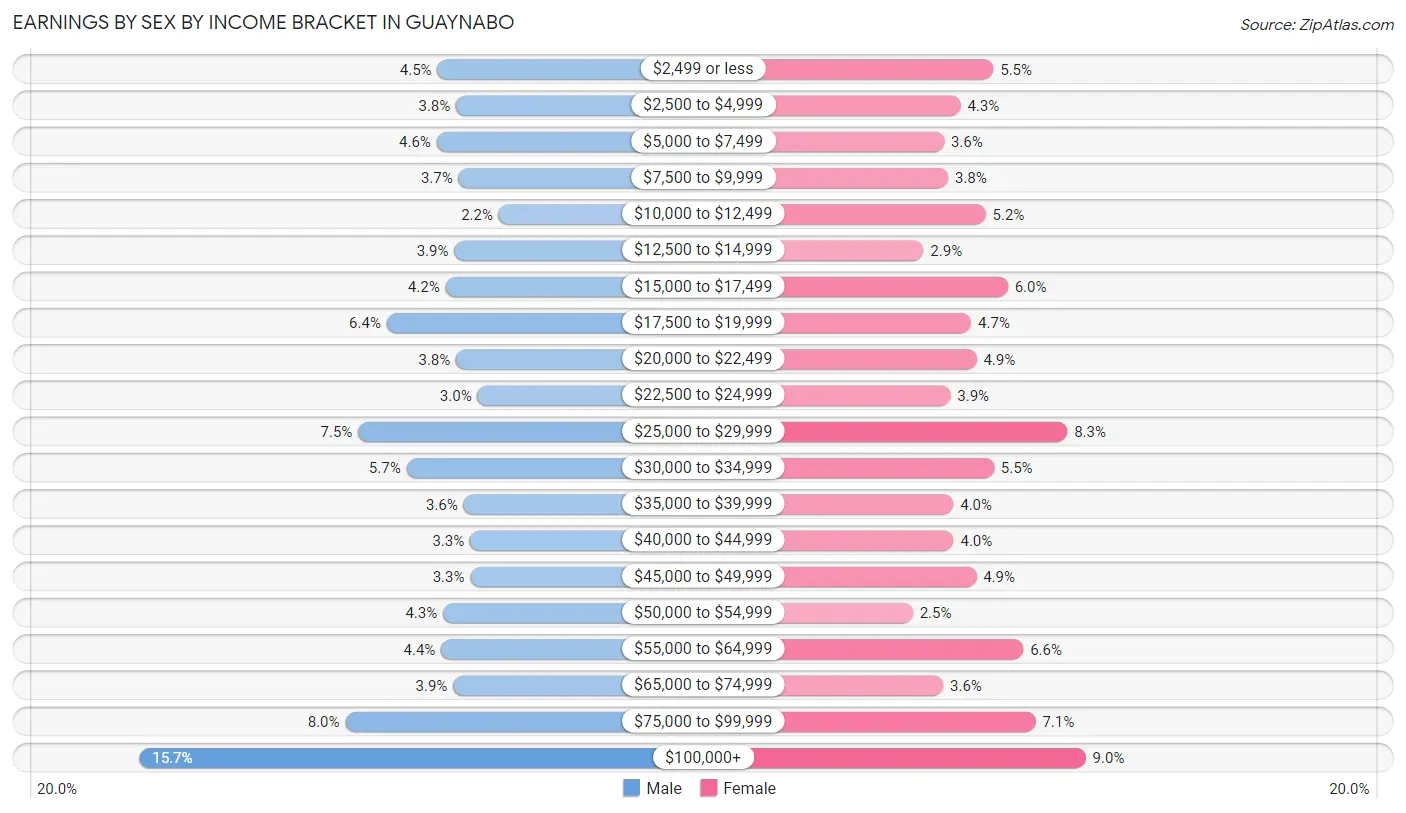
| Income | Male | Female |
| $2,499 or less | 735 (4.5%) | 850 (5.5%) |
| $2,500 to $4,999 | 621 (3.8%) | 660 (4.3%) |
| $5,000 to $7,499 | 739 (4.6%) | 564 (3.6%) |
| $7,500 to $9,999 | 607 (3.7%) | 586 (3.8%) |
| $10,000 to $12,499 | 362 (2.2%) | 805 (5.2%) |
| $12,500 to $14,999 | 633 (3.9%) | 444 (2.9%) |
| $15,000 to $17,499 | 686 (4.2%) | 933 (6.0%) |
| $17,500 to $19,999 | 1,043 (6.4%) | 721 (4.7%) |
| $20,000 to $22,499 | 621 (3.8%) | 752 (4.9%) |
| $22,500 to $24,999 | 491 (3.0%) | 601 (3.9%) |
| $25,000 to $29,999 | 1,216 (7.5%) | 1,278 (8.3%) |
| $30,000 to $34,999 | 923 (5.7%) | 852 (5.5%) |
| $35,000 to $39,999 | 576 (3.5%) | 617 (4.0%) |
| $40,000 to $44,999 | 536 (3.3%) | 619 (4.0%) |
| $45,000 to $49,999 | 535 (3.3%) | 750 (4.9%) |
| $50,000 to $54,999 | 700 (4.3%) | 383 (2.5%) |
| $55,000 to $64,999 | 711 (4.4%) | 1,023 (6.6%) |
| $65,000 to $74,999 | 639 (3.9%) | 558 (3.6%) |
| $75,000 to $99,999 | 1,293 (8.0%) | 1,094 (7.1%) |
| $100,000+ | 2,545 (15.7%) | 1,385 (8.9%) |
| Total | 16,212 (100.0%) | 15,475 (100.0%) |
Earnings by Sex by Educational Attainment in Guaynabo
Average earnings in Guaynabo are $34,773 for men and $30,074 for women, a difference of 13.5%. Men with an educational attainment of graduate degree enjoy the highest average annual earnings of $78,125, while those with less than high school education earn the least with $12,260. Women with an educational attainment of graduate degree earn the most with the average annual earnings of $48,854, while those with high school diploma education have the smallest earnings of $13,500.
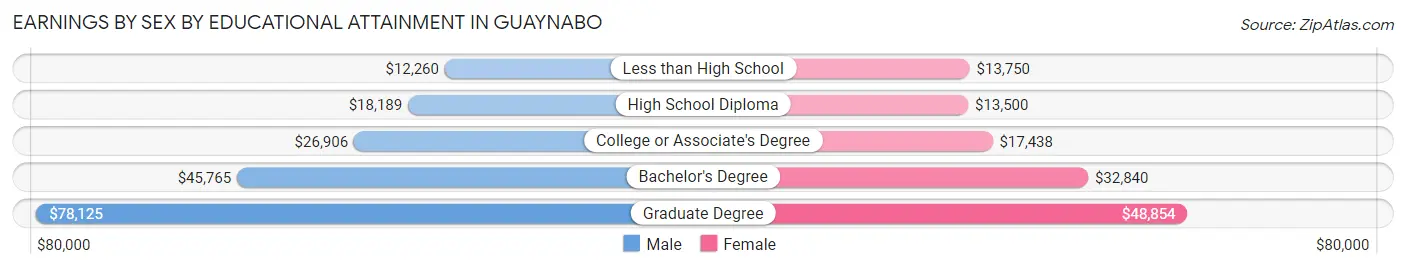
| Educational Attainment | Male Income | Female Income |
| Less than High School | $12,260 | $13,750 |
| High School Diploma | $18,189 | $13,500 |
| College or Associate's Degree | $26,906 | $17,438 |
| Bachelor's Degree | $45,765 | $32,840 |
| Graduate Degree | $78,125 | $48,854 |
| Total | $34,773 | $30,074 |
Family Income in Guaynabo
Family Income Brackets in Guaynabo
According to the Guaynabo family income data, there are 2,912 families falling into the $50,000 to $74,999 income range, which is the most common income bracket and makes up 17.1% of all families. Conversely, the $10,000 to $14,999 income bracket is the least frequent group with only 749 families (4.4%) belonging to this category.
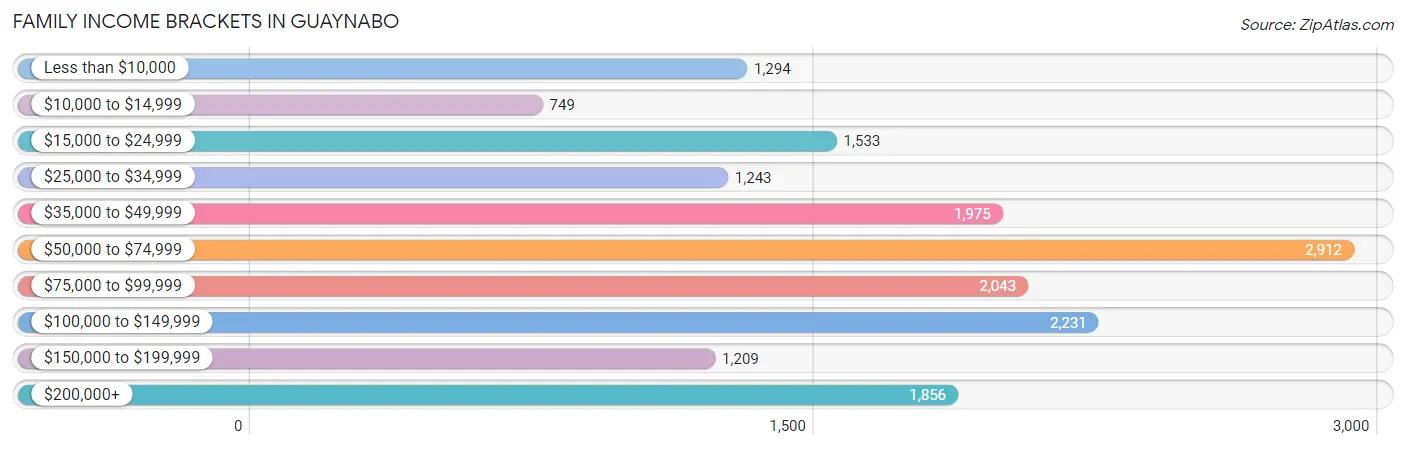
| Income Bracket | # Families | % Families |
| Less than $10,000 | 1,294 | 7.6% |
| $10,000 to $14,999 | 749 | 4.4% |
| $15,000 to $24,999 | 1,533 | 9.0% |
| $25,000 to $34,999 | 1,243 | 7.3% |
| $35,000 to $49,999 | 1,975 | 11.6% |
| $50,000 to $74,999 | 2,912 | 17.1% |
| $75,000 to $99,999 | 2,043 | 12.0% |
| $100,000 to $149,999 | 2,231 | 13.1% |
| $150,000 to $199,999 | 1,209 | 7.1% |
| $200,000+ | 1,856 | 10.9% |
Family Income by Famaliy Size in Guaynabo
5-person families (667 | 3.9%) account for the highest median family income in Guaynabo with $122,891 per family, while 2-person families (9,136 | 53.6%) have the highest median income of $27,026 per family member.
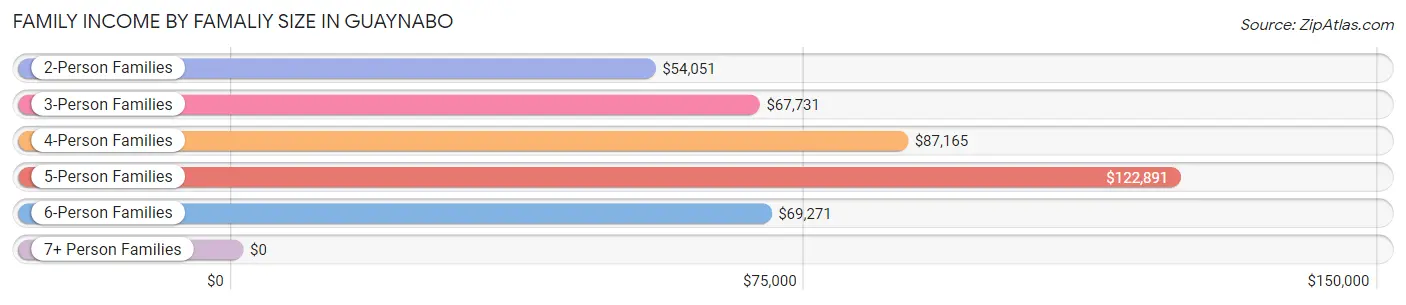
| Income Bracket | # Families | Median Income |
| 2-Person Families | 9,136 (53.6%) | $54,051 |
| 3-Person Families | 4,597 (27.0%) | $67,731 |
| 4-Person Families | 2,369 (13.9%) | $87,165 |
| 5-Person Families | 667 (3.9%) | $122,891 |
| 6-Person Families | 179 (1.1%) | $69,271 |
| 7+ Person Families | 80 (0.5%) | $0 |
| Total | 17,028 (100.0%) | $65,160 |
Family Income by Number of Earners in Guaynabo
The median family income in Guaynabo is $65,160, with families comprising 3+ earners (1,189) having the highest median family income of $106,222, while families with no earners (4,109) have the lowest median family income of $35,808, accounting for 7.0% and 24.1% of families, respectively.
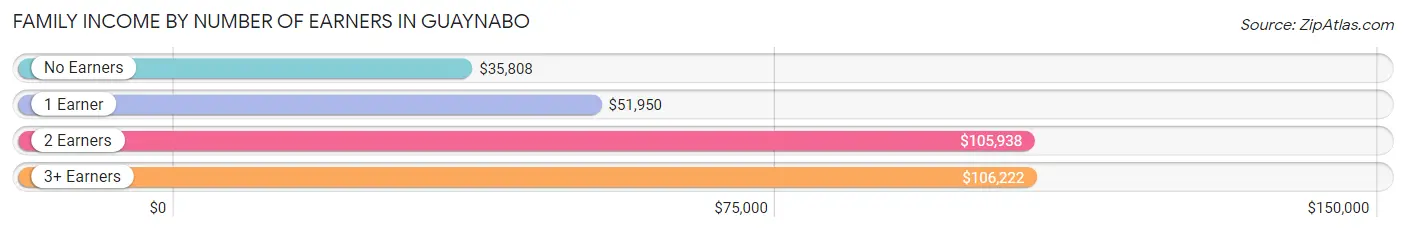
| Number of Earners | # Families | Median Income |
| No Earners | 4,109 (24.1%) | $35,808 |
| 1 Earner | 6,598 (38.8%) | $51,950 |
| 2 Earners | 5,132 (30.1%) | $105,938 |
| 3+ Earners | 1,189 (7.0%) | $106,222 |
| Total | 17,028 (100.0%) | $65,160 |
Household Income in Guaynabo
Household Income Brackets in Guaynabo
With 4,282 households falling in the category, the $50,000 to $74,999 income range is the most frequent in Guaynabo, accounting for 15.9% of all households. In contrast, only 1,454 households (5.4%) fall into the $10,000 to $14,999 income bracket, making it the least populous group.
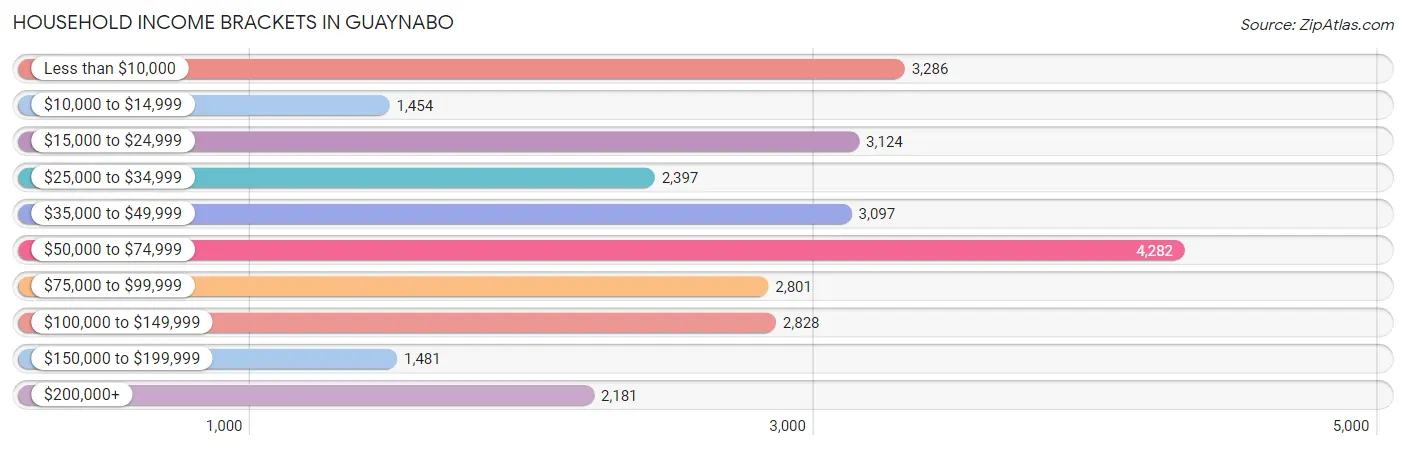
| Income Bracket | # Households | % Households |
| Less than $10,000 | 3,286 | 12.2% |
| $10,000 to $14,999 | 1,454 | 5.4% |
| $15,000 to $24,999 | 3,124 | 11.6% |
| $25,000 to $34,999 | 2,397 | 8.9% |
| $35,000 to $49,999 | 3,097 | 11.5% |
| $50,000 to $74,999 | 4,282 | 15.9% |
| $75,000 to $99,999 | 2,801 | 10.4% |
| $100,000 to $149,999 | 2,828 | 10.5% |
| $150,000 to $199,999 | 1,481 | 5.5% |
| $200,000+ | 2,181 | 8.1% |
Household Income by Householder Age in Guaynabo
The median household income in Guaynabo is $50,640, with the highest median household income of $67,159 found in the 45 to 64 years age bracket for the primary householder. A total of 10,526 households (39.1%) fall into this category. Meanwhile, the 15 to 24 years age bracket for the primary householder has the lowest median household income of $2,499, with 149 households (0.5%) in this group.
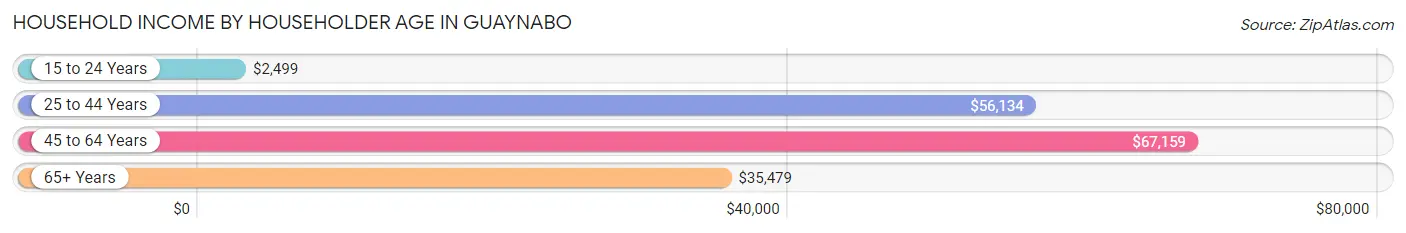
| Income Bracket | # Households | Median Income |
| 15 to 24 Years | 149 (0.5%) | $2,499 |
| 25 to 44 Years | 6,016 (22.3%) | $56,134 |
| 45 to 64 Years | 10,526 (39.1%) | $67,159 |
| 65+ Years | 10,240 (38.0%) | $35,479 |
| Total | 26,931 (100.0%) | $50,640 |
Poverty in Guaynabo
Income Below Poverty by Sex and Age in Guaynabo
With 19.5% poverty level for males and 22.3% for females among the residents of Guaynabo, 15 year old males and 12 to 14 year old females are the most vulnerable to poverty, with 179 males (50.7%) and 476 females (44.4%) in their respective age groups living below the poverty level.
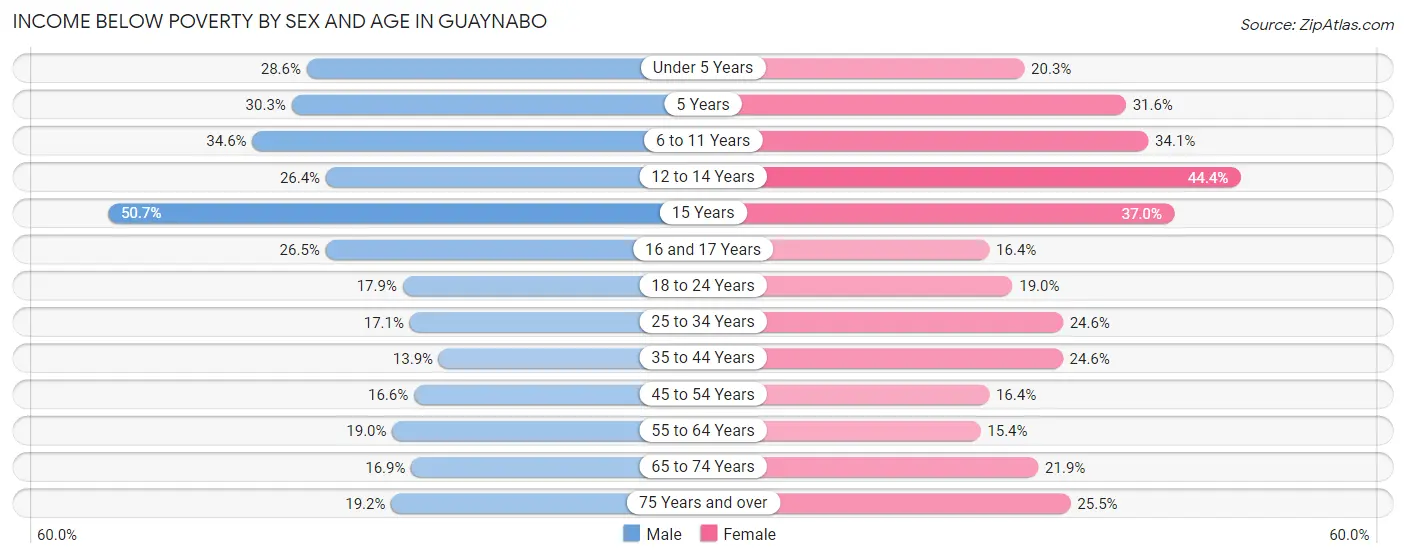
| Age Bracket | Male | Female |
| Under 5 Years | 336 (28.6%) | 224 (20.3%) |
| 5 Years | 46 (30.3%) | 80 (31.6%) |
| 6 to 11 Years | 676 (34.6%) | 592 (34.1%) |
| 12 to 14 Years | 229 (26.4%) | 476 (44.4%) |
| 15 Years | 179 (50.7%) | 88 (37.0%) |
| 16 and 17 Years | 220 (26.5%) | 147 (16.4%) |
| 18 to 24 Years | 513 (17.9%) | 471 (19.0%) |
| 25 to 34 Years | 800 (17.1%) | 1,088 (24.6%) |
| 35 to 44 Years | 572 (13.9%) | 1,120 (24.6%) |
| 45 to 54 Years | 700 (16.6%) | 791 (16.4%) |
| 55 to 64 Years | 804 (19.0%) | 906 (15.4%) |
| 65 to 74 Years | 625 (16.9%) | 1,087 (21.9%) |
| 75 Years and over | 586 (19.2%) | 1,344 (25.5%) |
| Total | 6,286 (19.5%) | 8,414 (22.3%) |
Income Above Poverty by Sex and Age in Guaynabo
According to the poverty statistics in Guaynabo, males aged 35 to 44 years and females aged 55 to 64 years are the age groups that are most secure financially, with 86.1% of males and 84.6% of females in these age groups living above the poverty line.
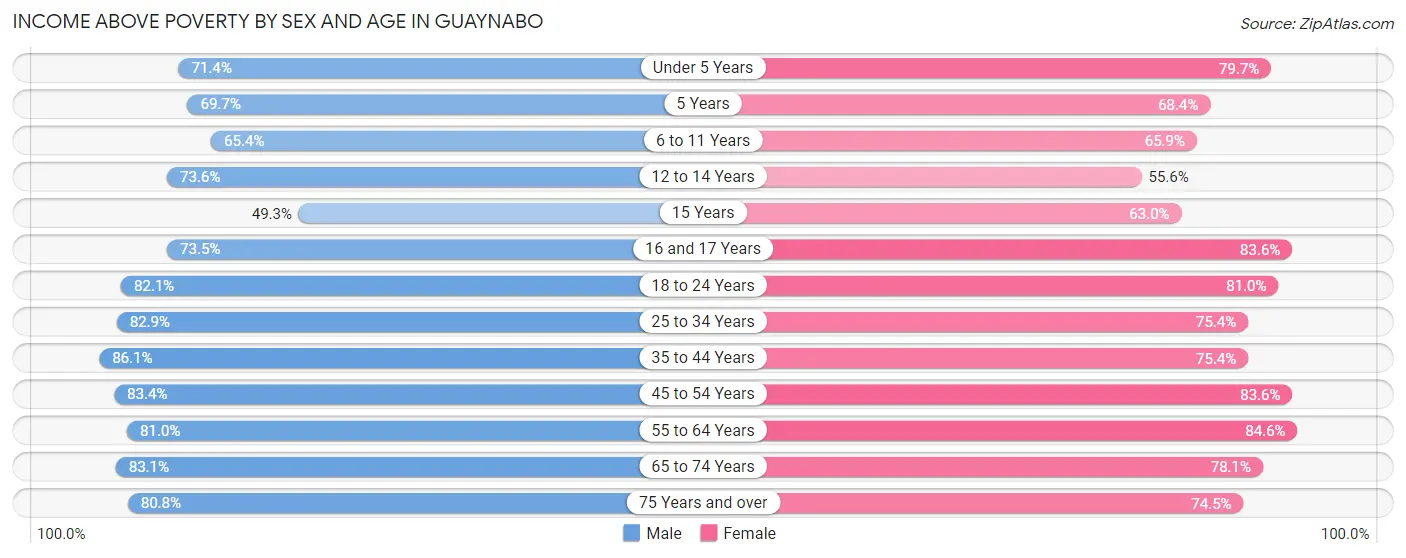
| Age Bracket | Male | Female |
| Under 5 Years | 840 (71.4%) | 879 (79.7%) |
| 5 Years | 106 (69.7%) | 173 (68.4%) |
| 6 to 11 Years | 1,276 (65.4%) | 1,143 (65.9%) |
| 12 to 14 Years | 637 (73.6%) | 597 (55.6%) |
| 15 Years | 174 (49.3%) | 150 (63.0%) |
| 16 and 17 Years | 611 (73.5%) | 749 (83.6%) |
| 18 to 24 Years | 2,354 (82.1%) | 2,009 (81.0%) |
| 25 to 34 Years | 3,877 (82.9%) | 3,335 (75.4%) |
| 35 to 44 Years | 3,554 (86.1%) | 3,435 (75.4%) |
| 45 to 54 Years | 3,509 (83.4%) | 4,036 (83.6%) |
| 55 to 64 Years | 3,419 (81.0%) | 4,964 (84.6%) |
| 65 to 74 Years | 3,067 (83.1%) | 3,884 (78.1%) |
| 75 Years and over | 2,472 (80.8%) | 3,934 (74.5%) |
| Total | 25,896 (80.5%) | 29,288 (77.7%) |
Income Below Poverty Among Married-Couple Families in Guaynabo
The poverty statistics for married-couple families in Guaynabo show that 9.2% or 1,019 of the total 11,094 families live below the poverty line. Families with 3 or 4 children have the highest poverty rate of 23.9%, comprising of 39 families. On the other hand, families with no children have the lowest poverty rate of 8.7%, which includes 694 families.
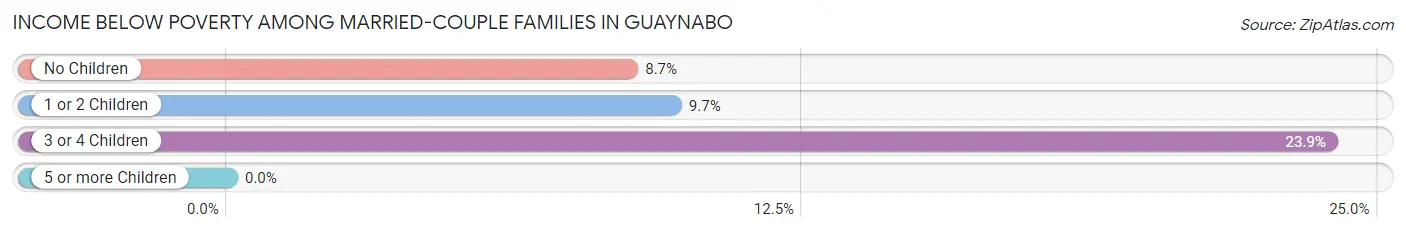
| Children | Above Poverty | Below Poverty |
| No Children | 7,276 (91.3%) | 694 (8.7%) |
| 1 or 2 Children | 2,675 (90.3%) | 286 (9.7%) |
| 3 or 4 Children | 124 (76.1%) | 39 (23.9%) |
| 5 or more Children | 0 (0.0%) | 0 (0.0%) |
| Total | 10,075 (90.8%) | 1,019 (9.2%) |
Income Below Poverty Among Single-Parent Households in Guaynabo
According to the poverty data in Guaynabo, 32.9% or 446 single-father households and 36.1% or 1,651 single-mother households are living below the poverty line. Among single-father households, those with 1 or 2 children have the highest poverty rate, with 365 households (59.7%) experiencing poverty. Likewise, among single-mother households, those with 3 or 4 children have the highest poverty rate, with 53 households (53.5%) falling below the poverty line.
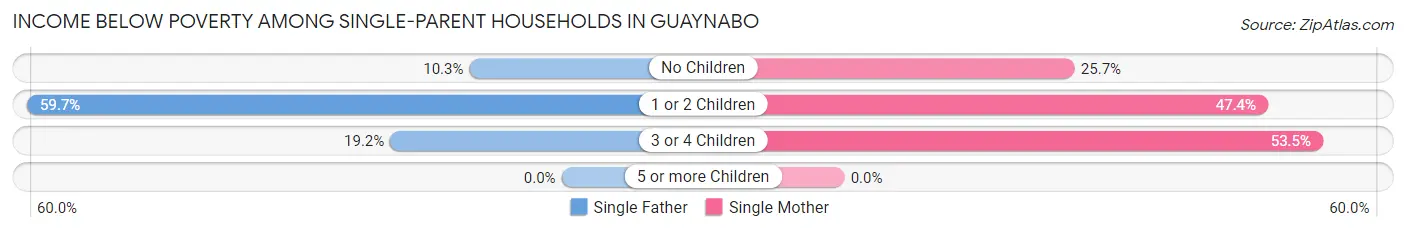
| Children | Single Father | Single Mother |
| No Children | 72 (10.3%) | 623 (25.7%) |
| 1 or 2 Children | 365 (59.7%) | 975 (47.4%) |
| 3 or 4 Children | 9 (19.2%) | 53 (53.5%) |
| 5 or more Children | 0 (0.0%) | 0 (0.0%) |
| Total | 446 (32.9%) | 1,651 (36.1%) |
Income Below Poverty Among Married-Couple vs Single-Parent Households in Guaynabo
The poverty data for Guaynabo shows that 1,019 of the married-couple family households (9.2%) and 2,097 of the single-parent households (35.3%) are living below the poverty level. Within the married-couple family households, those with 3 or 4 children have the highest poverty rate, with 39 households (23.9%) falling below the poverty line. Among the single-parent households, those with 1 or 2 children have the highest poverty rate, with 1,340 household (50.2%) living below poverty.
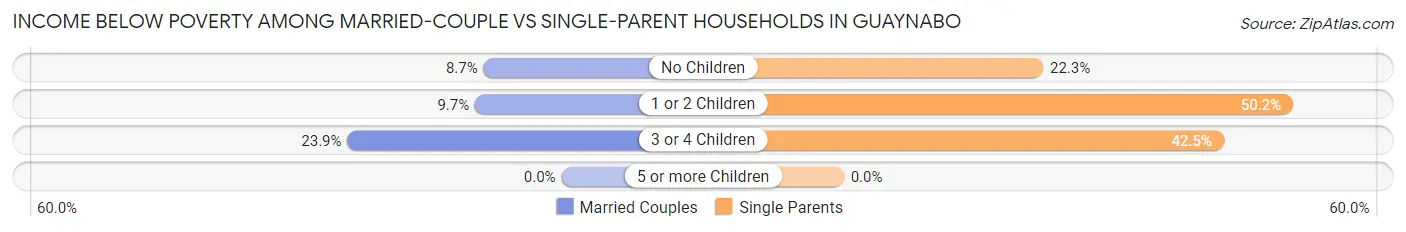
| Children | Married-Couple Families | Single-Parent Households |
| No Children | 694 (8.7%) | 695 (22.3%) |
| 1 or 2 Children | 286 (9.7%) | 1,340 (50.2%) |
| 3 or 4 Children | 39 (23.9%) | 62 (42.5%) |
| 5 or more Children | 0 (0.0%) | 0 (0.0%) |
| Total | 1,019 (9.2%) | 2,097 (35.3%) |
Race in Guaynabo
The most populous races in Guaynabo are Hispanic or Latino (68,876 | 98.2%), White / Caucasian (28,208 | 40.2%), and Two or more Races (25,279 | 36.0%).
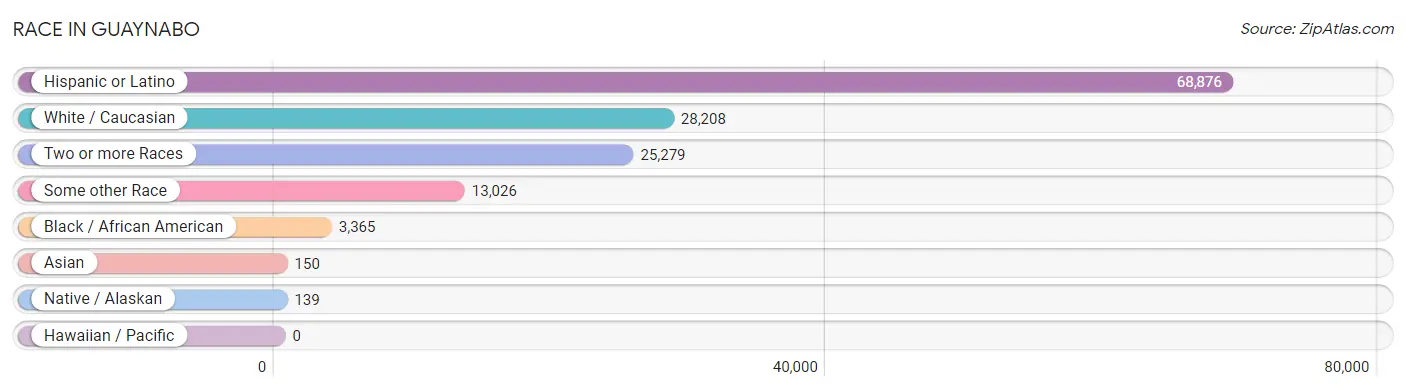
| Race | # Population | % Population |
| Asian | 150 | 0.2% |
| Black / African American | 3,365 | 4.8% |
| Hawaiian / Pacific | 0 | 0.0% |
| Hispanic or Latino | 68,876 | 98.2% |
| Native / Alaskan | 139 | 0.2% |
| White / Caucasian | 28,208 | 40.2% |
| Two or more Races | 25,279 | 36.0% |
| Some other Race | 13,026 | 18.6% |
| Total | 70,167 | 100.0% |
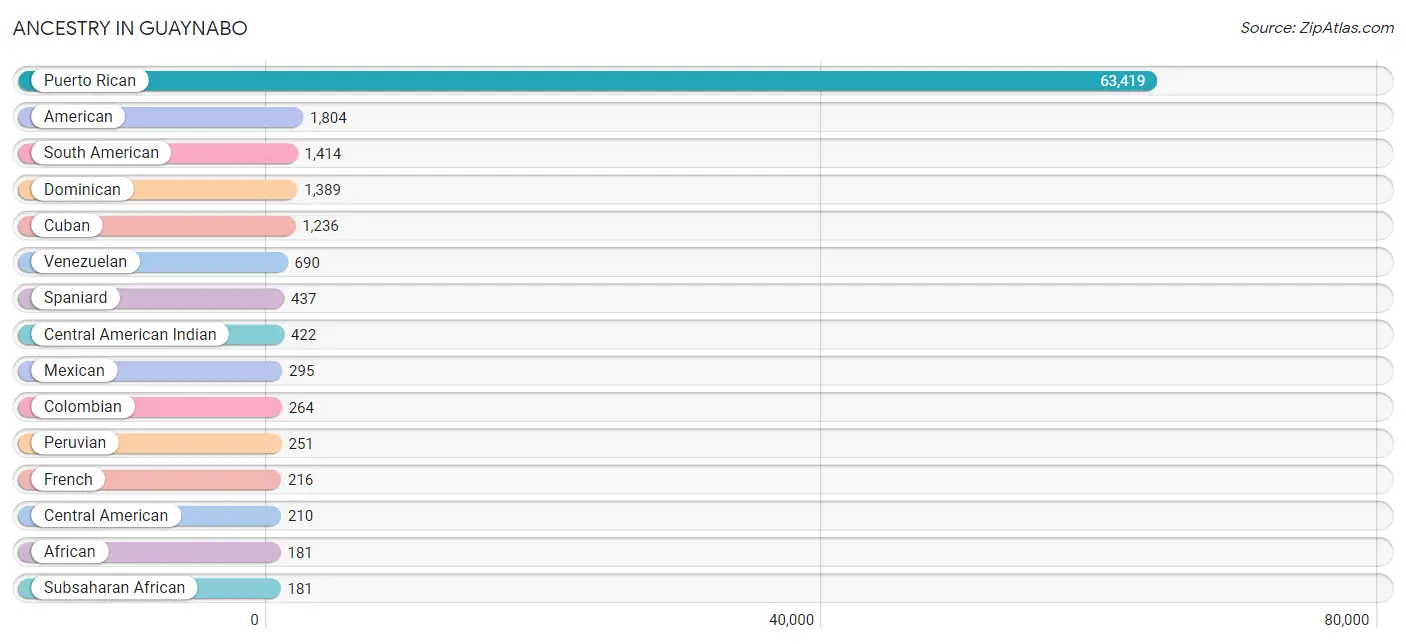
Ancestry in Guaynabo
The most populous ancestries reported in Guaynabo are Puerto Rican (63,419 | 90.4%), American (1,804 | 2.6%), South American (1,414 | 2.0%), Dominican (1,389 | 2.0%), and Cuban (1,236 | 1.8%), together accounting for 98.7% of all Guaynabo residents.
| Ancestry | # Population | % Population |
| African | 181 | 0.3% |
| American | 1,804 | 2.6% |
| Apache | 14 | 0.0% |
| Arab | 101 | 0.1% |
| Argentinean | 77 | 0.1% |
| Austrian | 25 | 0.0% |
| Belgian | 11 | 0.0% |
| Brazilian | 17 | 0.0% |
| British | 34 | 0.1% |
| British West Indian | 75 | 0.1% |
| Central American | 210 | 0.3% |
| Central American Indian | 422 | 0.6% |
| Chilean | 30 | 0.0% |
| Colombian | 264 | 0.4% |
| Costa Rican | 53 | 0.1% |
| Cuban | 1,236 | 1.8% |
| Danish | 9 | 0.0% |
| Dominican | 1,389 | 2.0% |
| Ecuadorian | 63 | 0.1% |
| English | 32 | 0.1% |
| European | 64 | 0.1% |
| Finnish | 11 | 0.0% |
| French | 216 | 0.3% |
| French Canadian | 4 | 0.0% |
| German | 78 | 0.1% |
| Greek | 19 | 0.0% |
| Guatemalan | 50 | 0.1% |
| Haitian | 91 | 0.1% |
| Indian (Asian) | 85 | 0.1% |
| Iraqi | 19 | 0.0% |
| Irish | 68 | 0.1% |
| Italian | 134 | 0.2% |
| Korean | 90 | 0.1% |
| Lebanese | 82 | 0.1% |
| Mexican | 295 | 0.4% |
| Native Hawaiian | 44 | 0.1% |
| Nicaraguan | 48 | 0.1% |
| Osage | 16 | 0.0% |
| Panamanian | 26 | 0.0% |
| Paraguayan | 18 | 0.0% |
| Peruvian | 251 | 0.4% |
| Polish | 27 | 0.0% |
| Portuguese | 11 | 0.0% |
| Puerto Rican | 63,419 | 90.4% |
| Romanian | 21 | 0.0% |
| Salvadoran | 33 | 0.1% |
| South American | 1,414 | 2.0% |
| South American Indian | 43 | 0.1% |
| Spaniard | 437 | 0.6% |
| Spanish American Indian | 8 | 0.0% |
| Subsaharan African | 181 | 0.3% |
| Thai | 69 | 0.1% |
| Uruguayan | 21 | 0.0% |
| Venezuelan | 690 | 1.0% |
| Welsh | 4 | 0.0% |
| West Indian | 64 | 0.1% | View All 56 Rows |
Immigrants in Guaynabo

| Immigration Origin | # Population | % Population | View All 0 Rows |
Sex and Age in Guaynabo
Sex and Age in Guaynabo
The most populous age groups in Guaynabo are 25 to 29 Years (2,410 | 7.5%) for men and 55 to 59 Years (3,070 | 8.1%) for women.
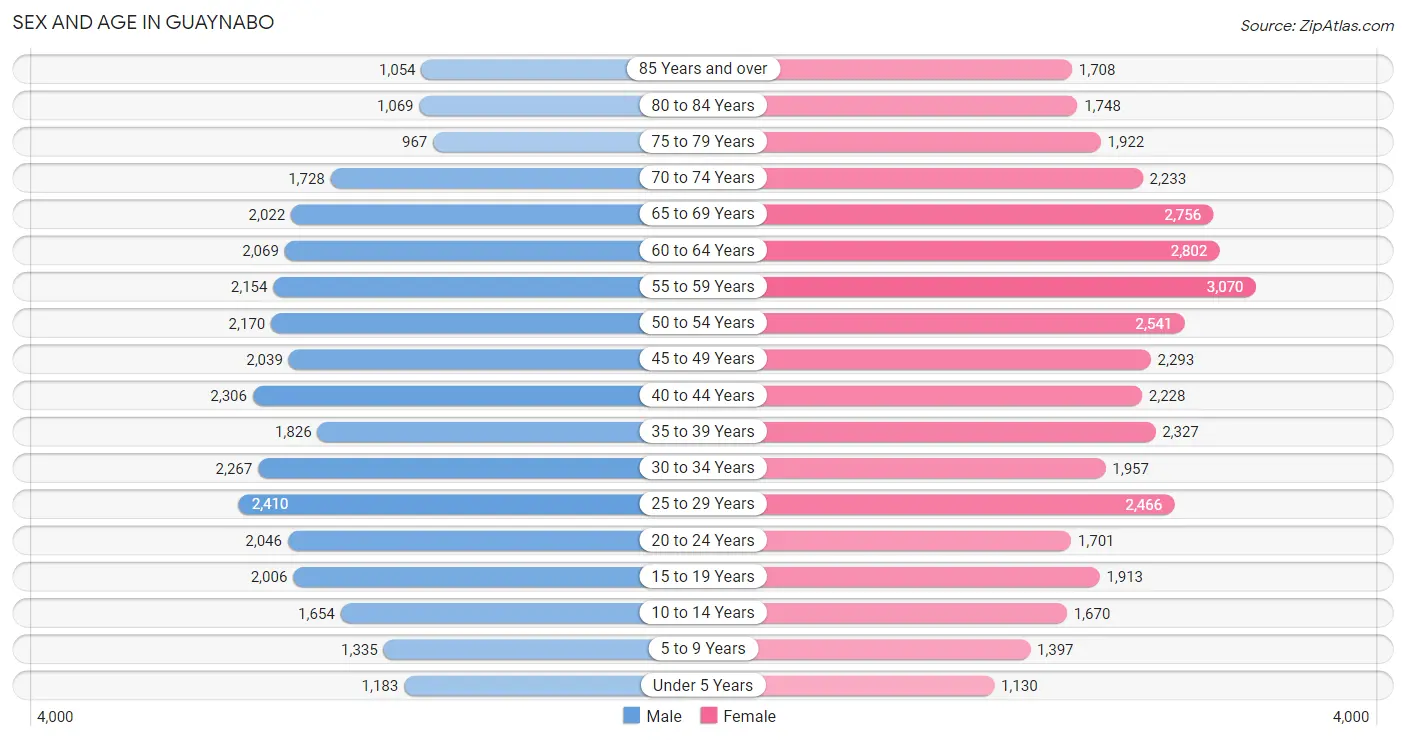
| Age Bracket | Male | Female |
| Under 5 Years | 1,183 (3.7%) | 1,130 (3.0%) |
| 5 to 9 Years | 1,335 (4.1%) | 1,397 (3.7%) |
| 10 to 14 Years | 1,654 (5.1%) | 1,670 (4.4%) |
| 15 to 19 Years | 2,006 (6.2%) | 1,913 (5.1%) |
| 20 to 24 Years | 2,046 (6.3%) | 1,701 (4.5%) |
| 25 to 29 Years | 2,410 (7.5%) | 2,466 (6.5%) |
| 30 to 34 Years | 2,267 (7.0%) | 1,957 (5.2%) |
| 35 to 39 Years | 1,826 (5.7%) | 2,327 (6.1%) |
| 40 to 44 Years | 2,306 (7.1%) | 2,228 (5.9%) |
| 45 to 49 Years | 2,039 (6.3%) | 2,293 (6.1%) |
| 50 to 54 Years | 2,170 (6.7%) | 2,541 (6.7%) |
| 55 to 59 Years | 2,154 (6.7%) | 3,070 (8.1%) |
| 60 to 64 Years | 2,069 (6.4%) | 2,802 (7.4%) |
| 65 to 69 Years | 2,022 (6.3%) | 2,756 (7.3%) |
| 70 to 74 Years | 1,728 (5.3%) | 2,233 (5.9%) |
| 75 to 79 Years | 967 (3.0%) | 1,922 (5.1%) |
| 80 to 84 Years | 1,069 (3.3%) | 1,748 (4.6%) |
| 85 Years and over | 1,054 (3.3%) | 1,708 (4.5%) |
| Total | 32,305 (100.0%) | 37,862 (100.0%) |
Families and Households in Guaynabo
Median Family Size in Guaynabo
The median family size in Guaynabo is 3.31 persons per family, with single male/father families (1,357 | 8.0%) accounting for the largest median family size of 3.63 persons per family. On the other hand, married-couple families (11,094 | 65.1%) represent the smallest median family size with 3.27 persons per family.
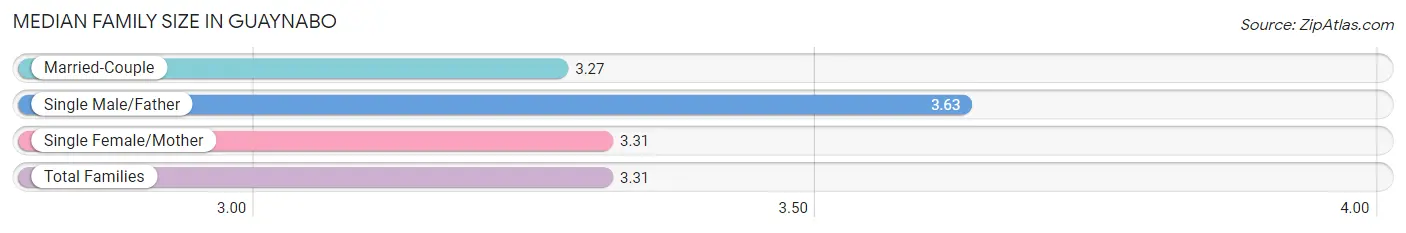
| Family Type | # Families | Family Size |
| Married-Couple | 11,094 (65.1%) | 3.27 |
| Single Male/Father | 1,357 (8.0%) | 3.63 |
| Single Female/Mother | 4,577 (26.9%) | 3.31 |
| Total Families | 17,028 (100.0%) | 3.31 |
Median Household Size in Guaynabo
The median household size in Guaynabo is 2.59 persons per household, with single male/father households (1,357 | 5.0%) accounting for the largest median household size of 4.02 persons per household. non-family households (9,903 | 36.8%) represent the smallest median household size with 1.16 persons per household.
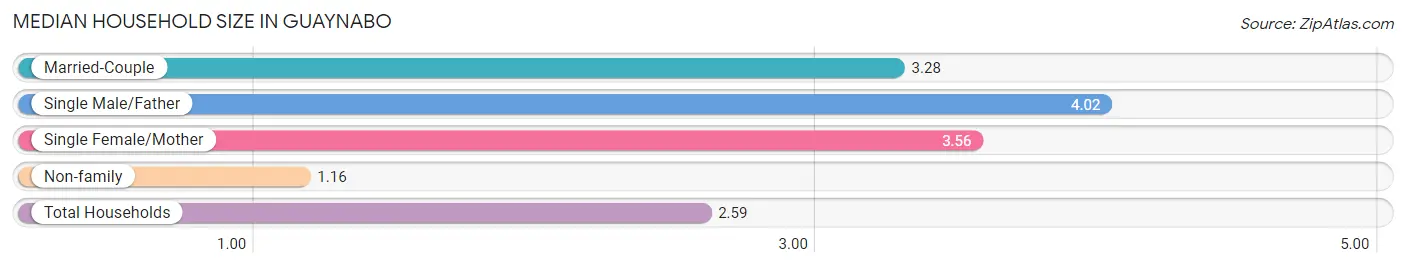
| Household Type | # Households | Household Size |
| Married-Couple | 11,094 (41.2%) | 3.28 |
| Single Male/Father | 1,357 (5.0%) | 4.02 |
| Single Female/Mother | 4,577 (17.0%) | 3.56 |
| Non-family | 9,903 (36.8%) | 1.16 |
| Total Households | 26,931 (100.0%) | 2.59 |
Household Size by Marriage Status in Guaynabo
Out of a total of 26,931 households in Guaynabo, 17,028 (63.2%) are family households, while 9,903 (36.8%) are nonfamily households. The most numerous type of family households are 2-person households, comprising 8,326, and the most common type of nonfamily households are 1-person households, comprising 8,534.
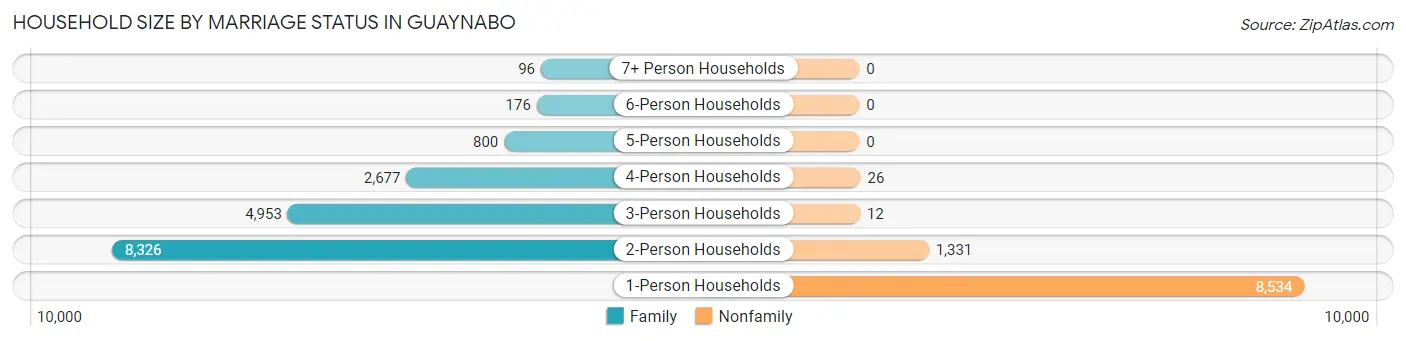
| Household Size | Family Households | Nonfamily Households |
| 1-Person Households | - | 8,534 (31.7%) |
| 2-Person Households | 8,326 (30.9%) | 1,331 (4.9%) |
| 3-Person Households | 4,953 (18.4%) | 12 (0.0%) |
| 4-Person Households | 2,677 (9.9%) | 26 (0.1%) |
| 5-Person Households | 800 (3.0%) | 0 (0.0%) |
| 6-Person Households | 176 (0.6%) | 0 (0.0%) |
| 7+ Person Households | 96 (0.4%) | 0 (0.0%) |
| Total | 17,028 (63.2%) | 9,903 (36.8%) |
Female Fertility in Guaynabo
Fertility by Age in Guaynabo
Average fertility rate in Guaynabo is 14.0 births per 1,000 women. Women in the age bracket of 20 to 34 years have the highest fertility rate with 24.0 births per 1,000 women. Women in the age bracket of 20 to 34 years acount for 68.7% of all women with births.
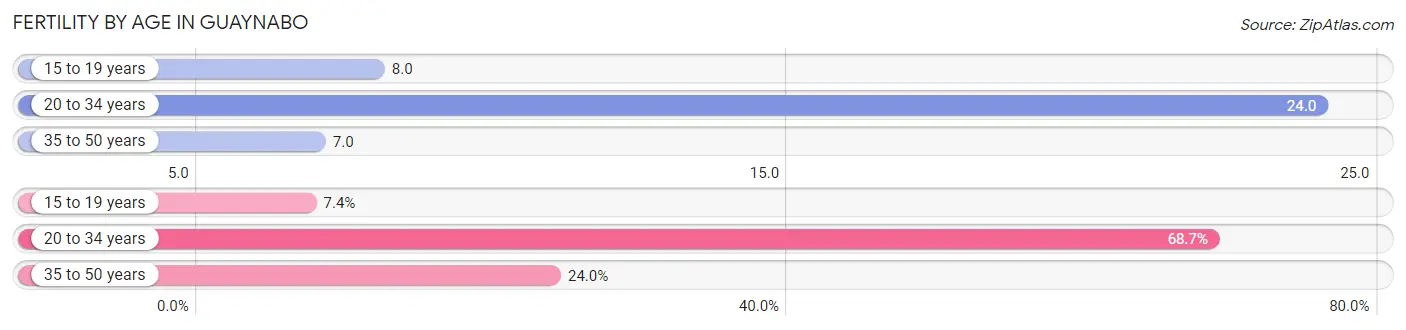
| Age Bracket | Women with Births | Births / 1,000 Women |
| 15 to 19 years | 16 (7.4%) | 8.0 |
| 20 to 34 years | 149 (68.7%) | 24.0 |
| 35 to 50 years | 52 (24.0%) | 7.0 |
| Total | 217 (100.0%) | 14.0 |
Fertility by Age by Marriage Status in Guaynabo
50.2% of women with births (217) in Guaynabo are married. The highest percentage of unmarried women with births falls into 15 to 19 years age bracket with 100.0% of them unmarried at the time of birth, while the lowest percentage of unmarried women with births belong to 20 to 34 years age bracket with 45.6% of them unmarried.
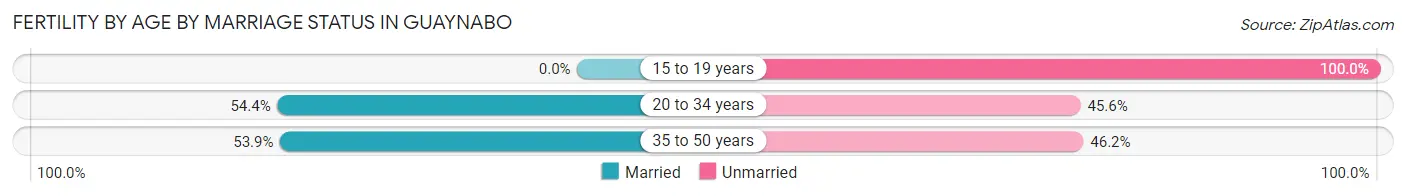
| Age Bracket | Married | Unmarried |
| 15 to 19 years | 0 (0.0%) | 16 (100.0%) |
| 20 to 34 years | 81 (54.4%) | 68 (45.6%) |
| 35 to 50 years | 28 (53.8%) | 24 (46.2%) |
| Total | 109 (50.2%) | 108 (49.8%) |
Fertility by Education in Guaynabo
Average fertility rate in Guaynabo is 14.0 births per 1,000 women. Women with the education attainment of high school diploma have the highest fertility rate of 25.0 births per 1,000 women, while women with the education attainment of college or associate's degree have the lowest fertility at 7.0 births per 1,000 women. Women with the education attainment of graduate degree represent 30.9% of all women with births.
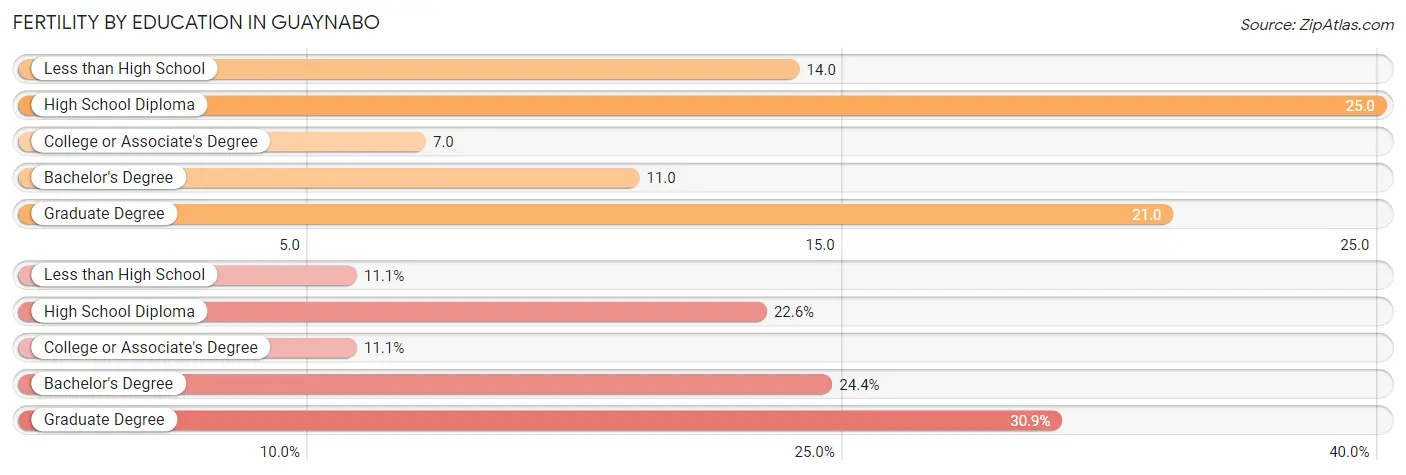
| Educational Attainment | Women with Births | Births / 1,000 Women |
| Less than High School | 24 (11.1%) | 14.0 |
| High School Diploma | 49 (22.6%) | 25.0 |
| College or Associate's Degree | 24 (11.1%) | 7.0 |
| Bachelor's Degree | 53 (24.4%) | 11.0 |
| Graduate Degree | 67 (30.9%) | 21.0 |
| Total | 217 (100.0%) | 14.0 |
Fertility by Education by Marriage Status in Guaynabo
49.8% of women with births in Guaynabo are unmarried. Women with the educational attainment of graduate degree are most likely to be married with 100.0% of them married at childbirth, while women with the educational attainment of less than high school are least likely to be married with 100.0% of them unmarried at childbirth.
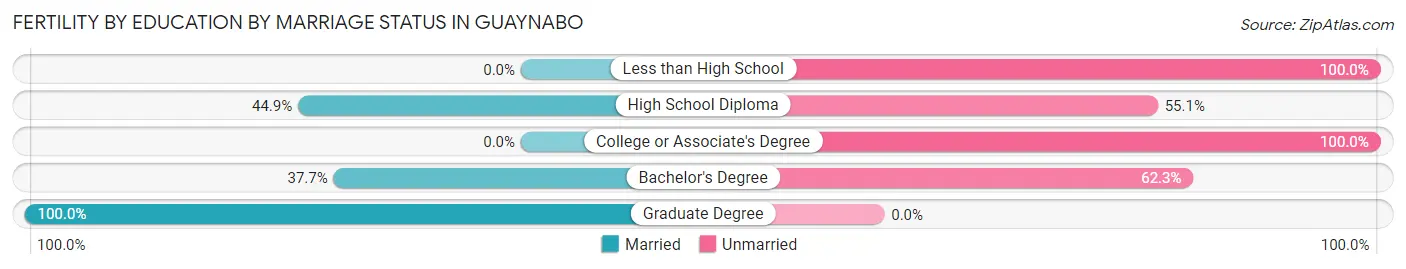
| Educational Attainment | Married | Unmarried |
| Less than High School | 0 (0.0%) | 24 (100.0%) |
| High School Diploma | 22 (44.9%) | 27 (55.1%) |
| College or Associate's Degree | 0 (0.0%) | 24 (100.0%) |
| Bachelor's Degree | 20 (37.7%) | 33 (62.3%) |
| Graduate Degree | 67 (100.0%) | 0 (0.0%) |
| Total | 109 (50.2%) | 108 (49.8%) |
Employment Characteristics in Guaynabo
Employment by Class of Employer in Guaynabo
Among the 29,003 employed individuals in Guaynabo, private company employees (17,259 | 59.5%), self-employed (not incorporated) (3,690 | 12.7%), and state government employees (2,189 | 7.5%) make up the most common classes of employment.
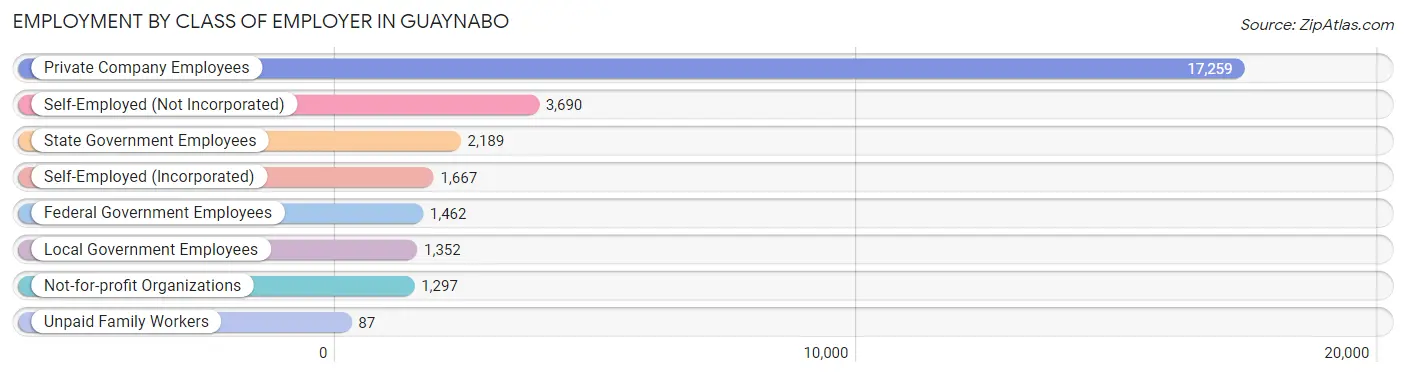
| Employer Class | # Employees | % Employees |
| Private Company Employees | 17,259 | 59.5% |
| Self-Employed (Incorporated) | 1,667 | 5.8% |
| Self-Employed (Not Incorporated) | 3,690 | 12.7% |
| Not-for-profit Organizations | 1,297 | 4.5% |
| Local Government Employees | 1,352 | 4.7% |
| State Government Employees | 2,189 | 7.5% |
| Federal Government Employees | 1,462 | 5.0% |
| Unpaid Family Workers | 87 | 0.3% |
| Total | 29,003 | 100.0% |
Employment Status by Age in Guaynabo
According to the labor force statistics for Guaynabo, out of the total population over 16 years of age (61,207), 52.6% or 32,195 individuals are in the labor force, with 8.1% or 2,608 of them unemployed. The age group with the highest labor force participation rate is 30 to 34 years, with 84.5% or 3,569 individuals in the labor force. Within the labor force, the 16 to 19 years age range has the highest percentage of unemployed individuals, with 43.9% or 181 of them being unemployed.
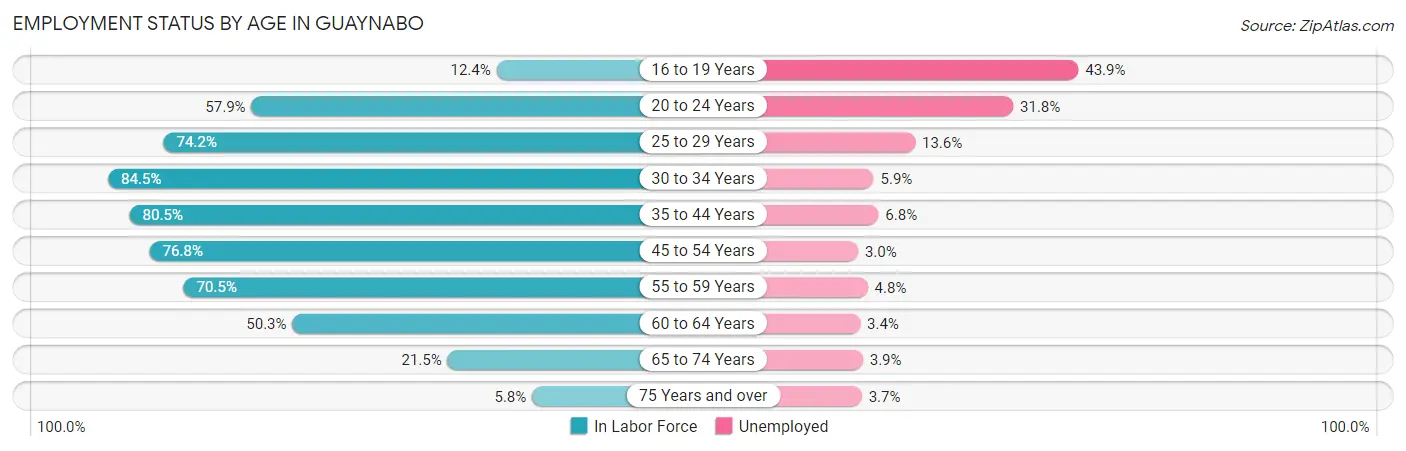
| Age Bracket | In Labor Force | Unemployed |
| 16 to 19 Years | 413 (12.4%) | 181 (43.9%) |
| 20 to 24 Years | 2,170 (57.9%) | 690 (31.8%) |
| 25 to 29 Years | 3,618 (74.2%) | 492 (13.6%) |
| 30 to 34 Years | 3,569 (84.5%) | 211 (5.9%) |
| 35 to 44 Years | 6,993 (80.5%) | 476 (6.8%) |
| 45 to 54 Years | 6,945 (76.8%) | 208 (3.0%) |
| 55 to 59 Years | 3,683 (70.5%) | 177 (4.8%) |
| 60 to 64 Years | 2,450 (50.3%) | 83 (3.4%) |
| 65 to 74 Years | 1,879 (21.5%) | 73 (3.9%) |
| 75 Years and over | 491 (5.8%) | 18 (3.7%) |
| Total | 32,195 (52.6%) | 2,608 (8.1%) |
Employment Status by Educational Attainment in Guaynabo
According to labor force statistics for Guaynabo, 73.8% of individuals (27,251) out of the total population between 25 and 64 years of age (36,925) are in the labor force, with 6.0% or 1,635 of them being unemployed. The group with the highest labor force participation rate are those with the educational attainment of bachelor's degree or higher, with 81.5% or 17,830 individuals in the labor force. Within the labor force, individuals with less than high school education have the highest percentage of unemployment, with 28.5% or 236 of them being unemployed.
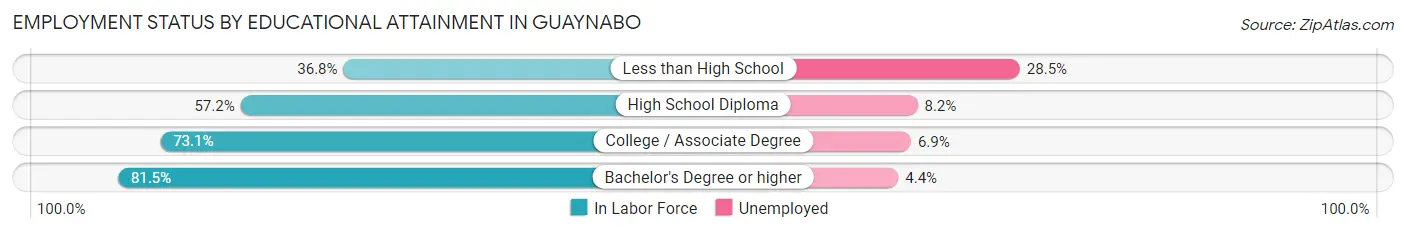
| Educational Attainment | In Labor Force | Unemployed |
| Less than High School | 828 (36.8%) | 642 (28.5%) |
| High School Diploma | 2,728 (57.2%) | 391 (8.2%) |
| College / Associate Degree | 5,868 (73.1%) | 554 (6.9%) |
| Bachelor's Degree or higher | 17,830 (81.5%) | 963 (4.4%) |
| Total | 27,251 (73.8%) | 2,216 (6.0%) |
Employment Occupations by Sex in Guaynabo
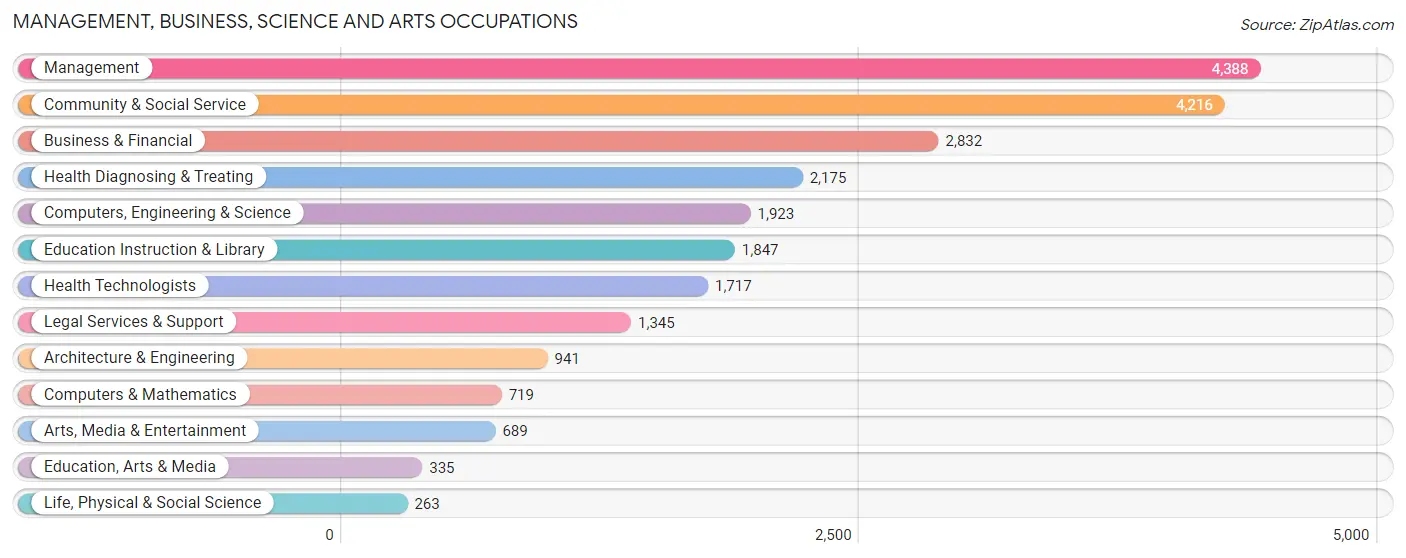
Management, Business, Science and Arts Occupations
The most common Management, Business, Science and Arts occupations in Guaynabo are Management (4,388 | 14.9%), Community & Social Service (4,216 | 14.3%), Business & Financial (2,832 | 9.6%), Health Diagnosing & Treating (2,175 | 7.4%), and Computers, Engineering & Science (1,923 | 6.5%).
Management, Business, Science and Arts Occupations by Sex
Within the Management, Business, Science and Arts occupations in Guaynabo, the most male-oriented occupations are Architecture & Engineering (83.0%), Computers, Engineering & Science (73.8%), and Computers & Mathematics (67.0%), while the most female-oriented occupations are Education Instruction & Library (70.9%), Education, Arts & Media (64.2%), and Community & Social Service (57.6%).
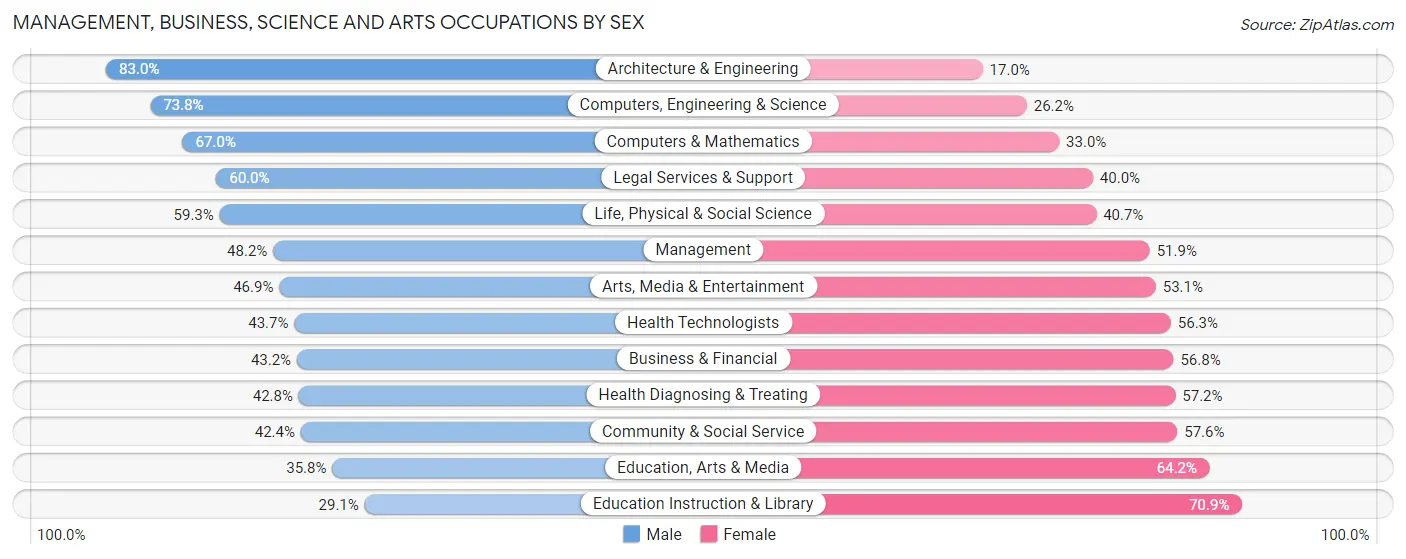
| Occupation | Male | Female |
| Management | 2,113 (48.1%) | 2,275 (51.8%) |
| Business & Financial | 1,223 (43.2%) | 1,609 (56.8%) |
| Computers, Engineering & Science | 1,419 (73.8%) | 504 (26.2%) |
| Computers & Mathematics | 482 (67.0%) | 237 (33.0%) |
| Architecture & Engineering | 781 (83.0%) | 160 (17.0%) |
| Life, Physical & Social Science | 156 (59.3%) | 107 (40.7%) |
| Community & Social Service | 1,787 (42.4%) | 2,429 (57.6%) |
| Education, Arts & Media | 120 (35.8%) | 215 (64.2%) |
| Legal Services & Support | 807 (60.0%) | 538 (40.0%) |
| Education Instruction & Library | 537 (29.1%) | 1,310 (70.9%) |
| Arts, Media & Entertainment | 323 (46.9%) | 366 (53.1%) |
| Health Diagnosing & Treating | 931 (42.8%) | 1,244 (57.2%) |
| Health Technologists | 751 (43.7%) | 966 (56.3%) |
| Total (Category) | 7,473 (48.1%) | 8,061 (51.9%) |
| Total (Overall) | 15,006 (51.0%) | 14,386 (48.9%) |
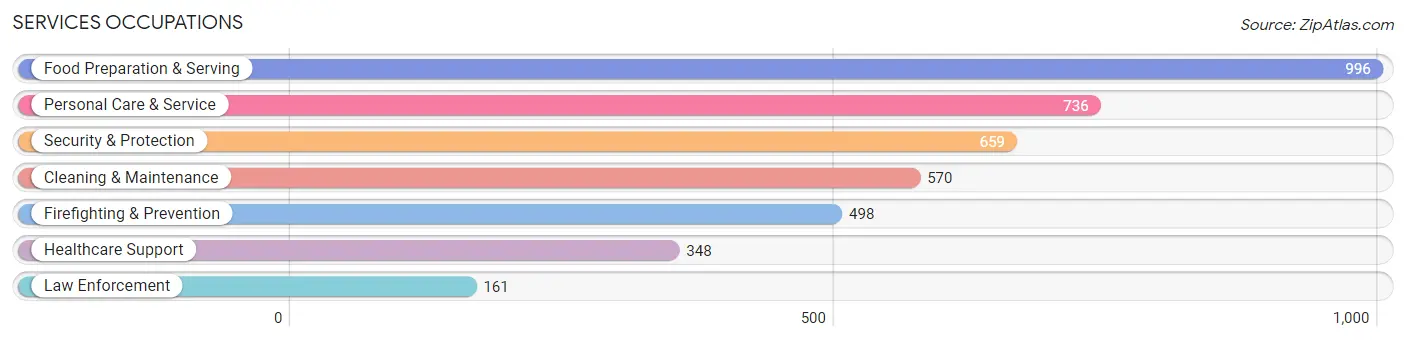
Services Occupations
The most common Services occupations in Guaynabo are Food Preparation & Serving (996 | 3.4%), Personal Care & Service (736 | 2.5%), Security & Protection (659 | 2.2%), Cleaning & Maintenance (570 | 1.9%), and Firefighting & Prevention (498 | 1.7%).
Services Occupations by Sex
Within the Services occupations in Guaynabo, the most male-oriented occupations are Law Enforcement (69.6%), Security & Protection (68.0%), and Firefighting & Prevention (67.5%), while the most female-oriented occupations are Healthcare Support (96.8%), Personal Care & Service (44.7%), and Food Preparation & Serving (38.4%).
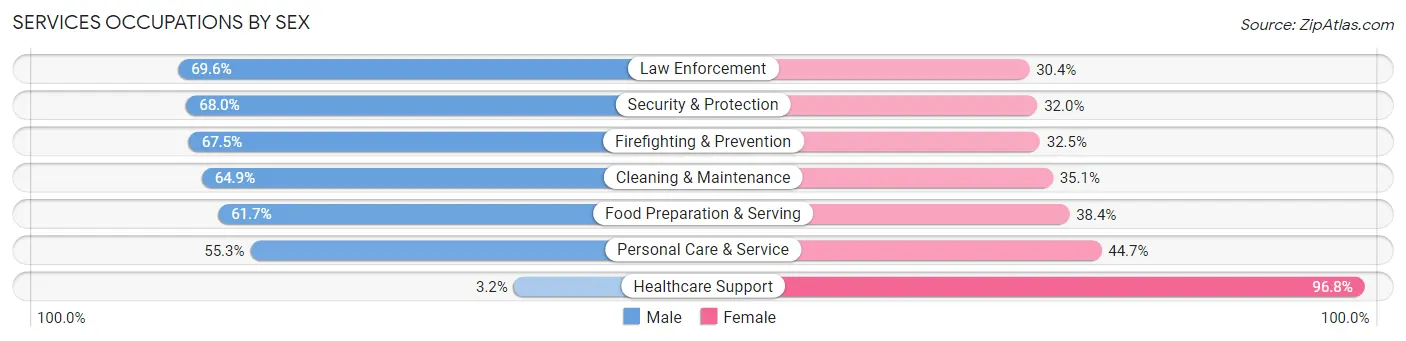
| Occupation | Male | Female |
| Healthcare Support | 11 (3.2%) | 337 (96.8%) |
| Security & Protection | 448 (68.0%) | 211 (32.0%) |
| Firefighting & Prevention | 336 (67.5%) | 162 (32.5%) |
| Law Enforcement | 112 (69.6%) | 49 (30.4%) |
| Food Preparation & Serving | 614 (61.7%) | 382 (38.4%) |
| Cleaning & Maintenance | 370 (64.9%) | 200 (35.1%) |
| Personal Care & Service | 407 (55.3%) | 329 (44.7%) |
| Total (Category) | 1,850 (55.9%) | 1,459 (44.1%) |
| Total (Overall) | 15,006 (51.0%) | 14,386 (48.9%) |
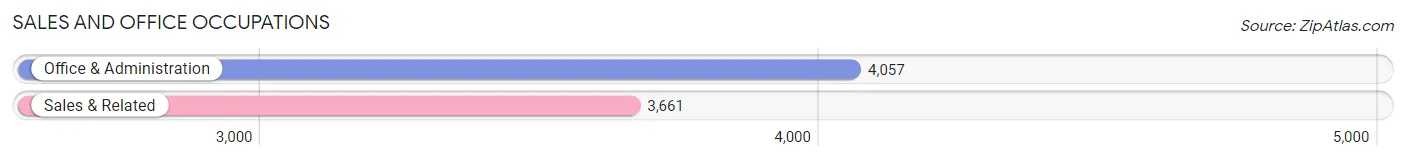
Sales and Office Occupations
The most common Sales and Office occupations in Guaynabo are Office & Administration (4,057 | 13.8%), and Sales & Related (3,661 | 12.5%).
Sales and Office Occupations by Sex
| Occupation | Male | Female |
| Sales & Related | 1,771 (48.4%) | 1,890 (51.6%) |
| Office & Administration | 1,315 (32.4%) | 2,742 (67.6%) |
| Total (Category) | 3,086 (40.0%) | 4,632 (60.0%) |
| Total (Overall) | 15,006 (51.0%) | 14,386 (48.9%) |
Natural Resources, Construction and Maintenance Occupations
The most common Natural Resources, Construction and Maintenance occupations in Guaynabo are Installation, Maintenance & Repair (657 | 2.2%), and Construction & Extraction (568 | 1.9%).
Natural Resources, Construction and Maintenance Occupations by Sex
| Occupation | Male | Female |
| Farming, Fishing & Forestry | 0 (0.0%) | 0 (0.0%) |
| Construction & Extraction | 528 (93.0%) | 40 (7.0%) |
| Installation, Maintenance & Repair | 638 (97.1%) | 19 (2.9%) |
| Total (Category) | 1,166 (95.2%) | 59 (4.8%) |
| Total (Overall) | 15,006 (51.0%) | 14,386 (48.9%) |
Production, Transportation and Moving Occupations
The most common Production, Transportation and Moving occupations in Guaynabo are Transportation (623 | 2.1%), Production (502 | 1.7%), and Material Moving (481 | 1.6%).
Production, Transportation and Moving Occupations by Sex
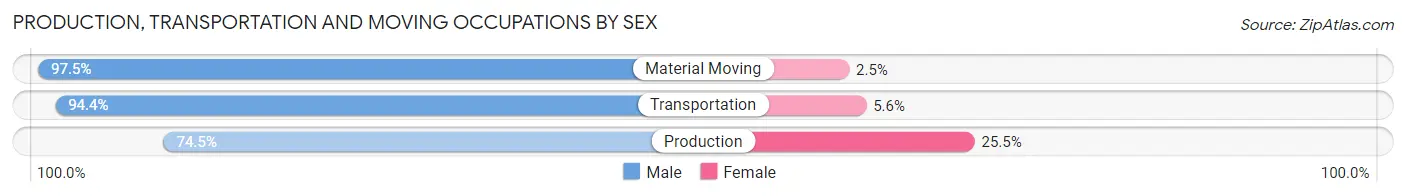
| Occupation | Male | Female |
| Production | 374 (74.5%) | 128 (25.5%) |
| Transportation | 588 (94.4%) | 35 (5.6%) |
| Material Moving | 469 (97.5%) | 12 (2.5%) |
| Total (Category) | 1,431 (89.1%) | 175 (10.9%) |
| Total (Overall) | 15,006 (51.0%) | 14,386 (48.9%) |
Employment Industries by Sex in Guaynabo
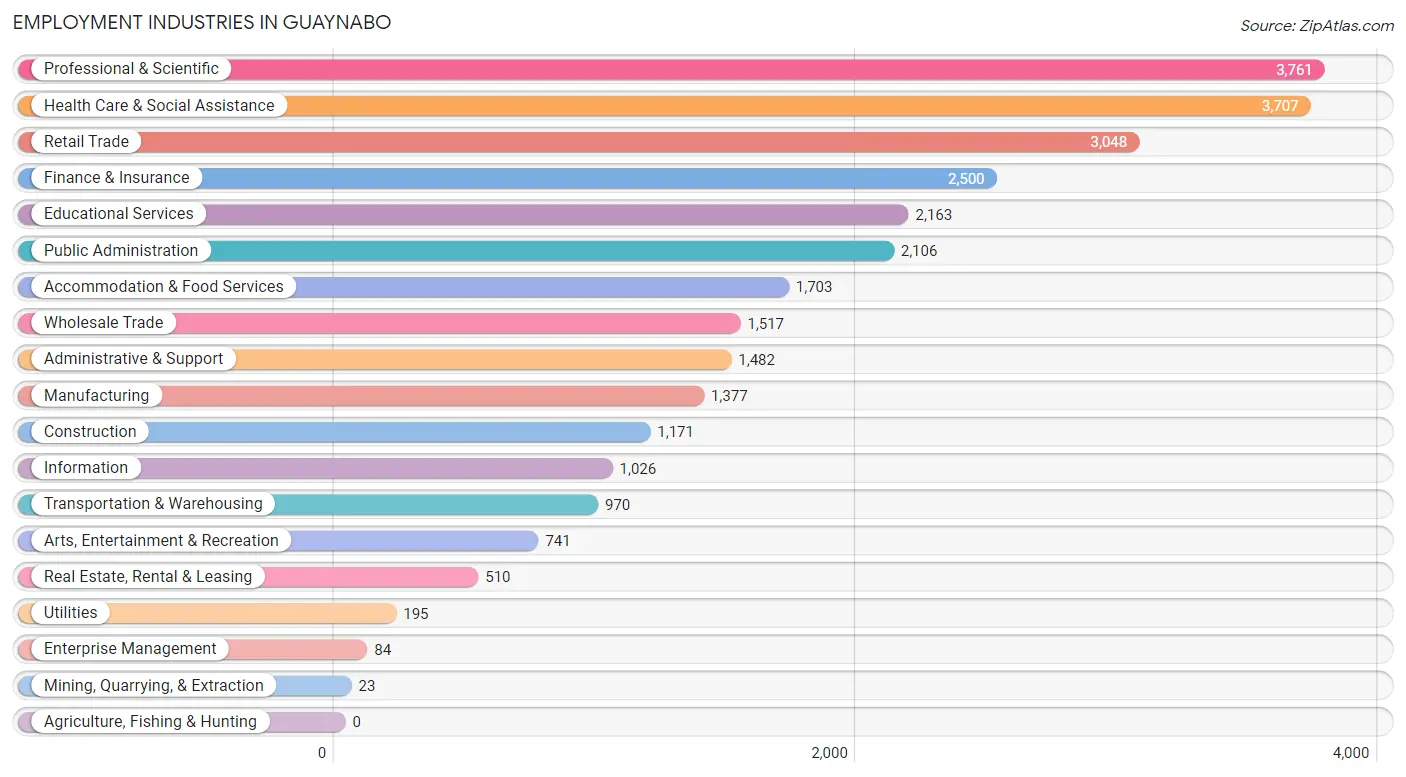
Employment Industries in Guaynabo
The major employment industries in Guaynabo include Professional & Scientific (3,761 | 12.8%), Health Care & Social Assistance (3,707 | 12.6%), Retail Trade (3,048 | 10.4%), Finance & Insurance (2,500 | 8.5%), and Educational Services (2,163 | 7.4%).
Employment Industries by Sex in Guaynabo
The Guaynabo industries that see more men than women are Mining, Quarrying, & Extraction (100.0%), Construction (80.0%), and Transportation & Warehousing (76.1%), whereas the industries that tend to have a higher number of women are Enterprise Management (75.0%), Educational Services (74.8%), and Health Care & Social Assistance (64.4%).
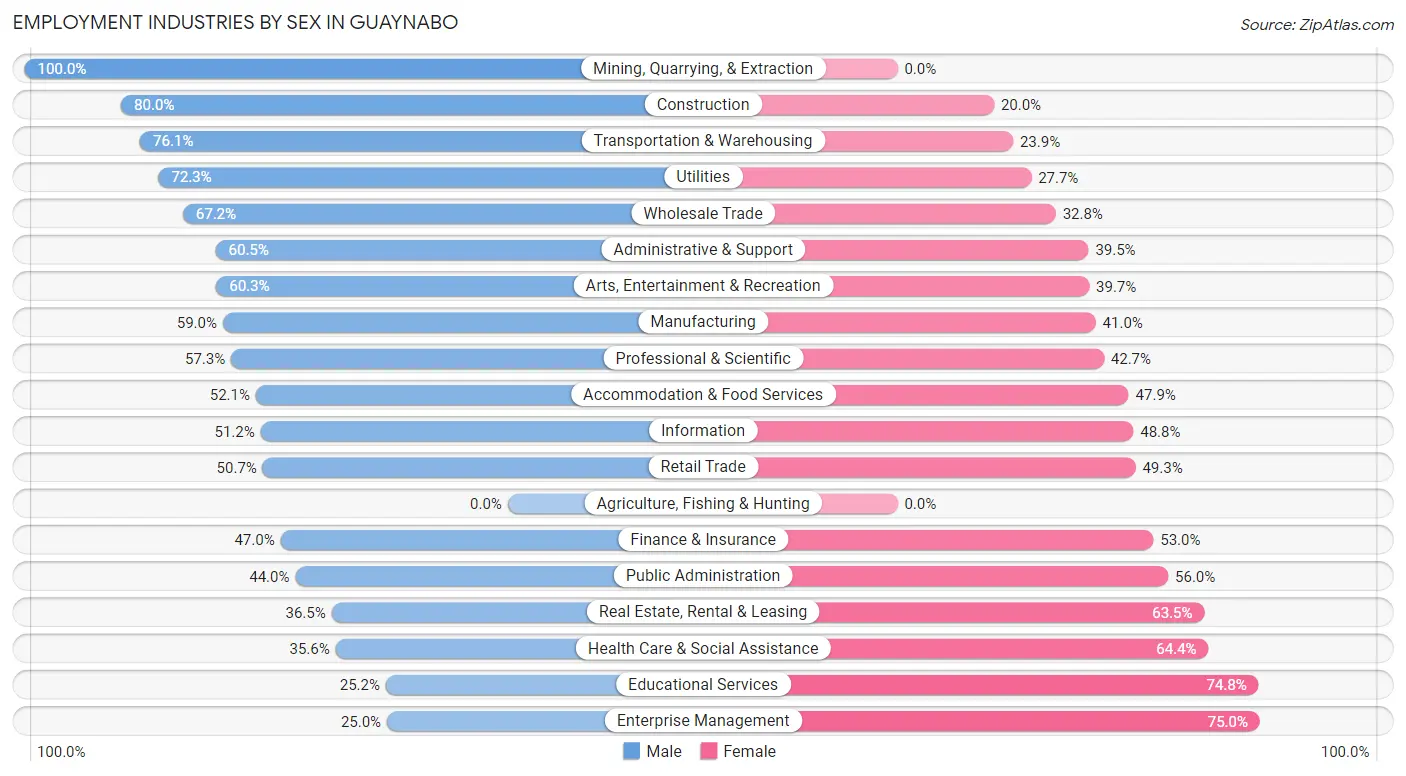
| Industry | Male | Female |
| Agriculture, Fishing & Hunting | 0 (0.0%) | 0 (0.0%) |
| Mining, Quarrying, & Extraction | 23 (100.0%) | 0 (0.0%) |
| Construction | 937 (80.0%) | 234 (20.0%) |
| Manufacturing | 812 (59.0%) | 565 (41.0%) |
| Wholesale Trade | 1,020 (67.2%) | 497 (32.8%) |
| Retail Trade | 1,546 (50.7%) | 1,502 (49.3%) |
| Transportation & Warehousing | 738 (76.1%) | 232 (23.9%) |
| Utilities | 141 (72.3%) | 54 (27.7%) |
| Information | 525 (51.2%) | 501 (48.8%) |
| Finance & Insurance | 1,176 (47.0%) | 1,324 (53.0%) |
| Real Estate, Rental & Leasing | 186 (36.5%) | 324 (63.5%) |
| Professional & Scientific | 2,154 (57.3%) | 1,607 (42.7%) |
| Enterprise Management | 21 (25.0%) | 63 (75.0%) |
| Administrative & Support | 896 (60.5%) | 586 (39.5%) |
| Educational Services | 546 (25.2%) | 1,617 (74.8%) |
| Health Care & Social Assistance | 1,321 (35.6%) | 2,386 (64.4%) |
| Arts, Entertainment & Recreation | 447 (60.3%) | 294 (39.7%) |
| Accommodation & Food Services | 888 (52.1%) | 815 (47.9%) |
| Public Administration | 926 (44.0%) | 1,180 (56.0%) |
| Total | 15,006 (51.0%) | 14,386 (48.9%) |
Education in Guaynabo
School Enrollment in Guaynabo
The most common levels of schooling among the 15,667 students in Guaynabo are college / undergraduate (4,111 | 26.2%), high school (2,990 | 19.1%), and middle school (2,912 | 18.6%).
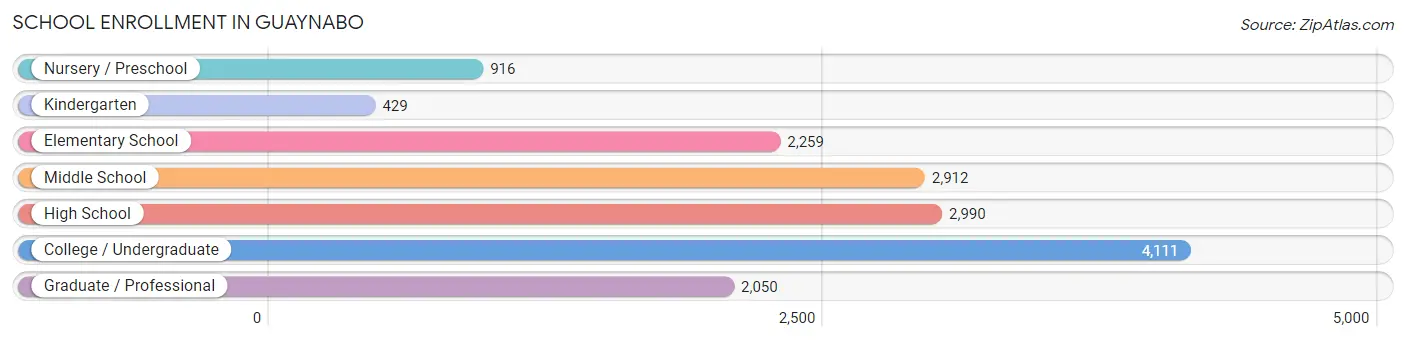
| School Level | # Students | % Students |
| Nursery / Preschool | 916 | 5.9% |
| Kindergarten | 429 | 2.7% |
| Elementary School | 2,259 | 14.4% |
| Middle School | 2,912 | 18.6% |
| High School | 2,990 | 19.1% |
| College / Undergraduate | 4,111 | 26.2% |
| Graduate / Professional | 2,050 | 13.1% |
| Total | 15,667 | 100.0% |
School Enrollment by Age by Funding Source in Guaynabo
Out of a total of 15,667 students who are enrolled in schools in Guaynabo, 10,215 (65.2%) attend a private institution, while the remaining 5,452 (34.8%) are enrolled in public schools. The age group of 18 to 19 year olds has the highest likelihood of being enrolled in private schools, with 1,153 (83.6% in the age bracket) enrolled. Conversely, the age group of 3 to 4 year olds has the lowest likelihood of being enrolled in a private school, with 356 (48.1% in the age bracket) attending a public institution.
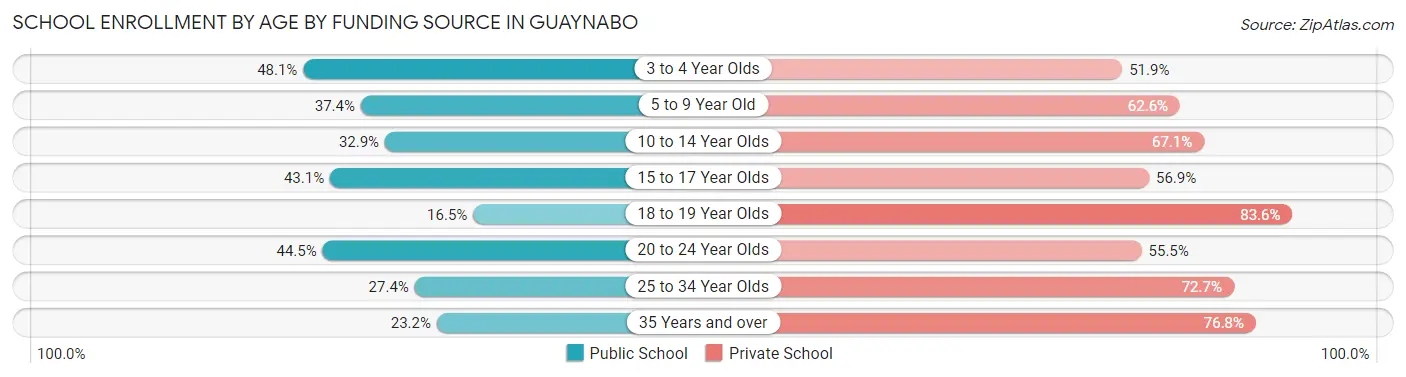
| Age Bracket | Public School | Private School |
| 3 to 4 Year Olds | 356 (48.1%) | 384 (51.9%) |
| 5 to 9 Year Old | 1,017 (37.4%) | 1,704 (62.6%) |
| 10 to 14 Year Olds | 1,093 (32.9%) | 2,231 (67.1%) |
| 15 to 17 Year Olds | 984 (43.1%) | 1,298 (56.9%) |
| 18 to 19 Year Olds | 227 (16.5%) | 1,153 (83.6%) |
| 20 to 24 Year Olds | 1,007 (44.5%) | 1,256 (55.5%) |
| 25 to 34 Year Olds | 539 (27.4%) | 1,432 (72.7%) |
| 35 Years and over | 229 (23.2%) | 757 (76.8%) |
| Total | 5,452 (34.8%) | 10,215 (65.2%) |
Educational Attainment by Field of Study in Guaynabo
Business (9,955 | 32.9%), science & technology (2,648 | 8.7%), education (2,574 | 8.5%), bio, nature & agricultural (2,417 | 8.0%), and engineering (2,353 | 7.8%) are the most common fields of study among 30,256 individuals in Guaynabo who have obtained a bachelor's degree or higher.
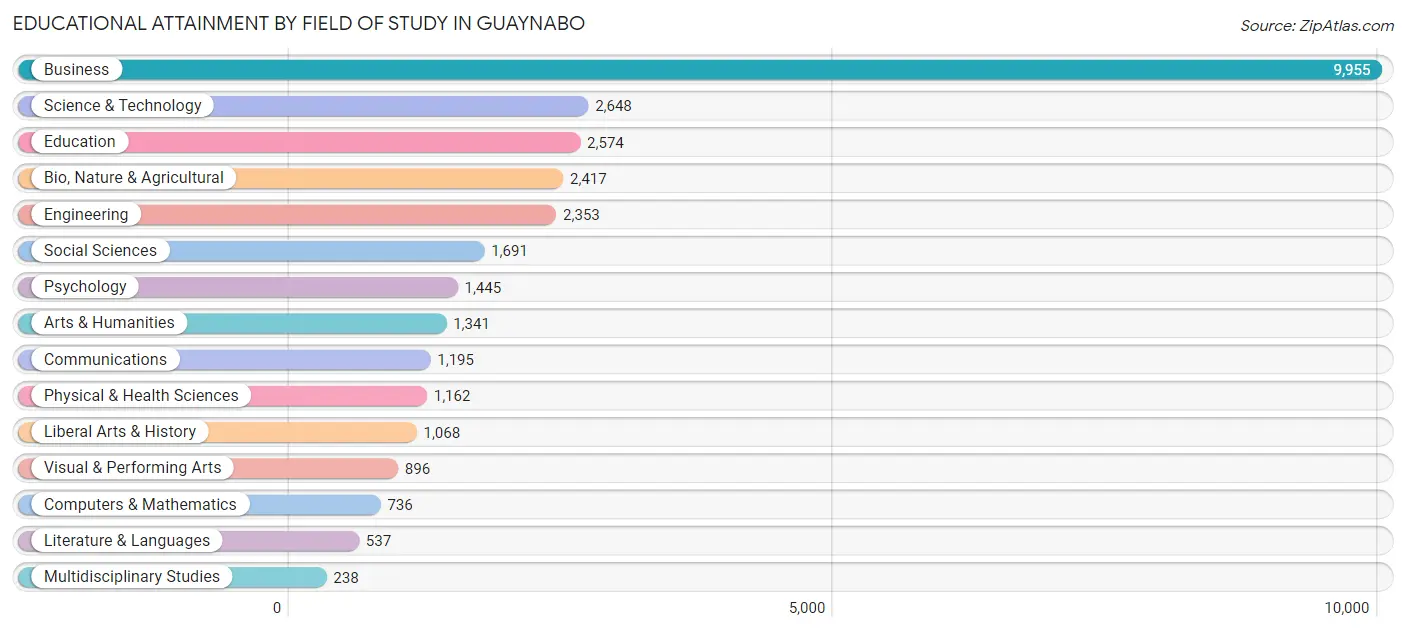
| Field of Study | # Graduates | % Graduates |
| Computers & Mathematics | 736 | 2.4% |
| Bio, Nature & Agricultural | 2,417 | 8.0% |
| Physical & Health Sciences | 1,162 | 3.8% |
| Psychology | 1,445 | 4.8% |
| Social Sciences | 1,691 | 5.6% |
| Engineering | 2,353 | 7.8% |
| Multidisciplinary Studies | 238 | 0.8% |
| Science & Technology | 2,648 | 8.7% |
| Business | 9,955 | 32.9% |
| Education | 2,574 | 8.5% |
| Literature & Languages | 537 | 1.8% |
| Liberal Arts & History | 1,068 | 3.5% |
| Visual & Performing Arts | 896 | 3.0% |
| Communications | 1,195 | 4.0% |
| Arts & Humanities | 1,341 | 4.4% |
| Total | 30,256 | 100.0% |
Transportation & Commute in Guaynabo
Vehicle Availability by Sex in Guaynabo
The most prevalent vehicle ownership categories in Guaynabo are males with 2 vehicles (6,643, accounting for 44.7%) and females with 2 vehicles (6,005, making up 47.2%).
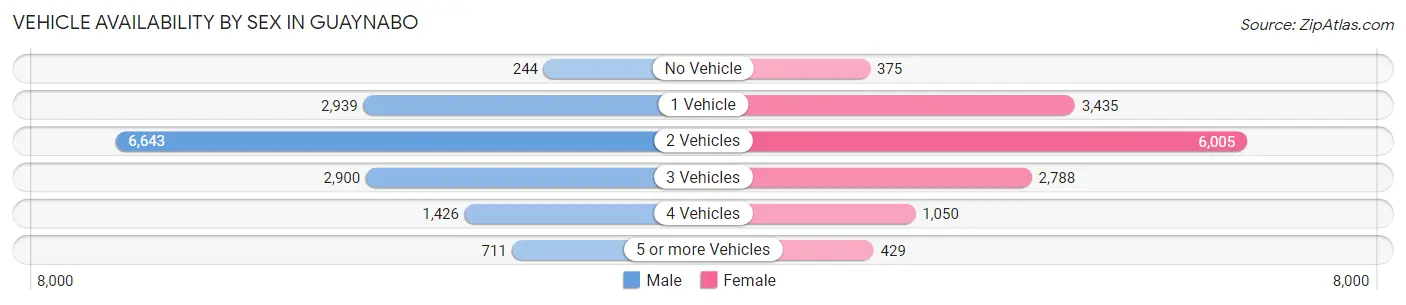
| Vehicles Available | Male | Female |
| No Vehicle | 244 (1.6%) | 375 (2.7%) |
| 1 Vehicle | 2,939 (19.8%) | 3,435 (24.4%) |
| 2 Vehicles | 6,643 (44.7%) | 6,005 (42.6%) |
| 3 Vehicles | 2,900 (19.5%) | 2,788 (19.8%) |
| 4 Vehicles | 1,426 (9.6%) | 1,050 (7.5%) |
| 5 or more Vehicles | 711 (4.8%) | 429 (3.0%) |
| Total | 14,863 (100.0%) | 14,082 (100.0%) |
Commute Time in Guaynabo
The most frequently occuring commute durations in Guaynabo are 15 to 19 minutes (5,639 commuters, 21.4%), 30 to 34 minutes (5,457 commuters, 20.7%), and 20 to 24 minutes (5,020 commuters, 19.0%).
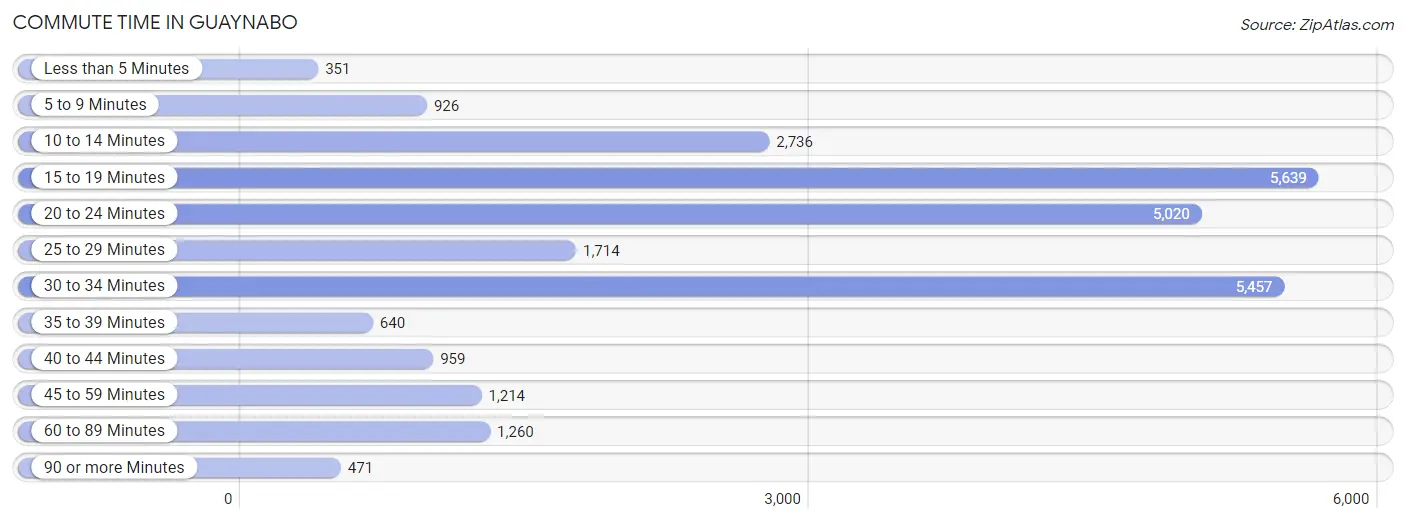
| Commute Time | # Commuters | % Commuters |
| Less than 5 Minutes | 351 | 1.3% |
| 5 to 9 Minutes | 926 | 3.5% |
| 10 to 14 Minutes | 2,736 | 10.4% |
| 15 to 19 Minutes | 5,639 | 21.4% |
| 20 to 24 Minutes | 5,020 | 19.0% |
| 25 to 29 Minutes | 1,714 | 6.5% |
| 30 to 34 Minutes | 5,457 | 20.7% |
| 35 to 39 Minutes | 640 | 2.4% |
| 40 to 44 Minutes | 959 | 3.6% |
| 45 to 59 Minutes | 1,214 | 4.6% |
| 60 to 89 Minutes | 1,260 | 4.8% |
| 90 or more Minutes | 471 | 1.8% |
Commute Time by Sex in Guaynabo
The most common commute times in Guaynabo are 30 to 34 minutes (3,051 commuters, 22.5%) for males and 15 to 19 minutes (2,945 commuters, 23.0%) for females.
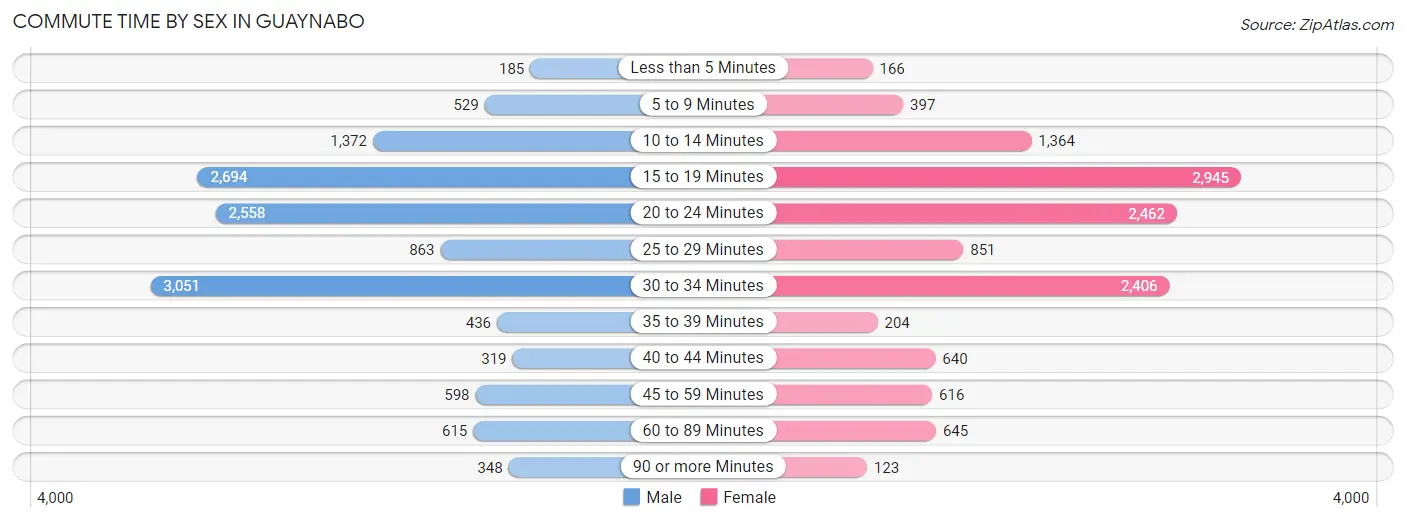
| Commute Time | Male | Female |
| Less than 5 Minutes | 185 (1.4%) | 166 (1.3%) |
| 5 to 9 Minutes | 529 (3.9%) | 397 (3.1%) |
| 10 to 14 Minutes | 1,372 (10.1%) | 1,364 (10.6%) |
| 15 to 19 Minutes | 2,694 (19.9%) | 2,945 (23.0%) |
| 20 to 24 Minutes | 2,558 (18.9%) | 2,462 (19.2%) |
| 25 to 29 Minutes | 863 (6.4%) | 851 (6.6%) |
| 30 to 34 Minutes | 3,051 (22.5%) | 2,406 (18.8%) |
| 35 to 39 Minutes | 436 (3.2%) | 204 (1.6%) |
| 40 to 44 Minutes | 319 (2.4%) | 640 (5.0%) |
| 45 to 59 Minutes | 598 (4.4%) | 616 (4.8%) |
| 60 to 89 Minutes | 615 (4.5%) | 645 (5.0%) |
| 90 or more Minutes | 348 (2.6%) | 123 (1.0%) |
Time of Departure to Work by Sex in Guaynabo
The most frequent times of departure to work in Guaynabo are 7:00 AM to 7:29 AM (2,108, 15.5%) for males and 7:00 AM to 7:29 AM (2,757, 21.5%) for females.
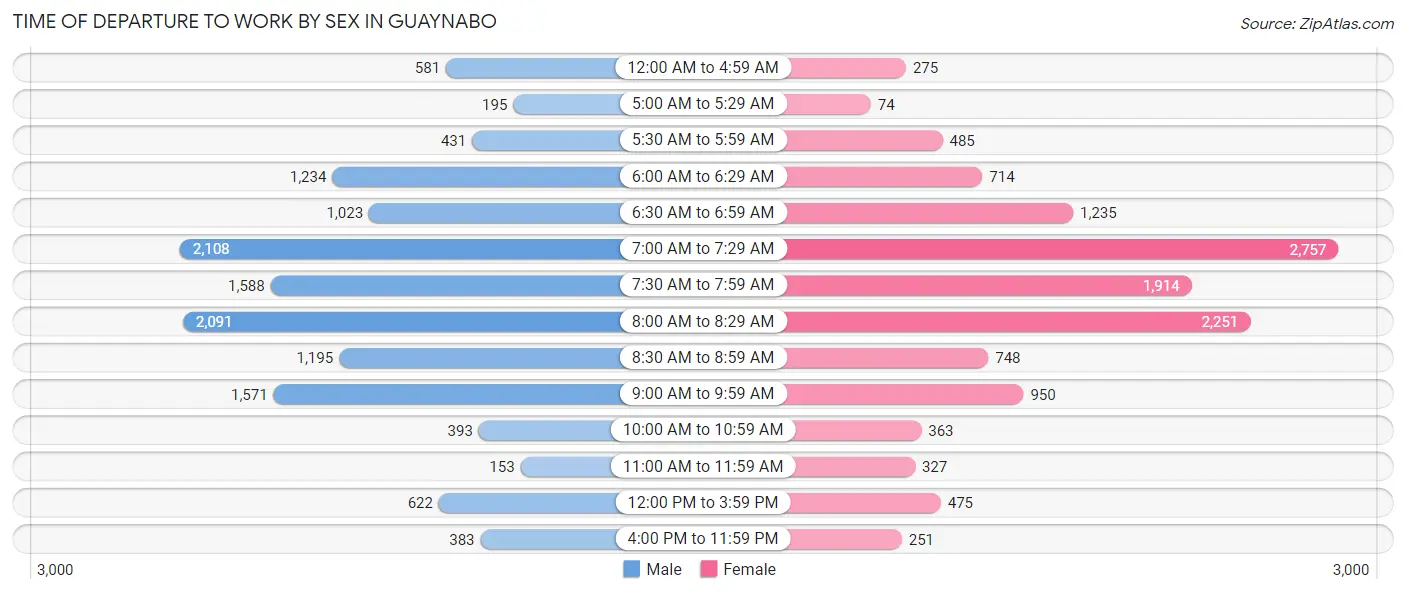
| Time of Departure | Male | Female |
| 12:00 AM to 4:59 AM | 581 (4.3%) | 275 (2.1%) |
| 5:00 AM to 5:29 AM | 195 (1.4%) | 74 (0.6%) |
| 5:30 AM to 5:59 AM | 431 (3.2%) | 485 (3.8%) |
| 6:00 AM to 6:29 AM | 1,234 (9.1%) | 714 (5.6%) |
| 6:30 AM to 6:59 AM | 1,023 (7.5%) | 1,235 (9.6%) |
| 7:00 AM to 7:29 AM | 2,108 (15.5%) | 2,757 (21.5%) |
| 7:30 AM to 7:59 AM | 1,588 (11.7%) | 1,914 (14.9%) |
| 8:00 AM to 8:29 AM | 2,091 (15.4%) | 2,251 (17.6%) |
| 8:30 AM to 8:59 AM | 1,195 (8.8%) | 748 (5.8%) |
| 9:00 AM to 9:59 AM | 1,571 (11.6%) | 950 (7.4%) |
| 10:00 AM to 10:59 AM | 393 (2.9%) | 363 (2.8%) |
| 11:00 AM to 11:59 AM | 153 (1.1%) | 327 (2.5%) |
| 12:00 PM to 3:59 PM | 622 (4.6%) | 475 (3.7%) |
| 4:00 PM to 11:59 PM | 383 (2.8%) | 251 (2.0%) |
| Total | 13,568 (100.0%) | 12,819 (100.0%) |
Housing Occupancy in Guaynabo
Occupancy by Ownership in Guaynabo
Of the total 26,931 dwellings in Guaynabo, owner-occupied units account for 19,291 (71.6%), while renter-occupied units make up 7,640 (28.4%).
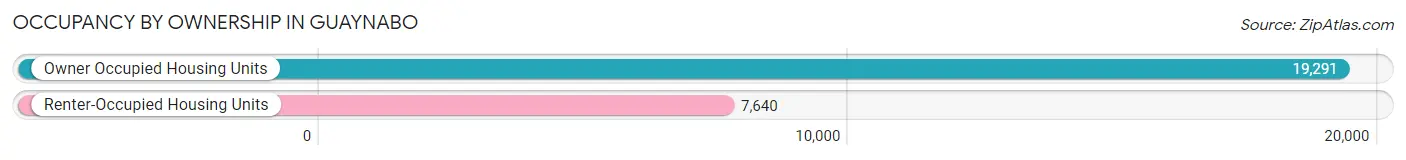
| Occupancy | # Housing Units | % Housing Units |
| Owner Occupied Housing Units | 19,291 | 71.6% |
| Renter-Occupied Housing Units | 7,640 | 28.4% |
| Total Occupied Housing Units | 26,931 | 100.0% |
Occupancy by Household Size in Guaynabo
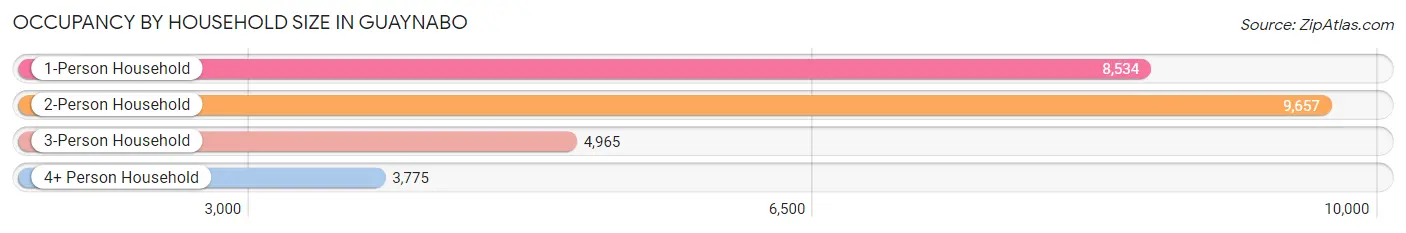
| Household Size | # Housing Units | % Housing Units |
| 1-Person Household | 8,534 | 31.7% |
| 2-Person Household | 9,657 | 35.9% |
| 3-Person Household | 4,965 | 18.4% |
| 4+ Person Household | 3,775 | 14.0% |
| Total Housing Units | 26,931 | 100.0% |
Occupancy by Ownership by Household Size in Guaynabo
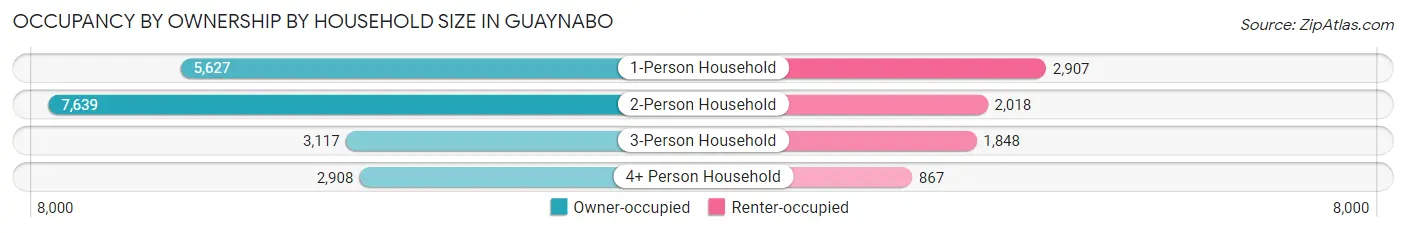
| Household Size | Owner-occupied | Renter-occupied |
| 1-Person Household | 5,627 (65.9%) | 2,907 (34.1%) |
| 2-Person Household | 7,639 (79.1%) | 2,018 (20.9%) |
| 3-Person Household | 3,117 (62.8%) | 1,848 (37.2%) |
| 4+ Person Household | 2,908 (77.0%) | 867 (23.0%) |
| Total Housing Units | 19,291 (71.6%) | 7,640 (28.4%) |
Occupancy by Educational Attainment in Guaynabo
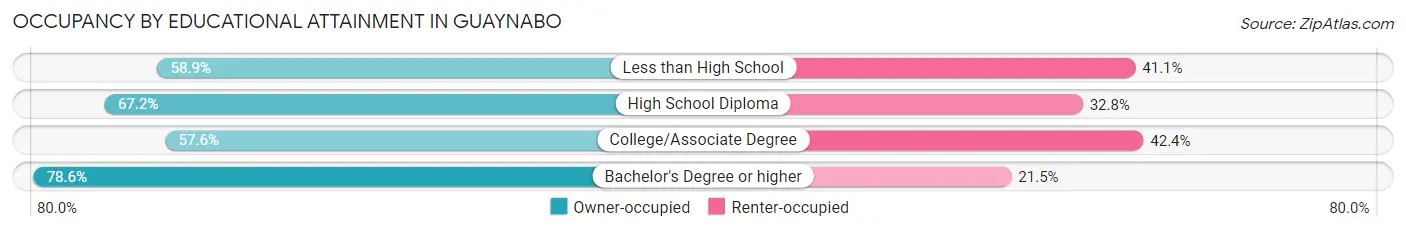
| Household Size | Owner-occupied | Renter-occupied |
| Less than High School | 1,460 (58.9%) | 1,019 (41.1%) |
| High School Diploma | 2,295 (67.2%) | 1,118 (32.8%) |
| College/Associate Degree | 2,727 (57.6%) | 2,006 (42.4%) |
| Bachelor's Degree or higher | 12,809 (78.5%) | 3,497 (21.4%) |
Occupancy by Age of Householder in Guaynabo
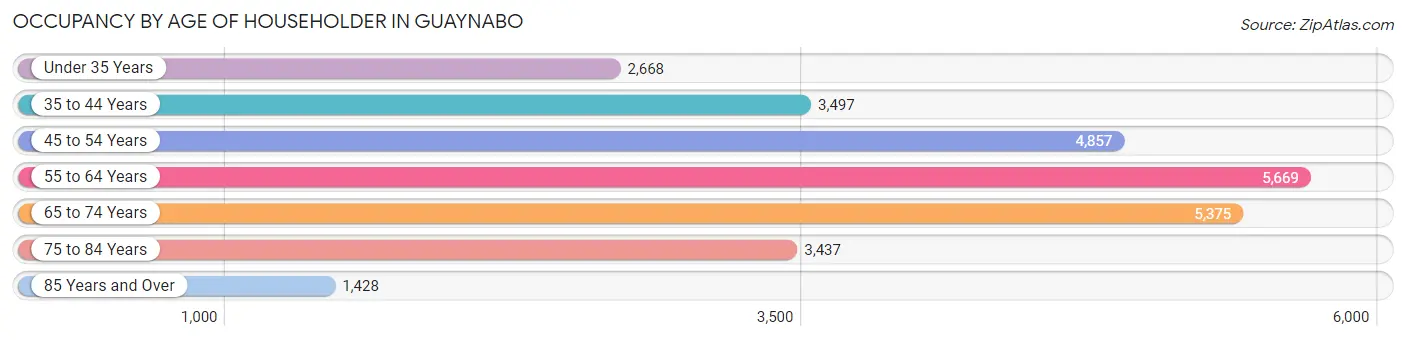
| Age Bracket | # Households | % Households |
| Under 35 Years | 2,668 | 9.9% |
| 35 to 44 Years | 3,497 | 13.0% |
| 45 to 54 Years | 4,857 | 18.0% |
| 55 to 64 Years | 5,669 | 21.0% |
| 65 to 74 Years | 5,375 | 20.0% |
| 75 to 84 Years | 3,437 | 12.8% |
| 85 Years and Over | 1,428 | 5.3% |
| Total | 26,931 | 100.0% |
Housing Finances in Guaynabo
Median Income by Occupancy in Guaynabo
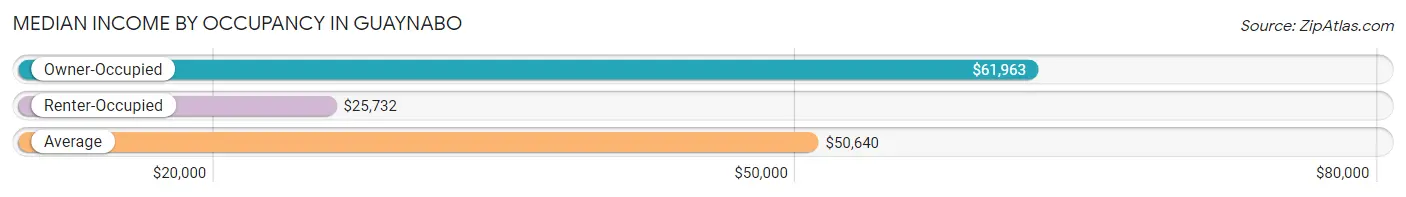
| Occupancy Type | # Households | Median Income |
| Owner-Occupied | 19,291 (71.6%) | $61,963 |
| Renter-Occupied | 7,640 (28.4%) | $25,732 |
| Average | 26,931 (100.0%) | $50,640 |
Occupancy by Householder Income Bracket in Guaynabo
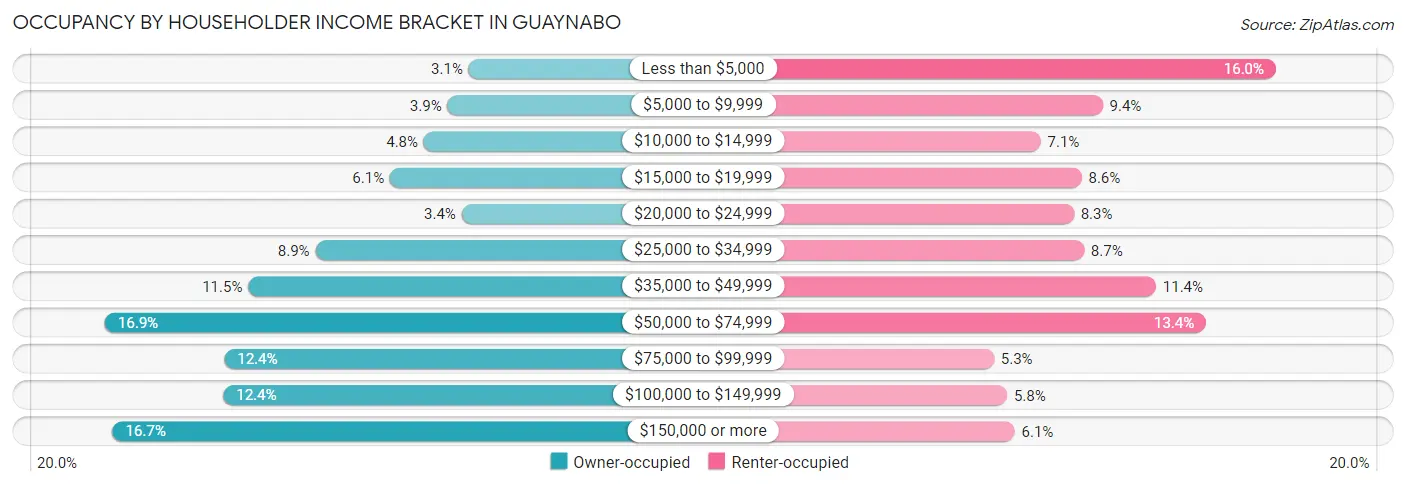
| Income Bracket | Owner-occupied | Renter-occupied |
| Less than $5,000 | 595 (3.1%) | 1,223 (16.0%) |
| $5,000 to $9,999 | 751 (3.9%) | 719 (9.4%) |
| $10,000 to $14,999 | 924 (4.8%) | 539 (7.0%) |
| $15,000 to $19,999 | 1,172 (6.1%) | 658 (8.6%) |
| $20,000 to $24,999 | 647 (3.4%) | 635 (8.3%) |
| $25,000 to $34,999 | 1,720 (8.9%) | 665 (8.7%) |
| $35,000 to $49,999 | 2,215 (11.5%) | 874 (11.4%) |
| $50,000 to $74,999 | 3,268 (16.9%) | 1,020 (13.4%) |
| $75,000 to $99,999 | 2,391 (12.4%) | 403 (5.3%) |
| $100,000 to $149,999 | 2,397 (12.4%) | 441 (5.8%) |
| $150,000 or more | 3,211 (16.7%) | 463 (6.1%) |
| Total | 19,291 (100.0%) | 7,640 (100.0%) |
Monthly Housing Cost Tiers in Guaynabo
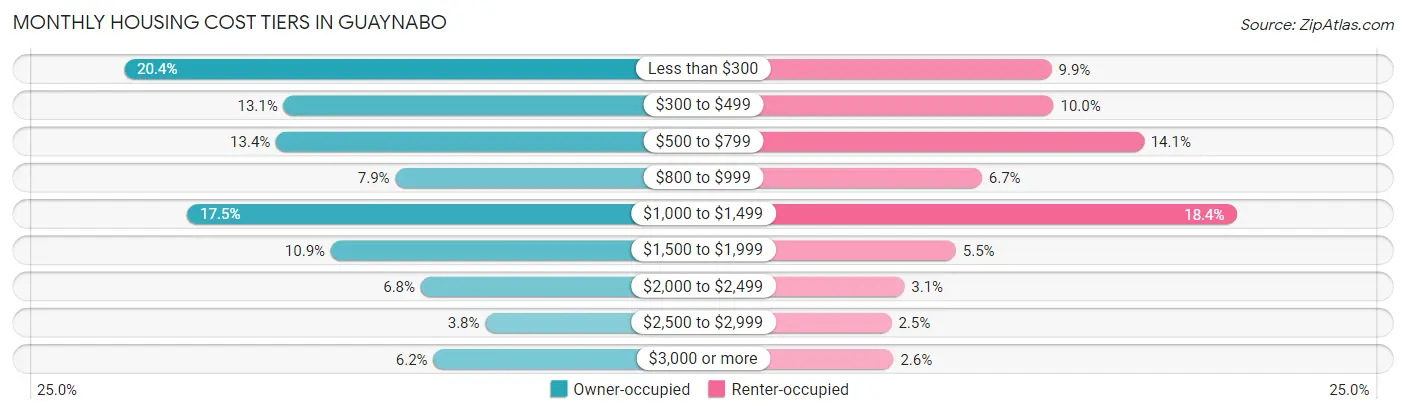
| Monthly Cost | Owner-occupied | Renter-occupied |
| Less than $300 | 3,940 (20.4%) | 753 (9.9%) |
| $300 to $499 | 2,524 (13.1%) | 760 (10.0%) |
| $500 to $799 | 2,588 (13.4%) | 1,077 (14.1%) |
| $800 to $999 | 1,529 (7.9%) | 508 (6.7%) |
| $1,000 to $1,499 | 3,380 (17.5%) | 1,403 (18.4%) |
| $1,500 to $1,999 | 2,102 (10.9%) | 416 (5.4%) |
| $2,000 to $2,499 | 1,304 (6.8%) | 235 (3.1%) |
| $2,500 to $2,999 | 731 (3.8%) | 190 (2.5%) |
| $3,000 or more | 1,193 (6.2%) | 197 (2.6%) |
| Total | 19,291 (100.0%) | 7,640 (100.0%) |
Physical Housing Characteristics in Guaynabo
Housing Structures in Guaynabo
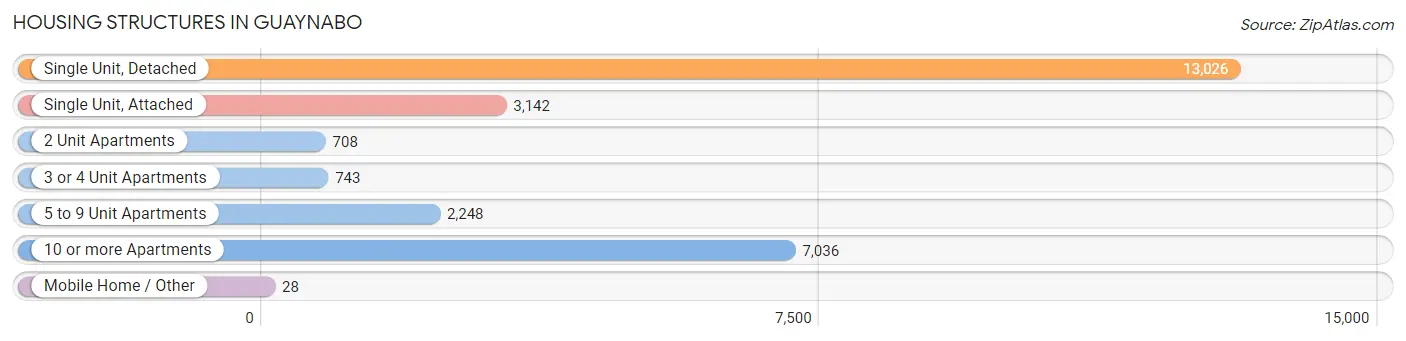
| Structure Type | # Housing Units | % Housing Units |
| Single Unit, Detached | 13,026 | 48.4% |
| Single Unit, Attached | 3,142 | 11.7% |
| 2 Unit Apartments | 708 | 2.6% |
| 3 or 4 Unit Apartments | 743 | 2.8% |
| 5 to 9 Unit Apartments | 2,248 | 8.4% |
| 10 or more Apartments | 7,036 | 26.1% |
| Mobile Home / Other | 28 | 0.1% |
| Total | 26,931 | 100.0% |
Housing Structures by Occupancy in Guaynabo
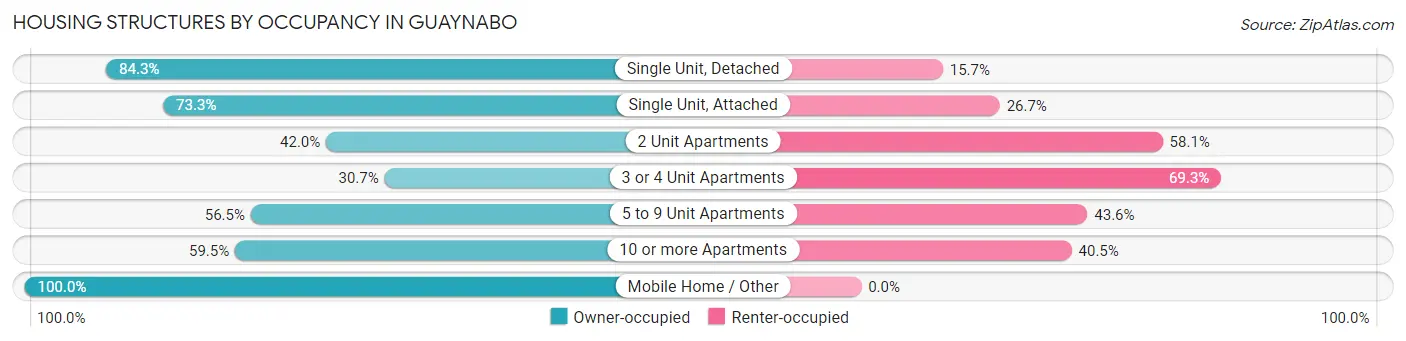
| Structure Type | Owner-occupied | Renter-occupied |
| Single Unit, Detached | 10,980 (84.3%) | 2,046 (15.7%) |
| Single Unit, Attached | 2,304 (73.3%) | 838 (26.7%) |
| 2 Unit Apartments | 297 (41.9%) | 411 (58.1%) |
| 3 or 4 Unit Apartments | 228 (30.7%) | 515 (69.3%) |
| 5 to 9 Unit Apartments | 1,269 (56.5%) | 979 (43.5%) |
| 10 or more Apartments | 4,185 (59.5%) | 2,851 (40.5%) |
| Mobile Home / Other | 28 (100.0%) | 0 (0.0%) |
| Total | 19,291 (71.6%) | 7,640 (28.4%) |
Housing Structures by Number of Rooms in Guaynabo
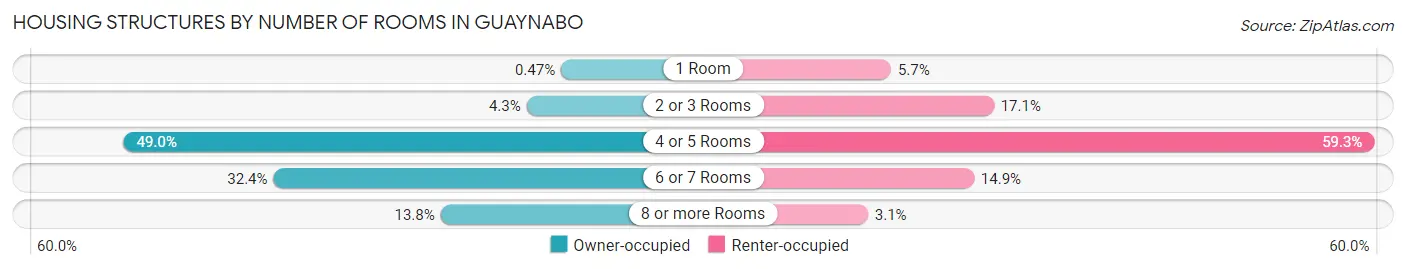
| Number of Rooms | Owner-occupied | Renter-occupied |
| 1 Room | 90 (0.5%) | 433 (5.7%) |
| 2 or 3 Rooms | 827 (4.3%) | 1,304 (17.1%) |
| 4 or 5 Rooms | 9,457 (49.0%) | 4,530 (59.3%) |
| 6 or 7 Rooms | 6,248 (32.4%) | 1,136 (14.9%) |
| 8 or more Rooms | 2,669 (13.8%) | 237 (3.1%) |
| Total | 19,291 (100.0%) | 7,640 (100.0%) |
Housing Structure by Heating Type in Guaynabo
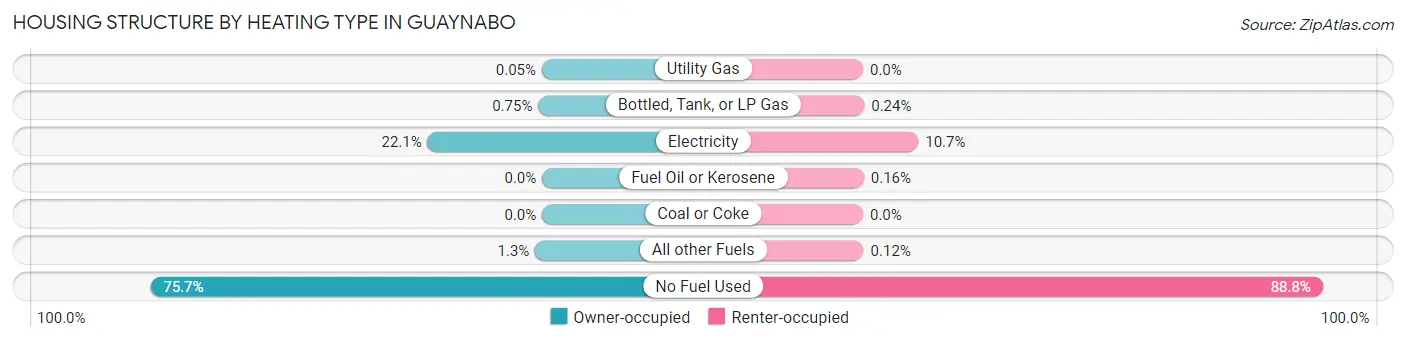
| Heating Type | Owner-occupied | Renter-occupied |
| Utility Gas | 10 (0.1%) | 0 (0.0%) |
| Bottled, Tank, or LP Gas | 145 (0.7%) | 18 (0.2%) |
| Electricity | 4,271 (22.1%) | 816 (10.7%) |
| Fuel Oil or Kerosene | 0 (0.0%) | 12 (0.2%) |
| Coal or Coke | 0 (0.0%) | 0 (0.0%) |
| All other Fuels | 259 (1.3%) | 9 (0.1%) |
| No Fuel Used | 14,606 (75.7%) | 6,785 (88.8%) |
| Total | 19,291 (100.0%) | 7,640 (100.0%) |
Household Vehicle Usage in Guaynabo
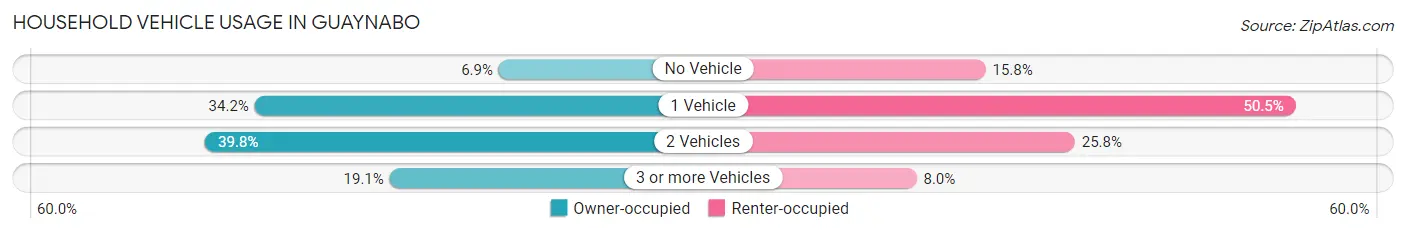
| Vehicles per Household | Owner-occupied | Renter-occupied |
| No Vehicle | 1,328 (6.9%) | 1,203 (15.8%) |
| 1 Vehicle | 6,603 (34.2%) | 3,857 (50.5%) |
| 2 Vehicles | 7,674 (39.8%) | 1,967 (25.8%) |
| 3 or more Vehicles | 3,686 (19.1%) | 613 (8.0%) |
| Total | 19,291 (100.0%) | 7,640 (100.0%) |
Real Estate & Mortgages in Guaynabo
Real Estate and Mortgage Overview in Guaynabo
| Characteristic | Without Mortgage | With Mortgage |
| Housing Units | 9,012 | 10,279 |
| Median Property Value | $208,700 | $226,700 |
| Median Household Income | $41,645 | $2,210 |
| Monthly Housing Costs | $338 | $1,193 |
| Real Estate Taxes | $1,046 | $4,541 |
Property Value by Mortgage Status in Guaynabo
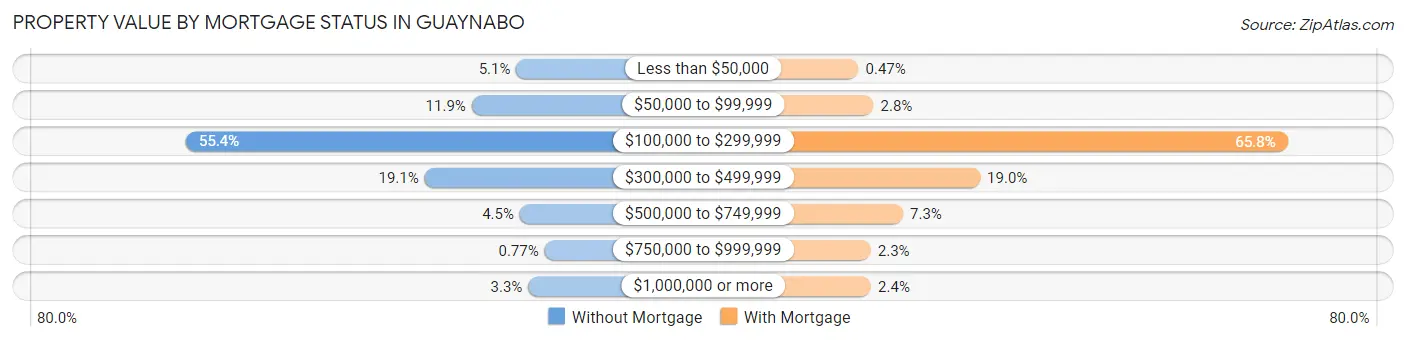
| Property Value | Without Mortgage | With Mortgage |
| Less than $50,000 | 457 (5.1%) | 48 (0.5%) |
| $50,000 to $99,999 | 1,071 (11.9%) | 283 (2.8%) |
| $100,000 to $299,999 | 4,994 (55.4%) | 6,766 (65.8%) |
| $300,000 to $499,999 | 1,718 (19.1%) | 1,952 (19.0%) |
| $500,000 to $749,999 | 409 (4.5%) | 745 (7.2%) |
| $750,000 to $999,999 | 69 (0.8%) | 240 (2.3%) |
| $1,000,000 or more | 294 (3.3%) | 245 (2.4%) |
| Total | 9,012 (100.0%) | 10,279 (100.0%) |
Household Income by Mortgage Status in Guaynabo
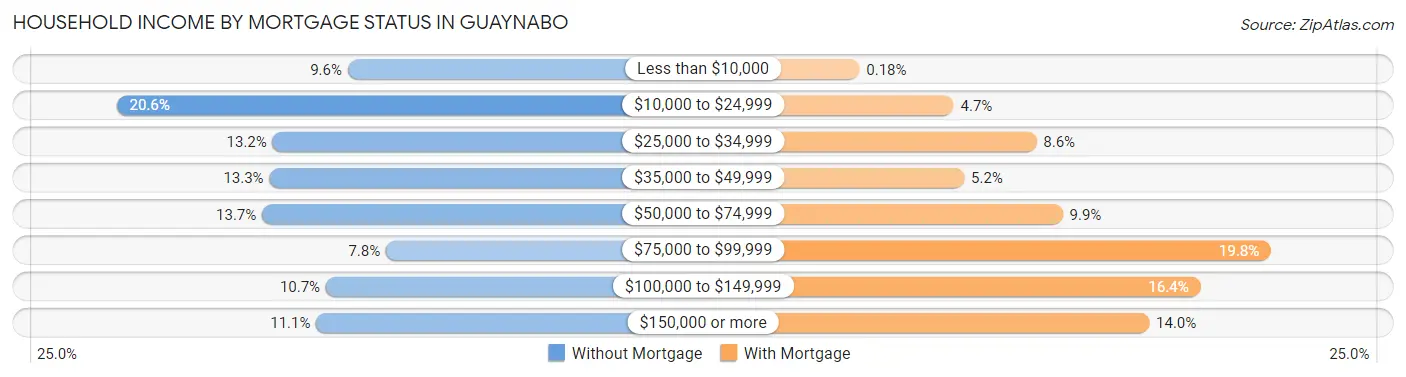
| Household Income | Without Mortgage | With Mortgage |
| Less than $10,000 | 866 (9.6%) | 19 (0.2%) |
| $10,000 to $24,999 | 1,858 (20.6%) | 480 (4.7%) |
| $25,000 to $34,999 | 1,189 (13.2%) | 885 (8.6%) |
| $35,000 to $49,999 | 1,202 (13.3%) | 531 (5.2%) |
| $50,000 to $74,999 | 1,234 (13.7%) | 1,013 (9.9%) |
| $75,000 to $99,999 | 702 (7.8%) | 2,034 (19.8%) |
| $100,000 to $149,999 | 960 (10.6%) | 1,689 (16.4%) |
| $150,000 or more | 1,001 (11.1%) | 1,437 (14.0%) |
| Total | 9,012 (100.0%) | 10,279 (100.0%) |
Property Value to Household Income Ratio in Guaynabo
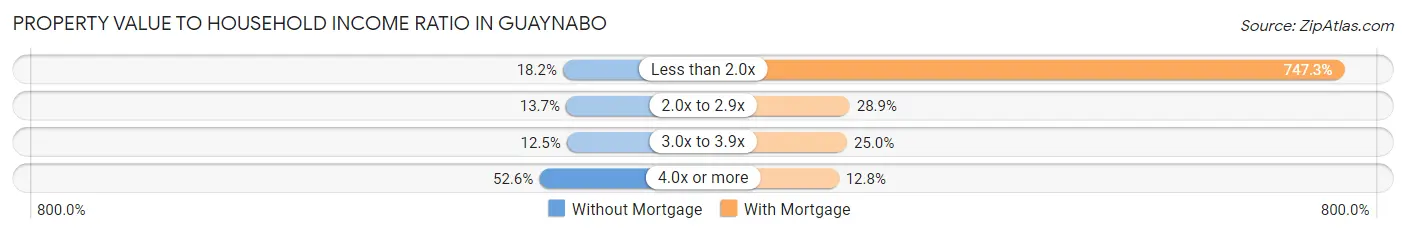
| Value-to-Income Ratio | Without Mortgage | With Mortgage |
| Less than 2.0x | 1,637 (18.2%) | 76,819 (747.3%) |
| 2.0x to 2.9x | 1,238 (13.7%) | 2,969 (28.9%) |
| 3.0x to 3.9x | 1,126 (12.5%) | 2,568 (25.0%) |
| 4.0x or more | 4,738 (52.6%) | 1,317 (12.8%) |
| Total | 9,012 (100.0%) | 10,279 (100.0%) |
Real Estate Taxes by Mortgage Status in Guaynabo
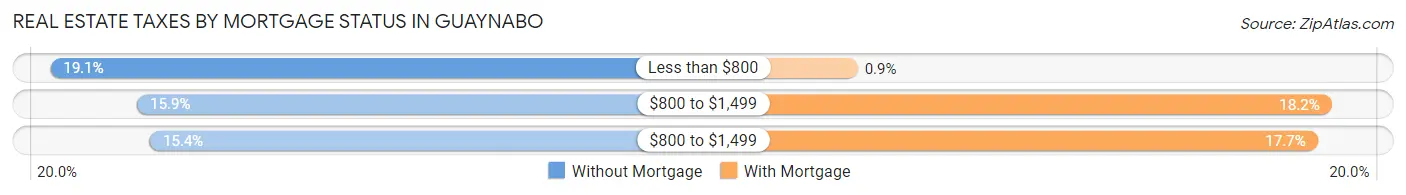
| Property Taxes | Without Mortgage | With Mortgage |
| Less than $800 | 1,718 (19.1%) | 92 (0.9%) |
| $800 to $1,499 | 1,432 (15.9%) | 1,872 (18.2%) |
| $800 to $1,499 | 1,390 (15.4%) | 1,819 (17.7%) |
| Total | 9,012 (100.0%) | 10,279 (100.0%) |
Health & Disability in Guaynabo
Health Insurance Coverage by Age in Guaynabo
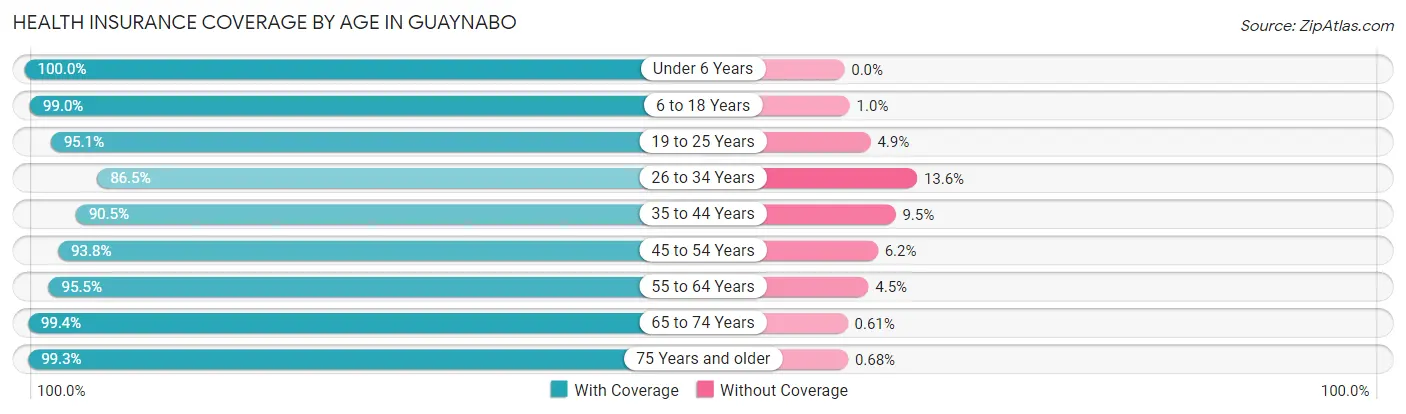
| Age Bracket | With Coverage | Without Coverage |
| Under 6 Years | 2,709 (100.0%) | 0 (0.0%) |
| 6 to 18 Years | 8,680 (99.0%) | 88 (1.0%) |
| 19 to 25 Years | 5,063 (95.1%) | 260 (4.9%) |
| 26 to 34 Years | 7,081 (86.5%) | 1,110 (13.6%) |
| 35 to 44 Years | 7,816 (90.5%) | 824 (9.5%) |
| 45 to 54 Years | 8,412 (93.8%) | 559 (6.2%) |
| 55 to 64 Years | 9,641 (95.5%) | 452 (4.5%) |
| 65 to 74 Years | 8,610 (99.4%) | 53 (0.6%) |
| 75 Years and older | 8,279 (99.3%) | 57 (0.7%) |
| Total | 66,291 (95.1%) | 3,403 (4.9%) |
Health Insurance Coverage by Citizenship Status in Guaynabo
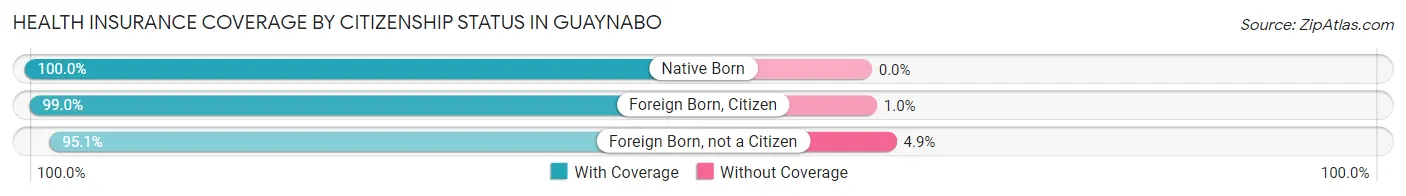
| Citizenship Status | With Coverage | Without Coverage |
| Native Born | 2,709 (100.0%) | 0 (0.0%) |
| Foreign Born, Citizen | 8,680 (99.0%) | 88 (1.0%) |
| Foreign Born, not a Citizen | 5,063 (95.1%) | 260 (4.9%) |
Health Insurance Coverage by Household Income in Guaynabo
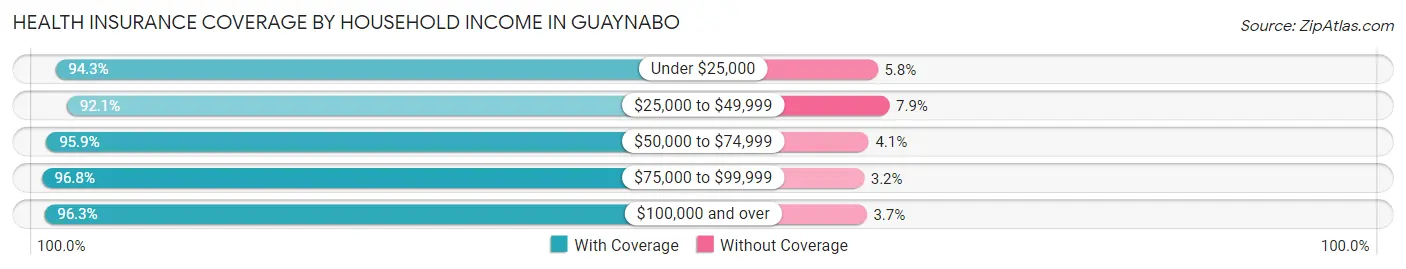
| Household Income | With Coverage | Without Coverage |
| Under $25,000 | 14,478 (94.3%) | 884 (5.8%) |
| $25,000 to $49,999 | 11,313 (92.1%) | 973 (7.9%) |
| $50,000 to $74,999 | 11,187 (95.9%) | 474 (4.1%) |
| $75,000 to $99,999 | 8,239 (96.8%) | 271 (3.2%) |
| $100,000 and over | 20,805 (96.3%) | 798 (3.7%) |
Public vs Private Health Insurance Coverage by Age in Guaynabo
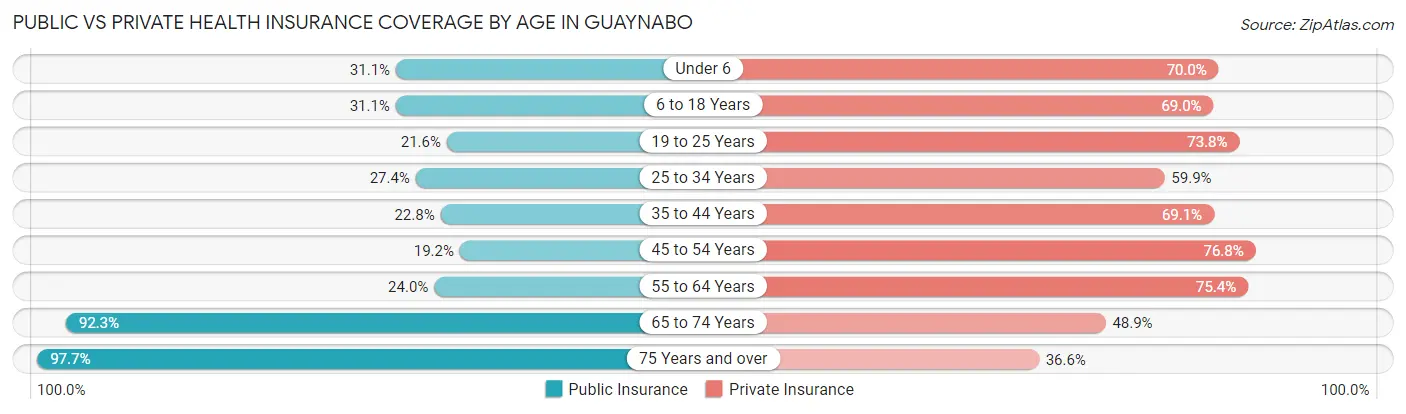
| Age Bracket | Public Insurance | Private Insurance |
| Under 6 | 842 (31.1%) | 1,895 (70.0%) |
| 6 to 18 Years | 2,729 (31.1%) | 6,048 (69.0%) |
| 19 to 25 Years | 1,152 (21.6%) | 3,928 (73.8%) |
| 25 to 34 Years | 2,245 (27.4%) | 4,905 (59.9%) |
| 35 to 44 Years | 1,971 (22.8%) | 5,968 (69.1%) |
| 45 to 54 Years | 1,724 (19.2%) | 6,889 (76.8%) |
| 55 to 64 Years | 2,420 (24.0%) | 7,610 (75.4%) |
| 65 to 74 Years | 7,999 (92.3%) | 4,240 (48.9%) |
| 75 Years and over | 8,140 (97.7%) | 3,047 (36.5%) |
| Total | 29,222 (41.9%) | 44,530 (63.9%) |
Disability Status by Sex by Age in Guaynabo
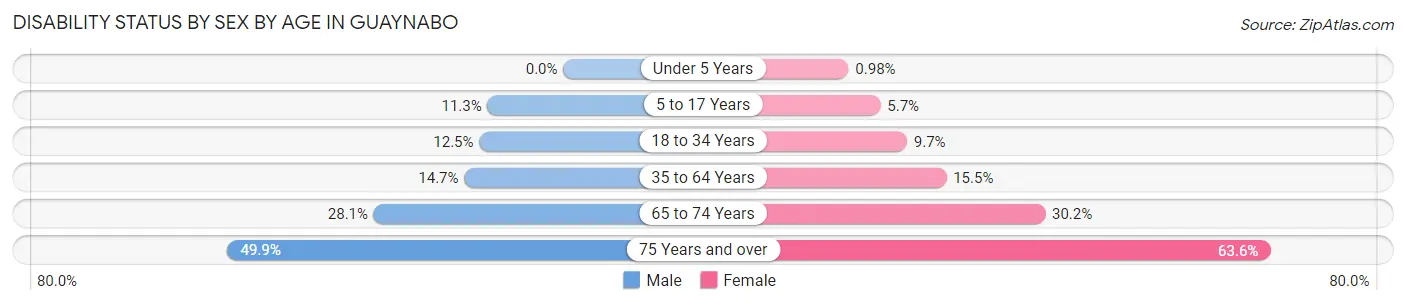
| Age Bracket | Male | Female |
| Under 5 Years | 0 (0.0%) | 11 (1.0%) |
| 5 to 17 Years | 469 (11.3%) | 240 (5.7%) |
| 18 to 34 Years | 931 (12.5%) | 663 (9.7%) |
| 35 to 64 Years | 1,835 (14.7%) | 2,361 (15.5%) |
| 65 to 74 Years | 1,039 (28.1%) | 1,500 (30.2%) |
| 75 Years and over | 1,525 (49.9%) | 3,357 (63.6%) |
Disability Class by Sex by Age in Guaynabo
Disability Class: Hearing Difficulty
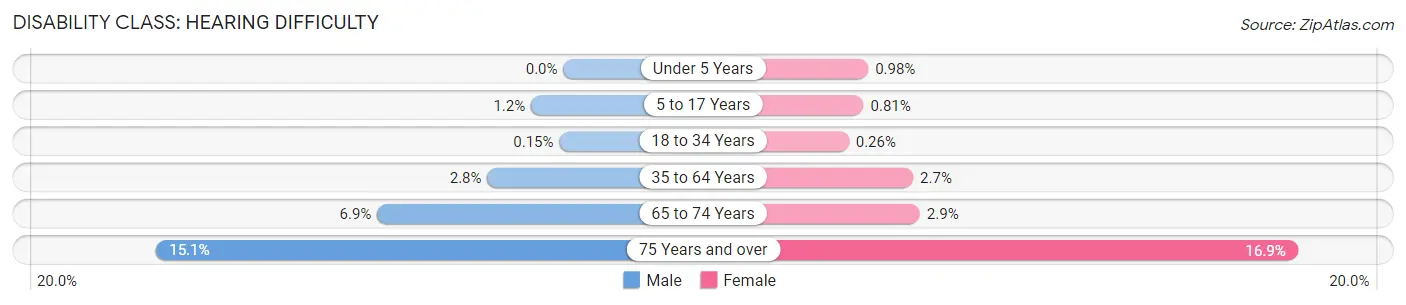
| Age Bracket | Male | Female |
| Under 5 Years | 0 (0.0%) | 11 (1.0%) |
| 5 to 17 Years | 50 (1.2%) | 34 (0.8%) |
| 18 to 34 Years | 11 (0.2%) | 18 (0.3%) |
| 35 to 64 Years | 352 (2.8%) | 404 (2.6%) |
| 65 to 74 Years | 255 (6.9%) | 144 (2.9%) |
| 75 Years and over | 462 (15.1%) | 893 (16.9%) |
Disability Class: Vision Difficulty
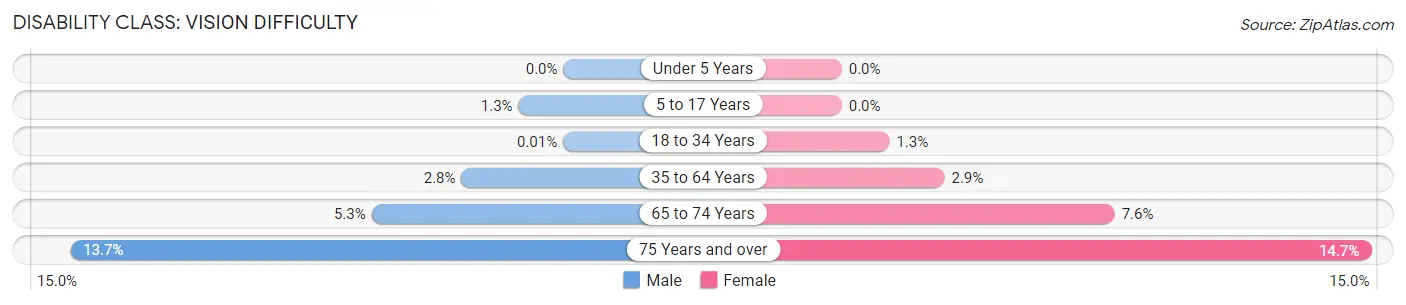
| Age Bracket | Male | Female |
| Under 5 Years | 0 (0.0%) | 0 (0.0%) |
| 5 to 17 Years | 52 (1.3%) | 0 (0.0%) |
| 18 to 34 Years | 1 (0.0%) | 91 (1.3%) |
| 35 to 64 Years | 354 (2.8%) | 436 (2.9%) |
| 65 to 74 Years | 197 (5.3%) | 378 (7.6%) |
| 75 Years and over | 420 (13.7%) | 778 (14.7%) |
Disability Class: Cognitive Difficulty
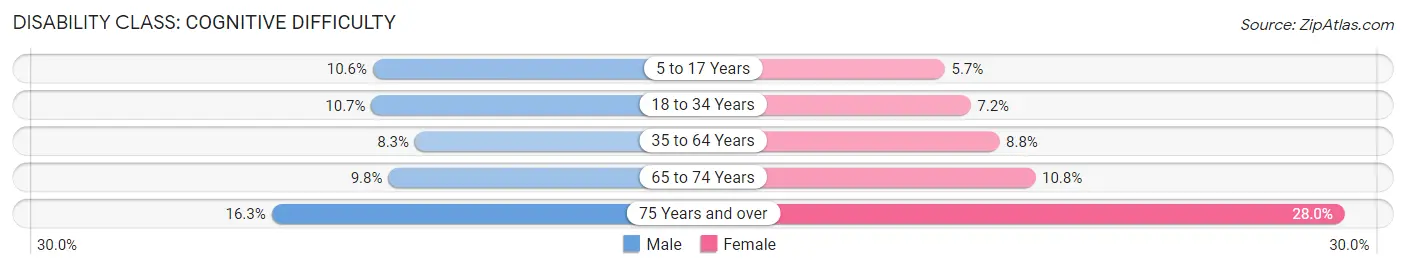
| Age Bracket | Male | Female |
| 5 to 17 Years | 442 (10.6%) | 240 (5.7%) |
| 18 to 34 Years | 798 (10.7%) | 491 (7.2%) |
| 35 to 64 Years | 1,033 (8.3%) | 1,333 (8.8%) |
| 65 to 74 Years | 360 (9.8%) | 535 (10.8%) |
| 75 Years and over | 497 (16.3%) | 1,478 (28.0%) |
Disability Class: Ambulatory Difficulty
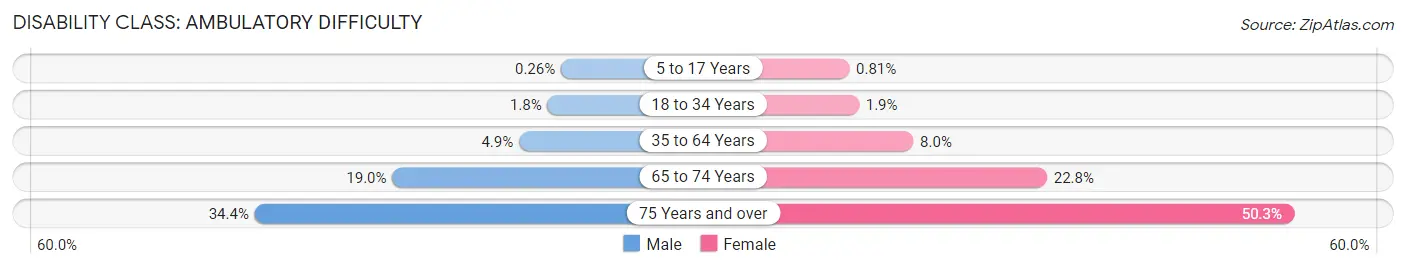
| Age Bracket | Male | Female |
| 5 to 17 Years | 11 (0.3%) | 34 (0.8%) |
| 18 to 34 Years | 131 (1.8%) | 130 (1.9%) |
| 35 to 64 Years | 615 (4.9%) | 1,210 (8.0%) |
| 65 to 74 Years | 703 (19.0%) | 1,135 (22.8%) |
| 75 Years and over | 1,051 (34.4%) | 2,657 (50.3%) |
Disability Class: Self-Care Difficulty
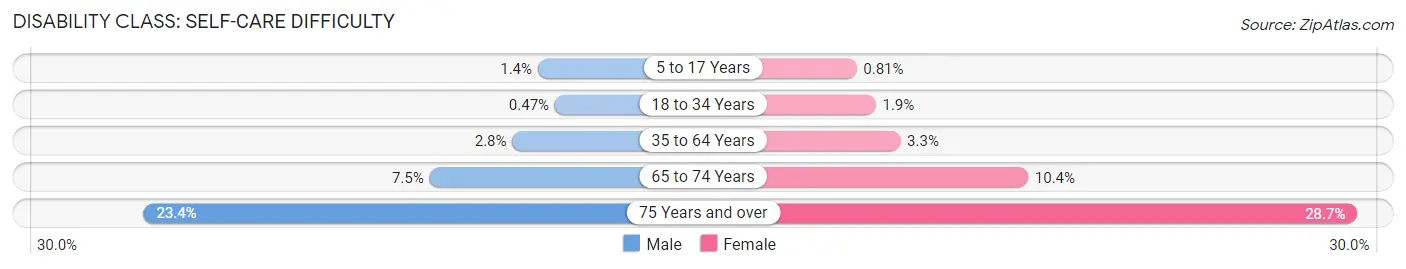
| Age Bracket | Male | Female |
| 5 to 17 Years | 59 (1.4%) | 34 (0.8%) |
| 18 to 34 Years | 35 (0.5%) | 129 (1.9%) |
| 35 to 64 Years | 355 (2.8%) | 494 (3.3%) |
| 65 to 74 Years | 275 (7.4%) | 515 (10.4%) |
| 75 Years and over | 715 (23.4%) | 1,515 (28.7%) |
Technology Access in Guaynabo
Computing Device Access in Guaynabo
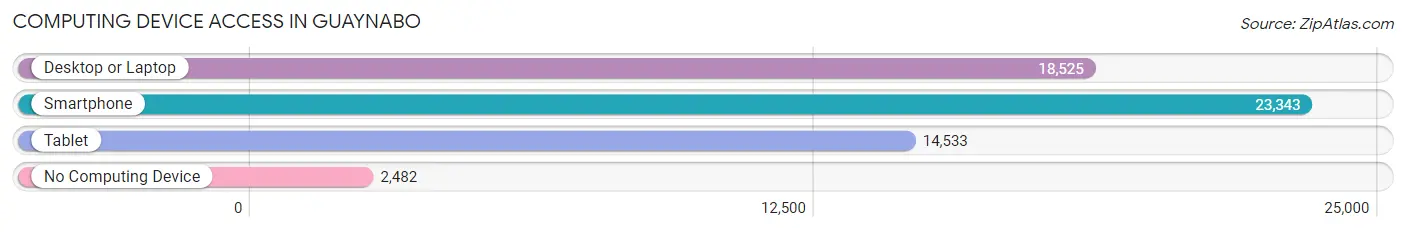
| Device Type | # Households | % Households |
| Desktop or Laptop | 18,525 | 68.8% |
| Smartphone | 23,343 | 86.7% |
| Tablet | 14,533 | 54.0% |
| No Computing Device | 2,482 | 9.2% |
| Total | 26,931 | 100.0% |
Internet Access in Guaynabo
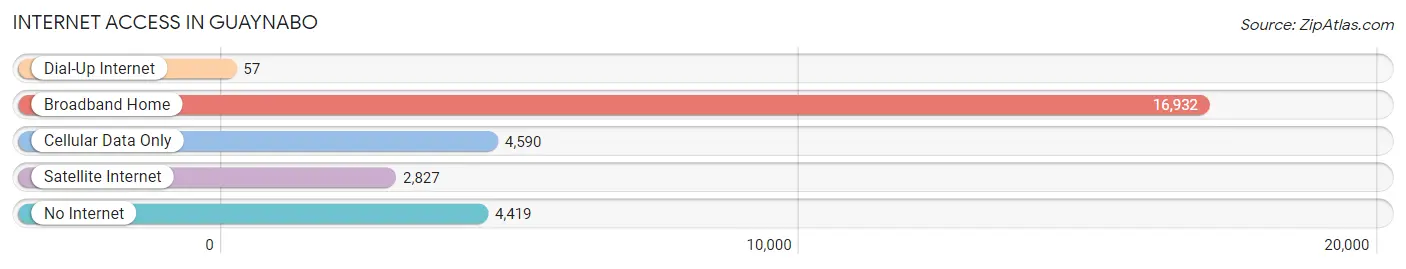
| Internet Type | # Households | % Households |
| Dial-Up Internet | 57 | 0.2% |
| Broadband Home | 16,932 | 62.9% |
| Cellular Data Only | 4,590 | 17.0% |
| Satellite Internet | 2,827 | 10.5% |
| No Internet | 4,419 | 16.4% |
| Total | 26,931 | 100.0% |
Guaynabo Summary
Guaynabo is a municipality located in the northern coast of Puerto Rico, in the northern part of the island. It is part of the San Juan-Caguas-Guaynabo Metropolitan Statistical Area. As of the 2010 census, the municipality had a population of 97,924, making it the third most populous municipality in Puerto Rico.
History
The area of Guaynabo was originally inhabited by the Taíno Indians, who called the area “Guaynabo”, which means “land of the waters”. The area was later colonized by the Spanish in the 16th century. During the Spanish colonial period, the area was used for cattle ranching and agriculture.
In 1776, the area was officially declared a municipality by the Spanish government. During the 19th century, the area experienced a period of economic growth and development, with the construction of roads, bridges, and other infrastructure.
In 1898, the area was ceded to the United States as part of the Treaty of Paris, which ended the Spanish-American War. In 1899, the area was incorporated as a municipality of Puerto Rico.
Geography
Guaynabo is located in the northern coast of Puerto Rico, in the northern part of the island. It is bordered by the municipalities of San Juan, Bayamón, Toa Baja, and Cataño. The municipality covers an area of approximately 24 square miles (62 km2).
The terrain of Guaynabo is mostly flat, with some hills in the northern part of the municipality. The highest point in the municipality is Cerro de la Cruz, which has an elevation of 1,065 feet (325 m).
The climate of Guaynabo is tropical, with an average temperature of 79°F (26°C). The average annual precipitation is approximately 64 inches (1,600 mm).
Economy
The economy of Guaynabo is largely based on services and manufacturing. The municipality is home to several large companies, including pharmaceutical giant Pfizer, telecommunications company AT&T, and financial services company Banco Popular.
The municipality is also home to several shopping centers, including Plaza Las Américas, Plaza Guaynabo, and Plaza del Sol.
Demographics
As of the 2010 census, the population of Guaynabo was 97,924, making it the third most populous municipality in Puerto Rico. The population is largely of mixed European and African descent. The median household income in the municipality is $20,845, and the median age is 37.
The majority of the population (90.3%) speaks Spanish as their primary language, while 4.2% speak English. The majority of the population (94.2%) is Roman Catholic, while 2.2% are Protestant.
Guaynabo is home to several universities, including the University of Puerto Rico at Bayamón, the Interamerican University of Puerto Rico, and the University of the Sacred Heart. The municipality also has several public and private schools, including the Colegio San Ignacio de Loyola, the Colegio San Antonio Abad, and the Colegio San José.
Common Questions
What is Per Capita Income in Guaynabo?
Per Capita income in Guaynabo is $32,208.
What is the Median Family Income in Guaynabo?
Median Family Income in Guaynabo is $65,160.
What is the Median Household income in Guaynabo?
Median Household Income in Guaynabo is $50,640.
What is Income or Wage Gap in Guaynabo?
Income or Wage Gap in Guaynabo is 13.4%.
Women in Guaynabo earn 86.6 cents for every dollar earned by a man.
What is Family Income Deficit in Guaynabo?
Family Income Deficit in Guaynabo is $10,174.
Families that are below poverty line in Guaynabo earn $10,174 less on average than the poverty threshold level.
What is Inequality or Gini Index in Guaynabo?
Inequality or Gini Index in Guaynabo is 0.54.
What is the Total Population of Guaynabo?
Total Population of Guaynabo is 70,167.
What is the Total Male Population of Guaynabo?
Total Male Population of Guaynabo is 32,305.
What is the Total Female Population of Guaynabo?
Total Female Population of Guaynabo is 37,862.
What is the Ratio of Males per 100 Females in Guaynabo?
There are 85.32 Males per 100 Females in Guaynabo.
What is the Ratio of Females per 100 Males in Guaynabo?
There are 117.20 Females per 100 Males in Guaynabo.
What is the Median Population Age in Guaynabo?
Median Population Age in Guaynabo is 46.6 Years.
What is the Average Family Size in Guaynabo
Average Family Size in Guaynabo is 3.3 People.
What is the Average Household Size in Guaynabo
Average Household Size in Guaynabo is 2.6 People.
How Large is the Labor Force in Guaynabo?
There are 32,195 People in the Labor Forcein in Guaynabo.
What is the Percentage of People in the Labor Force in Guaynabo?
52.6% of People are in the Labor Force in Guaynabo.
What is the Unemployment Rate in Guaynabo?
Unemployment Rate in Guaynabo is 8.1%.