Mexican American Indian Self-Care Disability
COMPARE
Mexican American Indian
Select to Compare
Self-Care Disability
Mexican American Indian Self-Care Disability
2.6%
SELF-CARE DISABILITY
0.5/ 100
METRIC RATING
249th/ 347
METRIC RANK
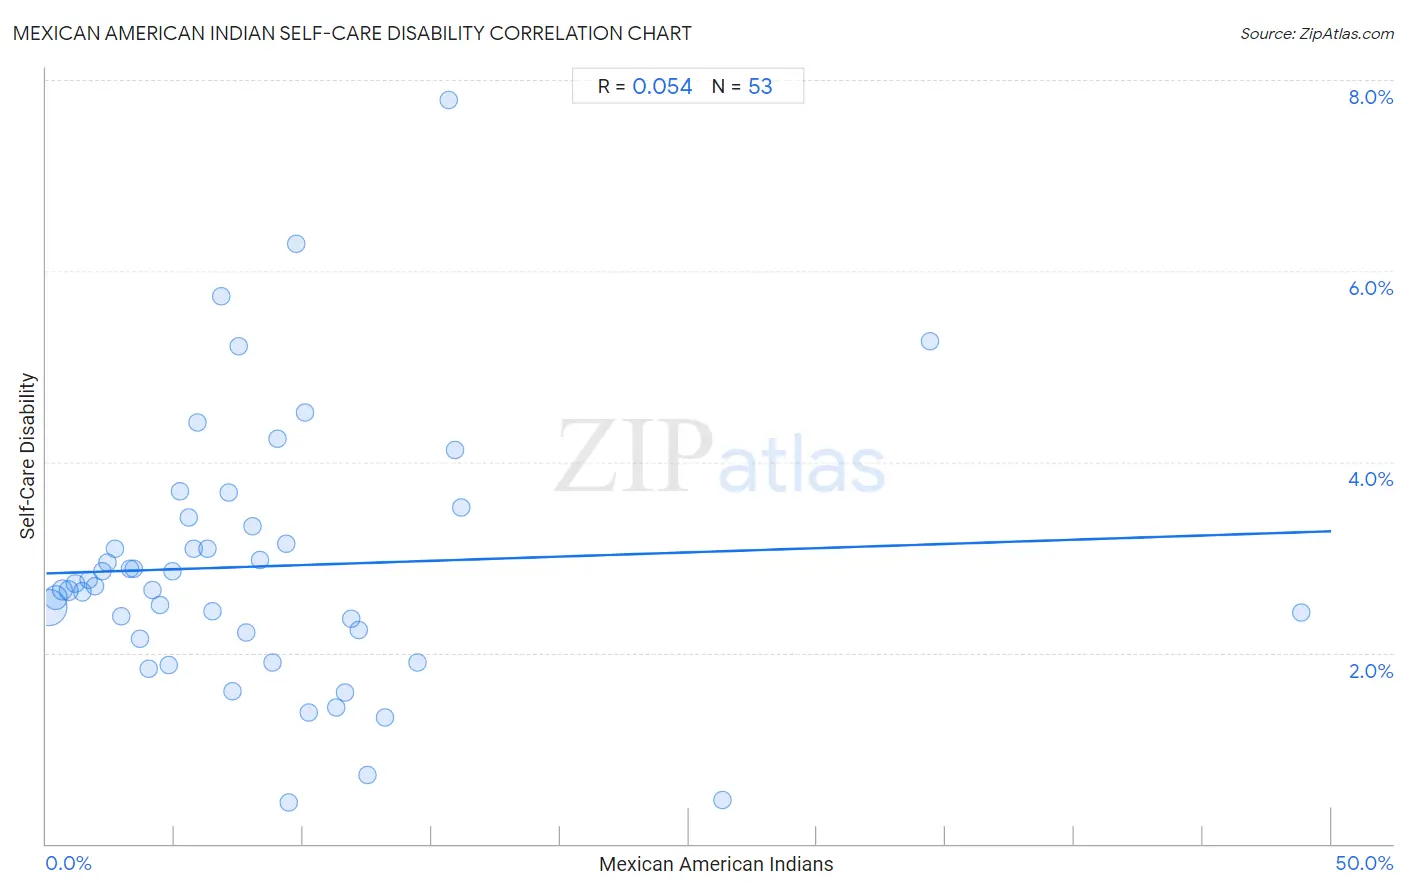
Mexican American Indian Self-Care Disability Correlation Chart
The statistical analysis conducted on geographies consisting of 317,353,837 people shows a slight positive correlation between the proportion of Mexican American Indians and percentage of population with self-care disability in the United States with a correlation coefficient (R) of 0.054 and weighted average of 2.6%. On average, for every 1% (one percent) increase in Mexican American Indians within a typical geography, there is an increase of 0.0088% in percentage of population with self-care disability.
It is essential to understand that the correlation between the percentage of Mexican American Indians and percentage of population with self-care disability does not imply a direct cause-and-effect relationship. It remains uncertain whether the presence of Mexican American Indians influences an upward or downward trend in the level of percentage of population with self-care disability within an area, or if Mexican American Indians simply ended up residing in those areas with higher or lower levels of percentage of population with self-care disability due to other factors.
Demographics Similar to Mexican American Indians by Self-Care Disability
In terms of self-care disability, the demographic groups most similar to Mexican American Indians are Portuguese (2.6%, a difference of 0.080%), Immigrants from Liberia (2.6%, a difference of 0.16%), Nicaraguan (2.6%, a difference of 0.23%), Immigrants from Albania (2.6%, a difference of 0.24%), and Immigrants from Bangladesh (2.6%, a difference of 0.24%).
| Demographics | Rating | Rank | Self-Care Disability |
| Spanish | 0.8 /100 | #242 | Tragic 2.6% |
| Hawaiians | 0.8 /100 | #243 | Tragic 2.6% |
| Yuman | 0.8 /100 | #244 | Tragic 2.6% |
| Immigrants from Western Asia | 0.6 /100 | #245 | Tragic 2.6% |
| Cheyenne | 0.6 /100 | #246 | Tragic 2.6% |
| Immigrants from Albania | 0.6 /100 | #247 | Tragic 2.6% |
| Nicaraguans | 0.6 /100 | #248 | Tragic 2.6% |
| Mexican American Indians | 0.5 /100 | #249 | Tragic 2.6% |
| Portuguese | 0.4 /100 | #250 | Tragic 2.6% |
| Immigrants from Liberia | 0.4 /100 | #251 | Tragic 2.6% |
| Immigrants from Bangladesh | 0.4 /100 | #252 | Tragic 2.6% |
| Immigrants from Haiti | 0.3 /100 | #253 | Tragic 2.6% |
| Haitians | 0.3 /100 | #254 | Tragic 2.6% |
| Tsimshian | 0.3 /100 | #255 | Tragic 2.6% |
| Immigrants from Central America | 0.3 /100 | #256 | Tragic 2.6% |
Mexican American Indian Self-Care Disability Correlation Summary
| Measurement | Mexican American Indian Data | Self-Care Disability Data |
| Minimum | 0.10% | 0.43% |
| Maximum | 48.8% | 7.8% |
| Range | 48.7% | 7.4% |
| Mean | 8.5% | 2.9% |
| Median | 6.8% | 2.7% |
| Interquartile 25% (IQ1) | 3.3% | 2.2% |
| Interquartile 75% (IQ3) | 10.7% | 3.4% |
| Interquartile Range (IQR) | 7.4% | 1.2% |
| Standard Deviation (Sample) | 8.4% | 1.4% |
| Standard Deviation (Population) | 8.4% | 1.4% |
Correlation Details
| Mexican American Indian Percentile | Sample Size | Self-Care Disability |
[ 0.0% - 0.5% ] 0.10% | 197,400,231 | 2.5% |
[ 0.0% - 0.5% ] 0.37% | 63,726,328 | 2.6% |
[ 0.5% - 1.0% ] 0.62% | 28,024,304 | 2.7% |
[ 0.5% - 1.0% ] 0.87% | 13,577,009 | 2.7% |
[ 1.0% - 1.5% ] 1.13% | 5,313,464 | 2.7% |
[ 1.0% - 1.5% ] 1.40% | 2,945,324 | 2.6% |
[ 1.5% - 2.0% ] 1.63% | 2,379,213 | 2.8% |
[ 1.5% - 2.0% ] 1.89% | 1,214,851 | 2.7% |
[ 2.0% - 2.5% ] 2.17% | 920,035 | 2.9% |
[ 2.0% - 2.5% ] 2.39% | 490,463 | 2.9% |
[ 2.5% - 3.0% ] 2.67% | 319,325 | 3.1% |
[ 2.5% - 3.0% ] 2.93% | 108,917 | 2.4% |
[ 3.0% - 3.5% ] 3.24% | 331,082 | 2.9% |
[ 3.0% - 3.5% ] 3.42% | 120,247 | 2.9% |
[ 3.5% - 4.0% ] 3.65% | 103,785 | 2.2% |
[ 3.5% - 4.0% ] 3.99% | 102,707 | 1.8% |
[ 4.0% - 4.5% ] 4.14% | 19,042 | 2.7% |
[ 4.0% - 4.5% ] 4.43% | 29,357 | 2.5% |
[ 4.5% - 5.0% ] 4.77% | 21,719 | 1.9% |
[ 4.5% - 5.0% ] 4.93% | 13,928 | 2.9% |
[ 5.0% - 5.5% ] 5.19% | 36,726 | 3.7% |
[ 5.5% - 6.0% ] 5.53% | 13,087 | 3.4% |
[ 5.5% - 6.0% ] 5.72% | 2,762 | 3.1% |
[ 5.5% - 6.0% ] 5.91% | 17,517 | 4.4% |
[ 6.0% - 6.5% ] 6.28% | 13,355 | 3.1% |
[ 6.0% - 6.5% ] 6.45% | 11,493 | 2.4% |
[ 6.5% - 7.0% ] 6.79% | 7,742 | 5.7% |
[ 7.0% - 7.5% ] 7.09% | 23,092 | 3.7% |
[ 7.0% - 7.5% ] 7.24% | 5,163 | 1.6% |
[ 7.0% - 7.5% ] 7.49% | 2,909 | 5.2% |
[ 7.5% - 8.0% ] 7.79% | 9,657 | 2.2% |
[ 8.0% - 8.5% ] 8.01% | 9,047 | 3.3% |
[ 8.0% - 8.5% ] 8.32% | 1,863 | 3.0% |
[ 8.5% - 9.0% ] 8.82% | 2,506 | 1.9% |
[ 9.0% - 9.5% ] 9.02% | 5,409 | 4.2% |
[ 9.0% - 9.5% ] 9.33% | 3,816 | 3.1% |
[ 9.0% - 9.5% ] 9.46% | 2,220 | 0.43% |
[ 9.5% - 10.0% ] 9.73% | 894 | 6.3% |
[ 10.0% - 10.5% ] 10.05% | 4,526 | 4.5% |
[ 10.0% - 10.5% ] 10.21% | 519 | 1.4% |
[ 11.0% - 11.5% ] 11.28% | 727 | 1.4% |
[ 11.5% - 12.0% ] 11.64% | 507 | 1.6% |
[ 11.5% - 12.0% ] 11.88% | 2,777 | 2.4% |
[ 12.0% - 12.5% ] 12.15% | 650 | 2.2% |
[ 12.0% - 12.5% ] 12.48% | 2,756 | 0.72% |
[ 13.0% - 13.5% ] 13.17% | 3,242 | 1.3% |
[ 14.0% - 14.5% ] 14.47% | 159 | 1.9% |
[ 15.5% - 16.0% ] 15.65% | 1,438 | 7.8% |
[ 15.5% - 16.0% ] 15.93% | 1,036 | 4.1% |
[ 16.0% - 16.5% ] 16.14% | 3,129 | 3.5% |
[ 26.0% - 26.5% ] 26.33% | 938 | 0.46% |
[ 34.0% - 34.5% ] 34.41% | 590 | 5.3% |
[ 48.5% - 49.0% ] 48.82% | 254 | 2.4% |