Mexican American Indian Married-couple Households
COMPARE
Mexican American Indian
Select to Compare
Married-couple Households
Mexican American Indian Married-couple Households
45.9%
MARRIED-COUPLE HOUSEHOLDS
23.3/ 100
METRIC RATING
194th/ 347
METRIC RANK
Mexican American Indian Married-couple Households Correlation Chart
The statistical analysis conducted on geographies consisting of 317,492,406 people shows a slight negative correlation between the proportion of Mexican American Indians and percentage of married-couple family households in the United States with a correlation coefficient (R) of -0.062 and weighted average of 45.9%. On average, for every 1% (one percent) increase in Mexican American Indians within a typical geography, there is a decrease of 0.053% in percentage of married-couple family households.
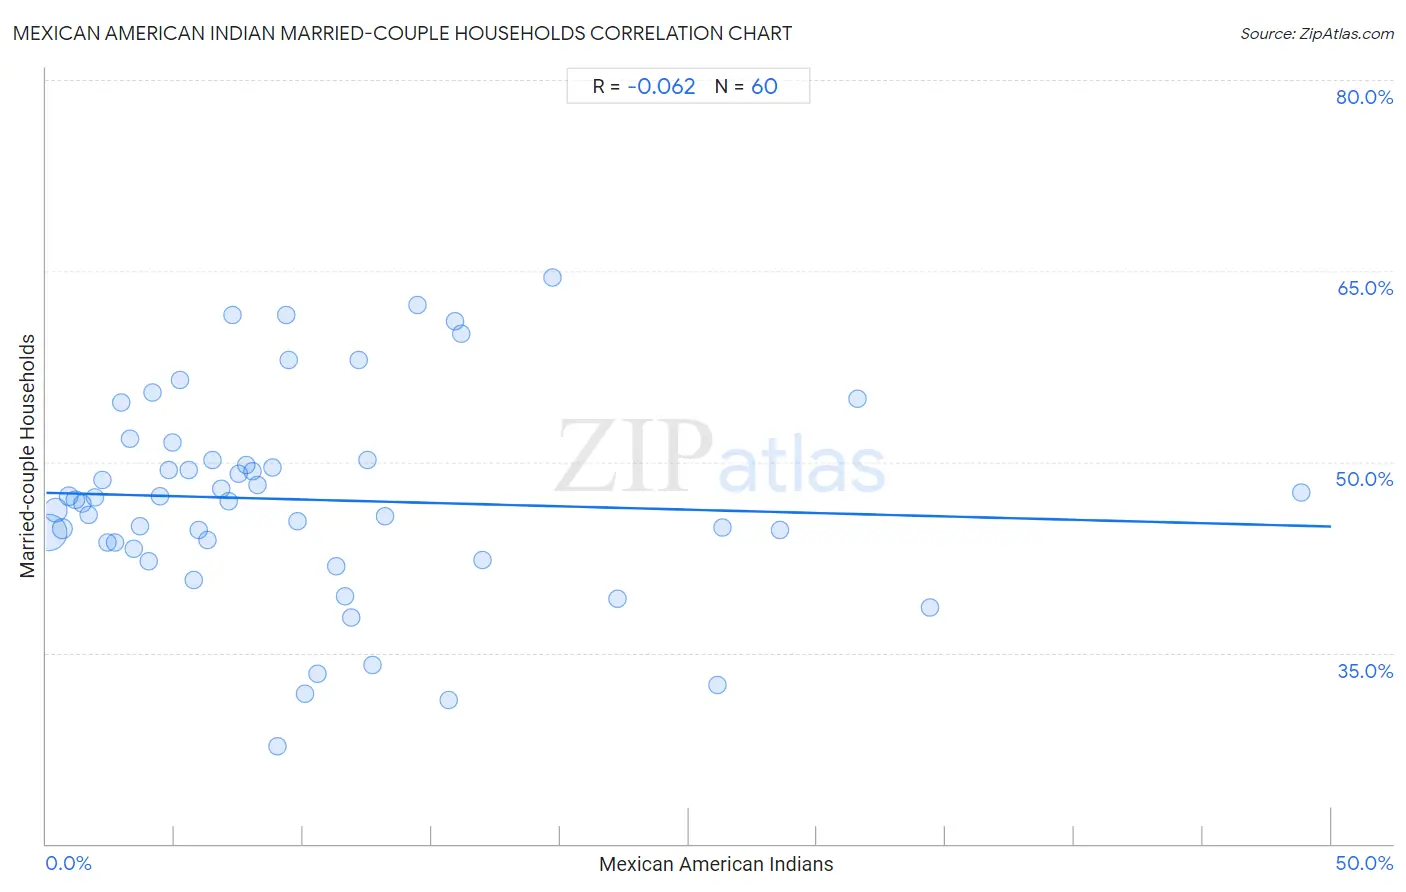
It is essential to understand that the correlation between the percentage of Mexican American Indians and percentage of married-couple family households does not imply a direct cause-and-effect relationship. It remains uncertain whether the presence of Mexican American Indians influences an upward or downward trend in the level of percentage of married-couple family households within an area, or if Mexican American Indians simply ended up residing in those areas with higher or lower levels of percentage of married-couple family households due to other factors.
Demographics Similar to Mexican American Indians by Married-couple Households
In terms of married-couple households, the demographic groups most similar to Mexican American Indians are Taiwanese (45.9%, a difference of 0.010%), Chickasaw (45.9%, a difference of 0.030%), Immigrants from South America (45.9%, a difference of 0.060%), Immigrants from Northern Africa (46.0%, a difference of 0.070%), and Choctaw (46.0%, a difference of 0.080%).
| Demographics | Rating | Rank | Married-couple Households |
| Fijians | 29.2 /100 | #187 | Fair 46.1% |
| South American Indians | 28.4 /100 | #188 | Fair 46.0% |
| Immigrants from Latvia | 26.9 /100 | #189 | Fair 46.0% |
| Immigrants from Kuwait | 25.6 /100 | #190 | Fair 46.0% |
| Choctaw | 24.9 /100 | #191 | Fair 46.0% |
| Immigrants from Northern Africa | 24.6 /100 | #192 | Fair 46.0% |
| Taiwanese | 23.4 /100 | #193 | Fair 45.9% |
| Mexican American Indians | 23.3 /100 | #194 | Fair 45.9% |
| Chickasaw | 22.7 /100 | #195 | Fair 45.9% |
| Immigrants from South America | 22.2 /100 | #196 | Fair 45.9% |
| Cambodians | 21.3 /100 | #197 | Fair 45.9% |
| Ottawa | 19.4 /100 | #198 | Poor 45.8% |
| Carpatho Rusyns | 15.7 /100 | #199 | Poor 45.7% |
| Potawatomi | 15.6 /100 | #200 | Poor 45.7% |
| Immigrants from Serbia | 15.2 /100 | #201 | Poor 45.7% |
Mexican American Indian Married-couple Households Correlation Summary
| Measurement | Mexican American Indian Data | Married-couple Households Data |
| Minimum | 0.10% | 27.7% |
| Maximum | 48.8% | 64.5% |
| Range | 48.7% | 36.8% |
| Mean | 10.1% | 47.0% |
| Median | 7.6% | 47.0% |
| Interquartile 25% (IQ1) | 3.8% | 43.4% |
| Interquartile 75% (IQ3) | 12.6% | 50.1% |
| Interquartile Range (IQR) | 8.8% | 6.7% |
| Standard Deviation (Sample) | 9.4% | 8.1% |
| Standard Deviation (Population) | 9.3% | 8.0% |
Correlation Details
| Mexican American Indian Percentile | Sample Size | Married-couple Households |
[ 0.0% - 0.5% ] 0.10% | 197,443,403 | 44.5% |
[ 0.0% - 0.5% ] 0.37% | 63,752,588 | 46.2% |
[ 0.5% - 1.0% ] 0.62% | 28,044,165 | 44.8% |
[ 0.5% - 1.0% ] 0.87% | 13,576,728 | 47.3% |
[ 1.0% - 1.5% ] 1.13% | 5,319,694 | 47.0% |
[ 1.0% - 1.5% ] 1.40% | 2,946,122 | 46.7% |
[ 1.5% - 2.0% ] 1.63% | 2,383,872 | 45.8% |
[ 1.5% - 2.0% ] 1.89% | 1,216,183 | 47.2% |
[ 2.0% - 2.5% ] 2.17% | 920,642 | 48.6% |
[ 2.0% - 2.5% ] 2.39% | 493,458 | 43.6% |
[ 2.5% - 3.0% ] 2.67% | 328,283 | 43.7% |
[ 2.5% - 3.0% ] 2.93% | 113,787 | 54.7% |
[ 3.0% - 3.5% ] 3.24% | 331,240 | 51.8% |
[ 3.0% - 3.5% ] 3.42% | 123,077 | 43.2% |
[ 3.5% - 4.0% ] 3.65% | 104,379 | 45.0% |
[ 3.5% - 4.0% ] 3.99% | 103,191 | 42.2% |
[ 4.0% - 4.5% ] 4.14% | 19,319 | 55.5% |
[ 4.0% - 4.5% ] 4.43% | 30,504 | 47.3% |
[ 4.5% - 5.0% ] 4.76% | 22,457 | 49.4% |
[ 4.5% - 5.0% ] 4.93% | 13,928 | 51.6% |
[ 5.0% - 5.5% ] 5.19% | 37,213 | 56.4% |
[ 5.5% - 6.0% ] 5.53% | 14,099 | 49.3% |
[ 5.5% - 6.0% ] 5.72% | 2,762 | 40.8% |
[ 5.5% - 6.0% ] 5.91% | 18,079 | 44.6% |
[ 6.0% - 6.5% ] 6.28% | 13,419 | 43.9% |
[ 6.0% - 6.5% ] 6.45% | 11,493 | 50.1% |
[ 6.5% - 7.0% ] 6.80% | 8,370 | 47.9% |
[ 7.0% - 7.5% ] 7.09% | 24,129 | 46.9% |
[ 7.0% - 7.5% ] 7.24% | 5,246 | 61.6% |
[ 7.0% - 7.5% ] 7.49% | 2,909 | 49.0% |
[ 7.5% - 8.0% ] 7.79% | 9,657 | 49.8% |
[ 8.0% - 8.5% ] 8.01% | 9,363 | 49.3% |
[ 8.0% - 8.5% ] 8.24% | 6,274 | 48.2% |
[ 8.5% - 9.0% ] 8.81% | 2,655 | 49.5% |
[ 9.0% - 9.5% ] 9.02% | 5,409 | 27.7% |
[ 9.0% - 9.5% ] 9.33% | 3,816 | 61.6% |
[ 9.0% - 9.5% ] 9.46% | 2,220 | 58.0% |
[ 9.5% - 10.0% ] 9.80% | 1,817 | 45.4% |
[ 10.0% - 10.5% ] 10.05% | 4,526 | 31.8% |
[ 10.5% - 11.0% ] 10.56% | 322 | 33.3% |
[ 11.0% - 11.5% ] 11.28% | 727 | 41.8% |
[ 11.5% - 12.0% ] 11.64% | 507 | 39.4% |
[ 11.5% - 12.0% ] 11.88% | 2,777 | 37.7% |
[ 12.0% - 12.5% ] 12.15% | 650 | 58.0% |
[ 12.0% - 12.5% ] 12.48% | 2,756 | 50.1% |
[ 12.5% - 13.0% ] 12.71% | 118 | 34.1% |
[ 13.0% - 13.5% ] 13.17% | 3,242 | 45.8% |
[ 14.0% - 14.5% ] 14.47% | 159 | 62.3% |
[ 15.5% - 16.0% ] 15.65% | 1,438 | 31.3% |
[ 15.5% - 16.0% ] 15.93% | 1,036 | 61.0% |
[ 16.0% - 16.5% ] 16.14% | 3,129 | 60.1% |
[ 16.5% - 17.0% ] 16.96% | 112 | 42.3% |
[ 19.5% - 20.0% ] 19.70% | 2,650 | 64.5% |
[ 22.0% - 22.5% ] 22.22% | 54 | 39.3% |
[ 26.0% - 26.5% ] 26.11% | 180 | 32.5% |
[ 26.0% - 26.5% ] 26.33% | 938 | 44.9% |
[ 28.5% - 29.0% ] 28.57% | 196 | 44.6% |
[ 31.5% - 32.0% ] 31.58% | 95 | 55.0% |
[ 34.0% - 34.5% ] 34.41% | 590 | 38.6% |
[ 48.5% - 49.0% ] 48.82% | 254 | 47.6% |