Mexican American Indian Disability Age 5 to 17

COMPARE

Mexican American Indian
Race
Ancestry
AfghanAfricanAlaska NativeAlaskan AthabascanAlbanianAleutAlsatianAmericanApacheArabArapahoArgentineanArmenianAssyrian/Chaldean/SyriacAustralianAustrianBahamianBangladeshiBarbadianBasqueBelgianBelizeanBermudanBhutaneseBlackfeetBolivianBrazilianBritishBritish West IndianBulgarianBurmeseCajunCambodianCanadianCape VerdeanCarpatho RusynCelticCentral AmericanCentral American IndianCherokeeCheyenneChickasawChileanChineseChippewaChoctawColombianColvilleComancheCosta RicanCreeCreekCroatianCrowCubanCypriotCzechCzechoslovakianDanishDelawareDominicanDutchDutch West IndianEastern EuropeanEcuadorianEgyptianEnglishEstonianEthiopianEuropeanFijianFilipinoFinnishFrenchFrench American IndianFrench CanadianGermanGerman RussianGhanaianGreekGuamanian/ChamorroGuatemalanGuyaneseHaitianHmongHonduranHopiHoumaHungarianIcelanderIndian (Asian)IndonesianInupiatIranianIraqiIrishIroquoisIsraeliItalianJamaicanJapaneseJordanianKenyanKiowaKoreanLaotianLatvianLebaneseLiberianLithuanianLumbeeLuxembourgerMacedonianMalaysianMalteseMarshalleseMenomineeMexicanMexican American IndianMongolianMoroccanNative HawaiianNavajoNepaleseNew ZealanderNicaraguanNigerianNorthern EuropeanNorwegianOkinawanOsageOttawaPaiutePakistaniPalestinianPanamanianParaguayanPennsylvania GermanPeruvianPimaPolishPortuguesePotawatomiPuebloPuerto RicanPuget Sound SalishRomanianRussianSalvadoranSamoanScandinavianScotch-IrishScottishSeminoleSenegaleseSerbianShoshoneSierra LeoneanSiouxSlavicSlovakSloveneSomaliSouth AfricanSouth AmericanSouth American IndianSoviet UnionSpaniardSpanishSpanish AmericanSpanish American IndianSri LankanSubsaharan AfricanSudaneseSwedishSwissSyrianTaiwaneseThaiTlingit-HaidaTohono O'OdhamTonganTrinidadian and TobagonianTsimshianTurkishU.S. Virgin IslanderUgandanUkrainianUruguayanUteVenezuelanVietnameseWelshWest IndianYakamaYaquiYugoslavianYumanYup'ikZimbabwean
Immigration
NonimmigrantsImmigrantsAfghanistanAfricaAlbaniaArgentinaArmeniaAsiaAustraliaAustriaBahamasBangladeshBarbadosBelarusBelgiumBelizeBoliviaBosnia and HerzegovinaBrazilBulgariaBurma/MyanmarCabo VerdeCambodiaCameroonCanadaCaribbeanCentral AmericaChileChinaColombiaCongoCosta RicaCroatiaCubaCzechoslovakiaDenmarkDominicaDominican RepublicEastern AfricaEastern AsiaEastern EuropeEcuadorEgyptEl SalvadorEnglandEritreaEthiopiaEuropeFijiFranceGermanyGhanaGreeceGrenadaGuatemalaGuyanaHaitiHondurasHong KongHungaryIndiaIndonesiaIranIraqIrelandIsraelItalyJamaicaJapanJordanKazakhstanKenyaKoreaKuwaitLaosLatin AmericaLatviaLebanonLiberiaLithuaniaMalaysiaMexicoMicronesiaMiddle AfricaMoldovaMoroccoNepalNetherlandsNicaraguaNigeriaNorth AmericaNorth MacedoniaNorthern AfricaNorthern EuropeNorwayOceaniaPakistanPanamaPeruPhilippinesPolandPortugalRomaniaRussiaSaudi ArabiaScotlandSenegalSerbiaSierra LeoneSingaporeSomaliaSouth AfricaSouth AmericaSouth Central AsiaSouth Eastern AsiaSouthern EuropeSpainSri LankaSt. Vincent and the GrenadinesSudanSwedenSwitzerlandSyriaTaiwanThailandTrinidad and TobagoTurkeyUgandaUkraineUruguayUzbekistanVenezuelaVietnamWest IndiesWestern AfricaWestern AsiaWestern EuropeYemenZaireZimbabweAzores
Select to Compare
Race
Ancestry
AfghanAfricanAlaska NativeAlaskan AthabascanAlbanianAleutAlsatianAmericanApacheArabArapahoArgentineanArmenianAssyrian/Chaldean/SyriacAustralianAustrianBahamianBangladeshiBarbadianBasqueBelgianBelizeanBermudanBhutaneseBlackfeetBolivianBrazilianBritishBritish West IndianBulgarianBurmeseCajunCambodianCanadianCape VerdeanCarpatho RusynCelticCentral AmericanCentral American IndianCherokeeCheyenneChickasawChileanChineseChippewaChoctawColombianColvilleComancheCosta RicanCreeCreekCroatianCrowCubanCypriotCzechCzechoslovakianDanishDelawareDominicanDutchDutch West IndianEastern EuropeanEcuadorianEgyptianEnglishEstonianEthiopianEuropeanFijianFilipinoFinnishFrenchFrench American IndianFrench CanadianGermanGerman RussianGhanaianGreekGuamanian/ChamorroGuatemalanGuyaneseHaitianHmongHonduranHopiHoumaHungarianIcelanderIndian (Asian)IndonesianInupiatIranianIraqiIrishIroquoisIsraeliItalianJamaicanJapaneseJordanianKenyanKiowaKoreanLaotianLatvianLebaneseLiberianLithuanianLumbeeLuxembourgerMacedonianMalaysianMalteseMarshalleseMenomineeMexicanMongolianMoroccanNative HawaiianNavajoNepaleseNew ZealanderNicaraguanNigerianNorthern EuropeanNorwegianOkinawanOsageOttawaPaiutePakistaniPalestinianPanamanianParaguayanPennsylvania GermanPeruvianPimaPolishPortuguesePotawatomiPuebloPuerto RicanPuget Sound SalishRomanianRussianSalvadoranSamoanScandinavianScotch-IrishScottishSeminoleSenegaleseSerbianShoshoneSierra LeoneanSiouxSlavicSlovakSloveneSomaliSouth AfricanSouth AmericanSouth American IndianSoviet UnionSpaniardSpanishSpanish AmericanSpanish American IndianSri LankanSubsaharan AfricanSudaneseSwedishSwissSyrianTaiwaneseThaiTlingit-HaidaTohono O'OdhamTonganTrinidadian and TobagonianTsimshianTurkishU.S. Virgin IslanderUgandanUkrainianUruguayanUteVenezuelanVietnameseWelshWest IndianYakamaYaquiYugoslavianYumanYup'ikZimbabwean
Immigration
NonimmigrantsImmigrantsAfghanistanAfricaAlbaniaArgentinaArmeniaAsiaAustraliaAustriaBahamasBangladeshBarbadosBelarusBelgiumBelizeBoliviaBosnia and HerzegovinaBrazilBulgariaBurma/MyanmarCabo VerdeCambodiaCameroonCanadaCaribbeanCentral AmericaChileChinaColombiaCongoCosta RicaCroatiaCubaCzechoslovakiaDenmarkDominicaDominican RepublicEastern AfricaEastern AsiaEastern EuropeEcuadorEgyptEl SalvadorEnglandEritreaEthiopiaEuropeFijiFranceGermanyGhanaGreeceGrenadaGuatemalaGuyanaHaitiHondurasHong KongHungaryIndiaIndonesiaIranIraqIrelandIsraelItalyJamaicaJapanJordanKazakhstanKenyaKoreaKuwaitLaosLatin AmericaLatviaLebanonLiberiaLithuaniaMalaysiaMexicoMicronesiaMiddle AfricaMoldovaMoroccoNepalNetherlandsNicaraguaNigeriaNorth AmericaNorth MacedoniaNorthern AfricaNorthern EuropeNorwayOceaniaPakistanPanamaPeruPhilippinesPolandPortugalRomaniaRussiaSaudi ArabiaScotlandSenegalSerbiaSierra LeoneSingaporeSomaliaSouth AfricaSouth AmericaSouth Central AsiaSouth Eastern AsiaSouthern EuropeSpainSri LankaSt. Vincent and the GrenadinesSudanSwedenSwitzerlandSyriaTaiwanThailandTrinidad and TobagoTurkeyUgandaUkraineUruguayUzbekistanVenezuelaVietnamWest IndiesWestern AfricaWestern AsiaWestern EuropeYemenZaireZimbabweAzores
Disability Age 5 to 17
Income
Poverty
Unemployment
Labor Participation
Family Structure
Vehicle Availability
Education Level
Disability

Mexican American Indian Disability Age 5 to 17
Fair

5.6%
DISABILITY | AGE 5 TO 17
35.2/ 100
METRIC RATING
182nd/ 347
METRIC RANK

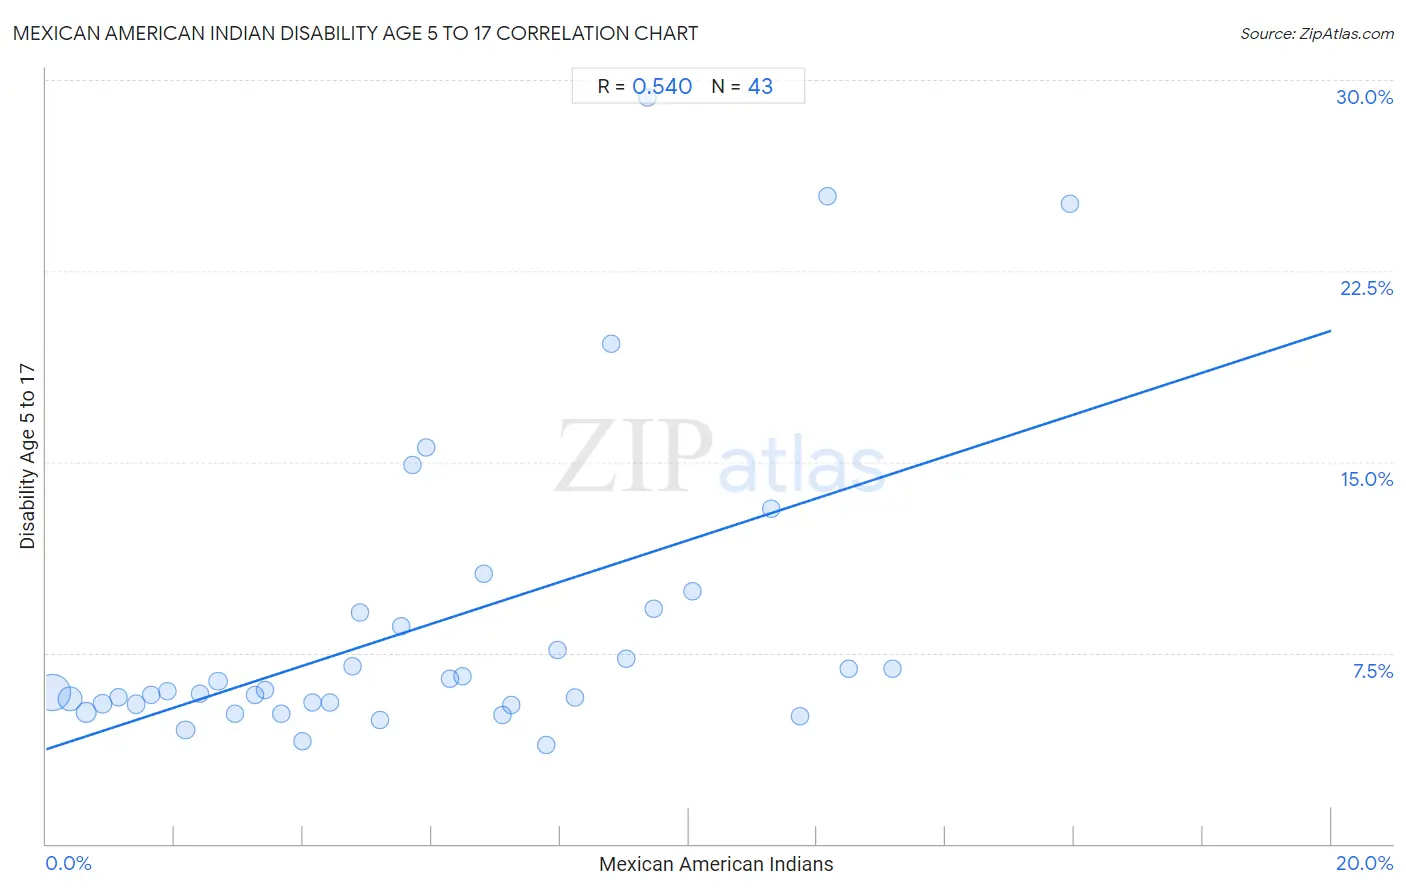
Mexican American Indian Disability Age 5 to 17 Correlation Chart

The statistical analysis conducted on geographies consisting of 316,219,119 people shows a substantial positive correlation between the proportion of Mexican American Indians and percentage of population with a disability between the ages 5 and 17 in the United States with a correlation coefficient (R) of 0.540 and weighted average of 5.6%. On average, for every 1% (one percent) increase in Mexican American Indians within a typical geography, there is an increase of 0.82% in percentage of population with a disability between the ages 5 and 17.
Mexican American Indian Disability Age 5 to 17
It is essential to understand that the correlation between the percentage of Mexican American Indians and percentage of population with a disability between the ages 5 and 17 does not imply a direct cause-and-effect relationship. It remains uncertain whether the presence of Mexican American Indians influences an upward or downward trend in the level of percentage of population with a disability between the ages 5 and 17 within an area, or if Mexican American Indians simply ended up residing in those areas with higher or lower levels of percentage of population with a disability between the ages 5 and 17 due to other factors.

Demographics Similar to Mexican American Indians by Disability Age 5 to 17

In terms of disability age 5 to 17, the demographic groups most similar to Mexican American Indians are Immigrants from Latin America (5.6%, a difference of 0.050%), Immigrants from England (5.6%, a difference of 0.060%), Syrian (5.6%, a difference of 0.080%), Immigrants from Mexico (5.6%, a difference of 0.080%), and Immigrants from Uruguay (5.6%, a difference of 0.13%).
DemographicsRating | RankDisability Age 5 to 17
Shoshone
49.4
/100
|
#175
Average
5.6%
Immigrants from Central America
49.4
/100
|
#176
Average
5.6%
Immigrants from Western Europe
47.8
/100
|
#177
Average
5.6%
Immigrants from Trinidad and Tobago
47.6
/100
|
#178
Average
5.6%
Immigrants from Barbados
40.5
/100
|
#179
Average
5.6%
Immigrants from Uruguay
37.7
/100
|
#180
Fair
5.6%
Immigrants from England
36.4
/100
|
#181
Fair
5.6%
Mexican American Indians
35.2
/100
|
#182
Fair
5.6%
Immigrants from Latin America
34.3
/100
|
#183
Fair
5.6%
Syrians
33.8
/100
|
#184
Fair
5.6%
Immigrants from Mexico
33.7
/100
|
#185
Fair
5.6%
Fijians
31.7
/100
|
#186
Fair
5.7%
Immigrants from Thailand
30.2
/100
|
#187
Fair
5.7%
Marshallese
28.1
/100
|
#188
Fair
5.7%
Pueblo
27.5
/100
|
#189
Fair
5.7%

Mexican American Indian Disability Age 5 to 17 Correlation Summary

MeasurementMexican American Indian DataDisability Age 5 to 17 Data
Minimum0.10%3.9%
Maximum15.9%29.3%
Range15.8%25.4%
Mean5.9%8.6%
Median5.5%6.0%
Interquartile 25% (IQ1)2.7%5.5%
Interquartile 75% (IQ3)8.8%9.1%
Interquartile Range (IQR)6.1%3.6%
Standard Deviation (Sample)3.9%6.0%
Standard Deviation (Population)3.9%5.9%

Correlation Details

Mexican American Indian PercentileSample SizeDisability Age 5 to 17
[
0.0%
-
0.5%
]
0.10%
196,895,4825.9%
[
0.0%
-
0.5%
]
0.37%
63,576,1725.7%
[
0.5%
-
1.0%
]
0.62%
27,867,5525.1%
[
0.5%
-
1.0%
]
0.87%
13,529,2975.5%
[
1.0%
-
1.5%
]
1.13%
5,243,3525.8%
[
1.0%
-
1.5%
]
1.40%
2,907,7695.5%
[
1.5%
-
2.0%
]
1.63%
2,349,1355.8%
[
1.5%
-
2.0%
]
1.89%
1,196,1126.0%
[
2.0%
-
2.5%
]
2.17%
896,7534.5%
[
2.0%
-
2.5%
]
2.39%
485,1585.9%
[
2.5%
-
3.0%
]
2.67%
312,8086.4%
[
2.5%
-
3.0%
]
2.93%
93,6025.1%
[
3.0%
-
3.5%
]
3.25%
312,1255.8%
[
3.0%
-
3.5%
]
3.41%
114,9826.1%
[
3.5%
-
4.0%
]
3.66%
96,7275.1%
[
3.5%
-
4.0%
]
3.99%
96,2004.0%
[
4.0%
-
4.5%
]
4.14%
17,7245.6%
[
4.0%
-
4.5%
]
4.42%
24,6245.5%
[
4.5%
-
5.0%
]
4.77%
21,8637.0%
[
4.5%
-
5.0%
]
4.88%
10,6519.1%
[
5.0%
-
5.5%
]
5.19%
35,6174.9%
[
5.5%
-
6.0%
]
5.53%
12,7088.5%
[
5.5%
-
6.0%
]
5.71%
2,55714.9%
[
5.5%
-
6.0%
]
5.91%
17,16415.6%
[
6.0%
-
6.5%
]
6.28%
13,3556.5%
[
6.0%
-
6.5%
]
6.48%
8,0776.6%
[
6.5%
-
7.0%
]
6.81%
7,21010.6%
[
7.0%
-
7.5%
]
7.09%
22,3795.0%
[
7.0%
-
7.5%
]
7.24%
5,1635.4%
[
7.5%
-
8.0%
]
7.79%
9,3753.9%
[
7.5%
-
8.0%
]
7.96%
5,5767.6%
[
8.0%
-
8.5%
]
8.24%
6,0455.8%
[
8.5%
-
9.0%
]
8.79%
1,99019.6%
[
9.0%
-
9.5%
]
9.02%
5,4097.3%
[
9.0%
-
9.5%
]
9.35%
2,78029.3%
[
9.0%
-
9.5%
]
9.46%
2,2209.2%
[
10.0%
-
10.5%
]
10.05%
4,5269.9%
[
11.0%
-
11.5%
]
11.28%
72713.2%
[
11.5%
-
12.0%
]
11.73%
4695.0%
[
12.0%
-
12.5%
]
12.15%
65025.4%
[
12.0%
-
12.5%
]
12.48%
2,7566.9%
[
13.0%
-
13.5%
]
13.17%
3,2426.9%
[
15.5%
-
16.0%
]
15.93%
1,03625.1%