Mexican American Indian 3 or more Vehicles in Household
COMPARE
Mexican American Indian
Select to Compare
3 or more Vehicles in Household
Mexican American Indian 3 or more Vehicles in Household
23.3%
3+ VEHICLES AVAILABLE
100.0/ 100
METRIC RATING
26th/ 347
METRIC RANK
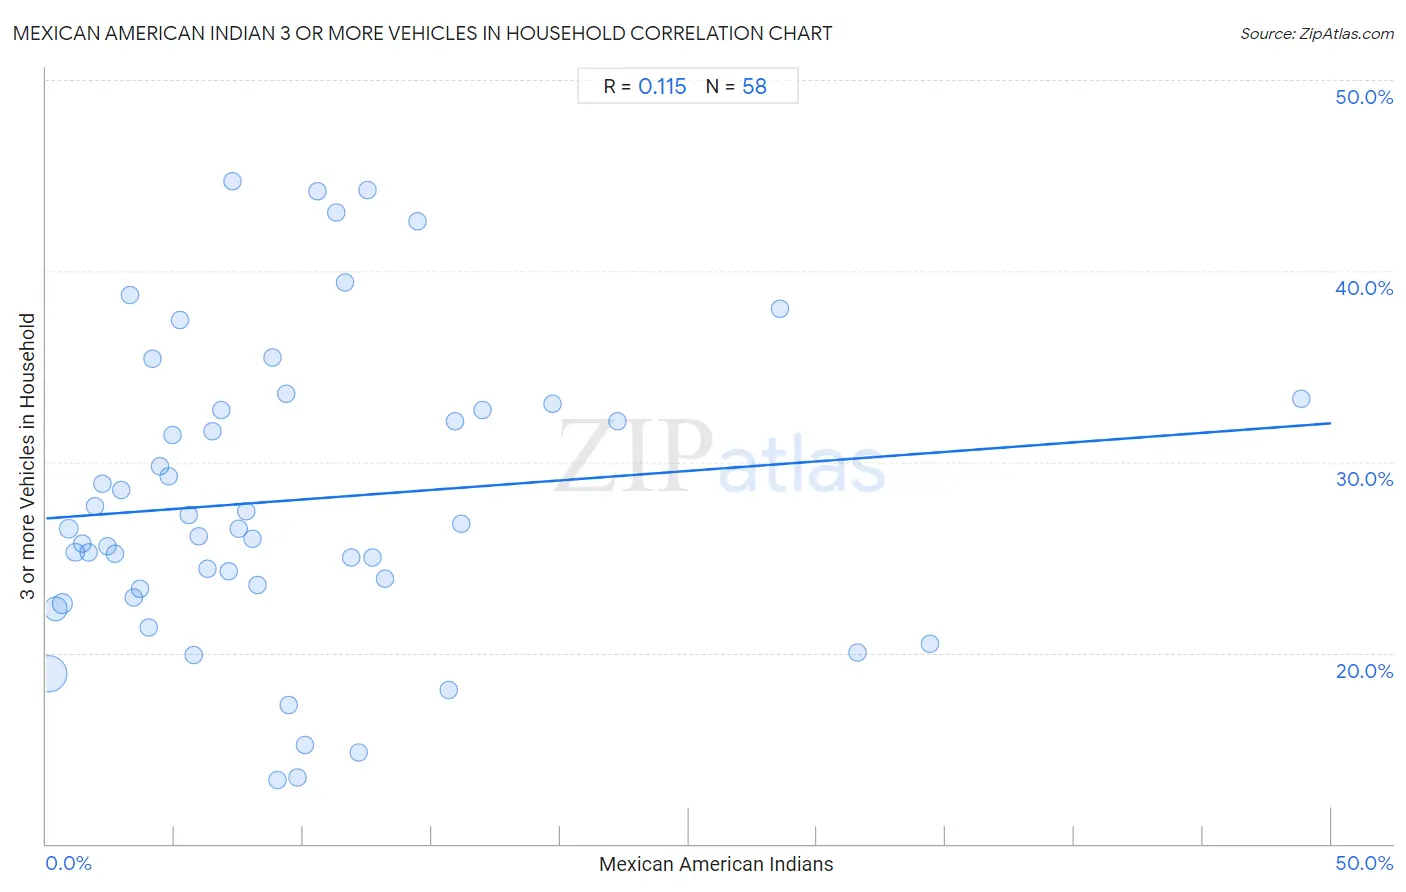
Mexican American Indian 3 or more Vehicles in Household Correlation Chart
The statistical analysis conducted on geographies consisting of 317,474,201 people shows a poor positive correlation between the proportion of Mexican American Indians and percentage of households with 3 or more vehicles available in the United States with a correlation coefficient (R) of 0.115 and weighted average of 23.3%. On average, for every 1% (one percent) increase in Mexican American Indians within a typical geography, there is an increase of 0.100% in percentage of households with 3 or more vehicles available.
It is essential to understand that the correlation between the percentage of Mexican American Indians and percentage of households with 3 or more vehicles available does not imply a direct cause-and-effect relationship. It remains uncertain whether the presence of Mexican American Indians influences an upward or downward trend in the level of percentage of households with 3 or more vehicles available within an area, or if Mexican American Indians simply ended up residing in those areas with higher or lower levels of percentage of households with 3 or more vehicles available due to other factors.
Demographics Similar to Mexican American Indians by 3 or more Vehicles in Household
In terms of 3 or more vehicles in household, the demographic groups most similar to Mexican American Indians are Guamanian/Chamorro (23.2%, a difference of 0.13%), Lumbee (23.1%, a difference of 0.47%), Spanish (23.1%, a difference of 0.54%), Immigrants from South Eastern Asia (23.1%, a difference of 0.71%), and Immigrants from Central America (23.4%, a difference of 0.77%).
| Demographics | Rating | Rank | 3 or more Vehicles in Household |
| Chinese | 100.0 /100 | #19 | Exceptional 23.9% |
| Paiute | 100.0 /100 | #20 | Exceptional 23.8% |
| Immigrants from Vietnam | 100.0 /100 | #21 | Exceptional 23.8% |
| Immigrants from Philippines | 100.0 /100 | #22 | Exceptional 23.8% |
| Scandinavians | 100.0 /100 | #23 | Exceptional 23.6% |
| Sri Lankans | 100.0 /100 | #24 | Exceptional 23.6% |
| Immigrants from Central America | 100.0 /100 | #25 | Exceptional 23.4% |
| Mexican American Indians | 100.0 /100 | #26 | Exceptional 23.3% |
| Guamanians/Chamorros | 100.0 /100 | #27 | Exceptional 23.2% |
| Lumbee | 100.0 /100 | #28 | Exceptional 23.1% |
| Spanish | 100.0 /100 | #29 | Exceptional 23.1% |
| Immigrants from South Eastern Asia | 100.0 /100 | #30 | Exceptional 23.1% |
| English | 100.0 /100 | #31 | Exceptional 23.1% |
| Pueblo | 100.0 /100 | #32 | Exceptional 23.0% |
| Spanish Americans | 100.0 /100 | #33 | Exceptional 23.0% |
Mexican American Indian 3 or more Vehicles in Household Correlation Summary
| Measurement | Mexican American Indian Data | 3 or more Vehicles in Household Data |
| Minimum | 0.10% | 13.3% |
| Maximum | 48.8% | 44.7% |
| Range | 48.7% | 31.4% |
| Mean | 9.6% | 28.0% |
| Median | 7.4% | 26.5% |
| Interquartile 25% (IQ1) | 3.7% | 23.3% |
| Interquartile 75% (IQ3) | 12.2% | 32.7% |
| Interquartile Range (IQR) | 8.5% | 9.4% |
| Standard Deviation (Sample) | 9.0% | 7.9% |
| Standard Deviation (Population) | 9.0% | 7.8% |
Correlation Details
| Mexican American Indian Percentile | Sample Size | 3 or more Vehicles in Household |
[ 0.0% - 0.5% ] 0.10% | 197,441,855 | 18.9% |
[ 0.0% - 0.5% ] 0.37% | 63,748,622 | 22.3% |
[ 0.5% - 1.0% ] 0.62% | 28,038,843 | 22.6% |
[ 0.5% - 1.0% ] 0.87% | 13,576,728 | 26.5% |
[ 1.0% - 1.5% ] 1.13% | 5,321,748 | 25.3% |
[ 1.0% - 1.5% ] 1.40% | 2,946,122 | 25.7% |
[ 1.5% - 2.0% ] 1.63% | 2,382,096 | 25.3% |
[ 1.5% - 2.0% ] 1.89% | 1,216,183 | 27.7% |
[ 2.0% - 2.5% ] 2.17% | 920,642 | 28.8% |
[ 2.0% - 2.5% ] 2.39% | 492,283 | 25.6% |
[ 2.5% - 3.0% ] 2.67% | 327,431 | 25.2% |
[ 2.5% - 3.0% ] 2.93% | 112,324 | 28.6% |
[ 3.0% - 3.5% ] 3.24% | 328,033 | 38.7% |
[ 3.0% - 3.5% ] 3.42% | 123,077 | 22.9% |
[ 3.5% - 4.0% ] 3.65% | 104,379 | 23.3% |
[ 3.5% - 4.0% ] 3.99% | 103,191 | 21.3% |
[ 4.0% - 4.5% ] 4.14% | 19,042 | 35.4% |
[ 4.0% - 4.5% ] 4.43% | 30,504 | 29.8% |
[ 4.5% - 5.0% ] 4.76% | 22,457 | 29.3% |
[ 4.5% - 5.0% ] 4.93% | 14,373 | 31.4% |
[ 5.0% - 5.5% ] 5.19% | 37,213 | 37.4% |
[ 5.5% - 6.0% ] 5.53% | 14,099 | 27.2% |
[ 5.5% - 6.0% ] 5.72% | 2,762 | 19.9% |
[ 5.5% - 6.0% ] 5.91% | 18,079 | 26.1% |
[ 6.0% - 6.5% ] 6.28% | 13,419 | 24.4% |
[ 6.0% - 6.5% ] 6.45% | 11,493 | 31.6% |
[ 6.5% - 7.0% ] 6.80% | 8,370 | 32.7% |
[ 7.0% - 7.5% ] 7.09% | 24,129 | 24.3% |
[ 7.0% - 7.5% ] 7.24% | 5,246 | 44.7% |
[ 7.0% - 7.5% ] 7.49% | 2,909 | 26.5% |
[ 7.5% - 8.0% ] 7.79% | 9,657 | 27.4% |
[ 8.0% - 8.5% ] 8.01% | 9,363 | 25.9% |
[ 8.0% - 8.5% ] 8.24% | 6,274 | 23.6% |
[ 8.5% - 9.0% ] 8.81% | 2,655 | 35.5% |
[ 9.0% - 9.5% ] 9.02% | 5,409 | 13.3% |
[ 9.0% - 9.5% ] 9.33% | 3,816 | 33.6% |
[ 9.0% - 9.5% ] 9.46% | 2,220 | 17.3% |
[ 9.5% - 10.0% ] 9.80% | 1,817 | 13.4% |
[ 10.0% - 10.5% ] 10.05% | 4,526 | 15.2% |
[ 10.5% - 11.0% ] 10.56% | 322 | 44.2% |
[ 11.0% - 11.5% ] 11.28% | 727 | 43.1% |
[ 11.5% - 12.0% ] 11.64% | 507 | 39.4% |
[ 11.5% - 12.0% ] 11.88% | 2,777 | 25.0% |
[ 12.0% - 12.5% ] 12.15% | 650 | 14.8% |
[ 12.0% - 12.5% ] 12.48% | 2,756 | 44.2% |
[ 12.5% - 13.0% ] 12.71% | 118 | 25.0% |
[ 13.0% - 13.5% ] 13.17% | 3,242 | 23.9% |
[ 14.0% - 14.5% ] 14.47% | 159 | 42.6% |
[ 15.5% - 16.0% ] 15.65% | 1,438 | 18.1% |
[ 15.5% - 16.0% ] 15.93% | 1,036 | 32.1% |
[ 16.0% - 16.5% ] 16.14% | 3,129 | 26.8% |
[ 16.5% - 17.0% ] 16.96% | 112 | 32.7% |
[ 19.5% - 20.0% ] 19.70% | 2,650 | 33.1% |
[ 22.0% - 22.5% ] 22.22% | 54 | 32.1% |
[ 28.5% - 29.0% ] 28.57% | 196 | 38.0% |
[ 31.5% - 32.0% ] 31.58% | 95 | 20.0% |
[ 34.0% - 34.5% ] 34.41% | 590 | 20.5% |
[ 48.5% - 49.0% ] 48.82% | 254 | 33.3% |